petroleum coke gasification synergies for · pdf filelow ash – no need to melt ......
TRANSCRIPT

Petroleum Coke Gasification Synergies
For Refineries
Gulf Coast Power AssociationApril 14, 2005
Phil Amick, Technology Director - Gasification

How Refineries Work . . .
CRUDE OILNATURAL GAS
COKE
TransportationFuels
STEAM
HYDROGEN
POWER
RCRA Waste Specialties

Delayed CokingLeading Heavy Residue Upgrading Technology
“Delayed Coking continues to be the workhorse of conversion technology…”
SFA Pacific Inc.
Domestic Statistics• 56 of 141 refineries w/ cokers• 63% of US refining capacity
(18 MMbpsd)• 115,000 tpd cokeEd Swain; Oil & Gas Journal; Nov. 2, 2003

Source: “Petroleum Coke production from US Refineries will Increase”, Ed Swain, Oil & Gas Journal, Nov. 3, 2003
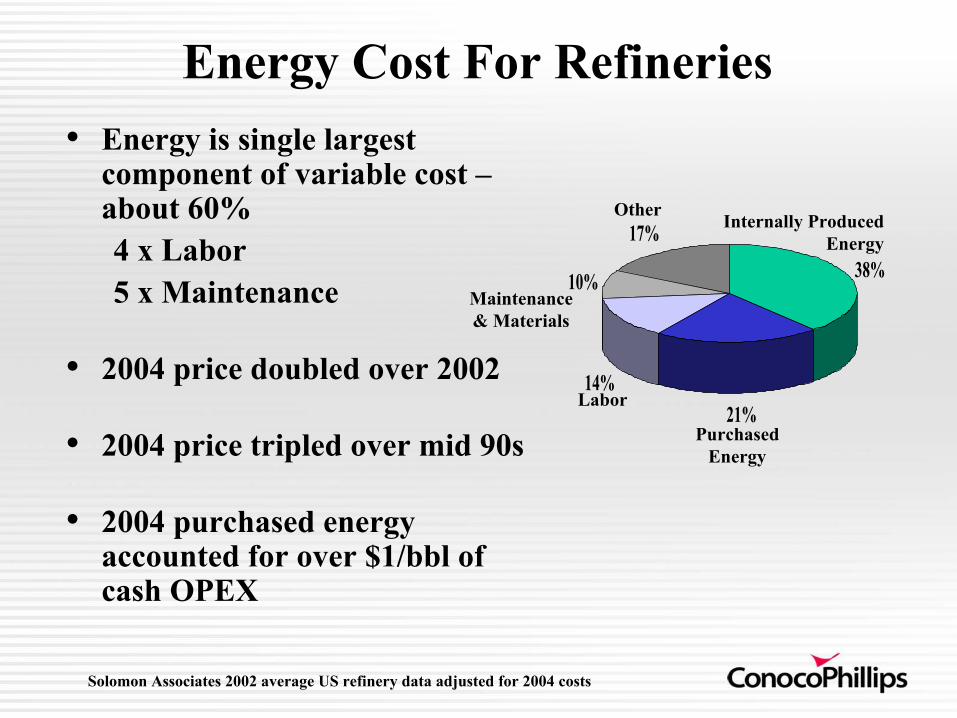
Energy Cost For Refineries• Energy is single largest
component of variable cost –about 60%4 x Labor5 x Maintenance
• 2004 price doubled over 2002
• 2004 price tripled over mid 90s
• 2004 purchased energy accounted for over $1/bbl of cash OPEX
38%
21%14%
10%
17%
Solomon Associates 2002 average US refinery data adjusted for 2004 costs
Internally ProducedEnergy
Other
Labor
PurchasedEnergy
Maintenance& Materials
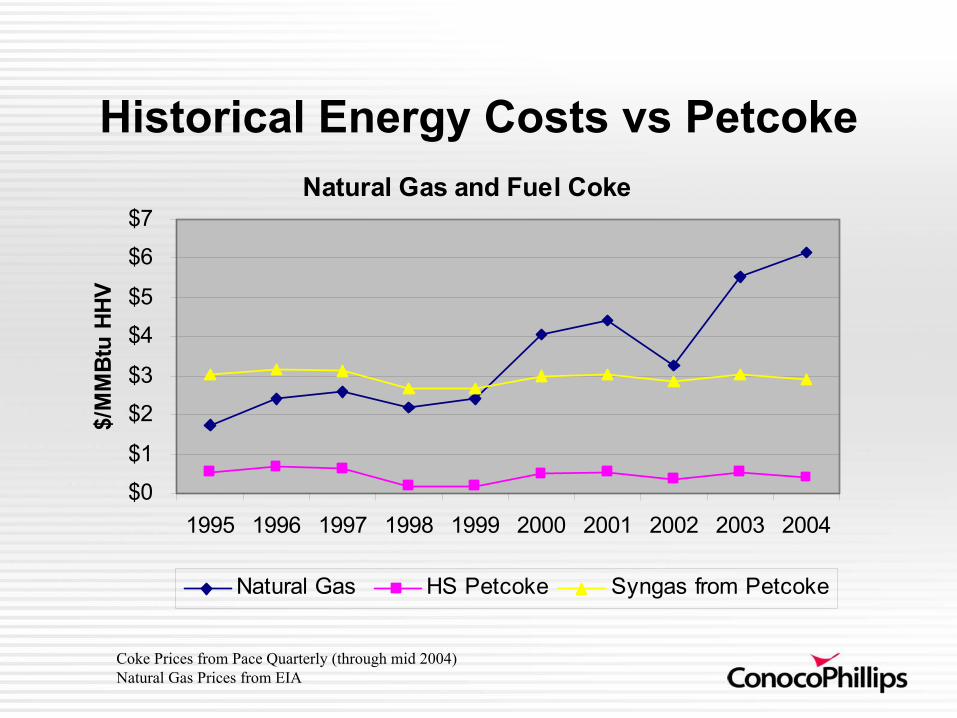
Historical Energy Costs vs Petcoke Natural Gas and Fuel Coke
$0
$1
$2
$3
$4
$5
$6
$7
1995 1996 1997 1998 1999 2000 2001 2002 2003 2004
$/M
MBt
u HH
V
Natural Gas HS Petcoke Syngas from Petcoke
Coke Prices from Pace Quarterly (through mid 2004)Natural Gas Prices from EIA

How Refineries SHOULD Work…CRUDE OIL
Purchased Energy ReducedSignificantly
Coke & RCRA Waste
STEAM
HYDROGEN
POWER
TransportationFuels
Specialties

Petroleum Coke
Electricity For Export
Syngas for Hydrogen

Petcoke As Gasification Feed
• Excellent Gasifier FeedLow Ash – No need to melt rocksHigh Btu Content – 28 MMBtu/ton
• Low Cost vs Natural Gas and Other FuelsHistorically $12/ton USGC laid in Vessel(1)
• $6-12 ton refinery gate depending on handling cost• $0.20 - $0.45 per MMBtu – 10 year average• Very stable pricing reacting to high sulfur coal not oil
2004 Henry Hub Average NG = $6.14/MMBtuLast 5 years Henry Hub(2) Average NG = $4.63/MMBtuLast 10 years Henry Hub(2) Average NG = $3.43/MMBtu
(1)Pace Quarterly Reports (through 2Q 2004)(2) Henry Hub NG price is well head price per EIA adjusted by 1.108

Refinery Case Study 1Basis 200,000 BPD Coking Refinery4700 TPD high sulfur, fuel coke
60 MMSCFD Hydrogen Demand100 MW Refinery Electric Demand
1880 Mlb/hr steam at 600 psig

Refinery Co-Production Reference Plant Basic BFD
SlurryPreparation
GasificationIsland
Gas Cleanup
Power Island
Coke
Slag Sales
Steam
Syngas
CokeSlurry
Hydrogen Shift &
Purification
Sulfur Sales
Refinery HydrogenSystem
Refinery SteamSystem
Power SalesRefinery Power
System
Coke Stg
Clean Syngas
Clean Syngas
Steam
ASU
Oxygen Sulfur

Integrated Gasification CoProductionAvailability
5000 TPD Petcoke IGCP
2 x 50% Air Separation
3 x 50% Gasification
2 x 50% Gas Clean-Up
2 x 50% GT
1 x 100% STG
Equivalent Annual Availability
Power > 94%
Steam > 99%
Hydrogen > 98.5%
Data Source: “Gasification Plant Cost and Performance Optimization”, USDOE, Global Energy & Nexant, DOE Contract No. DE-AC26-99FT40342, Task 1 Topical Report
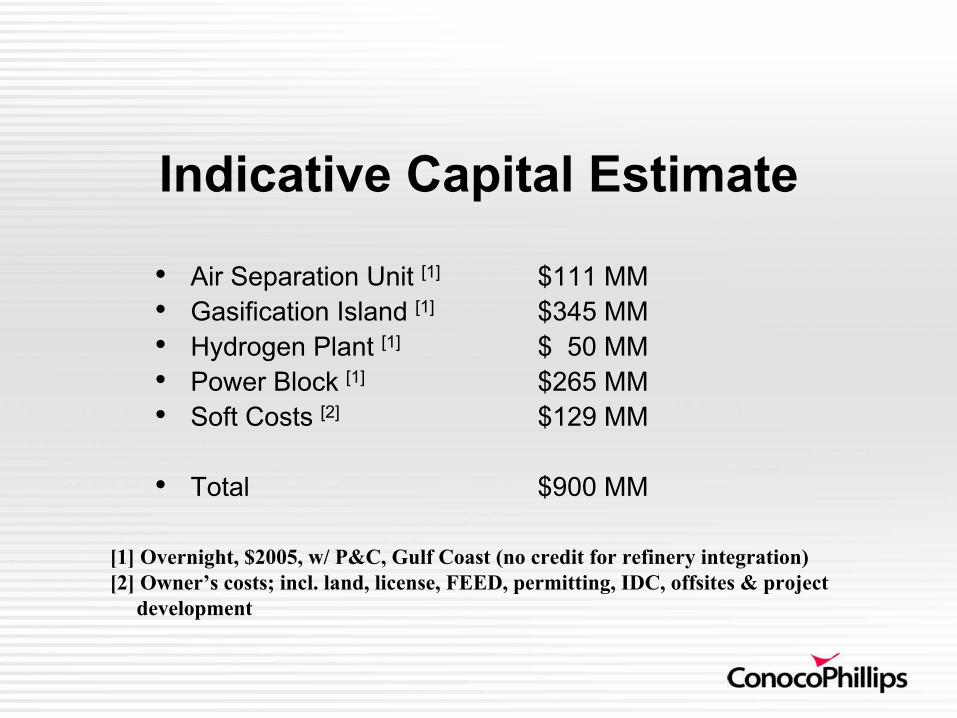
Indicative Capital Estimate
• Air Separation Unit [1] $111 MM• Gasification Island [1] $345 MM• Hydrogen Plant [1] $ 50 MM• Power Block [1] $265 MM• Soft Costs [2] $129 MM
• Total $900 MM
[1] Overnight, $2005, w/ P&C, Gulf Coast (no credit for refinery integration)[2] Owner’s costs; incl. land, license, FEED, permitting, IDC, offsites & project
development

Indicative Economics• Capex $900 MM• Opex, /yr $ 55 - $65 MM• Net Revenue/Savings, /yr $180- $190 MM• Project After Tax IRR
Full Equity 15 %30% Equity/70% Debt 21 %
• Cash cost of electricity and steam$/MMBtu equivalent $1.20 - $1.45$/bbl Crude OPEX Savings $0.40 - $0.45
Basis: Natural gas $4.63/MMBtu – Henry Hub Average last five years, EIA websiteAlternate cogen electricity $48/MW – estimated from natural gas price plus capital recovery

ASU(CT not shown)
GASIFICATIONPetroleum Coke(as
received)
Slag Sulfur
PETCOKE TO POWER, STEAM, H2 – Case 2REFINERY GASIFICATION
Heat Balance DiagramSteam Injection – 49F Ambient
Process Water
HP IP LP G
GH-P L-P
BFP
Oxygen (95% purity)
5,000 TPD
LP
CT
Air
Syn
gas
GTG (2)
DA
HP Steam
Hot BFW
Warm BFW
MP Steam
Cold Condensate
Demin.Makeup And Refinery
Condensate ReturnCONDENSER
Air
STG (1)
Process Waste Water
DSH
C
C
Warm Condensate
Hydrogen
Hyd
roge
n
Steam to Refinery
A
A
5000 TPD Petcoke
60 MMCFD H2
900 Mlb/hr 700# Steam
~420 MW Net

ASU(CT not shown)
GASIFICATIONPetroleum Coke(as
received)
Slag Sulfur
PETCOKE TO POWER, STEAM, H2 – Case 3REFINERY GASIFICATION
Heat Balance DiagramNitrogen Dilution– 68F Ambient
Process Water
HP IP LP G
GH-P L-P
BFP
Oxygen (95% purity)
5, 400 TPD
LP
CT
Air
Syn
gas
GTG (1)
DA
HP Steam
Hot BFW
Warm BFW
MP Steam
Cold Condensate
Demin.Makeup And Refinery
Condensate ReturnCONDENSER
Air
STG (1)
Process Waste Water
DSH
C
C
Warm Condensate
Hydrogen
Hyd
roge
n
Steam to Refinery
A
A
5400 TPD Petcoke
135 MMCFD H2
1100 Mlb/hr 700# Steam
~190 MW Net

Petroleum Coke can be a money-maker for refineries and cogeneration plants, when you choose the right technology.