petroleum industry in japan 2012 - paj · as it can excel during emergency response and should be...
TRANSCRIPT

Petroleum Association of JapanSeptember 2011
PetroleumIndustryin Japan
2012
Petroleum Association of JapanSeptember 2012

Preface1
Preface
1 2
out of nine refineries in the Tohoku and Kanto regions
stopped their operations. Three of those were forced
to suspend refining operations for a long period of
time. Besides, almost all oil storage terminals along
the Eastern Japan Pacific Ocean also suspended their
shipping operations. Service stations and tank trucks
making deliveries in the quake-hit areas also suffered
enormous damage. Consequently, confusion was
seen over a wide area. For example, the situation
arose in which smooth supply of petroleum products
was hampered in the affected areas as well as the
Tokyo metropolitan area due mainly to damage to
infrastructure such as oil shipping terminals, roads
and ports. This was despite the petroleum industry’s
utmost efforts to store and supply oil at a sufficient
volume on a nationwide basis. However, as a result of
the industry’s unified efforts, working across all com-
panies’ borders, the supply system was restored to
the pre-quake level in roughly three weeks. The petro-
leum industry believes it could fulfill its role as the pri-
mary energy supplier.
Furthermore, from the moment of disruption of
“system energy” such as electricity and city gas, oil
showed its strength as the “distributed energy” that
has emergency response capabilities in terms of easy
delivery and storage as a fuel for heating at the evacu-
ation centers, for emergency power systems and for
emergency and evacuation vehicles. Since oil is the
“last-resort” energy, it is necessary to re-evaluate oil
as it can excel during emergency response and
should be clearly positioned as the core energy in the
government’s energy policy.
Internationally, on the other hand, the “Shale Revo-
lution” drew attention in 2011. Mainly in the United
States, the development and active production of
shale gas and shale oil is moving ahead at a faster
pace. The problem of dwindling oil resources can now
be considered deferred for more than 50 years.
Japan’s energy policy is formed on the basis that oil
will be depleted in 40 to 50 years. Accordingly,
enhancement of alternative energy sources has been
focused on under the “Oil Use Reduction Policy”. How-
ever, it can be said that such a premise has been
shown to be wrong, since the risk of depleting oil
resources, including non-conventional oil resources,
is diminishing in the medium and long term.
Therefore, when reexamining the future energy pol-
icy, the petroleum industry is going to make a strong
appeal for the importance of promoting the effective
use of oil, which is superior for emergency response
and supply stability focusing on the following points:
• Do not let domestic oil demand decrease, in light
of the lessons of the “the importance of oil from
the Great East Japan Earthquake”
• Ensure a stable level of oil demand by maintaining
and strengthening the oil supply chain during
times of normal circumstances
Prices of West Texas Intermediate (WTI) in 2011 had
started with the level of around 90 US dollars per bar-
rel (US$/Bbl), and jumped to over 110 US$/Bbl in early
April due to the growing tension in Libya. Meanwhile,
because of various factors such as the reduced con-
cern of the Arab Spring spilling over into the Gulf oil
producing countries, the financial crisis in Europe,
and the economic slowdown in advanced countries,
oil prices temporarily dropped below 80 US$/Bbl in
early October. After that, with the tense situation
regarding Iran and its nuclear development problem
as well as corresponding financial sanctions against
the country, oil prices roughly stayed in the range
between 85 and 105 US$/Bbl at the year’s end.
Japan’s average crude oil import price (CIF) in 2011
was 108.7 US$/Bbl, up about 30 US$ versus 2010.
Though the exchange rate stayed at a strong yen (¥)
level, on a yen basis, the CIF was 54,645 ¥/kiloliter
(KL), ¥5,280/KL higher than the previous year.
In addition, there is a wide range of issues to be
considered, such as countermeasures for global
warming and settlement of double taxation, i.e., the
consumption tax on the gasoline tax.
This brochure has been created to provide consum-
ers as well as stakeholders with a better understand-
ing of the current situation and the future efforts of the
petroleum industry in Japan. We hope this brochure
will help to give you a sound understanding of oil and
the petroleum industry in Japan.
On March 11, 2011, the Great East Japan Earthquake,
with a domestic record magnitude of 9.0 occurred,
and the tsunami afterward brought catastrophic dam-
age to such areas as Iwate, Miyagi and Fukushima.
Furthermore, a severe nuclear accident, categorized
as Level 7 (IAEA standard), which equaled the nuclear
accident at Chernobyl, occurred at Tokyo Electric
Power Company’s Fukushima No. 1 Nuclear Power
Plant.
It caused considerable damage to oil facilities. Six
CONTENTS 1. Preface.......................................................................................................................1
2. Profile of Petroleum Association of Japan .............................................................3
3. Domestic Oil Supply and Demand Trend ...............................................................7
4. Energy Policy in Japan ..........................................................................................13
5. Oil Stockpiling and New Emergency Countermeasures ....................................20
6. Japan’s Petroleum Resource Development .........................................................25
7. Regulatory Reform and Petroleum Industry ........................................................27
8. Petroleum Product Distribution and Marketing ..................................................32
9. Toward a Fundamental Reexamination of Petroleum-related Taxes .................36
10. Reinforcement of Corporate Structure .................................................................41
11. Thorough Safety Measures ...................................................................................43
12. Preparation for Major Oil Spill Incidents .............................................................45
13. Environmental Measures in the Oil Refining Sector ..........................................47
14. Quality Improvement in Automotive Fuels ..........................................................50
15. The Global Warming Issue and Oil .......................................................................53
16. Utilization of Biomass Fuel ...................................................................................59
17. Efficient Use of Oil .................................................................................................62
18. Efforts toward Developing New Energies ............................................................65
◆ Great East Japan Earthquake and the Petroleum Industry................................67
Appendix: ......................................................................................................................69
� Location of Refineries and Crude Distillation Capacity in Japan
� Overview of the Japanese Petroleum Industry
� Main Product Specifications in Japan
� PAJ’s Oil Statistics Website for Details

Profile of Petroleum Association of Japan2 Profile of Petroleum Association of Japan
3 4
The Petroleum Association of Japan (PAJ), incorpo-
rated in November 1955, is composed of 14 oil refin-
ers and primary oil distributors (Motouri) in Japan.
PAJ deals with all matters concerning the refining
and marketing of petroleum products. The main activ-
ities are:
1. Publishing information on important issues for the
petroleum industry
2. Advocating the industry’s opinions and submitting
proposals to the government, business associa-
tions, the media and the general public
3. Researching and coordinating activities related to
important petroleum issues and providing infor-
mation on such issues
4. Undertaking governmental subsidy programs such
as the “Major Oil Spill Response Program”, includ-
ing international conferences
5. Enhancing communication and understanding
among member companies
1. Basic Policy for Fiscal Year (FY) 2012 Business Activities
Since the Great East Japan Earthquake, the Japa-
nese Government has reexamined the nation’s energy
policy, i.e., reexamination of the Basic Energy Plan,
new countermeasures for global warming and formu-
lation of innovative energy and environmental strate-
gies, aiming at completing the task in summer 2012.
Oil, as a “system energy”, played an important role as
a last-resort energy supply during the time the supply
of electricity and city gas had been disrupted or
stopped. Taking this into account, PAJ made its pro-
posal on energy policy four times to the government.
However, sufficient acknowledgment of the impor-
tance of oil has not been made at the government
deliberations.
In 2012, taking those policy developments into
account, PAJ has focused on addressing reexamina-
tion of energy policy and developing concrete mea-
sures for ensuring stable oil demand, namely,
reevaluation of the government policy for an energy
shift to natural gas and realization of a level playing
field in taxation. Furthermore, PAJ has also lent its
expertise on issues such as how the oil industry
should deal with responses to a disaster, the consoli-
dation of oil refining functions, the promotion of bio-
mass fuel, and the right execution of subsidiary
projects for oil spill responses, as well as work on var-
ious issues in a number of fields to improve the busi-
ness environment and the industry’s competitiveness.
2. Projects and Main Activity Plans in FY2012
1. Addressing issues concerning the petroleum poli-
cy in the future
(1) Make proposals for energy policies focusing on
how the petroleum industry should be in the
future.
(2) Develop countermeasures for biomass fuel.
(3) Tackle the global warming issue.
2. Urging comprehensive reexamination of petro-
leum-related taxes and ensuring equity in taxation
among energy sources
3. Strengthening both the domestic and international
competitiveness of the petroleum refining industry
in Japan
(1) Take action toward international issues related
to the refining industry and efforts to reinforce
further competitiveness.
(2) Resolve problems by analyzing the corporate
management and financial condition of the
petroleum industry.
4. Promoting various uses of petroleum products
(1) Promote activities to encourage broad use of
PAJ’s High Energy Efficiency Oil Utilization Sys-
tems.
(2) Develop countermeasures for issues related to
automotive fuels.
(3) Conduct research study on qualities of petro-
leum products which meet environmental
requirements.
5. Promoting disaster prevention and environmental
pollution control measures
(1) Formulate a response system to such risks as
major earthquakes, outbreaks of new-type
influenza, etc.
(2) Reinforce disaster prevention measures,
increase efforts to mitigate excessive safety and
disaster prevention regulations, and enhance
voluntary safety management systems.
(3) Maintain and improve the PAJ Major Oil Spill
Response Program.
(4) Deal with environmental problems concerning
toxic chemical substances, etc.
6. Addressing oil supply and distribution issues
(1) Participate in developing policies and programs
for oil stockpiling and emergency responses.
(2) Enhance services to provide information on oil-
related databases and survey reports on
domestic and foreign petroleum markets.
(3) Make positive efforts towards formation of a
fair and transparent petroleum product market.
(4) Rationalize petroleum product distribution, real-
ize regulatory reform, and promote environ-
mental measures.
7. Promoting activities for a strong foundation for the
petroleum industry
(1) Conduct PR activities for better public under-
standing of the positioning of oil among energy
sources.
(2) Make right execution of the structural improve-
ment projects under the government subsidies.
(3) Support research and development operations
by the Petroleum Industry Technology and
Research Institute, Inc. (PITRI).
(4) Support business of the Japanese National
Committee of the World Petroleum Council.
(5) Deal with labor policy issues concerning the
petroleum industry.
(6) Enhance communication among PAJ member
companies and collaboration with concerned
business organizations.

Profile of Petroleum Association of Japan
5 6
PAJ Member Companies (14)
• Idemitsu Kosan Co., Ltd.
• EMG Marketing G.K.
• TonenGeneral Sekiyu K.K.
• Toa Oil Co., Ltd.
• Kashima Oil Co., Ltd.
• Taiyo Oil Co., Ltd.
• Fuji Oil Co., Ltd.
• Cosmo Oil Co., Ltd.
• Kyokuto Petroleum Industries, Ltd.
• Mitsui Oil Co., Ltd.
• Showa Yokkaichi Sekiyu Co., Ltd.
• Showa Shell Sekiyu K.K.
• JX Nippon Oil & Energy Corporation
• Seibu Oil Co., Ltd.
Former Member & Friend of PAJ (1)
• Kygnus Sekiyu K.K.
■ Executives President Yasushi Kimura Representative Director, Chairman of the Board, JX Nippon Oil & Energy Corporation
Vice-President Jun Arai President, Representative Director, Showa Shell Sekiyu K.K.
Vice-President Kazuhisa Nakano President, Representative Director, Idemitsu Kosan Co., Ltd.
Vice-President Jun Mutoh President, Representative Director, TonenGeneral Sekiyu K.K.
Vice-President Keizo Morikawa President, Representative Director Chief Executive Officer, Cosmo Oil Co., Ltd.
Senior Managing Director Hideo Matsui Managing Director Junichi Hatano Managing Director Nobuo Hata
� Management and Committees
Commercial/Industrial Fuels
Lubricating Oils
Refining Technology
Quality Control
Hydrogen and Fuel Cell
Automotive Fuels
Environment & Public Safety Committee
Global Environmental Issue
Finance
Petroleum-related Taxation
Inland Transportation
Coastal Transportation
Ocean Transportation
Public Relations
Stockpiling
IAB (Industry Advisory Board)
Environmental
Facilities Management
Safety
Petroleum Distribution Laws
= Sub-committees
SS Technological Issue
Aviation
Technical Committee
Taxation & Finance Committee
Transportation Committee
Public Relations Committee
Crisis ManagementCrisis Management Committee
Oil Stockpiling Committee
Petroleum Energy System
Policy PlanningCommittee
General Assembly
Board of Directors Board of StandingDirectors
Auditor
Committee ofManaging Directors
Oil Statistics Committee
Japanese National Committee for ISO TC28*
JIG Japan
General Service Committee
Countermeasure Committee
Refining
Marketing
Technical Group
PAJ Oil Spill Cooperative (POSCO)
Associated Organizations
ISO: International Standardization OrganizationTC: Technical Committee
JIG: Joint Inspection Group Limited
Distribution Committee
Policy Planning
Labor Policy

Domestic Oil Supply and Demand Trend3 Domestic Oil Supply and Demand Trend
7 8
Structural Decline in Oil Demand
Total petroleum fuel demand for fiscal year (FY)
2010 was about 196 million kiloliters (KL), up by 0.5%
from the previous year. Though the total fuel demand
had exceeded 200 million KL since FY1988, it fell
below the 200 million KL mark, continuing its
decrease from the previous year. On the other hand,
the total fuel demand for the first half of FY2010
showed a 2.5% increase versus the same term of the
previous year mainly due to economic recovery, and
increases in demand for gasoline, Fuel Oil B and Fuel
Oil C caused by the record high temperatures during
summer.
Though total fuel demand had fallen below the 200
million KL level during the early 1980s after the sec-
ond oil crisis due to a drastic decrease in demand for
Fuel Oil C and naphtha for industrial fuel and feed-
stock, respectively, other fuels demand increased fair-
ly consistently after the Second World War. This
upward trend terminated in 2000. Total fuel demand
reached a peak of 246.0 million KL in 1999, and a
structural downward trend has continued since 2000.
Peak demand volumes by fuel were: 61.5 million KL
for gasoline in FY2004 and 30.6 million KL for kero-
sene in FY2002. As for industrial fuels (Fuel Oil B and
Fuel Oil C), the peak volume was 111 million KL in
FY1973.
Major factors for such structural decline in oil
demand in Japan are as follows: agathering
momentum of the oil use reduction policy, bchanges
in social structure, and cglobal warming counter-
measures.
a Gathering Momentum of the Oil Use Reduction
Policy
After suffering the two oil crises, Japan has promot-
ed the so-called “Oil Use Reduction” policy as a core
energy policy for lowering oil dependence in Japan.
In particular, such policy measures as enhancing
nuclear energy, banning new construction of oil-fired
power plants, and providing LNG with preferential
policy treatment has been taken for reducing the con-
sumption of Fuel Oil B and Fuel Oil C for power gen-
eration and industrial use. Consequently, a fuel shift
from oil to coal or LNG has been progressing in the
industrial, household and commercial sectors.
b Changes in Social Structure
With the changes in the structure of society due to
continuous population decline caused by a falling
birthrate and an aging population in Japan, the petro-
leum industry confronts a decline in fuel consump-
tion. For example, a diminishing number of
customers lowers the use of gasoline and kerosene,
and a stagnant volume of transported goods together
with advancement of rationalization and efficiency in
the transportation industry reduces the consumption
of diesel fuel and Fuel Oil A. Regarding the decrease
in gasoline demand for automobiles, it is said that the
phenomenon of young adults not using cars, mainly
in urban areas, has been increasing.
c Global Warming Countermeasures
Since the reduction of CO2 emissions became a glob-
al issue, reducing consumption of oil as a fossil fuel
has been promoted. In response, oil consumption has
been lowered by efficiency improvement of energy
consumption such as shifting to energies that emit less
CO2 and improving vehicles’ fuel consumption.
Total fuel oil demand for the first half (Apr~Sep) of
FY2011 was 88.6 million KL, 4% down from the previ-
ous year. On a fuel-by-fuel basis, all fuels except Fuel
Oil B and Fuel Oil C showed a decrease. Especially, jet
fuel and kerosene decreased significantly by 22% and
17% respectively from the previous year. The rise in
demand for Fuel Oil B and C was brought about by
their increased use for electric power generation due to
the Great East Japan Earthquake. The fuel demand for
electric power will fluctuate depending on the future
operating status of nuclear power plants.
It is projected that structural factors for a downward
trend in Japan’s petroleum product demand, excluding
Fuel Oil B and Fuel Oil C, will not be changed, exclud-
ing temporary impacts such as rapid changes in crude
oil prices. However, in light of the lessons learned from
the Great East Japan Earthquake, in order for the petro-
leum industry to perform a last-resort function for
energy supply, it is essential to secure a stable scale of
oil demand as well as to maintain and strengthen the
overall petroleum supply chain.
Petroleum Supply System in Japan
For FY2010, the domestic yield of crude oil was a
mere 850 thousand KL, equivalent to 0.4%, or 1.5 days,
of the 208.3 million KL of Japan’s crude processing vol-
ume. Japan, therefore, imports almost all crude oil and
petroleum products for meeting domestic petroleum
product consumption demand.
There are two methods for covering domestic petro-
leum product demand: One method is to “import
petroleum products” and the other is to “import crude
oil and refine it to produce petroleum products locally”.
The latter method, i.e., crude oil importation and
domestic refining, has been adopted in Japan.
The method for refining crude oil within the country
is called the “Domestic Petroleum Refining System”.
This method has various advantages such as being
able to reduce procurement costs by importing a mas-
sive amount of crude oil with large-scale tankers, to
flexibly change production volume of each petroleum
product in line with the domestic demand structure, to
adjust product qualities which meet domestic environ-
mental standards, etc., and to provide superior ability
to cope with an emergency. Therefore, “Domestic
Petroleum Refining System” has been adopted as a
core pillar of Japan’s petroleum supply system.
For the past 30 years, domestic petroleum demand
has been more or less consistently declining and, at the
same time, demand for so-called “white fuels” such as
gasoline, naphtha and kerosene has been increasing.
Oil companies, therefore, have made efforts to follow
trends in supply and demand by constructing heavy oil
cracking units for increasing output of “white fuels”.
Any excess or deficiency beyond refining facility capac-
ity has been supplemented by import or export of
petroleum products.
With the advancement of internationalization, oil
companies in recent years have tried to use product
import and export more flexibly from a strategic view-
point.
0 50,000 100,000 150,000 200,000 250,000
(FY)
Unit: 1,000kl� Petroleum Product (Fuel) Domestic Demand Trends
Source: Ministry of Economy, Trade and Industry (METI)
209,219
218,012
26,29723,56621,56479,199 21,083
2,967
37,680 26,701 31,423 44,78346,623 27,066
3,739
243,21841,745 29,924 47,686 58,37231,364 29,516
4,611
34,543
196,05532,866 19,619 43,728 57,21423,743 14,680
4,204
2011
196,01932,891 20,349 46,699 58,15917,343 15,425
5,153
2010
2000
1990
1980
212,63932,03121,66315,99792,903 18,992
2,059
28,9951975
Total Fuels234,138
Naphtha36,240
Kerosene21,930
DieselFuel
16,759
Fuel Oil B,C111,007
Fuel Oil A19,306
Jet Fuel 1,673Gasoline27,2231973
236,10937,116 28,265 49,388 61,42127,009 27,780
5,129
2005

Domestic Oil Supply and Demand Trend
9 10
Crude Oil Import
The crude import volume by region in FY2010
showed that Middle Eastern oil-producing countries
accounted for 86.6%. Oil dependency on the Middle
East had once dropped to 68% in FY1987 after the oil
crises; however, the dependency rose again in the
1990s, because non-Middle Eastern oil producing
countries such as China and Mexico gradually
reduced their export of crude oils in accordance with
economic growth in their countries.
Regarding crude oil imports by country, four coun-
tries, namely Saudi Arabia (29.2% of total import vol-
ume), the United Arab Emirates (20.9%), Qatar (11.6%)
and Iran (9.8%), accounted for about three-quarters of
Japan’s total crude import volume.
It is extremely important for Japan to maintain and
enhance positive relationships with those Middle
Eastern countries. However, some of those countries
are not always problem-free in terms of their domes-
tic political situations or their relations with the inter-
national community. It would have to be said that this
is a fragile aspect of Japan’s petroleum supply struc-
ture.
Petroleum Product Import and Export
For Japan, which adopts the “Domestic Petroleum
Refining System”, petroleum product import plays a
supplemental role. Regarding naphtha, however,
about 60% of its domestic demand is served by
imported products, because petrochemical compa-
nies in Japan independently import naphtha as a pet-
rochemical feedstock. In addition, as domestically
refined fuels that are supplied to ocean liners in Japan
are classified as exports, such export volume accounts
for a large portion in the supply volume of Fuel Oil B
and Fuel Oil C. Likewise, the volume of jet fuel that is
supplied to international aircraft is regarded as an
export, and nearly double its domestic demand is
recorded as an export.
In recent years, the export volume of diesel fuel is
increasing year by year, though the future trend is
uncertain.
0
1,000
2,000
3,000
4,000
5,000
6,000
60
70
50
80
90
100
Unit: 1,000 bbl/day (%)
� Changes in Crude Processing Capacity and Capacity Utilization Ratio
Source: PAJ
Uti
lizat
ion
Rat
io(%
)
Cru
de
Pro
cess
ing
Cap
acit
y
5,274
79.2
4,856
82.7
4,895
78.9
4,846
74.5
4,627
77.7
4,559
74.2
4,796
82.9
4,767
87.2
5,221
79.4
4,552
77.3
4,973
62.3
5,940
66.0
5,940
70.7
5,410
85.2
2007 2008 2009 2011(FY)2010200620052000199519901985198019751973
n Petroleum Product Domestic Demand by Usage (FY2010) Unit: 1,000kl
Usage
ProductGasoline Naphtha Jet Fuel Kerosene Diesel Fuel Heavy Fuel Crude Oil Lube Oil Total
Automobile 58,130 32,005 670 90,805
Aviation 4 5,154 5,158
Transportation & Marine 3,962 128 4,091
Agriculture & Fisheries 1,786 593 3,129 5,508
Mining & Manufacturing 63 4,192 52 13,833 964 19,103
Electric Power 214 6,169 4,689 11,071
Household & Commercial 14,353 5,645 19,998
Chemical Feedstock 46,663 679 47,342
Total 58,197 46,663 5,154 20,331 32,863 32,737 5,368 1,762 203,076
Source: PAJ
n Petroleum Supply and Demand (FY2011) Unit: 1,000kl
Item
FY2009 2010 2011 %vs.Prev. Year
Crude OilImport 211,656 214,357 209,173 97.6
Processed 209,846 208,572 196,720 94.3
Product(Fuel Oil)
Opening Inventory 11,805 10,533 10,483 99.5
Production 196,375 195,157 185,440 95.0
Import 29,799 33,100 37,378 112.9
Total Supply 226,174 228,257 222,818 97.6
Domestic 194,988 196,019 196,055 100.0
Export 29,932 30,285 25,352 83.7
Total Demand 224,920 226,303 221,407 97.8
Closing Inventory 10,577 10,483 10,103 96.4
Source: METI
2000
1990
1980
1975
1973
OPEC 86.2 non-OPEC 13.8
249,199
238,480
254,604
UAE14.7
Saudi Arabia33.0
Iran 2.3Indonesia
15.0Oman
3.5Others
5.7
Kuwait 3.5China
3.8Qatar
3.5Iraq5.5
NeutralZone5.4
Others 3.3 Mexico 0.8
UAE21.4
Saudi Arabia19.5
Iran10.7
Qatar6.0
Indonesia12.6
Oman6.4
Mexico3.7
China 6.5 Others 5.4
OPEC 78.0
OPEC 87.5
non-OPEC 22.0
non-OPEC 12.5
Others 0.5Iraq 2.0
Vietnam 1.1
Kuwait 1.9
Others 0.2Australia 1.4
UAE25.6
Saudi Arabia21.6
Iran11.5
Kuwait7.4
China2.2
Oman4.5
Others3.3
Iraq 1.4 Indonesia 4.8Qatar
9.6
OPEC 89.2 non-OPEC 10.8
262,785UAE10.3
Saudi Arabia27.2
Iran22.3
Indonesia11.2
NeutralZone4.9
Oman2.9
Others 1.1Iraq 2.3
China3.6
Kuwait8.3
Others 2.7 Brunei 3.3
OPEC 92.9 non-OPEC 7.1
UAE10.8
Saudi Arabia19.9
Iran31.0
Indonesia14.7
Oman1.9
Others 0.8China 0.6
Brunei3.5
Kuwait8.2
Neutral Zone5.3
NeutralZone3.5
NeutralZone5.4
Qatar10.22011
OPEC 83.6 non-OPEC 16.4
209,173Russia
4.1UAE22.5
Saudi Arabia31.1
Iran7.8
Kuwait7.0
Indonesia 3.5Oman 2.3
Others6.5
Others 0.8Neutral Zone 2.0 Iraq 2.2
Qatar11.62010
OPEC 84.0 non-OPEC 16.0
214,357Russia
7.1UAE20.9
Saudi Arabia29.2
Iran9.8
Kuwait7.0
Indonesia 2.4Oman 2.7
Others3.8
Others 0.4Neutral Zone 1.9 Iraq 3.3
Nigeria 1.9Others 1.1
Iraq 0.3
288,609
(FY)
� Crude Oil Imports by SourceUnit: 1,000kl,%
Source: METI

Domestic Oil Supply and Demand Trend
11 12
Unit: 1,000kl,%
� Major Petroleum Products by Importing & Exporting Country
Source: METI
Republic of Korea90.3
Singapore8.0
USA 0.0Taiwan 1.7 Sweden 0.0
� Petroleum Product Import & Export Composition (FY2011)
Import
Export
Gasoline Kerosene Diesel Fuel Heavy Fuel
Import2,910
Import1,490
Import875
Import7,235
Export1,254
Export600
Export7,619
Export7,135
US Forces 4.5 Guam 2.4
Australia7.1
Australia 1.2
New Zealand8.8
USA 8.1
USA 1.2
Hong Kong 7.1
Singapore62.3
Republic of Korea97.4
China2.6
Malaysia0.0
Singapore20.7
US Forces 1.6US Forces0.0 India 1.2
Republic of Korea71.2
Republic of Korea100.0
Australia34.2
Singapore30.3
Chile 2.4México 2.0
Hong Kong13.0
Hong Kong 0.4
Philippines 1.7Others
4.5
Republic of Korea4.5
Republic of Korea0.3
China 2.9
Indonesia21.7
Indonesia 1.7
Republicof Korea
19.7
Thailand 0.3
Malaysia7.2
Russia 2.2China 0.8
Papua New Guinea 0.6Singapore 1.6
Bonded Oil(Bunker)
55.9China18.4
Singapore14.4
Malaysia 1.6Hong Kong 3.0
Malaysia50.6
Republicof Korea6.7
Naphtha 66.5
Jet Fuel 34.3 Diesel Fuel 30.1 Heavy Fuel 28.1
Kerosene 4.0
Heavy Fuel19.4
Gasoline7.8
Diesel Fuel 2.3Gasoline 4.9
Import37,378
Export25,352
Naphtha 0.2 Kerosene 2.4
Unit: 1,000kl,%
� Major Petroleum Products by Importing & Exporting Country
Source: METI
Republic of Korea91.1
Singapore8.9
USA0.0Sweden0.0
� Petroleum Product Import & Export Composition (FY2010)
Import
Export
Gasoline Kerosene Diesel Fuel Heavy Fuel
Import1,098
Import1,053
Import444
Import3,215
Export2,198
Export198
Export11,046
Export7,908
New Zealand4.8
Others7.8
Indonesia3.0
USA3.5
Hong Kong5.6
Singapore75.3
Singapore2.3
Republic of Korea91.6
China6.1
Philippines 3.1
China5.6
Malaysia0.0
USA 0.0Malaysia 0.0Germany 0.0
Singapore24.3
Belgium20.1
Taiwan3.4
Republicof Korea46.6
Republic of Korea100.0
Australia15.1
Singapore29.1
Chile10.9 Hong Kong
13.6
United Kingdom 5.4China 6.2
Others8.2
Republic of Korea
3.0
New Zealand2.5
Indonesia40.7
Republicof Korea
14.5
USA 2.8
China 0.4Australia 0.4
Russia 2.1Singapore
3.0
Bonded Oil(Bunker)
57.4
China14.2
Singapore20.2
Malaysia1.0
Hong Kong2.2
Republicof Korea5.0
Naphtha 82.3
Jet Fuel 29.5
Kerosene 0.6
Diesel Fuel 36.5 Heavy Fuel 26.1
Kerosene 3.2
Heavy Fuel9.7
Gasoline3.3
Diesel Fuel 1.4Gasoline 7.3
Import33,100
Export30,285
Jet Fuel 0.1
Malaysia36.1
Netherlands2.8
0
50
100
150
200
250
300
60
70
80
90
100
� Crude Oil Import Trends and Dependence on OPEC and Middle East
Source: METI
1st
Oil
Cri
sis
2nd
O
il C
risi
s
Gul
f Cris
is
Iraq
War
Dependence on Middle East
Dependence on OPEC
Crude Oil Import Volume
(million kl)
(%)
08 09 1110070605040302012000999897969594939291908988878685848382818079787776751973(FY)
77.578.2
71.4
68.8
78.6
87.1
84.0
71.5
289
263
249
197
238
266
255
21492.9
89.2
86.2
71.6
78.0
79.9
87.6 86.6
83.6
209
85.189.1
249
90.0
Japanese Oil Development CompaniesIndependent Oil Companies
Source: METI
� Crude Oil Imports by Supplier Unit: 1,000kl,%
National Oil Companies of Oil-producing Countries
(FY)288,609Oil Majors 74.1 8.5 9.2 8.3
262,7857.770.0 14.3 8.0
249,19944.5 44.4 7.83.3
197,26110.526.1 59.73.7
238,48061.3 9.027.8 1.9
265,52564.2 10.423.9 1.5
254,60422.2 67.3 8.32.2
249,01018.8 75.0 4.41.8
209,17318.4 73.7 4.33.62011
214,35717.8 74.4 4.73.12010
2005
2000
1995
1990
1985
1980
1975
1973

Energy Policy in Japan4 Energy Policy in Japan
13 14
Enactment of the Basic Act on Energy Policy
Japan’s energy policies have changed in response
to the diverse requirements of the times. As more
than 30 years have passed since the first oil crisis in
1973, it is now necessary not only to secure a stable
oil supply but also to promote fair competition, liber-
alization, and efficiency improvement through dereg-
ulation and other measures as well as to consider
global environmental issues.
Taking into account changes in the recent energy
situation, the Basic Act on Energy Policy, enacted in
June 2002, aims at advancing various measures in a
comprehensive manner to indicate the broad future
direction of energy policy in Japan. This law illustrates
the following three basic principles of energy policy
(the “3E”): “securing stable energy supply”, “environ-
mental consideration”, and “efficient supply using
market mechanisms upon due consideration of the
first two principles.” It stipulates the roles and respon-
sibilities of the central government, local govern-
ments, and others. The law also provides that taking
into account the next decade or so, the Basic Energy
Plan should stably map out the basic direction of vari-
ous measures on energy supply and demand in line
with these 3E principles.
Oil Remains an Important Energy even in the 21st Century
The petroleum industry has consistently advocated
the following opinions for the simultaneous achieve-
ment of the energy policy’s three basic principles (3E):
1. Achieve “the optimum energy mix” suitable for
Japan by evaluating the characteristics of each
energy source fairly and objectively.
2. Promote effective and efficient use of oil, which
constitutes the largest share of the primary energy
supply.
3. Emphasize the feasibility of launching new ener-
gies such as nuclear power and biomass.
4. Provide an equal footing regarding competitive
conditions on taxation, stockpiling obligations, etc.
among all energy sources in order to achieve “the
optimum energy mix”.
As a result of industry advocacy efforts, the terms
“Oil Use Reduction Policy” and “Departure from the
Middle East”, conventional objectives of Japan’s basic
energy policy, were eliminated from the Basic Energy
Plan established in October 2003. The plan re-empha-
sized the significance of oil by stating “oil will remain
an important energy source in the future from the
viewpoints of economic efficiency and convenience”.
Upon compilation of the Basic Energy Plan, a report
titled “Energy Supply and Demand Outlook toward
2030” was drawn up in October 2004. The following
points were clearly stated in this report:
1. Oil will remain the central player in primary energy
supply in 2030.
2. The introduction of IGCC (Integrated Gasification
Combined Cycle) fueled by residuals should be
promoted to enhance efficient utilization of oil
resources.
3. The whole concept of oil substitution policy, as
well as the definition of “new energies”, will be
reexamined.
Toward the Advancement of Energy Supply Structure
After the G8 Hokkaido Toyako Summit in 2008, argu-
ments for realizing a low-carbon society have been
spreading in the nation. Movements regarding global
environmental issues in foreign countries have also
become active. Those movements are pressing the
energy industry for drastic changes. It is requested to
develop future energy policies considering the simul-
taneous settlement of the global warming issue in
addition to ensuring energy security to cope with the
recent violent fluctuations of crude oil prices.
Under these circumstances METI started delibera-
tions, from October 2008, on the reexamination of its
alternative energy policy and the increased use of
nonfossil energies. Unstable conditions have contin-
ued such as a steep rise in prices of all fossil fuels
including oil in 2008, but a drop in the prices due to
worldwide financial instability after autumn. In these
deliberations, therefore, the vulnerability of Japan’s
energy supply structure has been pointed out; for
example, its dependency on offshore fossil fuels for
over 80% of its supply. In addition, the following pro-
posals were emphasized: (1) the importance of taking
medium- and long-term measures such as global
warming countermeasures and formation of a low-
carbon society and (2) the necessity for reexamining
energy policies, taking into account the Basic Act on
Energy Policy (a unified settlement of 3E).
The petroleum industry has been arguing in favor of
the following opinions through the deliberations of
the council meetings:
1. Oil should be regarded as a core energy, not as a
buffer energy, since oil will remain the major ener-
gy (40% of primary energy supply) even in 2030.
2. The Alternative Energy Law should be abolished
and new legislation should be established to allow
sophisticated use of all energies through innova-
tive technologies for securing stable supply as well
as efficient and clean use of oil resources.
3. An equal footing of competitive conditions such as
taxation and subsidies among energy sources
should be provided to achieve the optimum mix of
energies.
In consequence, as the basic policy for Japan to
realize “a low-carbon society”, the points below were
indicated in the report compiled in January 2009:
1. To reexamine the alternative energy policies for
which the purpose is merely restraining oil usage
2. To conduct an objective assessment of each ener-
gy’s characteristics based on the basic principles of
the Basic Act on Energy Policy and to enhance the
corresponding development of a sophisticated
energy supply structure
3. To give consideration to the impartiality of com-
petitive conditions among energy sources
The petroleum industry considers these points to be
extremely significant.
With the completion of the report, the concept of
“oil substitution” in the policy measures of the Alter-
native Energy Law, which aims only at reducing reli-
ance on oil, was reexamined and this concept was
eliminated in the revised law. Thereafter, a new law,
the Law Concerning Sophisticated Methods of Energy
Supply Structures, which incentivizes energy suppli-
ers to take such measures as listed below, was enact-
ed in July 2009:
1. To promote innovative energy technologies and
non-conventional resource development
2. To expand the use of nonfossil energies (nuclear,
hydraulic, geothermal, new energies, etc.)
3. To enhance the sophisticated and effective use of
fossil resources (crude oil, natural gas, coal, etc.)
This new law is intended to urge energy suppliers
(electric power, city gas and oil) to expand the use of
nonfossil energy resources as well as to promote
effective use of fossil resources. Specifically, the noti-
fication of the criteria for judgment concerning the
promotion of the effective use of fossil energies was
given in July 2010.
Aiming to raise the installation ratio of Japan’s
heavy oils cracking units (currently about 10%) to
about 13% by FY2013, each oil refiner is obliged to
attain the facility improvement in three stages
depending on the current installation ratio. This will
lead to new or additional installation of heavy oils
cracking units, or the reduction of crude distillation
units to raise the installation ratio. In addition to these,
each refiner is going to work on technology develop-
ment such as improvements in facility operations.
Restructuring of Japan’s Energy Policies ~Energy Policies after the Great East Japan Earthquake~
In recent years, the global energy conditions such
as the steep rise in crude oil prices have become
increasingly severe. The international energy market
is facing significant structural changes such as the
rapid growth of energy demand in Asian countries

Energy Policy in Japan
15 16
and the rising tide of resource nationalism.
In addition, energy prices have fluctuated widely as
the situation was made worse by various factors such
as natural disasters including damage from an earth-
quake and a hurricane, reexamination of energy secu-
rity in light of the Fukushima nuclear power plant
accident, inflows of speculative money, terrorist activ-
ities and uncertainties in the Middle East like the issue
of Iran’s nuclear development. Amid mounting inter-
national concern over energy security, many countries
are gearing up for the restructuring of their national
energy strategies.
In the context of these circumstances, while the
government pursues energy policies stipulated in the
second revision of the Basic Energy Plan in June 2010,
Japan faces unprecedented situations brought about
by the Great East Japan Earthquake and Fukushima
No. 1 Nuclear Power Plant accident which occurred on
March 11, 2011.
Under these circumstances, the government adopt-
ed “The Guideline on Policy Promotion~For the Revi-
talization of Japan~“ which shows Japan’s revitalization
policy, at the cabinet meeting on May 17, 2011 to pro-
vide reconstruction support for the eastern Japan
region, in addition to dealing with various pre-quake
issues facing Japan, and to start its efforts for revitaliz-
ing Japan.
This guideline specifies that correcting the distorted
and fragile energy system, implementing innovative
strategies for energy and environment on a short-,
medium- and long-term basis in order to comply with
requests for overcoming limited power supply and
strengthening safety measures, and enhancing safe,
stable and efficient energy supply in line with environ-
mental concerns shall be deliberated at the Council
on the Realization of the New Growth Strategy.
In response, the following three points were con-
firmed again and at the council’s meeting on June 7:a Japan is in a situation to reexamine with a clean
slate the existing Basic Energy Plan that aimed for
50% dependency on nuclear power generation in
primary energy supply by 2030, since Japan faces
such a unprecedented situation in light of the
Great East Japan Earthquake and Fukushima No. 1
Nuclear Power Plant accident.b Over the years, Japan has changed its energy mix
drastically from water to coal, from coal to oil, and
from oil to nuclear. Countries around the world
also structure their own energy strategies to meet
their needs. It is always an important issue for all
nations to select energies for achieving economic
growth and the stability of their citizens’ lives.c Japan needs to speed up its new consensus build-
ing by reexamining its energy and environmental
strategy from scratch, irrespective of the given
premises.
It was also decided to establish the Energy and
Environment Council, headed by the Minister of State
for National Policy, to rethink the nation’s energy and
environment strategies without exceptions across all
government agencies and ministries.
The Energy and Environment Council, of which the
first meeting was held on June 22, 2011, issued the
“Interim Compilation of Discussion Points for Formu-
lation of Innovative Strategy for Energy and the Envi-
ronment" on July 27, and decided the broad direction
by illustrating the scenarios of lowering the depen-
dence on nuclear power and shifting to a distributed
energy system. Based on this direction and the basic
policy, various deliberations were conducted at the
following organizations:
• The Green Growth Strategy at the Energy and
Environment Council
• Validation of the power generation cost of each
energy source including nuclear power at Commit-
tee to Review Costs, etc. of Power Generation
• Development of the optimum energy mix for the
new Basic Energy Plan at the Advisory Committee
on Energy and Natural Resources
• Countermeasures against global warming at the
Central Environment Council
• Issues on nuclear energy policy at the Atomic
Energy Commission
Taking into account the argument points and the
deliberation results at those meetings, the Energy and
Environment Council decided the “Basic Principles~
Towards a Proposal Defining Options for a Strategy
for Energy and the Environment~” on December 21.
Following this policy, redesign of the energy and envi-
ronment strategy was specified in the “Strategy for
Rebirth of Japan” adopted at the cabinet meeting on
December 24.
Showing options for the energy and environment
strategies and enhancing national debate, the drafts
of the Green Growth Strategy, the new Basic Energy
Plan, the new General Framework of Nuclear Energy
Policy and new global warming countermeasures will
be prepared through continuous deliberations in
2012. “The Innovative Strategy for Energy and Envi-
ronment” is scheduled to be decided during summer
2012.
Reexamination of Japan’s Petroleum Policies
In the deliberation of energy policies, petroleum
policies were also reexamined.
In particular, for securing a stable supply of oil as
the superior energy source due to its disaster
response capabilities, such topics were tackled ahead
of other energy policy measures as the reinforcement
of oil’s disaster response capabilities was studied at
the Round-table Session of Experts on the Policies of
Resources and Fuels. At the round-table session, it
was reported that in the Great East Japan Earthquake,
many requests from various quarters were made for
oil as a distributed energy in the situation where the
system energies’ supply (electricity and city gas) was
suspended. It was determined that oil, which could
meet such supply requests, played the role of the “last
resort of energy” for protecting people’s lives. It was
also decided, as a reinforced measure for a thorough-
going oil supply chain in a time of disaster, to formu-
late a joint disaster preparedness system among oil
and LPG companies by strengthening disaster
response capabilities at oil terminals and service sta-
tions as well as developing a system for data gather-
ing and information service on oil and LPG reserves,
etc. With PAJ’s advocacy efforts, the following opin-
ions were incorporated into the deliberation:
• Clarification of role sharing between public and
private sectors, and enhancement of their collabo-
ration
• Preparation for a system for information gathering
• Enhancement of disaster response capability at oil
terminals
• Necessity for stable oil demand to maintain a
sound supply chain in addition to the expansion of
government oil product stockpiling
However, at the 7th session of the Basic Issues Com-
mittee on Energy and Natural Resources, the follow-
ing four points were indicated as the direction of
reform for Japan’s optimum energy mix and energy
policy:a Thoroughly strengthen policy measures for energy
saving and electricity saving, considering consum-
ers’ behavior and changes in social infrastructure.b Accelerate the development and usage of renew-
able energies to the maximum extent possible.c Effectively utilize fossil fuels including an energy
shift to natural gas, while taking full consideration
of the environmental burden (clean use of fossil
fuels).d Lower the dependency on nuclear power genera-
tion as much as possible.
Although oil accounts for the major portion of
Japan’s primary energy supply, the petroleum indus-
try’s advocacy points as described below are hardly
incorporated into its report:
• Heighten the position of oil as a core energy, by
reevaluating its superiority in disaster response
capabilities in light of its ease of use in multiple
roles.
• Ensure a stable scale of oil demand to maintain the
oil supply chain.
Furthermore, an energy shift to natural gas was
included in the report; despite the fact that the future
energy strategy had not been firmed up at that stage.
From now on it is essential to carry out more careful
deliberations on each energy source from scratch,

Energy Policy in Japan
17 18
without preconditions.
The Innovative Strategy for Energy and Environ-
ment will be formulated around summer 2012, after
undergoing a process of national debate. PAJ contin-
ues to advocate the necessity of oil and its superiority
as an energy supply due to its disaster response capa-
bilities which can most benefit affected people.
Energy Supply and Demand Performance (FY2010 Flash Report)
Final energy consumption for FY2010 showed a
4.0% increase from the previous year, due to the eco-
nomic recovery, an extremely hot summer and a very
cold winter. In comparison with the previous year by
sector are: 6.8% up for the industrial sector, 2.8% up
for the household and civil sector, and 0.9% up for the
transportation sector.
As a result, the total final energy consumption
showed an increase versus the previous year after six
years of decline since FY2004.
On the other hand, the total domestic primary ener-
gy supply was 22,065 petajoules (PJ), or 569.3 million
KL in crude oil equivalent, up by 5.6% versus the pre-
vious year; of which oil was 8,853 PJ, or 228.4 million
KL in crude oil equivalent. The oil ratio decreased by
2.0% to 40.1% from the previous year’s 42.1%.
The supply ratios in the total primary energy supply
are: nuclear power decreased from 11.5% to 11.3%,
while coal increased from 21.0% to 22.6% and natural
gas increased from 19.0% to 19.1%. Major primary
energy sources other than oil showed growth from
the previous year. However, even the ratio of coal, the
second largest primary energy source following oil, is
just half that of oil. Stable oil supply, therefore, is
absolutely essential for ensuring energy security in
Japan even in the future.
Law Concerning Promotion of Use of Nonfossil Energy Sources and Effective Use of Fossil Energy Raw Materials by Energy Suppliers(Law Concerning Sophisticated Methods of Energy Supply Structures)
Necessity for Enhancing Energy Suppliers’ Efforts; Oblige Them to:
To promote � utilization of nonfossil energies and � effective utilization of fossil energy sourcesby Energy Suppliers (Electricity, Oil and City Gas)
• Expand the use of nonfossil power sources, ramping up nonfossil power sources such as solar energy and nuclear power more than 50% by 2020 (Electric Companies)
• Purchase electricity by solar power generation at fair prices (Electric Companies) • Use biomass fuels and biogas (Oil Companies and City Gas Companies) • Use crude oil and natural gas effectively (Oil Companies and City Gas Companies)
Necessity for Promoting Technology Development; Development in:
(Examples)• Hydrogen production, storage and fuel cells toward building a hydrogen society• Nonconventional resources (methane hydrate and oil sands)• High efficiency cracking facilities for residual oils• Integrated Gasification Combined Cycle (IGCC)• Utilization of cellulosic biomass like woody waste
Basic Policy(Formulated by METI Minister)
Criteria for Judgment(Oblige specific energy suppliers to
comply with � and �)
Plan Creation/Submission(Applicable companies:
Energy suppliers over a certain size)
Advice and Order**Status of efforts is quite insufficient
in light of the criteria for judgment
Partial Revision of Laws such as the Act on the Promotion of Development and Introduction of Alternative Energy
To change the objective for promoting development and introduction from “Alternative Energy to Oil” to “Nonfossil Energies” (new energies, nuclear power, etc.)
through reexamination of the alternative energy policy
Examples of Specific Measures
Set up and publicly announce guidelines for businesses to introduce use of nonfossil energies in their factories and offices (Examples)• Promotion of large-scale solar energy (mega solar) facility construction through cooperation with local public organizations• Further enhancement for launching new energies such as solar energy generation at public facilities like ports, railroads and airports
■ Long-term Final Energy Consumption Outlook Unit: million kl crude oil equivalent
(FY) 1990 2005 20102020 2030
Business-as-usual Case
AdditionalMeasures Case
PoliticalInitiative Case
Business-as-usual Case
AdditionalMeasures Case
PoliticalInitiative Case
Final Energy Consumption 359 100% 413 100% 386 100% 421 100% 401 100% 375 100% 424 100% 391 100% 346 100%
Industry 181 50% 182 44% 170 44% 180 43% 180 45% 177 47% 179 42% 179 46% 174 50%
Household & Commercial 95 27% 134 32% 128 33% 149 35% 134 34% 121 32% 154 36% 130 33% 103 30%
• Household 43 12% 56 14% 56 14% 61 14% 56 14% 52 14% 66 16% 56 14% 47 14%
• Commercial, etc. 52 15% 77 19% 73 19% 88 21% 78 20% 68 18% 87 21% 74 19% 56 16%
Transportation 83 23% 97 24% 88 23% 92 22% 86 22% 78 21% 91 22% 82 21% 69 20%
■ Long-term Primary Energy Supply Outlook Unit: million kl crude oil equivalent
(FY) 1990 2005 2010*2020 2030
Business-as-usual Case
AdditionalMeasures Case
PoliticalInitiative Case
Business-as-usual Case
AdditionalMeasures Case
PoliticalInitiative Case
Primary Energy Domestic Supply 508 587 570 627 596 553 637 590 515
Ener
gy C
ateg
ory
Oil 265 52% 255 43% 212 37% 227 36% 215 36% 190 34% 220 35% 204 35% 168 33%
LP Gas 19 4% 18 3% 16 3% 18 3% 18 3% 18 3% 18 3% 18 3% 17 3%
Coal 85 17% 123 21% 129 23% 128 20% 120 20% 107 19% 131 21% 119 20% 92 18%
Natural Gas 54 11% 88 15% 109 19% 114 18% 103 17% 89 16% 112 18% 94 16% 71 14%
Nuclear Power 49 10% 69 12% 64 11% 99 16% 99 17% 99 18% 107 17% 107 18% 107 21%
Hydropower 22 4% 17 3% 18 3% 19 3% 19 3% 19 3% 19 3% 19 3% 20 4%
Geothermal 0 0% 1 0% 1 0% 1 0% 1 0% 1 0% 1 0% 1 0% 2 0%
New Energy 13 3% 17 3% 20 4% 22 3% 22 4% 30 5% 29 5% 29 5% 38 7%
* actual figure Source: METI : The Long-term Energy Supply and Demand Outlook, in August 2009

Energy Policy in Japan Oil Stockpiling and New Emergency Countermeasures5
19 20
History of Japan’s Oil Stockpiling System
In response to OECD advice in December 1962,
which obliged member countries to hold oil stockpil-
ing at a 60-day equivalent to the nation’s oil demand,
the Energy Committee under the Industrial Structure
Council made a proposal for the necessity of oil stock-
piling, stating that “holding a certain level of oil stock-
piling meets the requirement for energy supply
security as a transitional measure to rectify a supply
and demand imbalance until converting to alternative
supply sources at a time of temporary supply short-
age”.
At the outbreak of the third Middle East War in 1967,
Japan’s oil dependency reached 65% of the primary
energy supply. With a rapid rise in risk awareness in
Japan, the Petroleum Council of the Advisory Com-
mittee for Natural Resources and Energy compiled its
interim report, which indicates the necessity for estab-
lishment of the petroleum special account as a subsi-
dy measure from financial aspects in order to achieve
60-day oil stockpiling by the end of FY1974. Accord-
ingly, the oil stockpiling system in Japan virtually
started from FY1972.
At the time, it was decided that holding of oil stock-
piling by the private sector with governmental subsi-
dies was more appropriate than holding it directly by
the government, and the following measures were
taken:
1. Long-term low-interest loans for purchasing crude
oil for stockpiling
2. Japan Development Bank loans for constructing
oil reserve facilities
3. Accelerated depreciation deductions for oil storage
tanks
The first oil crisis occurred after that. As oil consti-
tuted about 77% of the primary energy supply at that
time, people’s lives were severely impacted. At the
Ministerial Meeting on Energy Measures in December
1975, it was decided to raise the target days of oil
stockpiling to 90 days, and plans were drawn up to
increase stockpiling volume to a 90-day equivalent by
the end of FY1979.
With the enforcement of the Petroleum Reserve
Law, enacted in December 1975, 90-day oil stockpiling
held by private oil companies was started in April
1976. At the time of its start, various measures were
taken such as expanding interest subsidies, the estab-
lishment of joint stockpiling companies including a
rise in investment ratio, and the foundation of a subsi-
dy scheme for oil storage locations in order to lessen
the burden of the enormous cost of funds associated
with the buildup of stockpiles.
With recognition of the need for the government
itself to take an initiative in maintaining the oil stock-
pile, government stockpiling by Japan National Oil
Corporation (JNOC) was started in 1978. The target
volumes of the government oil reserve were
achieved: 30 million kiloliters (KL) in February 1989,
and 50 million KL in February 1998. During this 20
years period, 10 national oil stockpiling bases were
constructed across the country.
In accordance with the expansion of government
stockpiling, the private sector stockpiling was reduced
by 4 days each year from 1989 to 1993, and since then
a 70-day equivalent stockpiling system has been
maintained.
Oil Stockpiling System after Deregulation
As a result of the abolition of the Provisional Mea-
sures Law on the Importation on Specific Refined
Petroleum Products (Fuel Import Restriction Law) in
April 1996, importation of petroleum products was vir-
tually liberalized. After that the petroleum industry
legislation under normal times have been regulated
by (1) the Act on Quality Control of Gasoline and
Other Fuels (Fuel Quality Act), which was reformed
from the previous Gasoline Retail Business Law and
(2) the amended Petroleum Reserve Law, which stipu-
lates the requirements for new entrants of oil import-
ers.
In response to the abolition of the Petroleum Industry
Law in January 2002, the new Oil Stockpiling Act was
enforced. From the viewpoints of ensuring fulfillment 2011 (FY)200520001995199019851980
0
2000
4000
6000
8000
10000
12000
An
nu
al E
lect
rici
ty G
ener
ated
Ou
tpu
t
Unit: 100 mil kWh, %� Trends of Electricity Generated Output by Source
Source : FEPC* *Federation of Electric Power Companies
17
46
5
0
15
17
4,850
27
27
10
0
22
145,840
27
29
10
0
22
12
7,376
34
19
14
0
22
10
8,557
34
11
18
1
26
10
9,396
31
11
26
1
24
8
9,889
11
14
25
1
40
9
9,550
2010
29
8
25
29
9
10,064 1
Geothermal Power & New Energies(Solar Power, Wind Power, etc.)Hydraulic Power
Natural Gas
Coal
Oils
Nuclear Power
0 100 200 300 400
2010
2000
1990
1980
1975
1973(FY)
0 100 200 300 400 500 600
2010
2000
1990
1980
1975
1973(FY)
Hydropower, Geothermal 4.1
Nuclear Power 0.6New Energy 0.9Natural Gas 1.5
Unit: million kl crude oil equivalent, %� Primary Energy Supply Trends
Unit: million kl crude oil equivalent� Final Energy Consumption Trends
Source: METI
Source: METI
286Industrial 188 Civil 52 47
Transportation
286165 61 59
271168 53 50
358180 95 83
412186 125 101
386170 128 88
416Coal 15.5 Oil incl. LPG 77.4
1.0
42966.1 16.9 6.1 4.7 5.3
1.5 0.9
39673.4 16.4 5.3
2.5
52157.1 16.7 10.2 9.3 4.2
2.5
60950.8 18.1 13.0 12.2 3.4
3.5
59743.7 21.6 17.3 10.8 3.1
2.5
Oil Stockpiling and New Emergency Countermeasures
21 22
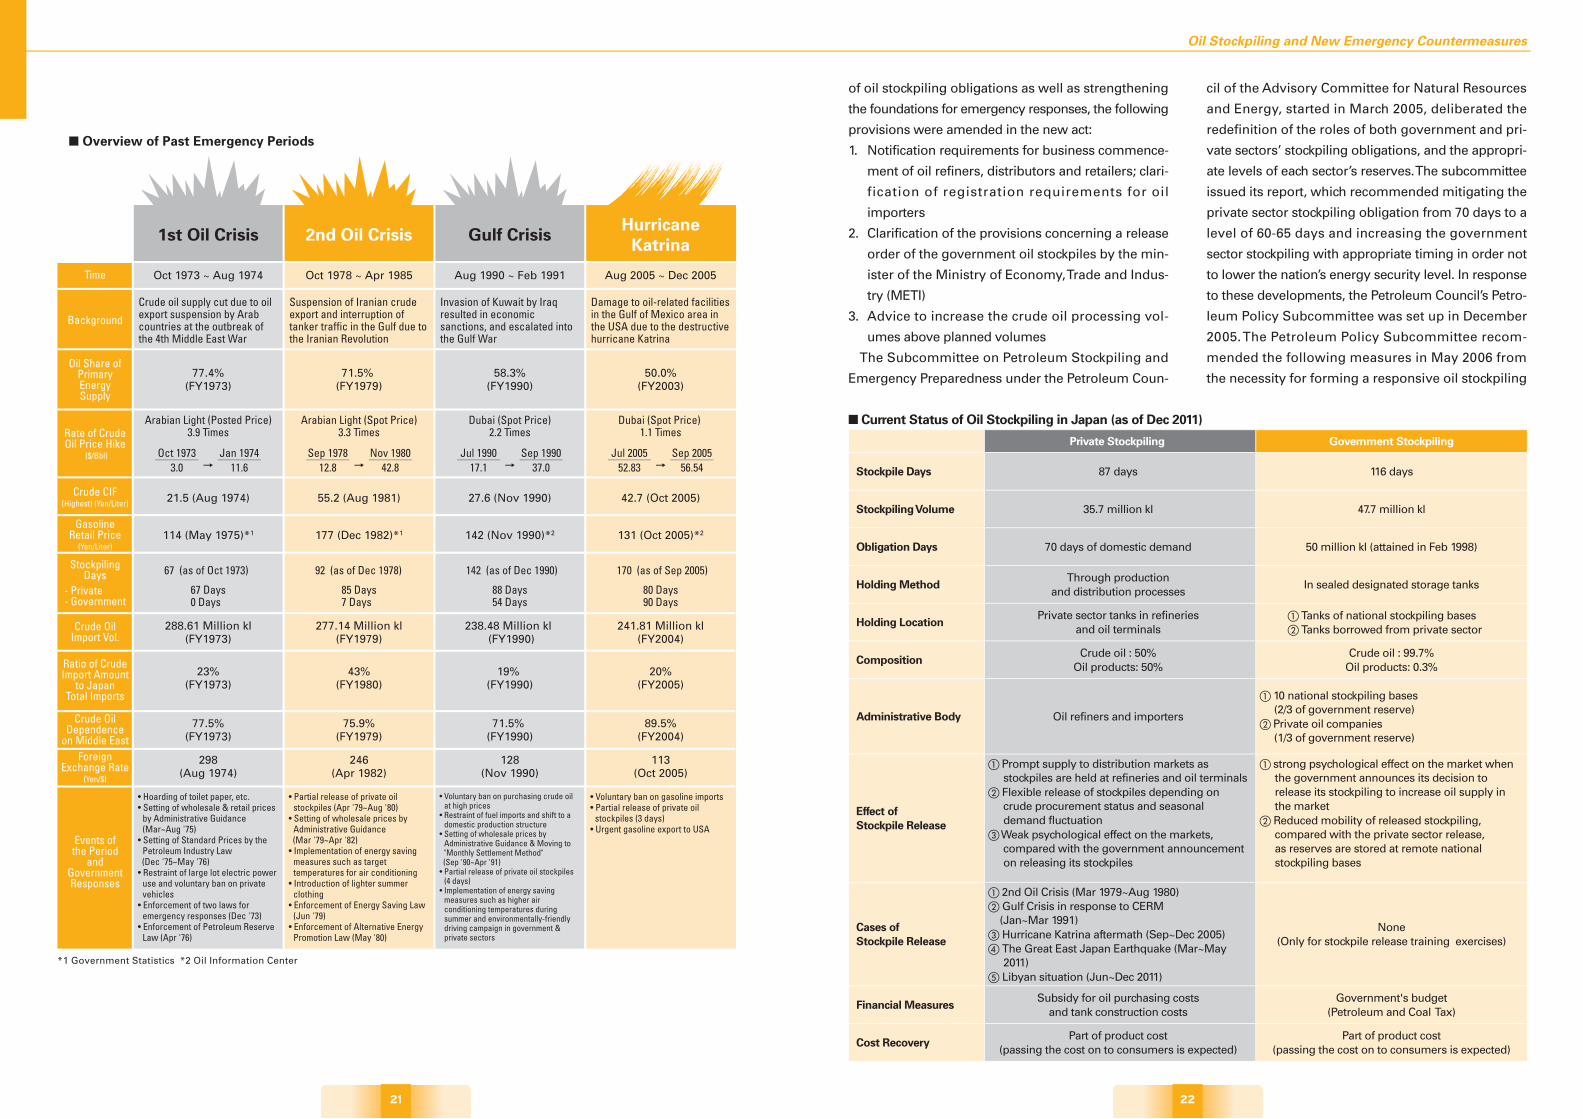
of oil stockpiling obligations as well as strengthening
the foundations for emergency responses, the following
provisions were amended in the new act:
1. Notification requirements for business commence-
ment of oil refiners, distributors and retailers; clari-
fication of registration requirements for oil
importers
2. Clarification of the provisions concerning a release
order of the government oil stockpiles by the min-
ister of the Ministry of Economy, Trade and Indus-
try (METI)
3. Advice to increase the crude oil processing vol-
umes above planned volumes
The Subcommittee on Petroleum Stockpiling and
Emergency Preparedness under the Petroleum Coun-
cil of the Advisory Committee for Natural Resources
and Energy, started in March 2005, deliberated the
redefinition of the roles of both government and pri-
vate sectors’ stockpiling obligations, and the appropri-
ate levels of each sector’s reserves. The subcommittee
issued its report, which recommended mitigating the
private sector stockpiling obligation from 70 days to a
level of 60-65 days and increasing the government
sector stockpiling with appropriate timing in order not
to lower the nation’s energy security level. In response
to these developments, the Petroleum Council’s Petro-
leum Policy Subcommittee was set up in December
2005. The Petroleum Policy Subcommittee recom-
mended the following measures in May 2006 from
the necessity for forming a responsive oil stockpiling
� Overview of Past Emergency Periods
288.61 Million kl(FY1973)
Events ofthe Period
andGovernmentResponses
StockpilingDays
Crude OilImport Vol.
Crude OilDependence
on Middle East
Time
Background
Oil Share ofPrimaryEnergySupply
Rate of CrudeOil Price Hike
($/Bbl)
Crude CIF(Highest) (Yen/Liter)
GasolineRetail Price
(Yen/Liter)
Ratio of CrudeImport Amount
to JapanTotal Imports
ForeignExchange Rate
(Yen/$)
1st Oil Crisis
Oct 1973 ~ Aug 1974
- Private- Government
Crude oil supply cut due to oil export suspension by Arab countries at the outbreak of the 4th Middle East War
• Hoarding of toilet paper, etc. • Setting of wholesale & retail prices
by Administrative Guidance (Mar~Aug '75)
• Setting of Standard Prices by the Petroleum Industry Law
(Dec '75~May '76)• Restraint of large lot electric power
use and voluntary ban on private vehicles
• Enforcement of two laws for emergency responses (Dec '73)
• Enforcement of Petroleum Reserve Law (Apr '76)
77.4%(FY1973)
21.5 (Aug 1974)
114 (May 1975)*1
Arabian Light (Posted Price)3.9 Times
Oct 19733.0
Jan 197411.6
67 (as of Oct 1973)
67 Days0 Days
23%(FY1973)
77.5%(FY1973)
298(Aug 1974)
277.14 Million kl(FY1979)
2nd Oil Crisis
Oct 1978 ~ Apr 1985
Suspension of Iranian crude export and interruption of tanker traffic in the Gulf due to the Iranian Revolution
• Partial release of private oil stockpiles (Apr '79~Aug '80)
• Setting of wholesale prices by Administrative Guidance
(Mar '79~Apr '82)• Implementation of energy saving
measures such as target temperatures for air conditioning
• Introduction of lighter summer clothing
• Enforcement of Energy Saving Law (Jun '79)
• Enforcement of Alternative Energy Promotion Law (May '80)
71.5% (FY1979)
55.2 (Aug 1981)
177 (Dec 1982)*1
Arabian Light (Spot Price)3.3 Times
Sep 197812.8
Nov 198042.8
92 (as of Dec 1978)
85 Days7 Days
43%(FY1980)
75.9%(FY1979)
246(Apr 1982)
238.48 Million kl (FY1990)
Gulf Crisis
Aug 1990 ~ Feb 1991
Invasion of Kuwait by Iraq resulted in economic sanctions, and escalated into the Gulf War
• Voluntary ban on purchasing crude oil at high prices
• Restraint of fuel imports and shift to a domestic production structure
• Setting of wholesale prices by Administrative Guidance & Moving to "Monthly Settlement Method"
(Sep '90~Apr '91)• Partial release of private oil stockpiles
(4 days)• Implementation of energy saving
measures such as higher air conditioning temperatures during summer and environmentally-friendly driving campaign in government & private sectors
58.3%(FY1990)
27.6 (Nov 1990)
142 (Nov 1990)*2
Dubai (Spot Price)2.2 Times
Jul 199017.1
Sep 199037.0
142 (as of Dec 1990)
88 Days54 Days
19% (FY1990)
71.5% (FY1990)
128(Nov 1990)
241.81 Million kl(FY2004)
HurricaneKatrina
Aug 2005 ~ Dec 2005
Damage to oil-related facilities in the Gulf of Mexico area in the USA due to the destructive hurricane Katrina
• Voluntary ban on gasoline imports• Partial release of private oil
stockpiles (3 days)• Urgent gasoline export to USA
50.0%(FY2003)
42.7 (Oct 2005)
131 (Oct 2005)*2
Dubai (Spot Price) 1.1 Times
Jul 200552.83
Sep 200556.54
170 (as of Sep 2005)
80 Days90 Days
20%(FY2005)
89.5%(FY2004)
113(Oct 2005)
*1 Government Statistics *2 Oil Information Center
■ Current Status of Oil Stockpiling in Japan (as of Dec 2011)
Private Stockpiling Government Stockpiling
Stockpile Days 87 days 116 days
Stockpiling Volume 35.7 million kl 47.7 million kl
Obligation Days 70 days of domestic demand 50 million kl (attained in Feb 1998)
Holding MethodThrough production
and distribution processesIn sealed designated storage tanks
Holding LocationPrivate sector tanks in refineries
and oil terminalsaTanks of national stockpiling basesbTanks borrowed from private sector
CompositionCrude oil : 50%
Oil products: 50%Crude oil : 99.7%
Oil products: 0.3%
Administrative Body Oil refiners and importers
a10 national stockpiling bases (2/3 of government reserve)bPrivate oil companies (1/3 of government reserve)
Effect ofStockpile Release
aPrompt supply to distribution markets as stockpiles are held at refineries and oil terminals
b Flexible release of stockpiles depending on crude procurement status and seasonal demand fluctuation
c Weak psychological effect on the markets, compared with the government announcement on releasing its stockpiles
astrong psychological effect on the market when the government announces its decision to release its stockpiling to increase oil supply in the market
b Reduced mobility of released stockpiling, compared with the private sector release, as reserves are stored at remote national stockpiling bases
Cases ofStockpile Release
a2nd Oil Crisis (Mar 1979~Aug 1980)b Gulf Crisis in response to CERM (Jan~Mar 1991)c Hurricane Katrina aftermath (Sep~Dec 2005)d The Great East Japan Earthquake (Mar~May
2011)e Libyan situation (Jun~Dec 2011)
None(Only for stockpile release training exercises)
Financial MeasuresSubsidy for oil purchasing costs
and tank construction costsGovernment's budget
(Petroleum and Coal Tax)
Cost RecoveryPart of product cost
(passing the cost on to consumers is expected)Part of product cost
(passing the cost on to consumers is expected)

Oil Stockpiling and New Emergency Countermeasures
23 24
system:
1. Increasing of the stockpile volume (by buildup of
the government stockpile)
2. Introducing oil product reserves by the govern-
ment
Regarding the government product reserve, it was
decided to implement kerosene stockpiling in July
2009. Kerosene reserve stockpiling at a level equiva-
lent to one day’s consumption during the peak season
(130 thousand KL) is underway in the five regions
(Hokkaido, East Japan, Kanto, Chubu & Kinki, and Shi-
koku & Kyushu) in Japan. However, neither reduction
of the private sector stockpiling days nor buildup of
the government stockpile volume was taken.
Taking into account the great difficulties experi-
enced in petroleum product distribution at the time of
the Great East Japan Earthquake in March 2011, the
improvement of the government’s oil product stock-
piling by expanding product coverage and volumes
for the stockpiles, and more flexible provisions for
stockpiling release requirements are currently under
review.
Toward New Emergency Countermeasures
In FY2007, the Subcommittee on Next
Generation Fuels and Petroleum Policies
under the Advisory Committee for Natural
Resources and Energy made a review
based on active promotion of international
cooperation for oil stockpiling with coun-
tries in and surrounding Asia, where oil
consumption is rapidly increasing. It also
discussed Japan’s cooperation toward sta-
bilization of the international oil market in
an emergency, taking into account the pos-
sible direct release of its stockpile to over-
seas countries.
In line with such movements, a Japanese
oil company successfully won an interna-
tional bid in 2009 for preferential sales and
purchase of its crude oil stockpile, based on
an intergovernmental agreement conclud-
ed with New Zealand. In June 2009, the
Agency for Natural Resources and Energy
(ANRE) in Japan made an agreement on
the Joint Stockpiling Project with the Supreme Petro-
leum Council (SPC) of the United Arab Emirates.
Based on this agreement, stockpiling of crude oil from
Abu Dhabi National Oil Company (ADNOC) had start-
ed with receiving the first cargo (about 300 thousand
KL) at the Kiire Stockpiling Base in Kagoshima Prefec-
ture in December 2009. In addition, under the basic
agreement on a joint project between ANRE and
Saudi Arabian Oil Company (Saudi Aramco) in June
2010, the first crude oil tanker (about 300 thousand
KL) arrived at the Okinawa Stockpiling Base in Okina-
wa Prefecture after February 2011. Such crude oil
reserves are used commercially by these oil produc-
ing countries under normal times; however, in an
emergency situation Japanese oil companies receive
preferential crude oil supply from their reserves under
these agreements. This scheme is expected to rein-
force energy security and at the same time to
enhance the formation of strategic relationships with
oil producing countries.
On the other hand, in accordance with moving
ahead with global warming countermeasures, pro-
moting the introduction of renewable energies is
underway. Since such energies as solar and wind
power generally have a supply instability problem, oil
as the last resort of energy, which complements the
supply instability, will play an ever-greater role.
It is however assumed that Japan’s domestic oil
demand will continue to show a structural downward
trend. In order to keep playing roles as being the last
resort of energy and for providing flexible responses
in an energy, it is an important policy issue to reduce
the petroleum industry’s burden of huge costs associ-
ated with holding the private stockpiling.
In response to society’s demand at the time of the
Great East Japan Earthquake in March 2011, the petro-
leum industry as a whole made utmost efforts to
maintain stable oil supply, utilizing the characteristics
of a distributed energy that thrives during disasters in
every segment, from refining to marketing. Currently,
the government is reexamining the current Basic
Energy Plan. The petroleum industry is advocating for-
mulation of an agile and flexible stockpiling system
which will be able to mitigate confusion caused by a
supply shortage of petroleum products in an emer-
gency, considering the lessons learned from the
recent great earthquake.
2008
8,614(177)
(77)
(99)
2007
8,902(174)
(79)
(95)0
2,000
4,000
6,000
8,000
10,000
201120052000199519901985198019791978(FY)
� Oil Stockpiling Obligation Trends: Volume and Days (end of Mar each year)
Source: METI
Unit: 10,000kl, (days)
Private Stockpiles
Government Stockpiles
volume: Product equivalent basisdays: Petroleum Reserve Law
(90)
5,945(90)
(7) (7) (31) (55) (76)
6,048(88)
(81)
6,593(95)
(88)
6,949(128)
(97)
8,277(144)
(89)
8,816(157)
(81)
8,075(193)
(79)
(84)
8,806(156)
(72)
(114)
2012
8,343(197)
(84)
(113)
2010
8,301(199)
(84)
(115)
2009
8,670(184)
(81)
(102)
8,743(166)
(74)
(92)
� Outline of Japan’s Response Measures for an Emergency Period (as of Apr 2012)
* Japan Oil, Gas & Metals National Corporation
Oil Stockpiling Measures Oil Supply Measures
At a normal
time
At a time of
threat
In the event of an emergency
Emergency Declaration
Petroleum Supply & Demand Adjustment Act
Allocation/Ration Systems of Major Commodities
Allocation/Ration Systems of Oil Products
Act on Emergency Measures for
Stabilization of National Life
Revised Petroleum
Stockpiling Act
Pri
vate
Sec
tor
Sto
ckp
ilin
g
Go
vern
men
t S
tock
pili
ng
JOGMEC*
Maintain reserves
Secure stable supply by releasing oil reserves
Stop making up oil reserves
Draw down oil reserves
Cooperative actions by industries under
government direction/supervision
Cooperative actions by the oil industry under government direction/supervision
Establish oil supply targets
Indicate production/import
plans
Order oil holdings, sales/deliveries
Indicate/order commodity imports
Indicate commodity holdings
Determine standard prices
Indicate commodity production
Order sales/deliveries
Mediate/guide oil supplies
Restrict oil consumption
Restrict operations at SS
Supply Measures on Major Commodities
Control Measures on Oil Consumption
Registration of oil refiners, importers & distributors for
information gathering

Japan’s Petroleum Resource Development6 Japan’s Petroleum Resource Development
25 26
Japan’s Petroleum Resource Development
Petroleum resource development in Japan started in the early Meiji period (1870s)
primarily in Niigata Prefecture. Currently, commercial production is carried out in Hok-
kaido, Akita and Niigata Prefectures. Also, exploration development activities continue
to be conducted, and Yufutsu Oil/Gas Well and Minami Nagaoka Oil/Gas Well can be
noted as representative examples. These wells are currently under production. Associ-
ated natural gas produced with oil is utilized as city gas or power generation fuel in
most adjacent areas and contributes to the local economies of such communities. As
Japan however is the third largest oil consuming country, demand cannot be satisfied
through domestic oil and gas production, because this volume is only 1.4% of the
domestic consumption of oil and natural gas. Almost all petroleum resources are
dependent on imports.
Independent development of offshore oil and natural gas resources by Japanese
firms contributes not only to ensuring long-term supply stability of energy resources,
but also to establishing and strengthening mutual relationships between Japan and oil
and gas producing countries. Fostering business links with those national oil compa-
nies and oil majors has great significance for energy security.
Today, Japanese firms are involved in approximately 130 oil and gas development
projects around the world in areas such as the Middle East, South-east Asia, Africa,
South and North America, and the former republics of the Soviet Union, of which
about 70 have performed well in commercial production (at the end of June 2011). The
share of crude oil and natural gas from independent crude oil and gas development
projects is about 24% of the total domestic demand volume.
Japan’s Independent Oil and Natural Gas Development in Future
Oil and gas exploration development is a difficult business, requiring a huge amount
of investment and advanced technologies. To acquire promising areas for exploration,
it is essential for the government to take diplomatic initiatives for opening up access
as well as for building and enhancing cooperative relationships with oil and gas pro-
ducing countries. As Japan’s oil development firms are latecomers to this business
sector and inferior in both capital and technologies to oil exploration companies such
as the oil majors in the USA and Europe, they have been subsidized by the govern-
ment through Japan National Oil Corporation (JNOC) and, then, a newly established
organization called Japan Oil, Gas and Metals National Corporation (JOGMEC) which
succeeded JNOC when it was abolished in April 2005.
In this way, the government regards crude oil and natural gas as important energy
sources and provides a favorable business environment for the private oil and gas
companies to conduct their business operations. In turn, the development firms invest
and distribute business resources to achieve their targets. It is expected that such a
joint government and private-sector system will continue to function effectively.
Idemitsu Petroleum UKIdemitsu E&P Shetland
◎Norske AEDC ◎Idemitsu Snorre Oil Development
◎Nippon Exploration & Production UK ◎CIECO North Sea
◎Marubeni Oil & Gas (U.K.) ◎CIECO Energy (UK)
INPEX UKSummit Petroleum
Mitsui E&P PolandArabian Oil◎The Egyptian Petroleum DevelopmentTeikoku Oil AlgeriaTeikoku Oil Suez SOBINPEX LibyaJapex LibyaMoeko Libya
◎ITOCHU Oil Exploration (Azerbaijan) INPEX North Caspian Sea◎INPEX Southwest Caspian SeaINPEX BTC PipelineITOCHU Oil Exploration (BTC)
◎Summit Discovery Resources ◎Mid Continent Oil & Gas ◎JX NOEX USA ◎Teikoku Oil de Burgos ◎JAPEX (U.S.)◎Teikoku Oil (North America)◎Mitsui E&P USAMitsui E&P Texas
INPEX IchthysINPEX Banda SeaJX Nippon Oil & Gas Exploration (Australia)◎Japan Australia LNG (MIMI) ◎INPEX AlphaINPEX BrowseCosmo Oil AshmoreINPEX Masela◎INPEX Sahul◎INPEX Timor SeaINPEX DLNGPL◎Mitsui E&P AustraliaJAPAN ENERGY E&P AUSTRALIAJAPAN ENERGY E&P JPDAOsaka Gas AustraliaOsaka Gas CruxOsaka Gas GorgonOsaka Gas Ichthys Development
INPEX Offshore Southeast MahakamINPEX South MakassarJAPAN CBM◎JX Nippon Oil & Gas Exploration (Malaysia)◎JX Nippon Oil & Gas Exploration (Sarawak)◎Universe Gas & Oil Company◎INPEX Corporation◎INPEX TengahIndonesia Natural Gas Resources Muturi KG Wiriagar Petroleum◎Nippon Oil Exploration (Berau)◎KG Berau Petroleum◎MI Berau◎Japan Papua New Guinea Petroleum◎Southern Highlands PetroleumMurray PetroleumINPEX Offshore North MahakamJAPEX ButonINPEX SERAM SEANippon Oil Exploration (Niugini)Moeco West Papua 1Moeco West Papua 3JX Nippon Oil & Gas Exploration (Onshore Sarawak)
Source: Japan Petroleum Development AssociationRemarks: ◎projects in production
JAPAN CARABOBOINPEX North Peru◎Teikoku Oil (Venezuela)Teikoku Oil (Suriname)◎JGC Energy Development (USA)
◎INPEX Offshore North CamposINPEX OFFSHORE NORTHEAST BRAZIL
◎Mitsui E&P Australia
◎Ravva Oil(Singapore)
Mitsui E&P Mozambique Area 1
Idemitsu Oil & GasMoeco Merangin
◎Nippon Oil Exploration (Myanmar)◎Mitsui Oil Exploration
◎Moeco Thai Oil Development◎Japan Vietnam Petroleum
◎INPEX NatunaMoeco Vietnam Petroleum
◎Moeco ThailandMoeco Southwest Vietnam Petroleum
Idemitsu Cuu Long PetroleumMoeco Cambodia
Siam Moeco Teikoku Oil (Con Son)
Japex Block AMoeco Tuna E&P
Moeco (Son Hong)JX Nippon Oil & Gas Exploration
(Peninsula Malaysia)Moeco (Phu Khanh)
Nippon Oil Exploration (Cuu Long)◎Moeco International ◎CIECO Exploration & Production (Australia)
◎Mitsui E&P Australia
◎Canada Oil Sands◎Japan Canada OilINPEX Canada
◎Sakhalin Oil and Gas Development◎Sakhalin Energy Investment
◎Arabian Oil◎Abu Dhabi Oil
◎United Petroleum Development◎Japan Oil Development
◎INPEX ABK◎Mitsui Gas Development Qatar ◎Qatar Petroleum Development
◎JJI S&N ◎Mitsui E&P Middle East
JAPEX Garraf
◎MPDC Gabon◎Teikoku Oil (D.R.Congo)
◎Angola Japan Oil◎AJOCO Exploration
◎AJOCO '91 ExplorationCIECO E&P (Namibia)
Mitsui E&P Ghana KetaINPEX West Congo Petroleum
◎Energy Mega Pratama
■ Major Independent Oil Development Projects by Japanese Firms (as of the end of Nov 2011)

Regulatory Reform and Petroleum Industry7 Regulatory Reform and Petroleum Industry
27 28
Progress in Deregulation
Amid the ongoing globalization and easing of regu-
lations in the Japanese economic society, the Japa-
nese petroleum industry reached almost complete
liberalization at the end of 2001 when the Petroleum
Industry Law was abolished.
In consideration of the importance of oil, regula-
tions of the petroleum industry had been enforced by
giving the highest priority to the concept of securing a
stable supply under the Petroleum Industry Law,
which was enacted in October 1962 as a fundamental
law. The Petroleum Reserve Law, the Gasoline Retail
Business Law, and the Provisional Measures Law on
the Importation on Specific Refined Petroleum Prod-
ucts (Fuel Import Restriction Law) were enacted since
then to complement the Petroleum Industry Law.
Consequently, a broad range of regulations as well as
administrative guidance on petroleum imports, refin-
ing, manufacturing, and marketing were in effect.
However, as the gap between domestic and foreign
prices during the deregulation process became a politi-
cal issue, the shape of petroleum industry regulations
was reviewed. As a result, a series of deregulation
measures concerning the administrative guidance and
its procedures under the Petroleum Industry Law and
the Gasoline Retail Business Law were implemented
during the period between 1987 and 1992. After April
1996, when the Fuel Import Restriction Law was abol-
ished, the objective of Japanese petroleum policy
became the realization of an efficient oil supply using
market mechanisms, in addition to securing a stable oil
supply.
In June 1998 the Petroleum Council compiled a
report outlining the future direction of the petroleum
policy with a main focus on the following points, aim-
ing at implementation in 2001:
a The abolition of supply and demand adjustment
regulations such as the need for approval for busi-
ness commencement and facility investments
b The abolition of regulations on pricing based on
setting standard prices
The council then deliberated the optimum form of
oil stockpiling and emergency responses, and pro-
posed in its report in August 1999 to establish specific
response measures and an increase in the volume of
the government oil stockpiling. The report also point-
ed out that “it is extremely important from the view-
point of security measures to have a healthy
petroleum industry which runs a stable business even
in a severe management climate.”
Taking into account the above report and others, the
Petroleum Industry Law was abolished at the end of
December 2001. At the same time, the Petroleum
Reserve Law was partially amended and reformulated
as the new Oil Stockpiling Act, enforced in January
2002, to strengthen the infrastructure for emergency
responses. As a result, major petroleum industry reg-
ulations are limited to oil stockpiling requirements by
the Oil Stockpiling Act, and to fuel quality by the Act
on the Quality Control of Gasoline and Other Fuels.
In the midst of such ongoing regulatory reforms, the
excess capacity of oil refining facilities became an
issue under a decline in domestic oil product demand
mainly attributable to the enhancement of the oil use
reduction policy, the falling population, a low birthrate
and aging population, a rapid increase in crude oil
prices, and growing awareness of energy conserva-
tion during the economic recession after the Lehman
Shock. While the petroleum industry is making volun-
tary efforts to reduce its refining capacity, it was decid-
ed that oil refiners need to hold at least a certain level
of the capacity of heavy oil cracking units by the Law
Concerning Sophisticated Methods of Energy Supply
Structures. Consequently, each oil company is
requested to cut its refining capacity through this reg-
ulatory measure by the end of Fiscal Year (FY) 2013. In
some oil companies, the partial reduction in refining
capacities as well as refinery closures have already
been decided.
Business Environment Changes after Deregulation
With deregulation and the abolition of the Fuel Import
Restriction Law as a turning point, the�petroleum indus-
try has been forced to face a difficult business environ-
ment under sluggish market conditions and worsening
corporate profits due to severe price competition in dis-
tribution markets. For this reason, each oil company has
been making efforts to lower its operating costs in every
aspect of business, such as the rationalization of refin-
ing and distribution functions, restructuring by large-
scale workforce reductions in marketing and
administrative functions, and the reengineering of cor-
porate organizations.
In the ongoing process of liberalization in each phase
of manufacturing, importing and marketing, after such
regulatory reforms as the abolition of the Fuel Import
Restriction Law and the Petroleum Industry Law, it has
become much more important for the petroleum indus-
try to conduct business activities under market mecha-
nisms. The introduction of a market mechanism helps
to promote the streamlining of manufacturing and sup-
ply systems through appropriate distribution of
resources in a market. To that end, extensive disclosure
of appropriate market information is essential for the
effective functioning of market mechanisms. Before
deregulation, however, the available information on oil
supply and demand was limited to the statistics collect-
ed and publicized by the government. As these statistics
were mainly for analyzing the nation’s macroeconomic
trends, it was insufficient for use as an up-to-date tool to
allow market mechanisms to function effectively.
Under such circumstances, PAJ developed the PAJ
Oil Statistics Weekly, which gives the weekly supply
statistics on crude oil and petroleum products, an
accurate, prompt and precise database, to provide
data on oil supply situations on a weekly basis in Jan-
uary 2003. Since then, data on petroleum product sup-
ply by area (East Japan and West Japan), petroleum
product export, and refining capacity utilization ratios
were added. PAJ continues to extend its information
PAJ's Oil Statistics Weekly Website
https://stats.paj.gr.jp/
� Petroleum Industry Regulatory Reform History in Japan
Year1960
1975
1985
1990
1995
2000
2005
2010
1965
During Normal Periods During EmergenciesEnactment of Petroleum Industry LawJul '62
Enactment of Petroleum Reserve LawApr '76
Two Emergency Laws:Dec '73
Enactment of Gasoline Retail Business LawMay '77
Repeal of Fuel Import Restriction Law (Import liberalization of fuel products)Mar '96
Repeal of Petroleum Industry Law
Partial Revision of Act on Quality Control of Gasoline and Other Fuels(Registration and Quality Assurance Obligation of Processors)
Dec '01
Enforcement of Law Concerning Sophisticated Methods of Energy Supply StructuresAug. ’09
Notification of Criteria for Judgment Concerning Promotion of Effective Use of Fossil Energies (Raise Installation Ratio of Heavy Oils Cracking Units to about 13% by FY2013)
Jul ’10
Notification of Criteria for Judgment for Using Nonfossil Energies(Set Target Volumes for Using Bio-ethanol for Mixing with Gasoline by FY2017)
Nov ’10
Enactment of New Petroleum Stockpiling ActJan '02
Feb '09
Automatic Approval for Installation of Product Upgrading FacilitiesJul '87
Abolition of Guidance on Gasoline Production QuotaMar '89
Abolition of Guidance on Kerosene Inventory Build-up for WinterOct '89
Mar '90
Flexible Approval for Installations of Crude Processing FacilitiesSep '91
Abolition of Guidance on Crude Processing (Throughput)Mar '92
Abolition of Tariff-quota System (TQ) for Heavy FuelsMar '93
Abolition of SS Certificate System for Fuel Supply-source by its Branded Primary Distributor
Lifting of the Ban on Manned Self-service SS
Dec '97
Apr '98
Enactment of Act on Quality Control of Gasoline and Other Fuels by revising Gasoline Retail Business Law
Abolition of Guidance on SS Construction (Scrap-and-Build Rule)and on Transfer of SS Brand between Primary Distributors
Apr '96
Revision of Petroleum Reserve LawApr '96
Automatic Approval of Petroleum Product Exports (Export Liberalization of Fuel Products)
Jul '97
Enactment of Provisional Measures Law on Importation ofSpecific Refined Petroleum Products (Fuel Import Restriction Law)
Jan '86
1st
Phas
e D
ereg
ulat
ion
2nd
Phas
e D
ereg
ulat
ion
• Emergency Law for Stabilization of National Life• Petroleum Supply and Demand Optimization Law

Regulatory Reform and Petroleum Industry
29 30
coverage and expects the establishment of a transpar-
ent oil market by providing up-to-date oil supply infor-
mation which can be used to allow the full functioning
of market mechanisms.
Establishment of Fair and Equal Competitive Conditions among Energy Sources
More intensified competition than ever among ener-
gy sources is projected with the progress of deregula-
tion. In such a situation, compared with other energies,
oil is unfavorably treated to a significant degree in
terms of taxation and its stockpiling obligations.
From April 2003 coal was added as a taxable product
under the petroleum and coal tax scheme, and the tax
rates of LNG and imported LPG were raised, taking into
account the reinforcement of measures to reduce CO2
emissions originating from fossil fuels and the fairness
of tax burdens among energy sources. Though the tax
gaps between oil and other energies were narrowed,
still higher tax rates versus other energies were
imposed on oil (more than double) even after April 2007
when the final tax rates were applied as shown below:
- Oil : 2,040 yen/Kiloliter (KL)
- Coal : 700 yen/ton
- LNG : 757 yen/KL on an oil calorie equivalent basis
- Import LPG: 822 yen/KL on an oil calorie equivalent
basis
Furthermore, in the FY2012 Tax Reform Package, a
rise in the tax rate of petroleum and coal tax, in accor-
dance with the amount of CO2 emissions, was decided
in phases from October 2012 as a tax for global warm-
ing countermeasures. The new tax rates for FY2016 will
be 2,800 yen/KL for oil, 1,860 yen/KL for LNG and LPG,
and 1,370 yen/KL for coal. Since the petroleum industry
had been insisting on conducting a close investigation
beforehand of the global warming countermeasures in
the existing budget, which exceeds 1 trillion yen, it is
regrettable that a tax hike merely for obtaining tax reve-
nue was decided. As petroleum and coal tax is levied on
crude oil, the oil companies are responsible for all tax
collections and payments under open competition
based on market mechanisms. Thus, no cost recovery
system including such tax collections is provided.
Essentially, taxes on oil consumption are considered to
be borne by its end-consumers. The taxpaying capacity
of oil companies reaches a critical limit during a down-
turn in domestic demand. The petroleum industry there-
fore seeks a political consideration for ensuring the
collection of the tax increases.
On top of that, new fuels like alcohol fuels (100% alco-
hol) and compressed natural gas for CNG vehicles have
neither any diesel oil transaction tax nor gasoline tax
imposed on them. Since those fuels are for use in auto-
mobiles, the impartiality of tax imposition is being seri-
ously ignored.
Oil stockpiling became a very useful policy measure
as a pillar for energy security after the oil crises. As for
the stockpiling obligation of imported energy resources
other than oil, however, only LPG has a 50-day require-
ment, but there is no obligation for natural gas. As it is
assumed that natural gas demand will increase from
now on, prompt actions regarding natural gas stockpil-
ing are necessary from the viewpoint of maintaining a
stable energy supply.
On the other hand, the Law Concerning Sophisticated
Methods of Energy Supply Structures was enacted in
June 2009 to enhance the efforts towards the formation
of a low-carbon society. The Act on the Promotion of
Development and Introduction of Alternative Energy
(the Alternative Energy Act) was also revised, so that the
past mindset of promoting alternative energies at the
expense of an excessive tax burden only on oil has
been changed. Realizing competitive conditions on an
equal footing among energy sources is important to
form a fair market where market mechanisms are
allowed to function effectively.
Movements toward Petroleum Industry Reorganization
In view of the global realignment of oil majors, reor-
ganization of domestic financial institutions, and fierce
competition in the domestic oil market after the aboli-
tion of the Fuel Import Restriction Law, a realignment of
domestic oil refiners and primary oil distributors
(Motouri) was put in motion after the merger of Nippon
Oil and Mitsubishi Oil in April 1999. Unprecedentedly
large-scale and rapid market reorganization has
occurred since then. As a result, the petroleum industry
entered an era centering on a four-group-Motouri
framework; i.e., the Nippon Oil and Cosmo Oil Group,
ExxonMobil Japan Group, Japan Energy and Showa
Shell Sekiyu Group, and Idemitsu Kosan as of 2000.
However, excess refining capacity remains an indus-
try-wide issue. Even after reorganization into four major
nationwide groups, Japan’s ExxonMobil group further
integrated with four affiliated companies into ExxonMo-
bil Yugen Kaisha. Idemitsu Kosan closed its Hyogo
Refinery in April 2003 and its affiliate Okinawa Sekiyu
Seisei’s refinery in November 2003 to resolve its group’s
facility surplus. At the same time, the company extend-
ed its business alliance with Nippon Oil to the refining
function in addition to the current distribution function.
Moreover, backed by soaring crude oil prices and
strong demand for oil and petrochemical products in
Asia, such movements as the formation of strong part-
nerships between oil companies in Japan and Middle
Eastern oil producing countries through capital allianc-
es, and the entry into Japan’s oil market by foreign capi-
tal companies from Brazil and China were seen around
2007.
In 2008, to cope with recent high crude oil prices
and fierce competition in the overall energy market,
Nippon Oil merged with Kyushu Oil in October 2008.
0
350
400
450
500
550
Mar '12Dec '03Mar '000
100
200
300
400
500
600
Mar '04Mar '930
10,000
20,000
30,000
40,000
50,000
60,000
65,000
Mar '11Mar '950
5,000
10,000
15,000
20,000
25000,
30,000
35,000
40,000
Mar '11Mar '95
� Petroleum Industry Rationalization in Production, Distribution and Sales Facilities (Example)
Production Facilities (Refining Capacity)
Distribution Facilities (No. of Oil Storage Terminals)
Retail Outlets (No. of SS)
Work Force (No. of Employees)
Unit: 10,000b/d
±535
±499
±450
±600
±190
60,421
38,777
36,363
20,482
� Reorganization of Oil Companies in Japan (as of Jun 2012)
* Nippon Oil and Idemitsu Kosan concluded distribution alliance in 1995
Idemitsu Kosan Idemitsu Kosan
Nippon OilNippon Mitsubishi Oil Nippon Oil
JX Nippon Oil& Energy
Mitsubishi Oil
Daikyo Oil
Maruzen Oil Cosmo Oil Cosmo Oil
(Former) Cosmo Oil
Kyushu Oil
Nippon MiningJapan Energy
Kyodo Oil
Showa OilShowa Shell Sekiyu Showa Shell Sekiyu
Shell Sekiyu
Esso SekiyuExxonMobil
TonenGeneralMobil Sekiyu
TonenTonenGeneral Sekiyu
General Sekiyu
Taiyo Oil
Mitsui Oil
Taiyo Oil
Mitsui Oil
Merger in Apr 1999
Name changed in Jul 2002
Merger in Apr 1986
Merger in Dec 1992
Merger in Jan 1985
Merger in Jun 2002
Merger in Jul 2000
Refining & distributionalliance in Oct 1999
Reorganization inJun 2012
Refining & distributionalliance in Oct 1999
Refining alliance in Dec 2002*
Mergerin Jul 2010
Mergerin Oct 2008

Regulatory Reform and Petroleum Industry Petroleum Product Distribution and Marketing8
31 32
Furthermore, in July 2010 JX Nippon Oil & Energy was
established as a result of the management integration
between Nippon Oil and Japan Energy, which had con-
cluded a wide-ranging business tie-up agreement from
upstream operations to refining and distribution opera-
tions, fuel cell business, and technology development.
Management efforts toward further rationalization and
efficiency improvement apart from the existing four-
group structure were conducted.
Then in January 2012, ExxonMobil Japan Group
announced a change in its domestic capital ties in
Japan so as to transform itself into TonenGeneral
Group.
Enhancement of Rationalization and Efficiency Improvement after Reorganization
With the progress of such reorganization, each oil
company made efforts to streamline all of its business
segments such as their own refineries, fuel storage ter-
minals and service stations. Consequently, Japan’s total
refining capacity decreased by 0.85 million barrels per
day (BPD) or more than 16% during the past 12 years
from 5.35 million BPD in March 2000 to 4.50 million
BPD at the end of March 2012. In addition, on Septem-
ber 30, 2010, JX Nippon Oil & Energy announced plans
to reduce its group’s crude processing capacity by 400
thousand BPD versus December 2008 to 1.39 million
BPD at the end of October 2010 as well as to move up
by one year the schedule for an additional capacity
reduction of 200 thousand BPD, which was originally
planned to be completed by the end of March 2015, to
the end of March 2014. Furthermore, Idemitsu Kosan
announced the shutdown of the crude processing func-
tion (120 thousand BPD) of its Tokuyama Refinery in
March 2014.
With the efforts towards management efficiency
improvement and rationalization such as mergers and
business consolidation, the total workforce of oil refin-
ers and Motouri was reduced significantly during the
past 16 years, and at the end of March 2011 it was about
20,000 employees, compared with about 36,000
employees at the end of March 1995.
In addition, aiming at becoming integrated energy
firms, some oil companies are expanding into other
energy businesses, such as electric power, LNG, and
the distributed energy sector, where new energies like
fuel cells and solar photovoltaic power generation are
expected to grow. Beside the progress in streamlining
management style, creation of holding companies
among affiliated firms is seen in some cases.
Shaping the future evolution of the Japanese petro-
leum industry, oil companies have been making efforts
to enter new or other energy fields like electricity, since
oil demand will continue to decrease. They are also
accelerating their movement toward becoming a total
energy industry through realizing integrated operations
with various industries such as petrochemical compa-
nies through Refinery Integration for Group-operation
(RING) projects, while working on further rationalization
and efficiency improvement of their core oil business.
Distribution Rationalization and Efficiency Improvement due to Deregulation
Petroleum products are delivered to consumers by
coastal tankers, tank trucks, railroad tankers and pipe-
lines in Japan. A large portion of oil distribution is carried
out by tank trucks and coastal tankers.
A number of developments have taken place to cope
with the changes in the management climate since the
abolition of the Provisional Measures Law on the Impor-
tation of Specific Refined Petroleum Products (Fuel
Import Restriction Law) at the end of March 1996. In the
logistics segment, the petroleum industry has pushed
forward relocation and integration of distribution facili-
ties, expansion of product exchanges with other oil com-
panies, as well as joint use of refining and distribution
facilities. As a wave of business alliances and integration
beyond the corporate framework has been taking place,
especially after 1999, further efficiency improvement and
cost reduction measures in the industry have been taken.
Meanwhile, deregulation in coastal and land transpor-
tation has been executed from the viewpoint of the
industry’s efficiency improvement in physical distribu-
tion. For example, in the area of land transportation, the
introduction of tank trucks with a larger capacity was pro-
moted, as trucks with a cargo capacity of 26-28 kiloliters
(KL) were allowed by regulation amendments in Novem-
ber 1993, and “ultra-compact” tank trucks (more compact
than conventional trucks but with the same 24KL cargo
capacity) as well as those with a cargo capacity of 30KL
were developed by further partial mitigation of the regu-
lation and safety standards in October 2003. Besides,
unloading of fuels at a service station (SS) by the tank
truck (T/T) driver alone (SS staff presence is not required)
was permitted from April 1999 to improve delivery effi-
ciency on condition that safety countermeasures should
be more strictly adhered to. The permission was expand-
ed in October 2005 to include deliveries to tanks at kero-
sene distribution depots and to customer owned tanks.
It is also expected that expansion of the T/T driver
unloading system will enhance safety, reduce distribu-
tion costs and boost convenience for SS operation and
for customers.
Business Climate Changes Surrounding Service Stations
The Japanese petroleum industry entered a period
of full-scale globalization and liberalization after the
abolition of the Petroleum Industry Law in December
2001. The industry has faced unprecedented structural
changes, as the domestic oil market became linked
with international markets. Besides, an increase in
new generation vehicles such as electric vehicles (EV)
and plug-in hybrid vehicles (PHV) is expected in the
future.
To cope with such changes, it has become the most
pressing issue for oil refiners, primary oil distributors
(Motouri) and retail dealers (SS) to make joint efforts
to establish a sound distribution market and to create
new additional services at SS by further upgrading
quality, promoting value-added sales activities and
improving operational efficiency.
Rapid Increase in Numbers of Self-service SS
In April 1998, a manned self-service SS, where a
qualified SS attendant could watch car drivers’ refuel-
ing operations, was introduced. Over 8,000 self-service
SS are in operation. This accounted for about 22% of
the total SS in FY 2010.
In Japan, self-service SS were first developed by for-
eign capital Motouri, with long experience in the USA
and Europe, and by small and medium-sized Motouri
in the early stages of introduction. Other major
domestic capital Motouri actively joined the develop-
ment after 2002. Retail dealers have recently been
highly motivated to develop self-service SS. However,
with increased keen competition among self-service
SS, some of these have closed.
In addition to an increase in non-brands and private
brands, the number of self-service SS are also increas-
ing and there is concern that this may trigger a severe
price war in the future.
Safety Measures at Self-service SS
The number of incidents caused by drivers at self-
service stations is increasing, such as gasoline spills
and refueling with the wrong fuel. PAJ is disseminating 11/710/708/1 09/1 09/7 11/1 12/712/110/108/707/707/106/706/105/705/104/704/103/703/102/702/101/701/100/700/199/799/198/798/197/797/196/796/195/790/1 95/194/794/193/793/192/792/191/790/7 91/10
20
40
60
80
100
120
140
National AverageGasoline Retail Price
(excl. Taxes)
Crude Oil CIF
� Crude Oil CIF and Gasoline Retail Price Trends in Japan
Source: METI
Unit: yen/l
Repeal of "Fuel Import Restriction Law" (Mar 1996)
Repeal of "Petroleum Industry Law" (Dec 2001)

Petroleum Product Distribution and Marketing
33 34
information on how to fill gasoline properly at self-
service SS through posters and the PAJ website.
As refueling is done by drivers at self-service SS, the
petroleum industry is actively taking safety counter-
measures such as strengthening monitoring of refuel-
ing, ensuring good conductivity of refueling nozzles to
prevent static electricity spark-induced fires and install-
ing splash guard units to prevent spills in order to
improve safety at self-service SS.
Increase in New Generation Vehicles
Along with an increase in new generation vehicles
(NGV) such as EV and PHV, the services provided at SS
would be greatly changed from the conventional ones.
Therefore, it would be a challenge for the industry to
develop such infrastructure as solar photovoltaic
power generation and a quick electric charger and to
provide new additional services at SS such as car-shar-
ing, to cope with changes in the business climate sur-
rounding SS.
Issue of SS in Depopulated Areas
With fierce market competition due to declining
petroleum fuel demand, the number of SS has been
decreasing. Consequently, the diminishing number of
SS in the depopulated areas has become an issue of
concern. Due to closures of SS, the areas which face
difficulty in obtaining supplies of fuels such as kero-
sene, an essential commodity in cold regions, and
vehicle fuels for agricultural and forestry vehicles and
machinery have been increasing. This has become a
social problem in such regions.
This situation would bring further serious conse-
quences by not only inconveniencing consumers dur-
ing ordinary times, but also drastically decreasing the
number of open SS during an emergency.
It is important for the petroleum industry to address
this issue with the central and local governments, as
well as community residents, in order to fulfill the
social responsibility for stably supplying petroleum
products.
Responses to Environmental Issues at SS
The petroleum industry’s efforts in regard to environ-
mental issues have focused mainly on refineries; how-
ever, there are many cases in which SS have earnestly
dealt with environmental issues in recent years. Some
examples are the notification of the emission quanti-
ties of harmful chemical substances such as benzene
under the Pollutant Release and Transfer Register
(PRTR) Law enforced from April 2002, and the world’s
first nationwide supply of sulfur-free gasoline and die-
sel fuel (10ppm or less) from January 2005.
Considering the importance of the soil and ground-
water pollution issue at SS, PAJ has created the “SS
Soil Environment Safety Book” for early identification
and prevention of soil pollution at SS.
In addition, in response to the Fire and Disaster Man-
agement Agency’s issuance of a partial revision of the
notification concerning the construction techniques of
synthetic resin plumbing, etc. in August 2009, PAJ pre-
pared its master specifications of the standard con-
struction method for using synthetic resin plumbing
and its fire-resistant connection boxes to be used
underground in March 2010, as a part of the industry’s
efforts towards this pollution prevention issue. PAJ
promotes the dissemination of using such synthetic
resin plumbing in view of its low risk of corrosion in
underground piping.
A partial revision of the fire regulation on the control
of hazardous materials was made in June 2010 to cope
with accidental oil spills from underground tanks
(UGT). With the revised regulation, operators are
obliged to take measures for the prevention of oil leak-
age from single-hull UGT in accordance with the num-
ber of years the UGT has been buried, the design
performance, etc. Though this regulation stipulates a
moratorium until the end of January 2013, the petro-
leum industry is making efforts to assess the reality of
the situation and to advance measures for prevention
of soil pollution.
Living in Harmony with Local Communities (Responses to Large-scale disasters)
From the perspective of corporate social responsibil-
ity (CSR), PAJ aims at living in harmony with local
communities by ensuring as stable as possible a sup-
ply of petroleum products even in the event of a large-
scale disaster.
Petroleum products are considered to be flexible in
supply at the time of disasters like earthquakes,
because they can be delivered to SS and consumers
through various means such as vessels and tank trucks
from nearby refineries or oil storage terminals.
Actually at the time of the Great Hanshin-Awaji
Earthquake in January 1995, nearly 800 SS in the
stricken area suffered no outbreaks of fire and sup-
plied necessary fuels for recovery operations. In other
large-scale earthquakes, the petroleum industry also
makes utmost efforts to supply petroleum products to
SS and consumers smoothly by determining the
extent of the damage at the product shipping facilities
promptly.
In November 2008, PAJ and the Tokyo Metropolitan
Government concluded an agreement on “Stable Sup-
ply of Oil Products in Case of a Large-scale Disaster”,
which stipulates preferential fuel supply to important
public facilities for deploying disaster relief operations
in case of an earthquake with an intensity of lower 6
on the Japanese scale. The first field exercise based on
this agreement was conducted once a year from 2010,
and the industry continues making efforts to improve
the effectiveness.
At the time of the Great East Japan Earthquake in
March 2011, the petroleum industry suffered signifi-
cantly from the earthquake and the subsequent tsuna-
mi. Though many of the oil terminals and refineries
were damaged, the petroleum industry made concert-
ed efforts to continue a stable supply of oil to the
quake-hit areas. From late at night on the day of the
quake, PAJ coordinated with the government to cope
with the emergency supply requests for petroleum
products from the disaster area. Motouri made joint
use of their oil terminals which were not seriously
damaged for their product shipment.
Using lessons learned at the time of this huge earth-
Domestic Production
Primary Distributors(Motouri)
Sub-dealersRetailers
Dealers
TradingHouses
Product Imports
Consumers
Zen-Noh*
* National Federation of Agricultural Cooperative Associations
� Main Distribution Channels of Gasoline
Self-service
Total40,000
50,000
60,000
Total70,000
0
10,000
8,000
6,000
4,000
2,000
20,000
30,000
� Number of Service Stations at the End of Each Fiscal Year (Mar)
56,44458,26359,61559,99060,421
85
55,172
191
53,704
422
52,592
1,353
51,294
2,523
50,067
3,423
48,672
4,104
47,584
4,956
44,057
7,023
42,090
7,774
40,357
8,296
45,792
6,162
2008 2009
37,743
8,596
2011
38,777
8,449
201020072006200520042003200220012000199919981997199619951994
Source: METI, Oil Information Center

Petroleum Product Distribution and Marketing Toward a Fundamental Reexamination of Petroleum-related Taxes9
35 36
Exorbitant Amounts and High Rates of Petroleum-related Taxes
Because oil accounts for about 40% of the primary
energy supply and is the central energy source to
support people’s daily lives and industrial activities,
cost reduction is an important issue from the view-
point of the national economy. Since exorbitant
amounts and high rates of taxes are imposed on
petroleum products in a multiple-layered and multi-
stage way, such tax revenues have reached nearly 4.4
trillion yen per year (FY2012 budget).
Currently, customs duty and various taxes are
imposed on crude oil and petroleum products. Specif-
ically, customs duty is imposed on imported petro-
leum products and petroleum and coal tax (national)
is levied on imported crude oil and petroleum prod-
ucts at the import stage. When refined products are
delivered in the domestic market, the following indi-
rect taxes are imposed:
• Gasoline: Gasoline tax and local road tax (national)
• Diesel Fuel: Diesel fuel transaction tax (local/pre-
fectural)
• Jet Fuel: Aircraft fuel tax (national)
• LPG: Petroleum gas tax (national)
In addition, about 970 billion yen of general con-
sumption tax is also levied on those petroleum prod-
ucts (5% of product sales revenue). Consequently, total
petroleum-related taxes amount to about 5.38 trillion
yen, equivalent to about 50 US dollars per barrel. Such
exorbitant amounts and high rates of tax raised ener-
gy supply costs significantly and had a severe impact
on people’s daily lives and industrial activities.
Unreasonable and Unfair Petroleum-related Taxes
At the time of the introduction of the consumption
taxation in April 1989, the streamlining, including abo-
lition, of existing indirect taxes was carried out and
adjusted with the existing taxes so as not to increase
consumers’ overall tax burden. However, petroleum-
related taxes were neither abolished nor reduced due
quake, in order for the petroleum industry to maintain
its oil supply chain after a large-scale disaster, the
industry has been working on various measures such
as developing an information gathering system at the
time of disaster, installing drum filling facilities for
shipment to the affected areas, and organization of a
cooperative system across the industries in an emer-
gency.
Taking the experiences of responses to urgent
requests at the time of the Great East Japan Earth-
quake into consideration, PAJ is studying develop-
ment of an emergency response system for
information sharing with local prefectural govern-
ments across the country to promptly and flexibly
respond to urgent requests for petroleum product sup-
ply from the disaster-hit areas in an emergency.
For Maintaining and Strengthening Oil Supply Chain
The petroleum industry is a typical equipment-based
industry. Key characteristics of the oil supply chain are
its length and broad range, covering all steps from
acquiring petroleum resources and exploration devel-
opment to importing, refining, distributing and mar-
keting.
However, under such circumstances as the diminish-
ing domestic petroleum product demand in the medi-
um and long term, and the continuous management
rationalization based on market mechanisms, it is get-
ting difficult for the industry to maintain a proper scale
in its supply chain. The issue of declining numbers of
SS in depopulated areas is an example of the fraying
of the front line of marketing in the supply chain.
Additionally, in 2007 when Kashiwazaki Kariwa
Nuclear Power Plant suspended its operations due to
the Chuetsu-oki Earthquake, fuel deliveries to oil-burn-
ing power plants could not be smoothly conducted
due to a lack of sufficient oil product tankers.
The Ministry of Economy, Trade and Industry (METI)
issued its Petroleum Demand Outlook toward 2014 in
March 2010. Assuming its demand trend in this out-
look continues to 2020, the domestic petroleum prod-
uct demand would decrease by 30% versus FY2010
and be almost 50% down from the peak year of 1999.
Consequently, it would be more and more difficult to
maintain the oil supply chain if this declining trend
continues.
At the time of the Great East Japan Earthquake, right
after the supply stoppages of electricity and city gas,
(which are known as so-called “system energy”), oil as
the “distributed energy,” which is easy to deliver and
store, demonstrated its emergency response capabili-
ties. Oil was widely used as fuel for heating at the
evacuation centers, for emergency electrical genera-
tors at hospitals as well as nuclear power plants, and
for emergency and evacuation vehicles. In this way oil
played the role of the “last-resort” energy to ensure
the safety and security of people’s lives.
If the reduction of the oil supply chain continues due
to a decline in domestic demand, the petroleum indus-
try has serious concerns that the industry will not be
able to make such responses as it had done after the
great earthquake if a large-scale disaster occurs in the
future. Considering the importance of a stable energy
supply to end-consumers at the time of a natural
disaster, it is essential to maintain and strengthen the
current level of the supply chain. To that end, ensuring
a “stable scale of oil demand” is an urgent issue for
the petroleum industry.
Taking into consideration the current level of oil
demand by maintaining and promoting its usage
mainly in the heating, hot-water supply and the trans-
portation sectors, as well as the falling population and
energy efficiency improvement in the future, PAJ
assumes that approximately 180 million KL (down by
8% from 2010) of stable oil demand is the minimum
necessary for sustaining the oil supply chain in 2020.
Accordingly, the “Oil Use Reduction Policy” that
aims at diminishing oil demand should be revised at
the time of reexamining the energy policy. The petro-
leum industry continues to play its stable supply role
by asking consumers to use oil during their normal
daily lives. Import Stage Product Stage Consumption Stage
� Multiple & Multi-stage Imposition of Petroleum-related Taxes (FY2012 Budget)
Naphtha
Kerosene
Heavy Fuel
Others
Impo
rted
Oil
Prod
ucts
Co
nsu
mp
tio
n T
ax 5
%
Co
nsu
mer
s
2,040yen/kl
LP Gas Petroleum Gas Tax9,800yen/kl 22 billion yen
Gasoline Gasoline Tax53,800yen/kl 2,890 billion yen
Diesel Fuel Diesel Fuel Transaction Tax32,100yen/kl 890 billion yen
Jet Fuel Aviation Fuel Tax18,000yen/kl 57 billion yen
546 billion yen2.2 billion yen
Total Petroleum-related Tax Approx. 4.41 trillion yen
Total Approx. 5.38 trillion yen (Crude Oil at 50 $/bbl and 80 yen/$)
Consumption Tax970 billion yen
Impo
rted
Crud
e O
il
Petroleumand Coal Tax
Customs Duty

Toward a Fundamental Reexamination of Petroleum-related Taxes
37 38
rate system itself. However after that, the DPJ stated
that the current provisional tax level will continue to
be maintained, with the reason being the prevention
of revenue shortages. As a consequence, the situation
of forcing taxpayers, i.e., automobile users, to bear
the higher tax burden remains.
Considering the following two points, convincing
explanations to automobile users are requested:
(1) Drivers of gasoline and diesel fuel vehicles have to
bear more taxes for general revenue.
(2) There is a gap in the tax burden between urban
areas and rural areas where gasoline and diesel
fuel consumption is large.
Regarding recent automobile fuels, in addition to
CNG vehicles fueled by natural gas, electric vehicles
(EV) are entering their commercialization stage. Fur-
thermore, it is anticipated that fuel cell vehicles using
hydrogen will come into practical use in the future.
However, automobile fuel taxes like gasoline tax and
diesel fuel transaction tax are not imposed on those
fuels/energies for CNG vehicles and EV. This fact com-
pletely ignores any impartiality among fuels/energies
for automobiles. From the viewpoint of sharing a fair
burden of automobile-related social expenses, such
as for road maintenance and improvement, as well as
preventive measures against traffic accidents and
environmental protection, a level playing field in taxa-
tion on fuels/energies should be secured between
CNG and electric vehicles and those of gasoline and
diesel fuel.
The petroleum industry has been paying more than
five trillion yen of taxes each year, while fulfilling its
responsibility for stable supply. In the government’s
deliberation on FY2012 tax reform, the following view
is presented: ”The basic premise for lowering the tax
burden levied on an automobile itself is to ensure a
stable revenue source such as by increasing tax rates
of fuel/energy-related taxes beforehand.” The petro-
to their connection with specific revenue sources for
road construction. The government took unreason-
able and unfair measures by simply adding consump-
tion tax to petroleum product sales prices including
the respective petroleum-related taxes, namely, a tax
on tax. When the 3% rate of consumption tax was
subsequently raised to 5% in 1997, no corrective
actions were taken.
The system of the Specific Revenue Source for
Road Construction such as from gasoline tax was
abolished in April 2009 and those tax revenues have
been incorporated into the general revenue account.
With this abolition, any grounds for argument that
adjustments could not be made for the consumption
tax on the petroleum-related taxes were nullified;
however, specific measures for such adjustments
have not been taken.
The government is aiming at raising the consump-
tion tax to 10% from October 2015 as a part of the
Comprehensive Reform of Social Security and Taxa-
tion System. If it is realized, the portion of the con-
sumption tax levied on gasoline and other petroleum
products, a so-called tax-on-tax treatment, which is
worth 170 billion yen, will double. PAJ continues to
work on the realization of adequate tax adjustment
measures, especially the termination of such a tax-on-
tax treatment, by returning to the basic principle at
the time of launching the consumption tax.
Reducing Tax Burdens and Ensuring Fairness in Taxation of Petroleum-related Taxation
The provisional tax rates on top of the official rates
of gasoline tax and diesel fuel transaction tax had
been raised under the beneficiaries-pay principle to
secure revenues for road maintenance and improve-
ment. By shifting such tax revenue into general reve-
nue in April 2009, there was left no foundation for
imposing provisional taxes. Since the Democratic
Party of Japan (DPJ) became the ruling party by set-
ting forth the abolition of the provisional tax rates of
gasoline, etc., the DPJ abolished the provisional tax
� Ratio of Petroleum-related Taxes in Total National Taxes (FY2012 Budget)
Corporate Tax24.2%
Income Tax29.9%
Liquor Tax 3.0%
Tobacco Consumption Tax 2.4%
AutomobileTonnage Tax 1.6%
GasolineTax 6.4%
Customs Duty on OilPetroleum and Coal TaxPetroleum Gas TaxAviation Fuel Tax1.4%
Stamp Duty 2.3%
Direct Tax57.2%
Indirect Tax42.8%
Total National Revenues45.283 trillion yen
Consumption Tax 23.0%
others 2.8%
Inheritance Tax 3.2%
7.8%Source: Ministry of Finance (MOF)
� Petroleum-related Taxes per Liter of Gasoline (as of Jul 2012)
Petroleum and Coal Tax 2.04 yen
Gasoline Tax 53.8 yen
Net Gasoline Price 77.5 yen
Consumption Tax onNet Gasoline Price 3.9 yen
(Consumption Tax 6.7 yen)
Tax on Tax 2.8 yen
(Example: Gasoline Retail Price at 140 yen/R)
140 yen/R
133.3 yen/R
TotalPetroleum-relatedTaxes
� Current Status of Petroleum-related Taxes and Consumption Tax (FY2012 Estimate)
Consumption Tax Amount from Oil Product Sales
970 billion yen
Consumption Tax on Oil Portion
800 billion yen
Tax-on-Tax Portion
170 billion yen
Sales Amount excluding TaxesApprox. 15.9 trillion yen
Gasoline Tax2,890
billion yen
Petroleumand Coal Tax
546billion yen
Other Taxes24
billion yen
Approx. 3.46 trillion yen
Oil Product Sales Approx. 19.36 trillion yen (Excluding Consumption Tax)
Current Consumption Tax Rate 5%
Diesel FuelTransaction Tax
Approx.890
billion yen
Aviation Fuel TaxApprox.
57billion yen
Petroleum-related Taxes Approx. 4.41 trillion yen

Toward a Fundamental Reexamination of Petroleum-related Taxes
39 40
leum industry, however, is reaching a critical limit to
its taxpaying capacity in line with a decline in domes-
tic petroleum product demand. In the midst of setting
forth the plan of a tax hike by launching global warm-
ing countermeasure tax, it is totally unacceptable to
bear any further tax burden.
Global Warming Countermeasure Tax
The global warming issue is a key issue for all
humanity to be tackled for a long period of time on a
worldwide basis. The petroleum industry in Japan, as
an advanced environmental industry, has been taking
positive actions such as participating in Nippon
Keidanren’s “Action Plans for a Low-Carbon Society”
and launching supply of biomass fuels.
The Government Tax Commission decided the intro-
duction of a new tax concerning global warming
countermeasures, hereafter referred to global warm-
ing countermeasure tax, in its FY2011 Tax Reform
Package compiled in December 2010. However, the
bill was not finalized at the Diet deliberations because
of the divided Diet and the influence of the Great East
Japan Earthquake. The launching of this tax scheme
was specified again in the FY2012 Tax Reform Package
in November 2011.
The tax scheme for FY2012 is basically the same as
the previous year’s one. Specifically, a new scheme is
to add corresponding tax rates to the existing petro-
leum and coal tax in accordance with the amount of
CO2 emissions by setting up a special treatment provi-
sion for imposing a tax for global warming counter-
measures. It was decided that petroleum and coal tax,
currently ¥2,040/KL, will be raised in phases to a final
level of ¥2,800/KL in April 2016.
PAJ had been persistent in its opposition to choos-
ing the easy way to introduce new taxation on global
warming countermeasures from the viewpoint of a
burden on the public. It is necessary to gain public
understanding and consent through broad-ranging
discussion on overall policy measures such as the
specific plans for achieving a greenhouse gas (GHG)
reduction target. It is, however, very regrettable that
global warming countermeasure tax will be imple-
mented without such discussion.
For obtaining understanding and consent of the tax-
payers, i.e., energy consumers, global warming coun-
termeasure tax should be a specific purpose tax
solely for global warming countermeasures. It should
not be prodigally spent tax revenue for forest preser-
vation or local government budgets under the name
of environmental countermeasures.
Petroleum and coal tax is levied on crude oil, con-
sumers cannot recognize their tax burden directly,
and all tax collection and payments are solely the
responsibility of oil companies. The petroleum indus-
try, under complete open competition, is concerned
about a greater burden on oil companies due to glob-
al warming countermeasure tax, because there is a
possibility of not being able to pass this tax on to con-
sumers.
(Apr 2011)18,000
� Trends in Indirect Taxes Imposed on Petroleum Products since the 1973 Oil Crisis Unit: yen/kl
Gasoline Tax (General Term forGasoline Excise Tax and Local Road Tax)
Aviation Fuel Tax
Diesel Fuel Transaction Tax
Petroleum Gas Tax
Petroleum Tax Petroleum and Coal TaxExtraordinary Petroleum Tax
(Jul 1976)43,100
(Apr 2008)28,700
(Apr 2008)15,000
(Oct 2012)2,290
(Apr 1974)34,500
(Jun 1979)53,800
(May 2008)53,800
(Apr 2010)53,800
(Apr 1979)26,000
(Dec 1993)32,100
(May 2008)32,100
(Apr 2010)32,100
28,700
50,000
40,000
30,000
20,000
10,000
0
15,000
(Apr 1976)19,500
(Jan 1970)9,800
(Jun 1979)24,300
10,400(Apr 1974)13,000
(Jun 1978) (3.5%)(Sep 1984)
(Aug 1988)2,040
(Apr 2003)1,020
(4.7%)
1stOil Crisis
2ndOil Crisis
Gulf Crisis
1973 74 75 76 77 78 79 80 81 82 83 84 85 86 87 88 89 90 91 92 93 94 95 96 97 98 99 2000 01 02 03 04 05 06 07 08 09 11 1210
(Apr 1991) (Mar 1992)
0
10
20
30
40
50
60
70
80
Diesel FuelGasolinePianoAutomobileSakeBeerTobacco
Source: PAJ
� Comparison of Tax Burden Rates on Retail Prices among Commodities (as of Jul 2012)
Unit: %
64.5
45.1
28.4
10.94.8
44.8
31.7
Unit: Yen
Crude Oil & Pet. Products
(per KL)
LNG & LPG(per ton)
Coal(per ton)
At Present 2,040 1,080 700
Oct. 1,2012
2,290 1,340 920
Apr. 1,2014
2,540 1,600 1,140
Apr. 1,2016
2,800 1,860 1,370
Notes: Additional tax rates are calculated based on CO2 emission from each fossil fuel
■ Transitional Measures on Petroleum and Coal Tax (Global Warming Countermeasure Tax)

Reinforcement of Corporate Structure10 Reinforcement of Corporate Structure
41 42
Vital Need to Reinforce Corporate Structure
The petroleum industry continues to be requested
to supply environmentally-friendly petroleum prod-
ucts which mitigate global warming as well as meet
environmental regulations in a stable and inexpensive
manner.
Though the petroleum industry faces difficult busi-
ness conditions, it is essential for the industry to deal
with securing stable oil supply and making invest-
ment in facilities as well as in R&D to respond to envi-
ronmental requirements.
To comply with such requests, it is necessary for the
petroleum industry to ensure a fair earnings level and
to make further improvements while reinforcing the
petroleum industry’s business structure.
� Financial Results
The recent earnings structure of the petroleum
industry, however, is in an extremely severe situation,
even in comparison with other industries. Under a
declining trend of domestic petroleum product
demand on a medium and long term basis, the main
factor behind the low performance is thought attribut-
able to the difficulty in passing the higher cost,
beyond a certain level, on to the consumer through
higher product sales prices during the time of rising
crude oil prices. In addition, the record-breaking vio-
lent fluctuation in crude oil prices in 2008, and the
subsequent world recession arising from the global
financial crisis led to a rapid decrease in petroleum
product demand as well as to a destabilization of mar-
ket conditions. However, it is projected that the declin-
ing trend in domestic oil demand will not change in
the medium and long terms even in a period of falling
oil prices. Efforts to ensure earnings have become an
increasingly important issue for the industry.
The recent financial results of the petroleum indus-
try show that the profitability of the petroleum prod-
uct segments is the result of having created a better
environment for ensuring earnings through oil com-
panies’ efforts to improve the supply and demand
environment.
The performance of the oil and gas exploration
development segment is expected to continue firm,
backed by a forecast of continuing high crude oil pric-
es, etc. in the medium and long terms, despite a fac-
tor of profit decline due to the exchange rate impact (a
strong yen).
On the other hand, the profitability of the petro-
chemical segment, which had at times been extreme-
ly good in the past, has worsened, reflecting soaring
material prices and subsequent falling prices, etc. in
the petrochemical market.
As for the earnings of the petroleum product seg-
ment, if an oil company uses the gross average inven-
tory valuation method for its inventory valuation, the
apparent profits or losses are booked as a conse-
quence due to the “inventory valuation impact” by
the fluctuation of crude oil prices.
The “inventory valuation impact” means when
crude oil prices fluctuate, a product’s sales cost at
financial closing is affected depending on the type of
inventory valuation method which is used. During a
period of rising crude oil prices, the inventory valua-
tion gain is generated by the depressed sales cost at
financial closing, because the opening inventory cost
is lower than the inventory acquisition cost during the
term. On the other hand, in a time of falling crude oil
prices, the inventory valuation loss is generated due
to the higher opening inventory cost than the invento-
ry acquisition cost during the term. Such an “invento-
ry valuation impact” creates a large fluctuation in
earnings from the petroleum product segment.
The financial results of each oil company for fiscal
year (FY) 2010 ended in the black for the whole finan-
cial year. This was attributable to such factors as
growth in oil demand due to the economic recovery,
the extreme hot summer and the favorable inventory
valuation impact. For FY2011, it is forecast that the real
operating income will decline, excluding the inventory
valuation impact, of the petroleum product segment
due to a decrease in petroleum product demand
caused by the Great East Japan Earthquake.
Each oil company has been taking various counter-
measures such as exporting petroleum products, rein-
forcing their oil exploration business, and investing in
new businesses to strengthen their management
base. In recent years, various business efforts have
been made, such as the improvement in the supply
and demand situation through reformulating the
wholesale pricing scheme to properly reflect crude oil
price fluctuations and the reduction of excess facili-
ties.
It is essential from now on for each oil company to
properly assess the changes in the business environ-
ment and take further rigorous measures. Though
companies may be forced to reexamine investments
in facilities and R&D which are necessary for business
execution, it is necessary for each company to make
utmost efforts to make a more efficient and stronger
corporate structure by taking careful but even further
thoroughgoing restructuring measures.
-3
-4
-5
-6
-7
-8
-2
-1
0
1
2
3
4
5
OilManufacturingElectricPower
City Gas
30,000
28,000
26,000
24,000
22,000
20,000
18,000
16,000
14,000
12,000
10,000
0-100-200-300
100200300400500
20082007 2009 2010 201120062005200420032002200120001999199819971996199519941993199219911990(FY)
Unit: billion yen� Sales Revenue and Ordinary Income in the Petroleum Industry (All Refineries and Primary Distributors)
Source: PAJ
Sales Revenue
Ordinary Income
288 343 343 370 317
188114 136
�18
246221
536461
166214
62
16,45015,652 15,420
14,118 14,044 13,88615,687
14,780
17,782
26,135
21,352
19,41618,78617,474
15,507
13,259
� Financial Data Comparison between the Petroleum Industry and Other Industries (FY2011)
Unit: %Shareholders' Equity to Total AssetsUnit: %Ratio of Ordinary Profits to Sales
Manufacturing48.4
Electric Power13.9
Oil21.6
City Gas43.6
402375
28,999
40
20,323
521
22,754
680
25,554
�299
28,818
26,164
3.7
▲7.2
4.7
2.7

Thorough Safety Measures11 Thorough Safety Measures
43 44
Appropriate Safety and Disaster-Prevention Measures
The petroleum industry has developed a safety
management system using the latest technology and
provides a strict prevention system to deal with unex-
pected disasters in such operational stages as refin-
ing, storage, transportation and sales. There are two
aspects of these safety measures, the hardware and
software.
On the hardware side, all possible safety measures
are taken into consideration in facility construction,
from a safety review on construction materials in the
design stage to the management of construction
work.
Facility layouts are planned so that safe distances
are kept between the petroleum processing and stor-
age sites and the nearby residential areas, and fire-
breaks are also installed between all facilities. Each
plant facility and storage tank is also designed to with-
stand massive earthquakes.
On the software side, facility maintenance is the
core part of safety management. This includes period-
ic shutdown inspections, on-stream inspections, daily
inspections and special inspections. An emergency
shutdown system is in place and oil and gas leak
detectors have been installed. Patrol teams make con-
tinuous rounds so they can act immediately when
abnormal phenomena are detected, or can extinguish
any fire at an early stage. Also, “In-company Disaster-
prevention Organizations” and “Joint Disaster-pre-
vention Organizations” have been formed. These are
composed to include personnel from large-scale
industrial plants nearby with trained workers on a full-
time basis for prompt action in case of unexpected
fires or oil outflows. In such organizations, chemical
fire engines, elevated water spraying vehicles, foam
liquid carriers, oil skimmers, oil recovery vessels, and
fire-floats are in place and ready to operate.
In terms of safety measures for plant workers, sev-
eral training programs are conducted in each working
unit to elevate workers’ hazard awareness. Experi-
ences of past incidents at refineries are studied collec-
tively to develop incident prevention measures, which
are incorporated in the safety training programs.
From FY2002, information on facility-related incidents
has been shared among industry members so as to
develop proactive measures preventing similar inci-
dents. Preventive actions taken by each oil company
are compiled and shared as common information to
prevent incidents in the petroleum industry as a
whole.
Disaster Prevention against Longer-Cycle Seismic Vibration
In September 2003, a large-scale tank fire broke out
at the time of the Tokachi Offshore Earthquake. This
was caused by longer-cycle seismic vibration that had
not been experienced in the past. To cope with earth-
quakes of such a nature, the Petroleum Complex
Disaster Prevention Law and related regulations were
updated to include anti-earthquake safety measures
for floating roof tanks and fire-fighting tactics in case a
full-scale fire involving such a tank occurs. The petro-
leum industry is proceeding with a plan to reinforce
the “wide-area joint disaster prevention organiza-
tions” by installing mass foam discharging systems,
in cooperation with the national stockpiling facilities,
the petrochemical industry and the electric power
industry. By November 2008, the “wide-area joint
disaster prevention organizations” were established
in 12 nationwide blocks, and the installation of mass
foam discharging systems was completed in May
2009. Furthermore, the framework of mutual assis-
tance among these 12 blocks was established in
March 2010.
Maintenance of Mobile Mutual Support Systems
PAJ set up a policy named “PAJ Mutual Support
Policy for Petroleum Refinery/Facility Disasters”,
assuming a case in which wide-area and extensive
assistance is needed beyond the Designated Disaster-
prevention District specified by the Law on the Pre-
vention of Disasters in Petroleum Industrial
Complexes and Other Petroleum Facilities. An appro-
priate, prompt and mobile support system has been
developed for keeping damage to a minimum level
with this policy. Refineries and oil storage terminals
are thus protected by double and triple safety mea-
sures.
Efforts to Develop New Technological Innovations
Introducing the latest innovative technology is
essential for improving equipment reliability and
disaster prevention capability. As old-fashioned tech-
nical standards not only impede safety improvements
but also require a heavy cost burden, it is an alarming
problem in view of international competitiveness.
PAJ, therefore, plays a leading role in advocating
incorporation of performance standards into the Fire
Defense Law and other safety-related regulations, and
also is working on the introduction of new technolo-
gies for plant facility maintenance and disaster pre-
vention as voluntarily taken safety measures.
1. Introduction of Large-capacity Extinguishing
Foam Cannon System
A large-capacity extinguishing foam cannon sys-
tem was installed at the wide-area joint disaster
prevention organizations to cope with a full-scale
fire involving a large storage tank. A foam cannon
used in this system has a capacity equal to ten con-
ventional foam fire trucks. To operate the system
effectively and efficiently, PAJ conducts regular
education and training.
2. Establishment of Facility Maintenance
Standards
As the existing law stipulates strict criteria for
facility maintenance and repair, even fully usable
equipment sometimes has to be replaced or
repaired by law. PAJ has been addressing the need
for the establishment of private sector voluntary
standards, aiming at legally stipulating equipment
performance standards so as to promote voluntary
safety maintenance.
As part of this activity, PAJ jointly issued the
“Handbook on Evaluation of Appropriate Useful
Life” with the Japan Petrochemical Industry Associ-
ation, and developed a software program to evalu-
ate whether damage detected within a given piece
of equipment’s normal lifespan would affect its
future continued operation. Also jointly with the
Japan Petroleum Institute, PAJ compiled inspection
and maintenance technologies into the “Mainte-
nance Standard for Piping, Static Equipment, Rotat-
ing Machinery, Electrical Installations, Instruments,
and Outside Storage Tanks” to improve the reliabili-
ty of facility maintenance.
3. Introducing New Inspection Technology
Improving inspection technology is extremely
important to maintain facility operations safely.
However, new inspection technologies cannot be
employed based on facility staff’s own judgment
since the inspection methods are specified by the
existing Fire Defense Law and High Pressure Gas
Safety Law. PAJ requests that the Fire and Disaster
Management Agency legislate the performance
standards to avoid such an adverse effect. At the
same time, PAJ is conducting open demonstrations
of new inspection technologies, which are already
accepted in foreign countries, so as to obtain
domestic acceptance of the technology.

Preparation for Major Oil Spill Incidents12 Preparation for Major Oil Spill Incidents
45 46
PAJ Oil Spill Response Stockpiles
PAJ established six domestic and five overseas
bases by the end of March 1996 for stockpiling and
lending oil spill response (OSR) equipment in the
event of a major oil spill incident upon request by the
parties concerned. The domestic Wakkanai sub-base
was added in July 2010 in line with the start-up of
crude loading from Sakhalin II Project site.
In preparation for a spill incident, domestic bases
are located at oil refineries/storage terminals on
24-hour operations in close proximity to the waters
where there is heavy traffic in marine transportation
of oil.
Overseas bases are in the United Arab Emirates
(UAE), Saudi Arabia, Indonesia, Malaysia and Singa-
pore along the major oil routes from Middle Eastern
oil producing countries to Japan.
Cases Involving OSR Equipment Lending
As of April 2011, PAJ had lent out OSR equipment 26
times (13 times for domestic spills) since the estab-
lishment of the first stockpile base in November 1993.
A substantial quantity of large-scale oil booms,
skimmers, temporary storage tanks, etc. were lent out
at the request of ship owners and/or other parties
concerned in such major lending cases as a tanker
stranding incident off Yeochon in the Republic of
Korea in July 1995, a spill incident from a Russian-
flagged tanker in Japanese territorial waters off Shi-
mane Prefecture in January 1997, a tanker collision
incident in the Singapore Strait in October 1997, the
submergence of a large-scale barge in the Arabian
Gulf in January 1998, a tanker stranding incident in
the Singapore Strait in October 2000, and a tanker
collision incident in May 2010. Especially in the inci-
dent of the Russian tanker Nakhodka, PAJ fully con-
tributed to the response activity by continuously
dispatching OSR equipment instructors in coopera-
tion with the storage/maintenance companies of the
domestic bases.
Education & Training
Under this OSR equipment stockpiling program,
because all the equipment, including foreign prod-
ucts, consists of new large-scale and high perfor-
mance devices, it is necessary for concerned parties
to undergo training to familiarize them with the han-
dling of such equipment for quick and smooth
response activities. PAJ not only participates actively
in disaster response drills conducted by local Coast
Guard headquarters or disaster response coopera-
tives in the areas where the domestic stockpile bases
are located, but also conducts periodic training cours-
es in the bases for OSR staff of PAJ member compa-
nies and their subsidiaries nearby to familiarize staff
with the handling of OSR equipment. PAJ also gives
training to the stockpile base staff to train experts to
be on-scene commanders by dispatching them to
overseas institutions specializing in oil spill respons-
es. Joint OSR drills with the staff of the overseas
bases are also held abroad.
Research & Development on Oil Spill Response
PAJ has conducted research and development activ-
ities on OSR for many years. To cite one typical exam-
ple, it started in 1992 to develop a “Diffusion/Drifting
Simulation Model for Spilt Oil (a trajectory model)” so
that the model could be utilized for quick and effective
containment and cleanup work of an oil spill incident.
The model has been upgraded in accuracy and conve-
nience of use since then by expanding the coverage
of sea areas, giving changes with the passage of time,
showing geodesic change, etc. Simulation models are
available at the PAJ OSR website (http://www.pcs.
gr.jp) and are easily downloadable for use on person-
al computers.
Oil Slick Detection Technology Using Satellite Imagery
Satellite monitoring is considered an important
technology for the detection of oil slicks in a spill inci-
dent at sea. In particular, a synthetic aperture radar
(SAR) carried by a satellite is a promising tool
because it works without being influenced by the
weather. However, oil slick detection by SAR data is
not in practical use yet as it is difficult to detect a slick
when the surface of the sea is too rough or too
smooth. PAJ applied a new analytical processing
method for oil slick recognition that uses SAR data,
and has made progress toward technology that would
increase the probability of recognizing a slick even in
such extreme sea conditions.
Hosting of International Oil Spill Conferences
PAJ invites oil spill specialists from Japan and
abroad to its international oil spill conferences held
every year (14 symposia and 2 workshops were held
between 1990 and 2011). The purposes are to
exchange information among participants about
responses to major oil spill incidents, recent move-
ments of international compensation systems, and
technology development regarding oil spills. Since
the disaster in the Gulf of Mexico, several accidents
occurred inland and overseas, such as in the Bohai
Sea and New Zealand offshore. However, the number
of major incidents is graduallly decreasing owing to
the efforts of the parties concerned and international
cooperation. In 2012, PAJ will hold its international
symposium with the main topic of “Preparation for a
Major Oil Spill Incident” to further enhance the prepa-
ration for oil spill incidents based on the experience
learned from the Great East Japan Earthquake in
March 2011. Various parties from the US and the UK
concerned about oil spills are invited to the sympo-
sium.
Makassar Straits
Hormuz Straits
#1 Singapore
Malacca Straits
#2 Saudi Arabia
#4 Abu Dhabi
Oil routes from Middle East to Japan.
#3 Malaysia
#5 IndonesiaLombok Straits
#4 Niigata
#1 Tokyo Bay(Chiba)
#3 Ise Bay
#2 Setouchi
#6 Okinawa
#5 Hokkaido
Wakkanai Branch of#5 Hokkaido
Domestic Bases Overseas Bases
� PAJ Oil Spill Response (OSR) Equipment Stockpiles Japan & Overseas Bases
Overseas Base #4 Abu Dhabi
Domestic Base#1 Tokyo Bay
■ PAJ OSR Equipment Stockpiles (as of Apr 2012) Main Equipment Japan Overseas Total
BoomSolid Large Size
Emergency Use20,000m
1,200m20,000m
1,200m
Inflatable 9,806m 5,500m 15,306m
Skimmer No. of UnitCapacity(kl/h)
734,553
201,615
936,168
Beach Cleaner No. of UnitCapacity(kl/h)
38456
10156
48612
Recovered Oil Storage Oil Bag, Barge No. of UnitCapacity(ton)
271,950
271,950
Portable Tank No. of UnitCapacity(ton)
2221,584
40360
2621,944
■ PAJ’s OSR WebsiteIt includes information on
lending equipment, training,
R&D and international
conferences.
http://www.pcs.gr.jp

Environmental Measures in the Oil Refining Sector13 Environmental Measures in the Oil Refining Sector
47 48
Various Environmental Measures
The Japanese petroleum industry is striving for
cleanliness in refineries with special attention to air
and water quality, noise levels, the volume of industri-
al waste and areas of greenery. The industry is also
dedicated to improving the environmental perfor-
mance of product processing. The completion of the
world’s first lead-free gasoline program and the
implementation of a phased sulfur reduction program
for diesel fuel have been highlights of the industry’s
accomplishments.
The petroleum industry has also implemented envi-
ronmental control systems to carry out appropriate
environmental management in refineries and fuel
storage facilities. One major example is the ISO Envi-
ronmental Management System, which came into
effect in September 1996, and was enacted as the Jap-
anese Industrial Standard in October 1996. Each oil
company was accredited internationally by the adop-
tion of ISO 14001, and maintains a control system for
improving environmental conservation.
Air Pollution Control Measures
Sulfur Oxide Reduction�Measures
To reduce Sulfur Oxides (SOx) emissions from refin-
eries, low-sulfur by-product gas, which is released
from various processing units and low-sulfur fuel oils,
is used as an on-site fuel for furnaces and boilers in
refineries. Furthermore, the flue gas desulfurization
process substantially reduces the SOx contained in
the combustion gas. The process which reduces prod-
ucts’ sulfur content (such as the heavy oil desulfuriza-
tion units and hydrotreating units for kerosene, gas oil
and lubricating oil) generates by-product gas with a
high concentration of hydrogen sulfide. The by-prod-
uct gas is treated in a sulfur recovery unit to collect
sulfur. The remaining sulfur compounds are then pro-
cessed in a tail-gas processing unit.
Nitrogen Oxide Reduction Measures
To lower the amount of Nitrogen Oxides (NOx)
emitted from furnaces and boilers at refineries, the
petroleum industry has improved the combustion
method through low NOx burners and two-step com-
bustion; flue gas denitrification units further reduce
NOx in the combustion gas.
Soot and Dust Reduction Measures
As a refinery makes the best possible use of its by-
product gas released from various processing units as
on-site fuels, the amount of soot and dust emissions
becomes very small. Cyclones and electric dust pre-
cipitators are installed in series in fluidized catalytic
cracker (FCC) units and large boilers to minimize soot
and dust emissions.
Volatile Organic Compounds Reduction Measures
Volatile Organic Compounds (VOC) are known to
change into suspended particulate matter (SPM) or
photochemical oxidants when released into the atmo-
sphere. Fuel storage tanks and their loading facilities
are the main sources of VOC emissions from refiner-
ies. Crude oil and gasoline are stored in tanks with a
sealed-type floating or inner-floating roof to contain
VOC emissions. In addition, hydrocarbon vapor recov-
ery units are installed at fuel loading facilities for rail-
road tankers and tank trucks.
PAJ has been making efforts to control VOC emis-
sions under its Voluntary Action Plan, which set a tar-
get of a 30% reduction in 2010 versus the base year of
2000, and is confirming the results periodically. The
reduction of emissions in FY2010 was 31% versus
FY2000, and the reduction target was achieved.
Countermeasures against Hazardous Air Pollutants
Chemical substances which were in relatively high
concentration in the air and that would be hazardous
to human health were investigated for the purpose of
legally controlling their mission. Consequently, the Air
Pollution Control Law was amended, effective April
1997, to include benzene in the list of hazardous air
pollutants, even though it is only emitted in small
quantities.
Regarding the benzene emission issue, PAJ
announced its “Control Program for Hazardous Air
Pollution Substances” in October 1996. In line with
this program, various measures were taken to reduce
benzene emissions, including the decision to reduce
the benzene content in gasoline to less than 1%. Simi-
larly, measures on the exhaust side were taken to
reduce volatile organic compounds (VOC).
In July 1999, the Law concerning Reporting of
Releases to the Environment of Specific Chemical
Substances and Promoting Improvements in Their
Management (PRTR* Law) was enacted. In compli-
ance with the law, the petroleum industry continues
to monitor the release and transport of quantities of
specified chemical substances.*PRTR: Pollutant Release and Transfer Register
Measures for Water Quality Conservation, Industrial Waste Handling, etc.
Conservation of Water Quality
Though a large quantity of heat-exchanging water is
used at refineries, the water does not come into con-
tact with oils in order to prevent water contamination.
Industrial water is recycled after it is processed with
oil separators to reduce the net quantity of effluents
from the refineries. In the case where seawater is
used for cooling, it is strictly monitored so there is no
chance of polluting the environment. Wastewater
from refining processes is treated first by an oil sepa-
rator to recover oil contents, then goes through an
advanced treatment method using chemical coagu-
lants, activated sludge and activated charcoal. Then it
is collected in a guard basin, a pond located near the
final discharge point, where remaining contaminants
can settle out to ensure the water’s cleanliness before
its release from refinery sites.
Noise Reduction
Oil moving equipment at production, shipment and
power utility sites produces a certain amount of noise.
Each refining company makes every effort to mini-
mize such noise; locating storage tanks effectively so
as to serve as a sound barrier, utilizing low noise
burners, and installing sound absorbers and sound-
proof walls around noise sources are some of the
countermeasures being employed.
Industrial Waste
Various types of industrial waste are produced at
refineries, namely waste oils, sludge, spent acid and
alkali, and dust captured by electrostatic collectors. To
minimize industrial waste disposal volumes, each oil
company reprocesses waste oils, uses sludge and
dust as raw materials for cement production, and pro-
duces caustic soda from spent alkali to minimize
industrial waste volumes. The reduction in industrial
waste was 3,000 tons in FY2010, a 97.3% reduction
versus the FY1990 level.
Measures to Increase Areas of Greenery
Oil companies maintain refinery sites and their
vicinity with as much greenery as possible. About 10%
of a refinery’s lot area is allocated for greenery where
lawns and trees are planted. The ratio of areas of
greenery to the total site area is significantly higher
than that of other industry sectors.

Environmental Measures in the Oil Refining Sector
Quality Improvement in Automotive Fuels14
49 50
Efforts toward Fuel Quality Improvements
Improvement in Gasoline and Diesel Fuel Quality
The rapid increase in the number of motor vehicles
in Japan, which started in the early 1970s, created
serious air pollution problems, including lead emis-
sions, especially in urban areas. To cope with this
national concern, the Japanese petroleum industry
initiated a program for the first time in the world to
eliminate tetra-alkyl-lead blending with gasoline. The
phased lead elimination program was completed in
February 1975 for regular grade and in December
1986 for premium grade.
In the 1990s and after, the petroleum industry
focused on sulfur reduction programs for both gaso-
line and diesel fuel in line with the development of
more sophisticated exhaust gas aftertreatment sys-
tems. The petroleum industry launched sulfur-free (10
ppm or less) gasoline and diesel fuel from January
2005 on a voluntary basis.
Complying with a new standard for the emission of
hazardous organic compounds, the petroleum indus-
try reduced the content of benzene in gasoline to 1%
or less from January 2000.
Airborne hydrocarbons are considered to be one of
the main causes of photochemical smog in summer.
To reduce hydrocarbon emissions from gasoline in
the atmosphere, the petroleum industry voluntarily
lowered the maximum vapor pressure standard for
summer season gasoline from 2001, and reduced it to
65 kPa in 2005.
Low Sulfur Kerosene
Kerosene for heating use in Japan has the world’s
highest standard for reduced sulfur content, a maxi-
mum of 80 ppm, to assure cleaner and safer indoor
combustion.
Fuel Quality Control Law
With the start of import liberalization of petroleum
products effective April 1996, the Act on the Quality
Control of Gasoline and Other Fuels (Fuel Quality
Control Act) was enacted, replacing the Gasoline
Retail Business Law, to maintain the world’s highest
level of gasoline, kerosene and diesel fuel quality. The
new law specified the existing quality standards as
compulsory ones from both environmental and safety
viewpoints. The law also introduced the display of a
Standard Quality (SQ) certificate at service stations for
fuels satisfying the standard quality requirements.
At first, the compulsory standards were specified on
8 items for gasoline quality, and on 3 items for both
2008 2009 2010 20112007200620052000199519901985198019751973(FY)
� Environmental Regulations and Petroleum Industry Facility Investment
Unit: 1,000 b/d( ): number of facility units
Unit: billion yen
� Heavy Oil Desulfurizaiton Capacity Trends (end of Mar each year)
Source: PAJ
Source: PAJ
DirectDesulfurization
Unit
CapitalInvestment
Environmental Measures
IndirectDesulfurization
Unit
1970 1980 1990 2000
Heavy Oil Desulfurization ±550
Unleaded Gasoline ±300
Low-Sulfur Diesel Fuel±200
Further Reduction in Sulfur Contentof Gasoline and Diesel Fuel
±300 (Estimate)
Lower Benzene±140
Court Decision on Yokkaichi Pollution Lawsuit
(1967-1972)
Automobile Emission Control(1978)
Ultra Low-sulfur (50 ppm) Diesel Fuel (End-2004)
Ultra Low-sulfur (50 ppm) Gasoline (End-2004)
Long-term Emission Gas Control
(2005 for Gasoline and Diesel Fuel)
Sulfur-free (10 ppm) Diesel Fuel (2007)
Sulfur-free (10 ppm) Gasoline (2008)
Diesel Vehicle Emission Control-Short-term (1993)
-Long-term(1997-99)
Establishment of the Agency of Environment
(1971)
Setup of Benzene Environmental Standard
(1996-2000)
1,509(43) 1,451
(40)
862(29)
1,200(37)
1,441(44) 1,387
(41)
1,267(40)
194(5)
289(7)
459(12) 459
(12)415(12)
616(16)
668(24)
911(30)
982(32)
928(29)
852(28)
893(27)
550(14)
901(26)
1,460(40)
550(14)
910(26)
1,460(40)
550(14)
910(26)
1,449(39)
550(14)
899(25)
1,448(40)
548(14)
900(26)
1,447(40)
548(14)
899(26)
1,447(40)
548(14)
899(26)
1,358(40)
500(14)
858(26)
*2 This specification is applicable to diesel fuels without international blending of FAME (Fatty Acid Methyl Ester) Compulsory standards allow FAME upper blending limit of 5.0 mass%. In such a case, additional standards include
• Methanol : 0.01 mass% max. • Acid value : 0.13 mgKOH/g max. • Formic acid + Acetic acid + Propionic acid : 0.003 mass% max. • Acid stability : 0.12 mgKOH/g max.
*1 For an automobile that received registration by the Road Vehicle Act or its vehicle number is specified by law as a vehicle compatible with E10, gasoline specifications for both oxygen and ethanol are relaxed to 3.7 mass% and 10 vol% max, respectively.
� The Fuel Quality Control Law – Compulsory Standard (as of Apr 2012)
Gasoline
Item
Lead
Sulfur content
MTBE
Benzene
Kerosene
Methanol
Washed gum
Color
Oxygen content*1
Ethanol*1
Diesel Fuel Kerosene
Specification
Non-detectable
0.001 mass% max.
7 vol% max.
1 vol% max.
4 vol% max.
Non-detectable
5 mg/100 ml max.
Orange
1.3 mass% max.
3.0 vol% max.
Item
Cetane index
Sulfur content
Distillation, T90%
Triglyceride
FAME*2
Specification
45 min.
0.001 mass% max.
360˚C max.
0.01 mass% max.
0.1 mass% max.
Item
Sulfur content
Flash point
Color, Saybolt
Specification
0.008 mass% max.
40˚C min.
+25 min.

Quality Improvement in Automotive Fuels
51 52
diesel fuel and kerosene quality. The Fuel Quality Con-
trol Act has been amended since then to reflect the
national concern regarding further quality improve-
ment.
Through the progress of deregulation, alcohol-
blended automotive fuel was introduced onto the
market by product importers. The quality and perfor-
mance of the alcohol-blended fuel were not covered
by the scope of the Fuel Quality Control Act. Conse-
quently, several fires involving vehicles using the
alcohol-blended fuel were reported. To ensure con-
sumers’ safety, METI banned the sale of such alcohol-
blended fuel effective August 2003 and amended the
Fuel Quality Control Act to include the upper limit of
alcohol-to-gasoline blending as a maximum of 3% of
volume for ethanol and 1.3 % in weight for oxygenate.
In view of verification work on biofuels recently con-
ducted in various places, effective March 2007, man-
datory standards for FAME (Fatty Acid Methyl Ester),
Tri-glyceride and four other materials were added to
diesel fuel quality requirements in order to allow
blending of bio-diesel components in diesel fuel. The
additional requirements include an upper limit for
blending in diesel fuel. In February 2009, a registra-
tion system and quality assurance system was estab-
lished for newcomers in the business for blending
ethanol and equivalent products in gasoline.
Accordingly, the Fuel Quality Control Law should be
revised as necessary from now on to properly assure
fuel quality in line with METI’s plan.
Sulfur-free Gasoline and Diesel Fuel
Deterioration in air quality caused by diesel emis-
sions, namely nitrogen oxides (NOx), soot and dust
particulate matter (PM), had become a national con-
cern in the 1980s. In 1989, short- and long-term emis-
sion standards were established to reduce NOx and
PM emissions from diesel engine buses and trucks. To
achieve this diesel engine emission standard, engine
manufacturers were required to install advanced
exhaust gas aftertreatment systems (EGR: Exhaust
Gas Recirculation and Oxidation Catalyst).
The petroleum industry cooperated with the engine
manufacturers to achieve the emission standard
smoothly by reducing the fuel sulfur content of diesel
fuel from 5,000 ppm to 2,000 ppm in 1992 and further
to 500 ppm in October 1997. Over this period, oil refin-
ers invested 200 billion yen to install new facilities for
high-performance gasoil desulfurization.
In response to ongoing national concerns with PM
emissions, the existing long-range diesel emission
standard was revised to move forward the implemen-
tation year from 2007 to 2005. The target emission
level was achievable only with the installation of after-
treatment devices, such as a diesel particulate filter
(DPF), together with the reduction of diesel sulfur con-
tent. In this way, the requirement for diesel sulfur was
lowered to 50 ppm or less by the end of 2004.
In the meantime, the Tokyo Metropolitan Govern-
ment (TMG) started its own campaign named “Opera-
tion No Diesel Vehicle” from August 1999, banning
high emission diesel vehicles from entering the met-
ropolitan area. TMG mandated the installation of DPF
on existing diesel vehicles effective October 2003,
ahead of the national target in 2005, and urged vehi-
cle manufacturers to implement early introduction of
new DPF-equipped diesel vehicles.
In view of the urgent need for reduction of diesel
emissions accelerated by the scheduled TMG regula-
tion, the petroleum industry announced its partial
supply of low sulfur (50 ppm max.) diesel fuel from
October 2003 to meet the TGM regulation. Since then,
several local governments, i.e., Osaka and Aichi, as
well as large commercial diesel fuel users such as the
bus and truck industries, requested an earlier intro-
duction of low sulfur diesel fuel.
TMG also urged the introduction of a nationwide
supply of low sulfur diesel fuel prior to the implemen-
tation of the local Tokyo regulation so that all DPF-
equipped diesel vehicles could enter and drive
through the metropolitan area. The petroleum indus-
try moved forward the facility investment schedule for
earlier production of low sulfur diesel fuel, and started
supplying 50 ppm diesel fuel voluntarily from April
2003, 21 months earlier than the enforcement dead-
line of government regulations.
Needs for further reduction of fuel sulfur content to
sulfur-free (10 ppm or less) were already reported on
several occasions. In January 2002, TMG drew up its
Basic Environment Plan in which sulfur content for
both gasoline and diesel fuel was requested to be 10
ppm or less by 2008. In June 2003, the Petroleum
Council Subcommittee referred to the appropriate
timing for introduction of sulfur-free gasoline as 2008
and sulfur-free diesel fuel as 2007.
Availability of sulfur-free fuel is a prerequisite for
developing technologies for exhaust emission after-
treatment to meet more stringent emission standards
for both gasoline and diesel fuel engines, and at the
same time for improving the fuel economy of these
engines. The introduction of sulfur-free fuels would
contribute significantly to a clean environment by
reducing vehicle emissions and to mitigating global
warming by reducing CO2 production
The petroleum industry has invested 300 billion yen
of capital resources in developing cleaner fuel produc-
tion technologies, and on construction and modifica-
tion of desulfurization facilities to ensure the
production of sulfur-free fuels. As a result, the industry
announced in September 2003 that the world’s first
supply of sulfur-free gasoline and diesel fuels would
start from January 2005 in all areas of Japan.
■ Sign of Sulfur-free Gasoline
0
100
10
50
20092008200720062005200420032002200120000
10
50
300
400
500
2009200820072006200520042003200220012000
� Current Status for Sulfur Content in Gasoline
� Current Status for Sulfur Content in Diesel Fuels
Governmental Regulation
Unit: ppmUnit: ppm
Petroleum Industry's Voluntary Measures
50ppm
10ppm
50ppm50ppm
500ppm100ppm
10ppm
Governmental Regulation
Petroleum Industry's Voluntary Measures
3 Years in Advance
21 Months in Advance
2 Years in Advance
Start of Nationwide Supply Start of Nationwide Supply

The Global Warming Issue and Oil15 The Global Warming Issue and Oil
53 54
Global Trends Regarding the Climate Change Issue
The Kyoto Protocol stipulates a concrete approach
to the United Nations Framework Convention on Cli-
mate Change (UNFCCC) aiming at stabilizing the con-
centration of atmospheric greenhouse gas (GHG) and
at maintaining the current climate ever afterwards.
The protocol sets legally binding numerical targets for
GHG emission reduction for 2008-12 versus 1990 in
industrialized countries (a 6% reduction for Japan).
However, the U.S. decided to withdraw from the
Kyoto Protocol in 2001, and no emission reduction
obligation is stipulated for developing countries,
including countries with massive emissions like
China. Therefore, the coverage of reduction obliga-
tions is in decline, and its overall effect on the Proto-
col-based GHG reduction is said to be questionable
on a global basis.
The 17th Conference of the Parties (COP17) held at
the end of 2011 attracted a great deal of attention as
the session was held to establish a new global GHG
reduction framework for after 2013 when the first
commitment period of the Kyoto Protocol terminates.
Agreements adopted at the session include: aEstab-
lishing a second commitment period of the Kyoto Pro-
tocol until 2017 or 2020, bDeveloping a new legally
binding framework applicable to all the major emit-
ting countries no later than 2015 so as to be effective
2020, and cStriving for the steady implementation of
major countries’ GHG reduction targets in the COP16
Cancun Agreements.
As the Kyoto Protocol covers only a quarter of glob-
al emission levels, Japan, together with Russia and
Canada, stated that they have no intention to partici-
pate in the second commitment period. This was
reflected in the COP outcome document.
Domestic Trends Regarding the Climate Change Issue
Trends of CO2 Emission
A flash report on FY2010 GHG emissions shows a
10.3% decrease versus the 1990 level. Although a 4.4%
increase was recorded versus FY2009 due to the
recovery from an economic downturn and relatively
hot summer followed by a cold winter, favorable for-
est-sink measures and Kyoto mechanism credits more
than offset such an increase. The Kyoto Protocol
reduction target of 6% versus the 1990 level was
exceeded for three consecutive years from FY2008.
The industrial sector achieved a reduction of more
than 10% versus the FY1990 level, However, the busi-
ness/other sector as well as the household sector
increased more than 30% versus the same period.
Industry’s Movement toward Post-Kyoto Protocol
Prior to adopting the Kyoto Protocol, each type of
Japanese business and enterprise set its own GHG
reduction target, with the coordination of Keidanren
(the Japan Business Federation). These targets were
incorporated in ” Keidanren’s Voluntary Action Plan”,
and Japanese industry is striving to cope with the
global warming issue as a social commitment. The
industry‘s proactive measures are accredited in the
government’s “Kyoto Protocol Target Achievement
Plan” as a central role of domestic measures until the
end of FY2012.
Based on the experience of the voluntary action
plan, Japanese industry, including the petroleum
industry, prepared a “Low–Carbon Society Action
Plan” in December 2009 to succeed Keidanren’s ongo-
ing Action Plan, and announced to promote the policy
of achieving a low-carbon society that harmonized the
environment with the economy.
The petroleum industry agreed to this outline and
prepared “Petroleum Industry’s Action Plan for Low-
Carbon Society” with a main focus on energy conser-
vation at oil refineries.
0
50
100
150
200
250
300
350
400
450
500
201006 08040200989694921990(FY)
Countries obliged to reduce emissions by Kyoto Protocol
Countries not obliged to reduce emissions by not ratifying Kyoto Protocol
Countries not obliged to reduce emissions by Kyoto Protocol
� Trends in Japan’s CO2 Emissions of Energy Origin by Sector
Source: Ministry of Environment (MOE)
Industrial Sector
Transportation Sector
Emission
Commercial Sector
Household Sector
482
217
164
127
Unit: million ton CO2
421(From base year -12.7%)
232(From base year+6.8%)
217(From base year+31.9%)
173(From base year+35.5%)
Energy Conversion Sector6880.1
(From base year+18.0%)
FlashReport( )
� CO2 Emissions of Energy Origin by Country
Source: IEA CO2 Emissions from Fuel Combustion 2011
2009CO2 Emissions
29.0 billion tons
Republicof Korea
2%
Kyoto Protocol covers only 30% of the world CO2 emissions
Countries obliged to participate omit ‘d’ in the2nd commitment periodcover about 15%
China24%
USA18%
others7%
Japan4%
Russia5%
others25%
India5%
Canada 2%Australia 1%
Germany 3%UK 2%Italy 1%France 1%
n COP 16 Cancun Accord – 2020 Targets
China US EU Japan
ReductionTarget *1
-40~-45%vs 2005
-17%vs 2005
-20~-30%vs 1990
-25%vs 1990
vs 1990 327~366% *2 -3% -20~-30% -25%
*1 Each country’s target assumes enactment of domestic laws and other countries’ reduction level.
*2 8% annual growth set in the 11th five-year plan is assumed.
n Marginal Cost of 2020 Target by Country
*3 Note: -45% vs 2005 for China, and -30% vs 1990 for EU
Source: Research Institute of Innovative Technology for the Earth
0
100
200
300
400
500
$3$60
$135 *3
*3
JapanEUUSChina
$476
$/t CO2

The Global Warming Issue and Oil
55 56
many oil refineries are awarded for their excellence.
The petroleum industry is actively utilizing the ener-
gy conservation project conducted by New Energy
and Industrial Technology Development Organization
(NEDO), and introducing advanced energy conserva-
tion technology to refineries.
In addition, many refineries are participating in
“Kombinat (Refining and Petrochemical Complex)
Renaissance Program” which is aimed at advanced
integral management of nearby factories in a Kombi-
nat group, and working on the overall reduction of
energy consumption as a joint project, not only by
reducing direct energy consumption but also by pro-
moting procurement of raw materials, utilization of
by-products and efficient process management.
As a result of these efforts, Japanese refineries have
a world-leading level of energy efficiency.
Sulfur-free Automotive Fuels as a CO2
Countermeasure
Using sulfur-free gasoline and diesel fuel (sulfur
content of less than 10ppm) contributes to the reduc-
tion of nitrogen oxides (NOx) and particulate matter
(PM), and also contributes to CO2 reduction due to
fuel efficiency improvement. This is expected to be a
useful global warming countermeasure. The petro-
leum industry launched the nationwide supply of sul-
fur-free fuels in January 2005 well in advance of
government regulation.
Promotion of Technology Development and
International Cooperation
Technological breakthroughs are essential for global
warming countermeasures. Each PAJ member com-
pany advances the development of emerging technol-
ogies like environmentally-friendly fuel cells and
hydrogen refueling service stations. The oil compa-
nies also promote international technical cooperation
for GHG reduction on a global basis and participate in
overseas projects. In particular, regarding the United
Nation’s Clean Development Mechanism (CDM), six
projects by four oil companies (PAJ members) were
recognized by the Japanese government.
Shifting to Diesel Vehicles (Diesel Shift)
Diesel engine vehicles are considered a more effec-
tive countermeasure to global warming than gasoline
vehicles as they have better fuel efficiency and conse-
Petroleum Industry’s Efforts
Being a frontrunner in taking environmental mea-
sures as “an advanced environmental industry”, the
Japanese petroleum industry has been making posi-
tive efforts to address global warming through meth-
ods such as launching sulfur-free automotive fuels in
2005. With a focus on the steady implementation of
the Nippon Keidanren’s Voluntary Action Plan, each
PAJ member company has been implementing fur-
ther energy conservation in its own business opera-
tions and making an active contribution to reducing
GHG emissions in its transportation and operations
units where petroleum products are consumed.
Petroleum Industry’s Voluntary Action Plan for
Global Environmental Conservation
PAJ formulated the “Voluntary Action Plan for Glob-
al Environmental Conservation by the Petroleum
Industry” in February 1997 to respond to Nippon
Keidanren’s initiative, and set a target to be achieved
by FY2012 for the improvement of unit energy con-
sumption at oil refineries. Especially the unit energy
consumption at oil refineries in FY2010 was improved
by 16% from FY1990 through the use of sophisticated
heat recovery units and efficiency improvement and
optimization of refining facilities. In October 2007, the
petroleum industry’s target was revised upward to a
13% improvement from FY1990, incorporating prog-
ress in energy conservation and considering the pro-
jected decrease in oil demand in the future.
Refineries’ Energy Conservation Measures
Energy conservation at refineries consists of a wide
range of measures which include (1) sophisticated
operation control through innovative technology for
process control and optimal operation, (2) expanding
common use of heat among facilities and adding
waste heat recovery units, (3) operating facility main-
tenance efficiently, and (4) adopting high-efficiency
facilities and catalysts. These measures are being
evaluated at the “National Excellent Energy Conserva-
tion Examples Convention (until FY2008)” and “Ener-
gy Saving Grand Prix (organization category)” carried
out by the Energy Conservation Center of Japan, and
■ Energy Saving Technologies Included in NEDO’s Support Projects on Energy Use Utilization
Energy Saving Technologies Introduced
1 Introduce variable-speed gas compressor
2Recover waste-heat from steam-traps by capturing effluent steam
3Reduce furnace fuel consumption by replacing regular trays with high efficiency trays
4 Install desuperheater to recover steam
5 Install waste-heat boiler
6Install propylene fractionation process unit of high energy-efficiency type incorporating industrial heat-pump system
■ Energy Saving Projects at Refineries
Energy Saving Measures
Refiningplants
Thorough insulation of tower, tank and piping
Installation, cleaning and replacement of furnace air-preheater, and installation of waste heat boiler
Installation of various heat-exchangers
Flare gas recovery
Reducing furnace air flow rate
Common use of heat among processing units
Installation of process turbine (recovery of pressure energy)
Optimizing pump capacity (cut impellers)
Promoting computer control
Reviewing control limit of operation
Utilityplants
Repair and replacement of furnace wall and insulation material
Installation, cleaning and replacement of air- preheater
Installation of preheater for boiler feed water
High efficiency steam tubine for power generation
Optimizing pump capacity (cut impellers)
Promoting computer control
Reviewing control limit of operation
120
115
110
105
100
95
90
Japan
HighEfficiency
AsianCountries
(Note 2)
Western Europe
(15 Countries)
US andCanada
100 101103
113
↓
� Comparison of Energy Consumption Index (Note 1)
to Produce 1 KL of Petroleum Product (FY2004 Actual)
Prepared based on the result of the survey by Solomon Associates (SA) (Note)1 SA's original index using equivalent throughput, and this has similar characteristics to the unit energy consumption used in the industry’s voluntary action plan2 Including Korea, Singapore, Malaysia and Thailand and excluding China
0%
5%
10%
1990 1997 1998 1999 2000 2001 2002 2003 2004 2005 2006 2007 2008 2009 2010
15%
20%
Fiscal Year
Target: 13% Improvement
FY201016% Improvement
� Results of Refinery Energy Conservation since 1990 (Change in unit energy conservation)
Unit EnergyConsumptionImprovement vs. 1990

The Global Warming Issue and Oil
57 58
quently generate less CO2. In Europe, about 50% of
newly registered passenger vehicles have diesel pow-
ered engines which have been technically improved
since the late 1990s for better driving performance
and less exhaust emissions. On the other hand, 0.1%
of passenger vehicles sold in Japan are diesel pow-
ered. The lack of popularity of diesel vehicles is due to
Japan’s more stringent NOX emission regulations
compared with European standards, together with the
negative image connected to the noise and vibration
of diesel trucks. Although recent technological devel-
opments enabled us to sweep away all of these con-
cerns, customers’ acceptance still remains at a low
level.
Under these circumstances, METI organized a study
group to forecast the viability of clean diesel fuel for
passenger vehicles. The group concluded in the
report, issued in April 2005, that the promotion of die-
sel passenger vehicles (shifting to diesel vehicles) is
an effective means of reducing CO2 generation in the
transportation and industrial sectors. Some of the
advantages are as follows:
1. A 10% increase in the number of diesel vehicles
would reduce CO2 generation by 2 million tons a
year in the transportation sector.
2. A 10% shift in production volume from gasoline to
diesel fuel (4 million KL a year) would lead to a 1.7
million ton CO2 reduction in the oil refining sector.
Moreover, the Kyoto Protocol Target Achievement
Plan approved in April 2005 stated that “when a clean
diesel passenger vehicle that has exhaust emission
quality not inferior to that of a gasoline vehicle is
developed, the promotion of such a diesel vehicle
shall be examined accordingly”.
Further to this, METI’s Basic Energy Plan, revised in
February 2007, clearly stated that “Diesel Shift” should
be one of the energy conservation and CO2 reduction
measures in the transportation sector. Meanwhile,
METI released a report called the “Next-Generation
Vehicle and Fuel Initiative” in May. The report com-
piled measures to implement the initiative, such as a
need for early introduction of clean diesel vehicles
which meet the latest emission standards in view of
global warming and energy security issues as well as
international competitiveness.
The petroleum industry has invested about 300 bil-
lion yen of capital resources and started the world’s
first supply of sulfur-free diesel fuel in all areas of
Japan in January 2005 with an expectation of expand-
ing demand for clean diesel vehicles with improved
fuel efficiency. In recent years, clean diesel vehicles
are being reevaluated in terms of both air pollution
abatement and global warming view-
points by many parties concerned,
and its policy positioning has been
significantly changed from that in the
past.
To achieve the realization of the
“Next-Generation Vehicle and Fuel
Initiative”, national and local govern-
ments together with automobile and
petroleum industries set up the
“Clean Diesel Study Group” in Janu-
ary 2008 to discuss promotion plans
to expand the utilization of clean die-
sel vehicles. Such issues as dissemi-
nation of clean diesel vehicles, image enhancement,
cost reduction, and the outlook for diesel technology
development were deliberated at the meetings, and
two reports, entitled “Clean Diesel Promotion Strate-
gy” and “Clean Diesel Promotion Policy (Detailed
Strategy Version)”, were compiled in June 2008. The
reports reconfirm the significance of launching clean
diesel vehicles which contribute to CO2 emission
reduction in the transportation sector. In addition,
image enhancement strategies and tax incentives
were taken. As a promotional measure for diesel vehi-
cles, image improvement events like exhibitions and
test-ride events were conducted at the G8 Hokkaido
Toyako Summit in July 2008. This is because Hokkai-
do has the regional distinction of having a high diesel
vehicle ownership ratio and of having many active
environmental industries.
Clean diesel vehicles, together with hybrid and elec-
tric ones are regarded as key players in the environ-
mentally friendly vehicle market in the short and
medium term. Therefore, market creation and wide-
spread utilization of clean diesel vehicles are emerg-
ing issues. The petroleum industry looks forward to
significantly expanding the clean diesel vehicle mar-
ket based on the above strategy, and will continue col-
laborating with the central and local governments as
well as the automobile industry.
■ Petroleum Industry’s Commitment to a Low-Carbon Society - Coexistence of Stable Supply and Global Warming Countermeasure through Sophisticated Use of Oil -
Manufacturing Stage of Petroleum Products (Refinery)wMaintain and improve the world's highest level of energy
efficiency by the introduction of state-of-the-art technology and cooperation with nearby factories, considering the demands of various countries and regions.
wAim to achieve energy saving of 530 thousand KL *1,2,3 (crude oil equivalent) per year on an accumulated average from FY2010 to FY2020
*1 Utilizesthemid/long-termplanoftheActontheRationalUseofEnergytosumupenergysavingeffects(onlyforthefirstyear).
*2 Includesmeasuresforwhichgovernmentsupportisnecessary.Whenalargefluctuationindemandandstringentqualityrequirementsareidentified,thetargetissubjecttoreexamination.
*3 Correspondstoapprox.1.4milliontonsofCO2peryear
Transportation and Supply Stage of Petroleum ProductswFurther efficiency improvement in distribution system (joint
use of storage points, mutual accommodation of products, etc.)
wLED lighting at service stations, solar power generation, etc.
Development of Innovative Technologies (2030 - 2050)
wHeavy oil cracking using supercritical waterwMembrane separation and adsorption of hydrocarbonswCarbon dioxide capture and storage (CCS)
International CooperationwUse the knowledge and the experience of the petroleum
industry that achieves the world’s highest level of energy efficiency for personal and technical exchanges with developing countries
The petroleum industry actively contributes to global environmental conservation, the formation of a recycling society and sustainable economic development of society. With these as basic principles, the industry aims to pursue the formation of a low-carbon society and simultaneous achievement of the “3E” policy (energy security, environmental concern and efficient supply).
Basic Policy
Consumption Stage of OilaRenewable Energy (Biomass Fuel)wIntroduce biomass fuel for which stable and economical
procurement is possible as the effect on greenhouse gas reduction using LCA, competition with food, supply stability, and ecosystem consideration are being verified.
wPromote the use of ETBE blended biomass fuel while ensuring sustainability and stable supply in cooperation with the government, aiming at a steady introduction to meet the target amount of 500 thousand KL *4 (crude oil equivalent) in FY2017 set by the Law Concerning Sophisticated Methods of Energy Supply Structures.
*4 Approximately1.3milliontonsofCO2/year
bClean Diesel Powered Vehicle
cPromoting High-Efficiency Water Heater (“Eco-Feel”)
dOil-Based Fuel CellwExpand the promotion of oil-based fuel cells for which the
existing distribution network can be used (supply of hydrogen from kerosene and LPG)
Specific Approach to FY2020
19900
5
10
15
20
25
30
35
40
45
50
91 92 93 94 95 96 97 98 99 2000 01 02 03 04
� Sales Share of Diesel Passenger Vehicles in Europe and Japan
Europe
Japan
Source: Annual Report of World Automobile Statistics
Unit: %

Utilization of Biomass Fuel16 Utilization of Biomass Fuel
59 60
Sales of Bio-Gasoline (Biotechnology Gasoline)
Biomass fuels can be produced from renewable
materials such as agricultural crops and trees, and
they are considered to be “carbon neutral” in terms of
carbon emissions. Thus, many environmentally con-
scious countries are showing great interest in bio-
mass fuels. In the Kyoto Protocol Target Achievement
Plan of April 2005, the government specified the use
of 500,000KL (crude oil equivalent) of biomass fuels
for transportation use.
In January 2006, based on the request of the Agen-
cy of Natural Resources and Energy, the petroleum
industry announced a target plan to blend bio-ETBE
(ethyl-tertiary-butyl-ether) produced from 360,000KL
of bio-ethanol (210,000KL of crude oil equivalent) in
FY2010 aiming to cooperate in the achievement of the
government plan.
With a basic policy of “Priority for Consumers”,
“Safety, Security and Fairness”, and “Domestic Pro-
duction and Consumption”as an accountable fuel
supplier,, the petroleum industry is steadily striving to
meet the whole quantity of the targeted amount set
forth by the Law Concerning Sophisticated Methods
of Energy Supply Structures. In January 2007, the
member companies of PAJ established a limited lia-
bility partnership company (LLP) to jointly procure
bio-ETBE and related products. In FY2007, the sale of
bio-ETBE blended gasoline was launched at 50 service
stations in the Kanto area and it was expanded in
FY2008 to 100 sites including such areas as Osaka and
Miyagi. This received high acclaim from consumers,
municipal governments and business owners due to
its strong environmental considerations. The test mar-
keting of bio-gasoline (the government subsidized
project) was completed at the end of FY2008. The
member companies of PAJ introduced 200,000KL of
bio-ETBE blended gasoline in FY2009 to the market
prior to the nationwide sales plan of 840,000KL
(210,000KL of crude equivalent target volume) in
FY2010.
For proper dissemination of bio-ETBE gasoline, PAJ
issued display guidelines, such as posting of the bio-
ETBE blending ratio. This provides the handling of the
name and the logo of “Bio-Gasoline” when bio-ETBE
blended gasoline is sold in the service stations of PAJ
member companies in an effort to establish a market-
ing environment where consumers are assured of
product quality. As of February 2012, bio-gasoline was
being sold at about 2,550 service stations, and it is
likely to meet 210,000KL of crude equivalent target
volume.
Furthermore, the Basic Energy Plan revised in June
2010 includes introducing biomass fuel as over 3% of
national gasoline consumption in FY2020*. In line
with this plan, the Law Concerning Sophisticated
Methods of Energy Supply Structures, enforced in
November 2010, specified blending about 820,000KL
of bio-ethanol (500,000KL of crude equivalent vol-
ume) directly into gasoline or in the form of bio-ETBE
in FY2017.
Although bio-ethanol is drawing attention as a bio-
mass fuel, there are several concerns as follows:
a Its domestic production is practically not viable
due to Japan’s limited cropland and high produc-
tion costs.
b Since Brazil is the only country which has a surplus
export capacity of bio-ethanol, there is a risk of not
being able to secure a stable supply resulting from
uncertain weather conditions and food market
prices (Stable Supply).
c The raw material is a high-priced agricultural crop.
d Its calorific value is 30% less than that of gasoline
(Fuel Economy).
Moreover, if bio-ethanol is blended directly with
gasoline, a a small quantity of water contamination
would result in the phase separation of gasoline and
ethanol to increase the possibility of fuel quality
change (a lowered octane number), b the safety of
consumers might be threatened by corrosion and
deterioration of distribution/marketing facilities, and
cas the direct blending method increases gasoline
vapor pressure (an indicator for gasoline volatility), it
would increase the emission of poisonous materials
such as the hydrocarbons that are considered to
cause photochemical smog. Although the advantage
of bio-ethanol regarding CO2 reduction measures
tends to be emphasized, it should not be forgotten to
discuss pollution abatement measures in urban areas.
On the other hand, the bio-ETBE method which is
promoted by PAJ would never cause such problems.
As bio-ETBE is generally blended with gasoline at the
refinery (in the production process), the evasion of tax
and the circulation of inferior quality gasoline would be
prevented. Therefore, the oil industry considers the
refinery blending of bio-ETBE be the most appropriate
method to cope with those concerns, and recommends
this bio-ETBE should be used for automotive fuel. * The Basic Act on Energy Policy is to be reviewed in FY2012, and future
introduction of biomass fuel is also likely to be reviewed.
Sustainability Standards for Biomass Fuel
At first, great expectations were held regarding the
use of biomass fuel as an effective means for the
reduction of greenhouse gas emissions. Recently,
some issues have arisen in relation to competition
with food production and also impact on the ecologi-
cal system. In view of these concerns, Nomura
Research Institute, on behalf of the petroleum indus-
try, made a survey to assess the problem and the
approach to these issues in other countries. “The
Report Concerning Biomass Fuels” was published in
December 2007.
Biomass fuel sources as a competitor with those for
food has been in the spotlight since early 2008 as the
worldwide use of biomass fuel was one of the causes
of rapid food price increases. While the use of bio-
mass fuel is expanding around the world, various
studies and discussions are ongoing in European
countries, the U.S., as well as in the U.N., to establish
standards for the development and sustainable use of
biomass fuel, focusing on such concerns as competi-
tion with food and environmental problems of defor-
estation. To cope with these moves, the Ministry of
Economy, Trade and Industry organized the “Biofuel
Sustainability Study Group” in October 2008, with the
participation of the Cabinet Office, the Ministry of
Agriculture, Forestry and Fisheries and the Ministry of
Environment. The group studied the requirements to
formulate the Japanese version of biomass fuel sus-
tainability standards. The group, considering the
importance of sustainability and stable supply in
order to expand the introduction of biomass fuel,
investigated European and U.S. trends, and identified
various problems to be solved, including effects on
GHG reduction, land use for cultivation of biomass,
100%
80%
60%
40%
20%
0%US
(2008)US
(2017)EU
(2008)EU
(2017)Brazil(2008)
Brazil(2017)
Japan(2007)
1%
99%
9%
91%
40%
60%
19%
ImportedDomestic
81%
100% 100% 97%
3%
Source : Biofuel Sustainability Study Group (April 2009)
� Self-sufficiency of Bio-ethanol in Major countries
Sh
are
in E
than
ol C
on
sum
pti
on
(in
clu
din
g n
on
-Fu
el U
se)
Gasoline [Base]
BrazilSugarcane
Japan(reference)
No change of land use
Grassland
Savanna
High-yielding rice (1)
High-yielding rice (2)
Imported rice
Unmarketablewheat
Surplus sugar beetSugar beet
(target production)Constructiondebris wood
Blackstrap molasses
40%
86%
340%
111%
70%
72%
75%
54%
49%
10%
67%
Land use change
Crop production
Feedstock transport
Conversion
Liquid fuel transport
500 100 150 200 250 300g-CO2/MJ
Less CO2 emissions than Gasoline← →More CO2 than Gasoline
50% reduction over gasoline
� LCA of the Effect of Bio-ethanol on GHG Emissions Reducation
(Note)
Source: Interim Report of the Study Group on Sustainability Standards for the Introduction of Biofuel (March 2011)
1 High-yielding rice (1) is produced in a paddy field with water management and high-yielding rice (2) is without water management2 LCA of gasoline GHG emission is assumed as 81.7g-CO2/MJ3 In case of local production for local consumption, zero GHG emission during transportation is assumed

Utilization of Biomass Fuel
Efficient Use of Oil17
61 62
Efficient Use of Petroleum Products
Demand for heavy fuels is projected to show a
steady decline in the future, so the petroleum industry
is making efforts to develop innovative technologies
to create effective uses for residual oils like Fuel Oil C.
Integrated Gasification Combined Cycle (IGCC) is
the most prominent technology among them all for
using residuals in a cleaner and more efficient man-
ner, and is gathering worldwide attention. IGCC is a
system that uses gasification technology on low-value
residual oils like asphalt to generate electricity effi-
ciently from a compound turbine powered by syn-
thetic gas and steam. With this technology, impurities
such as sulfur in fuel oils can be removed through the
gasification process. In addition, sulfur oxides and
nitrogen oxides can be reduced to a minimum, and
high thermal efficiency (46%) can be achieved. Also, a
strong CO2 emission-reduction effect (15% lower than
that of a conventional oil thermal power plant) can be
achieved by gas-turbine and steam-turbine combined
cycles. Commercial operation of an electric power
wholesale supply using IGCC fueled by residual oils
(asphalt) began in June 2003.
The high-severity fluid catalytic cracking (HS-FCC)
process is another example of technical advance-
ment. Jointly with the Saudi Arabia government, the
petroleum industry carried out the development of
the HS-FCC process. HS-FCC plants were constructed
in Saudi Arabia in 2003 and in Japan in 2011, and they
were tested for verification of the HS-FCC process
technology. This process cracks heavy oils and pro-
duces a high yield of gasoline and also propylene,
which is a high-value raw material for petrochemical
products. As the demand for propylene continues to
expand mainly in the Asian market, an increasing
supply is required from crude oil processing. In this
regard, the commercialization of the HS-FCC process
is highly anticipated.
competition with food, and stability of supply. (Report
toward Establishing the Japanese Version of Biofuel
Sustainability Standards, April 2009)
“The Study Group on Sustainability Standards for
the Introduction of Biofuel” was then organized in
July 2009 to develop Japan’s own standards and
operating procedures. The interim report issued in
March 2010 is summarized as follows: a As one of the
sustainability standards for biomass fuel, the life cycle
assessment (LCA) of the GHG reduction effect should
be more than 50 % of the GHG emission by gasoline.
bA high rate of self-sufficiency is necessary for a sta-
ble supply of biomass fuel as the current supply is
limited to imported products from Brazil and to a
small part of domestic products. cAll related minis-
tries should have a mutual view on biomass fuel’s
competitive nature with food and examine the root
cause analysis and the action plan. The sustainability
standard of biomass fuel, which is to be introduced
based on the Law Concerning Sophisticated Methods
of Energy Supply Structures, will follow the direction-
ality that had been shown by the interim report.
Since Japan is a country of limited natural resourc-
es, it is fundamental to satisfy the principle of 3E
energy policy (securing stable energy supply, envi-
ronmental consideration and efficient supply) in a
well-balanced manner and the use of biomass fuels
as automotive fuel is not an exceptional case. In order
to expand the promotion of biomass fuels in future, it
is essential to consider “stable supply”, and, in the
long term, to develop innovative technologies for
manufacturing low cost biomass fuel by utilizing
plants and trees that do not conflict with food produc-
tion or supply. In order to abide by the sustainability
standards set forth by the above interim report, the
petroleum industry plans to effectively utilize bio-eth-
anol as renewable energy within a range where food
supply and the environment are not negatively affect-
ed. This sound approach will be continued in the
future for achieving the objectives of 3E policy.
Biofuel Marketing Schedule
Bio-Gasoline Sales
Introduction of Bio-ETBE
Maintenance of Domestic
Infrastructure
Bio-ETBESupply
April 2007 -March 2009Test Marketing
Verification Work on Distribution System
FY2007 50 service stations
1 Import Terminal Maintenance Summer 2008; Contract Start to use
2 Ocean Tanker Procurement Summer 2008: Contract Start to ship
FY2008 100 service stations
FY2009Expanded Marketing
[Bio-ETBE 0.2 million kl]
FY2010Full Marketing
0.21 million klof Crude Oil Equivalent
[Bio-ETBE 0.84 million kl]
3 Coastal Tanker Procurement Winter 2008: Contract Start to ship
*Supported by Governmental fund (Verification Work on Distribution System) for 2 years from FY2007
*
(Quantity of bio-ETBE introduction)
July 2008
Memorandum Conclusion in Brazil,Purchase Contract with US company
Start to Trade Domestic Ethanol
September 2009
� IGCC: Integrated Gasification Combined Cycle
Air Nitrogen
Air
Asphalt Steam
Steam
GeneratorSteam Turbine
Waste Heat Boiler
Gas TurbineGas Turbine
Gasification Unit Gas Turbine Exhaust
Electricity
Air Separation Unit
Hydrogen+
Carbon Monoxide
Synthetic Gas
Compound Generation UnitOxygen
� Characteristics of IGCC
IGCCBTG*1
(Conventional Oil ThermalPower Generation)
46% 39%Generating Efficiency
598g–CO2/kWh 706g–CO2/kWhCO2 Emission
� �Emission Gas Level*2
�1 BTG=Boiler Turbine Generator �2 Comparison based on NOx and SOx emissions

Efficient Use of Oil
63 64
Effective Petroleum Product Use during Consumption
As part of its policy of enhancing energy saving and
improvement in fuel handling, PAJ has worked on the
development and wider range of consumer use of its
Kerosene Utilization Systems since FY1993. The sys-
tem aims to promote oil co-generation systems, oil
central heating systems, and district heating and cool-
ing systems.
Environmentally Friendly High Efficiency Boiler
Jointly with the Petroleum Energy Center (PEC), PAJ
developed and commercialized a high-efficiency (95%),
low-nitrogen oxide (NOx) boiler fueled by Fuel Oil A,
which attained NOx emission of less than 70 ppm, far
below the Ministry of Environment’s “NOx Emission
Guideline for Small-scale Burning Appliances” .
High-Efficiency Water Heater, “Eco-Feel”
An innovative kerosene-based water heater was
introduced in December 2006. In comparison with
conventional water heaters, this unit uses less fuel
and reduces CO2 emissions, considered one of the
causes of global warming. PAJ, jointly with the Japan
Industry Association of Gas and Kerosene Appliances
(JGKA), registered a trade name for this heater, ”Eco-
Feel”, and started sales promotion of the product.
Listed below are the advantages of “Eco-Feel”
1. Waste Heat Recovery: An additional heat exchang-
er is installed to recover exhaust heat usually emit-
ted into the air. The efficiency of “Eco-Feel” is
improved to 95%, resulting in less kerosene con-
sumption.
2. CO2 Emission Reduction: Compared with a con-
ventional water heater (83% efficiency), “Eco-Feel”
required 12% less kerosene for burning and
decreased CO2 emissions by 12%.
Central Hot-Water Heating System,
“Hotto-Sumairu” (Hot Smile)
As household heating and cooling performance is
improving through the introduction of super-insulated
houses, concerns about the safety and hygiene
aspects of air conditioning are growing. To meet such
concerns, the petroleum industry is disseminating the
advantages of a kerosene-based central hot-water
heating system. A registered trade name, “Hotto-
Sumairu”, was chosen in agreement between PAJ and
LGKA for joint promotion of the system. As the hot
water made by a kerosene-fired boiler is used for
heating, the room is free of exhaust gas and would be
kept in a pollution-free condition. “Hotto-Sumairu”
promotion is directed not only at detached housing
but also at housing complexes.
Kerosene is Friendly to Environment and
Household Economy
There are various sources of energy familiar to us
besides kerosene such as gas and electricity. Among
these, the amount of carbon dioxide exhaust attribut-
able to kerosene is actually less than that from elec-
tricity. This is because the transmission loss and heat
loss occurs by as much as 63% before electricity
reaches each home from the power plant. Kerosene,
which is considered to emit a large amount of carbon
dioxide, is actually an environmentally friendly energy
source.
In addition, the price of kerosene per 1kW is about
30% of the cost of electricity in daytime, and about
60% that of city gas. Kerosene is more economical
and friendly to household expenses than either elec-
tricity or city gas.
Kerosene; a Decentralized Source of Energy that
Excels in Disaster Responsive Capability
Kerosene can be stored in decentralized tanks and
be utilized as an energy source in case of disaster
when ”system energy” sources such as electric
power and town gas supplies are cut off.
A survey of 1,000 adult men and women in Iwate,
Miyagi and Fukushima areas which were struck by the
Great East Japan Earthquake showed that about 52%
of them used kerosene immediately after the quake.
In the evacuation facilities, the kerosene heaters
were ubiquitously utilized as shelter residents’ heat-
ing equipment. Furthermore, many lives of people
injured in the disaster were saved in hospitals with
onsite oil-driven electric power generation facilities.
0
20
40
60
80
100
120
140
� Lower NOx Emission Attained
NOx Concentration in Exhaust Emissions (ppm)
2-Ton Boiler burning Fuel Oil A 2-Ton Boiler burning Kerosene
130 ppm 65 ppm 120 ppm 45 ppm
(ppm)
50% Decreasein NOx Concentration
62.5% Decreasein NOx Concentration
Conventional Boiler Environmentally Frendly High Efficiency Boiler
HeatEfficiency
83%
95%
WaterWaterKerosene 100Hot Water 83 Hot Water 95
Kerosene 100
Neutralizer
Exhaust Heat Approx. 200˚C Exhaust Heat Approx. 60˚C
Waste Water
Co
nve
nti
on
al W
ater
Hea
ter
“Eco
-Fee
l” W
ater
Hea
ter
Primary Heat Exchanger Secondary Heat Exchanger
Primary Heat ExchangerPrimary Heat Exchanger
� CO2 EmissionsAnnual Reduction
Conventional Eco-Feel
1,560kg-co2
1,363kg-co2
197kg-co2
Annual CO2 reduction equivalent to 14 cedar trees
* For a typical family of four members, “Eco-Feel” emits 200kg less CO2 a year compared with a conventional heater. As it also saves 79 liters of ker-osene a year, “Eco-Feel” is an ecological and economical water heater.
0.0 1.0 2.0 3.0 4.0
Electricity(Meter-rate
lighting)
Electricity(Daytime)
Electricity(Nighttime)
City Gas
LP Gas
Kerosene 1.00
2.02
1.51
1.05
3.09
2.49
11p.m.~7a.m.
7a.m.~11p.m.
0.0 0.1 0.2 0.3 0.50.4
Electricity (After CO2
creditadjustment)
Electricity(Actual
coefficientof emission)
City Gas
LP Gas
Kerosene 0.244
0.213
0.180
0.412
0.351
� Comparison of Energy Cost
� Coefficient of CO2 Emission by Energy Source (kg/CO2/kWh)
Source: Oil Information Center (national average as of January 2012)
Source: Ministry of Environment, Ministry of Economy, Trade and Industry,and Federation of Electric Power Companies of Japan
� Waste Heat and Transportation Loss of Electricity
Total energy efficiency
PowerPlant
Waste heat andtransportation losswhich are not utilized
37%
63%
0%
10%
20%
30%
40%
50%
60%
OthersCity GasElectricityLP GasKerosene
52.3
36.9
23.5
9.4
17.2
� Energy Utilized Immediately After the Earthquake
Total persons surveyed (n=1,000)
52% of persons surveyed could use kerosene immediately after the quake
3
T(Kerosene) 52%Kerosene was utilized most In the disaster

Efforts toward Developing New Energies18 Efforts toward Developing New Energies
65 66
Expectations for Fuel Cells
With their high energy efficiency and low environ-
mental burden, fuel cells are expected to become a new
form of energy supply for household and automotive
use. To promote the future popularization of fuel cells,
the government is taking initiatives in technology devel-
opment and field demonstration. The petroleum indus-
try is also advancing its efforts to develop and spread
the use of petroleum-based fuel cells as a new energy
system.
Stationary Fuel Cell System
A stationary fuel cell system generates electricity,
using hydrogen produced from petroleum fuels like
kerosene and LPG, and oxygen in the air. The heat given
off from power generation can be used for hot-water
supply in kitchens and bathrooms as well as for the
heat source of a floor heating system.
Its major features are: (1) good energy efficiency, (2)
eco-friendliness and (3) low utility costs.
The advantages of using petroleum fuels are:
(1) Hydrogen for generating electricity can be produced
from common fuels such as kerosene and LPG;
these fuels’ supply infrastructures have already been
established nationwide and storage and transporta-
tion are easy.
(2) Kerosene and LPG supply infrastructures are highly
disaster resistant, as shown at the time of the Great
Hanshin Earthquake and the Niigata-Chuetsu Earth-
quake. Petroleum-based fuel cells would be an effec-
tive energy supply system in the event of natural
disasters.
Petroleum Industry’s Efforts
The petroleum industry has accumulated advanced
technologies and know-how regarding hydrogen pro-
duction from petroleum fuels for many years. With that
know-how and the fuel supply infrastructures, field
demonstrations of a system of fuel cells using petro-
leum fuels have been carried out in households
throughout the country. As a result, in 2009, sales activi-
ty for fuel cells for household use was started under the
trade name of “Ene-Farm”. LPG was utilized as a first
stage of petroleum fuel supply.
For Popularization of Fuel Cells
Since the Great East Japan Earthquake, social interest
is increasing in preparation and power saving mea-
sures to avoid blackouts. In this regard, the petroleum
industry is making positive efforts in the following areas
for promotion of fuel cells:
• Marketing of household type solid oxide fuel cells
(SOFC) was launched in October 2011. This fuel cell
achieved a generation efficiency rating of 45% in
comparison with the conventional polymer elec-
trolyte fuel cells (PEFC). Further development will
actively be carried out on a disaster resistant fuel
cell system utilizing the characteristics of petro-
leum fuels.
• Reflecting the results of technology development,
verification tests will be conducted for a fuel cell
system run by petroleum fuels in facilities for
household and business use.
Hydrogen Supply to Fuel Cell Vehicles
The petroleum industry is increasing its efforts in
developing hydrogen production technologies and in
the field demonstration of hydrogen filling stations for
fuel cell vehicles. Oil companies in Japan participated in
the national demonstration projects (JHFC*1/NEDO*2
Projects and HySUT*3 activity) to operate various type
of hydrogen filling stations. In January 2011, 13 compa-
nies including oil, automobile and gas companies joint-
ly made a statement to develop a hydrogen supply
infrastructure and to introduce fuel cell vehicles in 2015.
Oil companies, as hydrogen suppliers, plan to estab-
lish the infrastructure beforehand and, with auto and
gas companies, to promote fuel cell vehicles. For the
realization of this plan, companies are requesting the
government to set up a promotion strategy through
public-private cooperation such as dissemination sup-
port and expanding public acceptance.
Furthermore, technology development to produce
hydrogen from kerosene at a filling station site is ongo-
ing. This includes a hydrogen manufacturing process
using membrane separation technology started in
FY2008.*1 METI’s Japan Hydrogen & Fuel Cell Demonstration Program*2 New Energy and Industrial Technology Development Organization *3 Research Association of Hydrogen Supply/Utilization Technology
Efforts toward New Technologies
Aiming at developing the highly efficient utilization of
petroleum and supplying high quality products, PAJ
established the Petroleum Industry Technology and
Research Institute, Inc. (PITRI) in December 1990 in
order to deal with various technical issues to be tackled
by the petroleum industry as a whole. PITRI has been
conducting research and development (R&D) on auto-
motive, industrial and household fuels, as well as safety
management systems for oil refining and storage facili-
ties.
In FY1991, PITRI started research activities at its labo-
ratory in Chiba City in collaboration with the Advanced
Technology and Research Institute (ATRI) under the
Petroleum Energy Center (JPEC) to carry out various
R&D projects.
R&D on Combustion Technologies for Automotive Fuel
In order to answer the national concern about envi-
ronmental issues, it is essential for the petroleum indus-
try to establish quality requirements for automotive fuel
that are attributable to improvements in automotive
vehicles’ fuel economy and exhaust gas quality.
With governmental support, the petroleum industry
and the automotive industry jointly completed a
research program called the Japan Clean Air Program,
(JCAP) run in two steps (JCAP-I and JCAP-II). The out-
come of JCAP activities includes the verification of
cleaner automotive exhaust gas and better fuel econo-
my by reducing the sulfur content of gasoline and die-
sel fuel. Based on this, the petroleum industry started
sulfur-free gasoline and diesel fuel supply.
In FY2007, a new research project, Japan Auto-Oil Pro-
gram (JATOP), was initiated for developing optimum
automotive and fuel technology to fulfill three require-
ments, namely “CO2 Reduction”, “Fuel Diversification”
and “Exhaust Gas Reduction”, in view of the issues of
preservation of air quality, global warming and energy
security.
Enhancement of Oil-Based Heating/Cooling
Systems
In line with the “Oil-based System Promotion Policy
for the 21st Century” which started in February 2001,
PAJ is disseminating the advantages of oil-based heat-
ing/cooling systems to both industrial and household
sectors. To support this, PITRI evaluated the perfor-
mance and the comfort of “Hotto-Sumairu” (an oil
based central heating and hot-water supply system)
and the positive results are being effectively used for
this system’s promotion.
R&D on Safety Management Systems for Oil Refining
and Storage Facilities
Aiming at the improvement of its own safety and
security standards at refining and storage sites, the
petroleum industry is reviewing nondestructive inspec-
tion methods and compiling field inspection data in
order to develop self-inspection standards.
Regarding the facilities in operation, the petroleum
industry is preparing fitness-for-service evaluation stan-
dards, in cooperation with API and ASME, to assess the
material strength and the remaining life of the facilities
based on the inspection data acquired for these facilities
in service.
In addition, as Japan is an earthquake-prone country,
an ongoing research study is steadily collecting data
regarding the effect of longer-cycle seismic vibration on
oil storage facilities
that will contribute
to safety control in
the future.
� Early Establishment of Hydrogen Supply Infrastructure
Set up on the Highway
Early Establishment in Four Metropolitan Areas
* After the introduction of FCV, nationwide expansion of FCV sales and the maintenance of hydrogen supply infrastructure will proceed

Temporary Service Station in Rikuzen-Takata-Shi
Shiogama Oil Terminal
Tagajo Station of Japan Ground Self-Defence Forces
Shiogama Oil Terminal Emergency Operations Room at PAJ
Temporary Service Station in Higashi-Matsushima-Shi
AOMORI
AKITA
Oil terminal inTokyo area
NIIGATA
SAKATA HACHINOHE
MORIOKA
ONAHAMA
HITACHI
KAMAISHI
KORIYAMA
KESENNUMA
SHIOGAMA
SENDAI
KASHIMA
KEIYO(CHIBA)KEIHIN(KANAGAWA)
Normal shipping operation is stoppedin most of East Japan oil terminals
AOMORI
AKITA
Oil terminal inTokyo area
NIIGATA
SAKATAMORIOKA
HACHINOHE
ONAHAMA
HITACHI
KAMAISHI
KORIYAMA
KESENNUMA
SHIOGAMA
SENDAI
KASHIMA
KEIYO(CHIBA)KEIHIN(KANAGAWA)
Oil terminals on the Pacific coast are partially open, and most of those in the Tokyo area are open
Response to the Great East Japan Earthquake
○ Strengthen production system of refineries in operation (Raising operating rate, increasing production capacity, etc.)○ Urgent import of gasoline and restricting product export (Increasing domestic supply)○ Shipping petroleum products to disaster area from western Japan and Hokkaido (Coastal tanker, tank car and tank truck)○ Cooperation among oil companies in the disaster area. (Joint use of oil storage facilities)○ Shifting of tank trucks from western Japan to the disaster area (Special engagement of approximately 300 trucks)○ Public relation activities in the disaster area for relieving consumers’ anxiety such as informing them of service stations in operation
March 12 (aftermath of the quake)
Refining Capacity in Japan
3.12 million b/d
March 21
Refining Capacity in Japan
4.0 million b/d
� Operating Situation of Refineries and Oil Terminals in Tohoku and Kanto Areas
Partial shipment
Suspended shipment
Able to ship
Partial shipment
Suspended shipment
Able to ship
ExpresswayExpressway
Tohoku Area
Kanto Area
Oil Terminal
3 Operating / 6 Shut down
6 Open for delivery23 Closed (restricted)
ing / 6 Shut down
Refinery
3 Operatierati
Oil Terminal
6 Operating / 3 Shut down
18 Open for delivery11 Closed (restricted)
ing / 3 Shut down
Refinery
6 Operatierati
67 68
Great East Japan Earthquake and the Petroleum Industry
Great East Japan Earthquake and the Petroleum Industry
Situation of Quake Damage to the Petroleum FacilitiesThe Great East Japan Earthquake, which struck at 2:46 p.m.
on March 11, 2011, caused serious damage over a wide area of eastern Japan. Petroleum-related facilities were not ex-ceptions. As social infrastructure such as roads and harbor facilities were paralyzed, a stable supply of petroleum prod-ucts could not be secured for some time in parts of the re-gion.
On the day after the quake, March 12, the operating situa-tion of petroleum facilities was as follows: Among nine refin-eries located in the Kanto and Tohoku region, six refineries halted production; two out of four refineries in Chiba Prefec-ture, two out of three in Kanagawa Prefecture, and one each in the city of Sendai and Kashima. A refining capacity of 1.4 million barrels per day was forced to stop operation; this ac-counts for around 30% of total refining capacity in Japan. Three refineries on Tokyo Bay restarted operation within two weeks. However, Sendai, Kashima and one of the Chiba re-fineries were severely damaged and the overall restoration required a long time. As for oil terminals, Hachinohe, Kamai-shi, Kesennuma, Shiogama, Onahama and Hitachi on the Pacific coast, and inland oil terminals in Morioka and Kori-yama suffered quake and tsunami damage. Together with the damage to the refineries, normal product shipping op-erations in eastern Japan area were paralyzed.
In addition, nearly 150 tank trucks were lost in the tsuna-mi, and 680 service stations in total in Iwate, Miyagi and Fu-kushima prefectures, about 40 % of the region’s total, were forced to suspend operation.
Petroleum Industry’s Response for Securing SupplyThe petroleum industry made every possible response
across the full range of each company’s functions to recover a stable supply of petroleum products such as gasoline and kerosene, in spite of having suffered severe damage to pe-troleum facilities.
Firstly, the industry started delivery by tank truck from the Sea of Japan coast prefectures such as Niigata, Yamagata, Akita and Aomori where the quake damage was minimal or nonexistent. However, the longer hauling distance, roads unfamiliar to drivers and interrupted or closed sections of main roads, made such transportation full of difficulty. There was a case where 30 hours of driving was needed to travel from Niigata to Sendai.
Tank truck shipments from the Tokyo metropolitan area were also carried out. The fuel for emergency transportation was delivered via the Tohoku and Joban Expressways to evacuation centers, hospitals and public institutions. In order to strengthen the transportation capacity to the disaster area, about 300 tank trucks were shifted from the Tokyo metro-politan area and western Japan to the Tohoku region.
In addition, special freight car operations were conducted day after day by Japan Freight Railway Company from Yoko-hama to Koriyama via Niigata, and to Morioka via Niigata and Aomori by making a detour around the Tohoku Main Line.
The Shiogama oil terminal, which is a large-scale facility
where the quake damage was relatively slight, restarted shipping its remaining products on March 17, and started re-ceiving products from coastal tankers on March 21. The use of coastal tankers enabled the transfer of a large quantity of products from refineries in Hokkaido, the Tokyo metropoli-tan area and western Japan, and product supply to the disas-ter area improved significantly. During this period, the Shiogama oil terminal was utilized jointly by rival oil com-panies.
To make up for the production of refineries which were forced to shut down, the eastern Japan refineries were run at a 95% operating ratio, nearly their full capacity. At the same time, oil companies stopped the export of petroleum prod-ucts.
The petroleum industry made maximum efforts to restore the supply system. Ten days after the quake, product ship-ment was restarted in the Tokyo metropolitan area and also from a part of the eastern Pacific key oil terminals, namely Shiogama and Hachinohe. By early April, the ordinary sup-ply system was considered to be almost restored in the di-saster area.
However, even in mid-April, there were places without a service station within a 10km zone, a so-called ‘service sta-tion blank zone’, in Ooozuchi-machi and Rikuzen-takata-shi of Iwate Prefecture and Minami-sanriku-cho of Miyagi Prefec-ture. At Rikuzen-takata, a temporary service station was constructed utilizing ISO tank containers, and the Self-De-fense Forces (SDF) together with the local authorities oper-ated hand-driven and foot-driven filling stands.
Petroleum Association of Japan’s ActionImmediately after the disaster, the Petroleum Association
of Japan (PAJ) established emergency response headquar-ters, headed by Akihiko Tenbo, the PAJ president. On the next day, PAJ set up an operations room to cope with urgent sup-port requests to individual supply points based on the re-quests from the Prime Minister’s Office and the Ministry of Economy, Trade and Industry. The room responded to about 1,400 requests such as supply of fuel for emergency vehicles (firefighting, ambulance, police and SDF), for emergency power generation (hospitals and nuclear power plants) and for heating (evacuation centers and schools).
In this earthquake disaster, SDF’s rescue operations were in the spotlight. PAJ cooperated with SDF by supplying about 7,000 drums of fuel. In addition, PAJ also contributed about 2,000 drums of fuel to three prefectures which suf-fered the most serious damage.
The Great East Japan Earthquake damaged the electrical grid and the city gas lines. However, after the supply from the centralized “system energy” was stopped, petroleum imme-diately showed its ability to cope with the emergency as a “distributed energy” that was easy to carry and store. Oil served as the last resort to support the lives of the people by supplying heating fuel to evacuation centers and fueling emergency vehicles for residents near the nuclear plant. In this regard, the importance of oil was highlighted again.

69 70
Idemitsu (Hokkaido) 140,000
JX Nippon Oil & Energy (Muroran) 180,000
Teiseki Topping Plant (Kubiki) 4,724
Idemitsu (Tokuyama) 120,000
JX Nippon Oil & Energy (Mizushima)380,200
Nansei (Nishihara) 100,000
JX Nippon Oil & Energy (Sendai) 145,000
Cosmo (Chiba) 220,000Kyokuto (Chiba) 175,000Idemitsu (Chiba) 220,000Fuji (Sodegaura) 143,000
Kashima (Kashima) 252,500
TonenGeneral (Kawasaki) 335,000Toa (Keihin) 65,000
JX Nippon Oil & Energy (Negishi) 270,000
Idemitsu (Aichi) 160,000
Cosmo (Yokkaichi) 175,000Showa Yokkaichi (Yokkaichi) 210,000
Cosmo (Sakai) 100,000TonenGeneral (Sakai) 156,000Osaka International Refining Company (Osaka) 115,000
TonenGeneral (Wakayama) 170,000
Cosmo (Sakaide)140,000
Taiyo (Shikoku)120,000
Seibu (Yamaguchi) 120,000
JX Nippon Oil & Energy (Oita) 136,000
TOTAL: 27 Refineries (4,479,424 b/d)
JX Nippon Oil & Energy (Marifu) 127,000
� Location of Refineries and Crude Distillation Capacity in Japan (as of Jul 2012)
(Unit: Distillation Capacity in b/d) � Overview of the Japanese Petroleum Industry [Oil Refiners and Primary Oil Distributors (Motouri)]
16 companies (as of Aug 2012)Number of Oil Companies
563.0 billion yen (as of Mar 2012)Total Capital
25.554 trillion yen (FY2011)Annual Sales Revenue
Approx. 19,500 (as of the end of FY2011)Total Number of Employees
246.6 million kl (FY2011)Crude & Product Import Volume
192.1 billion dollar (FY2011)Crude & Product Import Amount
99.6% (FY2011)Oil Dependence on Imports
� Main Product Specifications in Japan
Please refer to PAJ’s Oil Statistics Website for Details
http://www.paj.gr.jp/english/statis.html
Lead UnleadedDensity (max.) 0.783g/cm3 (15˚C)RVP 44~78kPaRON (min.) Premium 96; Regular 89Sulfur content (max.) 0.0010wt%Benzene (max.) 1vol%MTBE (max.) 7vol%Ethanol (max.) 3vol% *1O2 content (max.) 1.3wt% *1
•Motor Gasoline(JIS K2202)
Sulfur content (max.) 0.0080wt% (for fuel cell : 0.0010wt%)Smoke point (min.) 23mm (in winter season: 21mm)
•Kerosene(JIS K2203)
Kinematic viscosity (max.) 20mm2/S (50˚C)Pour point (max.) 5˚CSulfur content (max.) No.1: 0.5wt%; No.2: 2.0wt%
•Fuel Oil A *2
(JIS K2205)
Kinematic viscosity (max.) 50mm2/S (50˚C)Pour point (max.) 10˚CSulfur content (max.) 3.0wt%
•Fuel Oil B *2
(JIS K2205)
Kinematic viscosity (max.) No.1 250mm2/S (50˚C) No.2 400mm2/S (50˚C) No.3 400mm2/S~1000mm2/S (50˚C)Sulfur content (max.) No.1 3.5wt% No.2, No.3. no specification
•Fuel Oil C *2
(JIS K2205)
Pour point (max.) Special No.3: -30˚C; No.3: -20˚C; No.2: -7.5˚C; No.1: -2.5˚C; Special No.1: +5˚C;Cetane index (min.) Special No.1, No.1: 50 No.2, No.3, Special No.3: 45Sulfur content (max.) 0.0010wt%Density (max.) 0.86 (15˚C)
•Gas Oil(JIS K2204)
Note: 5 grades depending on ambient temperature of seasons and/or districts.
*1 For an automobile that received registration by the Road Vehicle Act or its vehicle number is specified by law as a vehicle compatible with E10, gasoline specifications for both oxygen and ethanol are relaxed to 3.7 mass% and 10 vol% max, respectively.
*2 Fuel oil is classified into 3 types by viscosity. Even though Fuel Oil A has the name "fuel oil", it's a kind of distillate product. This is used for marine diesel engines, small boilers, etc. Fuel Oil B had been produced in large quantities in the past, but this fuel is rarely produced nowadays. Average sulfur level of Fuel Oil C produced in Japan is about 1.5wt% recently (including all its grades).
Appendix
69 70
Appendix
Petroleum Association of JapanKeidanren Bldg., 3-2,1-chome, Ohtemachi, Chiyoda-ku, Tokyo 100-0004
Public RelationsTel. 81-3-5218-2305 Fax. 81-3-5218-2321
http://www.paj.gr.jp/