petroleum transactions determination of fracture...
TRANSCRIPT

J
PETROLEUM TRANSACTIONS
Determination of Fracture Orientation from Pressure Interference
LINCOLN f. ELKINS MEMMK AIME
ARIIE M. SKOV JUN/O* MEMBE* AIME
SOHIO PETROLEUM CO. OKLAHOMA CITY, OKLA.
T. P. 8137
ABSTRACT Inclusion of anisotropic permeability in mathemati
cal analysis of pressure transients observed during development of the huge Spraberry field indicates a major fracture trend which is in good agreement with that observed by fluid-injection tests spread over a 12- by 17-mile area. Delineation of this trend is important in selecting a pattern of injection for the pending large-scale water flooding in this field. Determination of reservoir parameters yielding best agreement between calculated pressures and observed reservoir pressures in newly completed wells was made using an IBM 650 computer.
INTRODUCTION
The Spraberry field covering 400,000 acres is a tight sand of less than 1-md permeability cut by an extensive system of vertical fractures. Primary recovery dominated by capillary retention of oil in the fractured sand matrix blocks is less than 10 per cent of oil in place. Strong forces of capillary imbibition of water into the sand, coupled with water flow under dynamic pressure gradient, indicate considerable increase in oil recovery can be achieved through water flooding. Best results will occur if the pattern of water injection is selected to force the water flow across the grain of the major fracture system.
Existence of an oriented vertical fracture system in the Spraberry, observed first in cores, was highlighted more recently by the 144-fold contrast in permeability along and at right angles to the major fracture trend required to match relative water breakthrough times in Humble Oil & Refining Co.'s waterflood test there. Spraberry operators since have conducted two gas-injection tracer tests for further areal confirmation of the fracture trend. Re-analysis of early reservoir pressure
Original manuscript received la Society of Petroleum Engineers office July 12, I960. Revised manuscript received Nov. 1. 1960. Paper presented at J t th Annual Fall Meeting: of SPE. Oct. 2-6. I960, in Denver.
Discussion of this and all following technical papers is invited. Discussior. in w r i t i n g I thi-e^ copies) mav he sent lo l.he ofnVe <>f
transients for evidence of anisotropic permeability has permitted many more local determinations of major fracture trend without resort to further field tests.
This paper is limited to updating analysis of reservoir pressure transients to include anisotropic permeability as a test for orientation of the major fracture trend in the Spraberry. The reader is referred to Ref. 1 and 2 for information about general Spraberry reservoir performance and to Refs. 3 and 4 for information about significance of fracture orientation in selection of the injection-well pattern for water flooding the Spraberry.
RESERVOIR PRESSURE DATA—DRIVER AREA
During early development of the Spraberry Driver area, Sohio Petroleum Co. made the extra effort to measure the initial pressure in each of the 71 wells in a 5-mile-long area immediately after completion. Progressively greater reductions in pressure ranging up to 400 psi were observed throughout the six-month development period. Detailed data are presented in Ref. 1.
Since the reservoir oil was undersaturated some 300 psi initially, early reservoir performance involving 55 new well pressures is subject to analysis as flow of a single compressible fluid in a porous media. Assumption of uniform permeability in all directions yielded good agreement between calculated pressures and observed pressures of these wells in the earlier study,' but subsequent, additional, mathematical development to include anisotropic permeability in the transient pressure considerations and present availability of electronic computers to perform the much more extensive arithmetical calculations now yield even better agreement.
The previous analysis, assuming uniform permeability, consisted essentially of calculating pressure reduction expanding circularly around each producing well and summing these effects at the time and location of each newly completed well for comparison with the measured pressure reduction. Permeability, effective fluid and rock compressibility, and permeability X thickness were varied until the best match with measured pressures was obtained. The present analysis, assuming anisotropic

permeability, is similar except that, in effect, the pressure reduction caused by production of a well expands in elliptical form with length/width varying as the square root of the ratio of permeability along and at right angles to the fracture trend. This adds fracture azimuth and permeability ratio to the other significant factors affecting performance. Values of certain of these variables were assumed and one other altered until a "best" fit was obtained. It was then "fixed" and a second one adjusted, then a third, etc., until no new combination could be found to improve the agreement between calculated and actual pressures. Seventy complete sets of calculations involving 155 producing wells and 55 new well pressure points were performed.
Results of this series of calculations with respect to the orientation of fractures and contrast in permeability — factors most pertinent to water flooding — are summarized in Figs. 2 and 3 which show average (root mean square) error in pressure vs these variables. Deviation between calculated pressures and measured pressures of individual wells are presented in Fig. 4 both for assumption of directional permeability and of uniform permeability. While the resolving power of the analysis is not high, indicated by comparison of error with and without consideration of permeability contrast, there is little doubt that orientation of the fractures so point for planning Spraberry waterflood injection-well patterns. They indicate an average fracture trend of N 56° E and a thirteen-fold ratio of effective permeability along and at right angles to the main fractures. Corresponding flow capacities are 3,220 and 248 md-ft, or about 104- and 8-md effective permeabilities based on 31-ft gross Upper Spraberry sand thickness. Matrix permeability is less than 1 md.
Since these pressure data of 55 new wells cover an
MARTIN CQ HOWARD CO.
SERMANIA
MIDLAND CQ
TEX HARVEY.
ATLANTIC WATER FLOOD TEST
MIDKIFF PRESSURE ANALYSIS
-DIRECTION BY PRESSURE ANALYSIS
-DIRECTION 1Y FLUID INJECTION
GLASSCOCK CO.
NORTH DRIVER PRESSURE ANALYSIS
DRIVER -PRESSURE
ANALYSIS
HUMBLE WATER—^ FLOOD TEST
N. PEMBROOK
PEMBROOK PRESSURE ANALYSIS
PEMBROOK GAS INJECTION TEST"*
ALOWELL GAS INJECTION TEST
PEMBROOK
BENEDUM
UPTON CO. REAGAN CO.
area 5 miles in length, they permit a determination of consistency of fracture orientation. Results of four sub-area analyses also are presented in Fig. 2, with indicated
0 IS 30 AS SO 75 90
ASSUMED AZIMUTH OF MAJOR FRACTURE TREND - • E ' O F N — INOICATCS ERROR ran EACH AREA ir ISOTROPIC
PERMEAi lUTY IS ASSUMED
Fic. 2—FitAcruM ORIENTATION BY AREA AND BY LIA SI IN THE DlTVXR ABXA.
cn 0-
o tr or
UJ cz z> cn 00 UJ tr a. UJ tr < a CO
< UJ
2
O o tr
1 v MIDKIFF AREA
17 WELLS * N
PEME ROOK AREA ! WELLS \
• 1 — 1 T
9 \
NORTH DRIV 21 WE
ER AREA LLS
T v 13 DRIVE
55 \
* AREA WELLS
)
Fic 1—FRACTUR* OIIENTATION, SPRABEKRV TREND.
ASSUMED VALUE OF PERMEABILITY RATIO - Kx / Ky
Fic. 3—EFFECTS OF CHANCING MAGNITUDE OF PntMEABILITY RATIO — kjk,.
PETROLEUM TRANSACTIONS, AIME

fracture orientation varying between N 36° E and N 76° E or ± 20" from the average direction determined using all 55 wells.
RESERVOIR PRESSURE STUDIES-OTHER SPRABERRY AREAS
Early pressures for four other areas in the Spraberry" have been analyzed similarly, and results are included in Figs. 2 and 3. Due possibly to the fact that three of these sets were not truly "initial" pressures of new wells but were pressures measured after as much as two months' production, there is significantly greater deviation between "best fit" calculated pressures and measured pressures than in the previously discussed results based on pressures measured immediately upon completion of new wells. Nevertheless, it is significant that fracture orientations calculated for the Midkiff and North Driver areas are in good agreement with those determined by the Humble' and Atlantic* waterflood tests, respectively. Simflarty there is good agreement between the fracture orientation determined from one pressure analysis and that from the gas-injection test in the Pembrook area.* An attempt to detennine fracture orientation from pressure data of another group of wells near the Pembrook gas-injection test resulted in such very large deviation between calculated pressures and measured pressures that no conclusion is warranted. Quite possibly this is due again to the fact that these pressures were not measured upon completion of the wells but were simply first tests available.
Fracture orientations determined by these various analyses of pressure interference between wells and by water injection and by gas injection are summarized in Fig. 1 and in Table 1. They show a range in direction from N 36° E to N 76° E over an area about 17 miles in length by 15 miles in width. Similarly, the ratio of permeability along the fracture trend to that perpendicular to it ranges from about 6 to 144 or higher.
CONCLUSIONS
Inclusion of anisotropic permeability in analysis of pressure transients in the Spraberry gives somewhat better agreement between calculated pressures and observed pressures of new wells than does assumption of uniform permeability. Close agreement between the
many fracture orientations so determined and those indicated by field injection tests spread over a 15- by 17-mile area demonstrate the anisotropy is real — not merely a chance variation in the statistics. This evidence of wide-spread uniformity of fracture trend is helpful in planning the injection pattern for forthcoming Spraberry water floods.
ACKNOWLEDGMENTS
The authors wish to thank R. E. Collins of the U. of Houston and H. H. Rachford, Ir. of Humble Oil & Refining Co. for advice on the mathematical treatment of transient flow in anisotropic reservoirs. The original derivation of Eq. 1 is included in a book, Flow of Fluids Through Porous Materials, soon to be published by Collins. The authors also wish to thank the Pembrook Unit Operators Committee for permission to publish results of the Pembrook gas-injection fracture orientation test.
Ellen Kilpatrick developed the computer program and performed tbe calculations which serve as the basis for this paper.
REFERENCES 1. Elkins, L. F.: "Reservoir Performance and Well Spacing,
Spraberry Trend Area Field of West Texas", Trans., AIME (1953) 198, 177.
2. Testimony before Texas Railroad CommiMion, (Sept 11-17, 1952) Oil and Gas Docket Nos. 125 and 126, Nos. 7 and 8 — 24360.
3. Bar-field, E. C, Jordan, J. K. and Moore, W. D.: "An Analysis of Large Scale Flooding in The Fractured Spar-berry Trend Area Reservoir", Jour. Pet. Tech.. (April, 1959) XI, No. 4, 15.
4. Elkins, L F.: "Spraberry Waterflood Possibilities", Talk presented to National Oil Scouts and Landmen's Assoc. (June 6, 1958); summary in OU and Gas Jour. (June 30. 1958); World OU (Aug. 1, 1958).
5. Pembrook Unit Operator: Personal Communication. 6. U. S. Bureau of Mines: Report to Southland Royalty Co.
on Radioactive Gas Tracer Survey, Spraberrv Trend, Aid-well Area, Reagan County, Tex. (Feb., 1960).
7. R. E. Collins: Personal Communication.
APPENDIX
The pressure drawdown at the location of a new well due to constant production of another well in an extensive reservoir of uniform thickness having aniso-
TASIE 1—«ACTU« ORIENTATION AND PERMEABILITY CONTRAST. SPRABERRY TREND AREA FIELD Avg. Deviation
Calculated Fracture Ratio of vt Measured
Trend Permeabilities* -Pressures lesi) Midkiff Ana
Humble Water Flood Pressure Analysis (17 walls)
North Driver Area Atlantic Water Flood*** Frouuro Analysis (21 wells)
Pembrook Area Gat Iniection teit Pressure Analysis (16 wells]
Aldwoll Area Radioactive Gas Tracer*
Driver A i o a t Pressure Analysis
35-Wei I Composite 14- Well Davenport A Lease 15- Well Davenport S Loose 13-W.II X. t. Coi and
J . C. Bryant A Leases 12-Well C. J . Can and T.X.L. Loasei
N SO' E N 43* E
N 42* E N 36* E
N 48* E N 62* E
N S3* E
N 56* E N 76* E N 52* E
N 74* N 36'
144 100 to 1000
13 36 6
36 7
•Ratio ot permeability alana major fracture trend te permeability perpendicular to fracture frond.
'"Orientation determined by general partem of reduction of fas-oil ratio and water breakthrough.
tSoe Ref. 1 far identification af
7S.4
53.3
60.6
31.6 24.7 21.4
15.2 14.7
Equivalent • m o b i l i t y "
(md-ft)
443
888 1130 968
1020 481
V O L . 219. 1960 303

O M&SUmlt* 'JO VARIATION 'N " T U M C A S l L ' '
• A S S u U E S A N I S O T R O P I C P C H M E A B I L i T V -
W A j O K T U C N O O R I E N T t O N S 6 * £
X CAL.CUl .ATtO N lT IA l . »P>E&SO*E
D E V I A T I O N • 3% PSI
• \ ' V «
< N O . \
5 N
2*00 Z3O0 2200 2100
MCASUP.C0 PP.CSSUP.C - P * l
Fic. 4—CALCULATED PRESSURE VS MEASURED PRESSURES, DRIVER AREA, SPRABERRY TREND FIELD.
tropic permeability is given by Eq. 1 for conditions of single-phase flow.'
Pi ~ P =
Ei ( -
4WA:.Jfc,/i 1.127 (X - x.)' (y - y.y.
k. 4 / — )
6.32 /
(1)
where p, = initial pressure (psi), p = pressure at x, y at time t (psi), q = production rate (B/D), ji* = viscosity of oil (cp), B = formation volume factor, h = thickness (ft), f = time (days),
c = effective compressibility of oil, water and rock (vol/vol/psi).
4> = porosity (fraction). Ei( - —) = exponential integral,
k, = effective permeability in x direction (darcies),
k, — effective permeability in y direction (darcies),
(JC — x.) = distance from producing well to pressure point in x direction (ft),
(y ~ y.) - distance from producing well to pressure point in y direction (ft), and
1.127 and 6.32 = conversion factors. The pressure reductions at a point due to production of different wells are additive. For uniform permeability, Eq. 1 reduces to the simpler, well known form involving r and k.
Since significant reservoir properties including effective compressibility of rock and its contained fluids and permeability, whether uniform or anisotropic, appear implicitly in this relation they can be determined only by trial solutions until the set of values is found which gives the best match between calculated pressures and measured pressures. Fracture orientation, diffusivity parallel to the main fractures and diffusivity perpendicular to the main fractures are related implicitly in Eq. 1, and geometric mean permeability V* . k, aad'p, are explicit. Determination of the best set of these factors requires the following sequence.
1. Determine x and y coordinates of all producing wells and pressure observation wells.
2. Rotate these coordinates to an assumed fracture orientation since axes in Eq. 1 correspond to directions of maximum and minimum permeabilities.
3. Calculate 2 q Ei ( ) for each pressure observation well using assumed values of diffusivity in the new x and y directions and determine the associated values of Vkjc, and p, by least-squares method.
4. Successively modify the fracture orientation and diffusivities in the x and y directions until a set of values of these factors is found such that any further modification increases the sum of squares of the difference between measured and calculated pressures of the individual observation wells.
3 * 4 P E T R O L E U M T R A N S A C T I O N S . A I M E

T.P. 3622
• J DISCUSSION OF THIS AND ALL FOLLOWING TECHNICAL PAPERS IS INVITED Discussion in writing (3 copies) may be sent to the Editor, Journal of Petroleum Technology, 800 Fidelity Union Bldg., Dollas 1, Tex., and will be considered for publication in the Transactions volume Petro'dum Development and Technology. Discussion will close December 31, 1953. Any discussion offered thereafter should be in the form of a new paper.
RESERVOIR PERFORMANCE AND WELL SPACING, SPRABERRY TREND AREA FIELD OF WEST TEXAS
LINCOLN F. ELKINS, SOHIO PETROLEUM CO., OKLAHOMA CITY, OKLA., MEMBER AIME
SUMMARY
The Spraberry Trend Field of West Texas was discovered in January, 1949. Drilling of 2.234 wells and production of *ome 45 million bbl of oil by January, 1953, indicated this to '•e an important field which will ultimately cover more than 400.000 teres. In addition to being the world's largest field in areal extent, the Spraberry has presented many problems in well completion and operation and has demonstrated unique reservoir performance characteristics.
The pay section consists primarily of a few fine grained sandstone or siltstone members in a thousand-ft thick section of shale, limestone, and siltstone. Since porosity averages only 10 per cent and nearly all permeabilities are less than 1 md. conventional core analysis does not delineate the "pay" section. Mercury injection was used as a capillary pressure test adaptable to rapid routine use to select those intervals having low enough connate water saturation to contain commercially significant oil saturation. In the central area of the field this "pay" amounts to 16 ft of Upper Spraberry and 15 ft of Lower Spraberry sands.
An interconnected system of vertical fractures, observed in cores, provides the flow channels for oil to drain into the wells but most of the oil is stored in the matrix since the void volume of fractures is estimated to be less than 1 per cent of
H in the sand. Initial potentials of wells range up to 1.000 0 after fracture treatment which should be compared with
..imated capacity of 5 to 10 B/D if oil had to flow into the wells through the sand itself.
'Reference* riven »t end of caper. Manuscript received in the Petroleum Branch office Feb. 2, 1953. Paper
presented at the AIME Annual Meeting- in Los Anreles, Calif., Feb. 14-19, 1963.
Without exception initial pressures of later drilled well? were significantly lower than initial pressures of earlier drilled nearby wells in a large area' sbme 6 miles long. This means the earlier drilled wells had drained fluids from areas much greater than their 40-acre proration' units. Since most of this-performance occurred while the reservoir pressure waV above the saturation pressure it was analyzed by the compressible fluid flow theory. This analysis gave calculated initial pressures which agreed within ± 30 psi of measured pressures of 60 per cent of wells in the area using 16-md permeability corresponding to a fracture system substantially that indicated by cores and using combined compressibility of rock and its contained oil and wcter corresponding to the core analysis data. The most important feature of this analysis was the very close agreement between effective compressibility of the rock and its contained oil and water from the field performance and that from the core tests, because it meant there are no "islands" of low permeability reservoir rock left untapped in the inter-well area and thus no additional wells are necessarv to insure that at least one well penetrates each "reservoir."
Twenty-five of forty-fcur 40-acre spaced wells on three contiguous sections were used in a four-month interference test. Six shut-in wells were tested monthly for oil production, productivity index, gas-oil ratio and pressure buildup, and seven shut-in well* were tested for decline in reservoir pressure. Tests on 12 regularly producing wells gave comparative data for interpretation of shut-in test wells. Reduction in reservoir pressure, decline in productivity index, and increase in gas-oil ratio were found to be substantially the same in the shut-in test wells as those in the comparative regularly producing wells, meaning that the producing wells were depleting the
Vol. 198, 1953 PETROLEUM TRANSACTIONS, AIME 177

T.P. 3622 RESERVOIR PERFORMANCE AND WELL SPACING, SPRABERRY TREND AREA FIELD OF WEST TEXAS
M A R T I N C O . ! H O W A R D C O .
!- FIG. 1 — SPRABERRY TREND FIELD, CONTOURS ON TOP OF SPRAIERRY FORMATION.
j 178 PETROLEUM TRANSACTIONS, AIME Vol. 198, 195"
LINCOLN F. ELKINS T.P. 3622
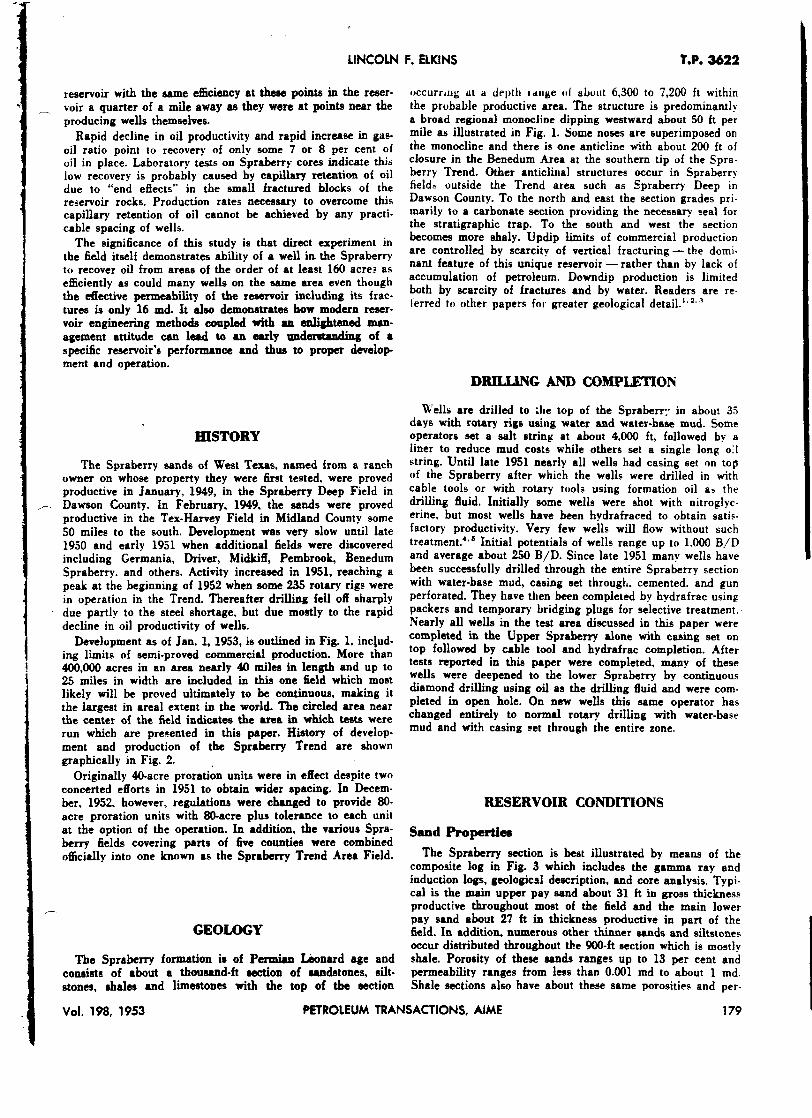
reservoir with the same efficiency at these points in the reservoir a quarter of a mile away as they were at points near the producing wells themselves.
Rapid decline in oil productivity and rapid increase in gas-oil ratio point to recovery of only some 7 or 8 per cent of uil in place. Laboratory tests on Spraberry cores indicate this low recovery is probably caused by capillary retention of oil due to "end effects" in the small fractured blocks of the reservoir rocks. Production rates necessary to overcome this capillary retention of oil cannot be achieved by any practicable spacing of wells.
The significance of this study is that direct experiment in the field itself demonstrates ability of a well in the Spraberry to recover oil from areas of the order of at least 160 acres as efficiently as could many wells on the same area even though the effective permeability of the reservoir including its fractures is only 16 md. I t also demonstrates how modern reservoir engineering methods coupled with an enlightened management attitude can lead to an eaxly understanding of a specific reservoir's performance and thus to proper development and operation.
H I S T O R Y
The Spraberry sands of West Texas, named from a ranch owner on whose property they were first tested, were proved productive in January, 1949, in the Spraberry Deep Field in Dawson County. In February, 1949, the sands were proved productive in the Tex-Harvey Field in Midland County some 50 miles to the south. Development was very slow until late 1950 and early 1951 when additional fields were discovered including Germania, Driver, Midkiff, Pembrook, Benedum Spraberry. and others. Activity increased in 1951, reaching a peak at the beginning of 1952 when some 235 rotary rigs were in operation in the Trend. Thereafter drilling fell off sharply due partly to the steel shortage, but due mostly to the rapid decline in oil productivity of wells.
Development as of Jan. 1, 1953, is outlined in Fig. 1, including limits of semi-proved commercial production. More than 400,000 acres in an area nearly 40 miles in length and up to 25 miles in width are included in this one field which most likely will be proved ultimately to be continuous, making it the largest in areal extent in the world. The circled area near the center of the field indicates the area in which tests were run which are presented in this paper. History of development and production of the Spraberry Trend are shown graphically in Fig. 2.
Originally 40-acre proration units were in effect despite twn concerted efforts in 1951 to obtain wider spacing. In December, 1952, however, regulations were changed to provide 80-acre proration units with 80-acre plus tolerance to each unit at the option of the operation. In addition, the various Spraberry fields covering parts of five counties were combined officially into one known as the Spraberry Trend Area Field.
G E O L O G Y
The Spraberry formation is of Permian Leonard age and consists of about a thousand-ft section of sandstones, silt-stones, shales and limestones with the top of the section
occurring at a depth tange of about 6,300 to 7,200 ft within the probable productive area. The structure is predominantly a broad regional monocline dipping westward about 50 ft per mile as illustrated in Fig. 1. Some noses are superimposed on the monocline and there is one anticline with about 200 ft of closure in the Benedum Area at the southern tip of the Spraberry Trend. Other anticlinal structures occur in Spraberry fields outside the Trend area such as Spraberry Deep in Dawson County. To the north and east the section grades primarily to a carbonate section providing the necessary seal for the stratigraphic trap. To the south and west the section becomes more shaly. Updip limits of commercial production are controlled by scarcity of vertical fracturing — the dominant feature of this unique reservoir — rather than by lack of accumulation of petroleum. Downdip production is limited both by scarcity of fractures and by water. Readers are referred to other papers for greater geological detail. 1 ' 2 , 3
DRILLING AND COMPLETION
Wells are drilled to ilie top of the Spraberry in about 35 days with rotary rigs using water and water-base mud. Some operators set a salt string at about 4,000 ft, followed by a liner to reduce mud costs while others set a single long oil string. Until late 1951 nearly all wells had casing set on top of the Spraberry after which the wells were drilled in with cable tools or with rotary tools using formation oil as the drilling fluid. Initially some wells were shot with nitroglycerine, but most wells have been hydrafraced to obtain satisfactory productivity. Very few wells will flow without such treatment.4,5 Initial potentials of wells range up to 1.000 B/D and average about 250 B/D. Since late 1951 many wells have been successfully drilled through the entire Spraberry section with water-base mud, casing set through, cemented, and gun perforated. They have then been completed by hydrafrac using packers and temporary bridging plugs for selective treatment. Nearly all wells in the test area discussed in this paper were completed in the Upper Spraberry alone with casing set on top followed by cable tool and hydrafrac completion. After tests reported in this paper were completed, many of these wells were deepened to the lower Spraberry by continuous diamond drilling using oil as the drilling fluid and were completed in open hole. On new wells this same operator has changed entirely to normal rotary drilling with water-base mud and with casing set through the entire zone.
R E S E R V O I R CONDITIONS
Sand Properties
The Spraberry section is best illustrated by means of the composite log in Fig. 3 which includes the gamma ray and induction logs, geological description, and core analysis. Typical is the main upper pay sand about 31 ft in gross thickness productive throughout most of the field and the main lower pay sand about 27 f t in thickness productive in part of the field. In addition, numerous other thinner sands and siltstones occur distributed throughout the 900-ft section which is mostly shale. Porosity of these sands ranges up to 13 per cent and permeability ranges from less than 0.001 md to about 1 md. Shale sections also have about these same porosities and per-
Vol. 198, 1953 PETROLEUM TRANSACTIONS, AIME 179

T.P. 3622
45
40
ui
<
RESERVOIR PERFORMANCE AND WELL SPACING, SPRABERRY TREND AREA FIELD OF WEST TEXAS
120
a < too
n
< 3 Z
o <n 30 z o z\ f 25 z o r~ a 20 o a a.
60 O 15 z o o a 40
a. j O „
1949 1950 1951 1952
J
MON1 HLY VI ELL C( IMPLET
\ IONS
/
CUMU .ATIVE NUMBE R OF W EXLS
I J
r i/
DAILY OIL PI WDUCT
\ ION J
vk A
/ 1 v / CUMULA'
/ OIL PRODU •IVE CTION
o 2
.5 f
200 °" 2000 in z fi
100 a. 1000
Q U I Q
FIG. 2 — HISTORY OF DEVELOPMENT AND PRODUCTION, SPRABERRY TREND AREA FIELD.
meabilities. Residual oil saturation in water-base mud cut cores determined by both retort and extraction methods ranges from about 10 per cent to 30 per cent in both shales and sands. Thus, conventional core analysis does not delineate the "pay" section.
Retorting of Spraberry shale at 400* F under vacuum yielded no oil recovery-while retorting of companion samples at 1,000° F yielded recovery equivalent of 10 to 30 per cent of pore space. Vacuum distillation of Spraberry crude at 400° F gave about 50 per cent vaporization. The hydrocarbon material in the Spraberry shale thus is not ordinary crude oil but is probably a highly viscous or even semi-solid residue. It is not a commercial deposit.
Porous diaphragm, centrifuge, and mercury injection capillary pressure methods all give similar values for irreducible water saturation for Spraberry sandstones. Single point mercury injection measurements at 1.300 psi were made to determine those portions of sand which had pores large enough to permit oil entry under conditions of capillarity which probably exist in the reservoir. Typical data are included in Fig. 3 and are labeled irreducible water saturation. Similar tests by commercial service laboratories have been reported as "productive porosity." Arbitrarily selecting "pay" as that section having less than 60 per cent irreducible water saturation limits the main upper sand to an average of 16 ft and the main lower sand to an a-erage of 15 ft. Most other sand
r
FIG. 3-COMPOSITE LOG, SOHIO PROCTOR NO. 1, REAGAN COUNTY, TEX.
180 PETROLEUM TRANSACTIONS, AIME Vol. 198, 1953

LINCOLN F. ELKINS T.P. 3622
Table 1 — Spraberry Sand Properties, Driver Field, Glaascock County, Texas Main Upper Spraberry Sand
Well
Gross* Sand
Section Ft
Net'* Pay Ft
Average Porosity Net Pay Per Cent
Averace Irreducible Water Sat. Net Pay
Beeervoir Pore Vol. Bbl/Acre
Gross Sand
Hydrocarbon Pore Volume Bbl/Acre
Gross Sand Net Sand A 30 18 10.6 28.4 21.650 11,650 10,630 B 36 20 9.1 28.4 24,600 11,650 10,100
c*** 24 15 9.8 19.4 16.550 10,100 9,230 D 29 15 10.1 25.0 20,300 9,150 8,850 E 22 10 10.2 32.8 16,400 6,280 5,280 f**m 17 11 10.4 25.0 12,700 7,530 6,360 G 41 13 9.7 32.0 27,500 8,530 6,750 H 27 17 8.5 25.7 18550 9,080 8,300 I 28 14 8.9 30.6 18,800 8.470 6.670 J 32 23 11.1 37.8 25,800 13,800 12,400
Average 31 16 9.9 30.1 21,600 9.930 8,610
Main Lower Spraberry Sand
A 27 14 9.4 15.2 15,850 9310 8,700 I 36 20 9.9 24.9 23,700 11,800 J 19 10 10.6 9.5 12,100 7,680 7,450
Average 27 15 10.0 16.5 17.230 9,630 9230
•Sandstone and siltstone section by core description. ••Section having less than 60% irreducible water saturation by Mercury Injection Method.
•••Complete section not cored and analysed. Excluded from averages.
FIG. 4 - T Y P I C A L FRACTURES IN SPRABERRY CORES.
FIG. 5 — TOP VIEW OF VERTICAL FRACTURES IN OUTCROP OF BRUSHY CANYON FORMATION.
streaks are too fine grained to contain sufficient oil saturation to be productive in this area but some of these thinner streaks apparently are productive in some parts of the field. Data for ten wells cored in the test area are summarized in Table 1. Values for hydrocarbon pore space for each well on both the gross sand and net sand basis are not products of average values but are summation of values measured individually on a sample of each foot of core.
The unique feature of the Spraberry formation is the extensive vertical fracturing observed in all productive wells cored. Sixty-two per cent of 2,058 ft of cores from five wells in this area had single fractures present and 4 per cent had multiple fractures, some parallel and some intersecting. Fracture spacing laterally is probably of the order of a few inches to a few feet estimated from frequency of fractures observed vertically in the 3.5 in. diameter cores. Typical fractures in cores are illustrated in Fig. 4. The vertical fracture pattern may very well be similar to that occurring in the outcrop of the Spraberry equivalent Brushy Canyon Formation some 70 miles south of Carlsbad, New Mexico, as illustrated in Fig. 5.
One hundred eleven measurements of fracture openings were made on these cores by comparing core diameter normal to the fracture with that parallel to the fracture after matching the core pieces by bedding planes, bit scratches, and fracture irregularities. These fracture measurements ranged up to 0.013 in. and averaged 0.002 in. Some large fractures exist as demonstrated by cement in cores cut below casing but these are infrequent. Productivity of wells indicates some of the fractures must be open because the actual initial potentials of wells often exceed the potential calculated from core analysis permeability by a factor of about 25. Fractures exist in the shales but pressure-production data discussed later indicate
Vertical Fractures
Vol. 198, 1953 PETROLEUM TRANSACTIONS, AIME 181

T.P. 3622 RESERVOIR PERFORMANCE AND WELL SPACING, SPRABERRY TREND AREA FIELD OF WEST TEXAS
per bbl at the 136° F reservoir temperature. Lower Spraberry oil in this area was saturated initially at a pressure of ar-2.535 psi. Formation volume factor is 1.58 and gas in soluv is 1.047 cu ft per bbl at the 144° F reservoir temperature.
Oi l in Place Initially
Tank oil in place initially in the Upper Spraberry, estimated from these various core analysis, fracture opening, and subsurface sample data, is 7,250 bbl per acre on the gross section basis and 6,300 bbl per acre on the net section basis considering only those intervals having less than 60 per cent irreducible water saturation. Similar estimates for the main lower Spraberry sand are 6,150 bbl per acre on the gross basis and 5,900 bbl on the net basis respectively.
FIG. 6 — AVERAGE SUBSURFACE OIL SAMPLE, UPPER SPRABERRY SAND, DRIVER FIELD, GLASSCOCK COUNTY, TEX. TEMPERATURE, 136° F.
M E A S U R E M E N T AND I N T E R P R E T A T I O N O F I N I T I A L P R E S S U R E S IN W E L L S
flow is mainly limited to the sand section and vertical communication through fractures in shale is negligible.
Fracture void volume in the main upper Spraberry sand is estimated to be about 110 bbl per acre based on fracture opening and probable fracture spacing just discussed. Fractures thus contribute little to reservoir void volume but do serve as conduits for flow of oil and gas from the reservoir to the wells.
Properties of Oil at Reservoir Conditions
Subsurface samples of oil were obtained from ten newly completed upper Spraberry wells in this area. Properties of each oil sample at saturation pressure are summarized in Table 2 and average properties at various pressures are presented graphically in Fig. 6. Of greatest significance for analysis of upper Spraberry reservoir performance observed is the approximate 300 psi undersaturation of oil initially. Formation volume factor is 1.385 and gas in solution is 713 cu ft
After hydrafrac treatment each well in the subject area was produced just a few hours for clean up and was then shut in for a minimum of 72 hours prior to measurement <5f reservoir pressure. Production during clean up ranged from 100 to 400 bbl generally. Wells so tested are identified in Fig. 7 and data obtained are presented graphically in Fig. 8 with appropriate corresponding circular symbols. Subsequent 72-hour shv pressures of some producing wells are shown as X's, and . connect pressures of an individual well. Within each closely associated group the later drilled wells had lower initial pressures without exception than did the earlier drilled wells, and in nearly all cases the initial pressures of later drilled wells correspond closely with 72-hour shut in pressures of nearby regularly producing wells. Each later drilled well was at least 1320 ft from any previously producing well, and one, Davenport C-14, in Section 11, was over half a mile from any producing well. This latter well reflected some 130 psi reduction in reservoir pressure at this distance even though it was completed within about three months of the wells first drilled in the area.
This rapid equalization of pressure over such wide area means the fractures observed in cores are a sample of an
Table 2 — Properties of Reservoir OiL Upper Spraberry Sand, Driver Field, Glasscock County, Texas
Well
Reservoir Pressure
Psi (-UOO1
Datum!
Reservoir Temp.
• F
Pressure at
Sampling Depth
Fai
Sat. Press.
Psi
Formation Volume Factor
Gas Sol.
C u F t Per Bbl
Viae, at
Sat. Press. Cent.
Compressibility of
Oil Vol/Vol/Psi
Gravity Residual
Oil •API
A 2330 135 2111 1944 1398 721 0.77 12.7x10-* 37.7 B 2231 136 2110 1982 1.391 719 — 12.0x10' 37.0 C 2263 137 2185 2008 1.362 685 0.66 12.7 x 10 ' 36.6 D 2251 137 2130 2090 1.356 679 0.62 11.9 x 10 ' 37.4 E 2212 138 2109 1797 1365 666 0.78 11.7x10 •« F 2325 137 2111 1959 1396 714 — 12.1 x 10 G 2341 137 2108 2016 1397 726 — 12.0 x 10-' H 2308 136 2175 2124 1.370 740 — 112 x 10- 3'1.6 I 2074 136 1847 1935 1.441 768 — 12.9x10 ' 37.5 J 2218 136 2002 1958 1376 711 — 12.4 x 10 c 37.0 Average 136 1981 1.385 713 .71 12.2 x 10 ' 37.2
182 PETROLEUM TRANSACTIONS, AIME Vol. 198, 1953

LINCOLN F. ELKINS T.P. 3622
MAGNOLIA
• I
ATLANTIC • I
•• •• »W. UNHOCIt.1T
26
S 0 H I O / /
y/ 35
•«
3< •<
GRAPHIC SCALE
2000 4000
K A G N O L I A 3 f ) ATLANTIC 3 8 3 7
I* #« • »
irw. seminytM. tr AL tr. tt. LAmt
ATLANTIC
A a?. *i.mC*. tT AL A T L A N T I C - SINCLAIR
•r. ». oVJrVg. rr AL
AN'LO LAtOOTO
ASMLAM044
7 SOHIO ATI
©. QT ©. G?7
Q* ©» Q> © e.j. cox. ETAL
AtML*-CLCA**N •« •
»l OAflMAO
M O W N
KL CAPITAN - AONLANO • • ««
WHITtHOVtt
• eo 4 0 4 3
CHAM. J. cox
CM AS. J. COX
ATLANTIC
m. M. LAHI. t r At
j . f L O r e SOHIO
•<* o> o* O o o* o o o
0<
o O" O O" o
*.S.OAVtH»OtlT f
SOHIO
o o» O O-
©• ©•
©• ©' » 1 cox »•
SOHIO I
©' ©
©• ©•
©• ©
©< ©' UCMATAMS »
10 SOHIO SOHIO I . ' 2
SOHIO
OHIO
gmwm AtogLLl* ».S.DA>fEH»0*Tf UAPr V. ItrrANS x.i. eox AO»»N OIL A U M W I | 5 SOHIO
€>* ©' © » © • © • © •
€> ©* C* €> €>€>€>•€>•
S.BAVEN0O*T *•
• » 13
HUMGLC
SOHIO
SOHIO
18
X I. COX. ET AL STANOLIND^ ^ 2 2 tTANOLMS 2 3
H * 5 5 j • * • » • ) * tTANOLINO 2t*X
•» ItOMA OA mmocTQA IIOXAAA AAOCTOA LtOMAHC A0OCTOA f.». WILLIAmtS. ETAL
FIG. 7 - G R O U P I N G Of WELLS FOR COMPARISON OF DECLINE OF INITIAL PRESSURE IN WELLS WITH DATE OF COMPLETION.
Vol. 198, 1953 PETROLEUM TRANSACTIONS, AIME 183

T.P. 3622 RESERVOIR PERFORMANCE AND WELL SPACING, SPRABERRY TREND AREA FIELD OF WEST TEXAS
2 4 0 0
S! 2200
2100
UJ 2 0 0 0
JANUARY
19 5 2
FIG. 8-COMPARISON OF INITIAL PRESSURES IN WELLS WITH DATE OF COMPLETION.
extensive well interconnected system of fractures covering this entire area. Since without exception reduced pressures were observed in all later drilled wells in each area, many wells drilled were unnecessary because they did not connect to fractures not already being drained by previously drilled wells.
Since reservoir pressures were above the saturation pressure of the oil until about Dec. 1. 1951, the performance was analyzed by the theory of flow compressible fluids by considering each well as a point sink in an infinite reservoir of uniform thickness, porosity, and permeability, and calculating the pressure drawdown at locations of each new well by Equation ( I ) . 9 - 7
Pa-P = (1)
where:
P., P 0 U
— Initial pressure, psi — Pressure at R at time T — Constant production rate, B/D — Oil viscosity, centipoise
B — Formation volume factor K —Effective permeability, darcys H —Thickness, feet R — Distance, feet C —Weighed average compressibility of oil.
connate water, and rock Porosity, fraction Time, days Exponential integral Conversion factors
Total pressure drawdown is the summation of effects of all producing wells using their appropriate production rates, distances, times on production, etc. Production from 143 wells within three miles of key wells indicated in Figs. 7 and 8 was used in calculation of expected initial pressures of 65 wells completed by Dec. 1, 1951.
Because the correct diffusivity factor is unknown and is in implicit form in the relation it was necessary to assume vari-
and calculate pressures of each
F — T — Ei{) -
1.127. 6.32 —
ous values of UCF
Deviations between measured and calculated pressures shown for three values of diffusivity in Fig. 9 leading to seler-
tion of 2.77 x 10* as the "best" value of based on most UCF
184 PETROLEUM TRANSACTIONS, AIME Vol. 198, 1953

LINCOLN F. ELKINS T.P. 3622
too
50
-SO
g-'OO
f)OA-J Qot -j * « - ' © » - /
j
©'"*»«-'«
o»-> °' "^OA-O
•/ ©w-« Qoo-ia © «-»C
O Qc- 0*-> c-,em) &T-7
1
©o % 3 0A-l*J ^OC-4 ©,-,
oc-t%
9' - ' O'-'
O"
•> ©«•»
- j
ot-n OA-it
W ,00 Jt
so
• J u K 0.
-I < 3 r-U <
3 Z
2 o
K 3
•) W W tt o.
-SO
o u
< 3 - 1 0 0 U
< 100
SO
©'«-/
IK _Q*#-/5_
O
II
•140 - * 4 « -116 -101
o
© M - / O
©"""
%iOA-t
C-t Uot-3 T-t
0'* c-t QQC-A
o - o
'C-T c - j Q ©jr. ,
er-/
©» 0C-*
Qfoc-t
©•»-«
-so
-100
rv II I I .
b
©!*.-/
OM-S cmr-> f -'i
©<«-* 0*»-J ©«.«-//
© f w
Or-/ 3r-©c-r
Qoo-4
©M-7 « © " ©»-r » » - » 0
'0t-7
©'-' €r2e-J
#ec-r
Qa*-// ©'-' 0C-/ sf.
01-11 O - i i .
x u">
n iu.
ado ID
AUGUST S E P T E M B E R . . . OCTOBER 1051
S Y M B O L S C O R R E S P O N D TO F I G U R E 7
DA DAVENPORT 'A' B J . C B R Y A N S 'A'
DB DAVENPORT 'B' C C J . COX
DC DAVENPORT - C X X. B. COX 'A-
T T X L 'A'
NOVEMBER
FIG. 9 - COMPARISON OF CALCULATED INITIAL PRESSURES WITH ACTUAL INITIAL PRESSURES OF WELLS.
Vol. 198, 1953 PETROLEUM TRANSACTIONS, AIME 185

T.P. 3622
Table 3 — Expansibility of Rock, OU and Water Derived f r o m Pressure — Production Analysis
Upper Spraberry Sand
Diffuiivity K Expansibility
UCF Bbl/Acre/Psi
1.58 x 10' 0.186 2.77 x IO4 0.204 4.75 x 10* 0.197
uniform distribution of plus and minus errors on the basis of both time ana geographical distribution. Sixty per cent of calculated pressures are within plus or minus 30 psi of measured initial pressures of wells, which is very excellent considering the working accuracy of pressure gauges in field application, difference in clean-up production and build-up characteristics of wells and the necessary assumption that all wells on each lease had equal production during any particular month.
Average effective permeability in this area was approximately 16 md for the 31-ft gross section as determined by this analysis, corresponding to productivity index of 0.48 B/D per psi and initial potential of 520 B/D. Actual productivity indices ranged from about 0.1 to 2.5 initially and initial potentials ranged from 31 to 960 B/D in this area. This effective permeability in millidarcy-feet is also of the same order of magnitude as that determined by build-up curve analysis in an adjacent area.8 Considering the flow to be primarily in two sets of equally spaced mutually perpendicular uniform fractures permits calculation of average fracture opening by Equation (2) . '
/ 12KS y s
\ 6 - 4 5 x l O V
where W — Fracture opening, inch K — Effective permeability, darcys S — Fracture spacing, inches
For average fracture spacing of 10 in. corresponding to frequency of fractures seen vertically in 3.5 in. diameter cores the fracture opening is calculated to be 0.0015 in. For 4-in. spacing the opening would be 0.0011 in., and for 2-ft spacing 0.0020 in. These calculated fracture openings compare favorably with the average opening of 0.002 in. actually observed in cores.
K KH The factor HCF, obtained by elimination of — from
RESERVOIR PERFORMANCE AND WELL SPACING, SPRABERRY TREND AREA FIELD OF WEST TEXAS
expansibility of rock and its contained oil and water in bbl per acre per psi. Expansibility so calculated is summarized in Table 3 for a three-fold range of diffusivity used in the anal' sis of the pressure-production performance.. I t is significant that the calculated expansibility varies only 9 per cent for this range and thus little error is introduced even though the resolving power of the analysis is not high in selecting the most probable value of the diffusivity factor. The corresponding combined expansibility of rock, oil, and water calculated from core analyses and subsurface samples is summarized in Table 4. Certainly the almost perfect agreement between expansibility calculated from the pressure-production analysis and that from the cores is partly fortuitous because data from individual core wells have an average deviation ;>f ztz 15 per cent from the mean. But the good agreement of all factors in the analysis including calculated individual well pressures, calculated permeability and fracture opening versus well tests and core measurement, and calculated expansibility of rock, oil, and water versus core data must mean these values quite accurately represent average conditions in this area of the field. Close agreement of expansibility of oil, water and rock derived from the analysis with that from cores using only sand intervals probably means production comes only from the sand and vertical migration through fractures in shale is not significant. At least this lack of migration through large vertical intervals was confirmed by a large increase in production when nearly depleted upper Spraberry wells were deepened to the lower Spraberry.
Observation of reduced reservoir pressure initially in all later drilled wells in each area certainly leads to the conclusion that there exists an interconnected system of fractures tapped by all wells drilled. But the almost perfect agreemef between combined expansibility of rock, oil and water derivi
V U
and in Equation (1), multiplied by 7,758 is combined UCF
Table 4 — Expansibility of Rock, O i l and Water Derived f r o m Cores and Subsurface F lu id Samples
Upper Spraberry Sand
O i l Water Rock
Volume Bbl/Acre
10,060 11,650
240,000
Unit Expansibility Vo)/Vol/Psi
12.2 xlO"* 3.2 xlO"' 1J38X10-'»
•Pore Vol. Change/Bulk Vol/Psi.
Gross Exnansion
Bbl/Acre/Psi
0.124 0.037 0.045
0.206
SOMO 2 M l HO ,
<r o* O' •>
•* ©* •» cr •»
* * <r •y ©' *y cr
.'• tr O" a* • r •4 o* i V M 0 9 0 T V r a c e r w /CAfMM * SON to II
<y a '
(j) MU. at sen
L I f l C N O
%mfX -*M PVRWAMCNTLT "
VOIR MCSWRCI ISXAOWRCD cf a ' e* ay O ecu. SMITHN exctrr roe MONTHLY
T C S T OT H M . I I U O S I . MWOUCTtVtTT MOCX fc OAS Oft. RATIO
oy O' O m
I W I ' AATIO
•ROOUCtD RC&ULARLV - Tf HH IM P R C t O U R C t GAS OIL MCASWRSO MOMTHLT
WsODMCfJ NCQULARLT - 71 HR.
•* mvtmmomr x-
ft OAS M L HA TIO H t A W m t t * tJONTML*'
• W K L L fHtOOUCIQ R t f t U L A R L T -OAO Oft. RATIO I t U S I f R C D MONTM*.T
FIG. 10 — KEY TO WELLS IN LARGE SCALE INTERFERENCE TEST.
186 PETROLEUM TRANSACTIONS, AIME Vol. 198, 1953

LINCOLN F. ELKINS T.P. 3622
using only production and initial pressures of wells and expansibility of rock, oil, and water obtained from core analyses idicate the chance is nil that the interwell area has untapped .slands" of reservoir containing commercially significant
amounts of oil. Thus additional wells, and for that matter many existing wells, are unnecessary to insure that each part of the reservoir is permeably connected to some well.
I»S2
JANUARY FEBRUARY MARCH APRIL
INTERFERENCE TEST
In order to continue to observe interference and other features of reservoir performance in the inter-well area, indicated
" initially by reduced reservoir pressure of later drilled wells, Sohio Petroleum Co. obtained permission from the Texas Railroad Commission to conduct a large scale long time interference test. The test area included three contiguous sections of land upon which 44 wells almost completed uniform 40-acre spacing development. Alternate wells in the center rows were shut in and their allowable production transferred to other wells on each lease in such manner as to protect correlative rights among all leases involved in the test area. The test area is outlined in Fig. 10.
Seven of the wells were shut in throughout the test and had . reservoir pressure measurements made monthly. Six of the
shut-in wells had production rate, gas-oil ratio, and flowing bottom hole pressure measured after which they were then shut in for a 72-hour pressure buildup test. Additional spot
isurements of reservoir pressure were made after the wells been shut in for one week and for one month. The wells
..ore then returned to production for a 48-hour test period during which gas and oil production were measured and the flowing bottom hole pressure was measured in each well during the last six hours of the test period. The wells were then shut in again for 72-hour pressure buildup tests and for spot readings of reservoir pressure after shut-in periods of one week and one month, etc. Each of the six wells so tested was shut in for three successive months each followed by the 48-hour production test and pressure tests just described. Shut-in wells so tested are illustrated by appropriate symbols in Fig. 10.
To provide a basis for evaluating the observations in the shut-in wells, various tests were made in regularly producing wells. Seventy-two hour shut-in pressures were measured at monthly intervals in six regularly producing wells. Production rate, gas-oil ratio, and flowing bottom hole pressure measurements followed by 72-hour reservoir pressure buildup tests were conducted at monthly intervals in six additional regularly producing wells. Wells so tested are illustrated by appropriate symbols in Fig. 10. In addition, oil production rate and gas-oil ratio were measured on all regularly producing wells in tbe test area at least once each month.
Decline in Reservoir Pressure
Although the reservoir was below the saturation pressure in X y rea during the interference test, reservoir pressure con-t 1 to decline rapidly due to continued development and duw io rapidly increasing gas-oil ratios. Pressure data of the shut-in wells and of the producing wells are presented graphically in Fig. 11 with appropriate symbols to designate test program of each well. Some of the wells shut in permanently
v A-x Ooc->
' —
•"• Ns
»•-« rs. c-»».
>c-
LEGENO
a — 3 0 OAT SHUT-IN PRESSURE WELL SHUT IN EXCEPT FOR MONTHLY TEST
a ~ 7 2 HR SHUT-IN PRESSURE REGULARLY PRODUCING WELL
B J C BRYANS
C K B COY
WELL SHUT IN PERMANENTLY
D B DAVENPORT "8 DC DAVENPORT 'C
FIG. 11-COMPARISON OF DECLINE IN RESERVOIR PRESSURE, SHUT-IN WELLS VS REGULARLY PRODUCING WELLS.
showed build up in reservoir pressure for a short time, but soon all shut in wells demonstrated significant decline in reservoir pressure at these points 1,320 ft from any producing well. In wells shut in except for 48-hour production tests monthly, the reservoir pressure built up to a maximum and then declined within each 30-day shut-in period. Only the 30-day shut-in pressures of these wells are included in Fig. 12. These wells also demonstrated significant decline in reservoir pressures at points in the reservoir 1,320 f t from regularly producing wells. Shut-in wells had approximately the same rate of pressure decline as did the producing wells and none of the shut-in wells failed to indicate some significant decline in pressure. During March and April, 1952, the pressure declined about 3 psi per day. During May and June, 1952. the rate of decline of reservoir pressure was reduced to about 2 psi per day due to curtailed production during the oil strike.
Reservoir pressures in the test area covered a range of some 500 psi due partly to difference in date of development of various areas and due partly to variations in density of drilling surrounding particular wells. Thus wells on the Davenport "B" lease drilled earlier and most completely surrounded by areas approaching complete development on a uniform 40-acre spacing pattern reflect the lowest reservoir pressure. Such regional variation in reservoir pressure makes it difficult to determine lag of pressure decline in the inter-
Vol. 198, 1953 PETROLEUM TRANSACTIONS, AIME 187

T.P. 3622 RESERVOIR PERFORMANCE AND WELL SPACING, SPRABERRY TREND AREA FIELD OF WEST TEXAS
f c u n t l l u . M A j i K ] .
f l f l l f
• ; f - r -
3 X
X O u
x U .
o U l u z <
ri * 8 8 g
.1 I -4=1-
i I i — r
M l !
OXLfm T«5 ( T 3 I s •
3 X
o a. Z >
z <
o oe
S i Ig
u . t—
2 Z IA> —
1 I I I ? i I I VMM - l M u 3 n O « M
S S - s 8
I I
I I *-
j i
S i 8 '
u H» OC O a. Z ui > -< o
Z < s
< Ui
£ z
! 1 * S 8 S o
CAL«m -««s « . «
Zs
Ml
I C S "
188 PETROLEUM TRANSACTIONS, AIME Vol. 198, 1953

LINCOLN F. ELKINS T.P. 3622
well area behind that of the area close to the producing wells. One good example, however, is Davenport B - l l which had
n shut in long before the test program started. Five of the .fit surrounding wells had 72-hour shut-in pressures meas
ured in March, 1952. Average of these pressures was 1,725 psi or about 40 psi below the 1,765 psi pressure of Davenport B - l l when all pressures were corrected to a common date.
These data show that, on the average, the pressure declined in shut-in observation wells 1,320 f t from any producing well at almost exactly the same rate as it did in the producing wells. As should be expected, the pressure in the shut-in wells was slightly higher than in the nearby producing wells but this lag which ranges at most up to 200 psi indicates depletion of the area of shut-in wells lagged only a few weeks behind the depletion of the area near the producing wells.
Most of the observations of lower initial pressures in later drilled newly completed wells were made while reservoir pressure was above or very near the saturation pressure of the formation ofl. Under those conditions large pressure changes occurred with removal of quite small volumes of oil due to the expansibility of oil above the saturation pressure. These observations during the interference test have shown that without exception production from wells has continued to affect reservoir conditions at points up to at least 1,320 f t away from the producing wells while the reservoir pressure has declined hundreds of psi below the saturation pressure of the formation oil. And this occurred during a period when much larger amounts of oil and gas must be removed to effect reservoir pressure changes due to the much larger expansibility of fluids below the saturation pressure.
iras-OH Ratios and Productivity Indices
In previous discussions of well spacing and recovery efficiency, proponents of wider spacing have often stated that interference between wells demonstrated by changes in pressure means efficient recovery of oil over the distance pressure drawdown was observed. Opponents of wider spacing have argued that reduction of pressure did not necessarily mean recovery of oil. The proponents have had to rely on theoretical considerations involving assumptions which were not acceptable to all concerned. It would indeed be fortunate if methods were available by which a well could be drilled and the oil content of the reservoir determined accurately. The well could then be shut in while other wells are produced and later could be resampled to determine oil recovery from the reservoir by difference. However, such techniques have not yet been developed and it is necessary to rely on indirect observations of depletion such as changes in oil productivity and gas-oil ratios in shut-in wells compared with such changes as occur in regularly producing wells to judge relative recovery efficiency.
As previously mentioned, gas-oil ratios and productivity indices were measured for six wells shut in except for a 48-hour production test each month. Data obtained in the series of tests on each of the wells are presented graphically in Fig. 12A-F, inclusive. With one exception the reservoir pressure in each well reached a maximum and then declined during each 30-day shut-in test period, and all of the wells had significant decline in pressure from month to month as discussed previously. Circled pressure points represent 1, 2. ' and 30 days shut-in pressures. In three shut-in wells the l i l ratio decreased during the first month it was shut in ana in all six shut-in wells it was higher at the end of the four-month test period than it was at the beginning. In five of the six shut-in wells the productivity index was higher following the first one-month shut-in period than it had been
at the beginning of the test. In all of the six shut-in wells the productivity index was lower at the end of the three-month test period than it was at the beginning of the test.
During each 48-hour production test of the shut-in wells, oil production was gauged for the first 24 hours, the next 18 hours, and finally for each of the last six one-hour periods. Flowing bottom hole pressures were recorded during this last six-hour period just prior to shutting in the well for a pressure buildup test. Cas production was measured throughout the 48 hours by orifice meters. Production data and gas-oil ratio calculated for the first 24 hours, the next 18 hours, and the last six hour periods included in Fig. 12A-F. inclusive, show that oil production declined generally and gas-oil ratio increased generally for each of the wells such that 48 hours was insufficient for the wells to be completely stabilized. Thus actual changes in productivity and gas-oil ratios in these shut-in wells probably were more severe than the 48-hour tests indicate. Additional gas-oil ratio and oil production tests were made within one to two weeks after the wells had been returned to regular production and four of the six wells showed further significant increase in gas-oil ratio. Data of these latter tests are included in each well performance chart.
Results obtained in six regularly producing wells tested for comparison are presented in Fig. 13A-F, inclusive. These charts show the oil production rate, gas-oil ratio, and productivity index data along with the flowing pressure and static reservoir pressure measured after 24 hours. 48 hours, and 72 hours shut-in periods. These 72-hour shut-in pressures, summarized in Fig. 11, were discussed previously. Gas-oil ratios of all six of these regularly producing test wells increased during the period and productivity indices of all six of these wells declined significantly throughout the test period.
Productivity indices of all shut-in and regularly producing test wells are summarized in Table 5. The tabulation includes ratio of the last test to the first test of each well to illustrate relative decline in productivity. For the regular producing wells this ratio averaged 0.56 representing 44 per cent decline in productivity during a two month period. For the shut-in test wells this ratio averaged 0.66 representing 34 per cent decline in productivity. As mentioned in discussion of well performance records in Fig. 12A-F these shut in test well' were still declining in production at the end of the 48-hour test following each one-month shut-in period. The last three tests were not comparable to the stabilized test following regular production before the well was shut in but they should be comparable to each other since all were measured at comparable times on production. For the group of shut-in wells the ratio of last productivity index to that measured after the first one-month shut-in period averaged 0.54 representing 46 per cent decline during a two-month period during which only enough oil was produced to test the wells. Production of these six wells during the 48-hour tests totalled less than 2 per cent of production from the four leases involved and average production of each of the shut-in wells was less than 10 per cent of average production of each of the regularly producing wells during the test period.
Reservoir pressure declined about 150 to 185 psi during the test and the corresponding increase in viscosity of oil should have been about 10 per cent from 0.82 to 0.90 cp. Thus, only 10 per cent of the 45 per cent decline in productivity index is attributable to changes in oil viscosity and the remaining 3" per cent must be due to actual reduction of oil saturation in the reservoir. Since over three-fourths of the decline in productivity index observed is due to reduction in oil saturation and since the same percentage decline in productivity index occurred in shut-in wells as did in regularly producing wells, it can only be concluded that a well in the Spraberry effects recovery of oil as efficiently at points in the reservoir at least
Vol. 198, 1953 PETROLEUM TRANSACTIONS, AIME 189

T.P. 3622 RESERVOIR PERFORMANCE AND WELL SPACING, SPRABERRY TREND AREA FIELD OF WEST TEXAS
I I
3
o
X
o u
X u. o I U u z < s ae .
o ,2 o
ip
' M l 1 I I 1 \
'81 ' s1 / i
§ 8 8
3
z < > ac 43
i j
u _; Z s J
I O
i f * / * * * ) / 1*M
[ I I I ! i ! s
«? [1
l i I
i
i 1 1 1
. 1 .
s
i
i 1 1 1
1 I
o
• ! f i
r , •
fi 1 1
-t-1 1
> « I \ \ o
< u
i i
a J
1 1
-t-1 1 I \ \
\ .
i
S t
i 1 1
\ i a 1 \
j t i
3
o
O a. Z I U > <
u .
Z Zt
at
OO u. y ac = £ U 1 s vi? r> a.
! I-
- ' i — i -
i ! I
z ,2 i_
3
o
O a. Z iu > < a
II So iu U a- 3
a at
0 5
I ! f ! f ! S - 9
0 U » » TO t V «
o a. Z iu > <
•-I !
z i ac _ oo s z
< Ot
* * U * 0 0 0 . . -
% I I I !
i i
—A
\\*\ 'i t
4^2-
j t v
•ii
o o. Z iu > <
Z = !
SS
*~ >• 190 PETROLEUM TRANSACTIONS, AIME Vol. 198, 1953

LINCOLN F. ELKINS T.P. 3622
Table 5 — Decline in Productivity Index
ell
Davenport C-6 Davenport C-8 Davenport B-5 Davenport B-7 Cox A-4 Bryans A-2
Well
Davenport C-5 Davenport C-10 Davenport B-8 Davenport B-14 Cox A-5 Bryans A-l
March'
0.187 0.235 0.134 0.105 0.160 0.59
Shut-In Wells Tested Monthly Productivity Index — Bbl/Day/Psi
Apr i l"
0.248 0.269 0.157 0.158 0.140 0.82
May"
0.150 0.185 0.098 0.073 0.099 0.32
June" 0.114 0.176 0.077 0.093 0.087 0.36
Productivity Index -
Wells Produced Regularly
Bbl/D»y/P»i March
0.163 0.219 0.L20 0.056 0365. 0.52
April
0.073 0.133 0.088 0.044 0.202 0.45
May
0.043 0.111 0.070 0.036 0.152 0.49
*Teat taken after regular production before well shut-in. ••Teat taken laat 6 hourt of 48-hour production teat following one month shut-in period.
Ratio June Teat March Test
0.61 0.75 0.57 0.88 0.54 0.61
Average 0.66
Ratio May Test
March Test
Average 0.56
June Test April Test
0.46 0.65 0.49 0.59 0.62 0.44
0.54
1,320 ft from the well as it does from points near the well itself.
Since gas-oil ratios in the Spraberry have increased rapidly after the reservoir pressure declined below 1,600-1,700 psi, it is best to compare gas-oil ratios of the shut-in wells with those ^ the producing wells at common pressures rather than at
unon dates. Gas-oil ratios of the six regularly producing Js having productivity index tests and the gas-oil ratios of
the six shut-in test wells are plotted versus 72-hour shut-in reservoir pressure in Fig. 14. The last gas-oil ratio point for each shut-in well plotted at the lowest reservoir pressure represents the test one to two weeks after the well had been returned to production. It is included because it represents more stabilized production than do the other measurements made during the 48-hour production tests following each one-month shut-in period. Similarly the last gas-oil ratio point for each of the regularly producing wells represents a test in June, 1952, moat nearly corresponding in date to the last tests of the shut-in wells.
Although gas-oil ratios of individual wells varied irregularly during the test, there is good general agreement between the trend of gas-oil ratios of shut-in wells and the trend of gas-oil ratios of regularly producing wells. This is particularly true when it is recalled that shut-in wells were not stabilized within the 48-hour production test following each one-month shut-in period. This is best illustrated by Davenport B-5 and Davenport B-7 wells, whose gas-oil ratios increased from 3,364 to 13,077 cu ft per bbl and from 2,414 to 9,160 cu ft per bbl, respectively, within one to two weeks after the wells had been returned to regular production. These compare with gas-oil ratios 14.250 cu ft per bbl for Davenport B-8 and 11,130 cu ft per bbl for the Davenport B-14 at approximately the same date.
Since change in gas-oil ratio is an index of depletion of oil and since approximately the same changes in gas-oil ratios occurred in the shut-in wells as did in the regularly producing wells, it can only be concluded that oil saturation was reduced
* substantially the same amount in the vicinity of the shut-in s as it was in the vicinity of the producing wells.
.these various comparisons of performance of shut-in wells with performance of nearby producing wells have shown by three indices of depletion, decline in reservoir pressure, decline in productivity index, and increase in gas-oil ratio, that sub
stantially the same reduction in oil saturation was occurring in the vicinity of the shut-in. wells as was occurring in the vicinity of the producing wells. These detailed tests were conducted in an area drilled on a uniform 40-acre spacing pattern so the tests of shut-in wells are limited to points 1.320 ft from some regularly producing well. But the previous observations of reduced pressure in newly completed wells in this same area included many step out developmental wells 1.870 ft from any producing well and one over half a mile from am
L E G E N D
• DAVENPORT *.' C X.S.COX
C DAVENPORT « • B J.C.SRYANS
O SMUT-IN W E L L
1 xee-a
L E G E N D
• DAVENPORT *.' C X.S.COX
C DAVENPORT « • B J.C.SRYANS
O SMUT-IN W E L L
L E G E N D
• DAVENPORT *.' C X.S.COX
C DAVENPORT « • B J.C.SRYANS
O SMUT-IN W E L L
L E G E N D
• DAVENPORT *.' C X.S.COX
C DAVENPORT « • B J.C.SRYANS
O SMUT-IN W E L L
K />••->< L E G E N D
• DAVENPORT *.' C X.S.COX
C DAVENPORT « • B J.C.SRYANS
O SMUT-IN W E L L
h 1" L E G E N D
• DAVENPORT *.' C X.S.COX
C DAVENPORT « • B J.C.SRYANS
O SMUT-IN W E L L r /J
L E G E N D
• DAVENPORT *.' C X.S.COX
C DAVENPORT « • B J.C.SRYANS
O SMUT-IN W E L L / \ 1 / / / /
L E G E N D
• DAVENPORT *.' C X.S.COX
C DAVENPORT « • B J.C.SRYANS
O SMUT-IN W E L L
/ / / / /
L E G E N D
• DAVENPORT *.' C X.S.COX
C DAVENPORT « • B J.C.SRYANS
O SMUT-IN W E L L
/ / I
L E G E N D
• DAVENPORT *.' C X.S.COX
C DAVENPORT « • B J.C.SRYANS
O SMUT-IN W E L L
/ / t c - .
\ \ \ 1
A I-I
g « U - a O l -• e»°s.
' » -I
7 O
3 O
a ooo i*oo leoo ITOO i«oo isoo i*oo itoo STATIC RESERVOIR PRESSURE - PSI. (-4400' OATUU)
FIG. 14 — COMPARISON OF GAS-OIL RATIOS OF SHUT-IN AND PRODUCING WELLS.
Vol. 198, 1953 PETROLEUM TRANSACTIONS, AIME 191

T.P. 3622 RESERVOIR PERFORMANCE AND WELL SPACING, SPRABERRY TREND AREA FIELD OF WEST TEXAS
producing well. There is no reason to believe reduction in productivity index and increase in gas-oil ratio would be limited to distances of 1.320 ft when reductions in reservoir pressures have occurred over much greater distances. From these various observations, it can only be concluded that one well can effect recovery of oil from an area of at least 160 acres in the Spraberry Trend as efficiently as could many wells drilled on the same tract.
G E N E R A L R E S E R V O I R P E R F O R M A N C E
Production History
This extensive program of obtaining cores, subsurface oil samples, initial pressures of each well and the conduct of an extensive interference test in this area has yielded the most complete record of performance of any area in the Spraberry Trend. History of oil production, gas-oil ratio, and reservoir pressure of the 16-well Davenport "B" lease covering Section 2 in this area is presented in Fig. 15. Production began in August, 1951, and reached a maximum in January, 1952. when ful l development on a 40-acre spacing pattern had been completed. During this period average reservoir pressure declined from 2,350 psi initially to about 1,900 psi and gas-oil
3
1 6 0 0
1 9 S 1 A , S | 0 , N 0
1 9 5 2 J , r M A M J , J
' ! 1 1 1
"• cc
= s O V
I/I u
5 3
I <
5 0 0
FIG. 15-RESERVOIR PERFORMANCE, SPRABERRY SANO. DAVENPORT B LEASE (16 WEILS), DRIVER FIELD, GLASSCOCK COUNTY, TEX.
4 S 8 IO CAS OIL RATIO-UCT PCR BARREL
FIG. 16 — RELATION BETWEEN DECLINE IN PRODUCTIVITY INDEX AND GAS-OIL RATIO AND DEGREE OF SEGREGATION OF OIL AND GAS IN FRACTURES.
ratios remained below 1,000 cu ft per bbl at or near the .solution ratio. Cumulative recovery was 170,000 bbl, or 265 bbl per acre. Production declined sharply in March due partlv to some wells being shut in for the test program just described and due partly to some wells being dead and shut in for installation of gas l i f t equipment. Radical changes in reservoir conditions caused production to continue to decline sharply through June when it averaged only 25 bbl per well per day even though additional wells were returned to production each month. In February gas-oil ratios started to increase rapidly such that by June the average gas-oil ratio for the lease was about 9,500 cu f t per bbl and ratios for some wells were as high as 30,000 cu ft per bbl. Reservoir pressure had declined to about 1,400 psi in June and cumulative lease production was only 280.000 bbl. equivalent to 17,500 bbl per well or 440 bbl per acre. Four wells on the lease were deepened to the lower Spraberry, accounting for the increase in production and decrease in gas-oil ratio in July. 1952. Extrapolation of production decline from the upper Spraberry alone on this lease would not indicate future production to be a large percentage of past production, and this points to very low u ' , :
mate recovery in barrels per acre and in percentage of oi place initially.
Other leases in the test area have experienced the same type decline in oil productivity and increase in gas-oil ratio, although such changes have lagged slightly behind that of
192 PETROLEUM TRANSACTIONS, AIME Vol. 198, 1953

T.P. 3622
2400
2200
2O00
in UJ
t ac O
i
600
400
VERSUS
C U M U L A T I V E on. R E C O V E R Y
SPRABERRY SAND -0RIVER FIELD, GLASSCOCK COUNTY, TEXAS
BASED ON PAST HISTORY TEST AREA LEASES
EXTRAPOLATED
OIL RECOVERY - PERCENT OIL
(20
FIG. 1 8 - G A S - O l l RATIO AND RESERVOIR PRESSURE VS CUMULATIVE OIL RECOVERY.
ium hole pressure from say 500 psi to 100 psi when the well is capable of flowing steadily at the higher pressure. Many wells tested under these conditions have flowed at substantially the same rates as they could be pumped.
Gas-Oil Ratio, Pressure and Recovery
Individual gas-oil ratios of the various wells on the test leases are plotted versus reservoir pressure in Fig. 17. Gas-oil ratios remained at. or near the solution gas-oil ratio until the pressure declined below 1,900 psi. With further reduction in pressure they then increased rapidly and averaged about 11,000 cu ft per bbl at 1,250 psi reservoir pressure. Gas-oil ratios of many wells in the test area have increased further to the range of 20,000 to 80,000 cu f t per bbl at reservoir pressure in excess of 900 psi although insufficient pressure data are available to plot the trend accurately.
Because of the rapid changes in Spraberry wells and differences in depletion of the wells, the relation between pressure decline, gas-oil ratio, and cumulative recovery cannot be accurately determined simply by averaging lease data. Such a comparison can be made, however, by material balance methods using the gas-oil ratio - pressure trend in Fig. 17, and the properties of the reservoir oil in Fig. 6. Calculations of percentage recovery of oil were made for increments of pressure decline such that gas-oil ratio corresponded to the average in that pressure range and the material balance was satisfied. Results of these calculations are presented in Fig. 18, which
RESERVOIR PERFORMANCE AND WELL SPACING, SPRABERRY TREND AREA FIELD OF WEST TEXAS
shows calculated gas-oil ratio and pressure versus percentage recovery of oil in place initially. The solid line corresponds with the gas-oil ratio • pressure trend in Fig. 17 and the dashed line corresponds with extrapolation of the gas-oil ratio trend.
This relation between pressure and oil recovery per cent permits an approximate indirect material balance estimate of oil in place initially in the main upper Spraberry sand in the test area. Recovery percentages corresponding to May 20, 1952, reservoir pressures of 18 wells in the three-section test area range! from 2.45 per cent to 6.65 per cent and averaged 5.72 per cent. Combining this recovery percentage with oil in place initially in the main upper Spraberry sand indicates expected recovery of 360 to 415 bbl per acre by May 20, 1952. depending upon whether net sand oil content or gross sand oil content is applicable. Actual recovery of the four leases to that date totalled 735,000 bbl, or 418 bbl per acre on the basis of 40 acres per well.
The comparison cannot be exact because analytical methods have not yet been developed which will account for the complex flow behavior when the reservoir is below the saturation pressure and both free gas and oil are present. Equalization of pressure between the undeveloped area and the test area should be much slower than that observed in newly completed wells during development when the reservoir was above the saturation pressure. Reduction in effective permeability to oil. demonstrated by the two-fold reduction in productivity indices of wells in the interference test, and seven-fold increase in expansibility of the oil-gas mixture when the pressure declines below the saturation pressure should reduce this rate of pressure equalization.
Considering these factors, the agreement between the expected recovery and the actual recovery is good. Not only does this mean that the pressure-recovery relation in Fig. 18 reasonably represents basic performance of the Spraberry, but it also re-affirms the previous conclusion that the fracture system provides permeable contact with all reservoir blocks containing oil. Thus "islands" of reservoir rock containing commercial quantities of oil do not remain untapped by fractures in' the inter-well area.
< o 30
INITIALLY
Unique Reservoir Performance
The relations between gas-oil ratio, pressure, and oil recovery percentage in Fig. 18 show that gas-oil ratios had increased significantly above the solution ratio when only 3 or 4 per cent of the oil in place had been recovered and that they had increased to about 12.000 cu f t per bbl when less than 7 per cent of oil in place had been recovered. Such trend to very high gas-oil ratio at very low percentage recovery of oil is not the performance normally expected in sandstone reservoirs where recoveries are often 15 to 25 per cent of oil in place before high average gas-oil ratios are reached. This performance of the Spraberry results from the unique properties of the reservoir, including the exceedingly fine grained low permeability matrix and the high degree of fracturing. With such conditions, retention of oil within the pores of the rock due to unbalanced capillary forces, well known as end effects in laboratory fluid-flow experiments, is important. Normally this end effect, which may be expressed as a capillary pressure difference, is at most a few psi and it is unimportant when compared with total pressure difference from a distant point in the reservoir to the well bore where the oil and gas must flow the entire length through chains of pores. In the Spraberry where the reservoir rock is divided into segments a few inches to a few feet in size, the total pressure gradient from the center of a block to the fracture face is of
194 PETROLEUM TRANSACTIONS, AIME Vol. 198, 1953

LINCOLN F. ELKINS T.P. 3622
the Davenport "B" lease due partly to later development and due partly to the Davenport "B" lease being most completely surrounded by areas of complete development on the 40-acre spacing pattern.
Decline i n Wel l Product ivi ty
Many factors affecting production change very rapidly in the Spraberry, as indicated by the decline in production of this typical lease and by the decline in productivity indices of various test wells in the interference program. For example, one well near the test area had a productivity index of 0.46 B/D per psi in a test taken within a few days after completion of the well. Two months later in a second test the productivity index declined from 0.23 to 0.09 B/D per psi in a 14-day test while tbe gas-oil ratjo was still less than 1,000 cu
R . S . D A V E N P O R T B L E A S E R S . D A V E N P O R T C L E A S E
X . B . COX A L E A S E J C. BRYANS A L E A S E
DRIVER FIELD, G L A S S C O C K COUNTY, TEXAS
4 0
36
32
23 22 21 20 IB IB 17 IB 15 M 13 12 II R E S E R V O I R P R E S S U R E 100 P S I (AT T O P OF SAND)
FIG. 17 -GAS-OIL RATIO Vii RESERVOIR PRESSURE, PERIODIC INDIVIDUAL WELL TESTS.
ft per bbl. Such decline in productivity is much greater than that corresponding to normal relative permeability - saturation relations.
Since the fracture openings are paper thin, gravity segregation of oil and gas may be very incomplete — particularly in the vicinity of the wells where velocities are highest, where considerable additional gas is being continually released from solution as the fluids flow into the area of reduced pressure, and where tbe converging flow concentrates pressure loss due to friction. With complete segregation of oil and gas in uniform fractures the relative permeabilities to oil and gas would correspond ideally to the relative saturations in the fractures (diagonals of a permeability - saturation plot). With no segregation in the fractures, gas would be transported as bubbles dispersed in the oil phase and the friction effects would be about the same as if only oil were present. Relative permeability to oil would correspond to the fractional composition of oil in the flowing mixture and relative permeability to gas would have no meaning in the normal concept of permeability.
Theoretical productivity index was calculated for each test of the wells in the interference test program both for the case of complete segregation of oil and gas in the fractures and for the case of no segregation of oil and gas using relative permeability - saturation relations just previously defined and using Equation (3 l developed by Evinger and Muskat.10
PI = -2*K.H
iP.-P,) In r,/r„
KJK. dP V B
(3i
Pt
K. P. P, U B r.
where: PI Productivity index K, Specific permeability H Thickness
Effective permeability to oil Static reservoir pressure Flowing bottom hole pressure Oil viscosity Formation volume factor Drainage radius Well radius
Initial productivity indices of these test wells were calculated from initial potential tests, measured initial shut in reservoir pressures, and flowing bottom hole pressures estimated from a simple linear average of tubing pressure versus flowing bottom hole pressure from 16 tests of other new Spraberry wells. Error in flowing bottom hole pressure is estimated to have been less than 100 psi, and pressure drawdown was greater than 500 psi in all but one of the 12 test wells. Actual relative productivity indices, using these as starting points, and theoretical relative productivity indices for 23 tests of the 12 wells are plotted versus gas-oil ratio in Fig. 16. Assumption of no segregation of oil and gas in tbe fractures gives approximately ten times closer agreement with the actual productivity tests than does assumption of complete segregation of oil and gas in the fractures. At gas-oil ratios greater than 5,000 cu f t per bbl actual productivity is consistently greater than that calculated assuming no segregation of oil and gas in the fractures but still many fold less than that assuming complete segregation. Some deviation is not surprising because oil volume fraction of the flowing gas-oil mixture is less than 10 per cent and at least some segregation should be expected.
In addition to explaining the abnormal decline in productivity of Spraberry wells this analysis has one very practical application in considering installation of artificial l if t to increase production rate of flowing wells. This theory indicates only nominal increase in production by lowering flowing bot-
Vol. 198, 1953 PETROLEUM TRANSACTIONS, AIME 193

LINCOLN F. ELKINS T.P. 3622
1 0 0 0
2
2 100
to
ui
z -I o Ui a ui tr 3 CO co Ul tx £L
< rr
10
\
I \ \
0
V,
\ °
o
0
A F T E R B O T S E T & MUS <AT
1 1 A. I .M.E. 193 9 1 1
50 60 70 60 90 100 PERCENT RESIDUAL OIL SATURATION
FIG. 19 —EFFECT OF RATE OF PRESSURE DECLINE ON FINAL SATURATION (SMALL CORE TESTS).
the same order of magnitude as the force of capillary retention and lower recoveries of oil result. The inter-relation between permeability, flow rate, capillary pressure, fluid properties, etc., is complex but the characteristic performance of small samples of reservoir rock is illustrated by an experiment conducted by Botset and Muskat, reported in 1939." These investigators performed experiments in which a small core filled with gas-saturated oil was allowed to produce by pressure depletion at different rates in successive experiments. Results of these experiments are summarized in Fig. 19, which is a plot of residual oil saturation versus rate of pressure decline. With pressure decline of 600 psi per minute, the residual oil saturation was 67 per cent of pore space. At successively lower rates of pressure decline, the residual oil saturation was higher until the pressure decline rate reached about 1.5 psi per minute. Below this rate of production, recovery was independent of rate within experimental limits of accuracy. At high rates of production, the pressure gradient within the core was sufficient largely to overcome the capillary retention of oil. At lower rates of production, the pressure gradient was less and effects of capillarity were more pronounced. At very p^v rates of production, a certain minimum oil recovery was
ned regardless of production rate. This latter phenomenon i t to necessity of removal of enough oil so that gas bubbles
forming within individual pores could grow in size to connect with gas bubbles in adjacent pores such that it could flow readily out of the core. When this equilibrium saturation had been reached the gas flow rate was low enough that the viscous
drag of gas on oil was insufficient to overcome the capillary retention and no more oil was produced.
Since the relation between the various factors involved are very complex and many of tnem not known quantitatively for the Spraberry, similar laboratory experiments were performed directly upon a Spraberry core sample. A core 2 in. in diameter and 6 in. in length was machined to fit closely a steel cylinder. The core containing 28.5 per ceni water saturation was placed in the cell and filled with gas-saturated Spraberry oil from a subsurface sample. Cas and oil were removed from the core at such a rate to result in pressure decline of about 200 psi per minute. The core was removed and oil saturation determined to be 2 per cent by difference in weight between the core with its residual oil and water saturation and the weight of the core with its initial water saturation. Oil recovery was calculated to be 52 per cent of oil in place initially in the core.
After being cleaned, the same core containing 13.4 per cent water saturation was replaced in the cell and again filled with gas-saturated Spraberry crude oil. Withdrawal of fluids was slowed to a constant rate of pressure decline of about 100 psi per day. Residual oil similarly determined by weight difference was 57.5 per cent of pore space and the oil recovery similarly calculated to be 7 per cent of oil in place initially. Data for both tests are summarized in Table 6. Practically all production of oil occurred before pressure declined to 1,000 psi. Thereafter only gas was produced.
Pressure decline of 100 psi per day in the slower experi- i
ment reported is some 30 to 100 times faster than the reservoir pressure decline rate in presently developed areas of the Spraberry Trend, which is of the order of 1 to 3 psi per day. Recovery performance of fracture blocks of size and properties similar to that used in the laboratory experiment should certainly be no better than that of the laboratory core. In addition, recovery performance of blocks a few feet in size at pressure decline rates of the order of 1 to 3 psi should be about the same as that observed in the laboratory core test at a pressure decline rate of 100 psi per day. This is based on assumption from theory of relative permeability and capillarity that similar end effects occur in different sized blocks when production rates are such that total pressure drop from the center to the face of the block is the same in all blocks. Frequency of fractures and opening of fractures observed in cores coupled with determination of reservoir permeability from analysis of the pressure-production relation indicates
Table 6 — Results of Laboratory Experiments Pressure Depletion of Oi l Saturated Spraberry Cores
CORE PROPERTIES Porosity Peraeability Size
8.15% 1.1 md 2.18* diam.x6.1* length
TEST NO. 1 Simulated Connate Water Saturation Saturation Pressure of Crude Oil Average Rate Pressure Drawdown Residual Oil Saturation by Weight Difference Calculated Oil Recovery — Per cent
of Oil in Place Initially
TEST NO. 2 Simulated Connate Water Saturation Saturation Pressure of Crude Oil Average Rate of Pressure Drawdown Residual Oil Saturation by Weight Difference Calculated Oil Recovery — Per cent
of Oil in Place Initially
28.5 % 2000 Pti 200 Psi/Min. 25 %
52 %
13.4 % 1990 Psi 100 Psi/Dav 57.5 %
7 %
Vol. 198, 1953 PETROLEUM TRANSACTIONS, AIME 195

T.P. 3622 RESERVOIR PERFORMANCE AND WELL SPACING, SPRABERRY TREND AREA FIELD OF WEST TEXAS
1. •ALT'
•
* • • '1 r4ff. •
2 4 2 3 2 2 21 2 0 10 18 17 16 15 R E S E R V O I R P R E S S U R E - 1 0 0 RS. I .
( A T T O P O F S A N D )
O
o o-
14
FIG. 20-GAS-OIL RATIO VS RESERVOIR PRESSURE, PERIODIC INDIVIDUAL WELL TESTS. E. D. BERNSTEIN LEASE, R. W. CLARK LEASE, R. PEMBROOK LEASE, PEMBROOK FIELD, UPTON COUNTY, TEX.
CONCLUSIONS
1. Spraberry oil is stored primarily in pores of sand me of very limited section. Paper-thin vertical fractures L
vide flow channels for oil in this extremely low permeability reservoir.
2. That a well can deplete an area of at least 160 acres in the Spraberry as efficiently as could many wells in the same area was confirmed by direct experiment in the field.
3. Capillary "end effects" in the small fractured blocks of rock limit recovery to only a few per cent of oil in place initially.
A C K N O W L E D G M E N T
fracture blacks are probably in this size range, and it appears that this recovery mechanism greatly influenced by capillary retention is the proper explanation of early trend to high gas-oil ratios aad very low percentage recovery of oil in place indicated by performance to date in the Spraberry.
Since most Spraberry wells have been produced at near capacity and very low recovery percentage is indicated even in the areas of 40-acre spacing, no practical method exists by which the rate of pressure decline could be greatly accelerated to achieve more efficient natural recovery.
The possibility that recovery is affected by production rate in the Spraberry cannot be ruled out on the basis of the two Spraberry core tests by analogy to the Botset-Muskat experiments. However, a portion of the Pembrook Field was developed on uniform 80-acre spacing. With proration based on 40-acre units, the production rate per acre in this portion of the Pembrook Field has been half the production rate per acre of the portion of the Driver Field drilled on 40-acre spacing, which has been discussed in this paper. Relation between gas-oil ratio and reservoir pressure for this portion of the Pembrook Field is presented in Fig. 20.
Core analyses, oil characteristics including solubility, shrinkage and saturation pressure, and reservoir pressure initially in this area of the Pembrook Field were very similar to those in the Driver Field. Comparison of data in Fig. 20 with that in Fig. 17 shows the relation between gas-oil ratio and pressure — and thus recovery efficiency — are substantially the -ame for the 80-acre spacing area and the 40-acre spacing area. In addition oil recovery per acre attained when reservoir pressure had declined to 1.650 psi was about the same in both areas. These factors demonstrate reduced withdrawal rate per acre should have no adverse effect on ultimate recovery if the remainder of the field is developed on wider spacing.
Applicability to Entire Field
Reservoir performance data included in this paper come entirely from the two areas outlined. However, reservoir conditions and reservoir performance are qualitatively similar to this throughout the Spraberry Trend. Those readers interested in any other particular area are referred to the testimony presented by W. O. Keller at the recent hearing on the Spraberry Trend.1 2 This includes summaries of core analyses, subsurface sample analyses, potentials and productivity indices of wells, examples of reduced reservoir pre:ssure in later drilled wells, decline curve estimates of ultimate recoveries, etc.. for various areas in the field.
Just as important as the particular facts reported here regarding reservoir performance and well spacing in the Spraberry Trend is the demonstration of co-operation that can be achieved through thorough understanding at all levels from field personnel to corporate management in solving a pressing problem. While space does not permit individual acknowledgment, the tireless efforts of pumpers, pressure unit operators, field engineers and supervisors, laboratory personnel, and others are gratefully appreciated for making the thousands of measurements accurately and on time which made this analysis possible.
The author wishes to express his appreciation tt> the management of Sohio Petroleum Co. for its support in the conduct of this extensive field research program and for its permission to publish the data included in this paper.
REFERENCES
1. McLennan, Lamar, Jr., and Bradley, H. W.: "Spraberry and Dean Sandstones of West Texas," Bull. AAPG, (April, 1951). »
2. Wilkinson, W. M. : "Fracturing in the Spraberry Reservoir, West Texas." Presented at Los Angeles Meeting AAPG, March 28, 1952.
3. Bartley, J. H. : "Geology of the Spraberry Trend of the Permian Basin of West Texas." Presented at Shreveport Meeting API, March 5, 1952.
4. Franklin, Leonard 0.: "Drilling and Completion Practices, Spraberry Trend." Presented at Shreveport Meeting API, March 5, 1952.
5. Spraberry Symposium, Third Oil Recovery Conference. Texas Petroleum Research Committee.
6. Muskat, M. : Flow of Homogeneous Fluids through Porous Media, McGraw-Hill, (1937) 667.
7. Bruce, W. A.: "Pressure Prediction for Oil Reservoirs," Trans. AIME, (1943) 151, 73.
8. Dyes, A. B., and Johnston, O. C : "Spraberry Permeability from Build-up Curve Analysis," Trans. AIME. (1953) 198, 135. (Jour, of Pet. Tech., May, 1953.)
9. Muskat, M. : op. cit., 425. 10. Evinger, H. H., and Muskat, M. : "Calculation of Theo
retical Productivity Factor," Trans. AIME, (1942) 146, 126.
11. Botset, H. G., and Muskat, M. : "Effect of Pressure I tion on Core Saturation," Trans. AIME, (1939) 132, 2.
12. Keller, W. O.: Testimony presented before Texas Railroad Commission at hearing on Spraberry Trend. Sept. 11-17. 1952.
196 PETROLEUM TRANSACTIONS, AIME Vol. 198, 1953

383
Water-imbibition Displacement—A Possibility
for the Spraberry t E . R. BROWNSCOMBE AND A. B. D Y E S *
ABSTRACT The Spraberry formation, although it gives a very
poor primary recovery, would not be suitable for gas or water injection by conventional standards because its high degree of fracturing, coupled with its very tight matrix material, would be expected to cause excessive channeling. However, the Spraberry rock tends to soak up water with the release of oil; and the large fracture system provides a conducting system to bring injected water into contact with large areas of the matrix. This leads to the suggestion of a water-imbibition displacement process for the Spraberry, set up with a pattern of injection and producing wells similar to that for
INTRODUCTION Although the Spraberry trend contains very large
quantities of oil, the rapid decline of the well productivity attended by rising gas-oil ratios has been a cause of considerable concern to operators there. The estimated recovery, which is less than 10 percent of the oil in place, indicates the necessity of I some alternate method of production which will | give a higher recovery. Conventional water flooding is generally recognized to be impractical. This is because most of the oii is stored in a very tight matrix, whereas most of the permeability is the \ result of a large number of fractures. 1 , J' 3' 4 Thus, conventional water flooding with water flowing from the injection well through the matrix to the producing well is out of the question. Channeling would be extremely serious. It would be even more serious for gas injection.
Inasmuch as channeling is inevitable, the thought has occurred that the fracture system provides a ready access to large areas of the matrix; and that, if the fractures were filled with water, natural imbibition, or the tendency of water to soak into rock, might provide an economic means for producing oil from the Spraberry. Early qualitative tests gave support to the idea when it was found that pieces of Spraberry matrix saturated with oil and placed in a beaker of water rapidly formed droplets of oil * The Atlantic Refining Company, Dallas, Tezaa. TPreaented durinc tha Thirty-aecond annual maatlng, Chicago,
J Nov. 1952, Refarencai are at the end of tha paper.
conventional water flooding, but controlled by the "natural-imbibition rate" into the matrix. A unique feature of tbe process is that the produced water-oil ratio will be a function of the water-injection rate and tne imbibition rate rather than solely of the degree of depletion as in conventional flooding.
Laboratory studies on rates of natural imbibition, coupled with estimates of the extent of fracturing, indicate that the process may be carried on at commercially economic rates and that it will result in a threefold Increase in recovery over that for natural depletion. A field test is being undertaken to confirm the feasibility of the process.
over the rock surface. This indicated that the water was imbibing into the rock and the oil was oozing out of the same surface into which the water was entering (Fig. 1). Concept of Process
In the field the process would be somewhat as follows: There would be a set of injection wells and of producing wellsj perhaps in a 5-spot or 9-spot pattern. Near the injection wells the fractures would be well filled with water. This water would be soaking into the matrix causing oil to flow into the fractures and to be carried on to the production wells. Perhaps the process could be visualized a little more clearly in terms of a hypothetical single fracture in which water is injected at one end and production is taken from the other as illustrated in Fig. 2. As the injected water flows toward the producing end, it is soaking into the matrix and releasing oil which takes its place in the flow stream.
If the rate of natural imbibition into the matrix is greater than the injection rate, all of the water will soak into the matrix and only oil will reach the producing end of the fractures. As the process continues, the natural-imbibition rate declines, because of the longer paths of invasion and because of complete invasion of the matrix where fractures are close. As a consequence, water must travel greater distances from the injection well before being completely imbibed. Eventually water reaches the producing wells. At this point, water pro-

«*•;., «....•:.» '.;•«:. -UM*M«K<Mi. 4h<*NBJtll1
384 E. R. BROWNSCOMBE AND A. B. DYES
Fig. 1—Oil Displacement from Spraberry Care by Water Imbibition
Oil globules formed on surface within few hours after oil-saturated core was immersed in water.
duction starts and the water-oil ratio rises as depletion is approached. Any water injected above the rate of natural imbibition will be produced; hence the water-oil ratio is a (unction both of the rate of water injection and of the natural-imbibition rate. This differs from conventional water flooding in which the water-oil ratio is determined by the degree of depletion and not by the rate of injection (in the absence of formation breakdown). After water production begins, it may be desirable to increase the injection rate substantially, hence the percentage of water in the fractures, in order to increase the area of contact between the matrix and the water in the fractures. Although this will increase the produced water-oil ratio, it may also be expected to increase the oil-production rate and may extend the economic life of the well.
Thus, some of the important variables in the imbibition displacement process appear to be: First, the matrix must show preference for wetting by water so that it will imbibe water causing the oil to be displaced from it. Second, the fracture spac
ing must be sufficiently close that the area provided for water, imbibing at the natural rate, is large enough to give an economic rate of production from the reservoir. Third, the displacement efficiency bv natural imbibition must be good enough to give a desirable ultimate oil recovery.
Laboratory Studies
As mentioned previously, the simple test of dropping oil-saturated Spraberry cores into a beaker of water demonstrated that the Spraberry matrix imbibes water readily in the laboratory. To provide quantitative data on the imbibition process, flat plates about \ in. thick were cut from upper Spraberry cores of the Driver area. These were saturated with X-ray opaque phenyl iodide. This material has wetting properties similar to oil and provides the X-ray absorbing medium necessary to follow the rate of advance of the water by means of periodic X-ray shadowgraphs.5 These plates were sealed with an impermeable plastic coating such that imbibition would proceed from one or more of the edges to simulate water being in contact with a section of matrix rock. These plates were permitted to imbibe water freely into the open edges, and periodic X-ray shadowgraphs recorded the position of the water front. Prints of the shadowgraphs, Fig. 3, illustrate the water encroaching into one of the plates displacing the o i l . In this particular case no connate water is present. Other smaller samples in
WATER
MATRIX
FRACTURE -
OIL
DISTANCE
Fig . 2 - Illustration of Oil Production by Water Imbibition
Water is being injected into the fracture only. As the fluid in the fracture moves toward the producing end, water is being lost to the matrix by imbibition and is being replaced by oil until the fracture is
completely filled with oil.

WATER-IMBIBITION DISPLACEMENT-A POSSIBILITY FOR THE SPRABERRY 385
Initial condition: Plate of Spraberry rock, 2.7 x I J x 0.25 in., folly saturated with oil and seated on the top, bottom, and three edges to limit imbibition to the left edge only.
After 21 hours: oil—dark; water-white. After 47 hours.
Fig. 3-Water-imbibition Displacement Flood of Spraberry Rock
which interstitial water was present gave about half this rate of displacement.
In general, tight cores (those of small pore size) give lower rates of imbibition than do loose cores because, although the imbibition force increases as the pore size decreases, the permeability is proportional to the square of the pore size. Thus, overall it might be expected that the rate of imbibition would be proportional to the square root of the permeability (assuming that the contact angle and the geometry of the pores are constant).6 The data in Table 1 suggest that in the Spraberry some of the tighter cores imbibed faster than the looser cores, possibly because of an unusual variation in pore geometry with permeability. In spite of the fact that Spraberry cores are very tight, the rate of penetration under laboratory conditions is substantial, as shown in Fig. 4 for one of the plates. Theoretical considerations based on a constant
average saturation behind the invasion front lead one to expect that the time required for invasion would be proportional to the square of the distance invaded. The laboratory data on several plates confirm this.
Laboratory results on rate of water penetration have been adjusted to correspond to reservoir displacement, taking into account the difference in laboratory and reservoir-oil viscosities and the presence of free gas and connate water. The adjusted curve. Fig. 5, shows that in the reservoir water will completely penetrate a matrix block 1 ft thick within V2 year and even penetrate a block 6 ft thick within 15 years (3 ft penetration from two sides.) If the reservoir performs as well as the laboratory data indicates, the rates of penetration would be sufficient for economic application to the Spraberry.
Quantitative data on the displacement efficiency

386 E. R. BROWNSCOMBE AND A. B. DYES
Tabic 1 Oil Recovery from Laboratory Tests of Water-imbibition Displacement in Upper Spraberry Matrix
Oil Recovery, Time Air Interstitial Percent of of Total Perme Water
Core Initial Oil Imbibition, Porosity, ability, Saturation, No. in Place Days Percent Millidarcys Percent Remarks
1 28.5 T 1 5.63 28.0
2 18.8 7 6.34 35.9 3 27.8 i 9.43 51.0 Plates 4 31.0 7 11.00 13.5 1 xO.75x0.23 in. 5 19.5 7 11.40 12.3 Imbibition 6 35.5 7 11.85 5.6 proceeding 1 40.7 i 12.38 44.6 from all 8 40.3 7 12.66 27.1 sides 9 42.5 i 13.34 27.5
10 31.6 7 13.35 60.5 11 39.7 * 13.95 35.1
12 66.9 4 11.62 13.3 13 54.6 4 11.95 12.6 Plates 14 50.0 4 12.80 38.4 1x0.75 x 0.25 in. 15 54.7 4 12.91 35.1 Imbibition 16 46.3 4 13.27 32.1 into 4 17 59.2 4 13.68 28.2 edges only 18 61.9 4 14.00 29.4 (V4 in. thick) 19 47.1 4 14.40 31.9
Plates 1x0.75x0.25 in.
20 36.0 2 12.38 44.6 Imbibition into 2 21 29.6 2 13.34 27.5 short edges
(V, in. thick)
22 7.0 i 8.03 0.34 45.7 23 24.0 7 8.61 0.25 41.2 24 S6.7 7 8.65 0.37 46.7 25 55.2 7 9.23 0.15 62.5 Core 26 0 7 9.7 0.50 35.9 plugs 27 26.2 7 11.4 0.29 63.3 0.9 in. diameter 28 21.0 7 11.7 0.65 26.4 1 in. long 29 13.8 7 11.8 0.93 38.5 30 34.5 7 11.9 0.56 48.9 Imbibition 31 0 7 12.1 4.9 21.4 into the 32 0 7 12.1 1.6 30.7 two faces 33 17.1 7 12.4 1.50 27.4 34 24.9 7 12.6 0.77 60.7 35 16.4 7 12.8 3.3 24.4 36 18.1 7 12.9 1.00 32.5 37 21.3 7 13.1 0.58 37.2 38 13.8 7 13.3 1.2 38.2 39 15.7 7 13.7 0.96 37.6
Average: 31

WATER-IMBIBITION DISPLACEMENT—A POSSIBILITY FOR THE SPRABERRY 387
1.2
TIME OF IMBIBITION —HOURS
Fig. 4 — Penetration of Water in Spraberry Matrix in Laboratory Imbibition-displacement Experiment
of the imbibition process has been obtained on small plates and on core-plug samples of Spraberry rock which contain interstitial water and which are saturated with o i l . These results are variable, ranging from zero to 67-percent oi l recovery. The average value, resulting from 2 to 7 days of imbibition, is 31 percent. The majority of the recovery occurs within 2 days in the small samples, and this 2-day value is compatible with the rate of imbibition as given by F i g . 5. (These recovery data are shown as a function of core properties in Table 1.) The value of 31-percent recovery behind the imbibing front was used, together with the rate-of-pene-tration curve of Fig . 5, to obtain the rate of oil displacement per unit area of contact of fracture and matrix. It may be anticipated that the presence of free gas in the reservoir w i l l tend to increase the oil-displacement efficiency. 7
As mentioned previously, the success of a natural-imbibition process of this sort depends upon the presence of a large number of interconnected fractures. The problem of estimating the size and number of fractures in the Spraberry has been one of considerable interest. One company cored a directional well in one section of the Spraberry trend and found native fractures 3 to 4 f t apart in the uppermost section of the Spraberry. The Sohio Petroleum Company estimated the average width of the fractures to be 0.002 in . from micrometer measurements on cores. 3 An estimate of the frequency of occurrence of the fractures may be made by comparing the calculated flow capacity of an individual fracture with the in-place permeability of the reservoir (inasmuch as the reservoir permeability is the result of the presence of the fractures). The in-place reservoir permeability may be determined by
a pressure build-up curve analysis. 8 This type of comparison, assuming the fractures are 0.003 in. wide, are vertical, and extend through a pay thickness of 20 f t , gives an average spacing of 3 ft for the average permeability of 30millidarcies. 1 Assuming that the nature of the fractures remains the same, the fracture spacing in specific areas of the region wi l l be inversely proportional to the permeabil i ty of the region. This fracture spacing was used in estimating the matrix surface area available for contact by water. If the smaller fracture width reported by the Sohio Petroleum Companv had been used, the calculated surface area available for imbibition would have been substantially greater.
It has been mentioned that there is some indication that the fractures in the Spraberry are oriented, which might lead to irregular movement of water. An analysis of pressure and production data in the Driver area showed some tendency to drain preferentially in a northeast to southwest direction, but this was not great.
Application to Field
Using the foregoing laboratory data corrected to field conditions, i t is possible to make a preliminary estimate of what the field application of th i s process might do in the upper Spraberry of the Driver area. It appears that the reservoir w i l l imbibe water and displace o i l sufficiently rapidly to maintain the production rate in the neighborhood of 100 bbl of oil per day per well for several years with moderate water production. Segregation of oi l and water in the fractures is anticipated. This wi l l cause the production of water to begin after several months of injection, gradually rising to high water-
TIME OF IMBIBITION — YEARS
Fig . 5-Estimated Linear Advance of the Water Front with Imbibition under Spraberry Reservoir
Conditions In this curve the laboratory data of Fig. 4 is adjusted to take into account the difference in reservoir and laboratory oil viscosities and the presence
of free gas and connate water.

388 E. R. BROWNSCOMBE AND A. B. DYES
• WM ScKcoct
It
.1 ol Basait
• Fraaman
• • • WM Schrock
• 1 For , , !
• ! i
33 W
Atlantic
• |Snewaan . Sargaat I Utittor 1
34
• • i • i
1
35 •
i i •
L o •
1 1 1
• • i • l
h
• !
«
1 • I •
! « • • • •
i • l
h
• ! •
• ! • TP L a * Tr.
« • w.u
• Stnrocft
1 • 1 *
TXL T ». Lgn.J Ti Magnolia
• 40
•> •
Magnolia
• 39
• Atlantic
• 38
Fig. 6 —Location of Water-imbibition Displacement Test in Upper Spraberry Formation, Driver Field,
Sect. 34, R.4S, Block 37 A Injection Wells e Producing Wells
oil ratios as the oil producti. v, declines to the economic limit during a several-year operation. The oil production can be arrived at by estimating the area of the fracture surface in contact with water, calculating the rate of water imbibition into this surface based on the rate of penetration given in Fig . 5, and taking the average oil recovery in the invaded zone as 31 percent. The ultimate recovery is estimated to be about three times that of natural depletion.
Although the results are very encouraging, it should be emphasized that this work is in the purely experimental stage and confirmation in a pilot flood is essential before the process can be considered for field application. The Atlantic Refining Co. is conducting a field test of the water-imbibition displacement process on the Schrock 34 lease. Rater is to be injected into three wells (Fig. 6), and the production behavior of offset and surrounding wells w i l l be analyzed. Ini t ia l ly , 200 bbl of water per day w i l l be injected into each of the wells, this rate being adjusted later depending upon the results obtained during the test.
CONCLUSIONS
1. Laboratory tests indicate that a water-imbibition process should substantially increase recoveries in the Spraberry.
2. In general, for successful operation, this water-imbibition displacement requires:
a. That the o i l be stored in the matrix. b. That the matrix rock be water wet; i.e., im
bibe water and release o i l . c. That the reservoir be highly fractured; i.e.,
the fractures must be sufficiently close to each other to permit water to imbibe into a
substantial fraction of the reservoir in a reasonable length of time.
REFERENCES 'Dyes , A.B. and Johnston, O.C: Spraberry Permeabil
ity from Build-up Curve Analysis, presented at fal l meeting, Am. Inst. Mining Viet. Engrs. (Petroleum Division), 1952.
Elkins, Lincoln F: Unique Reservoir Characteristics, Proc. Third Oil-recovery Conference (1951), Railroad Commission of Texas, Austin, Texas.
3 Fi t t ing, Ralph: Unique Reservoir Characteristics, Proc. Third Oil-recovery Conference (1951), Railroad Commission of Texas, Austin, Texas.
Ogden, Vic, and Locke, John: Core Data Discussions, Proc. Third Oil-recovery Conference (1951), Railroad Commission of Texas, Austin, Texas.
5 Slobod, R. L . and Caudle, B. H: X-Ray Shadowgraph Studies of Areal Sweepout Efficiencies, Trans. Am. Inst. Mining Met. Engrs.fPetroleum Development and Technology) 195, 265 (1952).
6 Calhoun, John C . Jr: Rate of Capillary Displacement, Oil Gas J., 48 [?3J July 7 (1949).
7 Holmgren, C. R. and Morse, R. A: Effect of Free-Gas Saturation on Oil Recovery by Water Flooding, Jour. Petroleum Technology. 135, May (1951).
Miller, C. C; Dyes, A. B; and Hutchinson, C. A. , Jr. The Estimation of Permeability and Reservoir Pressure from Bottom-hole Pressure Build-up Characterist ics , Trans. Am. Inst. Mining Met. Engrs. (Petroleum Development and Technology) 189, 91 (1950).
DISCUSSION
L . E. Elkins (Stanolind Oil and Gas Company, Tulsa): I should like to compliment The Atlantic Refining Company for the original thinking and the laboratory work that has gone into the formulation of their concept of this process, and for their v i sion in proceeding with the pilot project of such an exploratory nature.
The Spraberry no doubt offers a great challenge to the petroleum industry to improve the recovery
| possible by primary production. Early in the development of the idea concerning
the imbibition recovery process, we at Stanolind had some reservations as to whether water imbibition could be a significant factor in oi l recovery from the Spraberry despite the laboratory evidence. The primary reason for these reservations was that the early work was done on cleaned and dried cores, using so-called re stored-state techniques. We have noted great differences on various types of rocks between results from virgin cores and those same cores after cleaning and restoring the assumed original water-wet reservoir saturation conditions. For that reason, we undertook to study the imbibition characteristics of Spraberry reservoir material, using cores cut with o i l , handling

389
them in such a manner as to preserve in place the
or ig ina l connate water, and, insofar as possible ,
preserving the reservoir condit ions of wet t ing . The
cores were s imply completely resaturated wi th
reservoir o i l in the laboratory, water put into con
tact wi th them, and observations made of imbibi
t ion rates and o i l recoveries. In general, our
results agree wi th those obtained by A t l a n t i c .
As has been pointed out bv the authors, now that
it is f a i r ly certain that the Spraberry rock w i l l im
bibe water to displace o i l , and that the rates of
imbib i t ion might be wi th in economic f e a s i b i l i t y ,
further laboratory work can add l i t t l e to the def ini
t ion of the p rac t i cab i l i t y of the process. The Ult i
mate success of the field process, both as to rate
and ef f ic iency , w i l l depend pr imar i ly upon the fre
quency of fractures and the uniformity of the frac
ture svstem in the reservoir . That i s , w i l l an in
jected fluid move uniformly through the entire frac
ture svstem? The actual size of the matrix blocks
would not be important in the ear.y l i f e of such a
process, but would become very important later be
cause the rate of imbib i t ion f a l l s off as the square
of the distance invaded by water. In other words, i f
the Spraberrv f ractures are 1 f t apart, we have a
favorable s i tua t ion ; however, i f they are as far as
10 ft apart, the opposite is true. The i n i t i a l re
sponse, and even the long range rate, of o i l pro
duct ion may be severely res t r ic ted i f the matrix
011 is below-the bubble point and a gas phase is
present. If th is is true, the channels for o i l to flow
out of the matrix as water enters are pa r t i a l lv
blocked wi th gas.
Our concept of this process is a l i t t l e different
from that of A t l a n t i c , but that does not mean much
here because the p i lo t test w i l l prove i t one wav or
the other. However, i f we v i sua l ize these fractures
3 f t apart, the pressure in the middle of the block
is probably higher than that in the fracture . For
the process to work at a l l , the pressure in the frac
ture must be raised un t i l i t becomes equal to the
pressure in the matr ix . T h i s w i l l probably require
that the fracture system be subs tan t ia l ly filled w i th
water before the process can e f fec t ive ly begin.
Then , w i th the fractures filled w i t h water, cyc l i ng
of this water would be necessary to flush out the
o i l d isplaced into the fracture by imb ib i t i on and to
replenish the water supply to those fractures so
that imb ib i t i on could continue. In the p i lo t test , we
suspect the water w i l l probably move through the
f ractures and get to the producing w e l l s before the
imb ib i t i on process del ivers too much o i l out of the
b locks into the fracture system. In the block system
v i sua l i z ed by A t l a n t i c , we bel ieve that the o i l w i l l
flow generally outward from the center of the b locks
to the nearest fracture plane, flowing countercuiTent
to the water being imbibed. The natur : of this displacement process, as we see i t , is sorr.ewh.it different from that i l lus t ra ted in the oaaer.
We suspect that it might have a chance to b» success fu l i f one can in j ec t water and cvcie it through the fractures, keeping the fracture svstem. filled f u l l of water, and do this economically. I h.it is our concept of the wav this w o u k work mech-anical l v.
We believe that p i lo t projects l ike tnis w i l l pr»ve up new methods of secondary oi l recovery for t •• e o i l industry. At lant ic is to be complimented for stepping out wi th such a novel idea in such a compl ica ted reservoir.
L i n c o l n F . E l k i n s (Sohio Petrolei.m Comnanv, Oklahoma C i t y ) : My comments w i l l he l imi ted to only a part of the process. There are : ve c on si d orations which finally w i l l determine the value of the work. F i r s t , w i l l the rock drink water, second, wi! ' . the water expel o i l ; th i rd , can enough of the rock surface be contacted to give a sa t i s fac tory rate; four th , is there a water supply; and f i l t h , what are the economics.
1 knov,' of no Spraberry cores which have been tested bv the manv laboratories throughout the oil industry in the past two or three months since Atlant ic first proposed this process that have not imbibed water. Manv of these tests hav? been made on cores cut wi th o i l so that internal surface propert ies of the cores were altered as ; u ie as poss ib le . In nearly a l l of these tests t i e water displaced some o i l ranging from about t percent of pore space up to 30 or 40 percent of pore space. We have no way of knowing in advance what the final average reduction in o i l saturation would be under field condi t ions .
T h i s process would require suff ic ient water to fil. the void space created bv past product ion, shrinkage, and addit ional production ol o i l achieved by imbib i t ion displacement. Because semi-proved productive acreage of the Spraberrv is of the order of one-half m i l l i o n acres, the water requirement for complete appl ica t ion to the field mav -each one to two b i l l i o n barrels. Cer ta in ly that cannot be supp l i e d by fresh-water sources in West Texas. A possible source of sal t water is trie San Aneelo sand encountered at a depth of some 5 000 f t . This sand has suf f ic ien t volume, as indicated bv electr ic l o g , and mayhave su f f i c i en tpe rmeab i l i t y as indicated by los t -c i rcu la t ion d i f f i c u l t i e s whi le d r i l l i n g the w e l l s so there poss ib ly is an adequate source of water i f the process proves highly desirable .
O i l recovery in the A t l an t i c tests averaged some 20 percent of pore space. I f these ideal results could be achieved in the f i e ld , the addi t ional re-

E. R. BROWNSCOMBE AND A. B. DYES 390
covery might be as much as 1,000 bbl per acre 1
after correction for shrinkage and past production, j Such recovery with probably high l i f t ing costs wi l l certainly not be a bonanza, but it may add hundreds of millions of barrels to our overall recoverable reserves.
The rate of imbibition and final results depend to a large degree upon the spacing of fractures and upon the interconnection of fractures. We cored a number of wells in an area just southeast of Atlantic's field test and found numerous vertical fractures in each well . A l l later drilled wells in the area had substantially lower ini t ia l pressure than did earlier drilled wells in the area, indicating production of the earlier drilled wells had caused interference over wide areas, up to dis
tances in excess of one-half mile from any producing well . Detailed analysis of these initial pressure data indicated the natural fracture system in the interwell area was extensive and interconnected. In my opinion, the spacing of fractures laterally varies from a few inches to a few feet throughout large areas of the field. Fractures may be as much as 10 f t apart in the areas of lowest productivity.
I believe the fracture spacing is very favorable to this process which is now being tried in the field. It should take only a few months to determine whether the rock does imbibe water, but it may be difficult to exactly evaluate the results. However, If i t is a very economical process, we should not have much difficulty in recognizing it as such.
Cyclic Water Flooding the Spraberry Utilizes "End Effects" to Increase Oil Production Rate
LINCOLN f. ELKINS ARLIE M. SKOV MCMteHS AIME
SOHIO PETROLEUM CO. OKLAHOMA CITY, OKLA.
ABSTRACT
First response to large-scale water flooding in the fractured very low permeability Spraberry sand has led to a new unique cyclic operation. Capacity water injection is used to restore reservoir pressure. This is followed by many months production without water injection and the cycle repeated. Expansion of the oil, rock and water during pressure decline expels part of the fluids but capillary forces hold much of the injected water in the rock. At least with reservoir pressure restored and with partial water flood development, field performance has proved this cyclic operation is capable of producing oil from the matrix rock at least 50 per cent faster and with lower water percentage than is imbibition of water at stable reservoir pressure.
INTRODUCTION
The Spraberry Field of West Texas presents unusual problems for both primary production and water flooding. Extensive interconnected vertical fractures in the fractional-md sandstone permitted recovery of oil on 160-acre well spacing, but they made capillary end effects dominant. Primary recovery by solution gas drive is less than 10 per cent of oil in place. The concept of displacement of oil from the sand matrix by capillary imbibition of water has led to field techniques which promise greatly increased oil recovery. Free exchange of laboratory research, reservoir information and results of field pilot tests among the various companies has been very important in development of this technology.
Oriental manneeript received in Society of Petroleum Engineer* office April IE, 196S. Revised mannecript received July 8, 198S. Paper pretested at SPE Permian Baain Oil Recovery Conference held Hay 9-10. 1968 at Midland. Tex.
Five units covering a total of 170,000 acres have been formed for water flooding, and 10 other areas covering an additional 175,500 acres are in various stages of unitization. Part of the Driver Unit reaching fillup first has demonstrated very unusual waterflood behavior and indicated numerous operating problems that will develop within and among the various units.
SPRABERRY ROCK AND PRIMARY PERFORMANCE
The Spraberry, discovered in February, 1949, is a 1,000-ft section of sandstones, shales and limestones with two main oil productive members: a 10-15 ft sand near the top and a 10-15 ft sand near the base. In part of the field some thinner intermediate sands are oil productive, and others are water bearing. All sands have permeabilities of 1 md or less and porosities of 8-15 per cent. Ordinary core analysis and electric and radiation logs are ineffective in differentiating between oil productive and nonproductive sands. Sands capable of containing producible oil are best identified by mercury injection capillary pressure measurement and, in some cases, by core water saturation. About 3,500 wells have been drilled in the 500,000-acre trend.
Vertical fractures were observed in practically all Spraberry cores. Continuity and interconnection of fractures were confirmed by pressure interference among wells during early development.1 Major fractures trend northeast-southwest as indicated by oriented cores and confirmed by five fluid injection tests, by analysis of the pressure transients observed during development,4'* and by three interference tests in the Driver Unit Water Flood reported herein. Fracture spac-
'Referencei given at end of paper.
ing probably averages inches to a few feet.
Spraberry wells typically produced 100-400 BOPD initially after hydraulic fracture treatments. By 1962 oil production had declined to an average of 12 bbl/well/day, near the economic limits of operation. Reservoir pressure had declined from 2,300 psi initially in the Upper Spraberry and 2,500 psi in the Lower Spraberry to 500-1,000 psi. Partial closing of the fractures with declining reservoir pressure is believed to be the cause of such low oil production rates at these relatively high reservoir pressures. Cumulative recovery of 208 million bbl of oil is 80 to 90 per cent of that recoverable by primary means. Performance of the entire reservoir is summarized in Fig. 1.
IMBIBITION WATER FLOODING By 1952 reservoir performance indi
cated low primary recoveries. Most engineers, expecting serious channeling of injected fluids through the fractures, held little hope for secondary recovery. With its extensive background of research on the fundamentals of fluid flow within reservoir rocks, Atlantic's Research and Development Division on short notice in 1952 conceived that displacement of oil by capillary imbibition of water into the rock might significantly increase Spraberry recovery. Laboratory data reported by Brownscombe and Dyes scaled to probable reservoir conditions showed potential waterflood recovery equal to or greater than primary recovery with a 10-15 year flood life.'
A pilot test using three 40-acre injection wells, one central producing well and 18 surrounding observation wells demonstrated technical feasibility of the process. Injection of 1.5 million bbl of water from November 1952 to August 1955 proved water entered the rock and displaced oil
AUGUST, 10<3

from the matrix into the fractures. Water in volume broke into only one producing well.
Within two years gas/oil ratios of 18 wells in a trend northeast-southwest from the input wells declined to less than 2,000 cu ft/bbl from a range of 4,000-125,000 cu ft/bbl prior to injection. Water injection up to 2,000 B/D was insufficient to offset the larger withdrawals of oil and gas in the area. Reservoir pressure continued to decline in all producing wells. Oil production increased in a few wells and decline was arrested in many, but the low average production of 15-20 bbl/ well/day failed to incite significant interest in large-scale water flooding.
With Atlantic's research and pilot test as background, Humble's Production Research Division hypothesized that flooding in a two directional joint system might result in simultaneous conventional water flooding of individual sandstone blocks in series.* With water wet rock, water should preferentially enter the higher pressure upstream face of each fractured block. Laboratory tests confirmed this hypothesis for small core segments. In effect, both capillarity and dynamic pressure gradients across each block of reservoir rock were considered while Brownscombe and Dyes considered capillarity in a more static system.
Humble conducted an 80-acre five-spot Spraberry pilot flood from March, 1955 to March, 1958. The significant differences from the Atlantic test were complete enclosure of a five-spot and threefold greater water injection rate which more than restored original reservoir pressure. Within six months, oil production of the center well increased from 70 to more than 200 B/D. Water injected totalled 3.7 million bbl. The center well produced 117,000 bbl of oil during the test,3 and continued opera
tion increased this to 151,000 bbl by May, 1962. Two former injection wells were returned to production after injection of about 1 million bbl of water each. They subsequently produced about 30,000 bbl of oil each and a third well about 10,000 bbl.'
A computer analysis matched water breakthrough times of the center producing well and observation wells best with assumpion of N50°E orientation of major fractures and 144-fold ratio of permeabilities parallel to and perpendicular to the major fracture trend.
UNITIZATION
Analysis of these pilot test results indicated the major difference between the Atlantic test and the somewhat more successful Humble test was reservoir pressure of the producing wells. Productivity index and pressure build-up measurements during production, and water injectivity and pressure fall-off measurements during injection on the three Atlantic input wells indicated Spraberry fractures were pressure-sensitive — particularly in the vicinity of wells. Quite possibly Atlantic's modest oil production rates were limited by flow capacity of the partially closed fractures and not by rate of imbibition. This interpretation appeared to be confirmed by the Humble center well which produced 200-250 BOPD for six months after the reservoir pressure had been restored to more than 2,300 psi. (It now appears an additional factor might have been chance location of the Atlantic test in an area of lesser fracture intensity and chance location of the Humble test in an area of higher fracture intensity.)
Dependency of oil production rate on reservoir pressure indicated water flooding the Spraberry could not be performed successfully on a local cooperative basis. Large-scale operation
would be necessary to restore reservoir pressure and to permit well patterns to conform with the major fracture trends.
Based upon these pilot flood tests and these interpretations thereof, Sohio undertook unitization of a large segment of the field in September 1957. This resulted in the 59,976-acre Driver Unit becoming effective November 1, 1960. Four other units have been consummated and other areas outlined in Fig. 2 are in various stages of unitization. About 350,000 acres are being considered for unitized water flood. Parts of the Tex Harvey area north of the proposed units are being dump flooded on a cooperative basis.
DRIVER UNIT WATER FLOOD
A nominal 9-section area containing many 40-acre wells, indicated in Fig. 2 and shown in detail in Fig. 3, was selected initially to further define waterflood performance. Simultaneous but separate flooding of the Upper and Lower Spraberry sands was achieved by singly completing producing wells in part of the area and dually completing injection wells. Most input wells are located on N50°E lines conforming to the major fracture trend. Water injection was started in the north area April 1961 and progressed southward through the entire area by July 1961. Injection in tbe Upper Spraberry averaged 1,000 bbl/ well/day by gravity.
Within three to four months water reached many off-pattern north area Upper Spraberry wells, 600 ft from N50°E lines through input wells, when water injection in adjacent wells averaged 70,000 bbl each. Pres-
Fic. 2—EXISTING AND PROPOSED UNITS SPRABERRY TREND AREA FIELD.
8T8 J O U R N A L O F P E T R O L E U M T E C H N O L O G Y

sures in these north off-pattern wells ranged 1,500-2,260 psi in August while central pattern wells not yet experiencing water breakthrough remained in the 558-837 psi range, as shown in Fig. 3. By October water had reached the northern center producing wells and restored pressure to the range of 2,140-2,675 psi in most Upper Spraberry wells surrounded by injection. Most wells were producing 0-25 BOPD with 80-100 per cent water; only three produced as much as 40-60 BOPD.
Water required for fillup in the Upper Spraberry was about 900 bbl per acre. This is in agreement with gas-filled reservoir space created by Unit average production and shrinkage of oil. Actual oil production from wells in this area averaged 1,200 bbl per acre. Since more than half probably came from the Upper Spraberry, fillup should have required injection of 1,250 to 1,650 bbl per acre if all production actually came from the reservoir under those tracts. Cumulative oil production per acre there is twice Unit average and much higher than that of adjacent, less densely drilled tracts. This lower actual fill-up requirement in the more closely spaced earlier drilled tracts, favored by time and the allowable formula, is direct proof of effective drainage over wide areas in the Spraberry, which was inferred from interference test data obtained early in the development of the field.1
Water breakthrough without significant production of oil was not anticipated. The Humble test well had
• * ! « • • a u 2G13^ I * 0 » 1*4 *••»
»OOik4*«-^ 23SC
-if
FftACTgflE TftCNO LESENO
0 u w « s n u i p o o r £ U P P f SPP.AB IN_-
S LOWCA S U A * MOO OUAL COM* I N .
@ COMlNCi.EC M 0 0 V MATCH Su»»l.>
Fic. 3—INITIAL WATERFLOOD AREA PRESSURE, AUG., 1961.
produced 100,000 bbl oil—a nominal 1,250 bbl/acre—from the Upper Spraberry before water production averaged 80 per cent. The Driver flood was, of course, started at a later stage of depletion and a thicker water-saturated zone should have been created around the periphery of each fractured sandstone block. An interference test was conducted in that area in July and August 1961 to verify fracture orientation.
Pressure changes in each of two observation wells, shown in Fig. 4, correlate more nearly with changes in total water injection into the two wells rather than with injection into either adjacent input well. This tends to indicate the major fracture trend there conforms closely to N50°E. Considering injection wells as point sources and assuming anisotropic permeability, mathematical analysis indicates the trend actually may be a few degrees counter-clockwise from that line. This confirmation of fracture trend showed the water breakthrough was characteristic of the Spraberry at that stage of depletion and at high water injection rates. It did not result from selection of a wrong well pattern.
Water injection rates and the 1,000-1,400-psi difference in pressure between off-pattern wells and central-pattern wells in August, 1961 indicated effective permeability of the cross-fracture system was less than 34 md-ft compared with 245 md-ft cross-fracture permeability at higher reservoir pressures.' As a simplified idealization it appeared that this large reduction in fracture permeability resulted in filling each fractured block
of Spraberry rock and restoring reservoir pressure upwards from 1,000-1,500 psi before fractures downstream opened sufficiently to permit significant flow of water into the yet unfilled region. Under these conditions fillup of individual reservoir blocks probably was achieved in days to weeks.
Even using the three month average time of fillup from lines of input wells to the lines of off-pattern producing wells, and assuming 5-ft fracture spacing and 0.1-md effective permeability gives calculated pressure difference of 1.2 psi between the fractures and the center of the blocks. This compares with 0.1-psi imbibition capillary pressure calculated from the laboratory data of Atlantic. Both field and laboratory effective permeabilities might be significantly lower than 0.1 md due to hydration of clay minerals and relative permeability effects. Ratio of field pressure difference to laboratory capillary pressure would be similar to that calculated, although both values may be somewhat higher.
Wider fracture spacing and shorter fillup time would increase pressure, differences in the reservoir proportionately. This order of magnitude contrast between calculated pressure gradients in the blocks of reservoir rock during fillup and the weak capillary pressure tending to cause imbibition of water and expulsion of oil through counterflow suggested that over-injection might have been responsible for the absence of water-flood oil at water breakthrough. It appeared that cessation of water injection to permit capillary forces to become dominant and expansion of the rock and its contained fluids dur-
£3
s — i
£ o
TRACT 36
3*1
T-
I WEU NO. 385 : V '
2000
-TZmZ -—4WELL NO. 3 6 1 — ' '
...
TOTAL-WELLS 3S2&3S4
zU—u—:—;—i—
r WELL NO. 3 4 2 ^ ^
WELL NO. 3S4 U.-J
W 17 18 19 20 21 22 23 24 25 26 2 7 28 29 30 31 ; I 2 3 4 JULY 1961 1 AUGUST
FIG. 4—UPPER SPRABERRY INTERFERENCE TEST, SPRABERRY DRIVER UNIT.
2200 :
2100
1900
ISOO
A D C U S T , 1 9 6 3 B79

ing pressure reduction might aid in expulsion of oil from the rock matrix into the fractures.
To test these hypotheses, water injection into the Upper Spraberry was stopped October 4, 1961, after it bad been averaging 15,000 B/D in the north four lines of input wells. Oil production from the affected area had been averaging 350 B/D at very high water percentage. Within five days oil production increased to 1,050 B/D. Many wells changed from 0-25 BOPD at 80-100 per cent water to 60-120 BOPD with much less water. Composite daily production and injection for the area are shown in Fig. 5. Water production averaged 1,000 B/D on October 11 when metering was started. Within two weeks it declined to 600 B/D although oil production remained at 950 B/D.
Since reservoir pressures were well above that required to re-dissolve the free gas present at the start of the flood, it was to be expected that reservoir pressure would decline rapidly due to production and to leakage to adjacent areas. Fluid levels of six producing wells indicated a drop of 700 psi; and fluid levels of six shut-in injection wells indicated a drop of less than 400 psi in three weeks. Water injection in the Upper Spraberry was resumed October 28 at 4,000 B/D to evaluate imbibition at stable pressure. This rate was approximately in balance with production and leakage from the area. Oil production dropped from 1,000 to 800 B/D.
When water injection was increased to 6,000 B/D November 16, oil production dropped further to 600 B/D. Water production increased soon after water injection was resumed and reached 60 per cent of total fluid by the end of November. Fluid level measurements of three producing wells December 14 showed an average in-
' • - t ^ T — ,
-
_. . . . .
v, * .—^--^j ,—_
Ftc. 5 — WATERFLOOD RESPONSE — UPPER SPRABEBRY TRACTS 9, WV410, 36, 37, 38
AND 58—SPBABERBY DRIVER UNIT.
crease of 3.2 psi per day from October 23 tests. This pressure build-up multiplied by rock and liquid compressibilities indicates average water injection exceeded fluid production and leakage by just 0.5 bbl per acre per day.
In mid-December small pumping units were replaced by larger units on six wells, four idle wells were equipped with pumping units, and two wells were fracture treated. Within a week total oil production stabilized at 750 B/D and water production increased to about 1,900 B/D. The 1,000 B/D increase in total fluid production raised oil production by only 100-150 B/D. Circulation of larger volumes of water through the reservoir did not effect a significant increase in oil production when injection volume was about in balance with production and leakage. Imbibition was controlling.
The difference in performance without water injection and with approximately balanced water injection indicated that higher average oil production rate and lower average water percentage probably could be attained by cyclic operation. Reservoir pressure should be restored by capacity water injection and production should follow without any water injection. This hypothesis was based on the concept that production would be achieved by expansion of the rock and contained fluids during decline in reservoir pressure with capillary forces tending to hold much of the water in the rock. This contrasts with total dependency on capillarity to imbibe water into the rock and to expel oil by counterflow under conditions of pressure balance.
After the decision was made to resume cyclic operation, reservoir performance during January 11-15,
t»T(a HuaCTIS —
<
1 .1. • . . L . !
mmm, - - - - - -
J - - . axrC* MMWCtl 1 — — . :
r
— . — I , — i
Fic. 6—WATERFLOOD RESPONSE — UPPER SPRABERRY TRACTS 74, 75, 76, 77, 78, 79,
80 AND 105—SPRABERRY DRIVES UNIT.
1962 confirmed this hypothesis when sub-zero weather caused a four-day shutdown of source water. Injection into the Upper Spraberry in the four-section area was reduced from 5,000 B/D to 2,000 B/D. Oil production increased from 720 to 1.170 B/D in four days even though some producing wells were not operated due to freeze-up of fuel lines or flow lines. Water injection was resumed January 15, 1962 and increased to 16,000-25,000 B/D within 12 days. Oil production declined precipitately from 1,170 bbl on January 15 to 80 bbl on February 7, about 60 bbl of which came from Lower Spraberry wells producing into the same tank batteries. Every Upper Spraberry well changed to substantially 100 per cent water. Fluid levels showed the reservoir pressure to be 2.100-3,200 psi in most inside wells with an average of 2,400 psi.
On February 7 water injection was reduced from 21,000 B/D to 3,500 B/D and then essentially to zero on February 20. Within seven days oil production increased from 80 B/D to 1,480 B/D. It averaged 1,380 BOPD for the last half of February and declined to about 1.030 BOPD by August, 1962. Water production reached a peak of 4,670 B/D February 8 when all wells were returned to production. It declined more rapidly than did oil production throughout the entire seven-month production period.
Peak oil production rates in February, 1962 were limited by pump capacity with 1,500-3,500 ft of fluid in the annulus in most wells during operation. Central pattern wells continued to be the better oil producers with less water, while off-pattern wells continued to produce larger volumes of water even though no water was being injected into the Upper Spraberry. As reservoir pressures declined, production of most wells became limited by the combination of reduced pressure differential into the wells and by reduction in productivity index due to the pressure-sensitive fractures. Production tests throughout the entire period are listed in Table 1 for a typical group of wells.
Oil production response to cessation of water injection in the Upper Spraberry in February was much poorer on Tracts 38 and 58 than on other tracts in the north area. Injection into the Lower Spraberry was continuing. By March. 1962 it became apparent that water was entering the Upper Spraberry unintentionally through leaks in one or more dually
880 JOURNAL O F P E T R O L E U M T E C H N O L O G Y

TABLE 1—PtODUCTION TESTS—NOBTH WATERFLOOD AREA
Well 376' Well 38S Well 389 Wall 394- Well 398'
BOPD IWFD BOPD BWPD BOPD BWPD BOPD BWPD BOPD BWPO
Sept. 7-27, 1941 7 12C 0 Ocl. 8-11, 1961 95 25 71 Nev. 1 J.Dec. IS, 1961 25 75 22 Dec. 25, 1961-Jon. 10, 1962 15 171 23 Jon. 25-feb. 7, 1962 5 237 0 Feb. 15-28, 1962 98 52 43 April 1-30, 1962 43 21 26 June 1-30. 1962 23 10 23 Aug. 1-31, 1962 16 5 13 Sept- 15-Oct. 10, 1962 0 200 0 Oct. 20-Nov. 15, 1962 60 235 20 Dec. 15, 1962-Jan. 15, 1963 45 35 15 Feb. 1-28. 1963 30 30 34 March 1-31, 1963 IS 18 26 May 1-31, 1963 0 190 0 June 1-30, 1963 19 115 48
'Larger pumping unl l i installed mid-December 1961.
completed input wells. Elimination of these leaks increased oil production of Tract 38 from 160 to 260 B/D and decreased water production from 450 to 280 B/D in two weeks. Similarly, it increased oil production of Tract 58 from 160 to 260 B/D in eight days and decreased water production from 570 to 150 B/D in six weeks. In addition to indicating the need for frequent testing for communication in dually completed input wells, this performance demonstrated again the suppression of release of oil from the Spraberry rock by continuous water injection.
Oil production for this four-section area averaged 1,135 B/D from January 19 to September 1, 1962, including the period of capacity water injection and the period of production without water injection. Water production averaged 1,215 B/D which was equal to 52 per cent of total fluid production. These compare with 755 BOPD and 1,865 BWPD—71 per cent water—from the same wells December 27, 1961 to January 10, 1962 when water injection was about in balance with production and leakage. Cyclic operation with capacity water injection to restore reservoir pressure, followed by a longer period of production without water injection, released oil from the Spraberry rock at least 50 per cent faster with moderately less water production than did continuous injection of water at relatively stable reservoir pressure.
Since the oil production rate of this area had declined to some 15 per cent below the over-all average rate for the first full cycle, capacity water injection was resumed September 1, 1962. Within two weeks most Upper Spraberry wells produced substantially 100 per cent water and were shut in. Oil production declined from about 980 B/D to about 140 B/D, most of which came from Lower Spraberry wells with some from peripheral
175 21 83 23 69 43 100 38 66 17 120 40 119 30 86 15 35 54 10 63 10 91 15 29 98 11 150 33 231 0 226 35 105 15 356 80 91 91 156 52 170 15 40 21 31 74 6 113 14 34 11 16 62 8 122 12 18 11 9 50 8 85 10
215 0 118 0 75 0 110 60 16 145 74 25 114 123 21 12 25 53 4 90 30 27 36 36 28 9 74 21 18 29 29 21 8 68 15 150 0 190 0 135 0 195 72 25 142 26 104 48 154
Upper Spraberry wells producing into the same tank batteries.
When reservoir pressure had been restored from about 1,000-1,600 psi to about 3,000 psi, water injection into the Upper Spraberry was stopped October 11, 1962. Within six days oil production started to increase, and within 11 days it reached 1,200 B/D. Water production declined less rapidly than it did at the beginning of the first full cycle in February 1962 (see Fig. 5). For operating convenience water injection into the Lower Spraberry in this area was restricted to produced water—the Lower Spraberry has not reached fillup. On November 7 water injection into the Lower Spraberry was increased to capacity. Within a week oil production dropped from 1,245 B/D to 1,100 B/D, but the decline in water percentage stopped.
From the pattern of water production it became apparent that water was leaking unintentionally into the Upper Spraberry through one or more dually completed input wells. Injection into the Lower Spraberry was stopped December 2-5, 1962. Within five days water production dropped from 3,000 B/D to 2,200 B/D and oil production increased from 1,080 B/D to 1,235 B/D. On January 5. 1963 a casing leak was eliminated in one input well. San Andres water had been enterine the Upper Spraberry. Water production dropped immediately from 1,875 B/D to 1,525 B/D. Water production was reduced from 73 per cent in late November to 50 per cent by late January by stopping this unintentional injection of water into the Upper Spraberry.
These results reaffirmed the previous observations that continuous injection of water suppressed release of oil from the rock matrix and increased water production—even with injection less than production and leakage from the area. Reservoir
pressure in this area was declining 5 to 10 psi per day during November-December. 1962. The sudden increase in oil production Jan. 23, 1963 was flush production following four frac treatments. Capacity water injection was resumed April 27, 1963, partly due to declining oil production and partly to match timing of expansion of the flood area.
As in previous cycles most Upper Spraberry wells went to 100 per cent water. Oil production of the area dropped to about 175 B/D. Within a month reservoir pressure was restored to the 2,900-3.000 psi range and injection stopped. Within six days oil production started to increase and within 20 days it reached 1,100 B/D. By July, water production declined to 73 per cent—essentially the same as at a comparable stage of the second cycle.
During the first cycle oil production averaged 1,212 B/D with 49 per cent water. Similar production in the second cycle was 973 B/D, after subtraction of oil injected in frac treatments, with 65 per cent water. Part of the additional water production was due to unintentional water injection discussed previously. At the end of April, 1963 water production averaged 41 per cent compared with 36 per cent in late August, 1962 at the end of the first cycle. There is no reason based on performance to date to expect that this cycle of water injection followed by production without injection cannot be repeated successfully many times. Cumulative oil production for Tracts 36, 37 and 38 from the beginning of water injection April 1, 1961 to July 1. 1963, was 315 bbl per acre, mainly from Upper Spraberry.
Without water flood, production during this period would have been less than 40 bbl per acre based on previous trends. Although the water flood recovery to date is less than 17 per cent of the nominal oil production per acre from the center well in the Humble pilot flood, it is equal to 50 per cent of the cumulative primary production of oil per acre for both the Upper Spraberry and the Lower Spraberry in the Driver Unit.
The south part of the initial water flood did not reach fillup in the Upper Spraberry until April, 1962 due to a three-month later start of water injection, larger average input well spacing and emphasis of injection into the north area when water supply was limited. Response to cessation of water injection there, shown in Fig. 6, was not as spectacular as that in
A U G U S T , 1963 881

the north area, Fig. 5, due partly to continuing unintentional water injection in dually completed wells. Reduction of leakage in May, successful fracture treatment of one well, and equipping one idle well for pumping increased area production from 280 BOPD and 800 BWPD in March to 675 BOPD and 970 BWPD in early July, 1962. Production declined to 450 BOPD and 420 BWPD by June 1963. Water injection will be resumed in the near future to start a second cycle.
Water flood applied to about 10 per cent of the Driver Unit area has already increased oil production from 2,516 B/D in September 1961 to 4.082 B/D in June 1962 and to 4,058 B/D in December 1962, declining to 3,420 B/D in June 1963. Monthly oil production history is included in Fig. 1. Further response to this water flood and expansion of the flood to the remainder of the Unit area are expected significantly to increase oil production rate in the future. An additional 15,000 acres is now being placed under flood. Water injection was started in June in the area west and southwest of the initial development. It is scheduled to start in July in the area to the east.
VARJABILITY OF FRACTURES
Numerous features of reservoir performance have yielded some insight into the extent and continuity of the Spraberry fracture system. The significant increase in oil production within five days after water injection was stopped October 4, 1961 provides a measure of fracture volume. Multiplication of the 19-33 psi per day pressure reduction, during the next three weeks, by five days and by compressibility of 0.16 bbl/acre/psi, from the analysis of pressure transients,' indicates fracture volume to be of the order of 25 bbl per acre or less—certainly not more than 50 bbl per acre. Uncertainty of the rate of pressure decline, of relative amounts of oil and water expelled from the rock matrix in those first few days, and of change in oil saturation in the fractures limits the accuracy of this calculation.
Combination of this fracture volume with 3,200 md-ft permeability along the major fracture trend, from early pressure transients, indicates an average fracture spacing of 19 in. assuming uniform fracture openings. Selection of fracture volume per acre, effective permeability and fracture height from reasonable ranges of these factors to maximize fracture
spacing gives a 7 ft average. Alternate selection to minimize spacing gives 4 in. Corresponding average fracture openings are 0.006 in. and 0.003 in. respectively. While the accuracy of this analysis is limited, the fracture openings so calculated are of the same magnitude as direct measurements on cores.1
Similarly, the fracture spacings calculated are within the range indicated by the 66 per cent average frequency of fractures observed in the 3.5 in. diameter cores in the total core interval of many wells, and the 5 ft average fracture spacing observed in cores of one well deviated 75° from the vertical and drilled perpendicular to tbe major fracture trend.
In addition to satisfying curiosity about the reservoir, an estimate of the fracture spacing has a direct bearing on pre-judging effectiveness of water flooding to be expected in various parts of the field. Fracture spacing is very important due to the almost complete dependency of the Spraberry water flood on capillarity as to whether recovery is accomplished by water imbibition at stable reservoir pressure or whether injection is cyclic as described herein.
Doubling the fracture spacing halves the pressure gradient permitted —total difference in capillary pressure at the fracture face and in the center of the matrix block remains constant —and approximately quadruples the time to recover the same fraction of oil in place. Effective permeability calculated from analysis of early pressure transients is twice as high in the area of this water flood as it is in three other areas now being flooded or considered for flood.' Whether the difference is due to fracture opening or fracture spacing or both is not known, but it may indicate that the productive rates per acre which can be achieved in the other areas will be lower.
Numerous well tests and interference tests indicate the variability of the fracture system. Well 541 directly between and on the N50°E fracture trend through injection wells 547 and 598 behaved unusually. After being placed on pump in October. 1961, it produced more than 100 BOPD with 30 per cent water. During the next five months water percentage increased to just 60 per cent, even though complete fillup in the area was being approached. An interference test was conducted using wells 540, 541 and 542 for observation of pressure changes in the Upper Spraberry and input well 547. Bridge plugs isolated
the upper sand from the lower sand in the pressure wells.
After a long period of injection of 1,000-1,300 BWPD in Well 547, stopping input there caused reduction in pressures in Well 540 within five hours and in Well 542 within 13 hours. Pressure in Well 541 built up 550 psi during 13 days following being shut-in itself. No anomalous changes in pressure trend there correlate with the cessation or resumption of water injection into Well 547. The difference in pressure effects in Well 541 from that of Wells 540 and 542 indicates a discontinuity or at least a significant reduction in fracture permeability in the northeast-southwest trend between Well 541 and its direct and diagonal 40-acre offsets. Wells 542 and 540, respectively.
An interference test using Wells 523 and 527 for observation of pressure changes associated with changes in injection in Wells 517 and 524 showed similar behavior. Pressure in Well 523 continued to build-up through a seven-day period after being shut-in with no changes in the trend associated with cessation or resumption of water injection in either adjacent input well. Pressures wefe reduced in Well 527 in association with stopped injection in 517. No set of major fracture trend and permeability ratio parallel and perpendicular to the trend could be found to yield calculated pressures matching the observed pressure changes in Well 527 in detail.
During pressure build-up tests of six of seven low-capacity wells there was a 2.5- to 10-fold increase in slope of pressure vs log At/(t + At) at values of At/(t + At) in the range of 0.003 to 0.15. Normal qualitative interpretation would indicate restriction in permeability in the reservoir at considerable distances from the wellbore. Calculations following Hurst's* and Pirson's* would position these restrictions at distances of 100-200 ft or more if the changes in build-up characteristics actually represent reflections of changes in permeability of the fracture system.
Nine of 12 wells on which productivity indices were measured during a large-scale interference test in 19521
are Upper Spraberry producing wells in the present waterflood area. Total fluid productivity indices of these wells at approximately the same res-ervor pressure, calculated from operating fluid level measurements during the second cycle, indicate no consistent direction of change during the interim. One was 0.05, three 0.4 to
882 J O U R N A L O F P E T R O L E U M T E C H N O L O G Y

0.7, three 1.0 to 1.3, and two 1.5 to 2.0 times the earlier values. It appears that there has not been a general plugging of fractures by deposition of paraffin or minerals.
Capacity water injection into the Upper Spraberry in the north four rows of input wells during tbe second cycle, September-October, 1962, and during the third cycle, May, 1963, restored reservoir pressures there to about 3,000 psi but had no effect on production of the south area (see Fig. 6). In addition to confirming the general northeast-southwest trend of major fractures it also demonstrates the much lower permeability of the cross fractures.
OPERATING PROBLEMS
By July, 1962, 11 Upper Spraberry producing wells had been re-fractured with 10,000 gal of water or crude oil and 20,000 lb sand. Nominal fracture areas computed by the method of Howard and Fast10
were 50,000 sq ft. About half the treatments were moderately successful and the remainder unsuccessful in achieving sustained increases in productivity. Six other tight wells were fraced with 27,000 gal crude oil and 16,000 lb ceramic beads in one case, 1,500 lb sand and 6,300 lb walnut hulls in the others. Nominal fracture areas were 100,000-150,000 sq ft. All treatments were successful in increasing total fluid production rate by 50-100 per cent at comparable periods late in the production cycle; however, oil production rates of these wells averaged only 15-30 bbl/well/day in March, 1963.
Apparently the propping agents were not placed far enough back in the reservoir to offset restriction of production by closure of natural fractures when reservoir pressure is reduced. Achieving higher production rates at the lower reservoir pressures late in the production phase of the cycle remains an unsolved problem.
The cyclic operation which results in a reduction in reservoir pressure of the order of 1,000-1,500 psi in a matter of months requires frequent balancing of pumping units to keep stresses in the various components of the systems within safe limits while still achieving maximum lift. The moderate to low productivity indices of Spraberry wells cause operating well bottom-hole pressures to be reduced below the present saturation pressure of oil. Free gas reduces sucker rod pump displacement efficiencies. Typical maximum production rates of wells equipped with API
Class 320 pumping units, 1 Vi in. diameter pumps, and 1 in., % in. and % in. tapered rod strings, have been 125 BOPD with 50 BWPD. In the latter part of the production phase of each cycle production is limited in most cases by well capacity, not artificial lift capacity.
Water supply in the Spraberry area is limited to shallow Trinity sand fresh water used for domestic and ranching purposes, brackish Santa Rosa, and corrosive San Andres sulfur water. Although some Trinity water is being used in three Spraberry floods, it is not definite that the billion bbl or more required for flooding the entire field can be obtained from this source. The Santa Rosa has proved inadequate in the Midkiff Unit flood. No reduction in capacity or pressure has been observed in the San Andres water supply in the Driver Unit.
The 300 ppm hydrogen sulfide content of the San Andres water has created two problems: contamination of the Spraberry gas and corrosion. The sour gas problem in the present waterflood area has been solved temporarily by segregation of that gas and delivery to one plant in the area having sweetening facilities. For the expanded flood, hydrogen sulfide will be extracted from the water by coun-tercurrem contacting of San Andres water with oxygen-free flue gas in units similar to that in the nearby Pegasus field." Cement lining of the source water gathering system and the water injection system has been quite effective in reducing corrosion during the first two years operation of the Driver flood. Plastic lining of tubing in the water supply wells and in the input wells has been less successful. Extraction of hydrogen sulfide from the water may reduce corrosion along with eliminating contamination of the gas.
The intake capacity of water injection wells in the Upper Spraberry has been adequate, with surface pressure
. ranging from vacuum to 150 psi. However, the cyclic operation and effects of pressure-sensitive fractures on productivity make it desirable to increase the reservoir pressure beyond that possible with a gravity flood. Adding an additional 500 psi, for example, will increase the reduction in reservoir pressure from 1,000-1,500 psi to 1,500-2,000 psi during the production period of each cycle. The total oil production per cycle will probably be increased more than proportionately since the short period of high water production following water injection should not be signifi
cantly extended by this greater pressure. The increased productivity of wells due to larger fracture permeability at higher reservoir pressures and greater pressure differential into the wells should be equally significant.
LOWER SPRABERRY PERFORMANCE
Cumulative injection of water into the Lower Spraberry was about 1,000 bbl per acre by July, 1963. The lesser injection per acre there compared with the Upper Spraberry resulted from one-third less input wells, lower intake capacity of individual wells and emphasis on achieving fillup in the Upper Spraberry when water supply was limited. No significant effects of injection have been noted in any Lower Spraberry producing wells. No well produces more than 10 BWPD. This lack of response is to be expected. Fillup will probably require injection of more than 2.000 bbl per acre, compared with only 900 bbl per acre in the Upper Spraberry. The difference results from a 700 psi higher saturation pressure and higher formation volume factor for oil 'in the Lower Spraberry. No pilot water-flood tests have been conducted in the Lower Spraberry sand and fillup has not yet been achieved there in other Spraberry units.
The properties of the sand matrix and the presence of vertical fractures in the Lower sand are similar to those of the Upper sand. It is expected that flood performance of the two may be similar although it is likely that 011 recovery per acre will be less in the Lower sand due to the greater shrinkage that has already occurred.
COOPERATION BETWEEN UNITS
The various features of the Spraberry waterflood performance reported herein require considerable cooperation between adjacent units to achieve highest production rates and greatest ultimate recovery of oil in each unit. Lines of injection wells conforming with the major fracture trend should be continuous across the unit boundaries. If not, water injection in each unit will tend to water-out producing wells between the lines of injection in the other unit. Both units will be losers. To a lesser extent, but still important, it is desirable that the cycles of injection of adjacent units be in phase with each other. If not, injection in one unit will suppress release of oil from the sand matrix in the adjacent unit and will
A U C U S T . 1 9 6 3 883

cause high water cuts and lower oil production rates in wells Vi to 1 mile or more beyond the unit boundary.
This has been demonstrated by unintentional injection in the Upper Spraberry by leaks in dually completed input wells and a casing leak in the present Driver flood. When conditions are reversed and water is being injected into the alternate unit, oil production will be suppressed in the first unit. Again, both units would be losers. To the extent that lease-holdings, practicalities of operation and other factors permit, it is desirable that the voluntary Spraberry units be as large as possible to minimize these reductions in waterflood efficiency.
ACKNOWLEDGMENT
The authors thank the working interest owners in the Spraberry Driver Unit for releasing the performance data included herein and thank Sohio
Petroleum Co. for permission to publish this paper. Both the Atlantic Refining Co. and Humble Oil and Refining Co. should be commended for sharing the results of their research and pilot tests with other Spraberry operators. These tests have led to water flooding being undertaken in many parts of this large field.
REFERENCES
1. Elkins. L. ¥.: "Reservoir Performance and Well Spacing. Spraberry Trend Area Field of West Texas", Trans. AIME (1953) 198, 177.
2. Barfield. E. C Jordan, J. K. and Moore. W. D.: "An Analysis of Large-Scale Flooding in the Fractured Spraberry Trend Area Reservoir", Jour. Pet. Tech. (April 1959) X I , No. 4, 15.
3. Elkins, L. F. and Skov. A. M . : "Determination of Fracture Orientation From Pressure Interference", Trans. AIME (1960) 219, 301.
4. Elkins, L F.: "Spraberry Waterflood Possibilities", Talk presented to National Oil Scouts and Landmen's Assoc. (June 6, 1958); summary in Oil and
Gas Jour. (June 30, 1958) and World OU (Aug. I , 1958).
5. Brownscombe. E. R. and Dyes, A. B.: "Water-imbibition Displacement — A Possibility for the Spraberrv", Dril l , and Prod. Prac. API (1952 ) 383.
6. Graham, J. W. and Richardson. J. G.: 'Theory and Application of Imbibition Phenomena in Recovery of Oil", Trans. AIME (1959 ) 216, 377.
7. Dublin, J. R., I l l : Testimony before Railroad Commission of Texas, Mav 16. 1962. Docket Nos. 125 and 126, Nos. 7 and 8, 48118.
8. Hurst, W., Haynie, 0. K. and Walker, R. N . : "Some Problems in Pressure Build-up", SPE paper 145. Fall Meeting, Dallas, 1961.
9. Pirson, R. S. and Pirson, S. J.: "An Extension of the Pollard Analysis Method of Well Pressure Build-up and Drawdown Teste", SPE paper 101, Fall Meeting, Dallas, 1961.
10. Howard, G. C. and Fast. C. R.: "Optimum Fluid Characteristics for Fracture Extension", Dril l , and Prod. Prac. API (1957) 261.
11. Weeter, R. F.: "A Practical Solution to Preparing a Sour Water for Injection", SPE paper 582, Regional Meeting, Midland, Tex. (May, 1963). * • *
884 JOURNAL OF PETROLEUM TECHNOLOGY

FIELD CASE
HISTORY
Progress Report on Spraberry Waterflood Reservoir Performance, Well Stimulation and Water Treating and Handling
L F. ELKINS A. AA. SKOV ». C. COULD
MlMUtS AIMS
Abstract
Comparison of long term decline in oil production during cyclic -waterflooding or pressure pulsing of part of the Driver Unit with steady injection-imbibition flooding in the Tex Harvey area led to large expansion of flood in the Driver Unit on the steady injection basis. While the flood has been successful, the major problem has been attainment of satisfactory oil production rates in most of the wells. Large volume fracture treatments of low capacity
'r were unsuccessful in achieving sustained increases in , duction. A two-section area in the Driver Unit has already recovered 620 bbl of oil per acre by waterflood but other areas have not performed so well.
San Andres water containing 300 to 500 ppm H£ is sweetened to 0.5 to 1 ppm H£ by extraction with oxygen-free flue gas. This prevents contamination of gas produced in the area and apparently it has reduced corrosion in minimum investment, thin-wall, cement-lined water distribution systems. Cement-lined tubing in injection wells has mitigated corrosion as effectively as thick polyvinyl chloride films have, and at less cost.
Introduction
As reported in the literature,*"* the Spraberry field of West Texas has presented unusual problems for both primary production and waterfiooding. Earlier information from the Spraberry Driver Unit included conception and evaluation of cyclic waterfiooding or pressure pulsing in a nine-section pilot test as an aid to extraction of oil from the tight matrix rock and as a boost to normal capillary imbibition forces.' An additional 5 years* operation m that area, and performance of expanded steady injection water-flood, now covering a total of 68 sq miles, are reported herein. In addition, since the Driver Unit is one of the largest waterfloods in areal extent in the U. S., many opcrat- -ing experiences are presented for the benefit of engineers concerned with operation of other Spraberry floods or with other waterfloods where this reservoir technology and/or w*ter handling technology may be adaptable in part These
.iginal manuscript received in Society of Petroleum Engineer* office Ang. 14, 1967. Reviled manueeript received Aoa;. 1. 19SS. Taper (SPE 1809) w u presented at SPE 42nd Annual Fall Meeting; held tn Houston. Tex.. Oct. 1-4. 1967, and at SPE Production Technology Symposium held In Lubbock. Tex.. Nov. 16-17. 19(7. O Copyright 19W American Institute of Mining:. Metallurgies!, and Petroleum Engineers, Ine.
•References given at end of psper. This psper will be printed in Trantaetioni voramc 243. which will
cover 1968.
SOHIO •fTHOLEUAn CO. OKLAHOMA CITY, OKLA.
MIDLAND, rex.
include: (1) attempts to improve producing well capacity through large volume fracture treatments, (2) long-term performance of water treating plants utilizing oxygen-free flue gas to extract H.S from sour San Andres water, (3) performance of thin-wall cement-lined pipe in water distribution systems including comparison between those sections carrying raw San Andres water and those carrying treated water, and (4) comparison of performance of various lining materials and subsurface equipment in water supply and water injection wells. These experiences are reported without regard to whether results are good, bad or indifferent. Since the operations reported are limited to the techniques, materials, and equipment actually used in the Driver Unit, no comparison is possible with results of other approaches used in other Spraberry floods or in waterfloods generally under different conditions. However, an attempt is made to quantify these experiences as much as possible in the space available to permit other engineers to select those parts applicable to their problems.
Background
The Spraberry, discovered in Feb., 1949, is a 1,000-ft section of sandstones, shales and limestones with two main oil productive members—a 10- to 15-ft sand near the top and a 10- to 15-ft sand near the base, having permeabilities of 1 md or less and porosities of 8 to 15 percent. Extensive interconnected vertical fractures permitted recovery of oil on 160-acre spacing from this fractional-millidarcy sandstone, but they made capillary end effects dominant. Primary recovery by solution gas drive is less than 10 percent of oil in place, with most wells declining to oil production of a few barrels per day when reservoir pressures are still in the range of 400 to 1,000 psi. Partial closing of the fractures with declining reservoir pressure is believed to be the cause of such low production rates at these relatively high reservoir pressures.
In 1952 Brownscombe and Dyes proposed that displacement of oil by capillary imbibition of water from the fractures into the matrix rock might significantly increase oil recovery from the Spraberry, overcoming otherwise serious channelling of water through the fractures.* A pilot test conducted by the Atlantic Refining Co. during 1952 through 1955 indicated technical feasibility of the process; but low oil production rates averaging 15 to 20 bbl/well/D failed to create significant interest in large-scale waterfiooding at that time.' Humble Oil & Refining Co. conducted a highly successful 80-acre pilot test during 1955 through 1958 with
S E P T F M f i n R . T<>68 1039

the center well producing 117,000 bbl of oil during the test period and 151,000 bbl by May, 1962.' Following injection of about 1 million bbl of water each, two former input wells produced about 30,000 bbl of oil each and a third well about 10,000 bbl.
In April, 1961, water injection was begun in lines of input i wells in a nominal nine-section test area of the Sohio-oper- j ated Driver Unit. The wells are aligned parallel with the I northeast-southwest major fracture trend indicated generally in the Spraberry by oriented cores, by pilot injection tes is'4 and by analysis of pressure transients observed during initial development." With high injection rates, fillup was achieved in a Tew months in parts of the test area and the interior wells produced small volumes of oil with 80 to 100 percent water, contrary to the experience of the Atlantic and Humble isolated pilot tests. Analysis indicated that rate of water injection into individual blocks of reservoir rock matrix greatly exceeded the natural imbibition rate; this caused oil to be pushed into the center of the blocks rather than to move to the fractures by counter-flow. An entirely new operating technique was conceived whereby after reservoir fillup and pressure buildup were achieved, water injection would be stopped and production continued. Expansion of the reservoir rock and its contained fluids would provide the drive, and capillary end effects would retard expulsjon of water from the fractured matrix blocks' A field test of this hypothesis involving 39 producing wells in 4 sq miles resulted in a spectacular increase in oil production from 350 to 1,050 B/D in 5 days followed by a gradual decline in both oil and water production rates as reservoir pressure was depleted.
Status of Spraberry Waterfloods
Between July 1. I960, and June I, 1967, twelve units covering 277,000 acres were formed in the Spraberry field for waterflood. Fig. 1 shows the Unit areas and that of a cooperative waterflood operated by Mobil Oil Corp. and others. At their various effective dates the units had a combined cumulative primary oil production of over 145 million bbl from 2,214 wells, an over-all average of 525 bbl/ acre. Comparison of current oil production rate, peak oil production, and that at the time of unitization shows quite varied responses to waterflood among the units. As of the first quarter 1968, average oil production rates of the various units ranged from 5 to 20 B/D per operated producing well. (See Table 1.) In part, this range of production rates reflects differences in timing and degree of develop-
I
Fig. 1—Waterflood Units, Spraberry Trend Area field. West Texas.
TABLE 1—SPRABERRY TREND AREA WATERFLOOD UNITS Cumulative BOPD/
Total Oil Production Flood Unit Production (BOPD) Producing Well Date Wells (M bbl) Water first peak 1st qtr first peak 1st qtr
Operator Unit Unitized Acres Unitized Pre-Unit Total Source 3 mo. month 1968 3 mo. month 1968 Southland Aldwell 7-1-60 18,250 139 12,540 16,055 Trinity 1,670 1,901 555 16.2 15.6 8.3 Humble Midkiff 9-1-60 23,568 219 10,384 15,112 Santa Rosa 1,863 2,225 1.180 13.9 19.5 12.2 23,568
& Trinity Sohio Driver 11-1-60 60,296 554 33,916 44,105 San Andres 2,620 5,171 3.575 7.9 16.1 .12.0 Phillips N. Pembrook 7-1-62 23,160 207 11,089 12.997 Trinity 801 1.094 836 7.0 11.0 10.6 Humble Pembrook 4-1-63 43,031 243 11,915 13.720 San Andres 821 1,411 1,209 6.7 15.5 14.2 Mobil Shackleford 1-1-64 28,731 209 15,053 17,589 Trinity 1.778 1.812 1,720 9.6 14.7 14.5 Mobil Preston 6-1-64 17,038 174 12.735 14,539 Trinity 1.066 1,946 1,907 9.1 22.4 21.9 Cities Merchant 10-1-64 22,400 155 12,641 13,454 Trinity 730 741 535 5.3 5.4 5.2
Service -Humble Tippett 4-1-65 1,600 9 240 388 Trinity 98 182 146 15.4 22.7 18.3 Getty Nunn 7-1-65 9.560 92 8.889 9,438 San Andres 332 694 558 5.4 9.9 7.4 Humble Sherrod 8-1-66 8,800 41 2,345 2.487 Trinity 232 299 272 7.3 8.8 8.1 Marathon Benedum 6-1-67 20,440 172 13.355 13.561 Ellenburger 668 767 657 6.8 8.0 7.1
277,144 2,214 145.102 173,445 12.679 18,243 13.150 8.7a 14.2» 11.4' 'Average.
i f v t o J O T ' U N A I . O F P F T P O f F t ' * ! T E C H N O L O C Y

ment of the floods; but undoubtedly it also reflects effects M some significant differences in the reservoir itself —
;e of depletion, variations in water saturation and nat-~.al water influx, variations in fracture intensity, variations in relation of well pattern to fractures, etc. — not readily discernible through analysis of well and primary performance dau. In the Driver Unit, with which this report is primarily concerned, oil production was increased from 2,620 B/D at the time of unitization, to peak production of 5,171 B/D in Oct. 1965; and in June, 1968, it averaged about 3,370 B/D. This compares with an estimated 650 B/D current production without waterflood based on extrapolation of previous decline in production (Fig. 2). About 73 percent of the Driver Unit area is being subjected to waterflood. The major problem in this and all Spraberry floods is attainment of satisfactory oil production rates in a large percentage of wells.
Water Sources Water from a number of sources has been used in Spra
berry waterfloods. Santa Rosa sand water with about 15,000 ppm total solids occurring at about 1,000 ft was used initially in both the Mobil dump flood and the Midkiff Unit, but the supply rate and ultimate volume proved inadequate. Shallow Trinity sand water with about 2,000 ppm total solids has been used as a supplementary source in these two floods and as the only source in seven other Units. The third major source is the San Andres dolomite at 4,000 ft containing salt water with about 92,000 ppm total solids and about 300 to 500 ppm H.S. Raw San Andres water was used in the Humble pilot waterflood and in
initial nine-section development of the Driver«Unit, sn oil production response occurred in the Driver test,
sufficient H,S had been transferred to the oil in the reservoir and thence to the gas at the surface to contaminate the gas beyond -marketable limits. This local problem was solved by segregating the affected wells and connecting them to a gasoline plant having gas-sweetening facilities.
One important consideration in selection of source water for the floods is sensitivity of the Spraberry sand permeability to water salinity. In laboratory analyses of a few fresh cores cut and preserved in produced oil, one operator found that effective permeability to Trinity water was only 22 to 66 percent of the effective permeability of companion cores to San Andres water. This reduction in matrix permeability has no bearing on injectivity because injectivity is controlled largely by the native and artifically induced fracture systems. No difficulty has been encountered in injecting any of those waters into the Upper Spraberry
Fig. 2—Primary production and waterflood performance. Spraberry Driver Unit.
S E P T E M B E R , 1 9 6 8
at desired rates either by gravity or at moderate surface pressures. However, reduced effective permeability has a direct bearing on the rate of oil expulsion from the rock matrix to the fractures by the water imbibition mechanism. Unless clay swelling increases the capillary imbibition force by a ratio at least equal to the fractional reduction of effective permeability, the rate of oil production by the imbibition process must necessarily be reduced. We are not aware of any laboratory tests of the total imbibition process conducted under simulated reservoir conditions for complete evaluation of source water.
The operators of some units feel that the sensitivity of matrix permeability to water salinity is such an important factor that it takes precedence over economic considerations. For this reason, they use the more expensive sweet-ned San Andres water rather than fresh water. The Driver Unit uses oxygen-free flue gas to extract H,S from San Andres water, just as the Pembrook Unit uses engine exhaust gas, catalytically treated to remove oxygen and nitrogen oxides. The Nunn Unit uses recirculated natural gas to extract H.S from the water and an amine unit to extract H-S from the gas. The Benedum Unit is using Ellenburger water initially. All other Spraberry units use Trinity water. Since the performance of wells and areas within individual units using the same water is so variable, it is unlikely that the best water can be determined unequivocally through a comparison of performance of the different units.
Extended Analysis of Cyclic Flooding
Early performance of cyclic waterfiooding in the initial development area of the Driver Unit has already been reported." In that 8,700-acre area (Area 1, Fig. 3), injection was segregated into the Upper Spraberry and Lower Spraberry; 57 wells produced only from the Upper, 12 wells only from the Lower, and 23 producing wells had the two zones commingled. The north half of the area was subjected to three full cycles of injection and production following earlier short cycles and experiments of balanced injection and production. Data for this four-section area are presented in Fig. 4. A detailed map of the area is presented in Fig. 3 of Ref. 5, and data in Fig. 4 herein are an extension of Fig. 5 of RefT f. Pertinent dau for these three cycles are summarized in Table 2. Each time following high-rate water injection, the peak oil production rate
TABLE 2—RESERVOIR PERFORMANCE WITH CYCLIC WATERFLOOD—NORTH HALF OF INITIAL
DEVELOPMENT AREA, SPRABERRY DRIVER UNIT First Second Third Cycle Cycle Cycle
Capacity water injection started 1-15-62 9-1-62 4-27-63 Capacity water injection stopped BOPD before injection*
2-7-62 1011-62 5-29-63 Capacity water injection stopped BOPD before injection* 1,170 980 825 BOPD at end of injection* 80 140 175 Days to recover oil production BOPD after recovery period*
7 11 20 Days to recover oil production BOPD after recovery period* 1,480 1,200 1,100 Oil production during cycle,
bbl** 237.000 188,500 156.000 Oil production during cycle,
bbl/acre 87 69 57 Percentage decline from
previous cycle —— 21 17 Total days during cycle*** 246 230 237 Number of producing wells 33 35 35 Average BOPD/well for cycle 29 23 19
•Total production for Tracts 9, W>/2 10, 36, 37, 38, and 58 from Upper Spraberry and Lower Spraberry corresponding to Fig. 4.
••Production attributable to Upper Spraberry by well tests. •••Actual times adjusted to assumed uniform 31-day injec
tion period.
1041

was higher than that at the end of the previous production cycle; however, the time for recovery was successively longer and the average oil production rate lower. For these three cycles of 230 to 245 days* injection and production there was a decline in oil production of about 19 percent per cycle, resulting in a drop from 29 BOPD/well during the first cycle to 19 BOPD/well in the third. In each case
the peak reservoir pressure following injection was sufficient to have.redissolved all free gas in the reservoir. At the ends of the production periods all GOR's in the test area were still low. It is inferred that the recovery mechanism was primarily expulsion of oil and water by expansion of the reservoir rock and its contained liquids, with partial re tention of the injected water by capillary end effects.
At the end of a normal third cycle of injection and pro-
77" >\^Z>^ *>? y \ J\
• r VT'* • y % t y^y * I * y^^^Sy • *y • J- y ^ y * * y
o.A-i'
- - - w- m , - - • • y •
• • y . • JA-» • • • y^ y-ry •-.-'1- • y- • - ^ C \ * *y 9 • • y*^*yy * y ' y ^ ymoy • / ' y ^ *y • > ^ * > - - ^ ^ ^ V'' ^ * / y' y'" •
y£-i y ^ y y ' y x y y • y B • • y
J * y y * V y ^ * * \ y * y * * • • • . .
* s y ^ y m • • * y * * y ^ * . « • • • . i ' l • » ^ y m\m ^ ' e • • « ^ • . .
V.^ / a /TU*'* * • • " > / a f J ^ l * . • • •
• ^ a' A-^ i y % *_3^' "> / A • J \ I • • *
• • • « • • « > » * i
4 MILES *>y
L\ I N J E C T I O N WELL
• PRODUCING W E L L F R A C T U R E T R E N D
Fig. 3—y4reot developed for waterflood. Spraberry Driver Unit.
t » 4 l 1 * 4 1 1 1 4 3 14 4 4 11945
Fig. 4—Cyclic waterflood performance—Tracts 9. WVi 10. 36, 37, 38 and 58, Spraberry Driver Unit.
1043 JOURNAL OF PETROLEUM TECHNOLOGY
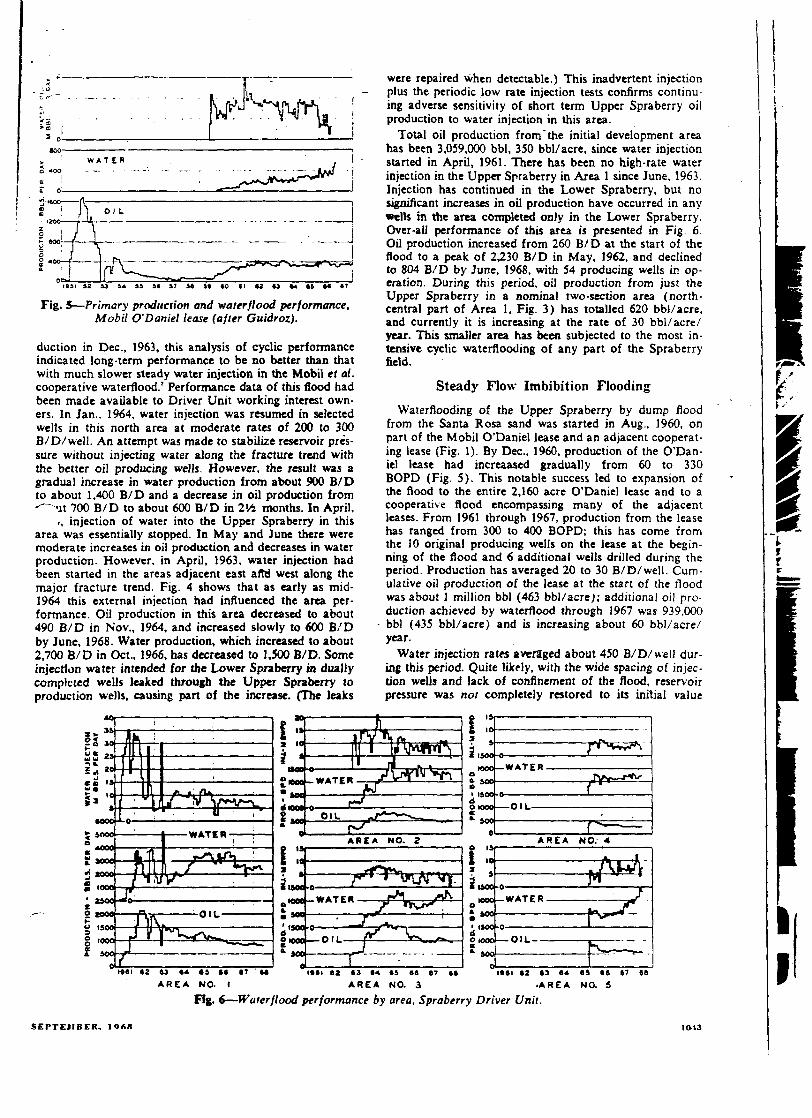
IB9> 12 U U 53 S« ST M S« «0 SI 62 t i • * S3 M
Fig. 5—Primary production and waterflood performance, Mobil O'Daniel lease (after Cuidroz).
duction in Dec, 1963, this analysis of cyclic performance indicated long-term performance to be no better than that with much slower steady water injection in the Mobil ef al. cooperative waterflood.' Performance data of this flood had been made available to Driver Unit working interest owners. In Jan.. 1964, water injection was resumed in selected welts in this north area at moderate rates of 200 to 300 B/D/ well. An attempt was made to stabilize reservoir pressure without injecting water along the fracture trend with the better oil producing wells. However, the result was a gradual increase in water production from about 900 B/D to about 1,400 B/D and a decrease in oil production from
ut 700 B/D to about 600 B/D in 2Vi months. In April, injection of water into the Upper Spraberry in this
area was essentially stopped. In May and June there were moderate increases in oil production and decreases in water production. However, in April, 1963. water injection had been started in the areas adjacent east afld west along the major fracture trend. Fig. 4 shows that as early as mid-1964 this external injection had influenced the area performance. Oii production in this area decreased to about 490 B/D in Nov., 1964, and increased slowly to 600 B/D by June, 1968. Water production, which increased to about 2,700 B/D in Oct., 1966, has decreased to 1,500 B/D. Some injection water intended for the Lower Spraberry in dually completed wells leaked through the Upper Spraberry to production wells, causing part of the increase. (The leaks
were repaired when detectable.) This inadvertent injection plus the periodic low rate injection tests confirms continuing adverse sensitivity of short term Upper Spraberry oil production to water injection in this area.
Total oil production from the initial development area has been 3,059,000 bbl, 350 bbl/acre, since water injection started in April, 1961. There has been no high-rate water injection in the Upper Spraberry in Area 1 since June, 1963. Injection has continued in the Lower Spraberry, but no significant increases in oil production have occurred in any wells in the area completed only in the Lower Spraberry. Over-all performance of this area is presented in Fig 6. Oil production increased from 260 B/D at the start of the flood to a peak of 2,230 B/D in May, 1962, and declined to 804 B/D by June, 1968, with 54 producing wells in operation. During this period, oil production from just the Upper Spraberry in a nominal two-section area (north-central part of Area 1, Fig. 3) has totalled 620 bbl/acre, and currently it is increasing at the rate of 30 bbl/acre/ year. This smaller area has been subjected to the most intensive cyclic waterfiooding of any part of the Spraberry field.
Steady Flow Imbibition Flooding
Waterfiooding of the Upper Spraberry by dump flood from the Santa Rosa sand was started in Aug., I960, on part of the Mobil O'Daniel lease and an adjacent cooperating lease (Fig. 1). By Dec, 1960, production of the O'Daniel lease had increaased gradually from 60 to 330 BOPD (Fig. 5). This notable success led to expansion of the flood to the entire 2,160 acre O'Daniel lease and to a cooperative flood encompassing many of the adjacent leases. From 1961 through 1967, production from the lease has ranged from 300 to 400 BOPD; this has come from the 10 original producing wells on the lease at the beginning of the flood and 6 additional wells drilled during the period. Production has averaged 20 to 30 B/D/well. Cumulative oil production of the lease at the start of the flood was about 1 million bbl (463 bbl/acre); additional oil production achieved by waterflood through 1967 was 939,000 bbl (435 bbl/acre) and is increasing about 60 bbl/acre/ year.
Water injection rates averaged about 450 B/D/well during this period. Quite likely, with the wide spacing of injection wells and lack of confinement of the flood, reservoir pressure was not completely restored to its initial value
i i
i s
•ooo t
I
- W A T E R -
a 'ooo —nr ' ssoo-**o-z 2 aooo f \ a 1 OIL
i»ei «z t i ** es I T
A R E A NO- I
WATER-
A R E A NO. 4
1 4 0 0 - 0
•WATER
i UOOf-0--WATER -
o IOOO — OIL—-
*• SOC 5 3 166) 1 2 S3 * * » i S6 ST 66
A R E A N a 3 1*61 62 63 6* 63 66 67 66
•AREA NO. 5
Fig. 6"—Waterflood performance by area, Spraberry Driver Unit.
S E P T E M B E R . , 1 9 6 * 10.13

such as occurred in the early intensive flooding in the Driver Unit. Thus a high probability exists that significant free gas saturation remains in the centers of fractured blocks of reservoir matrix rock in the O'Daniel lease, leaving higher oil saturation nearer the fracture faces for normal imbibition displacement by the process conceived originally by Brownscombe and Dyes.* In any event the oil production rates per well in this area with slower steady water injection rates were as high as the long-term-average oil production rates in the early part of the Driver Unit that was subjected to high-rate cyclic water injection. In addition, it requires a lower capacity water injection system and eliminates certain operating problems — rapidly changing producing well rates, changing working fluid levels in producing wells, etc. — that are associated with cyclic flooding. Based on these comparative performances, changes were made in operation in the initial development area of the Driver Unit; and the flood in the Driver Unit was expanded with slower steady water injection.
However, these results and the change to steady injection imbibition flooding in the remainder of the Driver Unit do not detract from the development of a new technology, based on fundamental principles of fluid behavior in reservoir rocks, to cope with the problems created by early high rate injection and complete restoration of reservoir pressure in the first part of the Driver Unit flood. They triggered laboratory research by others to investigate additional fundamental aspects of cyclic flooding or pressure pulsing of fractured reservoirs,'* and they prompted many other field tests of the process, of which the results of one such test have been published." Waterflood Expansion—Spraberry Driver Unit The first expansion of waterflood operation in the Driver
Unit added 16,670 acres (Areas 2 and 3 in Fig. 3). Injection of sweetened San Andres water was started in April. 1963, at moderate rates of about 500 BWPD/well for a low-pressure steady injection-imbibition flood. This action seemed prudent because the flood could always be converted to a high-rate cyclic flood at a later date, but the reverse is not true. Experience in the initial development area showed that oil production rate continued to be adversely sensitive to steady water injection once sufficient water had been injected at high rates, to restore reservoir pressure and once movable oil had been forced to the center of the fractured matrix blocks. (See Fig. 6 for performance data on these two areas.)
Oil production of Area 3 increased from about 550 B/D in 1963 to a peak of 1,670 B/D in Feb., 1965, and
declined to-952 B/D in June, 1968. During the higher oil production period from Oct., 1964, through Feb., 1966, in wells in this area produced at rates of 50 to 250 BOPD/ well and the average rate for all producing wells was about 29 BOPD/well. Water production increased to 1,350 B/D in Sept., 1965, decreased to about 750 B/D in late 1966 and then increased to 1,100 to 1,400 B/D. Significantly, both oii and water production declined in early 1966, increased in late 1967, then decreased again in mid-1968, paralleling changes in water injection rate. Thus oil production has not declined solely because the area is watered out.
Oil production of Area 2 increased from 220 B/D to a peak of 850 B/D in Jan., 1965, and then declined to 480 B/D. At peak production, rates ranged from 3 to 56 and averaged 17 BOPD/well. Water production reached a peak of 1,730 B/D in June, 1965, and has since declined slightly. In comparison with Area 3, the oil rates of Area 2 have been lower and the WOR's have been higher. In addition, the less dramatic decreases in both oil and water production suggest that under-injection has not influenced performance so much. Total Area 2 waterflood oil recovery to June. 1968. of 1.109,000 bbl (123 bbl/acre) is much less than the recovery of 2200,000 bbl (287 bbl/acre) for Area 3. Moreover the average well production rate in Area 2 has been less than that in Area 3 (Table 3). There is no clear-cut explanation for the difference in performance of the two areas. One plausible hypothesis (although one without proof) is that more of the wells in the Upper Spraberry in Area 3 were completed in the main Upper sand while many of the wells in Area 2 also included lesser sands, some of which carried water initially. The west area did produce more water prior to flood than did the east area. Commingling of the zones could have permitted water to penetrate the main sand such that some natural imbibition flooding occurred prior to the start of the intentional flood. Difference in fracture intensity, and differences in location of wells with respect to the fracture trend, might also have influenced performance. However, none of these factors can be identified nor their effects isolated through analysis of well performance data.
Water injection was started in the Upper Spraberry in Sept., 1965, in a second expansion of the Driver Unit water-flood (Areas 4 and 5, Fig. 3). Performance is summarized in Fig. 6. There was no increase in oil production by June. 1968, but total water injection of 492 bbl/acre in Area 4 and 622 bbl/acre in Area 5 through June, 1968, may be too low to cause a response. Based on performance of the north part of Area 1,* at least 900 bbl/acre is required for complete fillup in the Spraberry. However, with a low-pres-
TABLE 3—WATERFLOOD PERFORMANCE OF INDIVIDUAL AREAS, SPRABERRY DRIVER UNIT Area 1 Area 2 Area 3 Area 4 Area 5
Date water injection started 4-1-61 4-1-63 4-1-63 10-1-65 10-1-65 Acres 8.730 9,000 7.670 7.100 11,250 Total injection wells 32 19 10 12 17 Total producing wells 92 63 • 54 45 75 Cumulative to July 1, 1968*
339 Oil produced, M bbl 3.059 S«75i 1.109 2,200 339 / - ' l 646 Water produced, M bbl 6,439 2.070 1.508 585 639 Water injected, M bbl . 31.072 18,728 7,658 3.595 6,829
Oil production rate, BOPD Initial 260 310 485 400 960 Peak month 2.155 855
18b 1.670 — —
June, 1968 804 i f l 481 18b 953 111 281 I l l • 553 Oil production rate, BOPD/well
804 i f l
15.6 Initial 4.2 8.2 15.6 12.5 16.5 Peak month 24.8 17.1 31.6 — — June, 1968 14.9 12.3 21.2 7.4 9.9
Total
'Cumulative data from start of water injection. *'Areas 1, 2 and 3 only.
43,750 90
329
5: 5 7,353 IS. ' 11.241
67.882
2.415 4.680**
8/ 3,072 11
10.9 24.6*' 13.2
JOURNAL OF PETROLEUM TECHNOLOGY

sure imbibition waterflood, some free gas saturation should remain and response might occur before complete fillup. A ~ si^ficant increase in production did occur in Area 3 i iniection of 300 or less bbl water/acre into the Upper Spraberry. The decrease in oil production in Areas 4 and 5 during the first 6 months of flood operation is not a result of wells' being flooded out. Primarily it represents decline in flush production of formerly dead wells that were being placed on the pump, and decline in flush production after recompletions and fracture treatments in the Upper Spraberry during development for waterflood.
Lower Spraberry Performance During primary production, the Upper and Lower Spra
berry sands generally were cornmingled so that relative performance could not be determined. However, in terms of areal extent, production from the Lower Spraberry was somewhat poorer. Since the Atlantic and Humble pilot tests were in the Upper Spraberry only, the most densely drilled part of the Driver Unit was chosen for the initial nine-section waterflood (Area 1, Fig. 3). Water was injected separately into the Upper and Lower Spraberry, and 12 producing wells were completed in only skewed five-spot patterns in the Lower Spraberry, developing four sections for flood with skewed five-spot patterns of approximately 320 acres-. This permitted evaluation of imbibition waterfiooding in two "look-alike" reservoirs whose sand properties are substantially identical — both having matrix permeabilities of a fraction of a millidarcy. Possibly there is less natural fracturing in the Lower Spraberry as observed in cores; and probably there was less oil saturation at the start of waterfiooding. Lower Spraberry oil had a b>*"*>er saturation pressure and higher shrinkage factor
did Upper Spraberry oil. fhrough June. 1968, about 14.3 million bbl (aver
age 1,640 bbl/acre) of water had been injected into the Lower Spraberry in Area 1. Some of this water has been lost through leaks to the Upper Spraberry. Performance indicates that the Lower Spraberry is not nearly filled up. Total test production in June, 1961, for 11 of these wells was 248 BOPD and 172 BWPD. As of June. 1968. the total test production for 9 wells still operating was 116 BOPD and 33 BWPD indicating a decline in production of both oil and water and a decline in WOR.
Significant water breakthrough has not occurred in any well producing from only the Lower Spraberry. GOR's of some wells have declined from the range,2,000 to 6,000 cu ft/bbl at the start of water injection to a current 600 to 800 cu ft/bbl, suggesting impending fillup; but other ratios have increased. Two wells had moderate increases in oil production for 2 or 3 years, but they have since declined in both oil and water production. Fluid levels in the shut-in wells have not increased so much a; those observed in Upper Spraberry producing wells in the same area. This contrasts with production response in the Upper Spraberry in the same area after water injection of 900 bbl/acre.
Another difference observed is injection well performance. In the Upper Spraberry most input wells take desired water volumes on vacuum or at moderate surface pressure — two have been tested at rates of 10,000 to 15.000 B/D for a few hours. The Lower Spraberry wells have much lower injection capacities—about 200 to 1,000 B/D/well with 300 to 400 psi surface pressure — and they decline with time when injection is resumed after a shut-in period. Thus it appears that continuity and intensity of natural fractures is less in the Lower Spraberry than in the Upper. Combination of this fact with the probability of a lower oil saturation at the start of the flood indicates a low probability of successful imbibition waterfiooding in the Lower Spraberry. Nearly all of the waterflood oil recovered so far in Area 1 has come from the Upper Spraberry.
When Areas 2 and 3 were developed for waterflood in 1963. 18 additional wells were equipped for separate dual injection into the Upper and Lower Spraberry. The two zones were commingled in 70 producing wells. A total of 7.2 million bbl of water was injected into the Lower Spraberry in Area 2. and 2.3 million bbl in Area 3 by mid-1967. Since there are no producing wells completed in only the Lower Spraberry in these areas, the effectiveness of the flood cannot be determined. However, because of a lack of response to waterflood in the Lower Spraberry in Area 1, injection of water into the Lower Spraberry in Areas 2 and 3 has been stopped. This reduces cost where .performance has not yet justified expenditure, and permits acceleration of the flood in_the Upper Spraberry where some response has occurred, thus maximizing effectiveness of the limited supply of treated water. In the second ex-
TABLE A—RESULTS OF FRACTURE TREATING WATERFLOOD AREA 1, SPRABERRY DRIVER UNIT Well Number
379* 385 387 389 397 401 Fracture treatment
Date 1-24-63 1-24-63 10-22-62 1-16-63 1-16-63 10-24-63 Gallons 25,000 25,000 26,000 29,000 28,000 25,000 Pounds of proppant 6.400 6,400 16.000 6.100 6.100 6,400 Type of proppant . Walnut Walnut Glass Walnut Walnut Walnut Type of proppant .
Shells Shells Beads Shells Shells Shells Production test (oil/water, B/D) Reservoir pressure at high level (1 month after water injection stopped)
Pre-fracture 51/51 19/44 26/48 39/90 8/40 52/52 Post-fracture
Nov., 1962 53/80 83/177 July, 1963 23/23 65/65 14/59 38/52 9/21 11/77
Reservoir pressure at low level (7 months or more since water injection) Pre-fracture 24/3 12/19 1/9 U / 7 10/10 39/49 Post-fracture
_ April, 1963 12/8 22/15 17/12 29/15 14/31 20/40 Jan., 1964 4/27 10/59 9/9 8/26 3/8 8/16 July, 1964 15/62 13/40 5/7 6/14 5/2 6/20 July, 1965 7/40 13/70 — 4/10 — 13/28 July, 1966 8/70 13/125 — 3/22 — 5/20 May, 1967 10/20 20/50 — — — May, 1968 7/20 5/20 — —— — —
•Well 379 previously fracture treated Feb. 20, 1962.
S E P T E M B E R , 1 9 f S 104S

pansion of the flood in Areas 4 and 5, injection of water has been restricted to the Upper Spraberry for the same reasons. .- ...
Efforts to Improve Well Productivity During the first half of 1962 with reservoir pressure re
stored in Area I, it was apparent that productive capacity of many Upper Spraberry producing wells was not commensurate with effective permeability as indicated by extensive pressure transient analyses in the same area' when the wells were new and with effective permeability indicated by early well pressure buildup tests in an adjacent area." Upon initial completion, most Spraberry wells were fractured with 1,500 gal oil and Vi to Vi lb sand/gal. These small treatments were needed to establish communication between the wellbores and the native reservoir fracture system. With passage of time and reduction of reservoir pressure, the treatments may have lost their effectiveness. Pressure buildup tests at different stages of depletion during production, and pressure fall-off tests on the same wells had indicated pressure sensitivity of the Spraberry fracture openings.''* It was hypothesized that additional fracture treatments employing modern techniques, higher rates, much greater fluid volumes, and some of the newer prop-pants might restore well productivity. One well treated with 10.000 gal and 20,000 lb of sand on Feb. 20, 1962, did show a marked improvement in production from 18 BOPD with 2 BWPD to 110 BOPD and 12 BWPD shortly after treatment.
To aid in evaluating stimulation techniques, several pressure buildup tests were obtained on producing wells in Area 1 in July, 1962. While rods were being pulled from these pumping wells, and periodically thereafter for 72 hours, fluid level measurements were made to tie in with subsurface gauge measurements. Apparent effective permeabilities from productivity tests were from 4 to 30 md-ft and apparent effective permeabilities from the later parts of buildup tests were from 2 to 40 md-ft. These compare with 800 to 1,000 md-ft calculated from the early transient pressure behavior in the same area. Although the resulting data were influenced by afterfiow and gas saturation near the wellbore initially, it was concluded that probably no significant skin effect was present. Large flow resistance existed both near and far from wellbores. Thus large-volume fracture treatments probably would not be effective in restoring productivity. However, the large number of wells to which an effective stimulation technique could be applied warranted additional field testing even with low probability of success. A number of service companies were asked to study all available information and to recommend the best possible stimulation treatments for the particular reservoir conditions. As a result, six wells were fractured with 25,000 to 30,000 gal, five with 6,000 to 6.500 lb of walnut shells as proppant. and one with 16,000 lb of glass beads. The results presented in Table 4 were influenced by cyclic waterflood operations being conducted in the area at that time, but comparison of productivity at equivalent stages of cyclic operation and continued long-term performance after cycling ceased show no lasting improvement in productivity.
Fluid level pressure buildup data for three of these wells, taken at about the same stage in cyclic waterfiooding, are presented in Fig. 7 for tests before and after these large-volume fracture treatments. Table 5 compares productivity index (PI) and permeability calculated from both Pi's and pressure buildup before and after fracturing. Pressure buildup permeability was calculated in the conventional manner from the steeper slopes in the 20- to
50-hour range and were not corrected for the real but quantitatively undefinable effects of afterfiow, gas saturation near the well, changes in saturation with time, etc. The permeabilities so determined are near those of the matrix rock itself and suggest limited communication with the native fracture system at significant distances from tbe wellbore. This interpretation is confirmed by failure to establish significant long-term productivity improvement with large-volume fracture treatments. We believe that the fracture treatments diverted to the overlying or underlying shales.
Water Treating Plants
Because of the adverse effects of fresh water on Spraberry permeability, San Andres water was chosen for injection in the Driver Unit. The raw water contains 300 to 500 ppm H-S. To eliminate contamination of Spraberry gas and to reduce corrosion, two water treating plants have been constructed. They use oxygen-free flue gas, generated by submerged combustion of natural gas, to extract the H;S from the water. These plants are scaled-up versions of a similar plant designed and operated by Mobil in the nearby Pegasus field." Fig. 8 shows the general design of the plants, and Table 6 presents pertinent design and operating data. Actual flue gas required in both plants to reduce H.S content of treated water to 0.5 to 1 ppm has been about 95 cu ft/bbl. This contrasts with a treating ratio of 42 cu ft/bbl extrapolated from early tests at partial load in the Mobil plant. About 9.6 cu ft of flue gas is generated per cubic foot of fuel gas burned.
The scale-up of the plant resulted in many operational difficulties, particularly in the burner and downcomer section of the flue gas generator. Working with the manu-
0 i 1—i—i—i 1—i—I -J ;
I IO lOO
HOURS S H U T I N
Fig. 7—Pressure buildup tests before and after larg? fracture treatments.
1 0 4 * J O U R . \ A L OF P E T R O L E U M TECH>»

VENTtC 4AS
C O M B U S T I O N » m
Fig. 8—Schematic diagram of water sweetening plants, Spraberry Driver Unit.
facturer, and incorporating additional design modification dictated by operating experience, we changed these sections from rigid refractory linings, which cracked and spalled off on cooling, to non-rigid non-insulated metal linings. Thermocouples have recorded temperatures of 2.000 to 2.600F on the inside face of the inner cone. Under these conditions it has been found satisfactory to use R-330 stainless steel for the upper section and 316 stainless steel for the lower section of the downcomer. These high temperatures make it necessary to use Inconel for the inner cone of the burner. Current burner design utilizes a double inner cone arrangement so that the inner cone can be suspended from
.J LC top of the burner; and although many burnouts oc-red during their development, these burners have given
inns longer than 1 year. The stripping tower in the larger plant uses a flex tray
arrangement with 316 stainless steel bubble caps. The smaller plant uses a ballistic tray arrangement with per-' forations instead of bubble caps. Originally the towers were lined with coal tar epoxy resins; however these deteriorated with exposure to hot gases from the flue gas generator, so both towers now are lined with thick glass-reinforced epoxy resins that have given satisfactory performance. One tower has had more than 2 years' trouble-free operation. The larger plant has treated about 23 million bbl of water, and the smaller plant has treated about 14 million bbl since start-up in the spring of 1963.
Water Distribution Systems
Performance of the early Atlantic and Humble pilot tests indicated that satisfactory water injection rates probably could be achieved with low surface pressures. Accordingly the water distribution system for Area 1 of the Driver Unit was designed for 300 psi operation using thin-
TABLE 6—SAN ANDRES WATER TREATING PLANTS (HYDROGEN SULFIDE REMOVAL)
SPRABERRY DRIVER UNIT
Stripping tower Height, ft Diameter, in. Number of trays
Water through-put, B/D Flue gas through-put, Mcf/D Fuel gas consumption, Mcf/D Flue gas-water ratio, cu ft/bbl Burner air inlet pressure, psig H,S content of water, input, ppm H.S content of water, output, ppm
Large Small Plant Plant
63 63 66 54 26 26
26,000 16,000 2.500 1,500
260 135 95 95
300 to 500 0.5 to 1
400 to 500 0.5 to 1
wall, electric-welded, cement-lined pipe externally hot doped and wrapped. Wall thicknesses ranged from 0.083 in. for 3V5-in. lines to 0.365 in. for 10%-in. lines. The system has been operated for over 7 years with actual line pressure of about 225 psi. Experience in installation and operation of the system demonstrated extreme importance of careful handling. Many of the leaks occurred where cement lining was inadvertently cracked or knocked off during installation.
Experience during operation of Area 1 waterflood demonstrated that low distribution pressure was generally adequate for injection into the Upper Spraberry but not for the Lower. In the first expansion of the flood, the system was designed for 600 psi. and it has been operated at about 550 psi with pressure reduced at the wells where necessary. Because of the experience with the handling of "mini-wall" pipe in the initial development, a minimum wall thickness of 0.019-in. was selected for the first expansion of the flood and for extension of the system for the second expansion. Lengths, sizes, wall thicknesses and approximate dates of installation for the various sections are summarized in Table 7.
The distribution system in Area 1 and all of the source water gathering systems have carried raw San Andres water containing 300 to 500 ppm H-S for 7 years. In this period the 122,000 ft initial water distribution system has experienced 210 leaks.-Most of these have occurred in welds and in areas of previous leaks. The distribution systems for the first and second expansion have carried treated San Andres water with H.S reduced to 0.5 to 1 ppm. In 5 years the 125,000 ft system for the first expansion developed 85 leaks, and in 26 months the 133,000-ft system for the second expansion had 9 leaks. (See Table 8.) As may be expected, the leak frequency has increased with age of the systems, and it has been greater in lines carrying raw San Andres water. Over-all leak frequency of the two older systems has averaged about 1 leak/mile/ year. In general the thin-wall water distribution systems
TABLE 5—SUMMARY OF PRODUCTIVITY AND PRESSURE BUILDUP TESTS BEFORE AND AFTER FRACTURE TREATING* Well 385 Well 389 Well 397
Pre-Fracture Post-Fracture Pre-Fracture Post-Fracture Pre-Fracture Post-Fracture Rate prior to shut-in
BOPD BWPD
Total *om-hole pressures
Pumping, psia Shut in 72 hours Extrapolated
Flow capacity, md-ft From PI From late buildup
•Wells in Area 1.
15 22 37
370 1575 2065
15 3
39 33 72
530 1480 1925
36 10
11 24 35
350 1725 2070
14 3
17 62 79
505 1565 1890
40 10
7 26 33
180 1885 1940
13 2
10 20 30
190 1635 1955
12 2
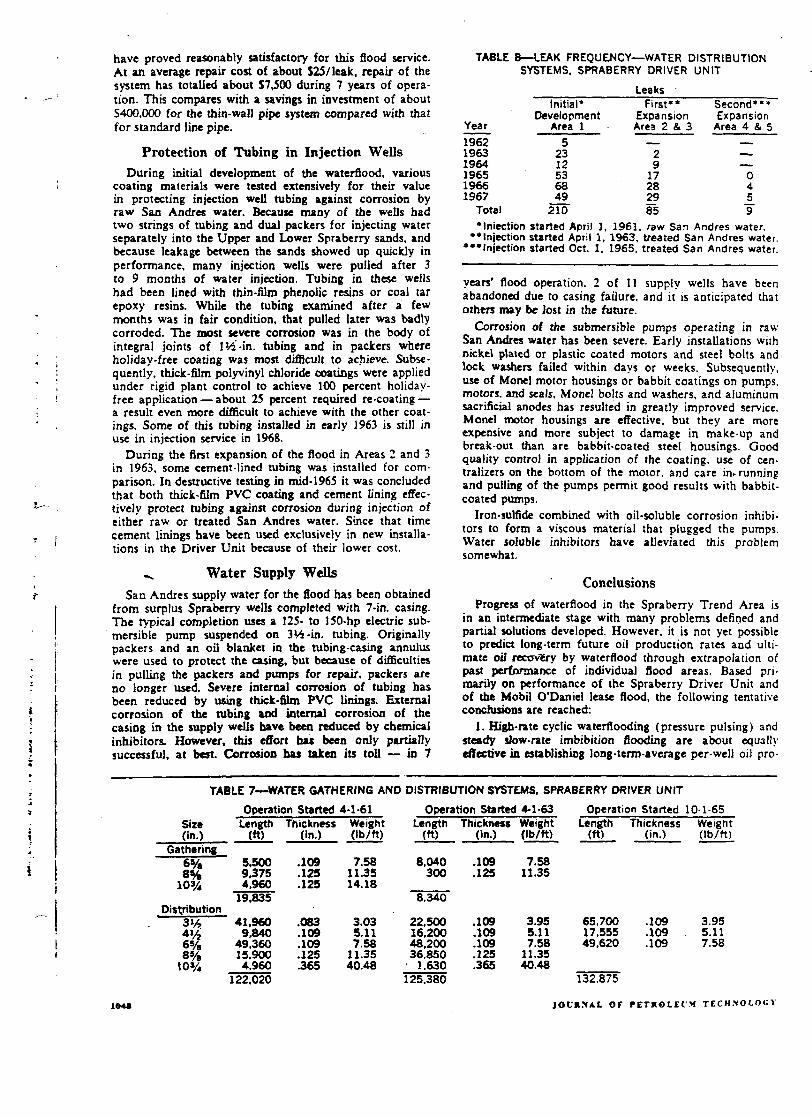
have proved reasonably satisfactory for this flood service. At an average repair cost of about S25/leak, repair of the system has totalled about S7,500 during 7 years of operation. This compares with a savings in investment of about S400,000 for the thin-wall pipe system compared with that for standard line pipe.
Protection of Tubing in Injection Wells
During initial development of the waterflood, various coating materials were tested extensively for their value in protecting injection well tubing against corrosion by raw San Andres water. Because many of the wells had two strings of tubing and dual packers for injecting water separately into the Upper and Lower Spraberry sands, and because leakage between the sands showed up quickly in performance, many injection wells were pulled after 3 to 9 months of water injection. Tubing in these wells had been lined with thin-film phenolic resins or coal tar epoxy resins. While the tubing examined after a few months was in fair condition, that pulled later was badly corroded. The most severe corrosion was in the body of integral joints of 1 -in. tubing and in packers where holiday-free coating was most difficult to achieve. Subsequently, thick-film polyvinyl chloride coatings were applied under rigid plant control to achieve 100 percent holiday-free application — about 25 percent required re-coating — a result even more difficult to achieve with the other coatings. Some of this tubing installed in early 1963 is still in use in injection service in 1968.
During the first expansion of the flood in Areas 2 and 3 in 1963, some cement-lined tubing was installed for comparison. In destructive testing in mid-1965 it was concluded that both thick-film PVC coating and cement lining effectively protect tubing against corrosion during injection of either raw or treated San Andres water. Since that time cement linings have been used exclusively in new installations in the Driver Unit because of their lower cost.
Water Supply Wells San Andres supply water for the flood has been obtained
from surplus Spraberry wells completed with 7-in. casing. The typical completion uses a 125- to 150-hp electric submersible pump suspended on 3Vi-in. tubing. Originally packers and an oil blanket in the tubing-casing annulus were used to protect the casing, but because of difficulties in pulling the packers and pumps for repair, packers are no longer used. Severe internal corrosion of tubing has been reduced by using thick-film PVC linings. External corrosion of the tubing and internal corrosion of the casing in the supply wells have been reduced by chemical inhibitors. However, this effort has been only partially successful, at best. Corrosion has taken its toll — in 7
TABLE 8—LEAK FREQUENCY—WATER DISTRIBUTION SYSTEMS, SPRABERRY DRIVER UNIT
Leaks Initial* First* * Second***
Development Expansion Expansion Year Area 1 Area 2 & 3 Area 4 & 5 1962 5 __ 1963 23 2 — 1964 12 9 — 1965 53 17 0 1966 68 28 4 1967 49 29 5
Total 210 85 9 •Iniection started April 3, 1961, raw San Andres water.
••Injection started April 1, 1963, treated San Andres water. •••Injection started Oct. 1. 1965, treated San Andres water.
years' flood operation. 2 of 11 supply wells have been abandoned due to casing failure, and it is anticipated that others may be lost in the future.
Corrosion of the submersible pumps operating in raw San Andres water has been severe. Early installations with nickel plated or plastic coated motors and steel bolts and lock washers failed within days or weeks. Subsequently, use of Monel motor housings or babbit coatings on pumps, motors, and seals, Monel bolts and washers, and aluminum sacrificial anodes has resulted in greatly improved service. Monel motor housings are effective, but they are more expensive and more subject to damage in make-up and break-out than are babbit-coated steel housings. Good quality control in application of the coating, use of centralizers on the bottom of the motor, and care in. running and pulling of the pumps permit good results with babbit-coated pumps.
Iron-sulfide combined with oil-soluble corrosion inhibitors to form a viscous material that plugged the pumps. Water soluble inhibitors have alleviated this problem somewhat.
Conclusions Progress of waterflood in the Spraberry Trend Area is
in an intermediate stage with many problems defined and partial solutions developed. However, it is not yet possible to predict long-term future oil production rates and ultimate oil recovery by waterflood through extrapolation of past performance of individual flood areas. Based primarily on performance of the Spraberry Driver Unit and of the Mobil O'Daniel lease flood, the following tentative conclusions are reached:
1. High-rate cyclic waterfiooding (pressure pulsing) and steady slow-rate imbibition flooding are about equally effective in establishing long-term-average per-well oil pro-
TABLE 7—WATER GATHERING AND DISTRIBUTION SYSTEMS, SPRABERRY DRIVER UNIT
Size (in.)
Gathering 6% 8%
103/4
Distribution 3V? 4Vz 6% 8%
t03/4
Operation Started 4-1-61 Operation Started 4-1-63 Operation Started 10-1-65 Length Thickness Weight Length Thickness Weight Length Thickness Weight
(ft) (in.) (lb/ft) (ft) (in.) (lb/ft) (ft) (in.) (Ib/tt)
5,500 .109 7.58 8.040 .109 7.58 9,375 .125 11.35 300 .125 11.35 4.960 .125 14.18
19,835 8.340
41.960 .083 3.03 22.500 .109 3.95 65,700 .109 3.95 9,840 .109 5.11 16,200 .109 5.11 17,555 .109 5.11
49.360 .109 7.58 48.200 .109 7.58 49,620 .109 7.58 15.900 .125 11.35 36,850 .125 11.35 4.960 .365 40.48 • 1.630 .365 40.48
122.020 125.380 132.875
104* JOURNAL OF FETSeLIfM TECHNOLOGY

duction rates. Lower investment and fewer operating prob-- lerns. are involved with steady-rate flooding.
Attainment of satisfactory oil production rates in a lai 6c percentage of wells is the major unsolved problem in Spraberry waterfloods. Experimental large volume fracture treatments on six wells using modern techniques and propping agents far deep reservoirs were ineffective in establishing significant sustained oil producing rates.
3. In the initial test area of the Driver Unit, injection of water into the Lower Spraberry at maximum capacity for over 7 years has failed to achieve reservoir fillup, increase in oil production or significant breakthrough of water into producing wells on 320-acre pattern blocks.
4. Extraction of H-S from San Andres water by counter-current contact with oxygen-free flue gas has prevented contamination of Spraberry gas, reduced corrosion in water distribution systems, and provided high salinity water for flooding the salinity-sensitive Spraberry sand.
5. Extensive field testing of linings for injection well tubing has demonstrated that thick-film polyvinyl chloride coating and cement lining are equally effective in reducing internal corrosion in tubing during injection of raw or treated San Andres water.
Acknowledgment
The authors express their thanks to the Working Interest Owners of the Spraberry Driver Unit for permission to publish data from that Unit regarding reservoir and facility performance presented here. The interpretation of the data and opinions expressed, however, are those of the authors and they do not necessarily represent opinions of
-se various owners. Permission from the management of .iio Petroleum Co. to present this report also is grate
fully acknowledged.
References
1. Elkins, L. F.: "Reservoir Performance and Well Spacing, Spraberry Trend Area Field of West Texas", Trans., AIME (1953) 198, 177-196.
2. Brownscombe, E. R. and Dyes, A. B.: "Water-Imbibition Displacement—A Possibility for the Spraberry", Drill, and Prod. Prac, API (1952) 383.
3. Elkins, L. F.: "Spraberry Waterflood Possibilities*, paper presented at National Oil Scouts and Landmens' Assn. meeting, June 6, 1958; summary in Oil and CasJ. (June 30, 1!>58), and World Oil (Aug. 1, 1958).
4. Barfield, E. C, Jordan, J. K. and Moore, W. D.: "An Analysis of Large Scale Flooding in Fractured Spraberry Trend Area Reservoir", / . Pet. Tech. (April, 1959) 15-19.
5. Elkins, L. F. and Skov, A. M.: "Cyclic Waterfiooding the Spraberry Utilizes 'End Effects' to Increase Oii Production Rate", J. Pet. Tech. (April, 1963) 877-884.
6. Elkins, L. F. and Skov, A. M.: "Determination of Fracture Orientation From Pressure Interference", Trans., AIME (1960) 219, 301-304.
7. Guidroz, G. M.: "E. T. O'Daniel Project—A Successful Spraberry Flood", / . Pet. Tech. (Sept., 1967) 1137-1140.
8. Owens, W. W. and Archer, D. L.: "Waterflood Pressure-Pulsing for Fractured Reservoirs", J. Pel. Tech (June, 1966) 745-752.
9. Felsenthal, M. and Ferrell, H. H.: "Pressure-Pulsing—An Improved Method of Waterfiooding Fractured Reservoirs", paper SPE 1788 presented at Permian Basin Oil Recovery Conference, Midland, Tex., May 8, 1967.
10. Dyes, A. B. and Johnston, O. C: "Spraberry Permeability From Buildup Curve Analyses", Trans., AIME (1953) 198, 135-138.
11. Weeter, R. F.: "A Practical Solution to Preparing a Sour Water for Injection", paper SPE 582 presented at Permian Basin Oil Recovery Conference, Midland, Tex., May 9 1963. * * *
L. F. Elkins (right), president of SPE during 1965, is technical advisor to the general manager of Sohio Petroleum Co. A graduate of the Colorado School of Mines. Elkins worked for Stanolind Oil Co. and Continental Oil Co. before joining Sohio in 1947. Elkins has served as chairman of the Oklahoma City Section of SPE twice and was the vice-chairman of the Petroleum Branch of AIME in 1951. He also served as an SPE Distinguished Lecturer in 1963-64. Arlie M. Skov (center) is the manager of special projects for Sohio. A graduate of The U. of Oklahoma, Skov joined SqhjcL. as a reservoir engineer. He served as chairman of the Oklahoma City Section during 1964. R. C Gould (left), a graduate of Texas A&M U'.. is a district engineer for Sohio in Midland. Before joining Sohio in 1951, Gould was employed by Tidewater Associated Oil Co.
1049

C L 3
~~Z.
—• *_*
'/; u _ J
tfl
I H -5
"U E u
•*--csi|<r|
r - i CO C rs. >n cc. cc o
i n rs. O f > r -
O O 00 ON
™| j \ n ^ (D
i n J"l rs O CN
fc* u 0 z> u U * - i
0- a. 0; 1) V
u 1/ c A '-»— !>_> 73
u- E U3
rg | r o | i n — i so O <M i n i n r^ rs — " O j ^ ^
o .o ^ r-i r j <NI co O r»
4 -n n N oo -T —• r j c
sO sO CT
V5
— >
X o o *-* 3 u
•~Z o c mmZ ) f - H
3
— r—«
v: 'mm
•n — zz. Ln
r ^ N cc r I — O O i n
,r i n o -rr ~ ~
rs. .rr- r-. CNl r j O O •— s t 30 is, CN -n <r co O C O a o c O - C o 3 r-- rs — i
s-j- un i n o — rs c> D
SC
v:
s >• c <z U Q
ft. V I
rt — I
O « |
rt r j
i f . — i
rt (N n r^ -1 i n i n i n i n i n
I I I I I i n <T rt r*. CN
rsi r j rt r-4 —
nr. a i <A o i CSI
tT1 •—'CO
CP CO sD
ri t\ CM n n st i A i r t i O l A l A l A
— 3 00 rsi
I I 1 s r s I A
. _ . .M CN
rsi rsi rsi rsi
rsi rsi rt
I Csi
rt CN m f l sT l A l A l A l A l A
rt o i r i s i rt f l rt
.i oi IA oi r-i
5 c..
—
• — i
<
|:
— — *- —
-
*
> —
ri >s .
— r > 5 i
u . r t
CJ rt u i-i
o -•-4 • r t
. r t Uri I - H
CJ -o Uri CJ ?J 0 a; - J
CJ O -o -a rt rt
o 3 a a X. rt u
u —* o c
X rt u
ri rsi f l sT
J»: f i
u .1 U s j
ri f C/J z
c : i - sT
j . : t n o I o r l - sT
JT f> tn z

© Internal Anatomy of a Tight, Fractured Hunton Lime Reservoir Revealed by Performance—West Edmond Field Lincoln F. Elkins,SPE-AlME, Sohio Petroleum Co.
Introduction In 1946 Littleficld. Gray and Godbold published a thorough geologic description of the West Edmond Hunton Lime reservoir, located in Central Oklahoma, and discussion of its early performance.1 They
"""'ressed implications of the nature of the reservoir ock on performance to be expected with production
both by natural means and by pressure maintenance with gas injection. The essence of their analysis was that presence of an extensive interconnected system of
"^fractures and solution channels constituting about 10 percent of the total reservoir void space in otherwise very low permeability reservoir rock would result in severe channeling of naturally encroaching water or injected gas through the fractures with little or no benefit to ultimate recovery of oil. Considerations were in progress to unitize the reservoir for pressure maintenance by gas injection. Some other engineers involved in the project had considerably different opinions at the time regarding continuity of fractures and regarding effects of such fractures on performance.
The field was unitized Oct. 1, 1947. Subsequently, pilot gas injection tests were conducted in four areas of the field; large scale waterfiooding was conducted in two parts of the field in the Bois d'Arc or Upper Hunton; and pilot waterfiooding was conducted in the Chimney Hill or Lower Hunton. Full scale water-flooding is now in progress in the Chimney Hill section where it is oil productive.
The primary purpose of this paper is to divine some
of the secrets of this reservoir through analysis of all aspects of its performance, with the hope that it will be of help to engineers and operators in developing and operating other low permeability fractured reservoirs. In part, this considers variance of actual performance from some widely used conventional reservoir engineering assumptions. For brevity, other aspects of unit operation and its benefits to the owners are not discussed.
Oil and Gas in Place For unit participation, net pay in the Bois d'Arc defined by the gross SP anomaly on electric logs totalled 2,100,000 acre-ft in,the 30.000-acre reservoir. Development of West Edmond predated modern logging techniques that now would be used to determine "net" or "productive" pay. In Fig. 1 this log pick is compared with detailed core analysis and core description by Littlefield et al. 1 for one well identified as A on the index map in Fig. 2. Not all of the gross Bois d'Arc section had oil staining, but all cores with measureable intergranular permeability were stained. (The committee selection of the Bois d'Arc SP interval also includes the Frisco section as identified from cores by Littlefield.) The Bois d'Arc is oil productive throughout the entire 600-ft monoclinal accumulation from the eastern upstructure erosional pinchout to the west-side oil-water contact. (See Littlefield et al. 1
and McGee and Jenkins- for geologic detail.)
, J T ' ;
i post mortem analysis indicates that many conventional reservoir engineering assumptions I and prediction techniques are inadequate to explain fully the performance of this I reservoir. Differences in characteristics of reservoir rock in two sections of the Hunton
resulted in radically different performance during fluid injection. : ' !
FEBRUARY, 1969 221

The Chimney Hill section is present throughout -the entire field, but only in an area of approximately 6,700 acres in the northeast part of the field does it have enough permeability and porosity to be commercially oil productive. The log of a typical producing well, identified as B in Fig. 2, is presented also in Fig. 1. No cores were obtained from oil-productive Chimney Hill wells, so reservoir rock properties must be inferred from well logs and performance. The latter is difficult to interpret because the Bois d'Arc and Chimney Hill are commingled in the wells. "Gross-net" SP porous intervals — qualified by drilling time, relative resistivity, and actual oil production tests — totalling 212,000 acre-ft were used for participation.
Combination of these two gross SP acre-ft volumes, estimated average porosity of 6 percent, interstitial water saturation of 15 percent and .oil formation volume factor of 1.5 indicated oil in place initially to be about 600 million bbl. At the solution GOR of about 1,000 cu ft/bbl the corresponding gas in place was estimated at 60<) Bcf. Material balance calculations for the March, 1946, pressure survey, summarized in my discussion of the Littlefield et al. paper," indicated maximum oi! in place to be 540 million bbl. At the time, average datum pressure was 2,235 psia, nearly one-third less than the initial pressure of 3,145 psia. These calculations included detailed weighting of net pay and PVT properties of oil and gas at actual mid-pay pressure of each well rather than the conventional use of PVT properties at average datum pressure. Assumption of 50 percent more gas production than reported, actual average reservoir pressures about 200 psi greater than measured well pressures, or some combination thereof, was needed to get the material balance estimate of oil
G I L M O R E NO. 4
Fig. 1—Typical log and core analysis, West Edmond Hunton lime.
in place up to 600 million bbl. After unitization, somewhat similar material balance calculations performed separately for five areas indicated successively increasing amounts of oil in place in each area. The totals for the entire field ranged from 718 million bbl for the Nov., 1947, pressure survey (average pressure 1,408 psi) to 970 million bbl for the Oct., 1952, survey (average pressure 641 psi). Corresponding gas in place initially for the latter survey was calculated to be 1,027 Bcf using differential vaporization data at reservoir temperature of 150F after correcting from apparent solution ratio at surface separating conditions. For reasons discussed later, water influx was ignored in these calculations.
As of Jan. 1. 1969, recorded cumulative gas pro-
* • 3 - w
• miCSSUNC TCST
Fig. 2—Index map, Dec, 1949, through Feb., 1950, reservoir pressure survey, West Edmond Hunton Lime field.
JOURNAL OF PETROLEUM TECHNOLOGY

duction was 961 Bcf. Actual gas production probably was somewhat greater. After unitization and full gas utilization, gas production was measured at plant inlets; it does not include losses in the 135-mile low-pressure gathering system and "the 30-mile 500-psi gas-lift system. Extrapolation of production curves presented in Fig. 3 results in estimated ultimate recovery of at least 980 Bcf. Combining this with estimated unrecovered gas of 100 to 200 Bcf at abandonment pressure of about 200 to 300 psi in the reservoir indicates gas in place initially to be nearly double the volume estimated in pre-unit reservoir studies. This requires oil-filled reservoir space double the committee estimate on a "gross" porous interval basis and 2.8 times the "productive porosity" as interpreted by Littlefield et al.
Such wide divergence of actual performance from the volumetric studies is cause for re-evaluation of applicability of some conventional reservoir engineering assumptions to this reservoir and thus possibly to some other tight, fractured carbonate reservoirs. A partial explanation of the increasing material balance estimate of "oil in place" is indicated by performance of the north 4,000-acre part of the field (in Twp 15N) that was substantially shut in from Nov., 1947, to March, 1950, to conserve gas while gas gathering facilities and a gasoline plant were being evaluated and installed. (The area shut in is identified in Fig. 2.) During this period, surveys of 24 of 25 key wells indicated pressure buildup of 56 to 508 psi, 215 psi average. Pressures in many wells were still increasing after more than 2 years" shut in time. (See Fig. 4. Parts A and B of this graph include data of two gas injection tests discussed later, and Part C includes data of other wells in the area.) This pressure buildup was not caused by water influx since the water producing front did not advance appreciably in this area. It may have resulted partly from oil and gas migration from one adjacent higher pressure area to the south-
laoo
- 1000
I
...
'* ,f - . T . . _
V •
CC D V)
tr
5 IOOO
o
< 1200
1000
OTHER W E L L S IN T O W N S H I P 15 N
* i / X X .
SL^tf.
.----«> • 4 0 0
-TREND WITHOUT I N J . , o 3 2
ss CUM. CAS INJ .
8 0 0
™ 7-TREND WITHOUT I N J .
1- -• X »
4 1
A 9 A
z O I-
0 u
! 2 0 0 2
u
19 4 9
Fig. 4—Reservoir pressure buildup—Twp 15N pilot gas injection test No. 3, Bois d'Arc.
east, but this should have been somewhat offset by migration to another adjacent, lower pressure area to the southwest. (See Fig. 2.) Part of this error in material balance is due to lack of pressure buildup in 48 hours in the conventional "radial flow" sense, but much of it is interpreted to be due to a significant difference between pressure in the tight matrix rock
Fig. 3—Reservoir performance. West Edmond Hunton Lime field.
FEBRUARY. 19C9 223

and pressure in the interconnected fractures and solution channels. This is analyzed in more detail later.
This pressure-production performance sheds no light on the discordance between actual gas production and volumetric considerations. In my opinion the latter result from error in the seemingly plausible assumption, made by all early analysts of West Edmond, including me, that extensive production.of oil at solution GOR meant that the entire reservoir necessarily was completely oil saturated. Part of the data leading to this assumption came from careful production testing and subsurface sampling, by USBM engineers,4 of two high-productivity wells. (See Table 1.) The fact that laboratory simulated flash liberation at separator conditions and field measured GOR's were comparable supports the correctness of the subsurface sample saturation pressures' being about 50 psi below static reservoir pressures at time of sampling, and 160 to 200 psi below initial reservoir pressures in the vicinity of the wells, some 450 ft structurally below highest proved oil production.
Various field data plus the core description of Littlefield et al. have led me to the conclusion that oil was concentrated in fractures, solution channels, and the more porous and permeable rock matrix, and that the remainder of the very tight rock was substantially saturated with free gas and.'or gas absorbed on interior rock surfaces. During development of West Edmond the customary completion practice included acid treatment before production testing. However, Sohio Cook No. 2 well (Well E in Fig. 2) was per-
TABLE 1—COMPARISON OF WELL TESTS AND SUBSURFACE SAMPLES OF RESERVOIR FLUIDS,
WEST EDMOND HUNTON UME FIELD*
Magnolia Talbot Mid-Continent I s « e
••ver
Field Tests No. 1 " Lynch No. 1
Location 2813N-4W 18-14W-4W Test date 10-28-44 11-1-44 Test depth, f t 6850 6,850 Test pressures, psia
Static 2,997 2,954 Flowing 2,962 2,952
Test temperature, °F 145 150 Producing rate, BOPD 447 232 Separator GOR, cu f t /bb l 940 924 Separator pressure, psia 54.5 44 Separator temperature, °F 60 60
Laboratory Tests
Saturation pressure at reservoir temperature, psia
Flash liberation at 60F Separator pressure, psia Gas released to atmospheric
pressure, cu ft/bbl Solution ratio at separator
pressure, cu ft/bbl Separator GOR, cu ft/bbl Formation volume factor
Differential liberation at reservoir temperature Gas in solution, cu ft/bbl Formation volume factor
2.952
62
978
30 948 1.48
1,087 1.55
2,905
50
928
22 906 1.49
985 1.52
•Test* conducted by USBM engineers. Data published permission of the Director of the Bureau of Mines.
••Well C in Fig. 2. ••Well O in Fig. 2.
forated and tested for natural productivity for a days. Although it is some 350 ft structural]', than highest proved oil production, it produced 3 MMcf gas and 25 bbl water-white condensate day. It was then acidized through the same perfo. tions and produced normal gravity dark oil at 7; bbl/hr with a GOR Of about 1,400 cu ft/bbl. A reasonable interpretation is that originally the well was exposed only to intergranular porosity in the rock matrix, which was gas saturated; then acidation connected the well to oil-saturated fractures or solution channels. Other related evidence is core analysis of a down-structure well near the oil-water contact (Well F in Fig. 2), which was deepened in 1949 and cored with produced oil as the drilling fluid. The cores all bled gas when submerged in water after recovery to the surface. Visual examination showed signifies oil staining to be limited to the core surface and fr..e-ture areas. Central portions of these cores not . stained were retorted, indicating oil saturation c ; about 10 percent and water saturation of 15 percent.
The porosity values and total cored thicknesses of 8 wells published by Littlefield et al. (Fig. 4, 7A and 7B of Ref. 1, with their Fig. 4 reproduced as part of Fig. 1 here) yield an average of 4.15 percent oil-stained '"productive" porosity and 2.45 percent non-oil-stained "non-productive" porosity alter correction to committee gross thicknesses of these wells. If these two porosities are considered as "oil" pay and "gas" pay. respectively, then 63 percent of the hydrocarbon-filled pore volume contained oil and 37 percent contained free gas. Based on the committee gross SP reservoir volume, these porosity values would correspond to 420 million bbl tank oil, 420 Bcf solution gas and 490 Bcf free gas — short 17 to 24 percent of the actual 1,100 to 1,200 Bcf of gas in place initially. The various factors can be brought into agreement either by reducing oil saturated porosity to 2 percent (200 million bbl), and increasing free gas saturated porosity to 4.6 percent (920 Bcf free gas), or, alternatively, by increasing gas-filled porosity by 1.0 to 1.5 percent, corresponding to a total porosity of 7.5 to 8 percent. While the last is still somewhat higher than the nominal 6 percent porosity used by the committee, it is much less divergent from core data than the approximately 12 percent porosity required if it is assumed that all of the gas was dissolved in oil initially.
Lack of oil staining in the less permeable reservoir rock, gas evolution from non-oil-stained cores, initial production of free gas with water-white condensate from a mid-structure well, and assumptions necessary to achieve conformity between material balance and volumetric considerations all are strongly presumptive evidence that initially there was free gas dispersed throughout the entire West Edmond nominally-oil-saturated Bois d'Arc reservoir. Together they cast serious doubt on applicability to this reservoir, and therefore possibly to others, of the very widely used reservoir engineering assumption that production of oil initially at solution GOR is sufficient evidence that liquid oil is the only hydrocarbon phase present in the reservoir in the vicinity of the well.
224 JOURNAL OF PETROLEUM TECHNOLOGY

Pressure Data and Interference Tests Some of the published discussion of the Littlefield et al. paper questioned continuity of the fractures because large differences in pressure existed between adjacent wells. While there were many such pressure differences, there are large areas where reasonable uniformity of pressures among wells has existed. For example, in the Dec. 1949-Feb., 1950, pressure survey presented in Fiu 2, there were at least 80 contiguous wells in Twp 15N, including 25 test wells, in the 1,144 to 1,325 psi range. Most of them had been shut in 5 to 25 months. In the west part of Twp 14N there were at least 88 contiguous wells, including 29 test wells, with pressures in the range of 700 to 800 psi. Shut-in times of test wells ranged from 2 days to 25 months. Similarly, in the west part of Twp 13N there were at least 95 contiguous wells, including 50 test wells, in the pressure range of 700 to 800 psi. Shut-in times ranged from 2 days to 21 months. Similar conditions existed at other pressure surveys. Although no mathematical model studies have been made, such widespread pressure equalization between producing and shut-in wells would not have been expected intuitively if communication was restricted to flow only in the rock matrix where permeabilities are a few millidarcies or less.
During development of West Edmond. an interference test was conducted between producing Well D and pressure test Wells G and H (Fig. 2). At the time, these were the only wells completed in the immediate area. With Well D producing about 1,200 to 1,800 BOPD for about 8 hours, pressure drops of 50 to 75 psi were observed in Wells G and H in less than 24 hours.* Such large pressure drops would not be anticipated if complete pressure equilibrium was achieved in vertical section in the inter-well area, even if the reservoir was completely liquid-filled. Apparently the pressure drawdown in the short test period occurred primarily in the interconnected fracture system.
Pilot Ga$ Injection Between May 5 and Aug. 11, 1948, 250 MMcf of gas was injected into the Bois d'Arc in Well 682, identified as I in Fig. 2. (GOR's of all eight offset wells are summarized in Fig. 5.) Within 2 weeks after gas injection was stopped, GOR of the northeast offset, Well 676, declined from about 21,000 to 11,500 cu ft/bbl, and within a month GOR of the east offset, Well 683, declined from 12,000 to 6,700 cu ft/bbl. It is estimated that at least 43 percent of the injected gas was channeling to these two wells. This calculation is based on difference between peak GOR's of each of these wells and the values at that time on linear trends between their GOR's at the start of the test and their minimum GOR's achieved after gas injection was stopped. The east well had been producing about 75 BOPD and the northeast well about 50 BOPD. Little or no gas channeling to other offset wells was detected.
•Details of this test are no longer available. Production rate and pressure drawdown are based on memory of engineers conducting the test and analyzing the data.
The injection well was returned to production 2 weeks after gas injection was stopped. Although the formation volume of gas injected was equal to the oil-filled pore space underlying 21.5 acres (based on Littlefield's average 4.15 percent "productive" porosity), during the first 11 days' operation it averaged 79 BOPD and 50 BWPD with a GOR of 4,700 cu ft/bbl, comparable with the average of offset wells. Backflow of gas was only 5 MMcf at that time. Obviously most of the gas had migrated away from the vicinity of the injection well without effectively displacing much oil.
A second test was conducted in an area producing from only the Bois d'Arc near its upstructure pinch-out. During 4 months, 383 MMcf of gas was injected into Well 614 and 93 MMcf of gas was injected into Well 632. (These wells are identified as J and K, respectively, in Fig. 2.) Composite performance of five project wells offsetting the main injection well is summarized in Fig. 6. In early March, 1948, these wells, previously shut in to conserve gas, produced 10 to 60 BOPD/well with GOR's of 10,000 to 80,000 cu ft/bbl, average 30,000 cu ft/bbl. When gas injection was started March 11, and particularly when choke sizes were reduced March 13 to balance reservoir fluid withdrawal with injection, oil rates dropped precipitously and GOR's increased rapidly to about 175,000 cu ft/bbl. GOR's shown thereafter are based on 7-day moving averages of oil and gas production to smooth out production gauges of oil in individual test tanks for each well. During 4 months of approximately balanced injection and production, these five
W E L L N O 6 7 4
j - * W E L L N O . 6 7 5
4 f t f t
6S2 ee3
IT cr 30-< I CD 2 0 |
a £ io
W E L L N O . 6 7 6
I
Fig. 5—Pilot gas injection test No. 1, Bois d'Arc.
FEBRUARY, 1969 225

wells averaged about 15 BOPD total at GOR's of 125,000 to 275,000 cu ft/bbl. Gas injection was stopped in mid-July and the wells continued to be produced at the same choke settings with essentially the same total gas production rate. Over a 10-week period oil production of the five wells increased gradually from 15 to 70 BOPD total, and the composite GOR declined from 250,000 to 50,000 cu ft/bbl.
In early March, average GOR was 30,000 cu ft/bbl prior to injection, anc! in late September, average GOR was 50,000 cu ft/bbl after injection. If oil and gas flowed from the rock matrix at the average of these GOR's to replace production flowing from and through the more permeable flow channels, about 8,800 bbl of oil would accompany the 354 MMcf of gas produced after gas injection was stopped. Production of 4,700 bbl left 4,100 bbl to resaturate the flow channels enough to reduce GOR from 250,000 to 50,000 cu ft/bbl. Previously a fivefold increase in GOR accompanied production of about 50,000 bbl of oil. If resaturation is the reverse of this trend, it indicates the main flow channels constitute about 8 percent of the reservoir space.
Helium was added to injection gas at I percent concentration for a week starting April 27, 1948. In one producing well it was detected in 12 days, and in seven of the nine test wells during the 5-month test it was detected at times as noted in Fig. 6. None was detected in any second row offset to the injection wells. About 44 percent of the injected helium was produced. Many reservoir factors combine to reduce helium concentration in produced gas from that in the small slug injected. These include varying velocities along different flow paths, dispersion in gas along any flow path, and variation in permeability, l f peak helium contents correspond to average travel times of injected gas to the various wells, and if all gas flow was confined to the 150-acre area enclosed by the affected wells, then minimum reservoir volume swept by injected gas was about 6 percent of the reservoir pore space. Obviously neither the analysis of helium transit times nor that of resaturation after gas injection is stopped is absolutely correct, but they both confirm qua'tatively the presence and continuity of
MARCH A P R I L MAY J U N E J U L Y A U G . SEPT. 1 1 4 1
Fig. 6—Pilot gas injection test No. 2, Bois d'Arc.
a low volume-high permeability system hypoti-.j i/cd by Littlefield et ul. from core observations.
In a third test, gas was injected into the Bois u'A:e in Wells 38 and 41, identified as L and M, respectively, in Fig. 2. These wells and their offsets were shut in about Dec. I , 1947, and essentially all of Twp 15N was shut in throughout 1948, 1949 and early 1950. Injection into Well 38 started March 23. 1948. at 580 Mcf/D and ranged up to 2,900 Mcf/D. A total of 128 MMcf was injected through June 4, 1948, during the test. Injection into Well 41 starting April 1, 1948, at 780 Mcf/D was increased successivelv to 6,500 Mcf/D by June 23, 1948, when the test was stopped after cumulative injection of 267 MMcf.
Static pressures measured at the top of Hunton in the injection wells and in the shut-in offset wells are summarized in Fig. 4. Pressures of wells surrounding Well 41 increased 50 psi in 1 month, 110 psi in 2 months and 205 psi in 3 months, with reasonable uniformity among the wells as illustrated in Fig. 4A Within 6 weeks after injection was stopped, the first measured shut-in pressure of the injection well was about the same as those of offset wells. Similarly, shut-in pressure of injection Well 38 declined to the average of its offset wells within 4 weeks after gas injection was stopped. (See Fig. 4B.) Note that these pressure equalizations demonstrate that the pressured-up bubbles of injected gas were dispersed beyond 160-acre confines of offset wells, and yet they occurred in areas where individual well pressure buildup was not complete after 2 years' shut-in time.
Theoretical analysis considering injection Well 41 as a point source in a large reservoir'1 requires effective regional permeability to gas of about 2 md to match pressure buildup of the well from 862 psi on
^ March 24, 1968, after being shut in 4 months prior to injection, to 1,030 psi on August 9, 1948, 6 weeks after injection of 267 MMcf of gas. On the same basis, calculated buildup of 190 psi in direct offset wells is in good agreement with actual average buildup there of 205 psi as of June 30, 1948. However, although theoretically the pressures of these offset wells should then have declined about 130 psi during the next 4'/i months after injection was stopped, the actual decline was only 15 psi. Then during the next year or so actual pressures reversed the trend and built up an additional 100 psi. Obviously there are reservoir factors involved in addition to effects of the limited gas injection.
Alternatively, if the area-wide approach to equilibrium during the 1948-49 shut-in, corresponding to the dashed line in Fig. 4A, is considered to represent radial pressure transients only and is analyzed in the conventional manner,5 effective permeability to gas is calculated to be about 0.28 md or less. Just prior to shut-in, wells in this area typically had been producing 6 to 30 bbl of oil and 86 to 998 Mcf of gas per day each, corresponding to GOR's in the range of 15,200 to 153,000 cu ft/bbl. Based on this type of calculation alone, one might conclude that injected gas could not be moved readily through the formation. Actual injection of 6.5 MMcf/D into Well 41 with about 800 psi differential to 40-acre offset wells
226 JOURNAL OF PETROLEUM TECHNOLOGY

was 10 to 20 times greater than that corresponding to 0.28 md effective permeability, depending upon
degree of wellbore jcgion permeability improve-;nt assumed to result from acid treatment. A third analysis considers the incremental pressure
buildup over and above the dashed line in Fig. 4A from March through June, 1948, to be the effect of pilot gas injection. Reasonable agreement between calculated and measured incremental pressures of Well 41 and its direct and diagonal offset wells is obtained when effective permeabilities to gas in the range of 4.5 to 6 md and associated effective porosities to gas' in the reverse range of 3 to 2 percent, respectively, are used in the conventional equations for transient liquid flow (used as a first approximation to the How of free gas). Porosity to gas "sensed" by pressure interference in the 3-month test is only one-third to one-half or less of the total porosity — a further indication of limited flow channels in otherwise very low permeability matrix rock.
A fourth analysis considers pressure transients, lasting for years, between the tight matrix rock and interconnecting fractures as the primary cause of the twofold underestimate of gas in place by material balance calculations in 1946-47, and of the 200 to 400 psi pressure buildup in parts of Twp 15N during 1948-49. when the area was substantially shut in. For order of magnitude estimate only it was assumed that the Bois d'Arc in this area contains two systems of interconnected vertical fractures at 5-ft spacing
lulated. for mathematical simplicity, by 5.6-ft di-...netcr matrix cylinders. Again, based on other evidence discussed here, it was assumed that the matrix rock had 4 percent effective porosity containing free gas and that the simpler mathematics for flow of fluid of constant compressibility suffice. Ignoring "after-llovv" of gas from the matrix rock to the relatively smaller volume fracture system, and assuming effective permeability to gas of 10~T md. resulted in reasonable agreement with the actual 2,200 psi pressure decline in the area with production during 1945-47 and the pressure buildup observed during the 1948-49 shin in (dashed line. Fig. 4A). The same results are obtained by varying permeability inversely as the square of fracture spacing — thus for 50-ft diameter blocks a permeability of 10"* md is indicated. The relation for potential change in a cylinder with constant ilux across its outer surface presented as Eq. 7.8 I - l and Fig. 25 by Carslaw and Jaeger* was used for this analysis.
A similar analysis was made, assuming a single horizontal fracture at the top or bottom of the 33-ft Bois d'Arc section in the vicinity of Well 41, using Eq. 3.8-3 and Fig. 15 of Carslaw and Jaeger. For linear flow and with all other assumptions the same as above, effective permeability to gas of 10~* md is required to match the pressure drawdown dur-
1945-47 and the pressure buildup during the ^8-49 shut-in period. For lesser half-thicknesses
ol blocks created by multiple horizontal fractures, permeability varies inversely as the square of thickness. For example, for 5-ft fracture spacing it would be about 10•* md. Since there are no very good clues
FEBRUARY, 1969
as to the nature and spacing of actual fractures, actual effective permeability is indeterminate. However, for any reasonable spacing the permeability required to match the 2-year pressure buildup is much lower than "permeability cutoffs" used quite frequently to define "net pay" in carbonate reservoirs.
A fourth pilot test involved injection of 571 MMcf of gas into only the Chimney Hill section in Well 283, identified as N in Fig. 2, and measurement of production of oil and gas from the eight offset wells. Nearly all of the latter wells were perforated in both the Bois d'Arc and Chimney Hill sections of the Hunton Lime. Composite performance of the test wells is summarized in Fig. 7. Within 2 weeks after gas injection was stopped. COR of the northeast offset declined from about 8,500 to 7,500 cu ft/bbl. On a difference basis this corresponds to channeling of less than 5 percent of the then daily gas injection. No other test well showed such reduction in COR. Since gas injection volume was equal to about 18 percent of the "oil productive" pore volume in the 160 acres enclosed by the eight wells offsetting the injection well, it is evident that the degree of fracturing in the Chimney Hill section of the Hunton is considerably less than that indicated for the Bois d'Arc section by results of other pilot gas'injection tests discussed previously.
Natural Water Influx Water production at West Edmond reached a peak rate of about 20,000 B/D in Sept. and Oct.. 1947. and then declined to about 7.000 B/D by mid-1950. all from the Bois d'Arc (Fig. 3). The subsequent increase in water production resulted primarily from waterflood operations, including injection of all produced water into the Bois d'Arc in west-central and north end wells from mid-1949 to late 1955. and injection of produced water and supplementary water into the Chimney Hill starting in Dec. 1955. By 1968 water production from the Bois d'Arc declined to about 2.150 B/D. Although part of the decline in water production during 1948-50 resulted from stopping operation of uneconomic wells, the combination of this decline in water production and a slowing of the advance of the water-producing front across the
C A S - O I L RATIO
CAS PRODUCTION
I
1 | 1 V — ,
r*—i°*s INJECTION
- O I L PRODUCTION -
MAT JUNE J U L T AUG. S E P T OCT. NOV. DEC I JAN 1 i e « 9
Fig. 7—Pilot gas injection test No. 4, Chimney Hill.
227

field indicated that water influx is from a limited aquifer.
These various observations permit an order-of-magnitude estimate of total water influx independent of material balance calculations and independent of an assumed reservoir sweep efficiency. By Jan. 1, 1949, maximum cumulative water influx is estimated to have been 33 million bbl (equal to 20,000 B/D for 4Vi years) of which 19 million bbl had been produced and disposed of into other formations. This type of estimate was the basis for ignoring water influx in the material balance calculations discussed previously. At the Dec, 1948, pressure survey, cumulative production of 80.6 •million bbl of oil and 378 Bcf of gas were equivalent to 814 million bbl of hydrocarbons at the average reservoir pressure of 1,230 psi. Net water influx of 14 million bbl or less replaced less than 2 percent of the hydrocarbons produced and thus had negligible effect on the over-all pressure-production performance of the reservoir.
The 14 million bbl or less net water influx remaining in the reseivoir had invaded some 3,000 to 8,000 acres to varying degrees based on limits of production of at least 80 percent water or 5 BWPD/well. respectively. The latter water producing front as of May 1. 1953, is shown as a solid line in Fig. 8. The smaller water-invaded part of the reservoir listed above includes some 272,000 acre-ft of gross Bois d'Arc, resulting in a maximum net water fillup of 51 bbl/acre-ft when wells therein produced 80 percent water or more. This maximum water fillup volume corresponds to only 16 percent of the oil-stained "productive porosity" as interpreted by Littlefield et al.1, and to only 8 percent of the "total" porosity estimated by material balance and other considerations reported here.
Another aspect of reservoir rock control of performance was demonstrated by behavior of west-side Bois d'Arc wells in Twps 13N and 14N (Area B in Fig. 8). In 1947 and 1948 water-producing wells in this area were produced at capacity to retard water encroachment farther into the reservoir. Thereafter wells were operated based on individual well profitability. Reduced availability of high pressure gas for gas lift, as well as water breakthrough into many flowing wells, caused rapid decline in oil production. By Aug., 1950, the west three to four rows of wells had been watered out and shut in and the water front was continuing to advance. Six wells that had been returned to pumping to arrest this advance produced essentially 100 percent water for 3 months until Well 290 (Well A in Fig. 8) increased production, overnight, to 140 BOPD with 204 BWPD in April, 1951. Since then this well has produced over 184,000 bbl of oil. During late 1948 the wells in Area B produced about 2,000 BOPD. By 1950, production had declined to less than 100 BOPD, and then it increased to a new peak of 1,000 BOPD by the end of 1952. (See Fig. 9.)
From a reservoir mechanics viewpoint the importance of this behavior is that most of this surge of oil production did not come at the water front, but rather behind it at westem-most wells being operated. It was
228
noi primarily oil from an oil bank but oil that had been bypassed by encroaching water. During 1947-48 reservoir pressure in the area had been declining about 1 psi/day. In 1949 this dropped to 0.5 psi/da\ and in 1950-51, pressures in extreme west-edge wells increased 50 to 150 psi. Apparently, change of pressure gradient from reservoir rock matrix to fractures to its reverse — fractures to matrix — was sufficient to shut off oil flow from the matrix by gas drive. Then, when water influx from the limited aquifer adjusted to the reduced rate of pressure decline in the general area, it permitted further drop in pressure in the water-invaded area and therefore resumption of flow of oil from the rock matrix. Recovery of
I : I Fig. 8—Waterflood map. West Edmond Hunton Lime field.
JOURNAL OF PETROLEUM TECHNOLOGY

1,075,000 bbl of oil from the area after Jan. 1, 1951, is equal to only 1.5 years' production at the 1948 rate. Apparently it was not "extra" oil but was oil deferred as a result of the change in operating practice.
Bois d'Arc Waterflood Re-injection of produced water into the Bois d'Arc was started in July, 1949, in west-side Wells 586 and 606 (Wells C and D, respectively, in Fig. 8). Later 13 additional wells were utilized to spread injection along the entire south area. Injection of water increased from about 4,800 B/D initially to 8,500 B/D, and reached a total of 9.2 million bbl by April,
o o:
1948 49 50 51 52 53 54 55 56 57
Fig. 9—Reservoir performance with natural water influx. Area B, Twp 14N.
KKX
eocc
KKX
eocc TV ^ . . - > / \ WATCH IMJCCTlON 1. : V -F OU * MUX STMiP
» . . i L — . . _, mK— . ,
I * — O I L PRODUCTION - TWf. ISN
son
N. 1 S
•m
^ •—•—•• • ; >s : V
s
100
— — — — — — — ' v ••• i i m - — -"V. , *u l 1
Y \ / I M A t 10 51 1 2 J3 S4 M M 57 M M « 0 ( I U «3 » 4
Fig. 10—Bois d'Arc waterflood performance, Twp 13N.
FEBRUARY, 1969
1953 — 8.4 million bbl in the first 4 miles south of the erosion channel. Thereafter injection was diverted progressively to other depleted areas of the Bois d'Arc for disposal.
This injection extended the 5 BWTD/well water front up to 1.5 miles eastward through the reservoir (area between the solid line and dashed line in Fig. 8) without creating an oil bank as conventionally conceived in waterflood operation. A few wells did have significant increases in oil production, which might have resulted from waterflood but which on the other hand might have resulted from application of artificial lift to wells previously shut in or dead. A far greater number of wells were flooded out within a few months to a year with no increase in oil production. The operation was judged to be unsuccessful, and attempts to waterflood the Bois d'Arc were abandoned in mid-1953.
Various results of this operation indicate rock control of reservoir performance similar to that experienced during natural water influx into the west-side area north of the erosion channel discussed previously. Net water injection and influx into this 4-mile-long area totaled about 8.0 million bbl or less from Jan" 1, 1949. to May 1, 1953. During this period the water front advanced through about 2,300 acres as measured by wells producing more than 5 BWPD, representative of the leading edge of the oil-water transition zone, and through about 2,800 acres as measured by wells producing more than 80 percent water, representative of the trailing edge of this transition zone. These data correspond to 3.500 bbl of water per acre for the leading edge and 2.900 bb! of water per acre for the trailing edge, as the actual fillup volume. This is equal to 8.4 to 10 percent of the oil-saturated reservoir pore space in the area, based on the Littlefield et al. estimate of 4.15 percent "productive" porosity: or it is equal to half these values compared with total porosity based on gas balance studies reported here.
When water injection into the 4-mile area of the Bois d'Arc was reduced starting Aug.. 1953, and stopped altogether in Feb., 1954, oil production from the general area increased from 700 B/D to about 1,500 B/D in 15 months and leveled off at 900 to 1,000 B/D for 4 years — much above the decline trend during water injection as shown in Fig. 10. Al though these data include oil production for the area south of the erosion channel excluding Twp 12S, they represent predominantly the performance of the waterflood area. The increase in oil production occurred primarily in wells at considerable distances behind the water front, wells that previously had produced large volumes of water at high water percentage. (Spot checks show that during 1954-58 these wells behind the water front in the 4-mile test area produced more than 85 percent of the oil volumes plotted in Fig. 10. Thereafter they gradually declined to about 50 percent in 1964.) One former injection well (Well E in Fig. 8) was returned to production in Sept, 1956. During 1958 it averaged 96 BOPD. By Jan., 1968, it had recovered 131^500 bbl of oil after receiving more than 1 million bbl of water dur-
229

ing injection. A singular interpretation of performance of this
area is not possible except to note that it does not represent production from an "oil bank" but actually was oil bypassed by the advancing water. From July, 1949, to Oct., 1952, reservoir pressures in west-edge injection wells increased about 300 psi, but pressures at the east side of the water-invaded area decreased about 400 psi. Thus it cannot be determined whether the reduction and subsequent increase in oil production resulted entirely from pressure control of flow from the matrix to the fractures or whether the injected water caused other effects. During the operation of this flood the concept of imbibition flooding of the very low permeability fractured Spraberry sand was proposed.7 Laboratory imbibition tests on re-saturated, aged Bois d'Arc cores resulted in no expulsion of oil in a few weeks while similar immersion of Spraberry cores in water caused oil droplets to appear at the core surface in a few minutes. Analysis of the field performance data leads qualitatively to a somewhat similar conclusion. If imbibition of water from the fractures into the matrix was the controlling mechanism, the apparent barrel-per-acre water fillup for the later part of the flood should have been significantly greater than the similar value for the early part due to the difference in (time) (matrix rock volume) exposed to water. Water influx in this area was estimated to be 5,000 B/D as of Jan., 1949, declining thereafter at 33 percent per year based on declining water production prior to injection. Combination of this estimate with quantities of water injected into and produced from the area indicates that the apparent fillup volume per acre was less for the later period — Nov. 1. 1951, to May 1, 1953 — thajiforthe earlier period —Jan. 1, 1949, to Nov. 1^1951— the reverse of that anticipated by imbibition theory. (Pertinent data are summarized in Table 2 and the water advance is illustrated in Fig. 8.) Even if water influx remained constant at 5,000 B/D, which is highly unlikely, the apparent fillup volume per acre for the later period would be only 7 to 25 percent greater
than that for the earlier period. This would not be indicative of significant water imbibition into the matrix rock.
An alternative interpretation could be that some of the water was forced into the rock matrix where reservoir pressure was increased. Then rearrangement of fluids there permitted expulsion of additional oil when reservoir pressure was subsequently reduced Such performance has been demonstrated in pressure pulsing of oil-wet cores in the laboratory. • It is not possible to discern the relative contributions of pressure control, imbibition, and pressure pulsing of a possible oil-wet reservoir rock to the increase in oil production in this area after water injection was stopped in late 1953. In any event, the 1.5 million-bbl increment of oil production since 1953, over and above extrapolation of the production decline trend established during waterfiooding, amounts to only 325 bbl of oil per acre of water-invaded area. This is about 7 percent of the 4.500 bbl/acre total oil recovery from that area. It did not appear to be economically feasible to repeat cycles of pressure buildup by water injection followed by pressure reduction, so nearly all wells in this area have been plugged and abandoned.
Chimney Hill Waterflood During pilot gas injection tests there had been rapid channeling to offset wells in the Bois d'Arc but little or no channeling in the Chimney Hill. This became the basis for starting a pilot waterflood test in the Chimney Hill even though large-scale waterflood of the Bois d'Arc had been unsuccessful. By use of packers set below the Bois d'Arc, nine existing Hunton wells were converted to water injection into the Chimney Hill only. These wells completed four adjacent 80-acre five-spots as outlined in Fig. 8. Material balance calculations using oil and gas production from the Chimney Hill estimated by difference from that of an adjacent area producing from only the Bois d'Arc provided the'only measure of reservoir pore space. On this ba^s it was estimated in 1955 that
TABLE 2—RESERVOIR VOLUME INVADED BY WATER—AREA WITHIN 4 MILES SOUTH OF EROSION CHANNEL, WEST EDMOND HUNTON LIME FIELD
Wells Greater
Thm
Wells Greater
Than 80% Acres Invaded
Cumulative Water
Iniection
Estimated* Natural Influx After
Jan. 1. 1949
Cumulative Water
Production After.
J u . 1. 1949
Estimated Net Water Injection
and Influx
Net Bbl Water Per Acre Based on
Based on Advance of Advance of 8 0 %
5 BWPD Water 5 BWPD 8 0 % Water tbbl) <bel) (Mil) (bbl) S BWPD Line Water Line
Jan. 1, 1949 Nov. 1, 1951 May 1, 1953
58 S5
116
32 79
102
2,320 3,800 4,640
1,280 3,160 4.080
4,515,000 8,361,000
3,100,000 3,700,000
2,100,000 4,074,000
5,515,000 7,987,000
Jan. 1, 1949 to
Nov. 1, 1951
Jan. 1, 1949 to
Nov. 1, 1951 37 47 1,480 1,880 4,515,000 3,100,000 2.100,000 5,515,000 3.730 2,930
Nov. 1, 1951 to
May 1 , 1953
Nov. 1, 1951 to
May 1 , 1953 21 23 840 920 3,846,000 600.000 1,974.000 2.472,000 2,940 2,680
Jan. 1, 1949 to
May 1, 1953
Jan. 1, 1949 to
May 1, 1953 58 70 2,320 2,800 8,361,000 ' 3,700.000 4.074,000 7,987,000 3,440 2,850
• E s t i m a t e d at 5,000 B / D Jan . 1 , 1949. and dec l in ing at 33 percent per year.
230 JOURNAL OF PETROLEUM TECHNOLOGY

2,100 bbl of oil per acre had been produced from the Chimney Hill in the pilot test area and that the amount of injection required for response would be from 8,000 to 12,500 bbl of water per acre. This range reflects the uncertainty in oil saturation due to the possible presence of dispersed free gas saturation initially.
In Dec., 1955, facilities were completed for gravity injection of all produced water into the Chimney Hill. For the 9 wells this totalled 5,000 to 7,000 B/D (Fig. 11). After 2V2 years with no response, injection was increased stepwise to about 11,000 B/D by supplementing produced water with salt water from a shallower water sand. First significant effects were noted after injection of 10 million bbl of water over 4 years — 14,000 bbl/acre within the area enclosed by first-row offset wells surrounding injection wells. In.late 1959 water production started to increase significantly, but even then a first peak water production rate of 600 B/D total for the four test wells was only 6 percent of the water injection rate. An increase in oil production rate did not start until late 1960-—5 years, after initiation of water injection. In three more years total oil production of these four wells reached a peak of 1.000 B/D in Oct.. 1963 — up from 40 to 50 B 'D total prior to response to waterflood. Subsequently it declined to about 300 B/D total in late 1968 (Fig. 11).
The reduction in water production during the last half of 1962 resulted from the discovery that corrosion of tubing in injection wells had inadvertantly permitted some water injection into the Bois d'Arc. Input wells were repaired to confine water injection to the Chimney Hill, and production packers were installed in the pattern producing wells to exclude production from the Bois d'Arc.
As of Jan. 1. 1969, the four test wells had produced a total of 1,454,000 bbl of waterflood oil, and a reasonable extrapolation of the decline curve indicates an ultimate recovery of about 1.7 million bbl — 5.300 bbl/acre. As of the same date, 31.750.000 bbl of water had been injected into the nine pattern wells and only 1,770,000 bbl of oil and 2,667,000 bbl of water have been produced from the four inside pattern wells and 12 first-row offset outside wells enclosing 720 acres. The net injection over production is thus about 27 million bbl, equal to a maximum present fillup of 37,500 bbl/acre.
Starting in 1962, 40 additional wells were converted to water injection to apply 80-acre five-spot flooding to nearly all of the remaining oil-productive Chimney Hill part of the field as outlined in Fig. 8. All produced water plus supplementary salt water is injected at capacity rates by gravity in most wells and by individual injection pumps at 16 wells. As of late 1968, total water injection rate outside the pilot area vas about 17,000 B/D, and cumulative water injec-ion there as of Jan. 1, 1969, was 27.0 million bbl —
6,100 bbl/acre. Production increase has occurred primarily in wells adjacent to the pilot test — probably in response to the much greater water injection there. However, within the last few months a few other wells also have had increases in oil production.
No reliable forecast can be made of when there will be a substantial increase in oil production rate or of what the ultimate recovery of oil by waterflood will be. Based solely on qualitative considerations of reservoir performance during primary production, it is anticipated that oil recovery per acre or per acre-foot from the entire Chimney Hill area will be somewhat less than that of the pilot test area.
Waterflood performance of the Bois d'Arc and that 'of the Chimney Hill were radically different. In the Bois d'Arc, injection of 2,900 to 3,500 bbl of water per acre was sufficient to flood out most wells, demonstrating rapid channeling through a small fraction of the pore space. Even within this fraction there was little or no evidence of formation of an "oil bank" since only a few wells had significant increase in oil production rate before fioodout. In contrast, 14,000 bbl of water per acre was injected into a much thinner section of Chimney Hill before there was any response at production wells; and although it cannot be determined how much was lost to the Bois d'Arc, it is possible that the current cumulative 37.500 bbl/acre has been injected primarily into the Chimney Hill without evidence of complete fillup at all first-row offsets surrounding the pilot test. Except for a period of early high water production, believed to be due to inadv ertent Hooding through the Bois d'Arc, the gross performance of the flood was conventional. There was a gradual and then rapid increase in oil production rate to 20 times the prellood rate — indicative of formation of an oil bank — followed by decline in oil rates as water cut increased. The radical difference in these two performance factors — fillup and oil displacement — between the Bois d'Arc and Chimney Hill in two sections of a carbonate sequence only 200 ft apart demonstrates dramatically the control of reservoir performance by the internal proper-tics of the reservoir rock.
Oil and Gas Recovery Composite production performance of the entire
JS, 1 4
Fig. 11—Chimney Hill pilot waterflood performance.
FF-BRl'ARY. 1969

West Edmond Hunton reservoir is presented in Fig. 3. Peak oil production rate of 87,500 B/D was reached in Sept., 1945. Due to reduction in allowable and application of GOR penalties it declined to 35,000 BOPD in Sept., 1947, just before unitization became effective. It was increased to 46,300 B/D in Oct., 1947, but significant cutbacks were made immediately thereafter to reduce gas venting in the field. Since early 1950 substantially all gas has been processed and sold. Processing facilities limited gas production, and thus oil production, until early 1953.
By Dec., 1968, oil production rate had declined to 920 B/D of which 640 B/D was from wells that had responded to the Chimney Hill waterflood. The remaining 280 BOPD and 109 MMcf/D of gas are produced from 87 other active wells — an average of 3.2 BOPD and 125 Mcf /D per well — very close to the economic limit of operation. Reservoir pressure currently is 200 to 300 psi based on surface pressures and fluid levels of wells outside the waterflood and water-invaded areas. Of the 750 productive Hunton wells drilled in the field. 471 have been plugged. 80 are temporarily abandoned. 52 are used for water injection. 94 are producing from the Bois d'Arc only, and 53 wells in the Chimney Hill waterflood area are either producing or shut in awaiting response to waterflood.
As of Jan. 1, 1969. cumulative recovery from the Hunton was 106.7 million bbl of oil and at least 961 Bcf of cas. Cumulative waterflood oil from the Chimney Hill is 1.8 million bbl subsequent to production response to the flood on an individual well basis. This leaves about 105 million bbl of oil — 45 bbl/acre-ft — as the primary recovery from the Hunton. Because of the great uncertainty discus*£d here, about the amount of oil initially in place, this recovery cannot be expressed accurately as a percentage recovery efficiency. In my oninion the oil in place initially was not greater than 300 to 400 million, bbl, indicating a possible primary recovery efficiency of 25 to 35 percent.
Conclusions Many observations, interpretations and indicated conclusions are reported throughout this review of West Edmond. Among the most important and most general of these are the following.
1. Non-oil-stained gas-bearing cores, gas-condensate production 350 ft below highest proved oil, and a twofold discordance between actual gas production and volumetric considerations of solution gas are strongly presumptive evidence that free gas and/or gas adsorbed on internal rock surfaces existed initially in very low permeability matrix rock dispersed throughout the oil zone. Thus production of oil at solution GOR initially is not necessarily sufficient
Original manuscript received in Society of Petroleum Engineers office July 31, 1968. Revised manuscript received J a n . 6. 1969. Paper (SPE 2314) was presented at S P E 43rd Annual Fall Meeting held In Houston. Tex.. Sept. 29-0ct. 2. 1968. © Copyright 1969 American Institute of Mining. Metallurgical, and Petroleum Engineers, Inc.
Th is paper will be printed in Transactions volume 246. which will cover 1969.
evidence that liquid oil is the only hydrocarbon phase present in the reservoir in the vicinity of such weils
2. Continuing pressure buildup for more than 2 years in a large shut-in area where gas injection resulted in significant pressure interference between 40-acre-spaced wells in a few weeks demonstrates that conventional transient pressure analyses dominated by considerations of radial flow are inadequate to explain pressure performance of this reservoir.
3. Production performance in the area of natural water influx, GOR changes and tracer movement in pilot gas injection tests, and large-scale waterfiooding demonstrate that flow of these extraneous fluids in the Bois d'Arc section of the Hunton is essentially confined to 5 to 10 percent of the pore volume nnd that they are substantially ineffective in displacing additional oil over and above that recovered by natural gas drive. This actual performance is in accord with predictions made in 1946 by Littlefield et al.' from core studies.
4. Contrast between severe water channeling in the Bois d'Arc and successful waterfiooding in the Chimney Hill 200 ft lower in the same carbonate sequence of the Hunton highlights the need for more quantitative geologic description of reservoir rock oriented toward better understanding of the distribution ol and movement of fluids within those rocks.
5. The various features of performance of this reservoir analyzed here demonstrate the need for a total approach to reservoir engineering. Over-emphasis of any one method fails to account for the many complexities introduced by the internal anatomy of the reservoir rock.
Acknowledgments Appreciation is expressed to the working interest owners of the West Edmond Hunton Lime Unit for permission to publish the performance of this reservoir. The interpretation of these data is that of the author. Such release (.information does not necessarily mean concurrence in these interpretations by the various working interest owners. Permission from Sohio Petroleum Co. to publish this report is also acknowledged.
References 1. Littlefield, Max, Gray, L. L. and Godbold, A. C : "A
Reservoir Study of the West Edmond Hunton Pool, Oklahoma", Trans., AIME f 1948) 174, 131-155.
2. McGee, D. A. and Jenkins, H. D.: "West Edmond Field, Central Oklahoma", Bull., AAPG (Nov., 1946) 30, No. 11, 1797.
3. Elkins, Lincoln F.t "Discussion of A Reservoir Study of the West Edmond Hunton Pool, Oklahoma", Trans.. AIME (1948) 174, 159-162.
4. Confidential Report to the West Edmond Engineering Assn., USBM (1945).
5. Matthews, C. S. and Russell, D. G.: Pressure Buildup and Flow Tests in Wells, Monograph Series, Society of Petroleum Engineers, Dallas, Tex. (1967) 1.
6. Carslaw, H. S. and Jaeger, J. C : Conduction of Heat in Solids, 2nd Ed., Oxford at the Clarendon Press (1959).
7. Brownscombe, E. R. and Dyes, A. B.: "Water-Imbibition Displacement — A Possibility for the Spraberrv," Drill, and Prod. Prac, API (1952) 383.
•8. Owens, W. W. and Archer, D. L.: "Waterflood Pressure-Pulsine for Fractured Reservoirs", J. Pet. Tech. (June. 1966)~745-752. JDPT
232 JOURNAL OF PETROLEUM TECHNOLOGY


xrr
uufo jod mo 01 £9-12-11 6u)M0|j u jo j j S4|nsay dnppng j o a+oy M&IH
CO
cT; Cf _
r-
u
<M
00 ro O
ID ro O
10 o
CVJ 10 O
O ro O
co cvi O
co cvi O
cvi o
cvj CVI o
O Cvi O
VISd — 1 9 ,0SW. I V 3ynSS3Md


" ' • '. • : ~ j !
: 1 ; 1 • i i . " i l , ! :
1 1 | i j ;
! ; , , ! ——- : I i
CvJ t to X
UJ
<C
o


11111111111111111 n 1111 M 111111111111111111111111111 1111111111111ii11111 i i i 11 ,1 | i 111 n i I I | i 11111111
A-16 FRAC
o CU
O
o
' " I I I I I I I I I I I I I I I I I I I I I I I 11 1 I I I I I I I 1 I I I I I I I I I I I I I I I I I I I I I I I I H I I I I I I I • I I I I I I I I I I I I I I I I I O
o o o o o o o o o o o O 00 IO T CM d i n T T T T •V CU CVJ CVJ CM CU CM
O
o .—. u.
^ cr o o d £ o —r-l
LU o n o y-cn
o
o IO
O i n
o ro
co ffi cu cu co OJ
JM CO CVJ
o ro cu
>• Q
f— 00
CO o , CO
UJ | j
o LL. in
CO o CJ — <£ OJ m
j CO
[LA
[AV
CD
co CO
IT) 03 CD CD CD
CD
CO
O O
ro
CD
CD
UJ UJ I - X
n
i i . cr co i -in UJ i -JC
i
ru
(VI
ro
u j o cr o
(ISd) 3HnSS3Hd


i 11 M 111 i ] 11 11i n 11111 i n 1111111 u i n 11 [11 n 1111i i i i i i i 111 i1111111i 11 [ 11 i 111 i 111111111111 ] I M 1111 I T
A - 1 6 FRAC
I I I I I I I I I I I I I I I I I I I I I I I I I I I , 111 • 11 • 1 1 1 1 1 1 n t 1 1 1 1 1 1 1 1 1 1 1 1 1 1 1 1 1 1 1 ) i I I i n 1 1 1 1 1 1 1 1 I I 1111111111
Zl on rx r> o o
o UJ
o ' l -cn
o o o o o o o IT)
cvi -<r o • f
CVI CVJ CVI CVI CVI cu 8 cn cu 8
CVI
>-Q Z) r— CO
a _ j
LU
co o CJ
>
CD
en LO
DO O 1 o CD
QD -~ O i n ro
CO (SJ
o LU D_ cvj CD X
i ZD CD <c <C
CD
cc CD
~^ OJ ~3 T
O CD
uj i i i I- X - 1 . l -H
1—
(ISd) 3dnSS3Ud


cr UJ
E < CO O h LU O z < i— EO
Q LU
5 D O _ J < o
( 1 0 ) . 0 0 2 9 . V i t T ' t S J o B
4
O
u -
o S
i 5 I 3 o 3
riso — n o ) , c o a j » i*re$3«o — 11 ti .ooti $ mrtcfiHW