pew research center - for release october 16,...
TRANSCRIPT

FOR RELEASE OCTOBER 16, 2017
Globally, Broad Support for Representative and Direct Democracy But many also endorse nondemocratic alternatives BY Richard Wike, Katie Simmons, Bruce Stokes and Janell Fetterolf
FOR MEDIA OR OTHER INQUIRIES:
Richard Wike, Director, Global Attitudes Research
Katie Simmons, Associate Director, Research
Bruce Stokes, Director, Global Economic Attitudes
Rhonda Stewart, Senior Communications Manager
202.419.4372
www.pewresearch.org
RECOMMENDED CITATION: Pew Research Center, October, 2017, “Globally, Broad Support for Representative and Direct Democracy”

1
PEW RESEARCH CENTER
www.pewresearch.org
About Pew Research Center
Pew Research Center is a nonpartisan fact tank that informs the public about the issues, attitudes
and trends shaping America and the world. It does not take policy positions. The Center conducts
public opinion polling, demographic research, content analysis and other data-driven social
science research. It studies U.S. politics and policy; journalism and media; internet, science and
technology; religion and public life; Hispanic trends; global attitudes and trends; and U.S. social
and demographic trends. All of the center’s reports are available at www.pewresearch.org. Pew
Research Center is a subsidiary of The Pew Charitable Trusts, its primary funder.
© Pew Research Center 2017

2
PEW RESEARCH CENTER
www.pewresearch.org
Table of Contents
Overview: Globally, Broad Support for Representative and Direct Democracy 3
Shallow commitment to representative democracy 5
Those in wealthier, more democratic nations are more committed to representative democracy 6
Even in rich, well-established democracies, nondemocratic models find some support 8
Education, ideology key drivers of support for nondemocratic alternatives 9
Satisfaction with democracy’s performance is tied to partisanship, the economy 11
1. Many unhappy with current political system 13
Mixed reviews of the way democracy is working 13
Lack of trust in national government 16
People in more rapidly growing economies more trusting of government 18
2. Democracy widely supported, little backing for rule by strong leader or military 20
Many publics want a direct say 22
Technocracy has its champions 25
Some support for rule by strong leader 26
Significant minorities support military rule 28
Acknowledgments 31
Methodology 32
Appendix: Political categorization 33

3
PEW RESEARCH CENTER
www.pewresearch.org
Globally, Broad Support for Representative and Direct Democracy But many also endorse nondemocratic alternatives A deepening anxiety about the future of democracy around the world has spread over the past few
years. Emboldened autocrats and rising populists have shaken assumptions about the future
trajectory of liberal democracy, both in nations where it has yet to flourish and countries where it
seemed strongly entrenched. Scholars have documented a global “democratic recession,” and
some now warn that even long-established “consolidated” democracies could lose their
commitment to freedom and slip toward more authoritarian politics.
A 38-nation Pew Research Center survey finds there are reasons for calm as well as concern when
it comes to democracy’s future. More than half in each of the nations polled consider
representative democracy a very or somewhat good way to govern their country. Yet, in all
countries, pro-democracy attitudes coexist, to varying degrees, with openness to nondemocratic
Widespread support for representative and direct democracy, but many are also open to nondemocratic alternatives Would __ be a good or bad way of governing our country?
Note: Percentages are global medians based on 38 countries. Full question wordings for political systems: Representative democracy, “A democratic system where representatives elected by citizens decide what becomes law”; Direct democracy, “A democratic system where citizens, not elected officials, vote directly on major national issues to decide what becomes law”; Rule by experts, “Experts, not elected officials, make decisions according to what they think is best for the country”; Rule by a strong leader, “A system in which a strong leader can make decisions without interference from parliament or the courts”; Rule by the military, “The military rules the country.” Source: Spring 2017 Global Attitudes Survey. Q29a-e.
PEW RESEARCH CENTER

4
PEW RESEARCH CENTER
www.pewresearch.org
forms of governance, including rule by experts, a strong leader or the military.
A number of factors affect the depth of the public’s commitment to representative democracy over
nondemocratic options. People in wealthier nations and in those that have more fully democratic
systems tend to be more committed to representative democracy. And in many nations, people
with less education, those who are on the ideological right and those who are dissatisfied with the
way democracy is currently working in their country are more willing to consider nondemocratic
alternatives.
At the same time, majorities in nearly all nations also embrace another form of democracy that
places less emphasis on elected representatives. A global median of 66% say direct democracy – in
which citizens, rather than elected officials, vote on major issues – would be a good way to govern.
This idea is especially popular among Western European populists.
These are among the major findings of a Pew Research Center survey conducted among 41,953
respondents in 38 countries from Feb. 16 to May 8, 2017.
The survey reveals that large numbers in many nations would entertain political systems that are
inconsistent with liberal democracy. For instance, when asked about a system in which experts,
not elected representatives, make key decisions based on what they think is best for the country, a
median of 49% across these 38 countries say this would be a good way to run their nation.
Unconstrained executive power also has its supporters. In 20 countries, a quarter or more of those
polled think a system in which a strong leader can make decisions without interference from
parliament or the courts is a good form of government. This type of regime is particularly popular
in several nations where executives have extended or consolidated their power in recent years,
such as the Philippines, Russia and Turkey.
While military rule is the least popular political system tested on the survey, even this finds some
support across the globe. Notable minorities in many nations consider it a good way to govern,
and half or more express this view in Vietnam, Indonesia, India and South Africa.

5
PEW RESEARCH CENTER
www.pewresearch.org
44%40
524847
4437363534
3118
37
7
4031
2615
1288
15
3633
2718
1227
20191817
1111
18
2424
2119
15139
19
23
42%46
4042
3734
4247
454046
6042
61
4847
516775
7967
67
5128
5468
4151
64585963
6755
61
4547
3938
3846
4845
47
7%7
65
869
1010
171215
10
22
71313
1299
99
736
1213
3213
1015171218
2216
1815
2324
2528
2724
13
CanadaU.S.
SwedenGermany
NetherlandsGreece
ItalyUK
FranceSpain
PolandHungaryMEDIAN
Russia
AustraliaSouth Korea
JapanPhilippinesIndonesia
VietnamIndia
MEDIAN
IsraelJordanTurkey
LebanonTunisia
MEDIAN
GhanaSenegal
KenyaTanzania
NigeriaSouth Africa
MEDIAN
ArgentinaVenezuela
BrazilChile
ColombiaPeru
MexicoMEDIAN
GLOBAL MEDIAN
Committed Less committed Nondemocratic
Shallow commitment to representative democracy
To examine the public’s support of
representative democracy over nondemocratic
alternatives, we constructed a commitment to
representative democracy index. (The index
does not include the question about direct
democracy.) Respondents are classified as
“committed democrats” if they support a
system in which elected representatives
govern but do not support rule by experts, a
strong leader or the military (i.e.,
nondemocratic governments). Respondents
who say a representative democracy is good
but also support at least one nondemocratic
form of government are classified as “less-
committed democrats.” And those who do not
support representative democracy and instead
support at least one nondemocratic form of
government are classified as “non-democrats.”
Roughly a quarter of people (median of 23%)
across the 38 countries surveyed are
committed democrats. About twice as many
(median of 47%) are less-committed
democrats. Relatively few (13%) are
nondemocratic. A small share (8%) does not
endorse any of these forms of governance.
Commitment to representative democracy is
strongest in North America and Europe. A
median of 37% across the 10 European Union
nations polled, as well as 40% in the United
States and 44% in Canada, support democracy
while rejecting nondemocratic forms of
government. Australia is the only country
outside of North America and Europe where at
least four-in-ten are categorized as committed
democrats.
Substantial percentages willing to consider nondemocratic options Commitment to representative democracy index
Note: Only respondents saying at least one political system included in the index would be a good way to govern their country are shown. Source: Spring 2017 Global Attitudes Survey. Q29b-e.
PEW RESEARCH CENTER

6
PEW RESEARCH CENTER
www.pewresearch.org
Sweden (52%) shows the strongest level of commitment of all countries surveyed, with roughly
half holding this view. By contrast, Russia (7%) has the lowest percentage of committed
democrats.
A median of 27% in the Middle East and North Africa are classified as committed to representative
democracy. In this region, Israelis (36%) and Jordanians (33%) are most likely to prefer
democracy to nondemocratic forms of government. But roughly one-in-five or fewer are
committed to representative democracy in Latin America (median of 19%), sub-Saharan Africa
(median of 18%) and the Asia-Pacific (median of 15%).
Those in more democratic, wealthier nations are more committed to representative democracy
In general, public commitment to representative democracy is highest in countries that have a
well-functioning democracy. The Economist Intelligence Unit’s Democracy Index is one measure
of how democratic a country is. The EIU index ranks countries from 0 to 10, where 0 indicates an
authoritarian regime and 10 represents a full democracy. The ranking is based on 60 indicators of
a country’s performance across five categories: the electoral process and pluralism, civil liberties,
functioning of government, political participation and political culture. The index is closely
correlated with our classification of committed democrats. For example, the Netherlands is ranked
higher on the EIU index with a score of 8.8, and 47% of the Dutch can be described as committed
supporters of representative democracy. Meanwhile, Nigeria has a democracy index score of 4.5
and just 11% of Nigerians meet the committed democrat criteria.

7
PEW RESEARCH CENTER
www.pewresearch.org
U.S.
Canada
France
Germany
Greece
Hungary
Italy
Netherlands
PolandSpain
Sweden
UK
Russia
Australia
India
Indonesia
Japan
Philippines
South Korea
Vietnam
Israel
Jordan
Lebanon
Tunisia
Turkey
GhanaKenya
Nigeria
Senegal
South Africa
Tanzania
ArgentinaBrazil
Chile
Colombia
MexicoPeru
Venezuela
0
10
20
30
40
50
60
2 3 4 5 6 7 8 9 10
Democracy index score
High incomeUpper-middle incomeLower-middle incomeLow income
%
The above scatterplot also reveals another pattern: Countries that are classified as more fully
democratic and that have a higher percentage of the public committed to representative
democracy also tend to be wealthier. In the scatterplot, the countries are color-coded by their
economic ranking from the World Bank, which classifies countries into four income categories
based on their per-capita gross national income: high, upper-middle, lower-middle and low
income. The group of countries in the upper-right-hand corner of the scatterplot – where the
Democracy Index ranking and the percentage of committed democrats are highest – are all upper-
income countries.
Countries with more democratic systems, greater wealth show more widespread commitment to representative democracy % committed to representative democracy*
*Respondents are classified as “committed democrats” if they support a system in which elected representatives govern and do not support rule by experts, the military or a strong leader who can make decisions without interference from parliament or the courts. Source: Spring 2017 Global Attitudes Survey. Q29b-e. Democracy index data from The Economist Intelligence Unit’s Democracy Index 2016. Income categorization from the World Bank, based on GNI per capita, accessed Sept. 25, 2017.
PEW RESEARCH CENTER
Correlation = 0.63

8
PEW RESEARCH CENTER
www.pewresearch.org
Even in rich, well-established democracies, nondemocratic models find some support
Although commitment to representative
democracy is relatively high in wealthy, strong
democracies, notable minorities in these types
of countries are open to nondemocratic
alternatives.
Rule by experts has considerable appeal in
many of these nations, with roughly half or
more in Hungary, South Korea, Poland, Spain
Japan, Israel and Chile suggesting this could be
a good way of running their country.
There is less support for a strong leader who
can make decisions without interference from a
parliament or courts. Still, about a quarter or
more back this idea in Japan, Italy, the United
Kingdom, Israel, Hungary, South Korea and the
U.S. And while military rule is relatively
unpopular, 17% endorse this idea in the
established democracies of the U.S., Italy and
France.
In high-income countries, many would consider nondemocratic alternatives Rule by __ would be a good way to govern our country
Note: Full question wordings for political systems: Rule by experts, “Experts, not elected officials, make decisions according to what they think is best for the country”; Rule by a strong leader, “A system in which a strong leader can make decisions without interference from parliament or the courts”; Rule by the military, “The military rules the country.” Source: Spring 2017 Global Attitudes Survey. Q29c-e.
PEW RESEARCH CENTER

9
PEW RESEARCH CENTER
www.pewresearch.org
Education, ideology key drivers of support for nondemocratic alternatives
At the individual level, education has a large
impact on attitudes about governance. In 22 of
the countries surveyed, people with higher
levels of education are more likely than those
with less education to be classified as
committed to representative democracy.1
Among the three types of nondemocratic
governments asked about, the education gap is
largest on rule by the military. People with less
education are more likely than those with more
education to say a military government would
be a good thing in 23 countries. In 18 of these
countries, the gap is at least 10 percentage
points. For example, in the U.S., 24% of people
with a secondary education or less say rule by
the military would be good for their country,
compared with 7% of those with more than a
secondary education.
1 For the purpose of comparing education groups across countries, we standardize education levels based on the United Nations’ International Standard Classification of Education. The lower education category is below secondary education and the higher category is secondary or above in Argentina, Brazil, Chile, Colombia, Ghana, India, Indonesia, Jordan, Kenya, Lebanon, Mexico, Nigeria, Peru, Philippines, Senegal, South Africa, Tanzania, Tunisia, Turkey, Venezuela and Vietnam. The lower education category is secondary education or below and the higher category is postsecondary or above in Australia, Canada, France, Germany, Greece, Hungary, Israel, Italy, Japan, Netherlands, Poland, Russia, South Korea, Spain, Sweden, UK and U.S.
People with less education more likely to support military government Military rule would be a good way to govern our country
Note: Only statistically significant differences shown. Source: Spring 2017 Global Attitudes Survey. Q29e.
PEW RESEARCH CENTER

10
PEW RESEARCH CENTER
www.pewresearch.org
There are also significant ideological and
partisan divides in many of these countries on
the questions about nondemocratic
alternatives. Support for a strong, unchecked
leader, for example, is significantly more
common on the ideological right in Australia,
Italy, the UK, the U.S., Canada, Greece and
Germany.
The strong leader model also finds backing in
Italy among those favorable to Forza Italia, the
political party of former Italian Prime Minister
Silvio Berlusconi – 43% of those with a
favorable view of the party endorse this
approach to governing. In Britain, it is more
popular among those with a positive opinion of
the United Kingdom Independence Party
(UKIP).
And in the U.S., a third of Republicans say a
strong leader who can govern without
interference from other branches of
government is a good thing, compared with
20% of independents and 17% of Democrats.
Ideological right more supportive of strong leader ruling without constraints A system in which a strong leader can make decisions without interference from parliament or the courts would be a good way to govern our country
Note: In U.S., ideology is defined as conservative (right), moderate (center) and liberal (left). Only statistically significant differences shown. Source: Spring 2017 Global Attitudes Survey. Q29c.
PEW RESEARCH CENTER

11
PEW RESEARCH CENTER
www.pewresearch.org
46%
52%
Satisfied Not satisfied
Satisfaction with democracy’s performance is tied to partisanship, the economy
In 26 of the 38 countries surveyed, people who are satisfied
with their democracy are more likely to support representative
democracy as a form of government. In turn, satisfaction with
democracy varies considerably across regions and countries,
and even within countries. People’s evaluations of democracy’s
functioning differ considerably based on their economic
attitudes and partisan orientations.
Overall, a global median of 46% say they are satisfied with the
way democracy is working in their country, while 52% are not.
Satisfaction is most common in Asia-Pacific and sub-Saharan
Africa, and least common in Latin America. In Europe,
opinions vary widely across nations. More than seven-in-ten
are happy with their democracy in Sweden, the Netherlands
and Germany. But two-thirds or more are unhappy in Italy,
Spain and Greece – all southern European nations that have
struggled economically over the past decade.
Views about the economy are strongly related to satisfaction
with democracy. In nearly every country, people who say the
national economy is currently doing well are more likely than
those who say it is doing poorly to be satisfied with the political
system. In 29 of 36 countries, the gap in democratic satisfaction between those who are happy
with the economy and those who are unhappy is at least 20 percentage points.
Publics split on how well democracy is working __ with the way democracy is working in our country
Note: Percentages are global medians across 36 countries. Question not asked in Turkey or Vietnam. Source: Spring 2017 Global Attitudes Survey. Q9.
PEW RESEARCH CENTER

12
PEW RESEARCH CENTER
www.pewresearch.org
The gap is largest in Venezuela – a nation beset
by economic difficulties – where 72% of those
who think the economy is in good shape are
satisfied with how democracy is working,
compared with only 14% among Venezuelans
who say the economic situation is bad.
European countries also tend to have some of
the largest differences on satisfaction with
democracy between those who think the
economy is doing well and those who do not,
including gaps of more than 50 percentage
points in Sweden and Hungary.
Satisfaction with the way democracy is working
is also tied to how people see the past and the
future. In 35 nations, satisfaction is lower
among those who think life for people like
themselves is worse today than it was 50 years
ago. In 34 countries, satisfaction is lower
among those who believe children growing up
today will be financially worse off than their
parents.
In addition, people who support the party in
power are much more likely to say they are
satisfied with the way democracy is working in
their country. For example, overall, 46% in the
U.S. are satisfied with how democracy is
working. However, fully 68% of Republicans
hold this view, compared with just 49% of
independents and 31% of Democrats.
Those upbeat on the economy more likely to be satisfied with democracy Satisfied with the way democracy is working in our country
Note: Only statistically significant differences shown. Question not asked in Turkey or Vietnam. Source: Spring 2017 Global Attitudes Survey. Q9.
PEW RESEARCH CENTER
13
PEW RESEARCH CENTER
www.pewresearch.org
30%51
202226
4744
536567
7479
50
36
112931
4147
6936
4758
6191
183233
435658
38
5467
7373
8278
9373
52
70%46
7977
735251
4434
312521
48
59
796969
5850
3064
523836
8
796664
564341
60
46282525
1817
625
46
CanadaU.S.
SwedenNetherlands
GermanyUK
PolandHungary
FranceItaly
SpainGreece
MEDIAN
Russia
IndiaIndonesia
PhilippinesAustralia
JapanSouth Korea
MEDIAN
IsraelJordanTunisia
Lebanon
TanzaniaGhana
SenegalKenya
South AfricaNigeria
MEDIAN
ArgentinaBrazilPeru
VenezuelaColombia
ChileMexico
MEDIAN
GLOBAL MEDIAN
SatisfiedNot satisfied
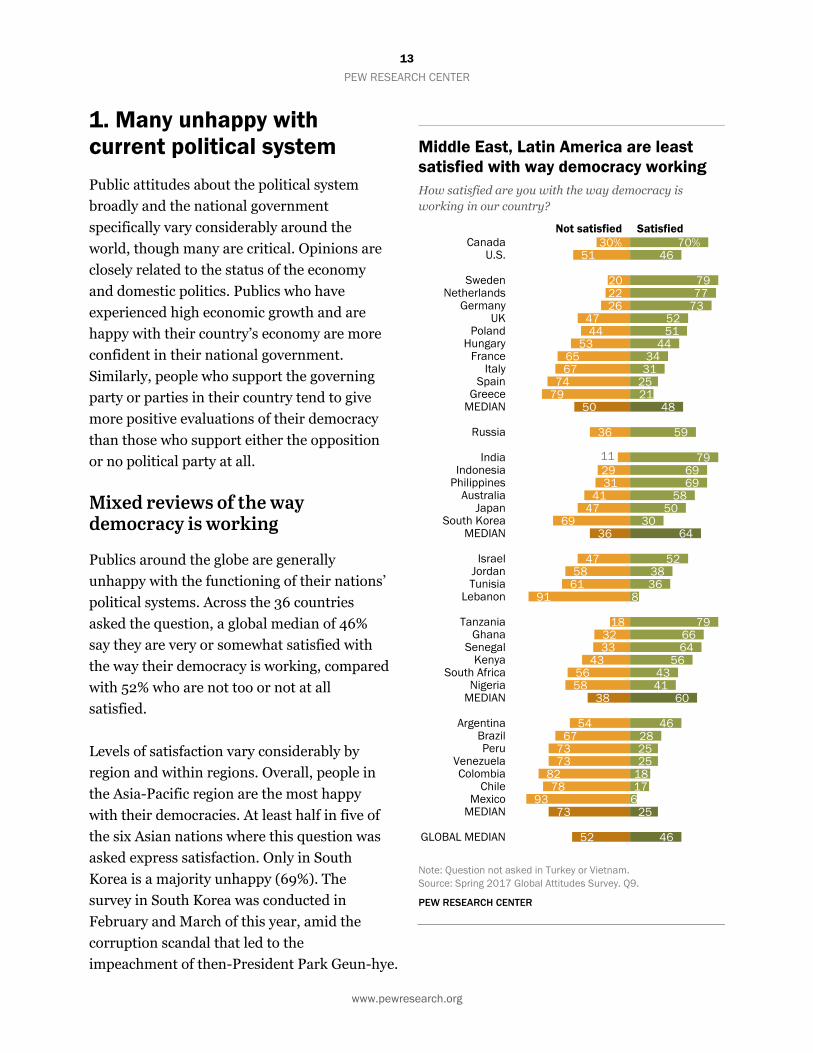
1. Many unhappy with current political system
Public attitudes about the political system
broadly and the national government
specifically vary considerably around the
world, though many are critical. Opinions are
closely related to the status of the economy
and domestic politics. Publics who have
experienced high economic growth and are
happy with their country’s economy are more
confident in their national government.
Similarly, people who support the governing
party or parties in their country tend to give
more positive evaluations of their democracy
than those who support either the opposition
or no political party at all.
Mixed reviews of the way democracy is working
Publics around the globe are generally
unhappy with the functioning of their nations’
political systems. Across the 36 countries
asked the question, a global median of 46%
say they are very or somewhat satisfied with
the way their democracy is working, compared
with 52% who are not too or not at all
satisfied.
Levels of satisfaction vary considerably by
region and within regions. Overall, people in
the Asia-Pacific region are the most happy
with their democracies. At least half in five of
the six Asian nations where this question was
asked express satisfaction. Only in South
Korea is a majority unhappy (69%). The
survey in South Korea was conducted in
February and March of this year, amid the
corruption scandal that led to the
impeachment of then-President Park Geun-hye.
Middle East, Latin America are least satisfied with way democracy working How satisfied are you with the way democracy is working in our country?
Note: Question not asked in Turkey or Vietnam. Source: Spring 2017 Global Attitudes Survey. Q9.
PEW RESEARCH CENTER

14
PEW RESEARCH CENTER
www.pewresearch.org
People in sub-Saharan Africa also tend to be more satisfied than others around the world with the
performance of their political system. Majorities in Tanzania, Ghana, Senegal and Kenya say their
democracy is working well. South Africans and Nigerians, however, are more dissatisfied.
Elsewhere, satisfaction with democracy is considerably lower. In North America, 70% of
Canadians say they think their political system is working well, but Americans are divided. Just
under half in the U.S. (46%) are happy with their democracy and 51% are unhappy.
While broad majorities in Sweden, the Netherlands and Germany say their political system is
functioning well, roughly half of British and Poles say the same. Nearly two-thirds or more in
southern Europe are unhappy with their democracies, including 79% in Greece.
Similarly, majorities in most countries surveyed in the Middle East and Latin America express
disappointment with how democracy is working in their nation. Mexicans and Lebanese are the
most dissatisfied, with at least nine-in-ten in each country who say their current political system is
not working well.

15
PEW RESEARCH CENTER
www.pewresearch.org
In many countries, partisanship has a
significant impact on attitudes about the
functioning of democracy. People who identify
with the current governing party or parties are
significantly more satisfied with their political
system than those who either support the
opposition or identify with no political party
(see Appendix for how governing party
supporters were coded). For example, in the
U.S., 68% of people who identify with the
Republican Party say they are satisfied with
their democracy, while just 40% of Americans
who do not identify with the Republican Party
say the same.
The partisan divisions over the functioning of
democracy are particularly large in Europe. Of
the 10 countries surveyed in the region, six
publics exhibit a gap of at least 20 percentage
points in democratic satisfaction between those
who identify with the governing party or parties
and those who do not. Outside of Europe, the
partisan divisions on this question are largest in
Venezuela (43 points), Israel (39) and Nigeria
(38).
Supporters of the parties in power are more satisfied with the way democracy is working Satisfied with the way democracy is working among __ of the governing political party/parties
Note: Only statistically significant differences shown. Source: Spring 2017 Global Attitudes Survey. Q9.
PEW RESEARCH CENTER

16
PEW RESEARCH CENTER
www.pewresearch.org
20%15
2426
159
1414
1351
20
393031
3667
2
1413
112
4851
2837
3422
142
1025
74
47%36
4743
5248
3528
2517
1212
47
4653
5144
5141
21
3735
1813
4119
4023
2022
1522
1215
1058
67%51
71696757494226201713
67
85838280574823
51482915
897068605444
29242217151212
CanadaU.S.
NetherlandsGermanySwedenHungary
UKPoland
ItalyFranceSpain
Greece
Russia
IndiaIndonesia
VietnamPhilippines
JapanAustralia
South Korea
IsraelJordanTunisia
Lebanon
TanzaniaGhanaKenya
SenegalNigeria
South Africa
VenezuelaBrazil
ArgentinaMexico
ChileColombia
Peru
Somewhat A lot Total
Lack of trust in national government
Attitudes about the
functioning of democracy are
closely tied to publics’ trust
in their national government.
People who are satisfied with
how democracy works in
their country also tend to say
they trust the national
government to do what is
right for the country. Given
that, the global distribution
of trust in national
governments is very similar
to attitudes about the
political system more
broadly. People in the Asia-
Pacific and sub-Saharan
Africa regions are more
positive about their national
government than others
around the world, while
publics in the Middle East,
Latin America and southern
Europe are especially
negative.
Still, some countries stand
out for their lack of trust. A
global median of 14% say
they trust their national
government a lot to do what
is right for the country. While
this percentage is quite low,
5% or less of the public
expresses this level of
confidence in their national
government in 10 of 37
Few worldwide have a lot of trust in their government How much do you trust the national government to do what is right for our country?
Note: Question not asked in Turkey. Source: Spring 2017 Global Attitudes Survey. Q4.
PEW RESEARCH CENTER

17
PEW RESEARCH CENTER
www.pewresearch.org
countries asked the question: Spain, Chile, Peru, France, South Korea, Brazil, Mexico, Lebanon,
Italy and Greece.
As with democratic satisfaction, attitudes about the national government are deeply partisan. In
30 of the 37 countries, people who identify with the governing party express more trust in the
government than those who do not identify with the leading party. In 13 countries, the partisan
gap is 30 percentage points or more.
Another key political driver of
attitudes about the national
government in Europe is
support for populist parties. In
many European countries,
where rising populist
sentiment has upended
traditional political dynamics,
people who have favorable
views of populist parties are
considerably more skeptical of
the national government than
those who have an
unfavorable attitude toward
these parties. The difference is
largest in Germany: 65% of
those who have a positive view
of the Alternative for Germany
party (AfD) say they trust the
national government not
much or not at all, compared
with just 24% of those who
have a negative view of the
party.
Moreover, most of the difference in trust between populist party supporters and their fellow
countrymen comes in saying they trust the government “not at all.” In France, broad majorities of
both those who like the National Front (FN) and those who do not say they lack trust in the
government (90% and 76%, respectively). But among National Front supporters, 71% say they
trust the government not at all, compared with 35% of people who have an unfavorable view of
FN.
Those who favor populist parties in Europe express deeper levels of distrust of government Do not trust the national government to do what is right for our country
Note: Only statistically significant differences shown. Source: Spring 2017 Global Attitudes Survey. Q4.
PEW RESEARCH CENTER

18
PEW RESEARCH CENTER
www.pewresearch.org
-3% -2% -1% 0% 1% 2% 3% 4% 5% 6% 7% 8%
Average GDP Growth (2012-2016)
North AmericaEuropeRussiaAsia/PacificMiddle EastAfricaLatin America
100%
80
60
40
20
Correlation = 0.57
TanzaniaIndia
Philippines
VietnamIndonesia
GhanaKenya
SenegalNigeria
IsraelAustralia
Poland
TunisiaSouth Korea
PeruColombia
ChileMexicoLebanon
FranceSpain
Italy
Greece
ArgentinaBrazil
South Africa
U.S.UK
JordanHungary
SwedenCanada
Japan
Russia
Netherlands
Germany
People in more rapidly growing economies more trusting of government
In addition to politics, the status of the economy is strongly related to people’s trust in their
government. Publics that have experienced a higher level of economic growth over the past five
years tend to have more confidence in their national government to do the right thing for their
country. For example, in India, where the economy has grown on average by 6.9% since 2012, 85%
trust their national government. Meanwhile, just 26% of Italians have confidence in their
government; their economy has contracted over the past five years (-0.5% average GDP growth).
People in high-growth-rate countries more likely to trust their national government Trust the national government to do what is right for our country
Note: Venezuela excluded due to lack of economic data. Source: 2017 Spring Global Attitudes Survey. Q4. Average GDP growth calculated from World Bank data, accessed Sept. 8, 2017.
PEW RESEARCH CENTER

19
PEW RESEARCH CENTER
www.pewresearch.org
This pattern appears at the individual level as
well. Within each country, people who say the
economy is doing well are more likely to trust
the national government than those who say
the economy is bad. In 29 of the 37 countries
asked the question, the trust gap between those
who are happy with the economy and those
who are unhappy is at least 20 percentage
points. As with partisan divisions on this
question, European countries tend to have
some of the largest differences between those
who think the economy is good and those who
do not.
Those upbeat about economy more likely to trust government How much do you trust the national government to do what is right for our country?
Note: Only statistically significant differences shown. Source: Spring 2017 Global Attitudes Survey. Q4.
PEW RESEARCH CENTER

20
PEW RESEARCH CENTER
www.pewresearch.org
10%13
78
1214
1813
201715
2215
23
106
9161817
810
111416
3639
16
1416
212021
2821
2220
3332
3534
3933
17
87%86
9290
8484
8179787877
7480
68
888786
82787775
82
8785
8061
5380
8581
787777
6678
7169
59585858
5358
78
43%48
5446
4342
232931
2620
3131
26
43333432
1922
4433
4151
432222
41
6253
4853
4234
51
3132
831
229
3231
33
CanadaU.S.
SwedenGermany
UKNetherlands
FranceItaly
GreeceHungary
PolandSpain
MEDIAN
Russia
AustraliaVietnam
IndonesiaPhilippines
South KoreaJapanIndia
MEDIAN
IsraelLebanon
TurkeyJordanTunisia
MEDIAN
GhanaTanzania
NigeriaSenegal
KenyaSouth Africa
MEDIAN
VenezuelaArgentina
BrazilPeruChile
MexicoColombia
MEDIAN
GLOBAL MEDIAN
Very goodTotal bad Total good
2. Democracy widely supported, little backing for rule by strong leader or military
Governance can take many forms: by elected
representatives, through direct votes by citizens,
by a strong leader, the military or those with
particular expertise. Some form of democracy is
the public’s preference.
“The effect of [a representative democracy] is …
to refine and enlarge the public views, by passing
them through the medium of a chosen body of
citizens, whose wisdom may best discern the true
interest of their country,” wrote James Madison
in the Federalist Papers No. 10 in 1787 as
Americans debated the nature of their new
government. And a democratic system where
representatives elected by citizens decide what
becomes law is now the mode of governance in
one form or another in most of the 38 countries
included in the 2017 Pew Research Center survey.
A global median of 78% back government by
elected representatives. But the intensity of this
support varies significantly between nations.
Roughly six-in-ten Ghanaians (62%), 54% of
Swedes and 53% of Senegalese and Tanzanians
hold the view that representative democracy is
very good. Just 8% of Brazilians and 9% of
Mexicans agree. The only countries where there
is significantly strong opposition to
representative democracy are Colombia (24% say
it is very bad) and Tunisia (23% very bad).
In many countries, skepticism of representative
democracy is tied to negative views about
Publics around the world support representative democracy Would a democratic system where representatives elected by citizens decide what becomes law be a good or bad way of governing this country?
Source: Spring 2017 Global Attitudes Survey. Q29b. PEW RESEARCH CENTER

21
PEW RESEARCH CENTER
www.pewresearch.org
economic conditions. In 19 countries, people who say their national economies are in bad shape
are less likely to believe representative democracy is good for the country.
In 23 nations, the belief that representative democracy is good is less common among people who
think life is worse today than it was 50 years ago. In Spain, for example, just 63% of those who
believe life is worse than before consider representative democracy a good thing for their country,
compared with 80% who support representative democracy among those who say life is better
than it was a half century ago.
Similarly, pessimism about the next generation is related to negative views about representative
democracy. In roughly half the nations surveyed those who think today’s children will be worse off
financially than their parents are less likely than others to say representative democracy is a good
form of government. Among Mexicans who believe the next generation will be worse off, only 52%
say representative democracy is good for the country. Backing for government by elected
representatives is at 72% among those who say children will be better off than their parents.
Attitudes toward representative democracy are also associated with opinions about diversity. In
more than a third of the nations surveyed those who think that having people of many different
backgrounds – such as different ethnic groups, religions and races – makes their country a worse
place to live are less likely than others to support government by elected representatives. In South
Africa, a country with a troubled history of racial oppression and conflict, 73% of those who
embrace diversity describe representative democracy as a good thing for their country; just 54%
agree among those who say diversity makes South Africa a worse place to live.

22
PEW RESEARCH CENTER
www.pewresearch.org
31%30
202223252017
264138
4324
19
82016
2925
3431
25
1216
355557
35
193130
35363633
283027
303233
3830
30
67%67
78757474
716967
575655
70
74
7676
736765646267
8483
6041
3360
806766
6261
5764
6563636261
5852
62
66
29%25
3938
322831
2220
15191725
39
51222823
1925
1723
5348
241612
24
5246
4336
3129
40
3441
2816
2633
1028
28
U.S.Canada
GreeceSpain
GermanyFrance
ItalyPoland
HungarySweden
UKNetherlands
MEDIAN
Russia
IndiaSouth Korea
VietnamPhilippines
JapanAustralia
IndonesiaMEDIAN
TurkeyLebanon
IsraelJordanTunisia
MEDIAN
KenyaGhana
SenegalTanzania
NigeriaSouth Africa
MEDIAN
ChileColombiaArgentina
MexicoVenezuela
PeruBrazil
MEDIAN
GLOBAL MEDIAN
Very goodTotal bad Total good
Many publics want a direct say
Direct democracy, a governing system where
citizens, not elected officials, vote directly on
major national issues, is supported by roughly
two-thirds of the public around the world,
with little difference in views between regions.
The strongest support for governing through
referenda is found in Turkey (84%), where
53% of the public say it would be very good to
have citizens vote on major national issues.
Lebanon (83%) and Kenya (80%) also show
broad support for direct democracy.
There is also strong backing for such
governance in Japan (65%) even though the
country has not had a referendum in the post-
World War II era.
In the U.S., Germany and the Netherlands,
people with a high school education or less are
more likely than those with more than a high
school education to support direct democracy.
Such differences are small in the U.S. (6
percentage points) and Germany (8 points)
but there is a 17-point differential in the
Netherlands (62% of those with less
educational attainment back direct
democracy, but only 45% of those with more
education agree).
In six of seven Latin American nations
surveyed, those with a secondary school
education or above are more supportive of
direct democracy than those with less than a
high school education. This educational divide
is 16 points in Chile and 14 points in Argentina
and Colombia. In each of these countries,
those with less education are less likely to hold
Widespread backing for citizens voting on major national issues Would a democratic system where citizens, not elected officials, vote directly on major national issues to decide what becomes law be a good or bad way of governing this country?
Source: Spring 2017 Global Attitudes Survey. Q29a.
PEW RESEARCH CENTER

23
PEW RESEARCH CENTER
www.pewresearch.org
an opinion of direct democracy.
In Latin America, there is also a generation gap in views of direct democracy. In Brazil, Chile,
Mexico and Venezuela, those ages 18 to 29 are more supportive than those ages 50 and older of
having citizens, not elected officials, vote directly on issues of major national importance.
Notably, in the U.S. it is people ages 30 to 49 who are most likely (73%) to back referenda.
In other countries there are sharp divisions along religious or ethnic lines. In Israel it is Arabs
(83%) more than Jews (54%) who favor direct democracy, and in Nigeria it is Muslims (70%)
more than Christians (55%).
Supporters of some populist
parties in Europe are
particularly enthusiastic about
direct democracy. In Spain,
88% of those who hold a
favorable view of Podemos say
citizens voting on national
issues would be good for the
country. In Germany, 84% of
AfD backers agree, as do 77%
of PVV supporters in the
Netherlands.
Support for direct democracy
can also be seen in other
recent Pew Research Center
findings in Europe. In the
wake of the United Kingdom’s
decision to leave the European
Union, a median of just 18% in
nine continental EU member
states say they want their
country to exit the EU. But
53% support holding a
national vote on their own
country’s EU membership.
In some countries, those favorable toward populist parties are more supportive of direct democracy A democratic system where citizens, not elected officials, vote directly on major national issues to decide what becomes law would be a good way of governing this country
Source: Spring 2017 Global Attitudes Survey. Q29a.
PEW RESEARCH CENTER

24
PEW RESEARCH CENTER
www.pewresearch.org
And such support is particularly strong among backers of Euroskeptic populist parties, many of
whom have promised their supporters a referendum on EU membership. (For more on European’s
attitudes about staying in the EU, see Post-Brexit, Europeans More Favorable Toward EU.)
And in six of the nine continental European nations surveyed, strong majorities of those who
believe that direct democracy is a very good form of governance support their own EU
membership referendum.

25
PEW RESEARCH CENTER
www.pewresearch.org
55%58
2334
4953555449
5659
6254
24
2214
3436
4144
5736
2738
455757
45
3338
4340
4749
42
4141
4643
4849
6046
46
41%40
685049
444442404039
3143
66
6765
6259
5249
4159
7052
4839
3648
6557
545351
4854
5352
474646
4331
46
49
CanadaU.S.
HungaryPoland
SpainGermany
FranceUKItaly
SwedenNetherlands
GreeceMEDIAN
Russia
VietnamIndia
PhilippinesIndonesia
South KoreaJapan
AustraliaMEDIAN
LebanonTurkeyIsrael
JordanTunisia
MEDIAN
NigeriaSenegal
TanzaniaSouth Africa
GhanaKenya
MEDIAN
MexicoPeruChile
ArgentinaVenezuelaColombia
BrazilMEDIAN
GLOBAL MEDIAN
GoodBad
Technocracy has its champions
The value of expert opinion has been
questioned in the eyes of the public in recent
years. But when asked whether a governing
system in which experts, not elected officials,
make decisions would be a good or bad
approach, publics around the world are
divided: 49% say that would be a good idea,
46% think it would be a bad thing.
Europeans (a median of 43%) and Americans
(40%) are the least supportive. But among
Europeans, roughly two-thirds of Hungarians
(68%) say leaving decision-making to experts
would be a good way to govern.
Asian-Pacific publics generally back rule by
experts, particularly people in Vietnam (67%),
India (65%) and the Philippines (62%). Only
Australians are notably wary: 57% say it would
be a bad way to govern, and only 41% support
governance by experts.
More than half of Africans surveyed also say
governing by experts would be a good thing for
their country. Nigerians (65%) are especially
supportive. And it is Nigerian Muslims more
than Christians who say this.
Young people in a number of advanced
economies are particularly attracted to
technocracy. In the U.S. the age gap is 10
percentage points – 46% of those ages 18 to 29
but only 36% of those ages 50 and older say it
would be good if experts, not elected officials,
made decisions. The young-old differential is
even greater in Australia (19 points), Japan
(18 points), the UK (14 points), Sweden (13
points) and Canada (13 points).
Publics generally divided on leaving governance to experts Would a system in which experts, not elected officials, make decisions according to what they think is best for the country be a good or bad way of governing this country?
Source: Spring 2017 Global Attitudes Survey. Q29d.
PEW RESEARCH CENTER

26
PEW RESEARCH CENTER
www.pewresearch.org
55%54
38454544
5863
527370
6355
13
1710
2117
2930
5021
3539
2736
6836
3439
4237
5768
41
2133
4249
5460
5449
43
76%81
667171
7684
87888990
9386
43
2843
4747
6174
7947
5460
6673
8466
505757
6166
8259
636768
75798181
75
71
22%17
292624
15131212109
613
48
555250
4231
2319
42
403332
2514
32
44393938
3216
39
272727
171717
1417
26
U.S.Canada
ItalyUK
HungaryPoland
SpainGreeceFrance
NetherlandsSweden
GermanyMEDIAN
Russia
IndiaIndonesia
PhilippinesVietnam
JapanSouth Korea
AustraliaMEDIAN
TurkeyTunisiaJordan
IsraelLebanonMEDIAN
South AfricaTanzania
KenyaNigeriaGhana
SenegalMEDIAN
BrazilMexico
PeruArgentinaColombia
VenezuelaChile
MEDIAN
GLOBAL MEDIAN
Very Bad Total goodTotal bad
Some support for rule by strong leader
Rule by a strong leader is generally unpopular,
though minorities of a substantial size back it.
A global median of 26% say a system in which
a strong leader can make decisions without
interference from parliament or the courts
would be a good way of governing. Roughly
seven-in-ten (71%) say it would be a bad type
of governance.
Opposition is particularly widespread in
Europe (a median of 86% oppose rule by a
strong leader), with strong opposition in
Germany (93%), Sweden (90%) and the
Netherlands (89%).
But autocracy is not universally opposed.
Roughly four-in-ten Italians (43%) who have a
favorable view of Forza Italia, the political
party founded by former Italian Prime
Minister Silvio Berlusconi, and a similar share
of the British (42%) who favor UKIP say a
strong leader making decisions would be good
for their country. Nearly half of Russians
(48%) back governance by a strong leader.
In Asia 55% of Indians, 52% of Indonesians
and 50% of Filipinos favor autocracy. Such
support is particularly intense in India, where
27% very strongly back a strong leader.
Public views of rule by a strong leader are
relevant in countries that have experienced
degrees of authoritarianism in recent years.
Roughly eight-in-ten Venezuelans (81%) and
71% of Hungarians oppose a strong leader who
makes decisions without interference of
parliament or the courts.
Support for autocracy generally low Would a system in which a strong leader can make decisions without interference from parliament or the courts be a good or bad way of governing this country?
Source: Spring 2017 Global Attitudes Survey. Q29c.
PEW RESEARCH CENTER

27
PEW RESEARCH CENTER
www.pewresearch.org
Rule by a strong leader also appeals to older
members of the public in some countries. More
than a quarter of Hungarians (29%) and South
Koreans (34%) ages 50 and older favor
governance by a strong leader.
In advanced economies there is little overall
backing for autocracy. But, where such support
does exist, it is often people with a secondary
education or below who are more likely than
those with more education to favor autocratic
rule. This educational divide is particularly
wide in the UK (19 percentage points), the U.S.
(15 points), Poland and South Korea (both 13
points).
In a number of nations there is a significant
division of opinion about strong leaders based
on ideology. Those who place themselves on the
right of the ideological spectrum are more likely
than those who place themselves on the left to
say a strong leader making decisions would be a
good way of governing. The ideological gap is
20 percentage points in South Korea and
Australia and 16 points in Italy and the UK.
Notably, in Venezuela, which has been ruled by
populist, left-wing strongmen, those on the left
are more supportive of autocratic rule than
those on the right.
In some countries those with less education more likely to favor autocracy A system in which a strong leader can make decisions without interference from parliament or the courts would be a good way of governing this country
More
education Less
education Diff % %
UK 13 32 +19
U.S. 13 28 +15
Poland 5 18 +13
South Korea 17 30 +13
Peru 23 35 +12
France 5 15 +10
Japan 25 35 +10
Note: Only statistically significant, double-digit differences shown. Source: Spring 2017 Global Attitudes Survey. Q29c.
PEW RESEARCH CENTER
Those on the right more likely to favor autocracy A system in which a strong leader can make decisions without interference from parliament and the courts would be a good way of governing this country
Left Center Right Right-left
diff % % %
South Korea 15 20 35 +20
Australia 8 16 28 +20
Italy 25 22 41 +16
UK 13 28 29 +16
Israel 15 18 29 +14
U.S.* 14 23 27 +13
Canada 9 16 21 +12
Chile 9 15 21 +12
Greece 7 12 17 +10
Germany 3 4 13 +10
Venezuela 40 10 9 -31
*In U.S., ideology is defined as conservative (right), moderate (center) and liberal (left). Note: Only statistically significant, double-digit differences shown. Source: Spring 2017 Global Attitudes Survey. Q29c.
PEW RESEARCH CENTER

28
PEW RESEARCH CENTER
www.pewresearch.org
64%67
5648
5868
6055
767771
7664
28
34
1731
4968
5731
3951
4156
7451
2933
4643
475045
2335
1744
495154
44
50
83%87
798281
848685
9191
9595
86
65
222728
5679
8691
56
547373
8787
73
42505254
5961
53
525655
637071
7463
73
17%10
1717151411988
4410
27
7068
5341
1512
841
4227
21109
21
52484645
3836
46
424038
31272424
31
24
U.S.Canada
ItalyFrance
UKHungary
SpainPolandGreece
NetherlandsGermanySwedenMEDIAN
Russia
VietnamIndonesia
IndiaPhilippines
JapanAustralia
South KoreaMEDIAN
TunisiaLebanon
JordanIsrael
TurkeyMEDIAN
South AfricaNigeriaGhanaKenya
SenegalTanzaniaMEDIAN
MexicoPeru
BrazilColombia
ChileArgentina
VenezuelaMEDIAN
GLOBAL MEDIAN
Very bad Total goodTotal bad
Significant minorities support military rule
There is minority support for a governing
system in which the military rules the country:
a median of 24% in the 38 nations surveyed.
At least four-in-ten Africans (46%) and Asians
(41%) see value in a government run by the
generals and admirals.
The strongest backing is in Vietnam (70%),
where the army has long played a pivotal role
in governance in close collaboration with the
Communist Party, especially in the 1960s and
70s during the war with the United States.
Some of this may be nostalgia for the past: By
two-to-one (46% to 23%) Vietnamese ages 50
and older are more likely than those ages 18 to
29 to say military rule would be very good for
their country.
Notably, roughly half of both Indians (53%)
and South Africans (52%), who live in nations
that often hold themselves up as democratic
exemplars for their regions, say military rule
would be a good thing for their countries. But
in these societies, older people (those ages 50
and older) are the least supportive of the army
running the country, and they are the ones
who either personally experienced the struggle
to establish democratic rule or are the
immediate descendants of those democratic
pioneers. In South Africa, blacks (55%) more
than whites (38%) also favor the military
making governance decisions.
Only one-in-ten Europeans back military rule.
But some on the populist right of the political
spectrum voice such support. Nearly a third of
those who hold a favorable view of the
National Front in France (31%) say a
With few exceptions, majorities oppose military government Would a system in which the military rules the country be a good or bad way of governing this country?
Source: Spring 2017 Global Attitudes Survey. Q29e.
PEW RESEARCH CENTER

29
PEW RESEARCH CENTER
www.pewresearch.org
governing system in which the military rules
the country would be a good thing, as do nearly
a quarter of those who favor UKIP in the United
Kingdom (23%).
Support for a governing system in which the
military rules the country enjoys backing
among people with less education in at least
half the countries surveyed, with some of the
strongest support among those with less than a
secondary education in Africa and Latin
America.
More than half of Peruvians with less than a
high school education (55%) prefer military
rule. Only about a third (32%) of more
educated Peruvians agree.
Particularly strong backing for military rule
also exists among the less educated in Vietnam
(76%), Nigeria (57%), Kenya (49%) and the
Philippines (47%).
Notably, one-in-five of those ages 50 and older
in the U.S. support military rule, as do roughly
one-in-four Japanese (24%) ages 18 to 29.
Those with less education more likely to support military government A system in which the military rules the country would be a good way of governing this country
More
education Less
education Diff % %
Peru 32 55 +23
Colombia 23 42 +19
Senegal 22 41 +19
Kenya 32 49 +17
U.S. 7 24 +17
Vietnam 60 76 +16
Brazil 29 45 +16
Chile 22 38 +16
France 7 21 +14
Nigeria 44 57 +13
Argentina 18 30 +12
Japan 8 19 +11
Australia 5 16 +11
Philippines 37 47 +10
Tunisia 32 42 +10
Canada 6 16 +10
Spain 4 14 +10
Netherlands 2 12 +10
Venezuela 20 29 +9
UK 8 17 +9
South Korea 5 13 +8
Poland 5 10 +5
Germany 1 4 +3
Note: Only statistically significant differences shown. Source: Spring 2017 Global Attitudes Survey. Q29e.
PEW RESEARCH CENTER

30
PEW RESEARCH CENTER
www.pewresearch.org
Ideology also plays a role in public views of
military rule. But it can cut both ways. In some
countries, people on the right of the political
spectrum are significantly more supportive of
military governance than those on the left,
especially in Chile. In Hungary and Venezuela,
on the other hand, it is more likely to be
individuals on the left who see value in military
rule.
Those on the right more supportive of military government A system in which the military rules the country would be a good way of governing this country
Left Center Right Right-left
diff % % %
Chile 20 17 41 +21
Spain 6 9 17 +11
Australia 4 13 13 +9
U.S.* 12 16 20 +8
Canada 4 11 12 +8
Greece 3 9 11 +8
Netherlands 2 7 10 +8
UK 7 16 14 +7
Israel 5 8 12 +7
Germany 0 3 7 +7
South Korea 5 7 11 +6
Hungary 28 11 11 -17
Venezuela 45 21 16 -31
*In U.S., ideology is defined as conservative (right), moderate (center) and liberal (left). Note: Only statistically significant differences shown. Source: Spring 2017 Global Attitudes Survey. Q29e.
PEW RESEARCH CENTER

31
PEW RESEARCH CENTER
www.pewresearch.org
Acknowledgments
This report is a collaborative effort based on the input and analysis of the following individuals.
Richard Wike, Director, Global Attitudes Research
Katie Simmons, Associate Director, Research
Bruce Stokes, Director, Global Economic Attitudes
Janell Fetterolf, Research Associate
Chris Baronavski, Senior Developer
James Bell, Vice President, Global Strategy
Caldwell Bishop, Research Associate
Hanyu Chwe, Research Assistant
Stefan Cornibert, Communications Manager
Danielle Cuddington, Research Analyst
Claudia Deane, Vice President, Research
Courtney Johnson, Research Associate
Michael Keegan, Information Graphics Designer
David Kent, Copy Editor
Dorothy Manevich, Research Analyst
Patrick Moynihan, Associate Director, International Research Methods
Courtney Nelson, Research Assistant
Jacob Poushter, Senior Researcher
Audrey Powers, Administrative Manager
Ariana Rodriguez-Gitler, Digital Producer
Steve Schwarzer, Senior Research Methodologist
Laura Silver, Senior Researcher
Rhonda Stewart, Senior Communications Manager
Kyle Taylor, Research Assistant
Margaret Vice, Senior Researcher

32
PEW RESEARCH CENTER
www.pewresearch.org
Methodology
About the Pew Research Center’s Spring 2017 Global Attitudes Survey
Results for the survey are based on telephone and face-to-face interviews conducted under the
direction of D3 Systems, Inc., ORB International, Princeton Survey Research Associates
International, Kantar Public UK and Voices! Research & Consultancy. The results are based on
national samples, unless otherwise noted. More details about our international survey
methodology and country-specific sample designs are available here.
Detailed information on survey methods for this report
General information on international survey research

33
PEW RESEARCH CENTER
www.pewresearch.org
Appendix: Political categorization
For this report, we grouped people into two political categories: those who support the governing
political party (or parties) and those who do not. These categories were coded based upon the
party or parties in power at the time the survey was fielded and respondents’ answers to a question
asking them which political party, if any, they identified with in their country.2
In countries where multiple political parties govern in coalition (as in many European countries),
survey respondents who indicated support for any parties in the coalition were grouped together.
In Germany, for example, where the center-right CDU/CSU governed with the center-left SPD at
the time of the survey, supporters of all three parties were grouped together. In countries where
different political parties occupy the executive and legislative branches of government, the party
holding the executive branch was considered the governing party.
Survey respondents who did not indicate support for any political party, or who refused to identify
with one, were considered to be not supporting the government in power. In the United States, for
example, only those who supported the Republican Party were considered to be supporters of the
governing party. Democrats, independents and those who don’t know which party they feel closest
to were considered non-supporters of the governing party.
In some countries, no respondents identified with one or more of the parties currently in a
coalition government. For example, the National Democratic Alliance in India officially consists of
dozens of political parties, but many of those were not identified by any respondent as the party
they felt closest to. Countries where an insufficient number of people identified with any party in
government have been excluded from the analysis. Below is a table that outlines the governing
political parties in each country; only political parties mentioned by respondents are shown.
2 Governing parties were not updated to account for elections that occurred after the survey was fielded and resulted in a new party (or parties) serving in government, as in France. Language used to measure party identification varied country by country.

34
PEW RESEARCH CENTER
www.pewresearch.org
Appendix: Political categorization
Countries Governing political party(ies) Argentina Cambiemos coalition: Republican Proposal, Radical Civic Union, Civic Coalition
Australia Liberal Party, Liberal-National Party, Country-Liberal Party, National Party
Brazil PMDB, PSDB, DEM, PP, PR, PRB, PSD, PTB, PSC, PROS
Canada Liberal Party
Chile New Majority coalition: Socialist Party, Christian Democratic Party, Party for Democracy, Communist Party, Social Democrat Radical Party, Citizen Left
Colombia Social Party of National Unity, Radical Change, Liberal Party, Citizen Option
France Socialist Party
Germany CDU, CSU, SPD
Ghana New Patriotic Party
Greece SYRIZA, Independent Greeks
Hungary Fidesz, Christian Democratic People’s Party
India National Democratic Alliance: BJP, Shiv Sena, Lok Janshakti, Telegu Desham, Shiromani Akali Dal
Indonesia PDI-P, PPP, Golkar, PKB, People’s Conscience Party, National Democratic Party (Nasdem), PAN
Israel Likud, Yisrael Beiteinu, Jewish Home, Kulanu, United Torah Judaism, Shas
Italy Democratic Party, Civic Choice, New Center-Right (now known as Popular Alternative)
Japan Liberal Democratic Party, Komeito
Kenya Jubilee Party
Mexico Institutional Revolutionary Party (PRI), Ecologist Green Party (PVEM)
Netherlands People’s Party for Freedom and Democracy, Labour Party
Nigeria All Progressives Congress
Poland Law and Justice (PiS)
Russia United Russia
Senegal United in Hope Coalition: Alliance for the Republic
South Africa African National Congress
Spain People’s Party, Citizens
Sweden Social Democratic Party, Green Party
Tanzania Party of the Revolution
Tunisia Nidaa Tounes, Ennahda Movement, Free Patriotic Union, Afek Tounes
Turkey Justice and Development Party
UK Conservative Party
United States Republican Party
Venezuela United Socialist Party (PSUV)*
* During fieldwork, the Venezuelan Supreme Court suspended the National Assembly. Those who identified with any party in the Great Patriotic Pole before this happened were coded as supporters of the governing party. Afterwards, only those who identified with the PSUV were classified as supporters of the governing party.
Note: Lebanon, South Korea, Jordan, Vietnam, Peru and the Philippines were excluded from this analysis.
PEW RESEARCH CENTER

35
PEW RESEARCH CENTER
www.pewresearch.org
Topline Questionnaire
Pew Research Center
Spring 2017 Survey
October 16, 2017 Release
Methodological notes:
Survey results are based on national samples. For further details on sample designs, see
Methodology section and our international survey methods database.
Due to rounding, percentages may not total 100%. The topline “total” columns show 100%,
because they are based on unrounded numbers.
For some countries, trends for certain years are omitted due to differences in sample
design or population coverage. Omitted trends often reflect less representative samples
than more recent surveys in the same countries. Trends that are omitted include:
‐ Vietnam prior to 2014
‐ Senegal prior to 2013
‐ Venezuela prior to 2013
‐ Brazil prior to 2010
‐ Nigeria prior to 2010
‐ South Africa in 2007
Not all questions included in the Spring 2017 survey are presented in this topline. Omitted
questions have either been previously released or will be released in future reports.

Q4. How much do you trust the national government to do what is right for (survey country) — a lot, somewhat, not much, or not at all?
A lot Somewhat Not much Not at all DK/Refused Total
United States Spring, 2017Canada Spring, 2017France Spring, 2017Germany Spring, 2017Greece Spring, 2017Hungary Spring, 2017Italy Spring, 2017Netherlands Spring, 2017Poland Spring, 2017Spain Spring, 2017Sweden Spring, 2017United Kingdom Spring, 2017Russia Spring, 2017Australia Spring, 2017India Spring, 2017Indonesia Spring, 2017Japan Spring, 2017Philippines Spring, 2017South Korea Spring, 2017Vietnam Spring, 2017Israel Spring, 2017Jordan Spring, 2017Lebanon Spring, 2017Tunisia Spring, 2017Ghana Spring, 2017Kenya Spring, 2017Nigeria Spring, 2017Senegal Spring, 2017South Africa Spring, 2017Tanzania Spring, 2017Argentina Spring, 2017Brazil Spring, 2017Chile Spring, 2017Colombia Spring, 2017Mexico Spring, 2017Peru Spring, 2017Venezuela Spring, 2017
15 36 24 23 2 10020 47 18 14 1 1003 17 36 42 1 10026 43 19 10 1 1001 12 26 60 1 1009 48 25 16 2 1001 25 47 26 2 10024 47 20 9 1 10014 28 31 24 4 1005 12 40 41 1 10015 52 23 10 0 10014 35 28 20 4 10020 47 24 6 3 1007 41 29 21 2 10039 46 7 4 4 10030 53 15 1 0 1006 51 33 7 3 10036 44 16 4 0 1002 21 50 25 2 10031 51 16 1 1 10014 37 33 14 2 10013 35 30 18 3 1002 13 42 43 1 10011 18 14 56 2 10051 19 13 13 4 10028 40 20 12 1 10034 20 21 24 1 10037 23 22 16 2 10022 22 28 24 3 10048 41 5 4 1 10010 12 41 34 3 1002 22 18 56 3 1005 10 51 32 2 1007 5 51 36 1 1002 15 39 43 1 1004 8 55 31 2 10014 15 24 45 2 100
In Canada and Mexico, asked 'federal government.'
PEW RESEARCH CENTER
www.pewresearch.org
36
Q9. How satisfied are you with the way democracy is working in our country — very satisfied, somewhat satisfied, not too satisfied or not at all satisfied?
Very satisfiedSomewhat
satisfiedNot too satisfied
Not at all satisfied DK/Refused Total
United States Spring, 2017Canada Spring, 2017France Spring, 2017Germany Spring, 2017Greece Spring, 2017Hungary Spring, 2017
Fall, 2009Italy Spring, 2017Netherlands Spring, 2017Poland Spring, 2017
Fall, 2009Spain Spring, 2017Sweden Spring, 2017United Kingdom Spring, 2017Russia Spring, 2017Australia Spring, 2017India Spring, 2017Indonesia Spring, 2017Japan Spring, 2017Philippines Spring, 2017South Korea Spring, 2017Israel Spring, 2017Jordan Spring, 2017Lebanon Spring, 2017Tunisia Spring, 2017
Spring, 2013Ghana Spring, 2017
Spring, 2013Spring, 2007
Kenya Spring, 2017Spring, 2013Spring, 2007
Nigeria Spring, 2017Spring, 2013
Senegal Spring, 2017Spring, 2013
South Africa Spring, 2017Spring, 2013
Tanzania Spring, 2017Spring, 2007
Argentina Spring, 2017Spring, 2013
Brazil Spring, 2017Spring, 2013
Chile Spring, 2017Spring, 2013
Colombia Spring, 2017Mexico Spring, 2017
Spring, 2013Peru Spring, 2017Venezuela Spring, 2017
Spring, 2013
11 35 28 23 3 10018 52 21 9 1 1003 31 37 28 1 10024 49 19 7 1 1003 18 43 36 0 1003 41 36 17 3 1002 19 46 31 1 1002 29 43 24 2 10025 52 16 6 2 1008 43 31 13 6 1006 47 32 7 7 1007 18 44 30 0 10023 56 14 6 1 10012 40 31 16 2 10018 41 25 11 5 10013 45 25 16 1 10033 46 8 3 9 10014 55 26 3 2 1005 45 38 9 3 10021 48 25 6 1 1003 27 55 14 1 10011 41 34 13 1 1006 32 34 24 4 1000 8 36 55 0 1007 29 14 47 3 1003 21 30 42 4 10041 25 17 15 2 10030 39 22 8 2 10031 50 15 3 1 10017 39 24 19 1 10027 46 19 9 0 10015 57 23 5 1 10020 21 27 31 0 1007 20 42 30 1 10031 33 13 20 3 10030 41 21 7 2 10015 28 29 27 2 10032 35 19 13 1 10030 49 7 11 2 10038 45 10 5 2 1009 37 31 23 1 10015 42 29 14 1 1003 25 25 42 4 10010 56 25 7 2 1004 13 42 36 5 10010 37 42 7 4 1002 16 48 34 1 1002 4 23 70 2 10010 43 31 14 2 1003 22 46 27 2 1009 16 27 46 1 10033 25 20 21 2 100
PEW RESEARCH CENTER
www.pewresearch.org
37
Q29a. I'm going to describe various types of political systems and ask what you think about each as a way of governing our country. For each one, would it be a very good, somewhat good, somewhat bad
or very bad way of governing this country? a. a democratic system where citizens, not elected officials, vote directly on major national issues to decide what becomes law
Very goodSomewhat
good Somewhat bad Very bad DK/Refused Total
United States Spring, 2017Canada Spring, 2017France Spring, 2017Germany Spring, 2017Greece Spring, 2017Hungary Spring, 2017Italy Spring, 2017Netherlands Spring, 2017Poland Spring, 2017Spain Spring, 2017Sweden Spring, 2017United Kingdom Spring, 2017Russia Spring, 2017Australia Spring, 2017India Spring, 2017Indonesia Spring, 2017Japan Spring, 2017Philippines Spring, 2017South Korea Spring, 2017Vietnam Spring, 2017Israel Spring, 2017Jordan Spring, 2017Lebanon Spring, 2017Tunisia Spring, 2017Turkey Spring, 2017Ghana Spring, 2017Kenya Spring, 2017Nigeria Spring, 2017Senegal Spring, 2017South Africa Spring, 2017Tanzania Spring, 2017Argentina Spring, 2017Brazil Spring, 2017Chile Spring, 2017Colombia Spring, 2017Mexico Spring, 2017Peru Spring, 2017Venezuela Spring, 2017
29 38 19 12 2 10025 42 21 9 3 10028 46 18 7 1 10032 42 21 2 2 10039 39 15 5 1 10020 47 21 5 7 10031 40 16 4 9 10017 38 27 16 2 10022 47 15 2 14 10038 37 13 9 4 10015 42 29 12 2 10019 37 26 12 5 10039 35 15 4 8 10025 39 24 10 2 10051 25 5 3 16 10017 45 25 6 7 10019 46 21 4 9 10023 44 18 11 3 10022 54 18 2 4 10028 45 12 4 11 10024 36 28 7 5 10016 25 30 25 4 10048 35 9 7 1 10012 21 22 35 11 10053 31 8 4 4 10046 21 10 21 3 10052 28 8 11 1 10031 30 19 17 2 10043 23 13 17 5 10029 28 15 21 6 10036 26 15 20 3 10028 35 16 11 10 10010 42 31 7 10 10034 31 14 14 7 10041 22 11 19 6 10016 46 19 11 7 10033 25 12 21 10 10026 35 14 18 7 100
PEW RESEARCH CENTER
www.pewresearch.org
38

Q29b. I'm going to describe various types of political systems and ask what you think about each as a way of governing our country. For each one, would it be a very good, somewhat good, somewhat bad or very bad way of governing this country? b. a democratic system where representatives elected by
citizens decide what becomes law
Very goodSomewhat
good Somewhat bad Very bad DK/Refused Total
United States Spring, 2017Canada Spring, 2017France Spring, 2017Germany Spring, 2017Greece Spring, 2017Hungary Spring, 2017Italy Spring, 2017Netherlands Spring, 2017Poland Spring, 2017Spain Spring, 2017Sweden Spring, 2017United Kingdom Spring, 2017Russia Spring, 2017Australia Spring, 2017India Spring, 2017Indonesia Spring, 2017Japan Spring, 2017Philippines Spring, 2017South Korea Spring, 2017Vietnam Spring, 2017Israel Spring, 2017Jordan Spring, 2017Lebanon Spring, 2017Tunisia Spring, 2017Turkey Spring, 2017Ghana Spring, 2017Kenya Spring, 2017Nigeria Spring, 2017Senegal Spring, 2017South Africa Spring, 2017Tanzania Spring, 2017Argentina Spring, 2017Brazil Spring, 2017Chile Spring, 2017Colombia Spring, 2017Mexico Spring, 2017Peru Spring, 2017Venezuela Spring, 2017
48 38 8 5 1 10043 44 8 2 3 10023 58 14 4 1 10046 44 7 1 2 10031 47 14 6 3 10026 52 15 2 5 10029 50 9 4 7 10042 42 10 4 2 10020 57 12 3 9 10031 43 15 7 4 10054 38 6 1 1 10043 41 9 3 4 10026 42 18 5 9 10043 45 7 3 2 10044 31 6 2 17 10034 52 8 1 5 10022 55 15 2 5 10032 50 13 3 2 10019 59 16 2 4 10033 54 4 2 7 10041 46 8 3 2 10022 39 24 12 2 10051 34 9 5 1 10022 31 16 23 8 10043 37 9 7 4 10062 23 5 9 2 10042 35 9 12 3 10048 30 11 10 1 10053 24 11 9 4 10034 32 12 16 6 10053 28 8 8 3 10032 37 12 8 12 1008 51 26 7 9 10022 36 19 16 7 10032 21 15 24 8 1009 49 23 11 8 10031 27 14 18 10 10031 40 12 10 7 100
PEW RESEARCH CENTER
www.pewresearch.org
39

Q29c. I'm going to describe various types of political systems and ask what you think about each as a way of governing our country. For each one, would it be a very good, somewhat good, somewhat bad or very bad way of governing this country? c. a system in which a strong leader can make decisions
without interference from parliament or the courts
Very goodSomewhat
good Somewhat bad Very bad DK/Refused Total
United States Spring, 2017Canada Spring, 2017France Spring, 2017Germany Spring, 2017Greece Spring, 2017Hungary Spring, 2017Italy Spring, 2017Netherlands Spring, 2017Poland Spring, 2017Spain Spring, 2017Sweden Spring, 2017United Kingdom Spring, 2017Russia Spring, 2017Australia Spring, 2017India Spring, 2017Indonesia Spring, 2017Japan Spring, 2017Philippines Spring, 2017South Korea Spring, 2017Vietnam Spring, 2017Israel Spring, 2017Jordan Spring, 2017Lebanon Spring, 2017Tunisia Spring, 2017Turkey Spring, 2017Ghana Spring, 2017Kenya Spring, 2017Nigeria Spring, 2017Senegal Spring, 2017South Africa Spring, 2017Tanzania Spring, 2017Argentina Spring, 2017Brazil Spring, 2017Chile Spring, 2017Colombia Spring, 2017Mexico Spring, 2017Peru Spring, 2017Venezuela Spring, 2017
5 17 21 55 2 1003 14 27 54 2 1002 10 36 52 0 1001 5 30 63 1 1005 7 24 63 1 1004 20 26 45 5 1006 23 28 38 6 1001 9 16 73 1 1002 13 32 44 9 1004 9 26 58 3 1001 8 20 70 1 1007 19 26 45 3 10019 29 30 13 10 1006 13 29 50 1 10027 28 11 17 18 10012 40 33 10 6 1006 25 32 29 7 10016 34 26 21 3 1005 18 44 30 3 1009 33 30 17 11 1007 18 37 36 2 10010 22 39 27 2 1006 8 16 68 3 10017 16 21 39 7 10020 20 19 35 6 10019 13 9 57 2 10017 22 15 42 3 10020 18 24 37 2 1008 8 14 68 3 10022 22 16 34 5 10019 20 18 39 3 1006 11 26 49 7 1002 25 42 21 11 1006 8 27 54 5 10010 7 25 54 4 1002 25 34 33 5 10015 12 26 42 6 1004 13 21 60 3 100
In place of “parliament” in Russia asked “government”; in Indonesia asked “House of People’s Representatives”; in Philippines asked “Senate/Congress”; in South Korea and Vietnam asked “National Assembly”; in Argentina, Brazil, Chile, Colombia, Mexico, Peru and Venezuela asked “Congress.”
PEW RESEARCH CENTER
www.pewresearch.org
40

Q29d. I'm going to describe various types of political systems and ask what you think about each as a way of governing our country. For each one, would it be a very good, somewhat good, somewhat bad or very bad way of governing this country? d. experts, not elected officials, make decisions according
to what they think is best for the country
Very goodSomewhat
good Somewhat bad Very bad DK/Refused Total
United States Spring, 2017Canada Spring, 2017France Spring, 2017Germany Spring, 2017Greece Spring, 2017Hungary Spring, 2017Italy Spring, 2017Netherlands Spring, 2017Poland Spring, 2017Spain Spring, 2017Sweden Spring, 2017United Kingdom Spring, 2017Russia Spring, 2017Australia Spring, 2017India Spring, 2017Indonesia Spring, 2017Japan Spring, 2017Philippines Spring, 2017South Korea Spring, 2017Vietnam Spring, 2017Israel Spring, 2017Jordan Spring, 2017Lebanon Spring, 2017Tunisia Spring, 2017Turkey Spring, 2017Ghana Spring, 2017Kenya Spring, 2017Nigeria Spring, 2017Senegal Spring, 2017South Africa Spring, 2017Tanzania Spring, 2017Argentina Spring, 2017Brazil Spring, 2017Chile Spring, 2017Colombia Spring, 2017Mexico Spring, 2017Peru Spring, 2017Venezuela Spring, 2017
9 31 27 31 2 1008 33 32 23 3 1006 38 38 17 1 1007 37 38 15 3 1005 26 37 25 6 10020 48 17 6 9 1007 33 31 18 10 1005 34 34 25 2 1009 41 25 9 16 10017 32 29 20 2 1008 32 36 20 3 1008 34 30 24 4 10026 40 19 5 10 1006 35 33 24 2 10033 32 9 5 21 10013 46 28 8 5 1008 41 33 11 7 10018 44 21 13 4 1006 46 34 7 7 10017 50 17 5 10 10013 35 30 15 6 1005 34 36 21 4 10033 37 19 8 4 10014 22 23 34 7 10021 31 20 18 10 10029 22 12 35 3 10020 28 17 32 3 10033 32 16 17 2 10034 23 16 22 4 10023 30 17 23 7 10023 31 16 27 3 10016 30 21 22 11 1003 28 42 18 9 10018 29 20 26 7 10026 17 20 29 7 1009 44 25 16 6 10028 24 17 24 7 10014 32 21 27 6 100
PEW RESEARCH CENTER
www.pewresearch.org
41

Q29e. I'm going to describe various types of political systems and ask what you think about each as a way of governing our country. For each one, would it be a very good, somewhat good, somewhat bad
or very bad way of governing this country? e. the military rules the country
Very goodSomewhat
good Somewhat bad Very bad DK/Refused Total
United States Spring, 2017Canada Spring, 2017France Spring, 2017Germany Spring, 2017Greece Spring, 2017Hungary Spring, 2017Italy Spring, 2017Netherlands Spring, 2017Poland Spring, 2017Spain Spring, 2017Sweden Spring, 2017United Kingdom Spring, 2017Russia Spring, 2017Australia Spring, 2017India Spring, 2017Indonesia Spring, 2017Japan Spring, 2017Philippines Spring, 2017South Korea Spring, 2017Vietnam Spring, 2017Israel Spring, 2017Jordan Spring, 2017Lebanon Spring, 2017Tunisia Spring, 2017Turkey Spring, 2017Ghana Spring, 2017Kenya Spring, 2017Nigeria Spring, 2017Senegal Spring, 2017South Africa Spring, 2017Tanzania Spring, 2017Argentina Spring, 2017Brazil Spring, 2017Chile Spring, 2017Colombia Spring, 2017Mexico Spring, 2017Peru Spring, 2017Venezuela Spring, 2017
4 13 19 64 1 1003 7 20 67 2 1005 12 34 48 1 1001 3 24 71 1 1001 7 15 76 1 1002 12 16 68 3 1002 15 23 56 5 1001 7 14 77 1 1001 8 30 55 6 1005 6 26 60 3 1001 3 19 76 1 1005 10 23 58 4 1008 19 37 28 7 1003 9 18 68 1 10030 23 11 17 19 10021 47 23 4 5 1002 13 30 49 6 10014 27 25 31 2 1001 7 34 57 1 10029 41 19 3 8 1002 8 31 56 3 1009 12 32 41 6 10011 16 22 51 1 10022 20 15 39 4 1002 7 13 74 4 10030 16 6 46 3 10025 20 11 43 2 10028 20 17 33 2 10024 14 12 47 2 10029 23 13 29 6 10021 15 11 50 2 10010 14 20 51 5 1007 31 38 17 7 10012 15 21 49 4 10019 12 19 44 6 1008 34 29 23 6 10022 18 21 35 5 1007 17 20 54 2 100
PEW RESEARCH CENTER
www.pewresearch.org
42