pfas science and challenges - gvsu
TRANSCRIPT

PFAS Science and Challenges
Richard R. Rediske, Ph.D.
Annis Water Resources Institute


Chemical Properties for Environmental and Health Impacts
• Water Soluble g/l
• Bioaccumulates in the plants and animals
• Not biodegradable
• Bind to proteins and DNA
• Limited excretion by the human kidney
• 100 fold accumulation factor in humans compared with lab animals due to excretion differences.
• Long half-lives (4-9 years) in humans
• Sensitive receptor endpoint (resemble Fatty Acids)
Zhang 2009

PFAS in the Environment
Oliaei 2013

What is a Part Per Trillion• PFAS concentrations are reported in concentrations of “parts per trillion”, or
“ppt”. • A ppt is a measurement of the quantity of a substance in the air, water, or soil
where there is one part of that substance for every one trillion parts of the medium it is contained in (a ratio of 1:1,000,000,000,000).
• One part per trillion is equivalent to one nanogram per liter of water. A nanogram is a unit of measurement that is equal to one billionth of a gram.
• One way to visualize this amount is that a dollar bill weighs about 1 gram. To get 1 nanogram, the dollar bill would be cut into 1,000 pieces. Take one of those pieces and cut it into another 1,000 equal pieces. Then take one of those pieces and cut it into another 1,000 pieces. Each piece in this group will be a billionth of the original dollar and will weigh approximately 1 nanogram. Other ways to conceptualize one ppt are one second in 32,000 years or one grain of sand in an Olympic-size swimming pool.
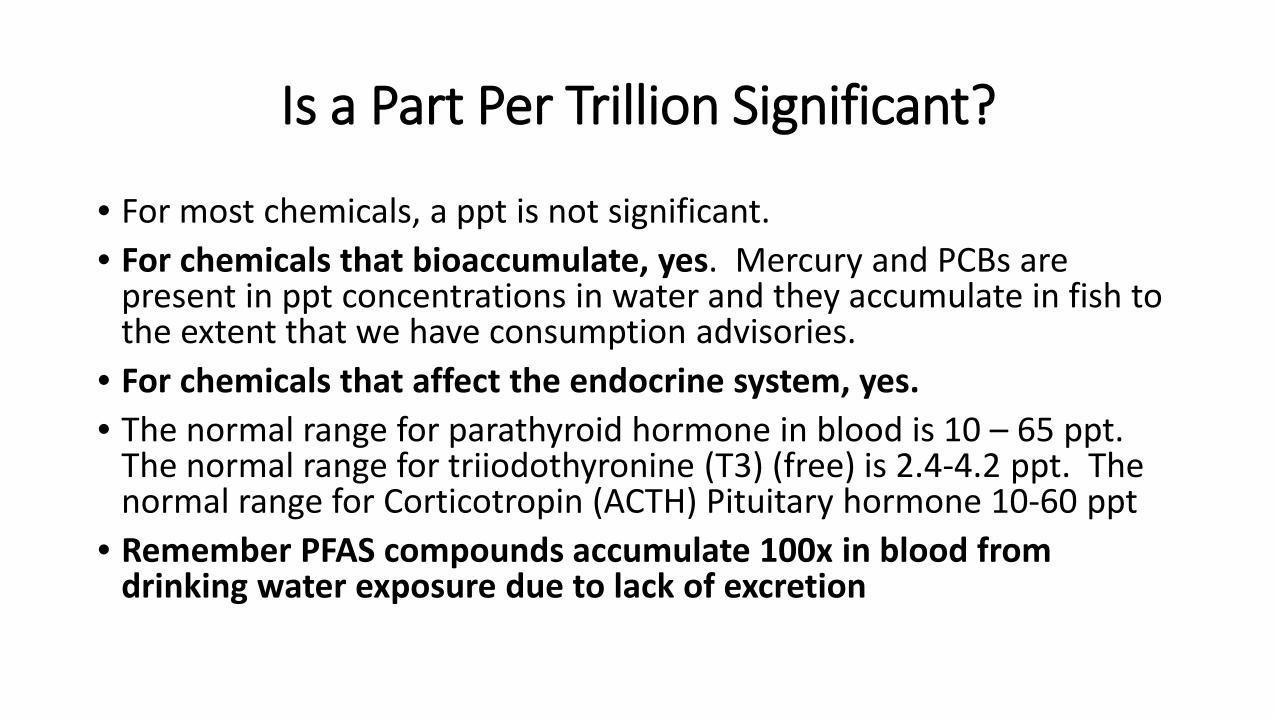
Is a Part Per Trillion Significant?
• For most chemicals, a ppt is not significant.• For chemicals that bioaccumulate, yes. Mercury and PCBs are
present in ppt concentrations in water and they accumulate in fish to the extent that we have consumption advisories.
• For chemicals that affect the endocrine system, yes. • The normal range for parathyroid hormone in blood is 10 – 65 ppt.
The normal range for triiodothyronine (T3) (free) is 2.4-4.2 ppt. The normal range for Corticotropin (ACTH) Pituitary hormone 10-60 ppt
• Remember PFAS compounds accumulate 100x in blood from drinking water exposure due to lack of excretion

Agency for Toxic Substances and Disease Registry ATSDR Report and C8 Study*
• Affects the developing fetus and child, including possible changes in growth, learning, and behavior, low birth weight, accelerated puberty, skeletal variations.
• Hormone interference (thyroid* and fertility)• Increase cholesterol*• Affects the immune system• Increase cancer risk* (Liver, kidney, testicular)• Pregnancy-induced hypertension* • Liver damage (Increased risk of thyroid disease) • Decreased antibody response to vaccines• Increased risk of asthma and ulcerative colitis* diagnosis • Increased risk of decreased fertility

PFAS and Safe Levels
• No direct relationship between blood levels and disease.• PFAS compounds show population effects – exposed populations
have higher rates of disease• Sensitive groups, timing, and age may be significant. • Young children – high maternal transfer, breast milk and
consumption of 4 L water.

PFOA in Blood in U.S. Population
Current level ~2 μg/L (ppb)
30
20
10
40
80
70
60
50
02000 2002 2004 2006 2008 2010 2012
Geometric Mean (ug/L)
95th Percen?le (ug/L)
U.S Department of Health and Human Services, Centers for Disease Control and Prevention, Fourth National Report on Human Exposure to Environmental Chemicals, Updated Tables, March 2018, Volume 1.

Average PFOA Levels in Blood (µg/L)(https://www.health.ny.gov/environmental/investigations/hoosick/docs/qandabloodtestingshort.pdf)
Belmont Infant 500 ug/l
Belmont Resident 2,000 ug/l

Increases in Serum Concentrations Predicted fromOngoing Exposure to PFOA in Drinking Water
Post et al, 2017

What Level of PFAS in Drinking Water is Safe?
PFAS
Con
cent
ratio
n in
Drin
king
Wat
er (n
g/l,
or p
pt)
1000
At Risk100
PFOS + PFOA = 70ppt
Safe
10
1
• U.S. EPA– January 2009
• PFOA = 400 ppt• PFOS = 200 ppt
– Early 2016• PFOA = 100 ppt
• – May 2016• PFOA + PFOS = 70 ppt
• New Jersey• – 2009
• PFOA = 40 ppt
• – 2016• PFOA = 14 ppt
• Vermont– March 2016
• PFOA = 20 ppt
• ATSDR– May 2018
• PFOA = 11 ppt• PFOS = 7 ppt
Regulations based on population vs individual group risk?

PFAS Challenges
• Funding for research and monitoring• Community support resources• Need for regulations in the presence of uncertainty• Transparent way to communicate science and
uncertainty