pfie march2015
TRANSCRIPT
2012
April 2015
NASDAQ:PFIE
The Leader in Oilfield Management Technologies
NASDAQ:PFIE
Important Cautions Regarding Forward-looking Statements
This presentation contains forward-looking statements, as defined in the Private Securities Litigation Reform Act of 1995. All statements other than historical facts are forward-looking statements, including without limitation, those regarding activities, events, financial results or developments that we intend, plan, expect, believe, project, forecast or anticipate will or may occur in the future. Examples of forward-looking statements include, but are not limited to, statements we make regarding the potential size of the market for our products, impacts of future legislation and regulatory action, forecasts of future performance, financial condition and results of operations, plans to expand to other markets, development of new technologies, potential acquisitions and the possibility of up-listing or cross-listing our equity securities. These statements reflect our management’s current views with respect to future events, are not guarantees of future performance, and involve risks and uncertainties that are difficult to predict. Further, forward-looking statements are based upon assumptions of future events that may not prove to be accurate. Such assumptions and assessments are made in light of our experience and perception of historical trends, current conditions and expected future results. These statements involve known and unknown risks, uncertainties, assumptions and other factors many of which are out of our control and difficult to forecast which may cause actual results to differ materially from those that may be described or implied herein. Such factors include but are not limited to: general economic conditions; competitive factors; political, economic, and regulatory changes affecting the oil and gas industry; commodity price changes (i.e. of oil and gas) that could affect sales strategies; changes in supplier pricing or transit costs; changes in exchange rates; changes in demand for combustion management products, and various other factors, both referenced and not referenced above, and other factors that are described in our filings with the Securities and Exchange Commission (the “Commission”), including our periodic reports on Forms 10-K and 10-Q. Should one or more of these risks or uncertainties materialize, or should underlying assumptions prove incorrect, actual results, performance or achievements may vary materially from those set forth in this presentation. You should not place undue reliance on any forward-looking statements and are advised to carefully review and consider the various disclosures in our filings with the Commission. Except as required by law, we neither intend nor assume any obligation to revise or update these forward-looking statements, which speak only as of their dates. We nonetheless reserve the right to make such updates from time to time by press release, periodic report or other method of public disclosure without the need for specific reference to this financial outlook. No such update shall be deemed to indicate that other statements not addressed by such update remain correct or create an obligation to provide any other updates.
Although we report our results using US GAAP, we have included in this presentation the non-GAAP measures of EBITDA and EBITDA Margin because management believes these measures are commonly used by securities analysts, investors and others interested parties in the evaluation of financial performance. These non-GAAP measures have limitations as analytical tools and you should not consider these non-GAAP measures in isolation or as a substitute for analysis of our results as reported under GAAP. A reconciliation of non-GAAP to GAAP results is included in this presentation, which has been posted online at http://www.profireenergy.com/.
Excluding the information from sources indicated, the content of this presentation is copyright 2015 Profire Energy, Inc. All Rights Reserved.2
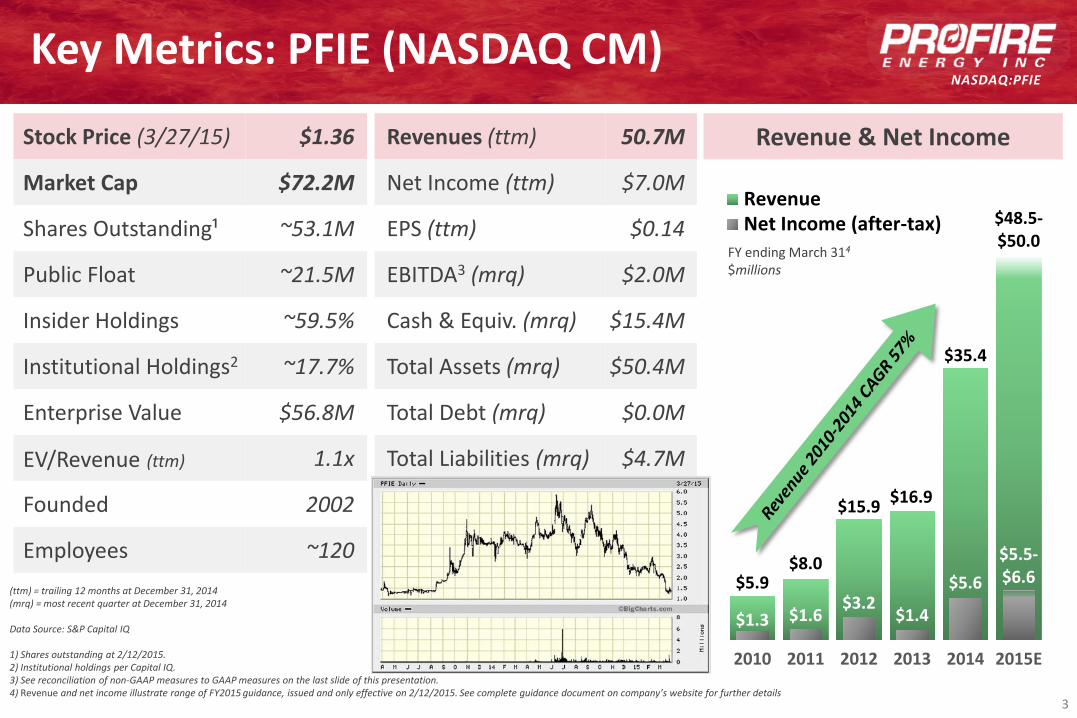
NASDAQ:PFIEKey Metrics: PFIE (NASDAQ CM)
(ttm) = trailing 12 months at December 31, 2014(mrq) = most recent quarter at December 31, 2014
Data Source: S&P Capital IQ
1) Shares outstanding at 2/12/2015.2) Institutional holdings per Capital IQ.3) See reconciliation of non-GAAP measures to GAAP measures on the last slide of this presentation. 4) Revenue and net income illustrate range of FY2015 guidance, issued and only effective on 2/12/2015. See complete guidance document on company’s website for further details
Stock Price (3/27/15) $1.36
Market Cap $72.2M
Shares Outstanding¹ ~53.1M
Public Float ~21.5M
Insider Holdings ~59.5%
Institutional Holdings2 ~17.7%
Enterprise Value $56.8M
EV/Revenue (ttm) 1.1x
Founded 2002
Employees ~120
Revenues (ttm) 50.7M
Net Income (ttm) $7.0M
EPS (ttm) $0.14
EBITDA3 (mrq) $2.0M
Cash & Equiv. (mrq) $15.4M
Total Assets (mrq) $50.4M
Total Debt (mrq) $0.0M
Total Liabilities (mrq) $4.7M
$5.9$8.0
$15.9 $16.9
$35.4
$48.5-$50.0
$1.3 $1.6$3.2
$1.4
$5.6$5.5-$6.6
2010 2011 2012 2013 2014 2015E
RevenueNet Income (after-tax)
Revenue & Net Income
FY ending March 314
$millions
3
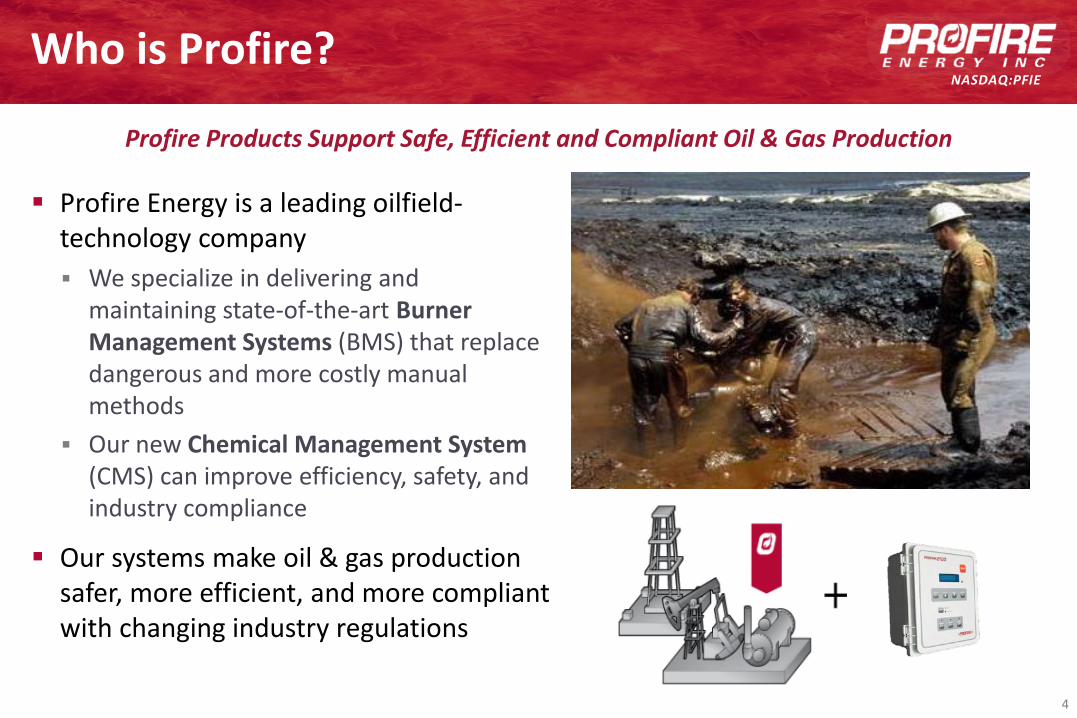
NASDAQ:PFIEWho is Profire?
Profire Energy is a leading oilfield-technology company We specialize in delivering and
maintaining state-of-the-art Burner Management Systems (BMS) that replace dangerous and more costly manual methods
Our new Chemical Management System (CMS) can improve efficiency, safety, and industry compliance
Our systems make oil & gas production safer, more efficient, and more compliant with changing industry regulations
Profire Products Support Safe, Efficient and Compliant Oil & Gas Production
4
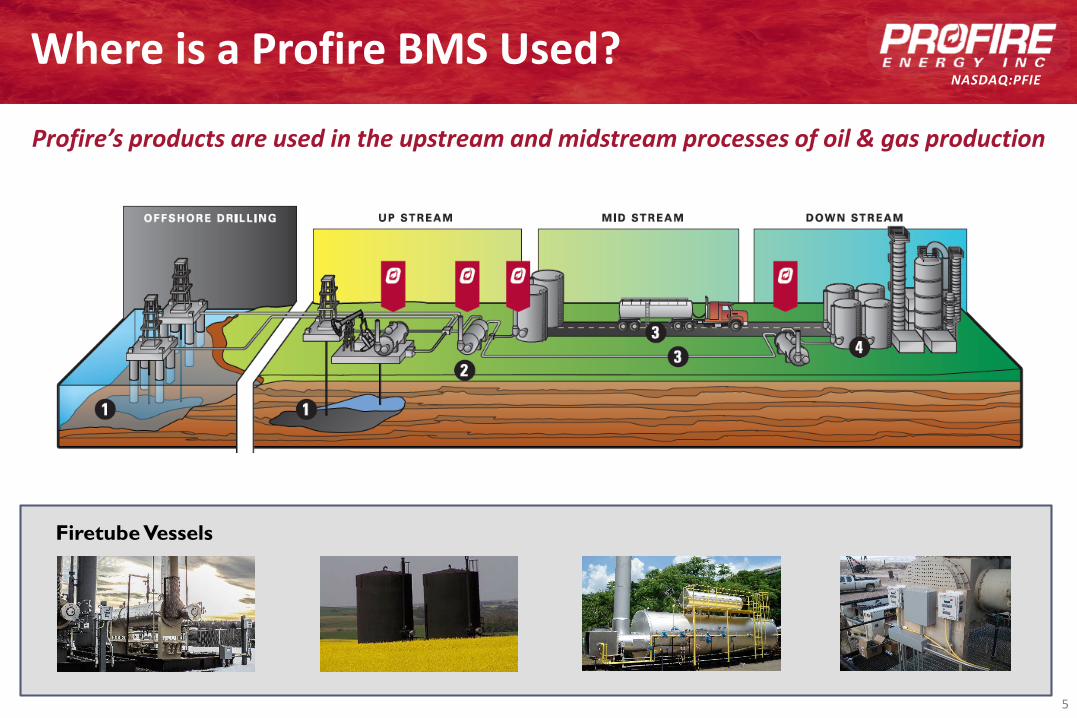
NASDAQ:PFIEWhere is a Profire BMS Used?
Firetube Vessels
Profire’s products are used in the upstream and midstream processes of oil & gas production
5
Burner Management
6
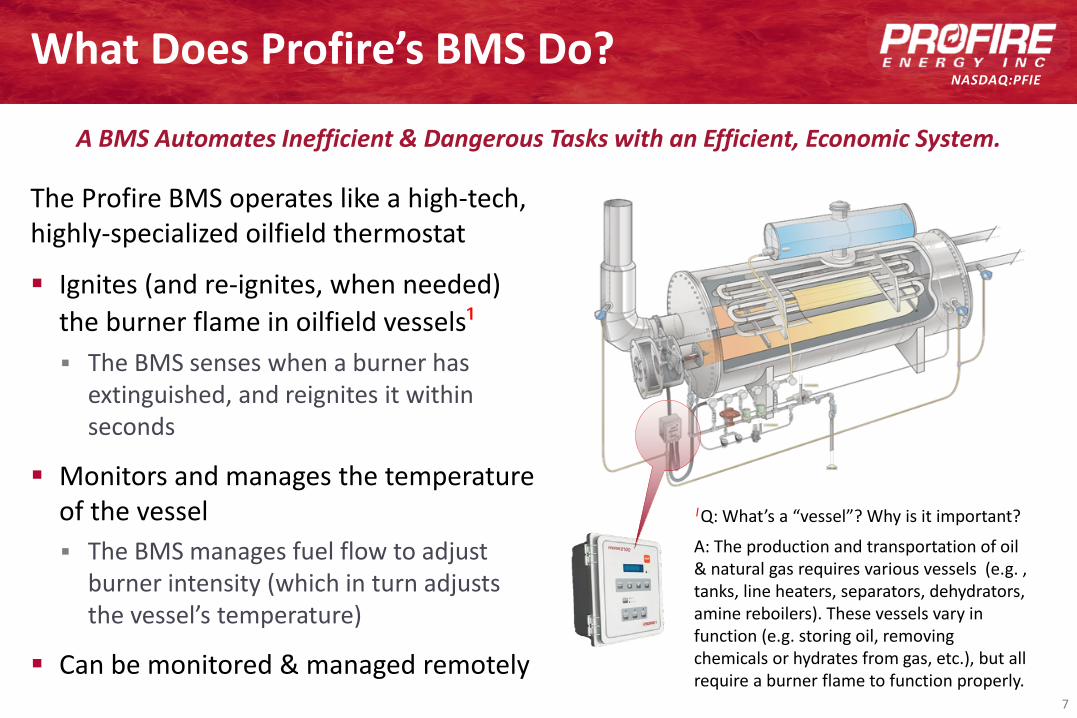
NASDAQ:PFIEWhat Does Profire’s BMS Do?
The Profire BMS operates like a high-tech, highly-specialized oilfield thermostat
Ignites (and re-ignites, when needed) the burner flame in oilfield vessels¹ The BMS senses when a burner has
extinguished, and reignites it within seconds
Monitors and manages the temperature of the vessel The BMS manages fuel flow to adjust
burner intensity (which in turn adjusts the vessel’s temperature)
Can be monitored & managed remotely
1Q: What’s a “vessel”? Why is it important?
A: The production and transportation of oil & natural gas requires various vessels (e.g. , tanks, line heaters, separators, dehydrators, amine reboilers). These vessels vary in function (e.g. storing oil, removing chemicals or hydrates from gas, etc.), but all require a burner flame to function properly.
A BMS Automates Inefficient & Dangerous Tasks with an Efficient, Economic System.
7
NASDAQ:PFIE
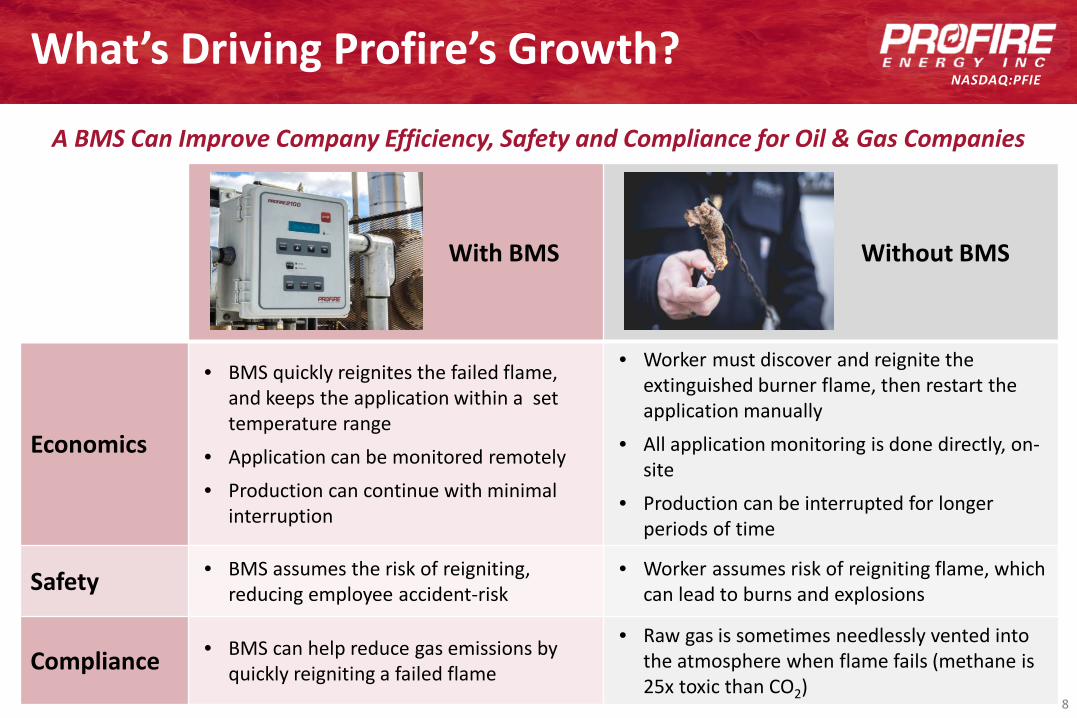
With BMS Without BMS
Economics
• BMS quickly reignites the failed flame, and keeps the application within a set temperature range
• Application can be monitored remotely• Production can continue with minimal
interruption
• Worker must discover and reignite the extinguished burner flame, then restart the application manually
• All application monitoring is done directly, on-site
• Production can be interrupted for longer periods of time
Safety • BMS assumes the risk of reigniting,reducing employee accident-risk
• Worker assumes risk of reigniting flame, which can lead to burns and explosions
Compliance • BMS can help reduce gas emissions by quickly reigniting a failed flame
• Raw gas is sometimes needlessly vented into the atmosphere when flame fails (methane is 25x toxic than CO2)
What’s Driving Profire’s Growth?
A BMS Can Improve Company Efficiency, Safety and Compliance for Oil & Gas Companies
8
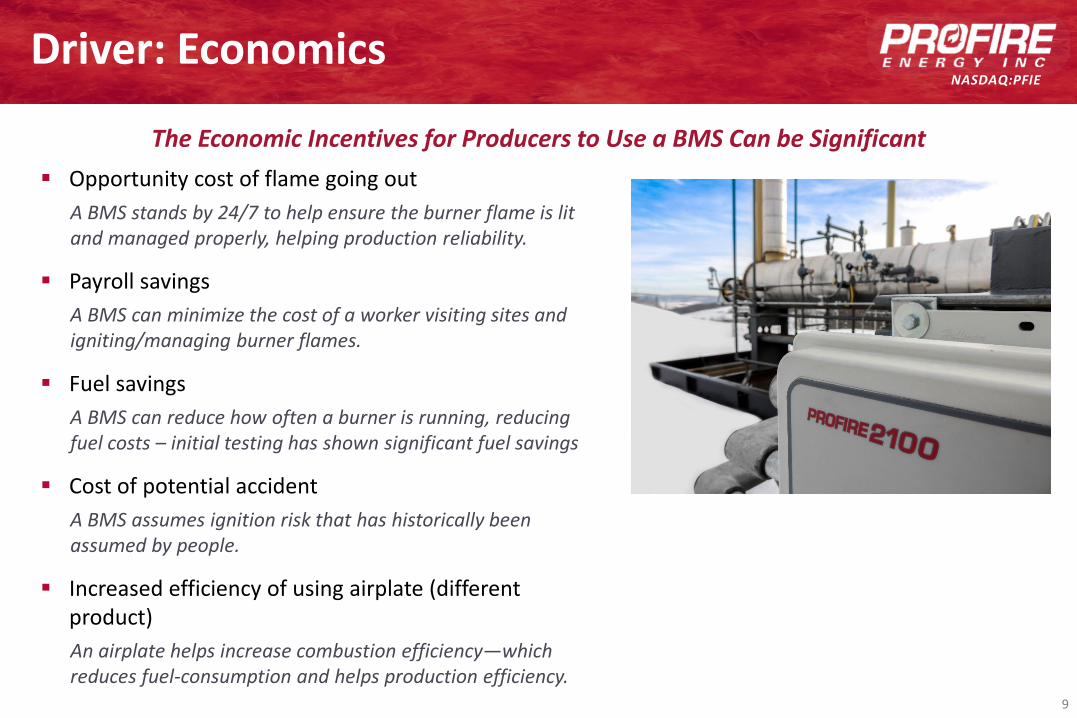
NASDAQ:PFIEDriver: Economics
Opportunity cost of flame going outA BMS stands by 24/7 to help ensure the burner flame is lit and managed properly, helping production reliability.
Payroll savingsA BMS can minimize the cost of a worker visiting sites and igniting/managing burner flames.
Fuel savingsA BMS can reduce how often a burner is running, reducing fuel costs – initial testing has shown significant fuel savings
Cost of potential accidentA BMS assumes ignition risk that has historically been assumed by people.
Increased efficiency of using airplate (different product)An airplate helps increase combustion efficiency—which reduces fuel-consumption and helps production efficiency.
The Economic Incentives for Producers to Use a BMS Can be Significant
9
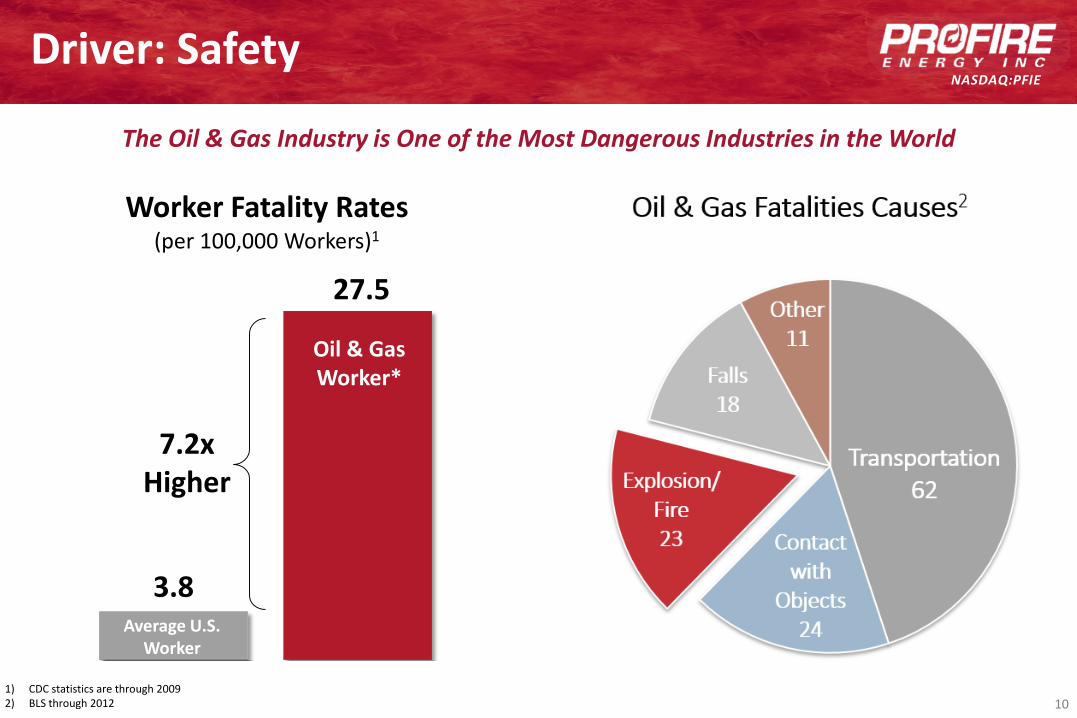
NASDAQ:PFIEDriver: Safety
3.8
27.5
Worker Fatality Rates(per 100,000 Workers)1
Vehicular45%
Contact with
Objects17%
Explosion/Fire17%
Falls13%
Other8%
Oil & Gas Fatalities Causes2
7.2x Higher
Oil & Gas Worker*
Average U.S. Worker
1) CDC statistics are through 20092) BLS through 2012
The Oil & Gas Industry is One of the Most Dangerous Industries in the World
10
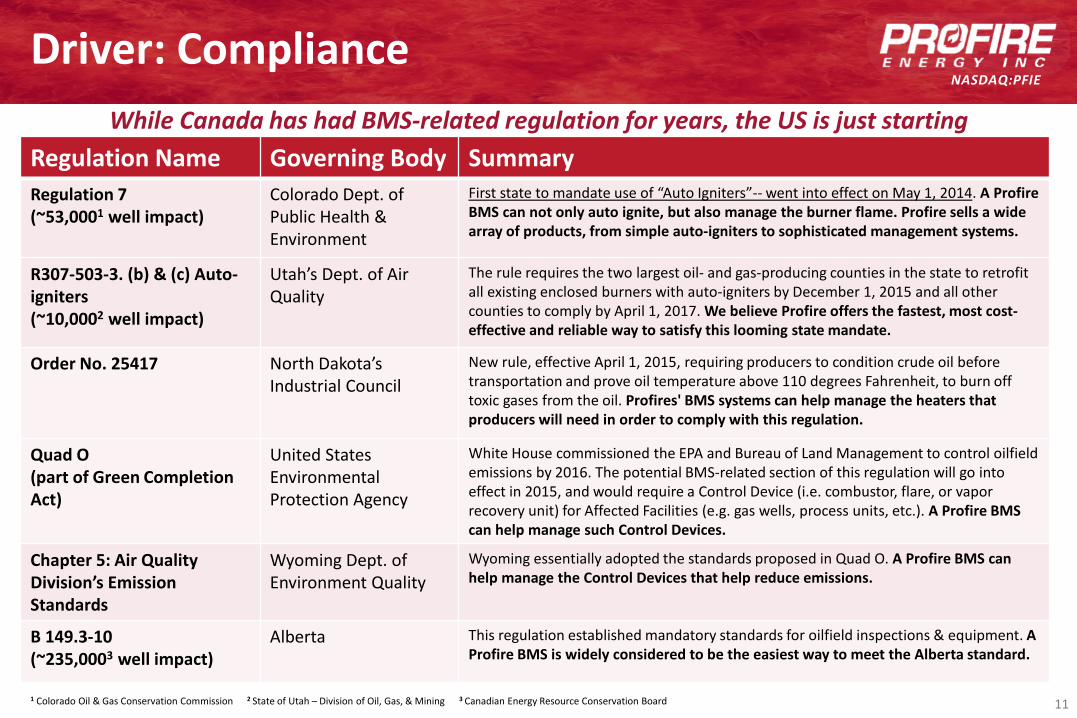
NASDAQ:PFIEDriver: Compliance
Regulation Name Governing Body SummaryRegulation 7(~53,0001 well impact)
Colorado Dept. of Public Health & Environment
First state to mandate use of “Auto Igniters”-- went into effect on May 1, 2014. A ProfireBMS can not only auto ignite, but also manage the burner flame. Profire sells a wide array of products, from simple auto-igniters to sophisticated management systems.
R307-503-3. (b) & (c) Auto-igniters(~10,0002 well impact)
Utah’s Dept. of Air Quality
The rule requires the two largest oil- and gas-producing counties in the state to retrofit all existing enclosed burners with auto-igniters by December 1, 2015 and all other counties to comply by April 1, 2017. We believe Profire offers the fastest, most cost-effective and reliable way to satisfy this looming state mandate.
Order No. 25417 North Dakota’s Industrial Council
New rule, effective April 1, 2015, requiring producers to condition crude oil before transportation and prove oil temperature above 110 degrees Fahrenheit, to burn off toxic gases from the oil. Profires' BMS systems can help manage the heaters that producers will need in order to comply with this regulation.
Quad O(part of Green Completion Act)
United States EnvironmentalProtection Agency
White House commissioned the EPA and Bureau of Land Management to control oilfield emissions by 2016. The potential BMS-related section of this regulation will go into effect in 2015, and would require a Control Device (i.e. combustor, flare, or vapor recovery unit) for Affected Facilities (e.g. gas wells, process units, etc.). A Profire BMS can help manage such Control Devices.
Chapter 5: Air Quality Division’s Emission Standards
Wyoming Dept. of Environment Quality
Wyoming essentially adopted the standards proposed in Quad O. A Profire BMS can help manage the Control Devices that help reduce emissions.
B 149.3-10(~235,0003 well impact)
Alberta This regulation established mandatory standards for oilfield inspections & equipment. A Profire BMS is widely considered to be the easiest way to meet the Alberta standard.
While Canada has had BMS-related regulation for years, the US is just starting
1 Colorado Oil & Gas Conservation Commission 2 State of Utah – Division of Oil, Gas, & Mining 3 Canadian Energy Resource Conservation Board 11
NASDAQ:PFIE
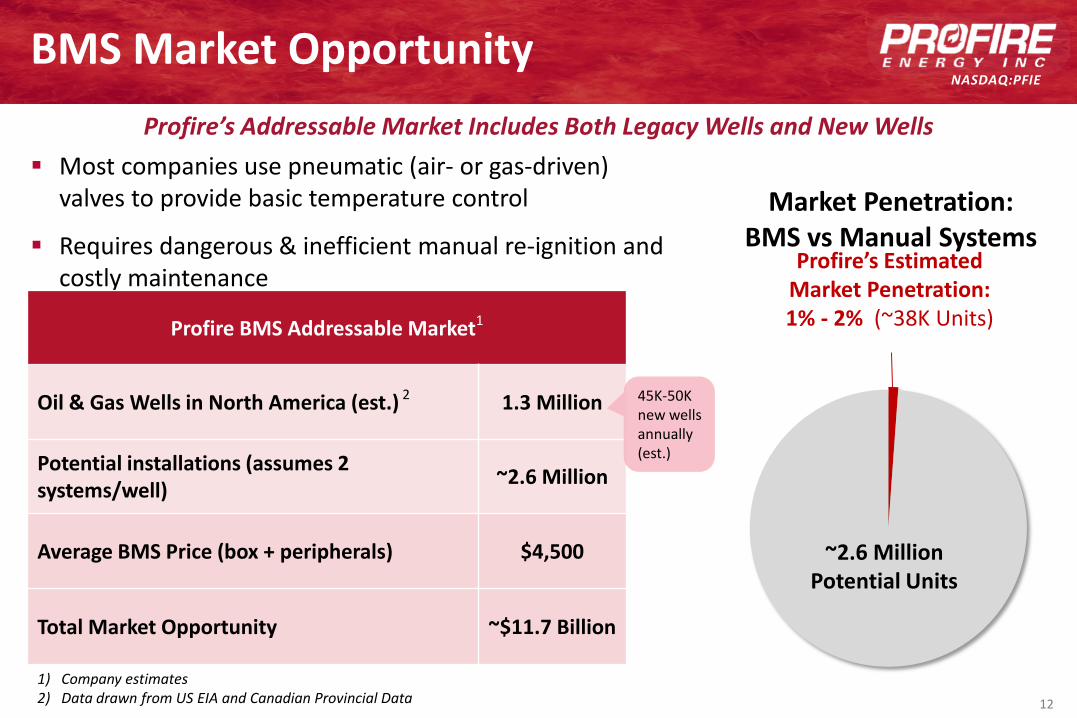
Market Penetration: BMS vs Manual Systems
BMS Market Opportunity
Most companies use pneumatic (air- or gas-driven) valves to provide basic temperature control
Requires dangerous & inefficient manual re-ignition and costly maintenance
1) Company estimates2) Data drawn from US EIA and Canadian Provincial Data
Profire BMS Addressable Market1
Oil & Gas Wells in North America (est.) 2 1.3 Million
Potential installations (assumes 2 systems/well) ~2.6 Million
Average BMS Price (box + peripherals) $4,500
Total Market Opportunity ~$11.7 Billion
45K-50K new wells annually (est.)
~2.6 Million Potential Units
Profire’s Estimated Market Penetration: 1% - 2% (~38K Units)
Profire’s Addressable Market Includes Both Legacy Wells and New Wells
12
NASDAQ:PFIE
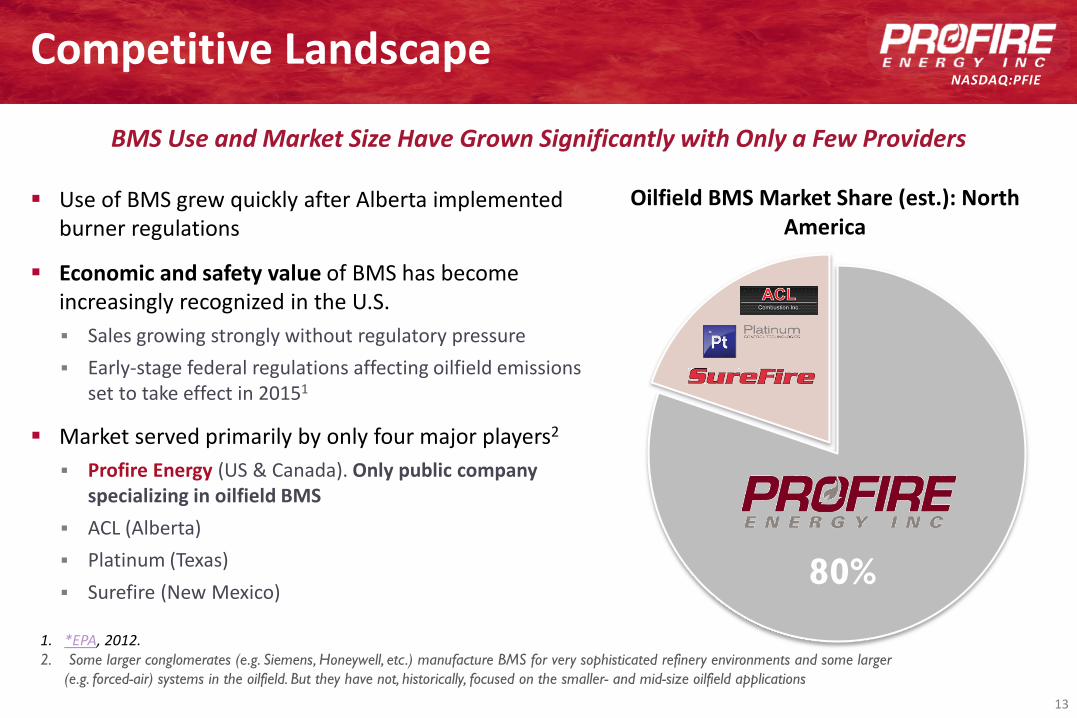
80%
Oilfield BMS Market Share (est.): North America
Competitive Landscape
Use of BMS grew quickly after Alberta implemented burner regulations
Economic and safety value of BMS has become increasingly recognized in the U.S. Sales growing strongly without regulatory pressure Early-stage federal regulations affecting oilfield emissions
set to take effect in 20151
Market served primarily by only four major players2
Profire Energy (US & Canada). Only public company specializing in oilfield BMS
ACL (Alberta) Platinum (Texas) Surefire (New Mexico)
BMS Use and Market Size Have Grown Significantly with Only a Few Providers
1. *EPA, 2012. 2. Some larger conglomerates (e.g. Siemens, Honeywell, etc.) manufacture BMS for very sophisticated refinery environments and some larger
(e.g. forced-air) systems in the oilfield. But they have not, historically, focused on the smaller- and mid-size oilfield applications
13
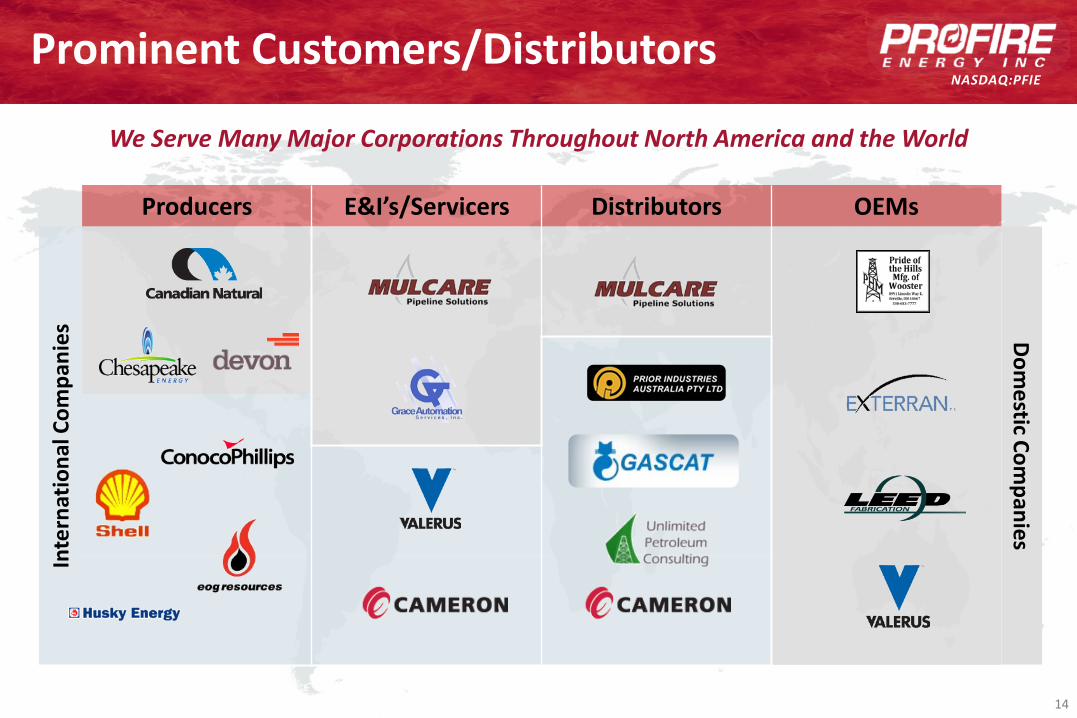
NASDAQ:PFIEProminent Customers/Distributors
Producers E&I’s/Servicers Distributors OEMs
Inte
rnat
iona
l Com
pani
es Dom
estic Companies
We Serve Many Major Corporations Throughout North America and the World
14
Chemical Management
15
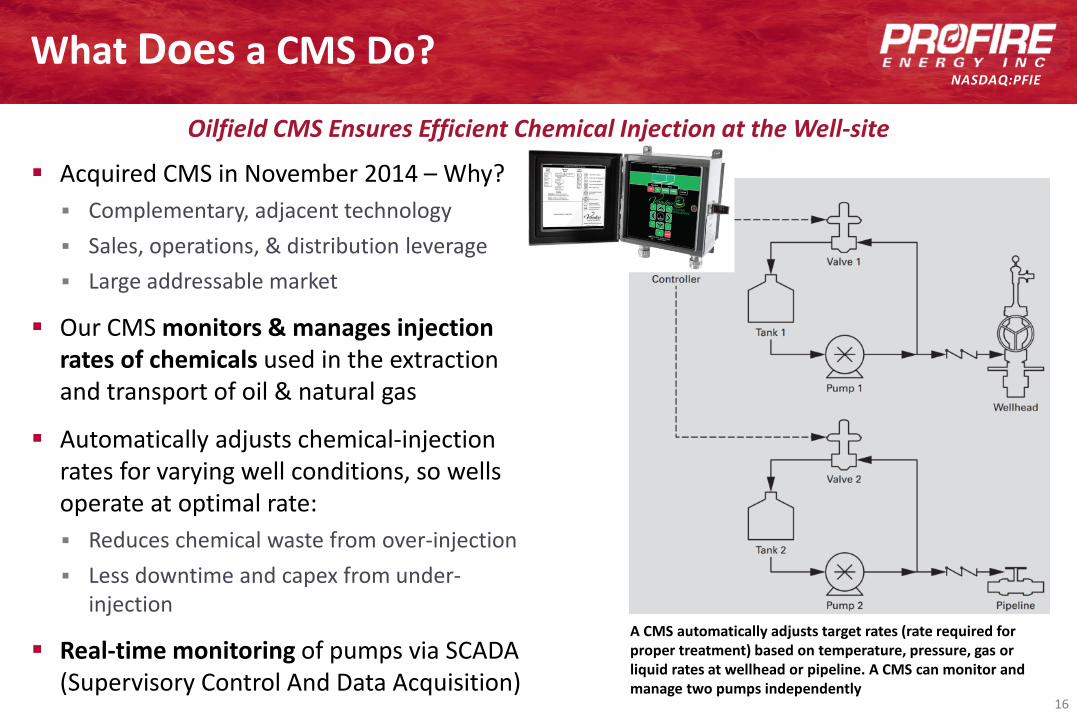
NASDAQ:PFIEWhat Does a CMS Do?
Acquired CMS in November 2014 – Why? Complementary, adjacent technology Sales, operations, & distribution leverage Large addressable market
Our CMS monitors & manages injection rates of chemicals used in the extraction and transport of oil & natural gas
Automatically adjusts chemical-injection rates for varying well conditions, so wells operate at optimal rate: Reduces chemical waste from over-injection Less downtime and capex from under-
injection
Real-time monitoring of pumps via SCADA (Supervisory Control And Data Acquisition)
A CMS automatically adjusts target rates (rate required for proper treatment) based on temperature, pressure, gas or liquid rates at wellhead or pipeline. A CMS can monitor and manage two pumps independently
Oilfield CMS Ensures Efficient Chemical Injection at the Well-site
16
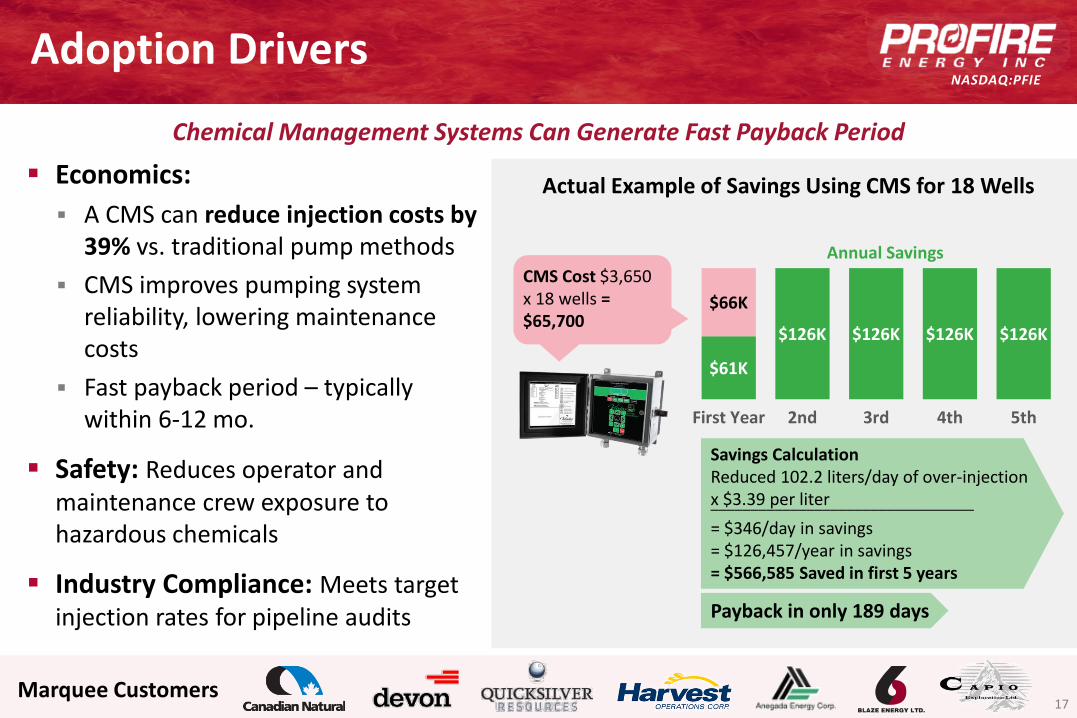
NASDAQ:PFIEAdoption Drivers
Economics: A CMS can reduce injection costs by
39% vs. traditional pump methods CMS improves pumping system
reliability, lowering maintenance costs
Fast payback period – typically within 6-12 mo.
Safety: Reduces operator and maintenance crew exposure to hazardous chemicals
Industry Compliance: Meets target injection rates for pipeline audits
Marquee Customers
Chemical Management Systems Can Generate Fast Payback Period
$61K
$126K $126K $126K $126K
$66K
First Year 2nd 3rd 4th 5th
Annual SavingsCMS Cost $3,650 x 18 wells = $65,700
Payback in only 189 days
Savings Calculation Reduced 102.2 liters/day of over-injection x $3.39 per liter_________________________________
= $346/day in savings= $126,457/year in savings= $566,585 Saved in first 5 years
Actual Example of Savings Using CMS for 18 Wells
17
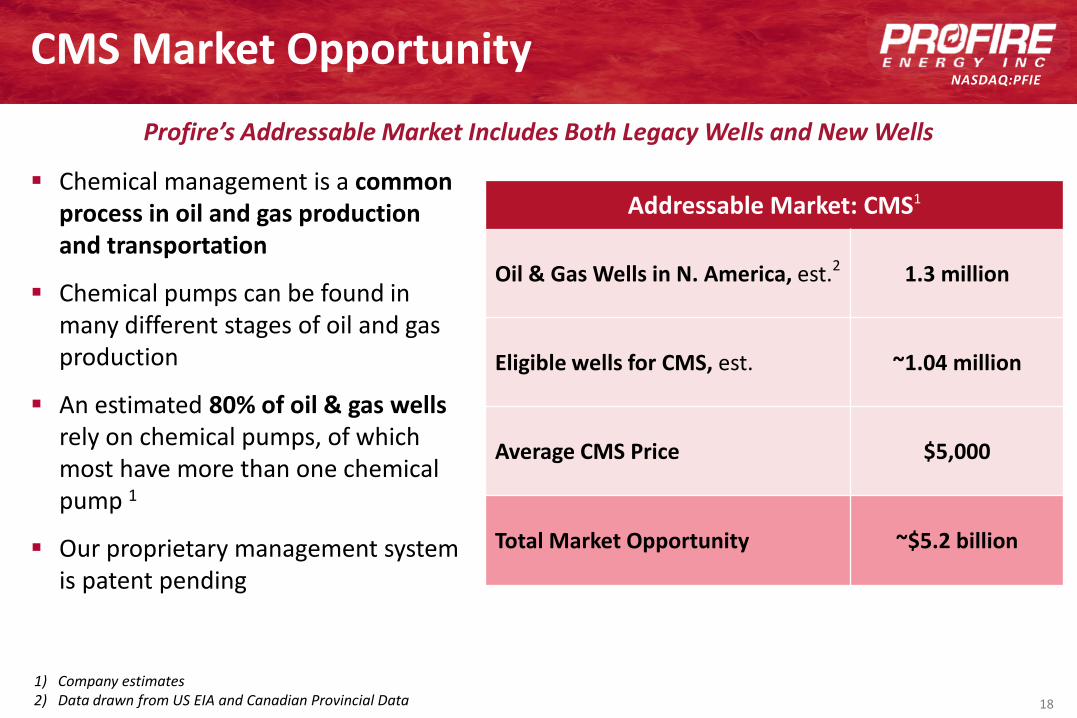
NASDAQ:PFIECMS Market Opportunity
Chemical management is a common process in oil and gas production and transportation
Chemical pumps can be found in many different stages of oil and gas production
An estimated 80% of oil & gas wells rely on chemical pumps, of which most have more than one chemical pump 1
Our proprietary management system is patent pending
1) Company estimates2) Data drawn from US EIA and Canadian Provincial Data
Addressable Market: CMS1
Oil & Gas Wells in N. America, est.2 1.3 million
Eligible wells for CMS, est. ~1.04 million
Average CMS Price $5,000
Total Market Opportunity ~$5.2 billion
Profire’s Addressable Market Includes Both Legacy Wells and New Wells
18

Strategy & Finance
19
NASDAQ:PFIE
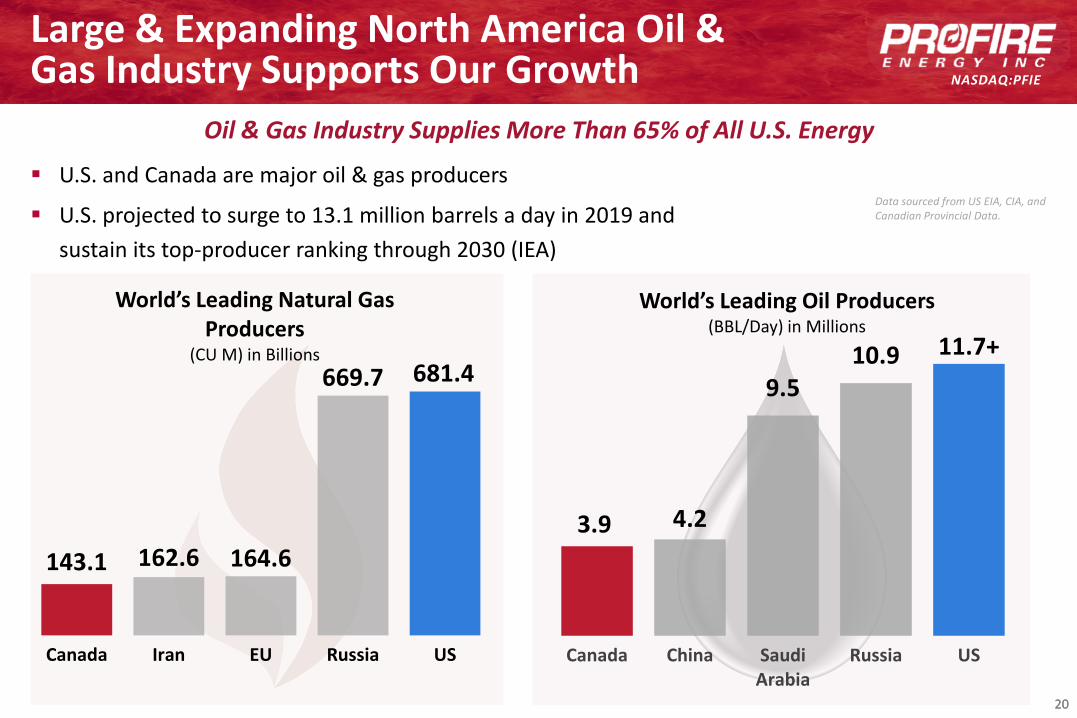
Large & Expanding North America Oil & Gas Industry Supports Our Growth
U.S. and Canada are major oil & gas producers
U.S. projected to surge to 13.1 million barrels a day in 2019 and sustain its top-producer ranking through 2030 (IEA)
Oil & Gas Industry Supplies More Than 65% of All U.S. Energy
143.1 162.6 164.6
669.7 681.4
Canada Iran EU Russia US
World’s Leading Natural Gas Producers
(CU M) in Billions
3.9 4.2
9.510.9 11.7+
Canada China SaudiArabia
Russia US
World’s Leading Oil Producers(BBL/Day) in Millions
20
Data sourced from US EIA, CIA, and Canadian Provincial Data.
20
NASDAQ:PFIE
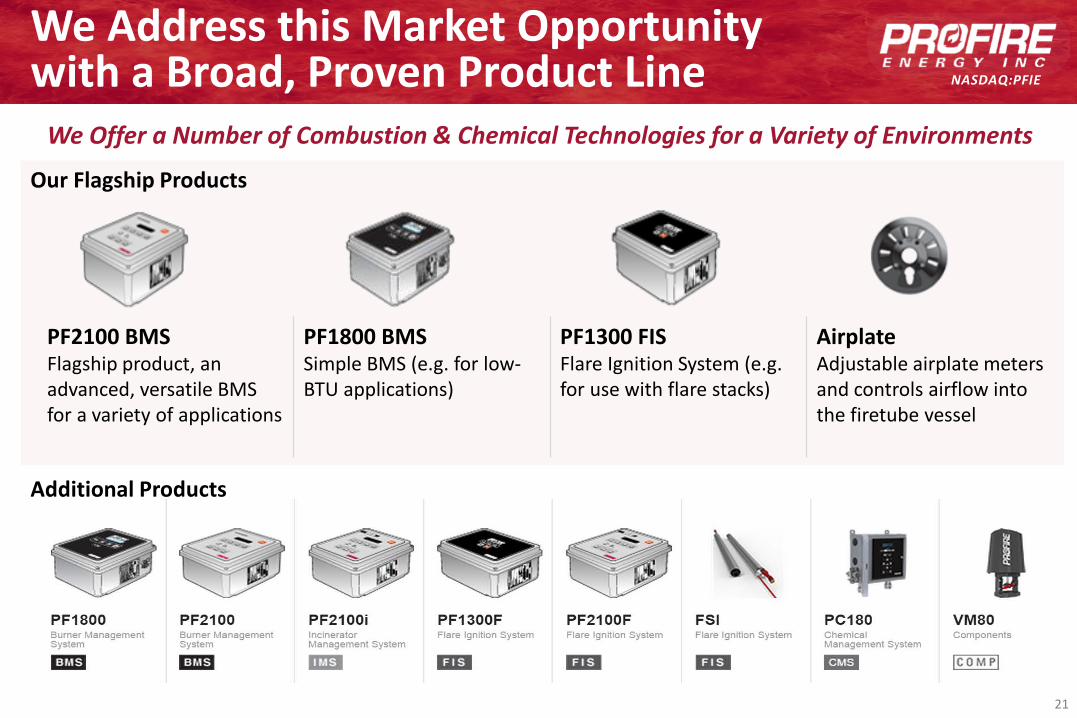
Additional Products
Our Flagship Products
We Address this Market Opportunity with a Broad, Proven Product Line
We Offer a Number of Combustion & Chemical Technologies for a Variety of Environments
PF2100 BMSFlagship product, an advanced, versatile BMS for a variety of applications
PF1800 BMSSimple BMS (e.g. for low-BTU applications)
PF1300 FISFlare Ignition System (e.g. for use with flare stacks)
AirplateAdjustable airplate meters and controls airflow into the firetube vessel
21
NASDAQ:PFIE
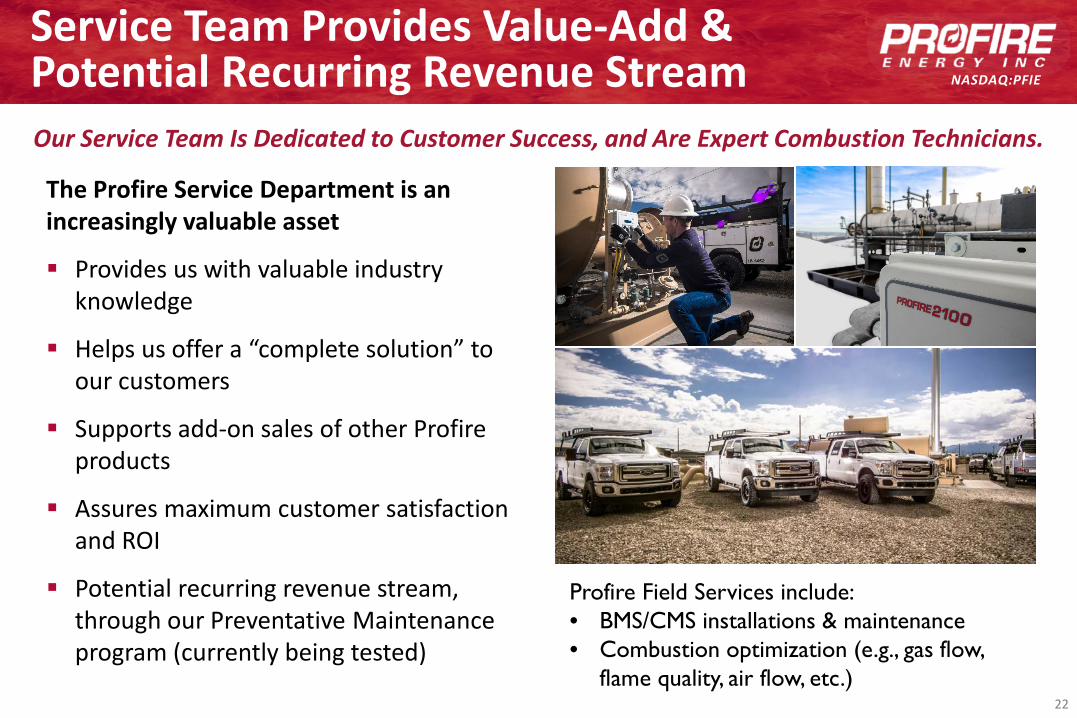
Service Team Provides Value-Add & Potential Recurring Revenue Stream
The Profire Service Department is an increasingly valuable asset
Provides us with valuable industry knowledge
Helps us offer a “complete solution” to our customers
Supports add-on sales of other Profireproducts
Assures maximum customer satisfaction and ROI
Potential recurring revenue stream, through our Preventative Maintenance program (currently being tested)
Our Service Team Is Dedicated to Customer Success, and Are Expert Combustion Technicians.
Profire Field Services include:• BMS/CMS installations & maintenance• Combustion optimization (e.g., gas flow,
flame quality, air flow, etc.)22
NASDAQ:PFIE
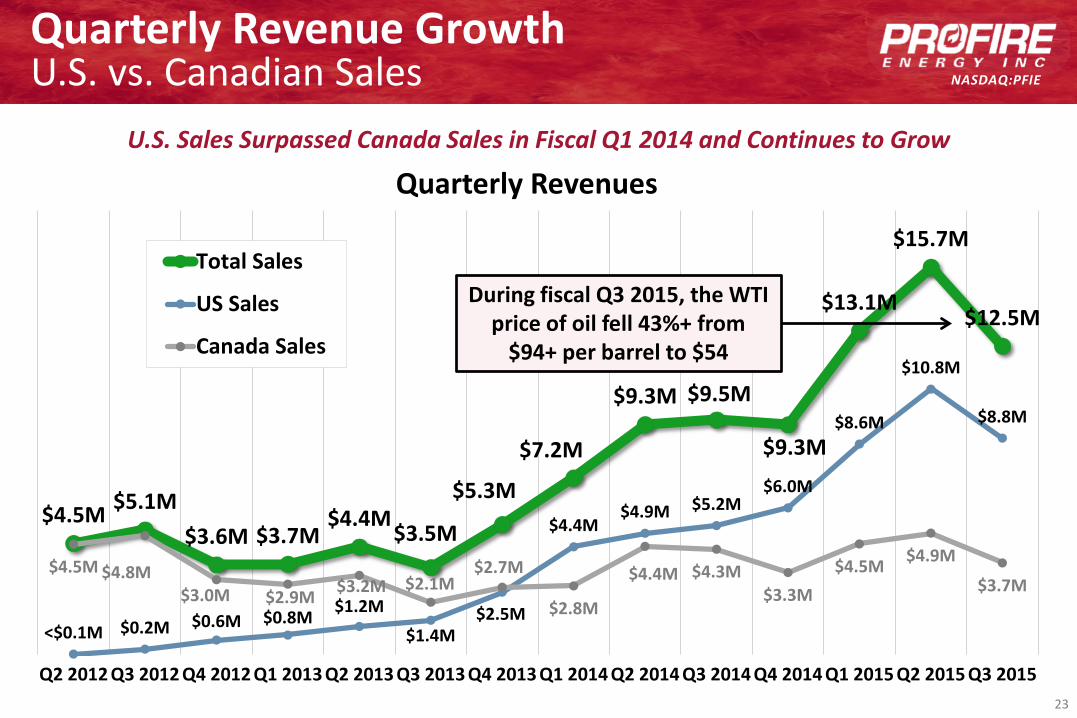
Quarterly Revenue GrowthU.S. vs. Canadian Sales
$4.5M $5.1M$3.6M $3.7M
$4.4M$3.5M
$5.3M
$7.2M
$9.3M $9.5M
$9.3M
$13.1M
$15.7M
$12.5M
<$0.1M $0.2M $0.6M $0.8M $1.2M$1.4M
$2.5M
$4.4M$4.9M $5.2M
$6.0M
$8.6M
$10.8M
$8.8M
$4.5M $4.8M$3.0M $2.9M $3.2M $2.1M
$2.7M
$2.8M
$4.4M $4.3M$3.3M
$4.5M $4.9M
$3.7M
Q2 2012 Q3 2012 Q4 2012 Q1 2013 Q2 2013 Q3 2013 Q4 2013 Q1 2014 Q2 2014 Q3 2014 Q4 2014 Q1 2015 Q2 2015 Q3 2015
Quarterly Revenues
Total Sales
US Sales
Canada Sales
U.S. Sales Surpassed Canada Sales in Fiscal Q1 2014 and Continues to Grow
During fiscal Q3 2015, the WTI price of oil fell 43%+ from
$94+ per barrel to $54
23
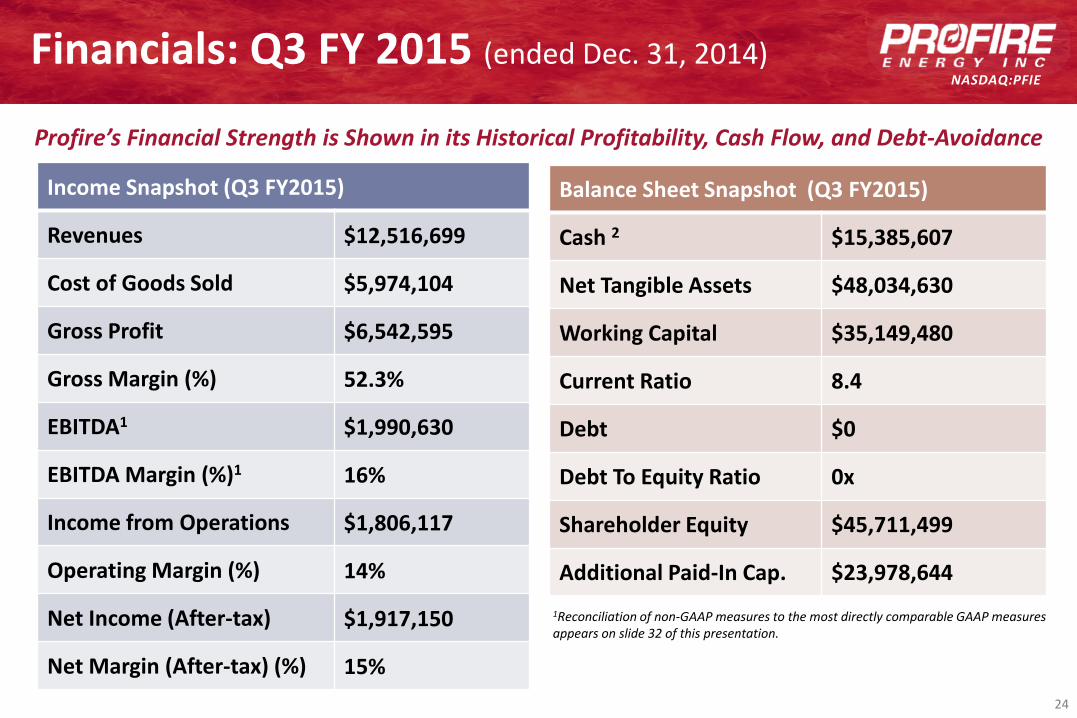
NASDAQ:PFIEFinancials: Q3 FY 2015 (ended Dec. 31, 2014)
Balance Sheet Snapshot (Q3 FY2015)
Cash 2 $15,385,607
Net Tangible Assets $48,034,630
Working Capital $35,149,480
Current Ratio 8.4
Debt $0
Debt To Equity Ratio 0x
Shareholder Equity $45,711,499
Additional Paid-In Cap. $23,978,644
Income Snapshot (Q3 FY2015)
Revenues $12,516,699
Cost of Goods Sold $5,974,104
Gross Profit $6,542,595
Gross Margin (%) 52.3%
EBITDA1 $1,990,630
EBITDA Margin (%)1 16%
Income from Operations $1,806,117
Operating Margin (%) 14%
Net Income (After-tax) $1,917,150
Net Margin (After-tax) (%) 15%
1Reconciliation of non-GAAP measures to the most directly comparable GAAP measures appears on slide 32 of this presentation.
Profire’s Financial Strength is Shown in its Historical Profitability, Cash Flow, and Debt-Avoidance
24
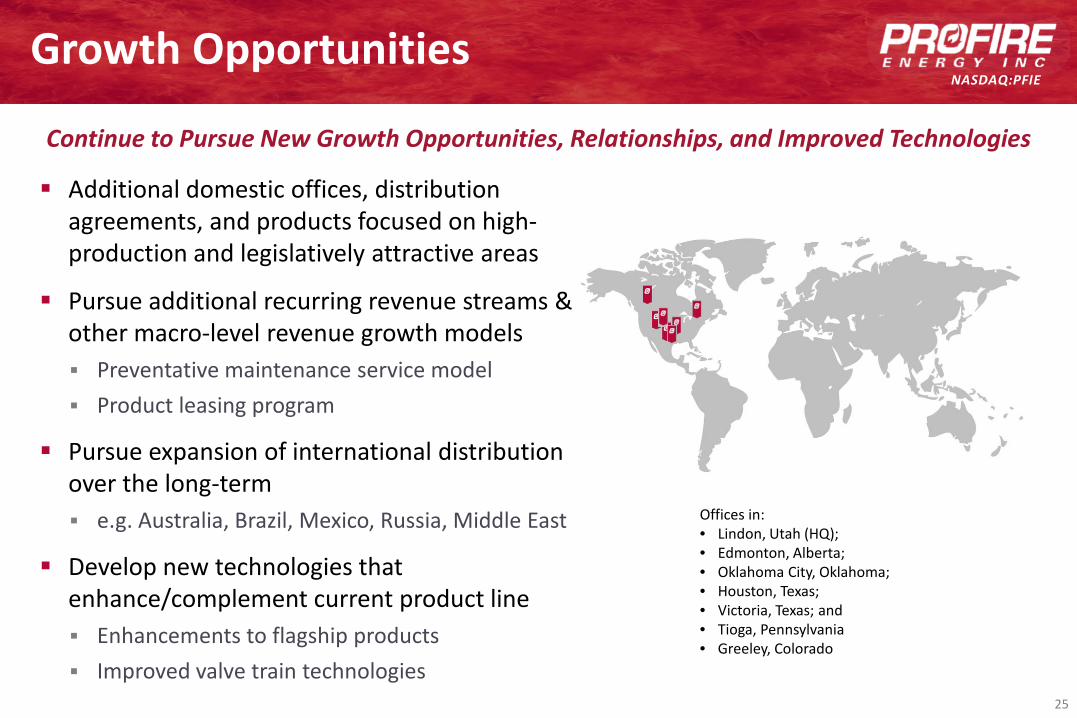
NASDAQ:PFIEGrowth Opportunities
Additional domestic offices, distribution agreements, and products focused on high-production and legislatively attractive areas
Pursue additional recurring revenue streams & other macro-level revenue growth models Preventative maintenance service model Product leasing program
Pursue expansion of international distribution over the long-term e.g. Australia, Brazil, Mexico, Russia, Middle East
Develop new technologies that enhance/complement current product line Enhancements to flagship products Improved valve train technologies
Offices in:• Lindon, Utah (HQ);• Edmonton, Alberta;• Oklahoma City, Oklahoma; • Houston, Texas; • Victoria, Texas; and• Tioga, Pennsylvania• Greeley, Colorado
Continue to Pursue New Growth Opportunities, Relationships, and Improved Technologies
25
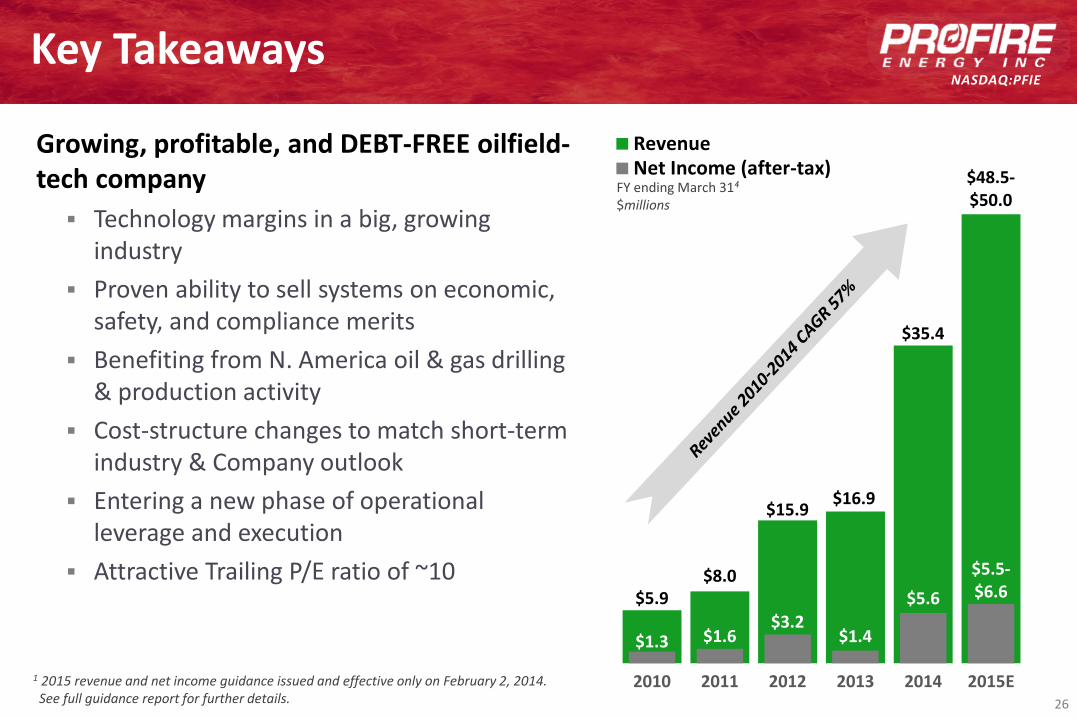
NASDAQ:PFIEKey Takeaways
Growing, profitable, and DEBT-FREE oilfield-tech company Technology margins in a big, growing
industry Proven ability to sell systems on economic,
safety, and compliance merits Benefiting from N. America oil & gas drilling
& production activity Cost-structure changes to match short-term
industry & Company outlook Entering a new phase of operational
leverage and execution Attractive Trailing P/E ratio of ~10
$5.9$8.0
$15.9 $16.9
$35.4
$48.5-$50.0
$1.3 $1.6$3.2
$1.4
$5.6
$5.5-$6.6
2010 2011 2012 2013 2014 2015E
RevenueNet Income (after-tax)
FY ending March 314
$millions
1 2015 revenue and net income guidance issued and effective only on February 2, 2014. See full guidance report for further details. 26

NASDAQ:PFIEContact Us
Tanner LambInvestor Relations Manager(801) 796.5127 [email protected]
Nathan McBrideVP Strategy & Finance(801) [email protected]
Visit www.ProfireEnergy.com for investor resources & updates
27

Appendix
28
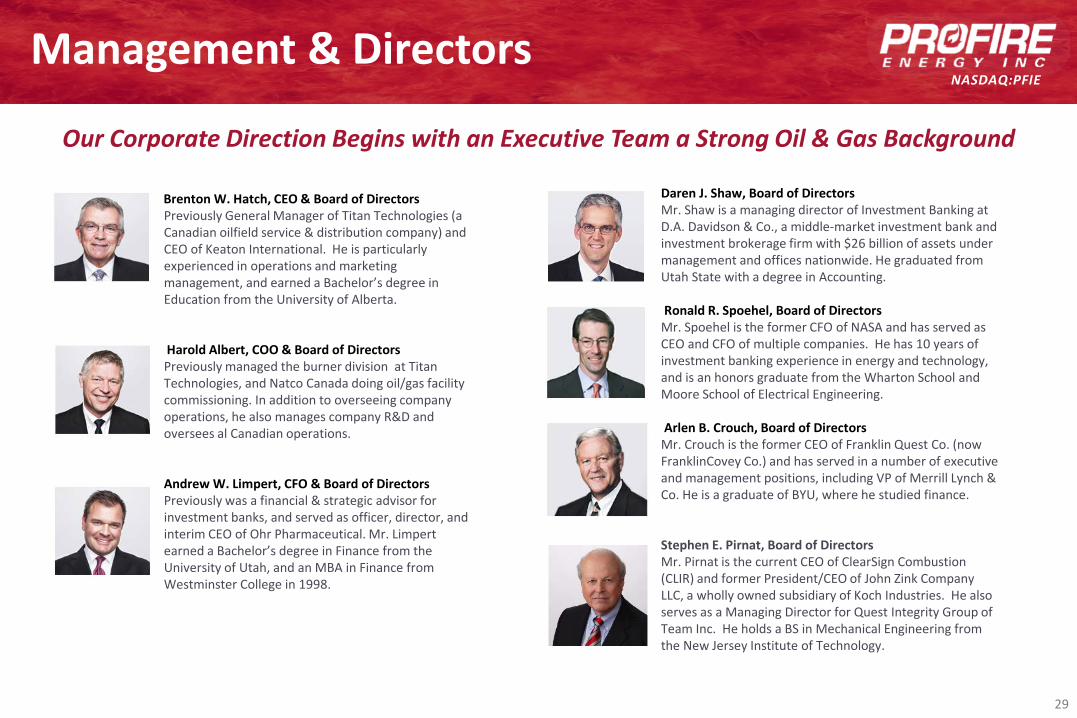
NASDAQ:PFIEManagement & Directors
Daren J. Shaw, Board of DirectorsMr. Shaw is a managing director of Investment Banking at D.A. Davidson & Co., a middle-market investment bank and investment brokerage firm with $26 billion of assets under management and offices nationwide. He graduated from Utah State with a degree in Accounting.
Ronald R. Spoehel, Board of DirectorsMr. Spoehel is the former CFO of NASA and has served as CEO and CFO of multiple companies. He has 10 years of investment banking experience in energy and technology, and is an honors graduate from the Wharton School and Moore School of Electrical Engineering.
Arlen B. Crouch, Board of DirectorsMr. Crouch is the former CEO of Franklin Quest Co. (now FranklinCovey Co.) and has served in a number of executive and management positions, including VP of Merrill Lynch & Co. He is a graduate of BYU, where he studied finance.
Stephen E. Pirnat, Board of DirectorsMr. Pirnat is the current CEO of ClearSign Combustion (CLIR) and former President/CEO of John Zink Company LLC, a wholly owned subsidiary of Koch Industries. He also serves as a Managing Director for Quest Integrity Group of Team Inc. He holds a BS in Mechanical Engineering from the New Jersey Institute of Technology.
Brenton W. Hatch, CEO & Board of DirectorsPreviously General Manager of Titan Technologies (a Canadian oilfield service & distribution company) and CEO of Keaton International. He is particularly experienced in operations and marketing management, and earned a Bachelor’s degree in Education from the University of Alberta.
Harold Albert, COO & Board of DirectorsPreviously managed the burner division at Titan Technologies, and Natco Canada doing oil/gas facility commissioning. In addition to overseeing company operations, he also manages company R&D and oversees al Canadian operations.
Andrew W. Limpert, CFO & Board of DirectorsPreviously was a financial & strategic advisor for investment banks, and served as officer, director, and interim CEO of Ohr Pharmaceutical. Mr. Limpert earned a Bachelor’s degree in Finance from the University of Utah, and an MBA in Finance from Westminster College in 1998.
Our Corporate Direction Begins with an Executive Team a Strong Oil & Gas Background
29
NASDAQ:PFIE
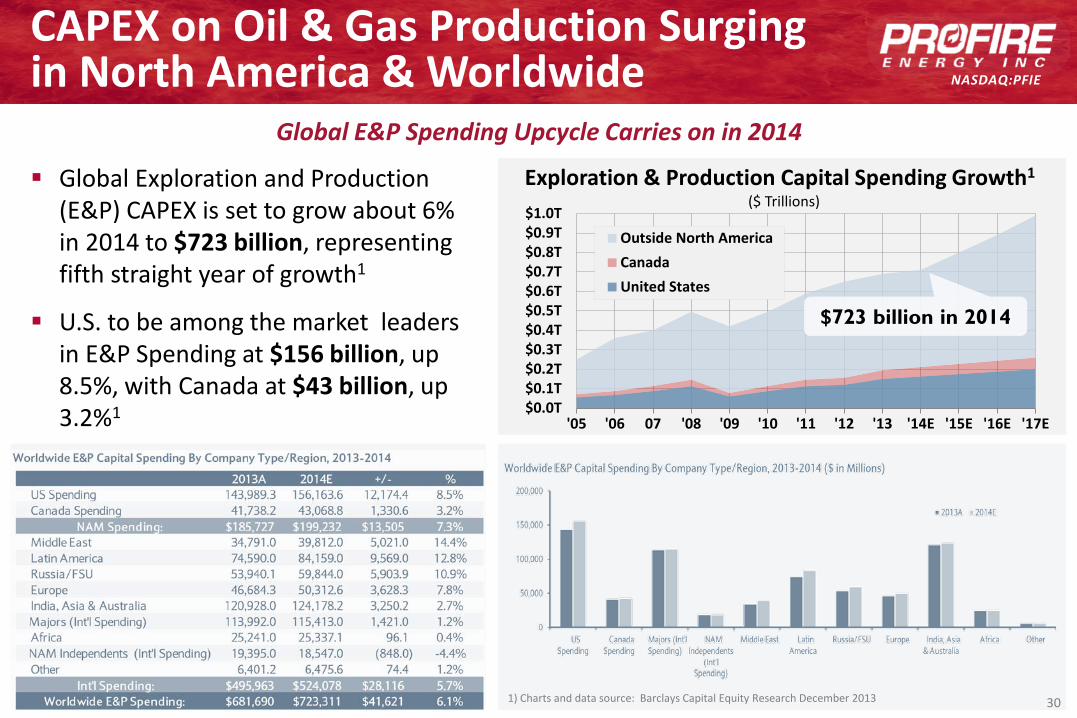
CAPEX on Oil & Gas Production Surging in North America & Worldwide
Global Exploration and Production (E&P) CAPEX is set to grow about 6% in 2014 to $723 billion, representing fifth straight year of growth1
U.S. to be among the market leaders in E&P Spending at $156 billion, up 8.5%, with Canada at $43 billion, up 3.2%1
1) Charts and data source: Barclays Capital Equity Research December 2013
$0.0T$0.1T$0.2T$0.3T$0.4T$0.5T$0.6T$0.7T$0.8T$0.9T$1.0T
'05 '06 07 '08 '09 '10 '11 '12 '13 '14E '15E '16E '17E
Outside North AmericaCanadaUnited States
Exploration & Production Capital Spending Growth1
($ Trillions)
$723 billion in 2014
Global E&P Spending Upcycle Carries on in 2014
30
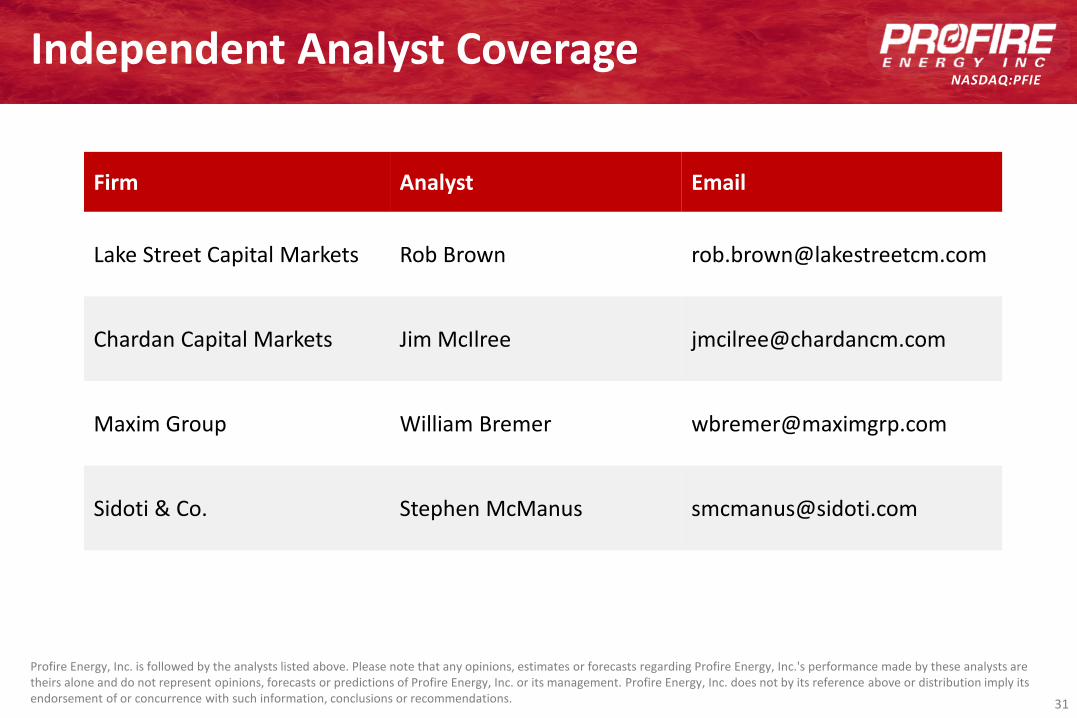
NASDAQ:PFIEIndependent Analyst Coverage
Firm Analyst Email
Lake Street Capital Markets Rob Brown [email protected]
Chardan Capital Markets Jim McIlree [email protected]
Maxim Group William Bremer [email protected]
Sidoti & Co. Stephen McManus [email protected]
Profire Energy, Inc. is followed by the analysts listed above. Please note that any opinions, estimates or forecasts regarding Profire Energy, Inc.'s performance made by these analysts are theirs alone and do not represent opinions, forecasts or predictions of Profire Energy, Inc. or its management. Profire Energy, Inc. does not by its reference above or distribution imply its endorsement of or concurrence with such information, conclusions or recommendations. 31
NASDAQ:PFIE
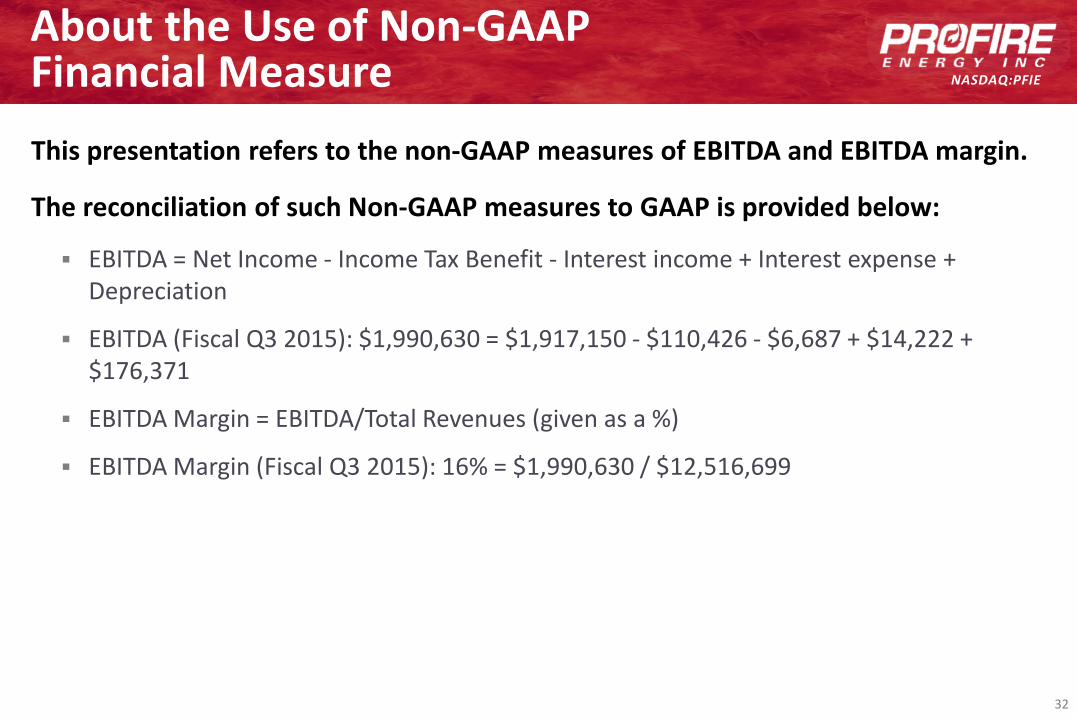
About the Use of Non-GAAPFinancial MeasureThis presentation refers to the non-GAAP measures of EBITDA and EBITDA margin.
The reconciliation of such Non-GAAP measures to GAAP is provided below:
EBITDA = Net Income - Income Tax Benefit - Interest income + Interest expense + Depreciation
EBITDA (Fiscal Q3 2015): $1,990,630 = $1,917,150 - $110,426 - $6,687 + $14,222 + $176,371
EBITDA Margin = EBITDA/Total Revenues (given as a %)
EBITDA Margin (Fiscal Q3 2015): 16% = $1,990,630 / $12,516,699
32