pgs’ ambition is to develop superior seismic data quality
TRANSCRIPT

PGS’ ambition is to develop superior seismic data quality to support customers’ exploration and production success
ANN
UAL REPORT 2013

CONTENT 1 THIS IS PGS
12 A CLEARER IMAGE
22 BUSINESS AREAS
32 PGS PERFORMANCE
46 BOARD OF DIRECTORS’ REPORT 56 FINANCIAL
STATEMENTS
THIS IS PGS
Petroleum Geo-Services (PGS) is a focused Marine geophysical company that provides a broad range of seismic and reservoir services, including acquisition, imaging, interpretation, and field evaluation. The Company’s MultiClient data library is among the largest in the seismic industry, with modern 3D coverage in all significant offshore hydrocarbon provinces of the world.
KEY FIGURES
PROPOSED DIVIDEND INCREASE OF
39%COMPARED TO 2012
NUMBER OF PATENTS GRANTED
Patents held by PGS granted under the laws of the U.S., the UK and Norway
395PATENTS
AVERAGE STREAMERS PER VESSEL
12.9BY THE END OF 2015
STREAMER MARKET SHARE OF
21%AS OF YEAR-END 2013 (PGS ESTIMATE)
NUMBER OF SEISMIC 3D VESSELS IN OPERATIONS
11AS OF APRIL 2014
9.2YEARS BY THE END OF 2015
AVERAGE VESSEL AGE

PGS ANNUAL REPORT 2013
1LOREM IPSUM
THIS IS PGS
FINANCIAL CALENDAR2014
REVENUE SPLIT
Marine Contract 45%MultiClient 45%Imaging 8%Other 2%
May 8 Annual General Meeting May 9 Q1 2014 Earnings Release July 24 Q2 2014 Earnings Release October 23 Q3 2014 Earnings ReleaseDecember 19 Capital Markets Day, Oslo
BUSINESS HIGHLIGHTS2013
Improved earnings compared to 2012 driven by all business areas.
MultiClient late sales at a record high, delivering good returns on the investments made in MultiClient.
Took delivery of Ram-form Titan, the first in a series of four Ramform Titan-class vessels.
Amended and extended the revolving credit facility.
Completed the first ever full-scale simul-taneous acquisition of Towed EM and 2D GeoStreamer® seismic.
New imaging techno-logies enabled PGS to get a perfect seismic tie at well locations in areas where, until now, this has been impossible.
Commenced acquisition of the Triton Full Azimuth GeoStreamer survey in the Gulf of Mexico.
Introduced a Quality Improvement Program to capture lost revenues by preventing quality related losses.
The Board of Directors proposes a dividend of NOK 2.30 per share, up 39 percent from 2012.
PGS REVENUESIn millions of US dollars
0
500
1000
1500
2000
2010 2011 2012 2013
VESSEL UTILIZATION
Contract 45%MultiClient 42%Steaming 10%Yard 3%
KEY FINANCIAL FIGURES
In USD million except per share data 2013 2012 2011 2010Revenues 1,501.6 1,518.3 1,253.3 1,135.1EBITDA (as defined) 828.9 776.2 534.8 475.4EBIT ex. impairment charges¹ 397.1 293.0 141.3 130.5EBIT as reported 382.1 293.8 138.7 51.4Net income 238.3 185.5 33.7 (14.0)EPS 1.11 0.86 0.16 (0.07)Net cash provided by operating activities 775.3 752.9 480.4 355.5Capital expenditures 437.8 368.1 279.9 223.5 Cash investment in MultiClient library 373.0 297.4 203.9 166.7Total assets 3,544.3 3,275.6 3,137.2 3,035.0MultiClient library 576.9 382.3 334.1 310.8Cash and cash equivalents 263.8 390.3 424.7 432.6Shareholders equity 2,065.6 1,911.5 1,771.7 1,755.3Net interest bearing debt 666.7 435.6 394.2 279.2¹ See notes to the financial statements for details of impairments by period presented

PGS ANNUAL REPORT 2013
2THISIS PGS
PGS took delivery of the Ramform Atlas in late January 2014, the second in a series of four Ramform Titan-class vessels.

PGS ANNUAL REPORT 2013
3THISIS PGS
We entered 2013 at a strong pace. However, sharper focus on cost and improved cash flow among our customers became increasingly appar-ent during the first half of the year and made the market more chal-lenging than anticipated. PGS responded by shifting more capacity into MultiClient activities, where better opportunities were identified. Reallocating capacity delayed revenue timing, since the MultiClient business model entails sales over a number of years.
The Industrial ApproachThe Industrial Approach is all about establishing a sound, industrial platform for delivering performance through the cycle and gener-ating consistent returns to our shareholders. The platform is sup-ported by three pillars: a vessel investment strategy, an operational strategy and a financial strategy.
Our ongoing new build program is governed by our vessel investment strategy, which specifically targets capacity investments that will bol-ster PGS’ market differentiation. Our most sustainable competitive advantage is the productivity of the fleet, primarily the high capacity Ramform vessels. Since 2008 we have taken delivery of five new ves-sels. Ramform Atlas, the latest fleet addition, was delivered late January 2014. Two more Ramform Titan-class deliveries are scheduled for 2015.
Fleet renewal has reduced the average vessel age significantly and by end 2015 we will have increased the number of streamers in the water by more than 50 percent since 2012. Market share is not a PGS objective, but critical mass is. We will only deploy PGS capital to new builds when we can establish real productivity differentiation and of course can see the prospect of a satisfactory Return On Capital Employed. All other
DEAR FELLOWSHAREHOLDERAll business areas contributed to the higher margins we achieved in 2013. Going forward, we are targeting continued earnings growth driven by the vessel new build program and our industrial business approach.
CEO letter 2013

PGS ANNUAL REPORT 2013
4THISIS PGS
capacity will be chartered in. We will as well avoid building capacity to try to hit anticipated peaks in the market , but add new capacity step by step through the cycle in line with market and replacement needs.
The main objectives of our operational strategy are to maintain our leading position within Health, Safety and Environment, increase our productivity advantage over peers and implement differentiat-ing GeoStreamer-based technologies on all vessels and in all imag-ing centers. Our technology position has improved significantly over recent years and we intend to continue to harvest from our technol-ogy pipeline. Developing a focused organization that can optimize profitability by balancing Marine Contract and MultiClient activities is another important aspect of our operational strategy. Since 2010 we have had a stronger focus on MultiClient, leading to growth in size and profitability. Pre-funding has been at a healthy level and is targeted to be in the range of 80-120 percent of capitalized cash investments. Supporting our operational strategy is a relentless drive for continuous improvements and operational excellence.
The financial strategy consists of capital discipline, a prudent finan-cial structure and a conservative gearing policy with focus on increas-ing both return on capital employed and dividend capacity.
We will continue to develop our business along these industrial lines of thinking.
2015 marks the end of our current new build program. From then on, it is about capitalizing on the benefits of a GeoStreamer-equipped fleet, and our improved productivity differentiation. Our focus will continue to be on improving profitability and return on capital employed while deliv-ering free cash flow and increased dividend capacity. We will grow the MultiClient business further and we remain confident that Geo Streamer Imaging will become yet another differentiator for the Company. We will continue to develop and commercialize new technologies and do our utmost to maintain leadership in Health, Safety and Environmen-tal performance as well as delivering cost and quality excellence.
Strong Performance In 2013, fleet operations and safety performance reached the best levels we have ever achieved. Strong operational performance will always be an important driver for improved financial results.
“WE WILL ONLY DEPLOY PGS CAPITAL TO NEW BUILDS WHEN WE CAN ESTABLISH REAL PRODUCTIVITY DIFFERENTIATION. ”

PGS ANNUAL REPORT 2013
5THISIS PGS
MultiClient late sales came in at a record level in 2013. This confirms the attractiveness of our MultiClient library and our ability to generate solid returns on our MultiClient investments. The lower pre-funding level experienced in 2013, compared with 2012, was mainly due to a lower proportion of surveys covering held acreage and relates to timing of expected cash flows. Our MultiClient performance in 2013 demon-strates healthy demand for quality products in attractive locations, despite customers’ increased focus on cost and improved cash flow.Our external Imaging revenues ended at approximately the same level as for 2012, while MultiClient processing increased in 2013.
Marine Contract’s operating margin for the full year 2013 ended at a solid 29 percent.
Improved Financial FlexibilityWe increased and extended our revolving credit facility in 2013, which contributed to a debt maturity profile of more than four years. At our capital markets day presentation in 2013, we flagged that the Company was considering refinancing of the Term Loan B. With the successful completion in March 2014 of both the refinancing of the Term Loan B and the Japanese export credit financing for the two last Ramform Titan-class vessels, the average time to maturity for our debt and drawing facilities has increased to almost six years.
Differentiation through InnovationTechnology plays an increasingly important role in differentiating seismic suppliers. Advancing PGS’ status as a leading innovator is a strategic objective. While GeoStreamer is the best example of our current differentiation through technology, further innovative prod-ucts have been commercialized in 2013.
The inherent capabilities of GeoStreamer have been an eye-opener for many clients. A good example is Lundin Petroleum’s application of Separated Wavefield Imaging in combination with Full Waveform Inversion on GeoStreamer data, for the now Statoil operated Johan Sverdrup field. The result was a perfect seismic tie at well location, an impossible task using conventional seismic data. Another example of acceptance of our technology in 2013 was the first ever full-scale simultaneous acquisition of Towed EM (Electro Magnetic) and 2D GeoStreamer seismic data. The first combined data sets to be avail-able in 2014.
OutlookIn 2014, basins offshore Brazil will be important drivers for seismic demand in the wake of the two licensing rounds completed in the region in 2013. Further north, oil companies are making discoveries offshore Central America and the hydrocarbon potential there will be further explored in 2014. Activity levels in the Gulf of Mexico have picked up, and we began our Triton Full Azimuth survey there in November 2013. Willingness to explore offshore Africa and Australia is growing. That said, activity levels in Nigeria, Asia Pacific, and off-shore Libya and Egypt remain relatively low, although these regions offer good future growth potential.
The North Atlantic region will once again be busy, driven by high exploration and production interest. We expect very healthy market conditions for the upcoming summer season.
We entered 2014 with a strong order book and our focus is increasingly on building backlog for the fourth quarter 2014 and first quarter 2015.
In late 2013, we launched a Quality Improvement Program aimed at improving profitability through capturing lost revenues by preventing quality shortcomings. In addition in early 2014, we launched a new cost initiative, targeting a run-rate cost reduction of $30 million by year-end.
The long-term prospects for our industry are good. Energy companies continue their search for new hydrocarbon resources in regions featur-ing deeper waters, harsher environments, extreme reservoir depths, and complex geologies. PGS’ excellent reputation, unique technolo-gies and solid market share in the higher-end survey market segment makes us an attractive contractor and partner for oil companies.
Our services are competitive, we offer leading-edge technologies, and our financial position is robust.
JON ERIK REINHARDSENPresident and CEO

PGS ANNUAL REPORT 2013
6THISIS PGS
THE WORLD OF PGS
OFFICESPGS has offices in 21 countries around the world and operates major regional centers in London, Houston, and Singapore, with the headquarters in Oslo, Norway.
AVERAGE NUMBER OF EMPLOYEES
0
500
1000
1500
2000
2500
2010 2011 2012 2013
LOST TIME INCIDENT FREQUENCY (LTIF)
0.16Per million man-hours, compared to 0.17 in 2012.
TOTAL RECORDABLE CASE FREQUENCY (TRCF)
0.94Per million man-hours, compared to 0.66 in 2012.

PGS ANNUAL REPORT 2013
7THIS IS PGS
RESEARCH AND DEVELOPMENT SPENDING OF APPROXIMATELY USD
60 MILLION ANNUALLY
JUBARTE'S OPTOSEIS SYSTEM INSTALLED AT WATER DEPTHS GREATER THAN
The first Permanent Reservoir Monitoring system installed at such depths.
1,000METERS
EXTERNAL IMAGING REVENUES HAVE INCREASED
40%OVER THE PAST FIVE YEARS
3D LIBRARY COVERS MORE THAN
580,000 SQUARE KILOMETRES
Imaging & Engineering
MultiClient
Ramform Titan-class
2D LIBRARY MEASURES
350,000 LINE KILOMETRES
MEGASURVEY 3D COVERAGE OF MORE THAN
690,000 SQUARE KILOMETRES
AFT BEAM MEASURES
70METERS
TOWING CAPACITY OF
16 streamers in exploration mode with 100 meter separation.
24STREAMERS
FUEL CAPACITY OF
6,000CUBIC METERS

PGS ANNUAL REPORT 2013
8THIS IS PGS
PGS’ two foremost competitive advantages are the Ramform fleet and the proprietary GeoStreamer technology platform. The Ramform vessels deliver proven operational capabilities and superior efficiency and deploy state-of-the art technologies.
PGS holds the industry record for vessels that tow and handle the greatest number of streamers. Fleet efficiency will continue to improve in 2014 as the new Ramform Atlas adds its contribution to performance. In 2015, two more Ramform Titan-class vessels are scheduled for delivery, culminating the fleet renewal program.
The Company’s most prominent technology differentiator is the dual-sensor streamer technology — GeoStreamer. Benefits of the GeoStreamer, compared to a conventional survey streamer, are higher resolution, better depth imaging, and superior operational efficiency. GeoStreamer improves the seismic value chain, from acquisition through processing.
PGS’ COMPETITIVE ADVANTAGES
PGS BUSINESS AREAS
MARINE CONTRACT
MARINE MARKET LEADERSHIPMarine Contract acquires seismic data exclusively for oil and gas exploration and production companies.
45% OF 2013 REVENUES
MULTICLIENT
DIVERSE MULTICLIENT LIBRARY MultiClient initiates and man-ages seismic surveys which PGS acquires, processes, markets and sells to multiple customers on a non-exclusive basis.
45% OF 2013 REVENUES
OPERATIONS
PRODUCTIVITY LEADERSHIP Operations supports Marine Contract and MultiClient with vessel resources and manages fleet renewal strategies.
IMAGING & ENGINEERING
TECHNOLOGY DIFFERENCIATIONImaging and Engineering processes seismic data acquired by PGS for its MultiClient library and for external clients on contract and manages research and development activities.
8% OF 2013 REVENUES
2% of revenues relates to Other Marine
PGS ANNUAL REPORT 2013
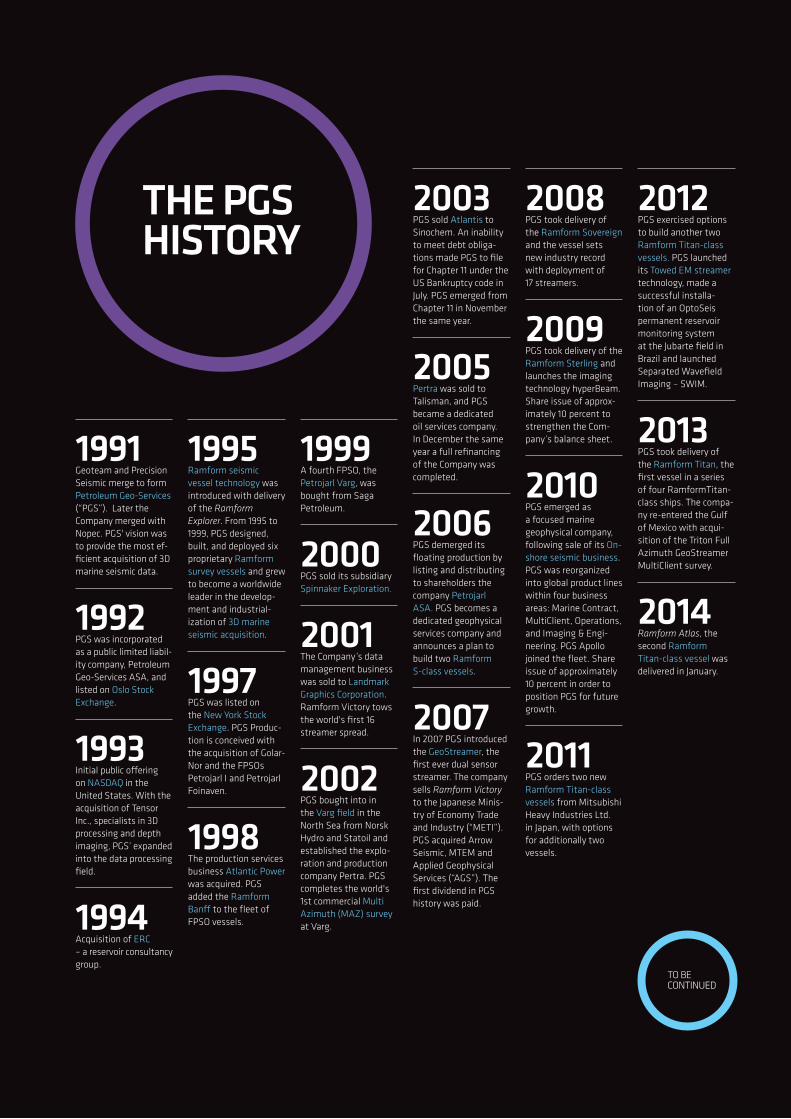
THE PGS HISTORY
1991 Geoteam and Precision Seismic merge to form Petroleum Geo-Services (“PGS”). Later the Company merged with Nopec. PGS' vision was to provide the most ef-ficient acquisition of 3D marine seismic data.
1992PGS was incorporated as a public limited liabil-ity company, Petroleum Geo-Services ASA, and listed on Oslo Stock Exchange.
1993Initial public offering on NASDAQ in the United States. With the acquisition of Tensor Inc., specialists in 3D processing and depth imaging, PGS’ expanded into the data processing field.
1994Acquisition of ERC – a reservoir consultancy group.
1995Ramform seismic vessel technology was introduced with delivery of the Ramform Explorer. From 1995 to 1999, PGS designed, built, and deployed six proprietary Ramform survey vessels and grew to become a worldwide leader in the develop-ment and industrial-ization of 3D marine seismic acquisition.
1997PGS was listed on the New York Stock Exchange . PGS Produc-tion is conceived with the acquisition of Golar- Nor and the FPSOs Petrojarl I and Petrojarl Foinaven.
1998The production services business Atlantic Power was acquired. PGS added the Ramform Banff to the fleet of FPSO vessels.
1999A fourth FPSO, the Petrojarl Varg, was bought from Saga Petroleum.
2000PGS sold its subsidiary Spinnaker Exploration.
2001The Company’s data management business was sold to Landmark Graphics Corporation. Ramform Victory tows the world's first 16 streamer spread.
2002PGS bought into in the Varg field in the North Sea from Norsk Hydro and Statoil and established the explo-ration and production company Pertra. PGS completes the world's 1st commercial Multi Azimuth (MAZ) survey at Varg.
2003PGS sold Atlantis to Sinochem. An inability to meet debt obliga-tions made PGS to file for Chapter 11 under the US Bankruptcy code in July. PGS emerged from Chapter 11 in November the same year.
2005Pertra was sold to Talisman, and PGS became a dedicated oil services company. In December the same year a full refinancing of the Company was completed.
2006PGS demerged its floating production by listing and distributing to shareholders the company Petrojarl ASA. PGS becomes a dedicated geophysical services company and announces a plan to build two Ramform S-class vessels.
2007In 2007 PGS introduced the GeoStreamer, the first ever dual sensor streamer. The company sells Ramform Victory to the Japanese Minis-try of Economy Trade and Industry (“METI”). PGS acquired Arrow Seismic, MTEM and Applied Geophysical Services (“AGS”). The first dividend in PGS history was paid.
2008PGS took delivery of the Ramform Sovereign and the vessel sets new industry record with deployment of 17 streamers.
2009PGS took delivery of the Ramform Sterling and launches the imaging technology hyperBeam. Share issue of approx-imately 10 percent to strengthen the Com-pany’s balance sheet.
2010 PGS emerged as a focused marine geophysical company, following sale of its On-shore seismic business. PGS was reorganized into global product lines within four business areas: Marine Contract, MultiClient, Operations , and Imaging & Engi-neering. PGS Apollo joined the fleet. Share issue of approximately 10 percent in order to position PGS for future growth.
2011PGS orders two new Ramform Titan-class vessels from Mitsubishi Heavy Industries Ltd. in Japan, with options for additionally two vessels.
2012PGS exercised options to build another two Ramform Titan-class vessels. PGS launched its Towed EM streamer technology, made a successful installa-tion of an OptoSeis permanent reservoir monitoring system at the Jubarte field in Brazil and launched Separated Wavefield Imaging – SWIM.
2013PGS took delivery of the Ramform Titan, the first vessel in a series of four RamformTitan -class ships. The compa-ny re-entered the Gulf of Mexico with acqui-sition of the Triton Full Azimuth GeoStreamer MultiClient survey.
2014Ramform Atlas, the second Ramform Titan-class vessel was delivered in January.
TO BE CONTINUED

PGS ANNUAL REPORT 2013
10THISIS PGS
EXECUTIVE MANAGEMENT
Jon Erik ReinhardsenPresident and CEO
Mr Reinhardsen joined PGS in April 2008 as President and Chief Executive Officer. Prior to heading PGS, he was Alcoa’s President, Global Primary Products Growth. At Alcoa, he was responsible for developing and imple-menting major primary metals and refining growth opportunities for the company worldwide. Mr. Reinhardsen joined Alcoa from Norway-based Aker Solutions ASA, an international engi-neering and construction contractor for the oil, gas, chemicals, petro chemicals, mining, and metal processing industries. As Group Executive Vice President for Aker Solutions based in Houston, Texas, he was responsi-ble for all non-European contracting operations and product businesses worldwide.
Earlier in his career, Mr. Reinhard-sen led Aker Maritime ASA’s Global Products business and was engaged in merger and acquisition activities, new business development, marketing and sales, and investor relations. He also led Aker ASA’s seismic venture Aker Geo that was later sold to CGG. In June 2009, Mr. Reinhardsen was elected to the board of directors of Cameron and he has been a member of the board of directors of Hoegh Autoliners Holdings AS and Hoegh LNG Holdings Ltd since 2005. He is also a member of the board of directors of Awilhelmsen AS. Mr. Reinhardsen earned a master’s degree in Applied Mathematics and Geophysics from the University of Bergen, Norway. He completed the International Executive Program of the Institute for Management Develop-ment (IMD) in Lausanne, Switzerland in 1991.
Gottfred LangsethExecutive Vice President and CFO
Mr Langseth joined PGS in November 2003 and was appointed Exe cutive Vice President and Chief Financial Offi-cer as of January 1, 2014. He was Chief Financial Officer of the information technology company Ementor ASA from 2000 to 2003. Mr. Langseth was Senior Vice President of Finance and Control at the offshore engineering and construction company Aker Mari-time ASA from 1997 to 2000. Langseth worked at Arthur Andersen Norway from 1991 to 1997. Mr. Langseth is a member of the board of directors of Mesta AS. Mr. Langseth was certified as a Norwegian state-authorized public accountant in 1993 and holds a Master of Business Administration degree from the Norwegian School of Economics and Business Adminis-tration.
Per Arild ReksnesExecutive Vice President, Marine Contract
Mr Reksnes was promoted to Execu-tive Vice President in April 2010, ini-tially to run PGS’ New Ventures busi-ness area and subsequently Marine Contract. From 2007–2010, he was PGS Marine’s President, EAME (Europe, Africa, Middle East) and CIS. His job titles at PGS have included President for Geoscience and Engineering, Pres-ident for Technology, Vice President for Profiling and Marketing, and Vice President, Technical Marketing. Per Arild Reksnes joined PGS in 2001 from his position as Chief Professional Geo-physics at Norsk Hydro. During his 16 years at Norsk Hydro, he held several geophysics and management posi-tions. Mr. Reksnes holds a Master's degree in Applied Geophysics from the University of Oslo and a Master's degree in Technology Management from MIT/NTH (Norwegian University of Science and Technology).

PGS ANNUAL REPORT 2013
11THISIS PGS
From left to right; Sverre Strandenes, Guillaume Cambois, Gottfred Lang-seth, Jon Erik Reinhard-sen, Magne Reiersgaard and Per Arild Reksnes.
Sverre StrandenesExecutive Vice President, MultiClient
Mr Strandenes was appointed Executive Vice President Multi Client in May 2010. He previously had been PGS’ Group President, Imaging & Engineering since November 2006. Strandenes has held several senior PGS management positions, includ-ing President, Marine Geophysical EAME Region (Europe, Africa, and Middle East). Prior to joining PGS in 1995, Mr. Strandenes was the Geo-sciences department manager at Norsk Hydro Research Center. During his 14 years at Norsk Hydro he held several geophysics and manage-ment positions. Mr. Strandenes is a board member of Azimuth Ltd. Sverre Strandenes was awarded a Master of Science degree (Cand. Real) from the University of Bergen in 1981.
Magne ReiersgaardExecutive Vice President, Operations
Mr Reiersgaard joined PGS at its inception in 1990/91 and has held a number of key executive positions in the PGS Group. He has been Execu-tive Vice President, Operations since April 2010. Magne Reiersgard’s prior management roles at PGS include President, Marine Geophysical NSA Region, based in Houston; President, Marine Geophysical Asia Pacific Region, headquartered in Singa-pore; and Vice President, Marine Acquisition. Prior to joining PGS, he held various management positions in the survey division of Geoteam AS. Currently on the Board of Directors of IAGC (International Association of Geophysical Contractors), he is also a board member of the not-for-profit Society of Exploration Geophysics (SEG) Foundation. Mr. Reiersgard holds an electronics degree from Agder University College, Grimstad, Norway, and a business degree from BI Norwegian School of Management.
Guillaume CamboisExecutive Vice President, Imaging & Engineering
Mr Cambois joined PGS in 2007 as the senior advisor spearheading deployment of PGS’ GeoStreamer technology. He took over as Marine Contract President, Asia-Pacific in March 2009 and in May 2010 advanced to Executive Vice President, Imaging and Engineering. During a 20-year career at the geophysical services company CGG prior to joining PGS, Guillaume Cambois held various executive management posts, such as Exe cutive Vice President, Data Processing and Chief Technology Officer. An active member of the Society of Exploration Geophysicists, he was the Society’s Vice President in 2007/2008 and is currently serving as Director at Large. Mr. Cambois received his Ph.D. in Geophysics from the University of Texas at Austin.

12LOREMIPSUM
PGS ANNUAL REPORT 2013
A CLEARER IMAGE

PGS ANNUAL REPORT 2013
13LOREM IPSUM
15PGS STRATEGY
17 HEALTH, SAFETY, ENVIRONMENT AND QUALITY
20 CORPORATERESPONSIBILITY

PGS ANNUAL REPORT 2013
14A CLEARER IMAGE

PGS ANNUAL REPORT 2013
15A CLEARER IMAGE
The platform is supported by three pillars: a vessel investment strategy, an operational strategy and a financial strategy.
Vessel Investment Strategy • Investing in own capacity only when differentiation can be
achieved • Newbuild program renews and expands PGS’ fleet, reduces
average age of fleet vessels, and increases the average number of streamers towed per vessel by approximately 50 percent
• Add new capacity step by step through the cycle, in line with market and replacement needs
• Maintain critical mass. Market share is not an objective.
Operational Strategy• Taking the industry lead in Health Safety Environment and
Quality (“HSEQ”)• Further increase productivity advantage relative to peers• Implement differentiating GeoStreamer-based technologies
on all vessels and in all imaging centers• Proactive MultiClient/Contract mix to ensure profit
optimization over the cycle• MultiClient pre-funding level of 80-120 percent of capitalized cash
investment• Emergence of GeoStreamer-based Imaging technologies • Technology pipeline with further profit potential.
PGS STRATEGY – THE INDUSTRIAL APPROACH
The Industrial Approach is all about establishing a sound, industrial platform for delivering performance through the cycle and generating returns to shareholders.
NEW BUILD PROGRAM INCREASES NUMBER OF STREAMERS PER VESSEL BY APPROXIMATELY
50%

PGS ANNUAL REPORT 2013
Financial Strategy• Prudent financial structure and conservative gearing policy • Focus on return on capital employed and dividend capacity.
2015 marks the end of the current new build program. From then on the Company’s focus will increasingly be on:
• Improving profitability, free cash flow, return on capital employed and dividend capacity
• Leveraging the GeoStreamer equipped fleet and enhancing productivity differentiation
• Continued MultiClient revenue growth and optimizing invested capital
• GeoStreamer imaging as a new differentiator• Continued rollout of new technologies • HSE, Cost, and Quality leadership.
To care for its stakeholders
Caring for employees' health and safety alongside caring for the environment and society at large is good for business. Leadership in HSEQ contributes to the pledge to care for customers' success.
To deliver productivity leadership
Productivity leadership is delivered through the Company’s fleet of Ramform vessels and the GeoStreamer tech-nology. PGS intends to be recognized as the first port of call for cli-ents seeking tight turn-around times for large projects in a licensing environment that specifies ever-shorter lead times until the first exploratory well is drilled.
To develop superior
data quality
PGS’ GeoStreamer technology drives the ambition to develop superior data quality that enables oil compa-nies to more accurately characterize subsurface features.
To innovate
Innovation is strate-gically important to differentiate. PGS was the first company to launch a dual-sensor streamer, the acclaimed GeoStreamer; the first to deploy vessels capable of towing more than 20 streamers, and the creator of unique reservoir-centric solu-tions and technologies.
To perform over the cycle
PGS is determined to perform over the cycle and mitigate its exposure to industry cyclicality by maintaining a strong balance sheet, taking a proactive approach to capa city and capital allocation between MultiClient and con-tract work, maintain-ing cost and capital discipline and focus on productivity , quality improvement and tech-nology differentiation. Achieving this ambition will improve profitabili-ty, free cash flow return on capital employed and dividend capacity.
PGS' STRATEGIC AMBITIONS
16A CLEARERIMAGE
MARKET SHARE IN NUMBER OF STREAMERS
PGS 21%WesternGeco 23%CGG 34%Polarcus 13%Dolphin 7%Others 2%
As of year-end 2013 (PGS estimate).

PGS ANNUAL REPORT 2013
17A CLEARER IMAGE
PGS has a strong Company-wide HSEQ culture. To further improve HSEQ performance and reinforce HSEQ management systems, PGS set three main goals for 2013 that were largely achieved:
• Maintain a low incidence of recordable injuries, in particular Lost Time Injuries
• Strengthen risk management and reduce overall risk exposure• Improve employee HSE awareness and performance.
HSEQ Performance2013 saw an increase in the number of injuries, compared to 2012; nev-ertheless, the number of recordable injuries still remained lower than in prior years. The PGS organization (core fleet vessels and PGS offices) had the following health and safety incident levels in 2013:
• Zero fatalities, compared with zero in 2012• Two Lost Time Injuries, compared with two in 2012 • Five Restricted Work Day Cases, compared with three in 2012 • Five Medical Treatment Cases, compared with three in 2012• Four High Potential Incidents, compared with one in 2012.
Total Company activity (core fleet vessels and PGS offices) in 2013 comprised 12,745,472 man-hours. Total activity in 2012 amounted to 12,045,876 man-hours.
The overall Lost Time Injury Frequency (“LTIF”) decreased to 0.16 per million man-hours in 2013, compared with 0.17 per million man-hours in 2012. The Total Recordable Case Frequency (“TRCF”) increased to 0.94 per million man-hours, compared with 0.66 per million man-hours in 2012. The number of total recordable incidents increased from eight in 2012 to 12 in 2013.
Despite the increase in injuries in 2013, the Company has recorded
HEALTH, SAFETY, ENVIRONMENT AND QUALITYHealth, Safety, Environment and Quality (“HSEQ”) management and reporting are key parameters for the evaluation of business performance at all PGS management levels and by the Company’s Board of Directors.
0,0
0,2
0,4
0,6
0,8
1,0
LOST TIME INCIDENTS FREQUENCY(LTIF) Per million man-hours
2010 2011 2012 2013
0,0
0,4
0,8
1,2
1,6
2,0
TOTAL RECORDABLE CASE FREQUENCY (TRCF) Per million man-hours
2010 2011 2012 2013

PGS ANNUAL REPORT 2013
18A CLEARERIMAGE
improving HSEQ performance in recent years. These improvements are attributable to systematic work that builds HSEQ competence, enhances risk management, and drives ongoing HSEQ awareness among employees.
Marine OperationsIn 2013, PGS Marine Operations (core fleet) experienced the following health and safety incident rates:• Zero fatalities, compared with zero in 2012 • Two Lost Time Injury, compared with one in 2012• Five Restricted Work Day Cases, compared with three in 2012 • Five Medical Treatment Cases, compared with three in 2012 • Four High Potential Incidents, compared with one in 2012.
PGS Marine Operations (core fleet) comprised 8,535,832 man-hours, compared with 7,820,536 in 2012, Marine Operations’ overall Lost Time Injury Frequency (“LTIF”) increased to 0.23 per million man-hours in 2013 compared with 0.13 in 2012. The Total Recordable Case Frequency (“TRCF”) rose to 1.41 per million man-hours in 2013, com-pared with 0.90 in 2012. The number of total recordable incidents increased to 12 from seven in 2012.
Office ActivitiesIn 2013, PGS offices experienced the following health and safety inci-dent rates:• Zero fatalities, compared with zero in 2012 • Zero Lost Time Injury, compared with one in 2012• Zero Restricted Work Day Cases, compared with zero in 2012
• Zero Medical Treatment Cases, compared with zero in 2012 • Zero High Potential Incidents, compared with zero in 2012.
PGS office operations in 2013 totaled 4,209,640 man-hours, com-pared with 4,225,340 man-hours in 2012 At PGS offices, the overall Lost Time Injury Frequency (“LTIF”) declined to zero per million man-hours in 2013, compared with 0.24 in 2012. The Total Recordable Case Frequency (“TRCF”) declined to zero per million man-hours in 2013, compared with 0.24 in 2012. The number of total recordable incidents decreased to zero from one in 2012.
Strengthening Risk ManagementThe Company’s risk management system was further developed in 2013 to ensure that all hazards associated with activities are iden-tified, risks assessed, and appropriate mitigation measures are determined. PGS implemented measures that strengthen processes and systems for risk and change management, and intensified the Company-wide focus on carrying out formal and informal risk assess-ments offshore and onshore.
Improving Employee HSE Awareness and PerformanceHSEQ engagement continued to be a top PGS priority in 2013 and Company employees have been encouraged to assume greater own-ership and responsibility for HSEQ matters. PGS promotes an orga-nization-wide culture of HSEQ ownership so as to ensure that each department fulfills its responsibility for correct management and implementation of HSEQ practices.
HSEQ Performance The PGS organization (core fleet vessels and PGS offices) 2013 2012Fatalities 0 0Lost Time Injuries 2 2Restricted Work Day Cases 5 3Medical Treatment Cases 5 3High Potential Incidents 4 1
Marine Operations PGS Marine Operations (core fleet) Fatalities 0 0Lost Time Injuries 2 1Restricted Work Day Cases 5 3Medical Treatment Cases 5 3High Potential Incidents 4 1
Office Activities PGS offices Fatalities 0 0Lost Time Injuries 0 1Restricted Work Day Cases 0 0Medical Treatment Cases 0 0High Potential Incidents 0 0
HEALTH AND SAFETY INCIDENT RATES2013

PGS ANNUAL REPORT 2013
19A CLEARER IMAGE

PGS ANNUAL REPORT 2013
20A CLEARER IMAGE
The process adopted to produce the Review was a good learning expe-rience that helped Company employees evolve in their thinking and approach. PGS has continued on its journey since then, increasing the level of commitment and engagement by its workforce.
To further demonstrate the Company’s commitment to continuously improve its corporate responsibility culture, in December 2013 PGS became a signatory of the UN Global Compact — a United Nations initiative that encourages businesses to adopt sustainable policies and to report their progress. By signing up to this international initiative, PGS is committed to align its approach to the ten principles of the UN Global Compact in the spheres of Human Rights, Labor, Environment, and Anti-Corruption.
The Responsibility Report will be distributed in conjunction with PGS’ annual reports hereafter. PGS’ aim with this second responsibility publication is to communicate to all stake holders the progress the Company has made against its responsible business commitments during 2012 and 2013.
“Evolution,” the title of the report, highlights PGS’ growth in the Corporate Responsibility arena while adapting to the needs of a changing world. The responsibility report is organized around four key areas — People, Environment, Conduct, and Stakeholders. It presents PGS’ commitments, activities and performance data relat-ing to the issues that matter most for the Company’s business. The report’s content has been assembled by a wide range of PGS employ-ees from across the business and around the globe.
CORPORATE RESPONSIBILITYIn 2012, PGS responded to stakeholder demand for transparency by publishing its first-ever Responsibility report: Responsibility Review 2011. The Review presented the Company’s efforts and achievements in this area.
PGS BECAME A SIGNATORYof the UN Global Compact in December
2013

The aim of the Responsibility Report is to communicate theprogress PGS has made against its responsiblebusiness commitments during 2012 and 2013.
The Responsibility report is organized around four key areas – People, Environment, Conduct and Stake-holders
Case studies, facts and figures cover PGS commitments, activities and performance on the issues that matter most to the business of the Company.
PGS RESPONSIBILITY REPORT 2014
Download the report at www.pgs.comor order a hard copy at [email protected]

22LOREMIPSUM
PGS ANNUAL REPORT 2013
BUSINESS AREAS

PGS ANNUAL REPORT 2013
23LOREM IPSUM
24 MARINECONTRACT
26 MULTICLIENT
28 OPERATIONS
30 IMAGING &ENGINEERING

PGS ANNUAL REPORT 2013
24BUSINESS AREAS
Value PropositionMarine Contract’s value proposition is to meet customers’ require-ments for efficient and cost-effective delivery of seismic data, offered with the highest available data quality, and delivered through safe and environmentally sound operations.
Seismic Surveys are Growing in SizePGS has a unique advantage in being the only seismic operator to use ships of the Ramform design. The ability to tow large, dense streamer spreads, as well as rapid streamer deployment and retrieval, are critical factors for high productivity. Measured in terms of unit production cost, no other fleet in the industry delivers compa-rable cost-effectiveness. The capability to complete large surveys in short time spans is a significant PGS advantage, particularly in light of the near doubling of average survey size over the last five years.
GeoStreamer in the Driver’s SeatPGS introduced GeoStreamer technology in 2007. Rollout of 2D ves-sels began in 2008, followed by the first 3D vessels in 2009. Today, the dual sensor streamer technology is recognized as the leading streamer technology among a majority of oil companies. The intro-duction of GeoStreamer has encouraged PGS competitors to develop similar systems. With the early development and implementation of GeoStreamer, PGS enjoys a clear advantage in the segment for high-end data quality. GeoStreamer delivers high bandwidth data, generically known as Broadband. Such data yields clearer subsurface images, and furnishes added information vital to analyzing the char-acteristics of specific reservoirs or other geological bodies. Market acceptance and dramatically increased demand for Broadband data
has been the trend headlined in the seismic industry since the launch of GeoStreamer. PGS expects about half of all customers’ seismic requirements to be Broadband in 2014.
Market Polarization Favors PGSLarger survey size combined with an increasing focus on data quality favor PGS’ Ramform fleet. The requirement for GeoStreamer quality data to image deep and complex structures also favors PGS’ technol-ogy offering. Getting the most out of GeoStreamer data demands proprietary data analysis techniques and experience, which in turn draw customers to PGS.
From an efficiency perspective, the PGS fleet will extend its compet-itive advantage over the coming years as the Company continues to take delivery of new Ramform Titan-class vessels with greater capa-bilities than current Ramform vessels.
New Growth OpportunitiesTowed Electro Magnetic (“Towed EM”) technology and OptoSeis are two key ventures for PGS.
The Towed EM solution yields benefits such as high data quality from dense data sampling, high acquisition efficiency, real-time quality con-trol, and onboard processing capability. PGS is the only company that can combine simultaneous EM and 2D seismic acquisition — a solution with the potential to become the ultimate exploration tool.
OptoSeis is a fiber-optic technology which forms the backbone of PGS’ system for permanent reservoir monitoring (“PRM”) of pro-
MARINECONTRACTSeismic Data under Exclusive Client Contracts
Marine Contract acquires seismic data under exclusive contracts with its customers. Marine Contract also generates growth opportunities for PGS through commercialization of new technology and business ideas.
0
200
400
600
800
MARINE CONTRACT REVENUESIn millions of US dollars
2010 2011 2012 2013

PGS ANNUAL REPORT 2013
25BUSINESS AREAS
ducing fields in the marine environment (OptoSeis Marine) and for 3D acquisition on land (OptoSeis Land). PGS has installed an Opto-Seis Marine system for Petrobras on parts of the Jubarte field off-shore Brazil. Delivered as a turnkey system, Jubarte’s OptoSeis is the world’s first PRM system installed at water depths greater than 1,000 meters.
The development of a permanent land-based fiber-optic system for 3D seismic acquisition is sponsored by Shell. The project’s goal is to deliver cost-effective large 3D surveys with ultra-high channel density.
Both Towed EM and OptoSeis have significant growth potential in the next several years.
Since delivery in 2013 the Ramform Titan has operated in the challenging waters of the North Sea and in the South Atlantic. The vessel has performed excellently and surpasses the Company's expectations.
BROADBAND SURVEYS ARE INCREASING AND ACCOUNTED FOR
41%of all surveys in 2013
PGS ANNUAL REPORT 2013
26 BUSINESS AREAS
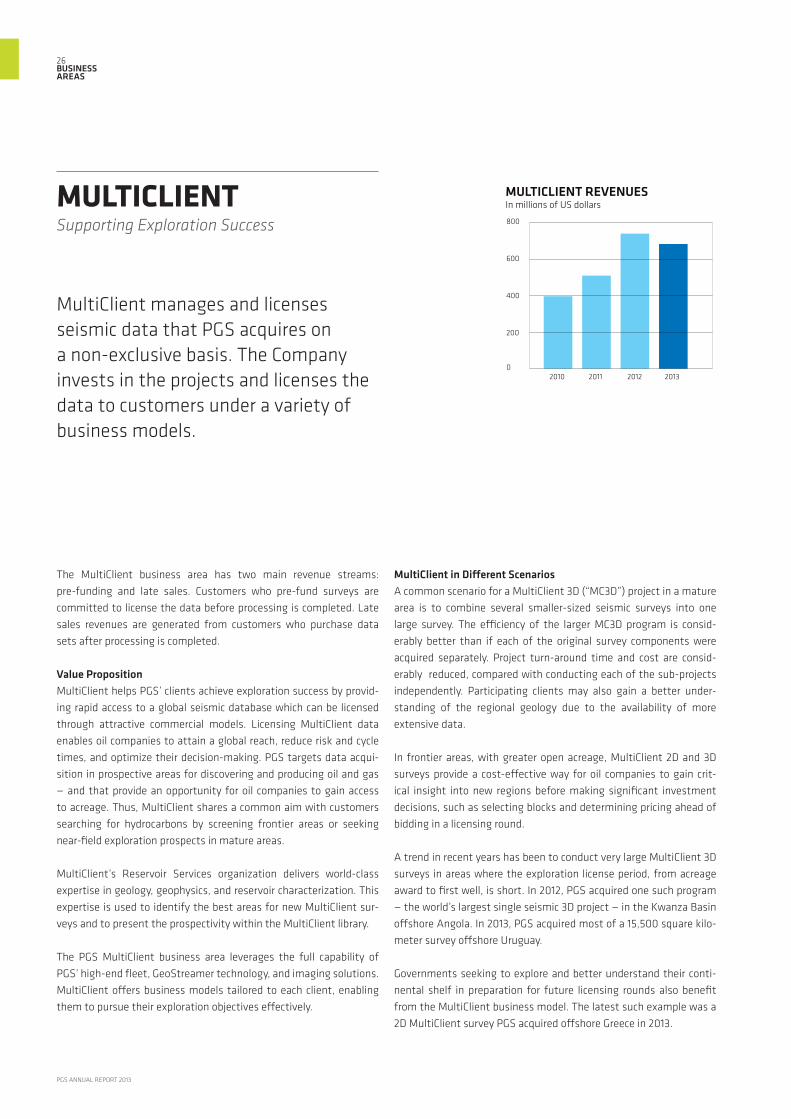
The MultiClient business area has two main revenue streams: pre-funding and late sales. Customers who pre-fund surveys are committed to license the data before processing is completed. Late sales revenues are generated from customers who purchase data sets after processing is completed.
Value PropositionMultiClient helps PGS’ clients achieve exploration success by provid-ing rapid access to a global seismic database which can be licensed through attractive commercial models. Licensing MultiClient data enables oil companies to attain a global reach, reduce risk and cycle times, and optimize their decision-making. PGS targets data acqui-sition in prospective areas for discovering and producing oil and gas — and that provide an opportunity for oil companies to gain access to acreage. Thus, MultiClient shares a common aim with customers searching for hydrocarbons by screening frontier areas or seeking near-field exploration prospects in mature areas.
MultiClient’s Reservoir Services organization delivers world-class expertise in geology, geophysics, and reservoir characterization. This expertise is used to identify the best areas for new MultiClient sur-veys and to present the prospectivity within the MultiClient library.
The PGS MultiClient business area leverages the full capability of PGS’ high-end fleet, GeoStreamer technology, and imaging solutions. MultiClient offers business models tailored to each client, enabling them to pursue their exploration objectives effectively.
MULTICLIENTSupporting Exploration Success
MultiClient manages and licenses seismic data that PGS acquires on a non-exclusive basis. The Company invests in the projects and licenses the data to customers under a variety of business models.
MultiClient in Different ScenariosA common scenario for a MultiClient 3D (“MC3D”) project in a mature area is to combine several smaller-sized seismic surveys into one large survey. The efficiency of the larger MC3D program is consid-erably better than if each of the original survey components were acquired separately. Project turn-around time and cost are consid-erably reduced, compared with conducting each of the sub-projects independently. Participating clients may also gain a better under-standing of the regional geology due to the availability of more extensive data.
In frontier areas, with greater open acreage, MultiClient 2D and 3D surveys provide a cost-effective way for oil companies to gain crit-ical insight into new regions before making significant investment decisions, such as selecting blocks and determining pricing ahead of bidding in a licensing round.
A trend in recent years has been to conduct very large MultiClient 3D surveys in areas where the exploration license period, from acreage award to first well, is short. In 2012, PGS acquired one such program — the world’s largest single seismic 3D project — in the Kwanza Basin offshore Angola. In 2013, PGS acquired most of a 15,500 square kilo-meter survey offshore Uruguay.
Governments seeking to explore and better understand their conti-nental shelf in preparation for future licensing rounds also benefit from the MultiClient business model. The latest such example was a 2D MultiClient survey PGS acquired offshore Greece in 2013.
0
200
400
600
800
MULTICLIENT REVENUESIn millions of US dollars
2010 2011 2012 2013

PGS ANNUAL REPORT 2013
27 BUSINESS AREAS
MultiClient LibraryPGS owns a substantial global library of marine MultiClient seismic data acquired in all of the world’s major oil and gas basins. The Multi-Client data library currently comprises individual surveys totaling more than 580,000 square kilometers of 3D data and 350,000 line kilometers of recent 2D seismic acquired by PGS.
GeoStreamer is the preferred technology for MultiClient acquisition and is used for the majority of PGS’ MultiClient surveys as the Com-pany continuously builds upon and upgrades its library. Clients can extend their exploration options by enabling better geological mod-eling and improving prospect definition and identification using Geo-Streamer data.
MegaSurveys and MegaProjectsMegaSurveys and MegaProjects are well-recognized PGS Multi-Client products and key business enablers. MegaSurveys are merged 3D data sets, while MegaProjects are merged 2D and 3D data sets. These products are constructed by seamlessly combining many Multi Client surveys — both PGS data sets and those of third parties — into large, contiguous, regional volumes.
MegaSurveys and MegaProjects enable oil companies to explore, with unparalleled insight, the geology and hydrocarbon potential of entire basins. Oil companies have embraced these products in their quest to understand the geology and prospectivity of their acreage, placed within a larger regional context. The findings can be applied as much to near-field exploration as to the evaluation of open blocks or farm-in and farm-out opportunities. PGS also uses MegaSurveys and MegaProjects as a pathfinder for developing new MultiClient projects.
These large integrated survey products also bring value to govern-ments by updating and expanding their national databases. PGS has extensive MegaSurvey coverage of the North Sea, Barents Sea, Gulf of Mexico, and Northwest Australia, as well as offshore Brazil and West Africa.
PGS MegaSurveys offer total 3D coverage of more than 690,000 square kilometers. PGS MegaProjects comprise 335,000 line km of 2D data linked to 25,000 square kilometers of 3D data. PGS has also
begun to incorporate GeoStreamer data within MegaSurveys to create the MegaSurveyPlus product, which by year-end 2013 comprised more than 50,000 square kilometers of 3D data worldwide.
Reservoir ExpertiseTo meet the oil industry’s growing demand for enhanced oil recov-ery and improved reservoir understanding, PGS is investing in state-of-the-art reservoir characterization skills and technologies. The Company’s reservoir-focused services help clients to better image reservoirs, quantify reservoirs and fluid properties and, ultimately, improve drilling success.
PGS Reservoir Services provides skills that are integral to position-ing and profiling PGS’ MultiClient projects and vital to PGS’ Imaging businesses. Reservoir Services personnel are experts in sub-surface interpretation and reservoir characterization.
Reservoir teams produce interpretation products and services, including exploration play studies and inversion volumes that com-plement PGS’ MultiClient services and enhance the value of PGS data sets. Through these projects, PGS has gained extensive knowledge about petroleum basins around the globe and enhanced the Com-pany’s ability to accurately assess the variety of sub-surface risks a client faces.
Providing a Range of Business ModelsIn recent years, an increasing number of smaller-sized oil compa-nies are pursuing business models that typically involve access to PGS’ services or MultiClient library in exchange for ownership in their licenses. In order for PGS to benefit from the value creation of these equity positions while avoiding conflicts of interest, the Company has entered into an agreement with Azimuth Ltd, whereby PGS divests its direct ownership in licenses to Azimuth Ltd. PGS holds a minority own-ership position in Azimuth. This arrangement provides a means for PGS to organize its equity business and monetize its stakes in licenses while remaining at arm’s length from its major clients. At present, Azi-muth Ltd. has three operating subsidiaries: AziNor, which concentrates on northwestern Europe; AziNam, focusing on Namibia; and AzEire, focusing on Ireland.

PGS ANNUAL REPORT 2013
28 BUSINESS AREAS
The implementation, management, and performance improvement of the Company’s Health, Safety, Environment, and Quality (“HSEQ”) sys-tems are also major responsibilities of the Operations business area.
Value PropositionHSEQ excellence is a core value for PGS. The Company aims to be best-in-class, with zero injury to people and minimal harm to the environment. HSEQ leadership requires continuous improvement through identifying, assessing, mitigating, and managing risks affecting employees, clients, contractors, and the environment.
The improved HSEQ performance in recent years is attributable to systematic work that builds HSEQ competence, enhances risk man-agement, and drives ongoing HSEQ awareness among employees. In 2013 PGS further developed its risk management system to ensure all hazards associated with offshore activities are identified, risks assessed and appropriate mitigation measures are defined. Engag-ing in HSEQ is a top priority and PGS continues to encourage person-nel to take increasingly more ownership and responsibility for HSEQ matters.
Seismic performance is improved through operational enhance-ments, investments, resource planning, and fleet renewal. Efficient operation of sophisticated systems enhances customer satisfaction as well as PGS’ profitability.
The Ramform AdvantagePGS is recognized throughout the industry for its unique Ramform vessels. The seismic vessels have a delta-shaped hull distinguished
OPERATIONSBuilding Sustainable Competitive Advantages
Operations supports both Marine Contract and MultiClient with reliable and efficient seismic production services as well as resource planning and fleet renewal strategies.
by an extremely wide aft beam, which for the new Ramform Titan-class vessels measures 70 meters wide. The broad aft workspace allows for safe and efficient deployment and retrieval of streamers and seismic sources. The acknowledged efficiency and productivity benefits of PGS Ramform vessels, the proprietary PGS seismic tech-nologies, along with the quality of PGS’ personnel, make the PGS fleet industry leading.
Continuous Focus on Reducing Technical Downtime — Best-in-Class PerformanceTechnical downtime as a percentage of total fleet time for the PGS fleet has decreased steadily over the last 20 years. Similarly, perfor-mance over the same period has improved. Performance is a measure of how well PGS utilizes the time available to acquire seismic data. Ongoing improvement of these indicators enables PGS to remain best-in-class. Productivity leadership, a core Company ambition, will continue by combining the newest and most efficient vessels in the industry with PGS’ GeoStreamer technology.
Ramform Titan-class VesselsIn late 2010, PGS launched a fleet renewal and expansion program — and two Ramform Titan-class vessels were ordered from Mitsubishi Heavy Industries in Japan in April 2011. The following year, the Com-pany exercised its option to build two additional Ramform Titan-class vessels for delivery in 2015. The first newbuild, the Ramform Titan, was delivered in late April 2013 and the vessel is performing beyond expectations. The second in the series, the Ramform Atlas, was delivered in January 2014 and commenced her first survey in the North Sea.
IN 2013 PGS TOOK DELIVERY OF
1 of 4new Ramform
Titan-class vessels

PGS ANNUAL REPORT 2013
29 BUSINESS AREAS
Safety, efficiency, performance, and crew comfort are the main ratio-nale for PGS’ continued investments in the Ramform design and construction of Ramform Titan-class vessels. Larger surveys and increased focus on data quality require more seismic streamers in the water. Wider back-deck working space and automated handling of equipment make the operation of a large streamer spread significantly safer and more efficient, compared to smaller-dimensioned vessels.
Exploiting the GeoStreamer BenefitsIn addition to delivering superior seismic data quality, GeoStreamer significantly widens the weather window in which data acquisi-tion can be performed. This is possible because GeoStreamer can be towed deeper than conventional streamers, since the receiver ghosts, which degrade data, have been eliminated. Improved oper-ational efficiency is a clear PGS advantage and a significant contri-butor to increased margins, with customers benefitting from shorter cycle times. With an aft beam of the Ramform Titan-class vessels of 70 meters, 30 meters wider than the Ramform S- and V-class ves-sels, the back deck of a Ramform Titan-class vessel is stable enough to operate in harsh environments and exploit the full potential of the improved weather window created by the GeoStreamer technology .
The Ramform Titan-class vessels are bolstering PGS’ position in the fast growing high-end survey market segment, where a premium
seismic data product is required in order for customers to gain a solid understanding of the geology and resource potential of deep targets with complex structures.
GeoStreamer RolloutGeoStreamer is a proprietary, dual sensor streamer technology unique to PGS. Demand for GeoStreamer acquisition has surpassed all projections. GeoStreamer technology was launched in 2007 and quickly gained widespread acceptance among oil companies. PGS rolled out the new streamer technology on 2D vessels in 2008 to prove its benefits to customers. In 2009, PGS extended the rollout to 3D operations, and the Atlantic Explorer was the first 3D vessel to have the new streamer technology installed. In late 2009, Ramform Challenger was equipped with GeoStreamer to become the Com-pany’s first high-capacity Ramform vessel to deploy the advanced streamer technology. Survey and vessel performance have been excellent since the conversion to GeoStreamer. Since then, PGS has equipped all its vessels with GeoStreamers, except the Ramform Sterling, which is scheduled for GeoStreamer upgrade in 2016. The new Ramform Titan-class vessels will all be equipped with the Geo-Streamer technology.
The Ramform Titan-class vessels have an aft stern of 70 meters. The vessels can tow 16 streamers with 100 meter separation and has 24 streamer reels onboard. The Ramform Titan-class vessels serves the ultra high-end segment of the seismic market.

PGS ANNUAL REPORT 2013
30 BUSINESS AREAS
Value PropositionPGS provides marine geophysical solutions that enable faster hydrocarbon discovery and recovery with less risk. This applies to data acquired both for external and internal customers (PGS MultiClient). The Imaging department of the Imaging and Engi-neering business area focuses on delivering geophysical solutions featuring significantly improved imaging and characterization. The Engineering department develops technologies and services that enhance PGS’ leadership position in operational efficiency and differentiate the Company’s strong service capabilities for identifi-cation and characterization of complex reservoirs.
GeoStreamer Advantage PGS reduces risk for clients in their quest for hydrocarbons in off-shore areas. A key success factor is the dual-sensor GeoStreamer technology. In contrast to all previous towed streamer technologies, GeoStreamer explicitly measures the vertical component of par-ticle velocity for the seismic wavefield. This robust measurement leads to an explicit wavefield separation platform, which provides many opportunities for improved resolution and characterization of reservoir rocks and fluids. An entirely new arena of seismic imaging solutions has been enabled by GeoStreamer, namely, the ability to construct subsurface seismic images using multiples.
The elimination of dynamic sea-state effects upon the seismic images removes many noise modes confronting high-accuracy reser-voir monitoring during reservoir depletion, and improves operational windows during rougher weather.
IMAGING & ENGINEERINGScience and Technology in PGS
The Imaging department provides a full range of advanced imaging and reservoir-related processing services to a global exploration and production customer base and to PGS MultiClient business. The Engineering department constitutes PGS R&D center.
Imaging DepartmentGrowth at PGS’ Imaging department is mainly attributable to pro-prietary GeoStreamer processing and best-in-class imaging tools. Imaging is noted for several state-of-the-art products that PGS and clients consider competitive advantages. These technologies include the Separated Wavefield Imaging (“SWIM”) technology, which exploits surface multiples as well as primary wavefields. An industry-leading portfolio of anisotropic velocity model building tools delivers the best images tailored to any geological scenario and challenge. High-end imaging technology has spurred stron-ger external revenues for the Imaging department, generated higher-quality products, and shortened cycle times. PGS’ robust visu-alization tools have enhanced customers’ target interpretation, char-acterization, and decision-making processes.
Dual-sensor GeoStreamer technology has proved its ability to reveal reservoir details and properties of unrivalled resolution. Each Geo-Streamer survey acquired and processed by PGS has delivered improved frequency bandwidth and data quality. So-called "broad-band" solutions are becoming commonplace among competitors, yet these efforts primarily depend upon creative processing-based enhancements to conventional streamer data acquired with either flat or variable-depth streamer profiles. In short, the unique vector-based dual-sensor engineering of GeoStreamer consis-tently outperforms conventional streamer data processing results. Moreover, the GeoStreamer platform delivers a range of previously unrealized opportunities for better reservoir interpretation and characterization.
0
30
60
90
120
150
IMAGING REVENUESIn millions of US dollars
200
DATA PROCESSING REVENUESIn millions of US dollars
2010 2011 2012 2013

PGS ANNUAL REPORT 2013
31 BUSINESS AREAS
Engineering DepartmentThe Engineering department comprises the Company’s research and development (“R&D”) activities. Projects span a diverse range of development and support functions for marine seismic acqui-sition. Techniques and imaging technologies include PGS’ Towed Electromagnetic (“Towed EM”) technology and several innovative technologies not yet commercialized. PGS has major R&D offices in the United States, the UK, and Norway, with additional groups in the Netherlands, Sweden, Australia, and Singapore. PGS spends approxi-mately USD 60 million annually on research and development.
New technologies that provide the right solutions to address the geophysical challenges facing a diverse customer base, are a priority for PGS’ Engineering department. A cornerstone of PGS’ technology leadership is implementation of efficiency and productivity enhance-ments, including greater automation of activities where appropriate and practical. The Company focuses on reducing the exposure of peo-ple and the environment to potential hazards in all areas of activity.
Human ResourcesThe outstanding competence of PGS employees and management is critical to achieve leadership in the technology markets. PGS recruits
and develops high performing leaders wherever the Company has a strategic presence. They are encouraged to reinforce PGS’ reputation and customer relationships through their achievements and conduct. PGS’ research and development teams proactively seek to improve their skills and product lifecycle management.
PGS invests in developing emerging technology through Technology Collaboration Agreements, joint ventures, government funding, and academic partnerships.
Intellectual PropertyPGS’ patents, trademarks, service marks, copyrights, and licenses protect its proprietary technology. The Company’s intellectual prop-erty includes the Ramform™ seismic vessels as well as the acclaimed GeoStreamer®, GeoSource®, OptoSeis®, HD3D® and hyperBeam® technology suites. These intellectual property rights collectively rep-resent a material business asset. As of December 31, 2013, PGS held 395 patents granted under the laws of the U.S., the UK, and Nor-way — an increase of 44 new patents in these jurisdictions in 2013. Additional patent-protected innovations help sharpen and preserve the competitive advantages achieved by PGS through technological differentiators.
This 3D GeoStreamer image of a layer some 2 seconds (TWT) below the mudline (seabed) shows the excellent structural resolution achieved. A complex network of faults and fractures is crisply imaged in extraordinary detail.

32LOREMIPSUM
PGS ANNUAL REPORT 2013
PGS PERFORMANCE

PGS ANNUAL REPORT 2013
33LOREM IPSUM
34 THE PGSSHARE
38 CORPORATE GOVERNANCE
44 PRESENTATION OF BOARD OF DIRECTORS
46 BOARD OF DIRECTORS’ REPORT
55RESPONSIBILITY STATEMENT

PGS ANNUAL REPORT 2013
34PGSPERFORMANCE
Share FactsPGS has 217,799,997 shares outstanding, including American Deposi-tory Shares (“ADS”), all of which are of the same class, and carry equal voting and dividend rights. Each share has a par value of NOK 3.
The ticker code for PGS at the Oslo Stock Exchange is “PGS” and the shares are denominated in Norwegian kroner (NOK). The Company’s ADS traded over the counter in the US have the ticker code “PGSVY” and are denominated in US dollars (USD). Each ADS represents one share. An American Depository Receipt, with the acronym ADR, is the actual physical certificate confirming ADS ownership. The term ADR is often used for both the certificates and the securities themselves.
Share Price DevelopmentFrom roughly mid-year 2011 to the second half of 2012 prices for seis-mic services increased significantly. Going into 2013, expectations of further price escalations were high. In the spring of 2013, oil compa-nies typically became more attentive to capital discipline and cash returns, a focus that became increasingly evident throughout the year. A more muted spending pattern among customers resulted in a more challenging market environment for seismic companies than initially projected. This situation was reflected in a negative share price development for a majority of seismic companies. PGS’ share price declined 24 percent in 2013, including dividend paid. Other European seismic companies were also down significantly; only the shares of TGS Nopec and Spectrum outperformed PGS in 2013. How-ever, the US oil services sector performed very well in 2013. Schlum-berger, with its seismic subsidiary WesternGeco, outperformed all
THE PGS SHAREThe PGS share has its primary listing on the Oslo Stock Exchange in Norway. In the United States, PGS’ ADS are traded over the counter.
NUMBERS OF SHARES ISSUED
217,799,997
PGS RANKING OF MOST TRADED STOCK ON OSLO STOCK EXCHANGE
8TH

PGS ANNUAL REPORT 2013
35PGSPERFORMANCE
European seismic companies; its share price increased approximately 30 percent in 2013. European seismic companies also lagged key indices, such as the Oslo Stock Exchange’s Benchmark Index and the Oslo Stock Exchange 10 Energy Index.
On average, approximately 1.5 million PGS shares traded daily on the Oslo Stock Exchange in 2013. In terms of turnover value, PGS was the eighth-most traded stock. Excluding companies in which the Nor-wegian government is the largest shareholder, PGS ranked number three, behind Seadrill and Subsea 7. Measured by market capitaliza-tion, PGS was number 20 among all companies listed on the Oslo Stock Exchange. The liquidity of PGS’ ADS is significantly lower; the average daily ADS trading volume was approximately 16,900 shares in 2013.
ShareholdersPGS had 5,586 shareholders on record as of December 31, 2013, according to the Norwegian Central Securities Depository (“VPS”).
By year-end 2013, non-Norwegian investors owned approximately 63 percent of the outstanding PGS shares. In 2013, non-Norwegian own-ership decreased by approximately five percentage points, compared to the shareholder structure as of year-end 2012. The decline was mainly driven by US-based investors decreasing their proportionate holdings from approximately 26 percent to nearly 21 percent. Hold-ings among UK-based investors remained fairly flat at 13 percent; holdings of other non-Norwegian shareholders, mainly domiciled in Europe, also remained largely at year-earlier levels.
PGS has a diversified shareholder base in which the most commonly practiced investment strategies are present. Investors focusing on growth and Growth At a Reasonable Price (“GARP”) account for approx-imately 45 percent of shareholders. Value investors make up approxi-mately 30 percent, while the more risk-seeking hedge funds constitute about 5 percent. Index investors amount to 10 percent and the remain-ing 10 percent are shareholders with “Other” mandates, such as mixed style, venture capital funds, and private equity investors.
As of December 31, 2013, Folketrygdfondet (The Norwegian State Pension Fund) was the largest PGS shareholder, owning 21.8 million shares or 10.02 percent of outstanding shares.
Distribution of Information and IR Activities All Company information considered material to the capital markets is published via the Oslo Stock Exchange’s news service: www.news-web.no, and posted on the Company’s website: www.pgs.com. PGS holds public presentations and arranges conference calls and web-casts in connection with quarterly earnings releases. The Company hosts an annual Capital Markets Day presentation for the invest-ment community, and management regularly meets with investors and participates at investor conferences.
Treasury SharesPGS is authorized to purchase up to 10 percent of its own share cap-ital. The authorization was made by the Company’s 2013 Annual General Meeting and remains valid for one year following its date of registration with the Norwegian Register of Business Enterprises. As of December 31, 2013, the Company held 2,658,671 own shares, equal to 1.22 percent of total shares outstanding.
Analyst CoverageAs of December 31, 2013, there were 26 sell-side analysts covering PGS on a regular basis, with market updates and estimates of PGS' financial results. Of these, nine are based in the UK, two in France, two in the US, and the rest in Norway. An updated list of analyst cov-erage is published on the Company’s website: www.pgs.com.
DividendPGS implemented its new dividend policy in 2011, with a dividend of NOK 1.10 per share paid in 2012 based on financial performance in 2011. In 2013, the dividend increased by 50 percent and amounted to NOK 1.65 per share. PGS’ dividend policy is to distribute between 25 to 50 percent of net income over the business cycle, and is a testament to the Company’s industrial approach to the business and its commit-ment to deliver cash returns to shareholders. The Board of Directors expects to propose to the 2014 Annual General Meeting a dividend of approximately NOK 2.30 per share for the 2013 financial year.
2014 Annual General MeetingPGS’ 2014 Annual General Meeting is scheduled for May 8, 2014 at 15:00 CET at the Company's headquarters at Lilleakerveien 4C, 0216 Oslo, Norway.
Each PGS share is entitled to one vote. Please note that Norwegian regulations stipulate that shares must be registered in the name of a specific owner in order for that person (or duly authorized agent) to be allowed to vote.
Shareholders who wish to attend the Annual General Meeting are requested to pre-register via the Company’s registrar. Registration and proxy forms will be mailed to shareholders’ registered addresses along with meeting documents. The registrar’s contact information follows:
DNB Bank ASARegistrar ServicesPO Box 1600 SentrumNO-0021 Oslo, NorwayPhone:+4723268021Email: [email protected]
Owners of American Depository Shares can vote by surrendering their shares to the ADS depositary bank, Deutsche Bank, so that title

PGS ANNUAL REPORT 2013
36PGSPERFORMANCE
to the shares in question is appropriately recorded in the share regis-ter maintained by Norway’s VPS prior to the meeting date.
Contact Information for ADS ShareholdersThe depositary bank for PGS’ ADS shares is Deutsche Bank; the con-tact information is as follows:
Deutsche Bank Shareholder ServicesAmerican Stock Transfer & Trust Company6201 15th Avenue Brooklyn, NY 11219, USAE-mail: [email protected] number: +1 800 937 5449Direct Dial: +1 718 921 8124
Corporate Debt RatingPGS is rated ‘BB’ by Standard and Poor’s and ‘Ba2’ by Moody’s Inves-tor Service. In 2011, the Company issued USD 300 million of Senior Notes with seven years maturity, and in 2012 an add-on of USD 150 million aggregate principal amount was placed at 107.5 percent of par. Both Standard and Poor’s and Moody’s Investor Service awarded the facility the same rating they had applied at the corporate level. PGS’ secured debt, which includes the Term Loan B and the Revol ving Credit Facility, is only rated by Moody’s Investor Service; Moody’s awarded these obligations the same rating as applied at the corpo-rate level.
CITIZENSHIP OF SHAREHOLDERS
Norway 37%USA 21%
UK 13%Other 29%
Source: Norwegian Central Securities Depository (VPS) as of December 31, 2013
COMPOSITION OF INVESTOR STRATEGIES
Growth and GARP 45%Value 30%Index 10%Others 10%Hedge funds 5%
Source: ThomsonReuters as of December 31, 2013

PGS ANNUAL REPORT 2013
37PGSPERFORMANCE
Rank Shareholder Shares held Ownership in % 1 FOLKETRYGDFONDET / THE NORWEGIAN STATE PENSION FUND 21 822 711 10.022 EUROCLEAR BANK 9 897 049 4.543 CLEARSTREAM BANKING 7 255 245 3.334 STATE STREET BANK 6 788 618 3.125 DEUTSCHE BANK TRUST DEPOSITORY RECEIPTS 1) 5 038 678 2.316 VARMA MUTUAL PENSION COMPANY 4 789 879 2.207 JPMORGAN CHASE BANK 4 504 814 2.078 JPMORGAN CHASE BANK 4 369 665 2.019 TAPIOLA 4 300 000 1.9710 STATE STREET BANK 3 906 224 1.7911 STATE STREET BANK 3 498 132 1.6112 VERDIPAPIRFONDET DNB 3 427 199 1.5713 VERDIPAPIRFONDET DNB 3 194 859 1.4714 JPMORGAN CHASE 3 127 589 1.4415 STATE STREET BANK 3 026 661 1.3916 GOLDMAN SACHS 2 932 646 1.3517 PETROLEUM GEO-SERVICES ASA 2 658 671 1.2218 HSBC BANK 2 360 514 1.0819 CITIBANK 2 091 641 0.9620 VANGUARD INTL. BROWN BROTHERS HARRIMAN 2 069 250 0.95
Total: 20 largest shareholders 101 060 045 46.40
1) The beneficial owners of American Depository Shares held by depositaries are not disclosed in the above table due to depository agreement terms.
20 LARGEST PGS SHAREHOLDERSAs of December 31, 2013
40
60
80
100
120
140
160
180
200
28.12.12 28.01.13
PGS
28.02.13 31.03.13 30.04.13 31.05.31 30.06.13 31.07.13 31.08.13 30.09.13 31.10.13 30.11.13 31.12.13
Schlumberger TGS CGG Polarcus Dolphin Spectrum
PGS SHARE PRICE PERFORMANCE DURING 2013 RELATIVE TO PEERS

PGS ANNUAL REPORT 2013
38PGSPERFORMANCE
Petroleum Geo-Services ASA is registered in Norway as a public lim-ited liability company, and our corporate governance model is based on Norwegian corporate law and the Norwegian Code of Practice for Corporate Governance (the NUES Recommendations). To the extent practicable, PGS adheres to requirements applicable to registrants of foreign securities in the United States, where our American Deposi-tary Shares (ADS) are publicly traded. We have also implemented corporate governance guidelines particularly suited to our Company and the industry in which we operate.
The Norwegian Public Limited Liability Companies Act section 5-6 (4) requires that the Ordinary General Meeting approves the statement of Corporate Governance. Consequently, this report will be presented to the General Meeting on May 8, 2014.
Our corporate governance principles, which have been adopted by our Board of Directors, are summarized below. Our website provides full versions of our basic corporate governance documents. These items include the Company’s Articles of association, corporate governance policy, the Board of Directors’ Rules of Procedure, and the charters for the Company’s Audit Committee, Remuneration and Corporate Governance Committee, and Nomination Committee. The docu-ments can be downloaded from our website: www.pgs.com.
In accordance with the Norwegian Accounting Act section 3-3b, PGS is required to give a statement of our corporate governance in the Board of Directors report. In the Board of Directors report we refer to this document.
1. Code of Conduct, Core Values and Corporate ResponsibilityWe have adopted a Code of Conduct that reflects our commitment to our shareholders, customers, and employees to carry out our busi-ness with the utmost integrity. Our Code of Conduct and Core Values are available in full on our website: www.pgs.com.
At the heart of our Core Values is also a serious approach to Cor-porate Responsibility. We have built our framework for Corporate
Responsibility around four key areas: People, Environment, Con-duct, and Stakeholders. For a further description, see our Corporate Responsibility Report, which is available at www.pgs.com.
2. Business PGS is a focused geophysical company providing a broad range of seismic and reservoir services, including acquisition, processing, interpretation, and field evaluation. The company also possesses the world’s most extensive multi-client data library. PGS operates on a worldwide basis with headquarters in Oslo, Norway.
Our business purpose, as presented in the Company’s Articles of Association, is as follows:
“The business of the Company is to provide services to and partici-pate and invest in energy related businesses.”
Our business operations and the goals and strategies for our business areas are presented in greater detail on pages 15–16 and 24–31 of this annual report.
3. Equity and DividendsShareholders’ equity as of December 31, 2013 was $2,065.6 million, corresponding to 58% of total assets. The Board of Directors believes that the Company’s net interest-bearing debt should be at moderate levels and not exceed two times annual EBITDA in the weak part of a business cycle and not exceed one times annual EBITDA at the peak of the cycle. The current net interest-bearing debt of $666.7 million is well within this range, and the Company’s funding and equity posi-tions are considered satisfactory by the Board of Directors. The Board continually monitors the adequacy of the Company’s equity in light of its objectives, strategy, and risk profile.
The Board of Directors has adopted a dividend policy whereby it is the intention to distribute 25 to 50 percent of net income as dividends.
The Board of Directors is authorized to buy back up to 10 percent of the
CORPORATE GOVERNANCEPetroleum Geo-Services is committed to maintaining high standards of corporate governance. We believe that effective corporate governance is essential to our Company’s success and establishes the framework by which we conduct ourselves in delivering services to our customers and creating value for our shareholders.

PGS ANNUAL REPORT 2013
39PGSPERFORMANCE
Company’s share capital. The current authorization expires on June 30, 2014. However, the authorization will – as always – be replaced by a new authorization at the next Annual General Meeting (“AGM”).
It has been an ongoing practice of PGS shareholders to grant limited authorizations to the Board of Directors permitting it to increase the Company’s share capital and/or acquire the Company’s shares (trea-sury shares) for certain defined purposes. Separate General Meet-ing votes are held for (a) authorizations related to employee stock option programs and (b) authorizations for other purposes. When a proposed authorization encompasses share capital increases and/or acquisition of treasury shares for various purposes, the Company does not find it practical to hold separate votes on each proposed purpose. Authorizations are time-limited, see the paragraph above.
4. Equal Treatment of Shareholders and Transactions with Close AssociatesPGS has a single share class and all shares carry the same rights. At our General Meetings, each share carries one vote. Our Board of Direc-tors is committed to equal treatment of shareholders in all respects.
When applicable, transactions involving the Company’s own shares should be carried out through a stock exchange, or at prevailing stock-exchange prices if carried out in an alternative manner.
Transactions between the Company and shareholders, a sharehold-er’s parent company, members of the Board of Directors, executive officers, or close associates of any such party (referred to as “Close Associates”) shall be conducted at arm’s length and at market terms. Material transactions with Close Associates will be subject to inde-pendent valuation by third parties. According to PGS’ Code of Con-duct, our employees shall not have any personal or financial interest that might conflict with those of PGS nor influence, or appear to influence judgments or actions in carrying out their responsibilities on behalf of the Company. According to our Rules of Procedure, a member of our Board of Directors may not participate in discus-sions or decision-making as to issues in which the director or any person closely associated with the director has a material personal or financial interest. The Code of Conduct and Rules of Procedure are available on our website: www.pgs.com.
5. Freely Transferable SharesThe Company’s shares are freely transferable.
6. General MeetingsThrough participation in General Meetings, our shareholders exercise ultimate authority over the Company and elect the members of its Board of Directors and the chairperson of the Board of Directors.
Pursuant to PGS’ Articles of Association, the notice of an AGM is dis-tributed at least four weeks in advance of the meeting to sharehold-
ers or their depository banks. For ADS holders, the record date for notice-distribution purposes is set at approximately five weeks prior to the AGM. A copy of the call notice with appendices will be posted on our website: www.pgs.com.
Notices convening Extraordinary General Meetings (“EGM”) must be distributed at least two weeks ahead of the meeting. The Board of Directors is to call shareholders to an EGM upon a written demand by the Company’s independent auditor or shareholders representing at least five percent of the share capital, or for other purposes.
Shareholders who wish to attend a General Meeting must notify the Company’s registrar or PGS by the deadline stated in the meeting notice, which must be at least two working days before the General Meeting.
According to the Company’s Articles of Association, documents to be considered at the General Meeting may be published on our website. The same applies to documents that, due to statutory requirements must be attached to, or included in the notice calling the General Meeting. If the documents are published in such a manner, the stat-utory requirements for distribution shall not apply. Nevertheless, shareholders are entitled to request that documents to be consid-ered by the General Meeting be sent to them via regular mail.
To vote at General Meetings, in person or by proxy, a shareholder must be registered with the Norwegian Central Securities Depos-itory (VPS). Holders of American Depositary Shares (“ADS”) may vote according to the underlying shares by: (a) having the underlying shares transferred to an account with the Norwegian Central Securi-ties Depository in the name of the holder, (b) attending the meeting as a shareholder by providing their name and address and a confir-mation from Deutsche Bank, depositary for the ADS, to the effect that they are the beneficial owner of the underlying shares, or (c) authorizing Deutsche Bank to vote the ADS on their behalf in accor-dance with specific guidelines.
An owner with shares registered through a custodian has voting rights equivalent to the number of shares covered by the custodial arrangement, provided that the owner of the shares, within two working days ahead of the General Meeting, provides PGS with his or her name and address together with written confirmation from the custodian to the effect that he or she is the beneficial owner of the shares held in custody.
Written and/or electronic voting in accordance with the Norwegian Public Limited Liability Companies Act, section 5-8b, shall be allowed for meetings where such method of voting is arranged by the Board of Directors.
All directors generally attend the AGM together with the chairman

PGS ANNUAL REPORT 2013
40PGSPERFORMANCE
of the nomination committee and the auditor. In accordance with our Articles of Association, the chairperson of the Board of Direc-tors chairs General Meetings. This is a deviation from the NUES Recommendation (identified below) No. 6 for making arrangements to ensure an independent chairman for the General Meetings. The reason for this deviation is that the Company has found this more practical and that PGS wishes to ensure that General Meetings are chaired by a competent person having proper insight into PGS’ over-all operations.
7. Nomination CommitteeAccording to our Articles of Association, the Company has a Nomi-nation Committee comprised of three members to be elected by our shareholders at the AGM. Nominations should take into account the interests of shareholders in general. The members and the chairper-son of the Nomination Committee are elected at the General Meet-ing. The majority of Nomination Committee members shall qualify as independent parties, pursuant to the Norwegian Code of Practice for Corporate Governance. The term of service shall be two years unless the General Meeting determines that the period shall be shorter.
The Nomination Committee’s main responsibilities, which are set out in its charter, are to propose nominees for election as members and chairperson of the Board of Directors and the Nomination Committee. Further, the Committee proposes remuneration to be paid to mem-bers of the Board of Directors and Nomination Committee. Remuner-ation is approved by the General Meeting. Annually, the Nomination Committee produces a written report containing its nominations and proposals, which is distributed in advance of each AGM.
Once a year, the Nomination Committee meets with each director individually and discusses how the Board and its committees func-tion and whether there is a need for changes to the Board.
Current Nomination CommitteeThe current Nomination Committee comprises Roger O’Neil (chair-person), C. Maury Devine, and Hanne Harlem. All three were re-elected at the AGM held May 14, 2013 for a service period ending with the 2014 AGM.
Shareholders who wish to propose new Board members may do so by submitting a candidate’s name to PGS’ investor relations staff via the Company’s website: www.pgs.com by following the link, “Nominate a Board Member.” The deadline for submissions each year is the end of February. Alternatively, candidates can be proposed by letter to PGS or via email to: [email protected]. PGS does not employ any Nomination Committee members and none is a member of the Board of Directors.
In 2013, the Nomination Committee held four meetings. The Nomi-nation Committee’s report on its work and recommendations will be distributed with the notice of the 2014 Annual General Meeting.
8. Board of Directors — Composition and IndependenceAccording to PGS’ Articles of Association, our Board of Directors shall have from three to thirteen directors. The period of service for mem-bers of the Board of Directors shall be one year.
The Board has adopted its own Rules of Procedure that establish in more detail its roles and responsibilities, including:• Directors’ qualifications• Requirement that a majority of the Board, a majority of the mem-
bers of the Remuneration and Corporate Governance Committee, and all members of the Audit Committee are considered to be independent directors
• Annual review and determination of the independence of each director.
The composition of the Board of Directors is a reflection of the Com-pany’s commitment to protect the common interests of all share-holders and the Company’s need for expertise, capacity, and diversity.
All directors are independent of the Company’s management. All directors are also per December 31, 2013, independent of our major business relations and major shareholders. The Board of Directors has considered whether Walter Qvam, who was appointed to the Board of Directors in November 2013, can be considered indepen-dent as he is the Chief Executive Officer of Kongsberg Gruppen ASA. Kongsberg Gruppen ASA, through its subsidiaries, is a provider of various services and equipment to PGS. However, this activity is not significant for either of the two companies involved, and PGS’ Board has concluded that Mr. Qvam is to be regarded as independent of the Company. No member of our Board of Directors may be an executive of PGS. Directors are not permitted to perform paid consultancy work for PGS. Five board members, directly or indirectly, own PGS shares.
Shareholders and other interested parties may communicate directly with our independent directors by written correspondence addressed to Petroleum Geo-Services, Board of Directors (Independent Mem-bers), Secretary of the Board of Directors or to the Company’s Gen-eral Counsel Rune Olav Pedersen, PO Box 251, NO-0216 Oslo, Norway. Further, our website: www.pgs.com invites shareholders wishing to discuss corporate governance or corporate responsibility matters to contact Mr. Pedersen by phone or arrange a meeting with him.
Current Board of DirectorsAs of December 31, 2013, the Board of Directors comprised nine shareholder representatives. Current board members are presented on the Company’s website: www.pgs.com and in this annual report.
9. The work of the Board of DirectorsIn accordance with Norwegian corporate law, our Board of Directors has overall responsibility for management of the Company, while the Company’s Chief Executive Officer (“CEO”) is responsible for day-to-day management.

PGS ANNUAL REPORT 2013
41PGSPERFORMANCE
The Board of Directors provides oversight of the CEO’s day-to-day management and company activities in general. The Board of Directors is also responsible for ensuring that appropriate manage-ment, guidelines, and control systems are in place and are followed. The CEO, as agreed with the chairperson of the Board of Direc-tors, annually submits a schedule for the meetings of the Board of Directors in the upcoming calendar year. The schedule is subject to Board approval. In 2013, the Board of Directors held nine meetings including conference calls. During 2013, all directors participated in all meetings and conference calls, with the exception of one director who missed one meeting and another director who missed one con-ference call.
Key elements of the Rules of Procedure cover the Board of Direc-tors’ responsibilities to determine the Company’s financial targets, set strategies along with the CEO and executive committees, and approve business plans, budgets, and budgetary and risk frame-works. In its supervision of the Company’s business activities, the Board of Directors will seek to ensure that satisfactory procedures are in place for monitoring and follow-up of Board-approved corpo-rate principles and guidelines covering areas such as ethical conduct; adherence to laws, rules, and regulations; health, safety and environ-ment; and corporate social responsibility.
The Rules of Procedure also require an annual self-evaluation to determine whether the Board of Directors and its committees are functioning effectively. The annual self-evaluation is prepared and facilitated by the Remuneration and Corporate Governance Com-mittee. An anonymous survey is carried out and the findings are discussed by the Board of Directors. The survey’s findings are made available to the Nomination Committee. The Chairperson of the Nomination Committee also shares with the Board relevant informa-tion for improvement of Board processes that may come up in their annual interviews with individual directors.
Each scheduled Board of Directors meeting includes a separate ses-sion at which issues may be discussed without the presence of man-agement.
The tasks and duties of the CEO vis-à-vis the Company’s Board of Directors are also outlined in the Rules of Procedure, along with the tasks and duties of the chairperson of the Board of Directors. The CEO participates in all board meetings other than closed sessions. The Board of Directors elects a vice chairperson to chair board meet-ings in the chairperson’s absence. The full text of the Board of Direc-tors’ Rules of Procedure is available at: www.pgs.com.
Our governance structure is organized as described below.
Our Board of Directors is responsible for the development and super-vision of our business activities. The Board has established an Audit
Committee and a Remuneration and Corporate Governance Commit-tee to assist in organizing and carrying out its responsibilities.
Board responsibilities include:• The Board of Directors appoints the Company’s CEO• The Board of Directors, along with the CEO, is committed to
operating PGS in an effective and ethical manner in order to cre-ate value for the Company’s shareholders. Our Code of Conduct requires management to maintain an awareness of the risks involved in carrying out our business strategies. Personal interests must not override or conflict with the interests of PGS.
The responsibilities of the CEO include:• Day-to-day management of company activities• Organizing PGS’ Executive Committees and the Disclosure Com-
mittee to further assist the CEO• The CEO, under the guidance and supervision of the Board of
Directors and the Audit Committee, is responsible for ensuring that the Company’s financial statements in all material respects, fairly present the Company’s financial condition and the results of its operations. Timely disclosure of issues to the Board of Direc-tors is also essential to the assessment of the Company’s financial condition, business performance and risks.
Board of Directors CommitteesOur Audit Committee comprises board members Harald Norvik (chairperson), Carol Bell, Daniel J. Piette, and Anne Grethe Dalane. All committee members are considered independent of the Company. The committee’s functions are to assist the Board of Directors in its supervision of the integrity of PGS’ financial statements; to monitor the independent auditor’s qualifications, independence and perfor-mance; to monitor the performance of the internal audit function; and to promote and review compliance with laws and regulatory requirements.
PGS’ Remuneration and Corporate Governance Committee comprises board members Holly Van Deursen (chairperson), Annette Malm Jus-tad, Ingar Skaug, and Walter Qvam. The function of the committee is to assist in matters relating to compensation, benefits, and perqui-sites of the CEO and other senior executives. Review and modifica-tion of the Company’s guidelines for good corporate governance are also committee responsibilities.
10. Risk Management and Internal ControlThe Board of Directors is responsible for ensuring that appropriate guidelines, monitoring, and internal control systems are in place and effective. These are to include embedding risk management, desig-nating risk ownership, and implementing risk responses and controls.
The Board of Directors has systems in place to ensure that the CEO exercises appropriate and effective management. The Board of

PGS ANNUAL REPORT 2013
42PGSPERFORMANCE
Directors’ Audit Committee assesses the integrity of PGS’ accounts. It also inquires into, on behalf of the Board of Directors, issues related to financial review and external audit of PGS’ accounts. Fur-ther, the Board of Directors and the Audit Committee supervise and verify that effective internal control systems are in place, including systems for risk management and financial reporting.
The Board of Directors and the Audit Committee take steps to ensure that the Company’s internal control functions are working as intended and that necessary measures are taken to reduce extraor-dinary risk exposure. Furthermore, the Board of Directors makes cer-tain that there are satisfactory routines for follow-up of principles and guidelines adopted by the Board of Directors governing ethical conduct; compliance with laws, rules and regulations; health, safety and working environment; and corporate social responsibility.
The Company’s anti-corruption program includes a policy, a manage-ment statement, and procedures as to several ethical issues, periodic training, high risk area assessment and monitoring, compulsory con-tract wording, etc. The policy and procedures are available at www.pgs.com. The program is evaluated on a regular basis by the Audit Committee.
Management maintains and regularly reviews a risk matrix setting out the main risks for the Company. These risk factors and the Com-pany’s risk mitigating activities are subject to discussion in the Board of Directors at least once a year.
Management conducts day-to-day follow-up of financial manage-ment and reporting. Management has established a structured process to ensure that Internal Control over Financial Reporting is effective. The process includes identification and assessment of all material financial reporting risks, identifying and documenting rele-vant controls to address these risks, and monitoring that controls are implemented and performed. For controls that are not operationally effective at year-end, their potential financial exposure and impact on the consolidated financial statements are evaluated.
Internal Audit DepartmentPGS has an Internal Audit Department reporting directly to the Audit Committee on its audit planning and audit reports. The purpose of the Internal Audit Department is to perform independent, objective assurance and consulting activities that add value and improve the Company's initiatives in financial, operational and compliance areas.
The scope of work for the Internal Audit Department includes deter-mining whether the Company’s risk management, control, and gov-ernance processes, as designed and represented by management, are adequate and well-functioning. The department has established a process for ensuring that adequate internal control-related activ-ities are integrated into significant PGS business operations world-
wide and that focus is directed towards areas of perceived high risk. Any non-conformance is systematically followed up and corrective measures are implemented and their effects monitored.
11. Remuneration of the Board of Directors and Executive ManagementRemuneration of board members is not linked to performance but is based on participation in meetings and is subject to annual approval by the General Meeting. Board members shall not solicit or accept specific assignments for PGS beyond their role as Board members. Board members do not hold any PGS share options.
For details on compensation to individual board members, please see Note 28 to the financial statement of PGS.
Remuneration payable to board members will be proposed by the Nomination Committee according to its charter, and submitted to the AGM for approval.
Executive remuneration is one of the primary tasks of the Remuner-ation and Corporate Governance Committee. The committee annu-ally reviews the total compensation level, the mix between fixed and performance related compensation and the mix between short, medium and long-term compensation. The Remuneration and Cor-porate Governance Committee has developed an annual schedule in order to ensure and facilitate a structured approach to the annual review of executive compensation. The committee has also engaged an external advisor for this work.
A specific peer group of comparable companies and an executive remuneration philosophy have been adopted. The peer group cur-rently consists of seventeen companies from Norway, Europe, and the Americas. All companies are of comparable size and have inter-national operations in the oil service sector. The external advisor collects and compiles relevant information on peer group compa-nies. This information is used by the Remuneration and Corporate Governance Committee for benchmarking executive remuneration. The executive remuneration policy document includes certain tar-gets and guidelines on how the Company’s executives should com-pare to the peer group. These tools amongst others, are used by the Remuneration and Corporate Governance Committee to decide on an appropriate remuneration structure and to set appropriate total remuneration.
Compensation for the CEO adheres to the same process as that used for other executives, but is also subject to approval by the Board of Directors.
PGS currently has a compensation structure for executive managers that includes a base salary, benefits such as newspaper and mobile phone subscriptions, cash bonuses, pension plans, and stock-based

PGS ANNUAL REPORT 2013
43PGSPERFORMANCE
long-term incentive programs. Features of these programs include an absolute ceiling on performance-related remuneration and a cap on maximum gain on option programs.
For further details on the compensation structure and total com-pensation to executive team members, see Note 28 to the financial statement of PGS.
12. Information and CommunicationsThe Board of Directors is committed to reporting financial results and other relevant information based on openness and the require-ment of equal treatment of all shareholders and securities market participants. The Company complies with relevant disclosure rules and regulations. Announcements are released through the Thomson Reuters reporting channel and posted on the Oslo Stock Exchange’s news service: www.newsweb.no. In addition, all announcements are available on the Company’s website: www.pgs.com. The Company’s policy of accessibility for shareholders is also presented on the Com-pany’s website.
The Company has an investor relations function to ensure that requests for information from shareholders, analysts and other inter-ested parties are satisfied. The Company has an active investor com-munication program which includes senior management roadshows in connection with reporting of financial results, presentations at rel-evant investor conferences, and availability for one-on-one meetings. The Company hosts a Capital Markets Day presentation once a year.
The Board of Directors and the Nomination Committee send a let-ter to the largest shareholders once a year inviting them to join in a dialog on corporate governance and corporate responsibility matters. The letter is also posted on www.pgs.com and any shareholder may initiate communication with the Company on these matters. During 2013, several meetings and phone conferences were conducted with shareholders under this initiative.
13. Takeover BidsThe Board of Directors has established guiding principles for how it will act in the event of a takeover bid. The Board of Directors will ensure that all shareholders are treated equally and seek to prevent disruptions to, or interference with, Company operations to the extent possible. In the event of a takeover bid, the Board of Directors will, in accordance with its overall responsibilities and good corporate governance, act in the best interest of shareholders and ensure that
they are given sufficient information in the matter. If a takeover bid is made, the Board of Directors will issue a statement containing a recommendation as to whether the shareholders should accept or reject the offer, including an independent valuation of the offer. The Company’s Articles of Association do not contain any restrictions, limitations, or defense mechanisms against acquisition of its shares.
14. AuditorThe Audit Committee shall support the Board of Directors in the administration and exercise of its responsibility for supervision of the work of the independent auditor, who shall keep the Board of Directors informed of all aspects of its work for PGS. This duty includes submission of an annual plan for the audit of PGS. The auditor attends all Audit Committee meetings and, at least twice a year, meets with the Audit Committee without the presence of management. In-house policies govern the use of the auditor’s ser-vices. Use of the auditor for services other than the audit of PGS requires pre-approval by the Audit Committee.
The independent auditor meets with the full Board of Directors at least once a year in connection with the preparation of the annual financial statements and, at least once a year, presents a review of PGS’ financial reporting and internal control procedures for financial reporting. At least once a year, the independent auditor meets with the Board of Directors without the presence of any member of the executive management.
Remuneration paid to the auditor for mandatory and other audit ser-vices will be reported to the AGM for approval.
15. Compliance with Laws, Rules, Regulations and RecommendationsAs part of PGS’ Business Practice outlined on www.pgs.com, PGS is inter alia committed to comply with relevant laws, rules, and regula-tions. In addition, PGS complies with the current recommendations set forth in the NUES Recommendations, subject only to deviations identified and justified in this report. The NUES Recommendations are available at www.nues.no.
The Board of Directors further conducts periodic reviews of PGS’ cor-porate governance policies and procedures, including the Board of Directors’ Rules of Procedure. This process is conducted annually and managed by the Remuneration and Corporate Governance Commit-tee. Any changes to policies or procedures are presented to the Board of Directors for approval.

PGS ANNUAL REPORT 2013
44PGSPERFORMANCE
BOARD OF DIRECTORS2013
Francis GugenChairpersonElected 2003
Mr Gugen was elected PGS Board Chairman in May 2009. Currently an energy-industry consultant and investor, he worked at Amerada Hess Corporation for 18 years, from 1982 to 2000. Mr. Gugen served as Chief Executive of Amerada Hess UK from 1995 to 2000 and Amerada Hess’ Chief Executive of North West Europe from 1998 to 2000. His board positions at listed companies include Board Chairman of IGas Energy Plc and Board Member of SBM Offshore NV; Mr. Gugen is an IGas Energy investor. Francis Gugen is also Chairman of the Board and investor in a number of privately held companies. A UK chartered accountant, he has also worked at Arthur Andersen. As of April 10, 2014, Mr. Gugen owns 30,000 PGS shares.
Harald NorvikVice ChairpersonElected 2003Audit Committee Chairperson
Mr Norvik is an independent advisor and consultant. He is Board Chairman of Asche-houg Publishing House and Board Member of ConocoPhil-lips, Inc., Deep Ocean Holding, and Umoe. Mr. Norvik was President and Chief Executive Officer of Statoil from 1988 to 1999. From 1981 to 1988, he was Finance Director and a Member of the Executive Board of the Aker Group. Har-ald Norvik served as Personal Secretary to the Prime Min-ister of Norway and as State Secretary in the Ministry of Petroleum and Energy from 1979 to 1981. He received his Master of Science in Business from the Norwegian School of Economics and Business Administration. As of April 10, 2014, Mr. Norvik owns 8,000 PGS shares.
Holly Van DeursenBoard memberElected 2006Remuneration and Corporate Governance Committee Chairperson
Ms. Van Deursen currently holds non-executive director positions with Petroleum Geo-Services, Bemis Compa-ny, Inc., Actuant Corporation, Capstone Turbine Corpora-tion, and Anson Industries, Inc. She served on BP plc's Top-Forty Executive Team as Group Vice President, Petro-chemicals from 2003 to 2005 and Group Vice President, Strategy from 2001 to 2003. Prior to these executive ap-pointments, Ms. Van Deursen held a variety of senior positions with BP and Amoco in Chicago, London, and Hong Kong and has served on the boards of directors of the American Chemistry Council and Amoco’s joint ventures in Korea, Taiwan, and Japan. Ms. Van Deursen holds a B.Sc. in Chemical Engineering from the University of Kansas and an MBA from the University of Michigan. As of April 10, 2014, Ms. Van Deursen owns 2,000 PGS shares.
Daniel J. PietteBoard MemberElected 2007Audit Committee Member
Mr Piette is Executive Chair-man of TerraSpark Geoscienc-es, a software company that offers technology for the in-terpretation of seismic data. Previously, Mr. Piette was President, CEO, and a Board Member of Object Reservoir. Mr. Piette was President and CEO of OpenSpirit Corpo-ration from 2003 to 2011. After receiving his B.Sc. with honors in Mining Engineer-ing from the University of Wisconsin-Madison in 1980, he held several executive management positions in the oil and gas industry, including business unit manager for the land acquisition systems group at Input/Output, President and CEO of Bell Geospace, and Vice President and General Manager of the Asia Pacific region for Land-mark Graphics. As of April 10, 2014, Mr. Piette owns 7,000 PGS shares.

PGS ANNUAL REPORT 2013
45PGSPERFORMANCE
Annette Malm JustadBoard MemberElected 2008Remuneration and Corporate Governance Committee Member
Ms. Malm Justad is an independent consultant and board member. She has served as CEO of Eitzen Maritime Services ASA, Vice President and Head of Pur-chasing for Yara International ASA, and Vice President and Fleet Manager of Norgas Carriers AS. At Norsk Hydro ASA, Annette Malm Justad held various technical and commercial positions. Ms. Malm Justad holds a Mas-ter’s degree in Technology Management from MIT/NTH, as well as an M.Sc. in Chemical engineering from the Norwegian University of Science and Technology. Board memberships include Board Chairman of American Shipping Company and Store Norske Spitsbergen and Board Member of Awilco. As of April 10,2014, Annette Malm Justad does not own any PGS shares.
Carol BellBoard MemberElected 2009Audit Committee Member
Dr. Bell has over 30 years of experience in the energy industry, with particular expertise in investment and financing in the oil and gas sector. She is a non-execu-tive director of Salamander Energy plc and Caracal Energy Inc (both London Stock Ex-change). She has held senior positions in investment banking, including Managing Director of the Global Oil & Gas Group at Chase Manhat-tan Bank, Head of European Equity Research at JPMorgan and Global Head of its Oil and Gas Equity Research Team. Dr. Bell began her career in corporate planning and development with RTZ Oil and Gas and later worked at Charterhouse Petroleum plc. She was awarded a Ph.D in May 2005 for her research on the evolution of economic and trade relations in the Ancient Eastern Mediterranean across the Late Bronze/ Iron Age transition, and in 2006 pub-lished a book on this subject. Dr. Bell is Honorary Treasurer of the British School in Athens. She was educated as a scientist, earning an M.A. in Biochemistry from Cambridge University, a B.A. in Geology from the Open University, and a Ph.D. in Archaeology from University College, London. As of April 10, 2014, Dr. Bell owns 5,000 PGS shares.
Ingar SkaugBoard Member Elected 2009Remuneration and Corporate Governance Com-mittee Member
Mr Skaug was Group CEO of the maritime industrial group Wilh. Wilhelmsen ASA from 2003 to 2010, after having served in several senior management positions within the group since 1990. Previously, Mr. Skaug was VP and Deputy Chief Operating Officer of SAS Airlines, a position that capped nearly three decades. Mr. Skaug is a Board Member of the ferry, roll-on roll-off, and logistics company DFDS AS, the travel bureau Berg-Hansen and Bery Maritime. He is also Board Chairman of Center for Creative Leadership, Ragni Invest, and Deputy Board Chairman and a member of the auditing committee of J. Lauritzen AS. In 2013 he joined Environor AS and Vectura AS as Board Chair-man and ABN/AGN as Board Member. He received his MBA degree from the University of Nürnberg, Germany. As of April 10, 2014, Mr. Skaug does not own any PGS shares.
Walter QvamBoard Member Elected 2013Remuneration and Corporate Governance Committee Member
Mr Qvam is President and Chief Executive Officer of Kongsberg Group ASA. He has previously held leading positions in various promi-nent Norwegian and interna-tional businesses in a variety of fields, including oil & gas, shipping (DNV - Det Norske Veritas), IT (Capgemini), transportation (the Norwe-gian State Railway) and con-sultancy (Gemini Consulting). Mr. Qvam graduated Master of Science (M.Sc.) from the Norwegian University of Sci-ence and Technology (1979), and has also studied at INSEAD in Singapore (1985). He is Chairman of the Council of Det Norske Veritas. As of April 10, 2014, Mr. Qvam does not own any PGS shares.
Anne Grethe DalaneBoard Member Elected 2013Audit Committee Member
Ms. Dalane is a senior execu-tive at Yara International and previously held a number of senior positions at Norsk Hy-dro. She is currently Business Process Owner, Sales at Yara International. Her previous experience covers a range of fields including HR as well as oil and gas. She has been Region Director Latin Amer-ica and Country Manager of Argentina. Ms. Dalane's background is in economics and she holds a business degree from the Norwegian School of Economics NHH. As of April 10, 2014, Anne Grethe Dalane does not own any PGS shares.

PGS ANNUAL REPORT 2013
46PGSPERFORMANCE
The marine seismic market changed to become more challenging in the latter half of 2013. PGS responded to this situation by switch-ing more capacity to MultiClient projects that met its rigorous performance criteria, and thereby being able to focus on the best contract jobs and maintaining good profitability. The platform for future earnings has increased with the delivery of Ramform Titan and Ramform Atlas, and will improve further when the Company takes delivery of the last two Ramform Titan-class vessels in 2015, combined with a continuous improvement of the GeoStreamer tech-nology platform.
Petroleum Geo-Services (“PGS” or “the Company”) is a focused Marine geophysical company that provides a broad range of seismic and reservoir services, including acquisition, imaging, interpreta-tion, and field evaluation. The Company’s MultiClient data library is among the largest in the seismic industry, with modern 3D coverage in all significant offshore hydrocarbon provinces of the world. The Company operates on a worldwide basis with headquarters in Oslo, Norway.
PGS is organized into four business areas: Marine Contract, MultiCli-ent, Operations, and Imaging & Engineering (“I&E”).
• Marine Contract: manages projects and customer relationships pertaining to seismic data acquired under exclusive contracts; the diversified customer base comprises a broad range of the world’s independent and national oil and gas exploration and production companies.
BOARD OFDIRECTOR'S REPORTMargins were higher in 2013 com-pared to 2012. Solid performance from all business areas and the increasing effects of the Company’s 2012 Profit Improvement Program contributed to the improvement.
RECORD MULTICLIENT LATE SALES OF USD MILLION
311
PROPOSED DIVIDEND PER SHARE FOR 2013 (IN NOK)
2.30

PGS ANNUAL REPORT 2013
47PGSPERFORMANCE
• MultiClient: initiates and manages projects and customer rela-tionships pertaining to seismic data licensed on a non-exclusive basis from the Company’s data library of seismic surveys. The PGS MultiClient library covers substantial areas in the major offshore hydrocarbon basins that the Company and its customers deem to have the highest potential for exploration and production, such as the North Sea, offshore West Africa, Brazil, the Gulf of Mexico and the Mediterranean Sea.
• Operations: supports both Marine Contract and MultiClient with reliable and efficient data acquisition by managing operations of the Company’s seismic vessels and related equipment, including fleet expansion and maintenance.
• I&E: processes seismic data acquired for PGS’ MultiClient library and as a contract service to external customers. It also manages the Company’s research and development activities.
2013 Business HighlightsOperating profit in 2013 increased from the previous year, despite a slight decline in revenues. This improvement reflects higher profit-ability for all business areas and the growing impact of the Compa-ny’s Profit Improvement Program.
Late sales were at a record high, delivering good returns on the investments made in MultiClient. The strong late sales performance demonstrates healthy demand for quality products in attractive loca-tions, despite a generally increased focus on cost and improved cash flow among customers. Going forward, the Company aims to further increase late sales by capitalizing on the 2013 investment in MultiClient.
In April, PGS took delivery of Ramform Titan, the first in a series of four Ramform Titan-class vessels. Ramform Titan is the most powerful and efficient marine seismic acquisition vessel in the world. The vessel has performed above expectations, being put to the test in the North Atlantic and offshore the Falkland Islands. With the Ramform Titan, the Company has been able to fully utilize all the weather benefits of GeoStreamer technology, and thereby further improve efficiency.
Financial flexibility remains a strategic ambition for PGS. In the fall of 2013, the Company increased its revolving credit facility by $150 mil-lion to $500 million and extended the maturity by three years to 2018. With the successful completion in March 2014 of both the refinancing of the Term Loan B and the Japanese export credit financing for the two last Ramform Titan-class vessels, the average time to maturity for the Company's debt and drawing facilities has increased to almost six years.
In 2013, PGS gained greater market recognition of its Towed Elec-tro Magnetic (“Towed EM”) and imaging technologies. In the fourth quarter, the Company completed the first ever full-scale simulta-
neous acquisition of Towed EM and 2D GeoStreamer seismic. The MultiClient program was undertaken with industry support. Turning to Imaging, the new GeoStreamer imaging technology, Separated Wavefield Imaging (“SWIM”) in combination with Full Waveform Inversion, have enabled velocities to be set much more accurately and thereby achieve a perfect seismic tie at well locations in areas where, until now, this had been impossible to reliably accomplish this by using conventional seismic data.
In November, PGS commenced the acquisition of its Triton Full Azi-muth GeoStreamer survey in the Gardens Banks and Keathley Can-yon areas of the Gulf of Mexico. There are a number of discoveries already within the limits of the survey. PGS is applying all of its latest technologies to deliver the best possible image of the subsurface in an area of the Gulf of Mexico where the geology is very complex.
As a follow-up to the 2012 Profit Improvement Program, PGS intro-duced a Quality Improvement Program in 2013. The aim of this lat-est program is to improve revenues by preventing quality related losses. Initiatives include improved communication among business functions, clear definitions of roles and responsibilities in the project organization, and streamlining of key project-related processes and project risk assessments.
PGS implemented its dividend policy in 2011. For 2013, the Board of Directors proposes a dividend of NOK 2.30 per share, up 39 percent from 2012. PGS’ dividend policy, whereby it is the intention to distrib-ute between 25 to 50 percent of net income over the business cycle, is a testament to the Company’s industrial approach to the business and its commitment to deliver cash returns to shareholders.
Strategy ReviewPGS’ strategic ambitions are anchored in five core pledges: To care, To deliver productivity leadership, To develop superior data quality, To innovate, and To perform over the cycle.
PGS has a strategic ambition to care for employees’ health and safety alongside caring for the environment and society at large. Leadership in HSEQ is one of PGS’ core values. To further improve HSEQ performance and reinforce HSEQ management systems, PGS set three main goals for 2013 that were largely achieved:
• Maintain a low incidence of recordable injuries, in particular Lost Time Injuries
• Strengthen risk management and reduce overall risk exposure• Continue to improve employee HSE awareness and performance.
The “Q” is in focus via implementation of the Quality Improvement Program. The Company aims to be best-in-class, and believes in zero injury to people and limited harm to the environment. HSEQ leadership requires continuous improvement through identifying,

PGS ANNUAL REPORT 2013
48PGSPERFORMANCE
assessing, mitigating, and managing risk affecting PGS employees, contractors, and the environment. Leadership in HSEQ also contrib-utes to the pledge to Care for Customers ’ Success.
Productivity leadership is served first and foremost by PGS’ fleet of Ramform vessels. Given the trend towards larger surveys and shorter cycle times between award of a license and the required drilling of the first well, efficiency and reliability are important performance criteria differentiating PGS from its competition. PGS has a new build pro-gram of four Ramform Titan-class vessels. The first vessel, the Ram-form Titan was delivered in April 2013. The Ramform Atlas entered the market in early 2014, while the two last vessels are scheduled for delivery in 2015. Although PGS already has the most productive fleet in the industry, the Company’s competitive advantage will be further enhanced when all Ramform Titan-class vessels have been delivered. GeoStreamer increasingly contributes to PGS productivity. With all but one vessel equipped with GeoStreamer, the Company is positioned to get full benefit out of the deeper tows enabled by GeoStreamer. Full GeoStreamer deployment will be achieved in 2016.
When adding capacity, PGS takes a long term view and invests through the cycle, backed by a solid balance sheet. The Company will only add capacity when differentiation can be achieved and, of course, it can see the prospect of a satisfactory ROCE (return on capi-tal employed). The Company is of the opinion that it has a fleet fit to serve the ultra-high-end segment of the market, which will be ever more the case after delivery of the additional Ramform Titan-class vessels in 2015. In the absence of capital expenditures for vessel new builds, the free cash flow potential of the Company will be significant and the Board intends to focus on further increasing ROCE and div-idend capacity. Maintaining critical mass is important for PGS; how-ever, market share growth alone is not a Company objective.
Oil companies are ultimately seeking superior data quality. The abil-ity to deliver an ever clearer, more informative seismic image requires successful product innovation. PGS introduced GeoStreamer in 2007 and was first to offer a dual-sensor streamer, despite industry efforts over many years to develop a dual-sensor streamer. PGS claims with pride that GeoStreamer has been the greatest game-changer in the seismic industry since the launch of 3D seismic in the early 1970s, and that it is the best example of PGS’ technology differentiation. To further advance the GeoStreamer technology platform, the Company has developed a number of spin-off products and technologies, such as GeoSource™ and SWIM. Imaging technologies derived from Geo-Streamer, such as SWIM, have emerged as a competitive advantage for PGS in 2013. The Company expects these technologies to become an ever more important market differentiator going forward.
Regarding operational innovation, PGS was the first company to deploy vessels capable of towing more than 20 streamers. The Company delivers unique reservoir-focused solutions based on the
high-performance GeoStreamer technology platform. There is a good technology pipeline with further profit potential which the Company intends to capitalize on; Towed EM and the OptoSeis fiber optic per-manent monitoring technology being the most attractive candidates in the medium term. The Company progressed well on this ambition in 2013, with the first full-scale simultaneous acquisition of Towed EM and 2D GeoStreamer seismic. On the Jubarte Permanent Res-ervoir Monitoring (“PRM”) project for Petrobras (offshore Brazil), where PGS installed the subsea system in 2012, the Company com-pleted both the first baseline survey and the first monitoring survey in 2013.
The seismic market is characterized by short order books which expose seismic companies to earnings fluctuations. PGS aims to per-form over the cycle and mitigate its exposure to industry cyclicality by maintaining a strong balance sheet, taking a proactive approach to capacity and capital allocation between MultiClient and contract work, maintaining cost and capital discipline, and focusing on pro-ductivity, quality improvement, and technology differentiation. The Company progressed in all of these areas in 2013.
Markets and Main BusinessesPGS is one of the three largest participants in the global marine 3D seismic market, with a market share of approximately 20 percent.
2013 ended up being a challenging year for the seismic industry with slower market growth and weaker than expected earnings develop-ment. This was especially true for the second half of the year. An increasing focus on cost and cash flow among customers adversely impacted their seismic spending. In this context, it is important to note that spending did not decline for exploration and development among oil companies; rather, the growth rate slowed compared to previous years.
The cautious approach to spending among oil companies affected the aggregate square kilometers of seismic acquired in 2013; the figure remained roughly unchanged from 2012. The average annual growth rate over the past eight years has been approximately 11 percent.
Well-established seismic companies have recently responded by decommissioning some capacity. These efforts trimmed capacity by approximately three percent in 2013, measured in terms of num-ber of streamers. PGS sees further potential for decommissioning of vessels, as the industry is still operating with a significant amount of old and ineffective capacity.
Historically, a weaker seismic market has been driven by macro events that cause oil prices to decline. During 2013, oil prices on aver-age remained well above $100 per barrel and there were no macro events adversely impacting overall financial markets. On the con-trary, most of the world’s financial equity indices rose in 2013.

PGS ANNUAL REPORT 2013
49PGSPERFORMANCE
Brazil has traditionally been an anchor market for seismic activity. The large discoveries made there several years ago led the govern-ment to halt licensing rounds to allow time for Brazilian authorities to determine how best to manage their natural resources. Activity in Brazil is expected to pick up in the wake of the 11th and 12th licensing round carried out in 2013. In the Gulf of Mexico activity also showed positive signs in 2013 after the region had been on hold for a number of years following the Macondo incident in 2010.
Going into the fourth quarter of 2013, the industry suffered from below-normal order book combined with a seasonally weaker win-ter market. PGS was able to build its order book as early as the third quarter, thereby making good progress on the transition into the 2014 summer season. Order book growth continued in the fourth quarter, but at the cost of lower rates for work scheduled for the winter sea-son. By year-end 2013, the Company had better order book visibility than the industry average. The Company’s order book amounted to $669 million, including $80 million of committed pre-funding for scheduled MultiClient projects.
Contract seismic work continued to contribute strongly to PGS busi-ness activity in 2013, with approximately 52 percent of active 3D vessel time spent on contract work. 48 percent of active 3D vessel time was used for acquisition of new MultiClient surveys with solid pre-funding levels. Pre-funding amounted to 97 percent of capital-ized MultiClient cash investments in 2013.
TechnologyHigh-end imaging technology contributes to imaging revenue growth and has resulted in higher-quality data, shorter cycle times, and bet-ter-informed decision-making by customers. PGS’ goal is to provide services efficiently and effectively that are recognized as state-of-the-art and to consistently maintain best-in-class MultiClient imag-ing capabilities.
GeoStreamer, the first-ever dual-sensor streamer and a proprietary PGS technology, represents a game changer in streamer technology and the best proof of PGS’ technology differentiation. GeoStreamer delivers enhanced resolution, better depth imaging, and improved operational efficiency.
GeoStreamer is used as an integrated acquisition and imaging solu-tion that enables PGS to deliver unparalleled features that differen-tiate the Company’s product capabilities from industry alternatives.
PGS has invested considerable resources to develop and deliver effi-cient imaging solutions and technological differentiators to custom-ers. SWIM is the newest addition to PGS processing technologies. SWIM has the potential to both improve data quality and make seis-mic acquisition more efficient.
While seismic data yields an image of the subsurface geological structure, electromagnetic (“EM”) data can provide information about the fluid content of reservoirs. PGS is bringing to the market a Towed EM streamer system. The benefits of towed EM acquisition are many, and customers have shown good interest in the technol-ogy. First and foremost, efficiency is significantly improved, com-pared to existing EM acquisition technologies.
Financial ResultsTotal revenues in 2013 were $1,501.6 million, compared to $1,518.3 million in 2012, a decrease of one percent, mainly due to lower Multi-Client pre-funding revenues.
Revenues from Marine Contract seismic acquisition increased by $54.0 million, or nine percent, to $677.5 million in 2013 primarily as a result of higher prices on contract services compared to 2012. The increase comes despite less 3D vessel capacity allocated to contract work. The contract EBIT margin for the full-year 2013 was 29 percent, compared to 16 percent in 2012. The margin improvement came in a generally stronger marine seismic market, particularly in the early part of 2013, but was also made possible by cost reductions and improved profitability of the Company’s increasingly GeoStreamer focused services.
Total MultiClient revenues (pre-funding and late sales combined) decreased by $56.3 million, or eight percent, to $671.8 million in 2013, caused by lower pre-funding revenues. The lower pre-funding rev-enues are mainly due to the lower weight of surveys covering held acreage. The project mix of MultiClient surveys will vary from year to year depending on the opportunities arising. Late sales in 2013 were record high at $311.3 million, up $44.5 million, or 17 percent from 2012.
Cash investment in the MultiClient library increased by $75.6 million, or 25 percent, to $373.0 million in 2013. Pre-funding as a percentage of capitalized cash investment was 97 percent in 2013, compared to 155 percent in 2012. The decrease in pre-funding level was primar-ily driven by the same factors mentioned above describing the lower pre-funding revenues. A more cautious spending pattern among oil companies and increased competition for pre-funding commitment to MultiClient projects, as experienced in 2013, also contributed to the reduced pre-funding level. In 2013, the fleet allocation ratio (active 3D vessel time for Marine Contract vs. MultiClient data acqui-sition) was approximately 52:48, compared to 57:43 in 2012.
Operating costs, which include cost of sales, expensed research and development costs, and selling, general and administrative costs, totaled $672.7 million in 2013, compared to $742.1 million in 2012, a decrease of $69.4 million, or nine percent. The decrease primar-ily reflects more costs capitalized to the MultiClient library and less activities in high cost regions. Further, cost inflation has been moder-ate and the cost impact of 2014 capacity growth has been mitigated

PGS ANNUAL REPORT 2013
50PGSPERFORMANCE
by the improved cost position achieved by the Company’s 2012 Profit Improvement Program.
Full year 2013 research and development costs decreased by $1.2 mil-lion, or 2 percent, to $54.7 million. The decrease is primarily driven by field trial activity returning to a more normal level, while overall resource levels remain roughly the same. Capitalized development costs totaled $16.0 million in 2013, compared to $17.6 million in 2012.
Net depreciation and amortization for 2014 amounted to $432.5 million, compared to $484.3 million in 2012, down $51.8 million or 11 percent.
Gross depreciation increased by $21.3 million, to $243.9 million in 2013, driven by entry of the Ramform Titan into the fleet, vessel upgrades and continued GeoStreamer investments. Depreciation capitalized increased by $30.2 million in 2013 mainly as a result of more fleet capacity allocated to 3D MultiClient surveys, causing reported net depreciation cost to decline by $8.9 million in 2013, compared to 2012.
MultiClient amortization for 2013 decreased by $42.9 million, or 12 percent, to $301.8 million, compared to 2012. MultiClient amortiza-tion as a percentage of total MultiClient revenues was 45 percent in 2013, which is down from 47 percent recorded in 2012. The net book value of the MultiClient library was $576.9 million as of December 31, 2013, compared to $382.3 million as of December 31, 2012.
In the fourth quarter of 2013 the Company recorded an impairment of $15 million related to the stacked source vessel Polar Sea.
Operating profit in 2013 was $382.1 million. The corresponding 2012 operating profit was $293.8 million.
Gross interest expense increased by $6.2 million, or 12 percent, to $57.6 million in 2013, compared to 2012. Higher capitalized interest related to construction in progress and to the MultiClient library more than offset the increase of gross interest expense, causing net interest expense to be $32.3 million in 2013, compared to $37.8 mil-lion in 2012.
Other financial expense, net of $21.9 million in 2013 compared to $27.5 million in 2012 is mainly attributable to loss from associated compa-nies related to investments in PGS Khazar LLC and Azimuth Ltd. and a currency loss. The currency loss amounted to $7.6 million in 2013 compared to a loss of $7.3 million in 2012. The Company holds foreign currency positions to balance its operational currency exposure.
Income tax expense was $89.6 million in 2013, compared to $42.9 million in 2012. Current tax expense for the full year was $32.2 mil-lion, compared to $43.9 million in 2012. Current tax expense relates primarily to foreign taxes or income taxes in countries in which PGS
have no carry forward losses or where there are limitations on the application of such losses. Deferred tax expense for the full year 2013 was $57.4 million compared to a benefit of $1.0 million in 2012.
With multinational operations, PGS is subject to taxation in many jurisdictions around the world with increasingly complex tax laws. PGS has identified issues in several jurisdictions that could even-tually make the Company liable to pay tax claims relating to prior years in excess of the liability recognized in financial statements. Reference is made to Note 9 of the 2013 financial statements for a description of significant tax contingencies.
Net income to equity holders of PGS ASA was $238.3 million in 2013, compared to $185.5 million in 2012.
Cash Flow, Financial Position and FinancingNet cash provided by operating activities totaled $775.3 million in 2013, compared to $752.9 million in 2012. The increase is largely attributable to higher EBITDA.
Cash and cash equivalents totaled $263.8 million as of December 31, 2013, compared to $390.3 million as of December 31, 2012.
In the third quarter of 2013, PGS increased its revolving credit facility from $350 million to $500 million and extended the maturity from 2015 to 2018. The facility is undrawn and further strengthened the Company’s solid liquidity reserve at improved terms.
PGS interest-bearing debt comprises the following primary components:
December 31(In USD million) 2013 2012Secured:Term loan B, due 2015 470.5 470.5USD 450 million Senior Notes, due 2018 450.0 450.0Japanese export credit financing 119.8 ---Total 1,040.3 920.5
Net interest-bearing debt (interest-bearing debt less cash and cash equivalents, restricted cash, and interest-bearing investments) was $666.7 million as of December 31, 2013, compared to $435.6 million as of December 31, 2012.
With the successful completion in March 2014 of both the refinancing of the Term Loan B and the Japanese export credit financing for the two last Ramform Titan-class vessels, the average time to maturity for our debt and drawing facilities has increased to almost six years.
InvestmentsIn 2013, total MultiClient cash investments, excluding capitalized interest, amounted to $373.0 million, compared to $297.4 million in
PGS ANNUAL REPORT 2013
51PGSPERFORMANCE
2012, an increase of $75.6 million. The increase is primarily due to more vessel capacity allocated to MultiClient in 2013 than in 2012. Capital expenditures totaled $437.8 million in 2013, compared to $368.1 million in 2012, an increase of $69.7 million or 19 percent. The increase is largely attributable to higher capital expenditures related to vessel new builds ($258.5 million in 2013).
Financial Market RiskPGS is exposed to certain market risks, including adverse changes in interest rates and foreign currency exchange rates, as discussed below.
Interest Rate RiskThe Company enters into financial instruments, such as interest rate swaps, to manage the impact of interest rate fluctuations.
As of December 31, 2013, the debt structure of the Company included $527.8 million in floating interest rate debt, with interest based on one and six month LIBOR rates, plus a margin. Fixed-interest-rate debt amounted to $512.5 million. To reduce the adverse effects of any interest rate increases, the Company has a portfolio of interest rate swaps (“IRS”) with a total nominal value of $300.0 million. The fair value of the IRS portfolio was minus $8.3 million as of December 31, 2013. The swaps are for periods of ½ to 1 ¼ years. Taking into account the effect of interest rate swaps, for every (hypothetical) one percentage point increase in LIBOR, the annual net interest expense of the Company’s net debt, including finance leases, would decrease by approximately $2.5 million, given PGS cash holdings as of December 31, 2013.
Currency exchange riskPGS conducts business primarily in US dollars (“$” or “USD”), but also in several other currencies, including British pounds (“GBP”), Norwe-gian kroner (“NOK”), Brazilian real (“BRL”), euro (“EUR”), and Singa-pore dollars (“SGD”). PGS is subject to foreign currency exchange rate risk on cash flows related to sales, expenses, financing, and invest-ment transactions in currencies other than the US dollar.
The Company predominantly sells its products and services in US dollars, and to a limited extent in other currencies. In addition to USD, a significant proportion of PGS’ operating expenses are incurred in GBP and NOK. Less substantial amounts are incurred in Singapore dollars and various other currencies. Thus, regarding expenses and revenues in currencies other than US dollars, such expenses will typ-ically exceed revenues.
A stronger US dollar reduces PGS’ operating expenses as reported in US dollars. It is estimated that a 10 percent change of the US dollar against the two most significant non-USD currencies, NOK and GBP, would have an annual impact on operating profit of $26-27 million, and $10-12 million, respectively, before currency hedging.
PGS hedges part of its foreign currency exposure related to operat-ing income and expenses by entering into forward currency exchange contracts. While the Company enters into these contracts with the purpose of reducing its exposure to exchange rate fluctuations, the contracts are not treated as hedges unless they are specifically des-ignated as hedges of firm commitments or certain cash flows. Con-sequently, these forward currency exchange contracts are recorded at estimated fair value with gains and losses included in the line Currency exchange gain (loss) in the consolidated statement of operations.
As of December 31, 2013, PGS had net open forward contracts to buy/sell GBP, NOK and BRL. The total nominal amount of these contracts was approximately $188.2 million, compared to $153.6 million as of December 31, 2012. Of the total notional amounts of forward exchange contracts, $51.4 million was accounted for as fair value hedges as of December 31, 2013 and $19.2 million was accounted for as fair value hedges as of December 31, 2012. There were no designated foreign currency cash flow hedges in 2013 or in 2012. Outstanding contracts at year-end 2013 had a net positive fair value of $1.0 million, compared to a net negative fair value of $2.3 million at year-end 2012.
A 10 percent depreciation of the US dollar against all the currencies in which the Company holds derivative contracts would increase the fair value of these contracts by approximately $9.1 million. The effect on the consolidated statements of operations would have been $3.6 million.
All interest-bearing debts are denominated in US dollars.
Credit RiskPGS’ accounts receivable are primarily from multi-national, integrated oil companies and larger-sized independent oil and natural gas com-panies, including companies that are owned in whole or in part by gov-ernments. The Company manages its exposure to credit risk through ongoing credit evaluations of customers. The Board deems the Com-pany’s exposure to credit risk as relatively limited due to the nature of the Company’s customer base, the long-term relationships, and the low level of losses on accounts receivable incurred over the years.
PGS monitors the counterparty credit risk of its banking partners, including derivatives counterparties and the institutions in which cash is held on deposit.
Liquidity RiskAs of December 31, 2013, PGS had an unrestricted cash balance of $263.8 million and a total liquidity reserve, including available unutilized draw-ing facilities, of $763.8 million, compared to $390.3 million and $740.3 million respectively at year-end 2012. The Company has a structured approach to monitoring credit risks as to financial counterparties.
PGS has a robust debt structure with adequate maturity profile. Financial covenants relating to existing facilities are not unduly

PGS ANNUAL REPORT 2013
52PGSPERFORMANCE
restrictive. However, materially adverse future market developments could require PGS to implement measures to meet financial cove-nants or refinance debt.
Based on the year-end cash balance, available liquidity resources, and the current structure and terms of the Company’s debt, it is the Board’s opinion that PGS has adequate funding and liquidity to sup-port its operations and investment programs.
Commodity RiskOperation of seismic vessels requires substantial fuel purchases. Thus, PGS is exposed to fuel price fluctuations. Based on the Com-pany’s fuel consumption in 2013, a 10 percent increase in fuel prices would increase the total fuel costs and operating expenses by approximately $1.0 million per month. The Company seeks to pass fuel price risk to customers in a majority of contracts.
Operational and Other RisksDemand for the Company’s products and services depend on the level of spending by oil and gas companies on hydrocarbon-resource exploration, field development, and production. Spending levels are heavily influenced by oil and gas prices and the oil and gas compa-nies’ focus areas. In addition to the risk of less demand for PGS’ ser-vices or for data from the MultiClient data library, the Company is subject to a large number of other risk factors including, but not lim-ited to increased competition, the attractiveness of its technology, changes in governmental regulations affecting the markets, techni-cal downtime, licenses and permits, and operational hazards such as weather conditions.
Contracts for services are occasionally modified by mutual consent and in certain instances may be cancelled by customers on short notice without compensation. Consequently, the order book as of any particular date may not be indicative of actual operating results for any succeeding period.
Shares, Share Capital, and DividendPGS has 217,799,997 shares issued and outstanding, all of which are of the same class and carry equal voting and dividend rights. Each share has a par value of NOK 3.
PGS’ ordinary shares are listed on the Oslo Stock Exchange (ticker: PGS) and denominated in Norwegian kroner. The PGS share contin-ues to be traded as an American Depositary Share (“ADS”) over the counter in the US (ticker: PGSVY). Quotes are denominated in US dol-lars and each ADS represents one share.
As of December 31, 2013, the Company held 2,658,671 treasury shares, primarily to be able to satisfy the exercise of options granted under the employee option programs.
The Board of Directors will propose to the 2014 Annual General Meet-ing (“AGM”) that a dividend for the year ended December 31, 2013 of NOK 2.30 per share to be paid. PGS has a dividend policy which aims to distribute 25 to 50 percent of net income as dividends over the business cycle. Proposals for dividend distributions in future years will be subject to assessments of business performance, operating environment, and growth opportunities to determine the appropri-ate dividend disbursement in any specific year.
Health, Safety, Environment and Quality (“HSEQ”)HSEQ management and reporting are key parameters for the evalu-ation of business performance at all PGS management levels and by the Company’s Board of Directors.
PGS’ HSEQ performance has improved over the past several years, but 2013 saw an increase in the number of injuries, compared to 2012. Nev-ertheless, the number of recordable incidents still remained low, and at industry leading levels. The PGS organization (core fleet vessels and PGS offices) had the following health and safety incident levels in 2013:
• Zero fatalities, compared to zero in 2012• Two Lost Time Injuries, compared to two in 2012 • Five Restricted Work Day Cases, compared to three in 2012 • Five Medical Treatment Cases, compared to three in 2012• Four High Potential Incidents, compared to one in 2012.
Total Company activity (core fleet vessels and PGS offices) in 2013 comprised 12,745,472 man-hours. Total activity in 2012 amounted to 12,045,876 man-hours.
The overall Lost Time Injury Frequency (“LTIF”) decreased to 0.16 per million man-hours in 2013, compared to 0.17 per million man-hours in 2012. The Total Recordable Case Frequency (“TRCF”) increased to 0.94 per million man-hours, compared to 0.66 per million man-hours in 2012. The number of total recordable incidents increased from eight in 2012 to 12 in 2013.
The Company’s risk management system was further developed in 2013 to ensure that all hazards associated with activities are iden-tified, risks assessed, and appropriate mitigation measures deter-mined. PGS implemented measures that strengthen processes and systems for risk and change management, and intensified the Com-pany-wide focus on carrying out formal and informal risk assess-ments offshore and onshore.
HSEQ engagement continued to be a top PGS priority in 2013 and Company employees have been encouraged to assume greater own-ership and responsibility for HSEQ matters. PGS promotes an orga-nization-wide culture of HSEQ ownership so as to ensure that each department fulfills its responsibility for correct management and implementation of HSEQ practices.

PGS ANNUAL REPORT 2013
53PGSPERFORMANCE
OrganizationPGS had an average of 2,245, 2,227 and 2,149 regular active employ-ees in the years ended December 31, 2013, 2012 and 2011 respectively.
As of December 31, 2013, PGS employees represented 71 nationali-ties; 31 percent of the office based employees are women (five per-cent of offshore employees are women). Among staff working in Norway, 37 percent are women. The Board of Directors has five male and four female directors.
At the headquarters in Oslo, 26 percent of management positions are held by women. Six percent of women and one percent of men working for the Norwegian organization of PGS work part-time.
PGS consciously strives to improve the nationality and gender diver-sity of staff. Long-standing practices include ensuring that offshore crews are culturally diverse and balanced, and that cultural sensitiv-ity training is offered at all levels of the organization.
The average monthly salary of active regular employees as of Decem-ber 2013 was $8,277 ($6,090 for female employees and $8,483 for male employees) based on January 31, 2014 exchange rates.
PGS headquarter is located at Oslo, Norway. The Company also has offices in other cities in Norway, and in 20 other countries: Angola, Australia, Brazil, China, Egypt, India, Indonesia, Japan, Kazakhstan, Malaysia, Mexico, the Netherlands, Nigeria, Russia, Singapore, Swe-den, Turkmenistan, United Kingdom, United States of America, and Vietnam.
Board of Directors and Corporate GovernanceThe Board of Directors was, in November, expanded and strengthened by the additions of Walter Qvam, CEO of the Kongsberg Group, and Anne Grethe Dalane, currently Business Process Owner, Sales at Yara.
The Board of Directors has the following members: Francis Gugen (Chairperson), Harald Norvik (Vice Chairperson), Holly Van Deursen, Annette Malm Justad, Daniel J. Piette, Carol Bell, Ingar Skaug, Walter Qvam, and Anne Grethe Dalane.
The Board has established two sub-committees: an Audit Com-mittee, comprising Harald Norvik (Chairperson), Carol Bell, Daniel J. Piette, and Anne Grethe Dalane, and the Remuneration and Corpo-rate Governance Committee, consisting of Holly Van Deursen (Chair-person), Annette Malm Justad, Ingar Skaug, and Walter Qvam. The committees act as preparatory bodies for the Board of Directors and assist the Directors in exercising their responsibilities.
PGS also has a Nomination Committee, elected by the sharehold-ers, consisting of Roger O’Neil (Chairperson), Hanne Harlem, and C. Maury Devine.
PGS’ corporate governance principles are adopted by the Board of Directors. The Board periodically reviews these principles. State-ments of the corporate governance structure are described in more detail in the corporate governance section of this annual report. The Company’s Articles of association, in addition to full versions of the rules of procedures for the Board of Directors, the Audit Committee charter, the Remuneration and Corporate Governance Committee charter, the Nomination Committee charter, and PGS’ Code of Con-duct are available on the Company’s website www.pgs.com (follow the links: About us > Commitments > Corporate Governance).
Since 2004, PGS has maintained a compliance hotline operated by an external service provider in order to facilitate reporting of any concerns regarding inappropriate business conduct. The Company encourages use of the hotline by anyone who has concerns relating to compliance with laws and regulations, breaches of the code of conduct, fair treatment, or any other matter. Concerns can also be raised directly with the General Counsel or any Board member.
When PGS published the 2013 annual report the Company also made available a corporate responsibility report. The Company’s corporate responsibility is organized around four key areas — People, Environ-ment, Conduct, and Stakeholders.
Outlook PGS entered 2014 with good visibility, and a majority of its capacity has already been booked.
The first quarter of 2014 will be challenging, while market conditions for the second and third quarters of 2014 appear healthy, driven by good activity levels in the North Atlantic region. All in all, the Com-pany expects a modest growth in demand in 2014. The average PGS streamer capacity will continue to increase in 2014, contributing to the Company’s earnings capacity. Based on experience with the new Ramform Titan delivered in 2013, the Company is confident that the new capacity will be very accretive to Company earnings.
PGS has made significant investments in MultiClient, and the Com-pany was pleased to see record late sales in 2013. Going forward, PGS also aims at capitalizing on MultiClient investments made in 2013, when investment levels were at a record high.
The long-term prospects for the seismic industry are good. Energy companies continue their search for new hydrocarbon resources in regions featuring deeper waters, harsher environments, extreme reservoir depths, and complex geologies. PGS’ capabilities and solid position in the high-end market segment makes the Company an attractive contractor for oil companies worldwide.
PGS capabilities and capacity will increase further as the two last Ramform Titan-class vessels enter the fleet in 2015. The vessels fea-

PGS ANNUAL REPORT 2013
54PGSPERFORMANCE
ture the design strengths demonstrated by today’s Ramform fleet along with capability enhancements across a series of key technol-ogies. PGS is well positioned to differentiate itself from peers going forward. The Company’s services are competitive, it offers lead-ing-edge technologies, and its balance sheet is robust.
The Board emphasizes that forward looking statements contained in this report are based on various assumptions made by management, depend on factors beyond its control, and are subject to certain risks and uncertainties. Accordingly, actual results may differ materially from those contained in forward looking statements.
Pursuant to section 3-3a of the Norwegian Accounting Act, the Board confirms that the 2013 financial statements have been prepared based on the assumption of a going concern and that it believes that this assumption is appropriate.
Events After the end of the Reporting PeriodSubsequent to December 31, 2013, PGS took delivery of the second ves-sel in the Ramform Titan-class, the Ramform Atlas in late January 2014.
In March 2014 the Term Loan B was resized from $470.5 million to $400.0 million and the maturity extended to March 2021.
The Company also signed agreements for $305.0 million export credit financing relating to the two Ramform Titan-class new builds to be delivered in 2015.
Allocation of the Parent Company’s Gain for 2013The financial statements of the parent company, Petroleum Geo-Ser-vices ASA (“PGS ASA”), are prepared and presented in accordance with generally accepted accounting principles in Norway (“N GAAP”). PGS ASA reported a net income of NOK 702.2 million for 2013, com-pared to a net income of NOK 915.0 million in 2012. PGS ASA is a hold-ing company with no material operating activities. The positive net income for 2013 is primarily caused by dividends from subsidiaries.
Of the total 2013 net income of NOK 702,246,000 the Board proposes to allocate NOK 207,421,000 to other equity and NOK 494,825,000 as dividend to shareholders. Total shareholders’ equity in PGS ASA as of December 31, 2013 was NOK 11,021,711,000, corresponding to 52 per-cent of total assets. Other equity as of December 31, 2013 was NOK 7,989,607,000.
London, March 19, 2014Board of Directors
Petroleum Geo-Services ASA
Francis GugenChairperson
Anne Grethe Dalane
Harald Norvik Vice Chairperson
Annette Malm Justad
Carol Bell
Ingar Skaug
Daniel J. Piette
Walter Qvam
Holly Van Deursen
Jon Erik ReinhardsenChief Executive Officer

PGS ANNUAL REPORT 2013
55PGSPERFORMANCE
Today, the Board of Directors and the Chief Executive Officer reviewed and approved the Board of Directors’ report and the con-solidated and separate annual financial statements for PGS ASA, for the year ending and as of December 31, 2013.
PGS ASA’s consolidated financial statements have been prepared and presented in accordance with IFRSs and IFRICs as adopted by the EU and additional disclosure requirements in the Norwegian Accounting Act, and that should be used as of December 31, 2013. The separate financial statements for PGS ASA have been prepared in accordance with the Norwegian Accounting Act and Norwegian accounting stan-dards as of December 31, 2013. The Board of Directors report for the group and the parent company is in accordance with the requirements of the Norwegian Accounting Act and Norwegian accounting standard 16, as of December 31, 2013.
To the best of our knowledge:• The consolidated and separate annual financial statements for
2013 have been prepared in accordance with applicable accounting standards.
• The consolidated and separate annual financial statements give a true and fair view of the assets, liabilities, financial position, and result of operations as a whole as of December 31, 2013, for the group and the parent company.
• The Board of Directors’ report for the group and the parent com-pany include a true and fair review of:
• The development and performance of the business and the position of the group and the parent company.
• The principal risks and uncertainties the group and the parent company face.
London, March 19, 2014Board of Directors
Petroleum Geo-Services ASA
Francis GugenChairperson
Anne Grethe Dalane
Harald Norvik Vice Chairperson
Annette Malm Justad
Carol Bell
Ingar Skaug
Daniel J. Piette
Walter Qvam
Holly Van Deursen
Jon Erik ReinhardsenChief Executive Officer
RESPONSIBILITY STATEMENT

PGS Annual report 2013
56PETROLEUM GEO-SERVICESNOTES
FINANCIAL STATEMENTS

PGS Annual report 2013
57PETROLEUM GEO-SERVICESNOTES
PETROLEUM GEO-SERVICES CONSOLIDATED
Consolidated Statements of Operations 58Consolidated Statements of Comprehensive Income 59Consolidated Statements of Changes in Shareholders’ Equity 59Consolidated Statements of Financial Position 60Consolidated Statements of Cash Flows 61 NOTES TO THE FINANCIAL STATEMENTSNote 1 General information about the Company
and Basis of Presentation 62Note 2 Summary of Significant Accounting Policies 62Note 3 Critical Accounting Judgments,
Estimates and Assumptions 67Note 4 Cost of Sales 69Note 5 Segment and Geographic Information 69Note 6 Depreciation, Amortization and Impairments
of Long-Term Assets 71Note 7 Interest Expense 72Note 8 Other Financial Expense, Net 72Note 9 Income Taxes 72Note 10 Earnings per Share Information 74Note 11 Restricted Cash 75Note 12 Accrued Revenues and Other Receivables 75Note 13 Other Current Assets 75Note 14 Property and Equipment 76Note 15 MultiClient Library 77Note 16 Other Long-Term Assets 78Note 17 Goodwill 79Note 18 Other Intangible Assets 79Note 19 Debt and Guarantees 80Note 20 Financial Instruments 81Note 21 Leases, Contingent Liabilities and Provisions 85Note 22 Accrued Expenses 86Note 23 Other Long-Term Liabilities 87Note 24 Pension Obligations 87Note 25 Shareholder Information 90Note 26 Related Party Transactions 91Note 27 Employee Share Option and Restricted
Stock Unit programs 92Note 28 Salaries and Other Personnel Costs, Number of
Employees, and Remuneration to the Board of Directors, Executive Officers and Auditors 94
Note 29 Subsidiaries 98Note 30 Change in Accounting Policy 99Note 31 Subsequent Events 100
PETROLEUM GEO-SERVICES ASAPARENT COMPANY
Statements of Operations 101Statements of Financial Position 102Statements of Cash Flows 103
NOTES TO THE FINANCIAL STATEMENTSNote 1 Summary of Significant Accounting Policies 104Note 2 Intercompany Transactions 104Note 3 Interest Expense, Net 104Note 4 Other Financial Items, Net 105Note 5 Income Taxes 105Note 6 Property and Equipment 106Note 7 Shares in Subsidiaries and Intercompany Receivables 106Note 8 Other Current Assets 107Note 9 Restricted Cash 107Note 10 Shareholders’ Equity 107Note 11 Debt and Guarantees 108Note 12 Financial Instruments 109Note 13 Other Long-Term Liabilities 110Note 14 Pension Obligations 111Note 15 Commitments 112Note 16 Accrued Expenses and Other Short-Term Liabilities 112Note 17 Salaries and Other Personnel Costs, Number of
Employees, and Remuneration to the Board of Directors , Executive Officers and Auditors 112
Note 18 Change in Accounting Policy 113

PGS Annual report 2013
58PETROLEUM GEO-SERVICESFINANCIAL STATEMENTS
Year ended December 31,
(In millions of US dollars) Note 2013 2012 2011Revenues 5 1,501.6 1,518.3 1,253.3 Cost of sales 4 570.9 642.4 643.4 Research and development costs 38.7 38.3 24.3 Selling, general and administrative costs 63.1 61.4 50.8 Depreciation and amortization 6 432.5 484.3 397.9 Impairment (reversal) of long-term assets 6 15.0 (0.8) 2.6 Other operating (income) expense (0.7) (1.1) (4.4)Total operating expenses 1,119.5 1,224.5 1,114.6 Operating profit 5 382.1 293.8 138.7 Interest expense 7 (32.3) (37.8) (42.2)Other financial expense, net 8 (21.9) (27.5) (33.4)Income before income tax expense 327.9 228.5 63.1 Income tax expense 9 89.6 42.9 30.0 Income from continuing operations 238.3 185.5 33.1 Income from discontinued operations, net of tax - - 0.6 Net income to equity holders of PGS ASA 238.3 185.5 33.7
Earnings per share, to ordinary equity holders of PGS ASA: 10- Basic $1.11 $0.86 $0.16 - Diluted $1.10 $0.85 $0.15
Earnings per share from continuing operations,to ordinary equity holders of PGS ASA: 10- Basic $1.11 $0.86 $0.15 - Diluted $1.10 $0.85 $0.15
PETROLEUM GEO-SERVICES
CONSOLIDATED STATEMENTS OF OPERATIONS

PGS Annual report 2013
59PETROLEUM GEO-SERVICESFINANCIAL STATEMENTS
Year ended December 31,(In millions of US dollars) Note 2013 2012 2011
Restated(1) Restated(1)
Net income 238.3 185.5 33.7 Other comprehensive incomeActuarial gains (losses) on defined benefit pension plans 24, 30 (12.2) 25.4 (28.8)Income tax effect on actuarial gains and losses 9 2.5 (7.0) 7.2 Items that will not be reclassified to statements of operations (9.7) 18.4 (21.6)Revaluation of cash flow hedges
Gains (losses) arising during the period 0.1 (5.0) (12.1)Reclassification adjustments for losses included in the statements of operations 8.8 12.5 14.7
Deferred tax on cash flow hedges 9 (2.6) (2.1) (0.7)Revaluation of shares available-for-sale
Gains (losses) arising during the period (0.6) 1.0 (11.4)Reclassification adjustments for losses (gains) included in the statements of operations 1.4 (0.9) (1.4)
Other comprehensive income (loss) from joint venture and associated companies 0.6 (1.3) 0.2 Translation adjustments and other (0.1) 0.1 1.3 Items that may be subsequently reclassified to statements of operations 7.6 4.3 (9.4)Other comprehensive income (loss), net of tax (2.1) 22.7 (31.0)Total comprehensive income to equity holders of PGS ASA 236.2 208.2 2.7
(1) The financial information is restated from retrospectively adopting IAS19R, see note 30.
PETROLEUM GEO-SERVICES
CONSOLIDATED STATEMENTS OF COMPREHENSIVE INCOME
Attributable to equity holders of PGS ASA
(In millions of US dollars)
Paid incapital
Treasury
shares
Additionalpaid-incapital
Accumulated
earnings
Othercompre hensive
income Total
Non-controlling
interests
Share-holders’
equityBalance as of December 31, 2011 96.5 (0.6) 508.2 1,187.7 (20.3) 1,771.5 0.2 1,771.7 Effect of retrospectively adopting IAS 19R (1) - - - - (28.7) (28.7) - (28.7)Balance as of January 1, 2012 96.5 (0.6) 508.2 1,187.7 (49.0) 1,742.8 0.2 1,743.0 Total comprehensive income - - - 185.5 22.7 208.2 - 208.2 Dividend paid (2) - - - (41.5) - (41.5) (0.2) (41.7)Acquired treasury shares - (0.4) - (10.9) - (11.3) - (11.3)Transferred shares, conversion of convertible notes - - - 1.1 - 1.1 - 1.1 Employee benefit plans - 0.5 5.1 6.6 - 12.2 - 12.2 Balance as of December 31, 2012 96.5 (0.5) 513.3 1,328.5 (26.3) 1,911.5 - 1,911.5 Total comprehensive income - - - 238.3 (2.1) 236.2 - 236.2 Dividend paid (3) - - - (60.7) - (60.7) - (60.7)Acquired treasury shares - (1.0) - (28.2) - (29.2) - (29.2)Employee benefit plans - 0.1 6.2 1.5 - 7.8 - 7.8 Balance as of December 31, 2013 96.5 (1.4) 519.5 1,479.4 (28.4) 2,065.6 - 2,065.6
(1) The financial information is restated from retrospectively adopting IAS19R, see note 30.(2) NOK 1.10 per share was paid as ordinary dividend for 2011.(3) NOK 1.65 per share was paid as ordinary dividend for 2012.
PETROLEUM GEO-SERVICES
CONSOLIDATED STATEMENTS OF CHANGES IN SHAREHOLDERS’ EQUITY

PGS Annual report 2013
60PETROLEUM GEO-SERVICESFINANCIAL STATEMENTS
December 31,(In millions of US dollars) Note 2013 2012ASSETS Restated(1)
Current assetsCash and cash equivalents 20 263.8 390.3 Restricted cash 11 14.6 6.5 Accounts receivable 20 177.1 176.3 Accrued revenues and other receivables 12 183.3 153.6 Other current assets 13 124.5 110.1 Total current assets 763.3 836.8 Long-term assetsProperty and equipment 14 1,629.5 1,437.7 MultiClient library 15 576.9 382.3 Restricted cash 11 74.8 85.8 Deferred tax assets 9 110.0 169.9 Other long-term assets 16 85.0 80.4 Goodwill 17 139.9 139.9 Other intangible assets 18 164.9 142.8 Total long-term assets 2,781.0 2,438.8 Total assets 3,544.3 3,275.6
LIABILITIES AND SHAREHOLDERS' EQUITYCurrent liabilitiesShort-term debt and current portion of long-term debt 19, 20 10.8 1.0 Accounts payable 20 66.0 61.0 Accrued expenses 22 279.4 275.6 Income taxes payable 9 34.3 31.3 Total current liabilities 390.5 368.9 Long-term liabilitiesLong-term debt 19, 20 1,019.6 915.8 Deferred tax liabilities 9 6.2 8.5 Other long-term liabilities 23 62.4 70.9 Total long-term liabilities 1,088.2 995.2 Shareholders' equityCommon stock; par value NOK 3; issued and outstanding 217,799,997 shares 25 96.5 96.5 Treasury shares, par value 25 (1.4) (0.5)Additional paid-in capital 519.5 513.3 Total paid-in capital 614.6 609.3 Accumulated earnings 1,479.4 1,328.5 Other comprehensive income (28.4) (26.3)Total shareholders' equity 2,065.6 1,911.5 Total liabilities and shareholders' equity 3,544.3 3,275.6 (1) The financial information is restated from retrospectively adopting IAS19R, see note 30.
PETROLEUM GEO-SERVICES
CONSOLIDATED STATEMENTS OF FINANCIAL POSITION
London, March 19, 2014Board of Directors, Petroleum Geo-Services ASA
Francis GugenChairperson
Anne Grethe Dalane
Harald Norvik Vice Chairperson
Annette Malm Justad
Carol Bell
Ingar Skaug
Daniel J. Piette
Walter Qvam
Holly Van Deursen
Jon Erik ReinhardsenChief Executive Officer

PGS Annual report 2013
61PETROLEUM GEO-SERVICESFINANCIAL STATEMENTS
Year ended December 31,(In millions of US dollars) 2013 2012 2011Cash flows provided by operating activities:Net income to equity holders of PGS ASA 238.3 185.5 33.7 Adjustments to reconcile net income to net cash provided by operating activities: Depreciation, amortization and impairment of long-term assets 447.5 483.5 400.5 Share of loss in Joint venture and associated companies 14.3 4.2 12.4 Interest expense 32.3 37.8 42.2 Loss on sale and retirement of assets 8.6 11.2 1.6 Income taxes paid (33.8) (28.5) (20.2)Other items 3.5 7.3 5.7 (Increase) decrease in accounts receivable, accrued revenues and other receivables (30.7) (2.9) 39.4 Increase (decrease) in accounts payable 17.0 (8.0) (24.4)Change in other short-term items related to operating activities 34.7 57.0 (4.5)Change in other long-term items related to operating activities 43.6 5.8 (6.0)Net cash provided by operating activities 775.3 752.9 480.4
Cash flows used in investing activities:Investment in MultiClient library (373.0) (297.4) (203.9)Investment in property and equipment (438.5) (358.5) (299.1)Investment in other intangible assets (29.2) (28.0) (20.0)Investment in other current- and long-term assets (22.0) (0.1) (28.7)Proceeds from sale of other current- and long-term assets 2.6 31.4 13.1 (Increase) decrease in long-term restricted cash (0.6) (5.4) (33.3)Net cash used in investing activities (860.7) (658.0) (571.9)
Cash flows (used in) provided by financing activities:Proceeds, net of deferred loan cost, from issuance of long-term debt 114.6 156.3 288.0 Repayment of long-term debt (11.9) (190.6) (156.0)Purchase of treasury shares (29.2) (11.3) (17.4)Proceeds from sale of treasury shares 1.6 7.1 4.2 Dividend paid (60.9) (41.7) (1.2)Interest paid (55.3) (49.1) (33.9)Net cash (used in) provided by financing activities (41.1) (129.3) 83.7 Net decrease in cash and cash equivalents (126.5) (34.4) (7.9)Cash and cash equivalents as of January 1 390.3 424.7 432.6 Cash and cash equivalents as of December 31 263.8 390.3 424.7
PETROLEUM GEO-SERVICES
CONSOLIDATED STATEMENTS OF CASH FLOWS

PGS Annual report 2013
62PETROLEUM GEO-SERVICESNOTES
Note 1 – General information about the Company and Basis of Presentation
General informationPetroleum Geo-Services ASA (“PGS ASA”) is a public limited liability company established under the laws of the Kingdom of Norway in 1991. Unless stated otherwise, references herein to the “Company” and “PGS” refer to Petroleum Geo-Services ASA and its subsidiaries.
PGS is a technologically focused oilfield service company principally involved in providing geophysical services worldwide. PGS provides a broad range of seismic and reservoir services, including acquisition, imaging, interpretation and field evaluation. The Company’s headquarters are at Lilleaker, Norway.
Basis of presentationThe Company prepares its consolidated financial statements in accordance with International Financial Reporting Standards (“IFRS”) as adopted by the European Union (“EU”). IFRS as adopted by the EU differs in certain respects from IFRS as issued by the International Accounting Standards Board (“IASB”). References to IFRS hereafter should be construed as refer-ences to IFRS as adopted by the EU. The consolidated financial statements are prepared using the historical cost basis, except for available-for-sale financial assets and derivative financial instruments that have been mea-sured at fair value. The consolidated financial statements are presented in US Dollars (”$” or “dollars”) rounded to the nearest million, unless otherwise indicated.
The consolidated financial statements were authorized for issue by the Board of Directors on March 19, 2014.
Note 2 – Summary of Significant Accounting Policies
Adoption of new and revised policies and standards and interpretationsEffective January 1, 2013, the Company adopted revised IAS 19 Employee benefits (2011). The main amendments impacting the Company are: (i) removal of the corridor mechanism such that actuarial gains and losses are recognized immediately in other comprehensive income, and (ii) the expected returns on plan assets must equal the discount rate on the pro-jected benefit obligation. The standard is applied retrospectively including periods prior to January 1, 2013. See note 30 for presentation of adjustments made in the restated periods.
Effective January 1, 2013, the Company adopted IFRS 13 Fair value measure-ment which does not have a significant effect on the financial statements of the Company. Further, the Company adopted the amendments to IAS 1 Presentation of financial statements which changed the presentation of the consolidated statements of comprehensive income to group items that may be subsequently reclassified to statements of operations and those that will not be reclassified.
Consolidation SubsidiariesSubsidiaries are all entities (including special purpose entities) over which the Company has the power to govern the financial and operating policies generally accompanying a shareholding of a majority of the voting rights. Potential voting rights that are currently exercisable or convertible are con-sidered when assessing whether the Company controls another entity.
Investments in joint ventures and associated companiesA joint venture is a contractual arrangement whereby the Company under-
takes an economic activity that is subject to joint control and which strate-gic financial and operating policy decisions relating to the activities require the unanimous consent of the parties sharing control.
An associated company is an entity over which the Company has significant influence and that is neither a subsidiary nor an interest in a joint venture. Significant influence is the power to participate in the financial and oper-ating policy decisions of the investee but is not control or joint control over those policies, generally accompanying a shareholding of between 20% and 50% of the voting rights.
The Company accounts for its investments in jointly controlled entities and associates using the equity method of accounting. Under the equity method, investments are carried in the consolidated statements of finan-cial position at cost as adjusted for post-acquisition changes in the Com-pany’s share of the net assets (i.e. profit or loss and equity adjustments), less impairment in the value of individual investments. Losses in excess of the Company’s investment (which includes long-term interests that, in substance, form part of the Company’s net investment) are not recognized, unless the Company has incurred legal or constructive obligations or made payments on behalf of the investment. Profits and losses resulting from sales of assets between the Company and the investee are deferred to the extent of the interest in the investee, and recognized when the assets are sold to an independent party or otherwise expensed.
The Company periodically reviews its net investments to determine whether there is an indication of impairment. If such indication exists, the recover-able amount of the net investment is estimated in order to determine the extent of the impairment (if any).
Long term assets held-for-saleNon-current assets are classified as held-for-sale when their carrying amount will be recovered principally through sale rather than through continuing use. This condition is deemed to exist when the sale is highly probable, the asset is available for immediate sale in its present condition and management is committed to the sale. Such assets, which are typically vessels, are mea-sured at the lower of carrying amount and fair value less costs to sell and are presented separately in the consolidated statements of financial position.
Cash and cash equivalents and restricted cashCash and cash equivalents include demand deposits and all highly liquid finan-cial instruments purchased with original maturities of three months or less. Cash and cash equivalents that are restricted from the Company's use are presented separately in the consolidated statements of financial position and are classified as current or long-term depending on the nature of the restric-tions. Such restrictions primarily relate to the Brazilian tax claim deposit (note 11), employee tax withholdings, cash collateral for bid or performance bonds, certain health insurance and restricted deposits under contracts.
Foreign currency translation and transactionsThe financial statements of subsidiaries and associates whose functional cur-rency is not US dollar are translated using the current exchange rate. Assets and liabilities are translated at the rate of exchange in effect at the period end; share par value and paid-in capital are translated at historical exchange rates; and revenues and expenses are translated at the average rate of exchange in effect during the period. Translation adjustments are recorded as a separate component in the consolidated statements of other comprehensive income.
Foreign exchange gains and losses resulting from the settlement of foreign currency transactions and from the translation of realized and unrealized monetary assets and liabilities denominated in foreign currencies are rec-

PGS Annual report 2013
63PETROLEUM GEO-SERVICESNOTES
ognized in the consolidated statements of operations, except when recog-nized in the consolidated statements of other comprehensive income as qualifying cash flow hedges.
Intangible assetsIntangible assets acquired separately are measured on initial recognition at cost. Following initial recognition, intangible assets are carried at cost less accumulated amortization and accumulated impairment. The cost of internally generated intangible assets, other than those specified below, is expensed as incurred.
MultiClient libraryThe MultiClient library consists of seismic data surveys which are licensed to customers on a non-exclusive basis. Costs directly incurred in acquiring, imaging and otherwise completing seismic surveys are capitalized to the MultiClient library. Costs incurred while relocating or “steaming” a vessel or crew from one location to another and borrowing costs incurred during the acquisition and imaging phases of the survey are also capitalized to the MultiClient library.
A project remains in surveys-in-progress until imaging is complete, which may be some months or up to a year after data acquisition ends, at which point it is transferred to finished library.
The Company records the costs incurred on the MultiClient library in a man-ner consistent with its capital investment and operating decision analysis, which generally results in each component of the MultiClient library being recorded and evaluated separately. The cost of projects within the same political regime, with similar geological traits and that are marketed collec-tively are recorded and evaluated as a group by year of completion.
The Company amortizes each MultiClient library survey based on the ratio of survey cost to forecast sales. On an annual basis each survey is placed in an amortization category based on this ratio. Effective January 1, 2012, the Company refined its method for calculating amortization expense on the MultiClient library by introducing more amortization categoris or bands in order to more precisely calculate sales amortization expense. In previous years, four categories were applied with amortization rates of 90%, 75%, 60% or 45% of sales. From January 1, 2012, these categories range from 30-95% of sales amounts with 5% intervals, with a minimum of 45% for pre-funding. Each category includes surveys where the remaining unamor-tized cost as a percentage of remaining forecasted sales is less than or equal to the amortization rate applicable to each category. An integral component of amortization of the MultiClient library is the min-imum amortization policy. The book value of each survey (including groups of surveys) of the MultiClient library is reduced to a specified percentage by year-end, based on the age of the survey in relation to its year of comple-tion. This requirement is applied each year-end regardless of future sales estimates for the survey. The specified percentage generates the maximum permitted book value for each survey as the product of the percentage mul-tiplied by the original capitalized cost of the survey at the respective period end. Any additional or minimum amortization charges required are then determined through a comparison of the remaining book value to the maxi-mum permitted book value allowed for each survey.
The specified percentages used to determine the maximum book value of the MultiClient library surveys are summarized as follows:
Calendar year after project completion 5-year profile
3-year profile
Year 0 (a) 100% 100%Year 1 80% 66%Year 2 60% 33%Year 3 40% 0%Year 4 20%Year 5 0%(a) Represents the year in which the survey is classified as completed.
All surveys, except derivative products, have a 5-year profile starting in the year after project completion. Derivative processed products have a 3-year profile starting in the year after data delivery. Derivative products are mainly reprocessing which creates data that can be licensed separately from the original survey.
The Company classifies, as amortization expense in its consolidated state-ments of operations, impairment of individual MultiClient surveys that are based on changes in project specific expectations and that are not individ-ually material. The Company expects this additional, non-sales related, amortization expense to occur regularly because each individual survey is evaluated at least annually for impairment or when specific indicators exist. The Company classifies as impairment in its consolidated statements of operations write-downs related to fundamental changes in estimates affecting a larger part of the Company’s MultiClient library where the effects are material. See impairment of property, equipment and intangibles below.
Research and development costsResearch costs are expensed as incurred. An internally generated intangible asset arising from development (or from the development phase of an internal project) is recognized if, all of the following have been demonstrated: technical and commercial feasibility of completing the intangible asset so that it will be available for use or sale; the intention to complete the intangible asset and use or sell it; the ability to use or sell the intangible asset; how the intangible asset will generate probable future economic benefits; the availability of adequate technical, financial and other resources to complete the development and to use or sell the intangible asset; and the ability to measure reliably the expendi-ture attributable to the intangible asset during its development.
The amount initially recognized for internally generated intangible assets is the sum of the expenditure incurred from the date on which the intangible asset first satisfies the recognition criteria above. All other development costs are expensed as incurred.
Subsequent to initial recognition, internally generated intangible assets are reported at cost less accumulated amortization and accumulated impair-ment, on the same basis as intangible assets acquired separately. Capi-talized development costs are amortized on a straight-line basis over the estimated useful life of the asset.
Patents, licenses and technologyPatents, licenses and technology are stated at cost less accumulated amor-tization and accumulated impairment. Amortization is calculated on a straight-line basis over the estimated period of benefit, ranging from one to twenty years.

PGS Annual report 2013
64PETROLEUM GEO-SERVICESNOTES
Property and equipmentProperty and equipment are stated at cost, excluding the costs of the day-to-day servicing, less accumulated depreciation and impairment. Deprecia-tion is calculated on a straight-line basis over the useful life of the assets based on cost less estimated residual values. The estimated useful lives for property and equipment are as follows:
YearsSeismic vessels 25 - 30Seismic and operations equipment, incl. computer 3 - 15Buildings and related leasehold improvements 1 - 17Fixture, furniture, fittings and office computers 3 - 5Major overhauls 3 - 7.5
Subsequent expenditures and major inspections/overhauls are included in the asset’s carrying amount or recognized as a separate asset, as appropri-ate, only when it is probable that future economic benefits associated with the item will flow to the Company and the cost of the item can be measured reliably. The carrying amount of replaced asset components are derecog-nized. All other repairs and maintenance are charged to the consolidated statements of operations during the period in which they are incurred.
The assets’ residual values, useful lives and method of depreciation are reviewed, and adjusted if appropriate, at least at each year-end.
Assets under construction are carried at cost, less accumulated impairment. Cost includes borrowing costs incurred during construction in accordance with the Company’s accounting policy as stated below. Depreciation com-mences when the asset is ready for its intended use.
A component of property and equipment is derecognized upon disposal or when no future economic benefit is expected from its use or disposal. Gains and losses arising on de-recognition of assets (calculated as the dif-ference between the net disposal proceeds and the carrying amount of the asset) is included in the consolidated statements of operations in the year derecognized.
Significant spare parts are capitalized along with the assets to which they relate. Other spare parts, consumables and bunker inventory are classified as other current assets and stated at cost.
Steaming costsSteaming costs relate to relocating or “steaming” a vessel and its crew from one location to another. Steaming costs are capitalized or deferred to the extent the probable future economic inflows from the projects to which the vessel will steam are sufficient to recover the cost of the steam. The recov-erable steaming cost associated with MultiClient surveys is capitalized as a part of the MultiClient library (see above). The recoverable steaming costs associated with exclusive contract surveys is deferred and charged to the consolidated statements of operations based upon the percentage of com-pletion of the surveys.
Impairment of property, equipment and intangiblesTangible and intangible assets are reviewed to determine whether there is any indication of impairment. If such indication exists, or when annual impair-ment testing for an asset is required, the recoverable amount of the asset is estimated to determine the extent of the impairment, if any. An asset’s recoverable amount is the higher of (i) its fair value less cost to sell and (ii) its value in use. This determination is made for an individual asset, unless the asset does not generate cash inflows that are largely independent of those from other assets or groups of assets. In assessing value in use, the esti-mated future cash flows are discounted to their present value using a rate
that reflects current market assessments of the time value of money and the risks specific to the asset for which the estimates of future cash flows have not been adjusted. If the carrying amount of an asset (or cash generating unit) exceeds its recoverable amount, the carrying amount is reduced to its recoverable amount and the impairment is recognized immediately and pre-sented separately in the consolidated statements of operations.
Goodwill does not generate cash flows independently of other assets or groups of assets and is allocated to the cash-generating units expected to benefit from the synergies of the combination that gave rise to the goodwill.
Where a reasonable and consistent basis of allocation can be identified, cor-porate assets are also allocated to individual cash-generating units, or oth-erwise they are allocated to the smallest group of cash-generating units for which a reasonable and consistent allocation basis can be identified.
Goodwill (and the cash-generating unit to which goodwill is allocated) and intangible assets not yet available for use are evaluated for impairment annually, or whenever there is an indication that the asset may be impaired. If the recoverable amount of the cash generating unit is less than the carry-ing amount of the unit (including goodwill allocation), the impairment goes first to reduce the carrying amount of goodwill and then to reduce the car-rying amount of the other assets in the unit pro-rata, based on their relative carrying amounts.
Reversal of an impairment is recognized if the circumstances that gave rise to the impairment no longer exist. The carrying amount of the asset (cash-generating unit) is increased to the revised estimate of its recover-able amount. The increased carrying amount may not exceed the carrying amount that would have existed had no impairment been recognized for the asset (cash-generating unit). The reversal is presented separately in the consolidated statements of operations. Impairment recognized on goodwill is not subject to reversal.
Derivative financial instruments and hedging The Company uses derivative financial instruments to reduce its exposure related to fluctuations in foreign currency rates and interest rates. Deriva-tive instruments are recognized in the consolidated statements of financial position at their fair values. Realized and unrealized gains and losses attrib-utable to derivative instruments that do not qualify for hedge accounting are recognized as other financial items, net, as they arise.
In limited circumstances, the company may apply hedge accounting if it meets certain criteria at hedge inception and on an ongoing basis.
The Company accounts for hedges that meet these criteria as follows: Fair value hedges: Fair value hedges are used to hedge currency risk on equip-ment purchases denominated in currencies other than USD. The change in fair value of the hedging instrument is recognized in the consolidated state-ments of operations. The change in fair value of the hedged item attrib-utable to the risk hedged is recorded as part of the carrying value of the hedged item and is also recognized in the consolidated statements of oper-ations. When an unrecognized firm commitment is designated as a hedged item, the subsequent cumulative change in fair value of the firm commit-ment attributable to the hedged risk is recognized as an asset or liability with a corresponding gain or loss recognized in the consolidated statements of operations.
Cash flow hedges: Cash flow hedging is used to hedge interest rate risk. The effective portion of the gain or loss on the hedging instrument is recognized in the consolidated statements of other comprehensive income, while any

PGS Annual report 2013
65PETROLEUM GEO-SERVICESNOTES
ineffective portion is recognized immediately in the consolidated state-ments of operations. Amounts recorded in the consolidated statements of other comprehensive income are transferred to the consolidated state-ments of operations when the hedged transaction affects the consolidated statements of operations. If a cash flow hedge is discontinued, any subse-quent change in value is recorded directly to the consolidated statement of operations. The fair value of the derivatives at the time is retained in other comprehensive income and amortized as an adjustment to the effective interest rate over the term of highly probable expected cash flows.
Revenue recognitionThe Company recognizes revenue when (i) persuasive evidence of a sale arrangement exists, (ii) delivery has occurred or services have been ren-dered, (iii) the sales price is fixed or determinable and collection is reason-ably assured. The Company defers the unearned component of payments received from customers for which the revenue recognition requirements have not been met. Consideration is generally allocated among the sepa-rate units of accounting based on their estimated relative fair values when elements have stand alone value. If an element of a customer agreement does not have stand alone value, revenue is deferred and recognized over the period services are provided. The Company's revenue recognition policy is described in more detail below.
Sales of MultiClient library dataLate sales - The Company grants a license to a customer, which entitles the customer to have access to a specifically defined portion of the MultiClient data library. The Company recognizes revenue for late sales on completed sur-veys when the customer executes a valid license agreement and has received the underlying data or has the right to access the licensed portion of the data, the customer's license payment is fixed and determinable and collection is rea-sonably assured.
Volume sales agreements – The Company grants licenses to the customer for access to a specified number of blocks of MultiClient library within a defined geographical area. These licenses typically enable the customer to select and access the specific blocks over a period of time. Although the license fee is fixed and determinable in all cases, the payment terms of indi-vidual volume sales agreements vary, ranging from payment of the entire fee at the commencement of the agreement, to installment payments over a multi-year period, to payment of the license fee as the specific blocks are selected. Revenue recognition for volume sales agreements is based on a proportion of the total volume sales agreement revenue, measured as the customer executes a license for specific blocks and the customer has received the data or has been granted access to the data and collection is reasonably assured.
Pre-funding arrangements – The Company obtains funding from a limited number of customers before a seismic survey project is completed. In return for the pre-funding, the customer typically gains the ability to direct or influence the project specifications, to access data as it is being acquired and to pay discounted prices. The Company recognizes pre-funding revenue on surveys-in-progress as the services are performed on a proportional per-formance basis. Progress is measured in a manner generally consistent with the physical progress on the project, and revenue is recognized based on the ratio of the project's progress to date, provided that all other revenue recog-nition criteria are satisfied.
Proprietary sales/contract salesThe Company performs seismic services under contract for a specific cus-tomer, whereby the seismic data is owned by that customer. The Company recognizes proprietary/contract revenue as the services are performed and
become chargeable to the customer on a proportionate performance basis over the term of each contract. Progress is measured in a manner generally consistent with the physical progress of the project, and revenue is recog-nized based on the ratio of the project's progress to date, provided that all other revenue recognition criteria are satisfied.
Other servicesRevenue from other services is recognized as the services are performed, provided all other recognition criteria are satisfied.
Income taxesIncome tax expense is comprised of the sum of current tax expense (or ben-efit) plus the change in deferred tax liabilities and assets during the period, except for current and deferred income tax relating to items recognized in the consolidated statements of other comprehensive income, in which case the tax is also recognized in the consolidated statements of other compre-hensive income.
Current tax assets and liabilities are measured at the amount expected to be recovered from or paid to the taxation authorities. The tax rates and tax laws used to compute the amount are those that are enacted or substan-tively enacted by the end of the reporting period.
Deferred tax assets and liabilities are calculated using the liability method for all temporary differences between the carrying amount of assets and liabilities in the consolidated financial statements and for tax purposes, including tax losses carried forward. A deferred tax liability is not recognized on temporary differences arising from the initial recognition of goodwill.
Deferred income tax is recognized on temporary differences arising on investments in subsidiaries, associates and interests in joint ventures, except where the timing of the reversal of the temporary differences can be controlled by the Company and it is probable that the temporary differences will not reverse in the foreseeable future.
The Company recognizes deductions/benefits from uncertain tax positions when it is probable that the tax position will ultimately be sustained. The carrying amount of deferred tax assets is reviewed at the end of each reporting period and reduced to the extent it is no longer probable that esti-mated future taxable profit will be sufficient to recover all or part of the deferred tax asset. Unrecognized deferred tax assets are reassessed at the end of each reporting period and are recognized to the extent it has become probable that estimated future taxable profit is sufficient to recover the deferred tax asset. The probability assessment is based on Management’s judgment and estimates of future taxable income, including the estimated effect of tax planning opportunities (see separate note describing account-ing estimates below).
Deferred tax assets and liabilities are measured at the tax rates that are expected to apply in the estimated year of realization or settlement, based on tax rates (and tax laws) that have been enacted or substantively enacted by the end of the reporting period.
Deferred tax assets and deferred tax liabilities are offset, if a legally enforceable right exists to set off current tax assets against current tax lia-bilities and the deferred taxes are related to the same taxable entity and the same taxation authority. Deferred tax assets and liabilities are classified as long-term in the consolidated statements of financial position.

PGS Annual report 2013
66PETROLEUM GEO-SERVICESNOTES
Employee benefitsPension obligationsThe Company operates various pension schemes. The schemes are funded through payments to insurance companies or trustee-administered funds. The Company has both defined benefit and defined contribution plans. A defined benefit plan is a pension plan which defines an amount of pension benefit that an employee will receive on retirement, dependent on factors such as age, years of service and compensation.
The liability recognized for defined benefit pension plans is the present value of the defined benefit obligation at the end of the reporting period, adjusted for past service costs and reduced by the fair value of plan assets. The defined benefit obligation is calculated annually by independent actuaries using the projected unit credit method. The present value of the defined benefit obliga-tion is determined by discounting the estimated future cash outflows using estimated interest rates of high-quality corporate bonds that are denomi-nated in the currency in which the benefits will be paid, and that have terms to maturity approximating the terms of the related pension liability.
Past service costs, which is an increase in the present value of the defined benefit obligation for employee services in prior periods due to current period changes to a defined benefit plan, are recognized immediately in the consolidated statements of operations unless the changes to the defined benefit plan are conditional on the employees remaining in service for a specified period of time (the vesting period). In this case, the past service costs are recognized on a straight-line basis over the vesting period.
Actuarial gains and losses due to current period changes in assumptions applied are recognized immediately in other comprehensive income.
For defined contribution plans, the Company pays contributions to privately administered pension insurance plans on a mandatory, contractual or vol-untary basis. The Company has no further payment obligations once the contributions have been paid. The contributions are recognized as employee benefit expense when due. Prepaid contributions are recognized as an asset to the extent that a cash refund or a reduction in the future payments is available.
Bonus plansThe Company recognizes a provision where contractually obliged or where there is a past practice that has created a constructive obligation.
Share-based paymentsShare options are measured at the fair value of the equity instrument at the grant date. Fair value is measured using the Black-Scholes pricing model. The expected life used in the model is based on management’s best esti-mate and considers the effects of non-transferability, exercise restrictions and behavioral considerations. Social security tax on share options is based on the intrinsic value as of the end of the reporting period and is recorded as a liability over the option period.
Restricted Stock Unit Plans are measured at the grant date using the cur-rent market value reduced by expected dividends paid before the vesting date, which is then further discounted.
Interest bearing debt and borrowingsInterest bearing loans are recognized initially at fair value less transaction costs. Subsequent to initial recognition, interest bearing loans are mea-sured at amortized cost using the effective interest method. Gains and losses are recognized in the consolidated statements of operations when the liabilities are derecognized as well as through the amortization process.
Financial assets and liabilitiesFinancial assets and liabilities are recognized when the Company becomes party to the contractual obligations of the financial instrument and are ini-tially recognized at fair value.
Financial assets and liabilities are classified into categories as follows:
Financial assets and liabilities measured at fair value through the consoli-dated statements of operationsThis category is comprised of financial assets and liabilities held-for-trad-ing and financial assets and liabilities designated upon initial recognition as measured at fair value through the consolidated statements of operations.
Financial assets and liabilities are classified as held-for-trading if they are acquired for the purpose of selling in the near term. Derivatives are classified as held-for-trading unless designated as effective hedging instruments.
After initial recognition, financial assets and liabilities in this category are measured at fair value with unrealized gains and losses recognized through the consolidated statements of operations.
Financial assets and liabilities measured at amortized costThis category is comprised of loans and receivables and other non-derivative financial assets and liabilities with fixed or determinable payments that are not quoted in an active market. These financial assets and liabilities are ini-tially recognized at fair value, with additions for directly attributable trans-action costs. After initial measurement, they are carried at amortized cost using the effective interest method less any allowance for impairment.
Financial assets and liabilities measured at fair value through the consoli-dated statements of other comprehensive income This category is comprised of financial assets and liabilities that are non-de-rivatives and are either designated as available-for-sale or not classified in any of the other categories. After initial measurement, they are measured at fair value with unrealized gains or losses recognized in the consolidated statements of other comprehensive income. When the asset or liability is disposed of, the cumulative gain or loss previously recorded in the consol-idated statements of other comprehensive income is reversed and recog-nized in the consolidated statements of operations.
The fair value of financial instruments that are traded in active markets at each reporting date is determined by reference to quoted market prices or dealer price quotations, without any deduction for transaction costs. For financial instruments not traded in an active market, the fair value is determined using appropriate valuation techniques. Such techniques may include using recent arm’s length market’s transaction, reference to the current fair value of other instruments that are substantially the same, discounted cash flow analysis or other valuation models. An analysis of fair values of financial instruments and further details as to how they are measured are provided in note 20.
The Company assesses at the end of each reporting period whether there is objective evidence that a financial asset or a group of financial assets is impaired. In the case of equity instruments designated as available-for-sale, a significant or prolonged decline in the fair value of the instrument below its cost is an indication of impairment. If such evidence exists for available-for-sale financial assets, the cumulative loss – measured as the difference between the acquisition cost and the current fair value, less any previously recognized impairment – is reversed through the consoli-dated statements of other comprehensive income and recognized in the consolidated statements of operations. Impairments recognized in the consolidated statements of operations on equity instruments are not
PGS Annual report 2013
67PETROLEUM GEO-SERVICESNOTES
reversed. Impairment testing of trade receivables is described in note 20 “Credit risk”.
Derivatives embedded in other financial instruments or other host contracts are treated as separate derivatives when their risks and characteristics are not closely related to those of host contracts and the host contracts are not carried at fair value through the consolidated statements of operations.
Earnings per shareBasic earnings per share is calculated by dividing the profit attributable to equity holders of the Company by the weighted average number of ordinary shares outstanding during the year, excluding ordinary shares purchased by the Company and held as treasury shares. Diluted earnings per share is cal-culated by adjusting the weighted average number of ordinary shares out-standing to assume conversion of all dilutive potential ordinary shares. For diluted earnings per share, dilutive potential ordinary shares are determined independently for each period presented. When the number of ordinary shares outstanding changes (e.g. share split) the weighted average number of ordinary shares outstanding during all periods presented is adjusted ret-rospectively. Basic and diluted earnings per share are presented separately for continuing and discontinued operations. The dilutive effect of outstand-ing options is reflected as additional share dilution in the computation of earnings per share.
Standards issued but not yet effective (which the Company has not early adopted) Unless specified, the issued standards are not expected to have a signifi-cant effect on the financial statements of the Company.
IFRS 10 Consolidated Financial StatementsIFRS 10 replaces the portion of IAS 27 Consolidated and Separate Financial Statements that addresses the accounting for consolidated financial state-ments. IFRS 10 establishes a single control model that applies to all entities including special purpose entities. The changes introduced by IFRS 10 will require management to exercise significant judgment to determine which entities are controlled, and therefore, are required to be consolidated by a parent, compared with the requirements that were in IAS 27. This stan-dard is approved by the EU effective from January 1, 2014. The Company will implement IFRS 10 from January 1, 2014.
IFRS 11 Joint Arrangements IFRS 11 replaces IAS 31 Interests in Joint Ventures and SIC-13 Jointly-con-trolled Entities — Non-monetary Contributions by Ventures. IFRS 11 removes the option to account for jointly controlled entities (JCEs) using proportion-ate consolidation. Instead, JCEs that meet the definition of a joint venture must be accounted for using the equity method. This standard is approved by the EU effective from January 1, 2014. The Company will implement IFRS 11 from January 1, 2014.
IFRS 12 Disclosure of Interests in Other Entities IFRS 12 includes all of the disclosures that were previously in IAS 27 related to consolidated financial statements, as well as all of the disclosures that were previously included in IAS 31 and IAS 28. These disclosures relate to an entity’s interests in subsidiaries, joint arrangements, associates and struc-tured entities. A number of new disclosures are also required. This stan-dard is approved by the EU effective from 1 January 2014. The Company will implement IFRS 12 from January 1, 2014.
IAS 27 Consolidated and Separate Financial Statements (revised)As a consequence of the issuance of IFRS 10, 11 and 12, the IASB issued amended and re-titled IAS 27 Separate Financial Statements. What
remains in IAS 27 is limited to accounting for subsidiaries, jointly controlled entities, and associates in separate financial statements. IAS 27 as revised is approved by the EU effective from January 1, 2014.
IAS 28 Investments in Associates and Joint Ventures (revised)As a consequence of the new IFRS 11 and IFRS 12, IAS 28 has been renamed IAS 28 Investments in Associates and Joint Ventures, and describes the application of the equity method to investments in joint ventures in addi-tion to associates. IAS 28 as revised is approved by the EU effective from January 1, 2014.
Note 3 – Critical Accounting Judgments, Estimates and Assumptions
Critical judgmentsThe preparation of financial statements in accordance with IFRS requires management to make estimates, assumptions and judgments that affect the reported amounts of assets and liabilities and the disclosure of contin-gent liabilities. In many circumstances, the ultimate outcome related to the estimates, assumptions and judgments may not be known for several years after the preparation of the financial statements. Actual amounts may dif-fer materially from these estimates due to changes in general economic conditions, changes in laws and regulations, changes in future operating plans and the inherent imprecision associated with estimates.
Estimation uncertainty and assumptionsThe key assumptions concerning the future and other key sources of esti-mation uncertainty at the end of the reporting period that have a significant risk of causing a material adjustment to the carrying amounts of assets and liabilities within the next financial year are discussed below.
Deferred tax assetsDeferred tax assets are recognized for all unused tax losses to the extent it is probable that future taxable profit will be available against which the losses can be utilized. Significant management judgment is required to estimate the amount of deferred tax assets that can be recognized, based upon the likely timing and level of future taxable profit. The estimates of projected future taxable profit are based on a number of factors and assumptions, many of which are subjective and outside of the Company’s control. Accordingly, these estimates may differ significantly from year to year, and the amount ultimately realized may differ from that which has been recognized in the consolidated statements of financial position.
Forecast sales of MultiClient libraryAt least annually, management forecasts future sales for each MultiCli-ent library survey for purposes of determining the amortization rate and amount of impairment, if any. In forecasting sales, management considers past experience, market developments, general prospects for hydrocar-bons in the area, political risk, likelihood and timing of exploration licensing rounds, existence of competitor data sets and general economic conditions. Because of the inherent difficulty in forecasting sales and future develop-ments, it is possible that the amortization rates could deviate significantly from year to year. In addition, future revenues on a survey may not be suf-ficient to cover the existing carrying value. To the extent the actual reve-nues achieved prove to be less than forecasted, future periods will reflect lower profitability due to increased amortization rates and/or impairments of MultiClient library surveys. The minimum amortization policy is designed to reduce the risk an increase in future years' amortization rates or impair-ment as result of unfavorable variances in revenues ultimately achieved compared to forecast.

PGS Annual report 2013
68PETROLEUM GEO-SERVICESNOTES
A 10% reduction in the sales forecast for all surveys with a net book value as of December 31, 2013 would have resulted in a further sales related impair-ment of $19 million in 2013 and 5 percentage point higher composite sales amortization rate for those surveys in future periods.
Property and equipment Depreciation and amortization is based on management estimates of the future economic benefits and expected useful lives of property and equip-ment. These estimates may change due to changes in market conditions including competition, technological development, use of the assets and strategic considerations.
Impairment of property and equipmentProperty and equipment are regularly reviewed for impairment, whenever events or changes in circumstances indicate that the carrying amount of the asset may not be recoverable. Future cash flows expected to be generated from the use and eventual disposal of the asset are estimated to determine the amount of impairment, if any.
Estimating future cash flows requires management to make judgments regarding long-term forecasts of future revenues and costs related to the assets subject to review. These forecasts are subject to uncertainty as they require assumptions about demand for our products and services, future market conditions and technological developments. Significant and unanticipated changes in these assumptions could result in a provision for impairment in a future period. Given the nature of these evaluations and their application to specific assets and specific times, it is not possible to reasonably quantify the impact of changes in these assumptions.
Forecast future revenues from services and products related to intangible assets At least annually, management forecasts future cash flows from services and products related to intangible assets, hereof $76 million relating to Towed EM activity. In forecasting cash flow, management considers the future market demand, extent of completion, technological and engineering requirements and the likelihood and timing of completing the service or product offering. Because of the inherent difficulty in estimating these factors, it is possible that future revenues and cash flows from these activities will not be suffi-cient to recover the existing carrying value of the related assets.
A 20% reduction in estimated gross future revenues from Towed EM activity without any adjustments to estimated future costs would result in an impairment of $25 million as of December 31, 2013.
Provision for contingencies, claims and tax litigationsThe Company records accruals for contingencies, claims and other uncertain liabilities, including possible tax litigation, when it is more likely than not that a liability has been incurred and the amount can be reasonably esti-mated. These accruals are adjusted periodically as assessments change or new or additional information becomes available. In estimating the likeli-hood of an unfavorable outcome, management evaluates the specific facts and circumstances in light of the related laws and regulations; advice from external counsel; and the outcome of similar cases, if any. Because of the inherent uncertainty in estimating the future outcome of such matters, it is possible that some of these matters will ultimately result in the Company incurring a material liability. As of December 31, 2013 there exists contingent tax claims and other contingent liabilities whose aggregate estimated max-imum exposure is approximately $300 million and for which management considers it more likely than not that the contingencies will be resolved in its favor, no provision is recognized for any portion of the exposure.

PGS Annual report 2013
69PETROLEUM GEO-SERVICESNOTES
Note 4 – Cost of Sales Year ended December 31,
(In millions of US dollars) 2013 2012 2011Vessel operating cost 616.9 574.3 556.9 Sales, project and project management cost 153.6 167.1 133.8 Imaging (previously "Data processing"), Geoscience and Engineering cost 149.9 137.3 135.2 Other 24.9 55.1 21.4 Total cash cost of sales 945.3 933.8 847.3 Less amount capitalized to MultiClient library 374.4 291.4 203.9 Net cost of sales 570.9 642.4 643.4
Note 5 – Segment and Geographic Information
Executive management regularly evaluates the operating segments operational and financial performance. The financial information disclosed is consis-tent with that used by executive management in controlling the Company’s business, for making strategic decisions and for allocating resources. The Company’s operating segments are managed separately and represent strategic business product lines. The segments serve a similar worldwide market. Customers for both segments are primarily composed of the same major multi-national, independent and national or state-owned oil companies.
Marine Contract and MultiClient segments satisfy the aggregation criteria under IFRS and accordingly, are presented as a combined Marine reporting seg-ment. Corporate overhead and significant charges that do not relate specifically to the operations of a particular segment are presented as Other. Inter-seg-ment sales are at prices that approximate market values. Financial items, income tax expense and liabilities are not included in the measure of segment performance.
Year ended December 31, 2013
(In millions of US dollars) Marine OtherTotal continuing
operationsRevenues by service lines:Marine Contract 677.5 - 677.5 MultiClient pre-funding 360.5 - 360.5 MultiClient late sales 311.3 - 311.3 Imaging (previously "Data processing") 122.7 - 122.7 Other 29.3 0.3 29.6 Total revenues 1,501.3 0.3 1,501.6 Operating costs (a) (660.4) (12.3) (672.7)EBITDA 840.9 (12.0) 828.9 Other operating income 0.7 - 0.7 Impairments of long-term assets (note 6) (15.0) - (15.0)Depreciation and amortization (note 6) (123.9) (6.8) (130.7)Amortization of MultiClient library (note 6) (301.8) - (301.8)Operating profit (loss) 400.9 (18.8) 382.1
Statement of financial position items and cash investments for the yearInvestments in joint venture and associated companies 48.1 - 48.1 Total assets 3,161.6 382.7 3,544.3 Cash used for investments in long-term assets (b) 822.0 17.4 839.4
(a) Operating costs include cost of sales, expensed research and development costs, and selling, general and administrative costs(b) Consist of cash investments in MultiClient library, capital expenditures and investments in other intangible assets

PGS Annual report 2013
70PETROLEUM GEO-SERVICESNOTES
Year ended December 31, 2012
(In millions of US dollars) Marine OtherTotal continuing
operationsRevenues by service lines:Marine Contract 623.5 - 623.5 MultiClient pre-funding 461.3 - 461.3 MultiClient late sales 266.8 - 266.8 Imaging (previously "Data processing") 124.4 - 124.4 Other 42.0 0.3 42.3 Total revenues 1,518.0 0.3 1,518.3 Operating costs (a) (726.4) (15.7) (742.1)EBITDA 791.6 (15.4) 776.2 Other operating income 1.1 - 1.1 Impairments of long-term assets (note 6) 0.8 - 0.8 Depreciation and amortization (note 6) (134.3) (5.3) (139.6)Amortization of MultiClient library (note 6) (344.7) - (344.7)Operating profit (loss) 314.5 (20.7) 293.8
Statement of financial position items and cash investments for the yearInvestments in joint venture and associated companies 52.2 (13.7) 38.5 Total assets 2,705.7 569.9 3,275.6 Cash used for investments in long-term assets (b) 686.9 6.6 693.5
(a) Operating costs include cost of sales, expensed research and development costs, and selling, general and administrative costs(b) Consist of cash investments in MultiClient library, capital expenditures and investments in other intangible assets
Year ended December 31, 2011
(In millions of US dollars) Marine OtherTotal continuing
operationsRevenues by service lines:Marine Contract 627.0 - 627.0 MultiClient pre-funding 223.5 - 223.5 MultiClient late sales 278.3 - 278.3 Imaging (previously "Data processing") 110.0 - 110.0 Other 14.2 0.3 14.5 Total revenues 1,253.0 0.3 1,253.3 Operating costs (a) (707.2) (11.3) (718.5)EBITDA 545.8 (11.0) 534.8 Other operating income 4.4 - 4.4 Impairments of long-term assets (note 6) (2.6) - (2.6)Depreciation and amortization (note 6) (155.3) (5.6) (160.9)Amortization of MultiClient library (note 6) (237.0) - (237.0)Operating profit (loss) 155.3 (16.6) 138.7
Statement of financial position items and cash investments for the yearInvestments in joint venture and associated companies 45.1 3.4 48.5 Total assets 2,507.8 629.4 3,137.2 Cash used for investments in long-term assets (b) 500.0 3.8 503.8
(a) Operating costs include cost of sales, expensed research and development costs, and selling, general and administrative costs(b) Consist of cash investments in MultiClient library, capital expenditures and investments in other intangible assets
Because the Company provides services worldwide to the oil and gas industry, a substantial portion of the property and equipment is mobile, and their respective locations at the end of each period (as listed in the tables below together with the MultiClient library) are not necessarily indicative of the earn-ings generated by the related property and equipment during the period. Property and equipment is classified based upon location of ownership. Goodwill is classified in the same geographic area as the underlying acquired assets. The geographic classification of statements of operations items is based upon location of performance or, in the case of MultiClient seismic data sales, the geographic area covered by the data being licensed.

PGS Annual report 2013
71PETROLEUM GEO-SERVICESNOTES
Revenues external customers Year ended December 31,(In millions of US dollars) 2013 2012 2011Americas (excluding Brazil and Falkland Islands) 259.7 165.1 185.1 Falkland Islands 134.1 11.7 - Brazil 133.2 181.3 173.3 UK 132.4 163.6 102.2 Norway 200.4 174.5 169.9 Asia/Pacific 172.0 284.0 252.2 Africa (excluding Angola) 164.5 170.0 153.0 Angola 179.1 301.4 82.7 Middle East/Other 126.2 66.7 134.9 Total 1,501.6 1,518.3 1,253.3
Revenues, including inter-area Year ended December 31, (In millions of US dollars) 2013 2012 2011 Americas (excluding Brazil and Falkland Islands) 262.6 165.7 187.0 Falkland Islands 134.1 11.7 - Brazil 133.2 181.3 173.3 UK 165.3 188.8 115.6 Norway 204.0 180.5 173.9 Asia/Pacific 172.0 284.2 252.2 Africa (excluding Angola) 176.8 179.2 157.2 Angola 179.1 301.4 82.7 Middle East/Other 126.2 66.7 135.5 Elimination inter-area revenues (51.7) (41.2) (24.1)Total 1,501.6 1,518.3 1,253.3
Total non-current assets (a) December 31, (In millions of US dollars) 2013 2012 Americas (excluding Brazil) 174.8 125.4 Brazil 64.1 42.1 UK 342.7 373.2 Norway 1,220.5 908.1 Asia/Pacific (excluding Singapore) 101.9 103.0 Singapore 480.7 474.4 Africa 70.3 64.5 Middle East/Other 104.3 50.5 Total 2,559.3 2,141.2
(a) Consists of Property and equipment, MultiClient library, Investments in joint venture and associated companies (note 16), Goodwill and Other intangible assets.
In 2013, aggregate revenues from the two largest customers accounted for 11.0% and 9.0% of the Company’s consolidated revenues, compared to 13.8% and 10.3% in 2012 and 11.0% and 7.0% in 2011, respectively (excluding discontinued operations).
Note 6 – Depreciation, Amortization and Impairments of Long-Term Assets
Depreciation and amortization consist of the following:
Year ended December 31,(In millions of US dollars) 2013 2012 2011Gross depreciation and amortization (243.9) (222.5) (210.9)Depreciation capitalized and deferred, net 113.2 82.9 50.0 Amortization of MultiClient library (note 15) (301.8) (344.7) (237.0)Net depreciation and amortization expense (432.5) (484.3) (397.9)

PGS Annual report 2013
72PETROLEUM GEO-SERVICESNOTES
Impairments and reversal of impairments of long-term assets consist of the following:Year ended December 31,
(In millions of US dollars) 2013 2012 2011Impairment of property and equipment (note 14) (15.0) (0.9) (4.6)Reversal of impairment of property and equipment (note 14) - 1.7 2.0 Net impairment (15.0) 0.8 (2.6)
Note 7 – Interest Expense
Interest expense consists of the following:
Year ended December 31,(In millions of US dollars) 2013 2012 2011Interest expense, gross (57.6) (51.4) (50.5)Interest capitalized to the MultiClient library (note 15) 10.5 5.6 6.4 Interest capitalized to construction in progress (note 14) 14.8 8.0 1.9 Total (32.3) (37.8) (42.2)
The average interest rate used to determine the amount of interest expense eligible for capitalization was 5.5%, 5.9% and 6.1% for the years ended Decem-ber 31, 2013, 2012 and 2011, respectively.
Note 8 – Other Financial Expense, Net
Other financial expense, net consists of the following:
Year ended December 31,(In millions of US dollars) 2013 2012 2011Interest income 1.6 3.6 7.6 Loss from joint venture and associated companies (note 16) (14.3) (4.2) (12.4)Loss on repurchase of convertible notes (note 19) - (7.5) (5.7)Fair value adjustments to financial instruments - (6.7) (13.0)Currency exchange loss (7.6) (7.3) (10.3)Other (1.6) (5.4) 0.4 Total (21.9) (27.5) (33.4)
Note 9 – Income Taxes
Net income tax expense from continuing operations consists of the following:
Year ended December 31,(In millions of US dollars) 2013 2012 2011Current taxes (a) 32.2 43.9 1.2 Deferred taxes 57.4 (1.0) 28.8 Total income tax expense 89.6 42.9 30.0
(a) Current tax mainly relates to withholding taxes in countries of operation.
The deferred tax asset recognized in other comprehensive income is as follows:
December 31,(In millions of US dollars) 2013 2012Pensions (note 24, 30) (4.1) (1.6)Cash flow hedges (note 20) (2.4) (5.0)Total recognized in other comprehensive income (6.5) (6.6)

PGS Annual report 2013
73PETROLEUM GEO-SERVICESNOTES
The income tax expense differs from the amounts computed when applying the Norwegian statutory tax rate to income before income taxes as a result of the following:
Year ended December 31,(In millions of US dollars) 2013 2012 2011Income before income tax expense from continuing operations 327.9 228.5 63.1 Norwegian statutory rate 28% 28% 28%Provision for income taxes at statutory rate 91.8 64.0 17.7 Increase (reduction) in income taxes from:Effect of tax rates other than statutory tax rate in Norway (1.1) (3.5) (1.2)Tax exempt income within tonnage tax regimes (a) (34.2) (29.1) 1.1 Change in assessment of recoverability of prepaid income taxes in Brazil - - (7.9)Foreign taxes not deductible or subject to credit 7.4 5.5 4.3 Change in tax rate (b) 4.1 1.1 1.5 Currency effects (c) 14.7 (15.9) 1.0 Changes in tax contingencies recognized as tax expense (benefit) (4.0) (1.9) (5.4)Changes in unrecognized deferred tax assets 6.7 22.3 7.1 Prior period adjustments (2.4) 3.9 7.4 Other permanent items 6.6 (3.5) 4.3 Income tax expense 89.6 42.9 30.0
Notes to selected items in the preceding table:
(a) The Company's vessel operations are mainly within the Norwegian Tonnage Tax regime under which operating profit is tax exempt.
(b) The Norwegian corporate income tax rate was reduced from 28% to 27% effective from January 1, 2014. As a result, a reduction in deferred tax assets of $3.8 million was recognized in 2013.
(c) Currency effects primarily relate to translating tax positions in local currency to US dollar functional currency.
The tax effects of the Company’s temporary differences are as follows:
December 31,(In millions of US dollars) 2013 2012Deferred tax assetsMultiClient library (33.7) (31.8)Derivatives (2.0) (4.3)Employee benefits (20.5) (21.7)Tax loss carry-forwards (171.0) (222.3)Tax credits (22.0) (19.5)Unrealized exchange loss (16.8) - Other (21.2) (29.2)Deferred tax assets, gross (287.2) (328.8)
Deferred tax liabilitiesProperty and equipment 38.3 32.0 Intangible assets 27.1 24.6 Current accruals/liabilities 9.0 10.4 Deferred taxable gain/revenue 9.8 4.4 Other 1.7 2.1 Deferred tax liabilities, gross 85.9 73.5
Deferred tax assets, net (201.3) (255.3)Deferred tax assets not recognized in the consolidated statements of financial position 97.5 93.9 Net recognized deferred tax assets (103.8) (161.4)

PGS Annual report 2013
74PETROLEUM GEO-SERVICESNOTES
Net deferred tax (assets) in the consolidated statements of financial position are as follows:
December 31,(In millions of US dollars) 2013 2012Deferred tax assets (110.0) (169.9)Deferred tax liabilities 6.2 8.5 Income tax assets, gross (103.8) (161.4)
Deferred tax assets specified by jurisdiction, both recognized and unrecognized, and tax losses including expiration periods as of December 31, 2013 are as follows:
(In millions of US dollars) Tax losses Expiry datesRecognized deferred
tax assetsNot recognized
deferred tax assetsBrazil 63.1 None - 40.5 Norway 288.0 None 88.5 10.9 Singapore 192.5 None 0.3 - UK 82.1 None 13.4 20.0 Other 77.7 2015 - No expiry 7.8 26.1 Total 703.4 110.0 97.5
It is the Company's current view that unremitted earnings from international operations are expected to be reinvested indefinitely, and as a result, no Nor-wegian taxes have been provided for unremitted earnings.
With its multi-national operations, the Company is subject to taxation in many jurisdictions around the world with increasingly complex tax laws. The Com-pany has possible issues in several jurisdictions that could eventually make it liable for material amounts of taxes relating to prior years.
Total accrued tax contingency liabilities is recognized as follows:
December 31,(In millions of US dollars) 2013 2012Income tax payable - 0.8 Other long-term liabilities 2.1 5.3 Total accrued tax contingency liabilities 2.1 6.1
Brazil tax audits 2006-2008 In May 2012, the Company received two tax assessments for 2008 from the federal tax authorities in Brazil claiming approximately $66 million including interests and penalties. One assessment asserts that seismic vessels do not meet the definition of a vessel and therefore the charters into Brazil are sub-ject to a 15% withholding tax instead of 0%. The second assessment levies a 10% tax (“CIDE”) on the same charters. In 2012, the first administrative appeal level ruled in favor of PGS with respect to the withholding tax claim but upheld the CIDE assessment. On July 17, 2013, the second administrative appeal level ruled in favor of PGS with respect to the withholding tax claim. The ruling has been appealed to the third and last administrative level. The CIDE case is still pending before the second level. Because the Company considers it more likely than not that this contingency will be resolved in its favor, no provision is recognized for any portion of the exposure.
Note 10 – Earnings per Share Information
Specification of average number of shares: Year ended December 31,2013 2012 2011
Weighted average basic shares outstanding (a) 215,566,344 216,634,550 217,238,666 Dilutive potential shares (b) 834,181 833,388 879,061 Weighted average diluted shares outstanding 216,400,525 217,467,938 218,117,727
(a) Weighted average basic shares outstanding for each year is reduced by the average numbers of treasury shares owned by the Company during the year (see note 25)(b) For the years ended December 31, 2013, 2012 and 2011, respectively, share options equivalent to 704,500, 5,649,689 and 6,538,530 common shares, were excluded from the
calculation of diluted earnings per share as they were anti-dilutive. In addition 8.0 million shares related to the convertible notes (see note 25) were excluded from the cal-culation for the year ended December 31, 2011, as they were anti-dilutive.

PGS Annual report 2013
75PETROLEUM GEO-SERVICESNOTES
Note 11 – Restricted Cash
Restricted cash consists of the following:
December 31,(In millions of US dollars) 2013 2012Current:Restricted Cash JBIC loan (note 19) 9.6 - Restricted payroll withholding taxes 4.5 5.0 Other 0.5 1.5 Total restricted cash, current 14.6 6.5 Long-term: - - Deposits ISS disputes (note 21) 74.8 85.8 Total current and long-term 89.4 92.3
Note 12 – Accrued Revenues and Other Receivables
Accrued revenues and other receivables consist of the following:
December 31,(In millions of US dollars) 2013 2012Accrued revenues 166.1 132.3 Other receivables 17.2 21.3 Total 183.3 153.6
Note 13 – Other Current Assets
Other current assets consist of the following:
December 31,(In millions of US dollars) 2013 2012Consumables, supplies and fuel inventory 54.4 44.7 Deferred steaming costs 25.0 17.2 Prepaid operating expenses 12.7 16.4 Withholding taxes and taxes receivable 7.5 7.7 Prepaid reinsurance 7.1 6.4 Loans to joint venture and associated company 6.5 - Available-for-sale investments 4.0 3.0 Assets held-for-sale - 7.5 Other 7.3 7.2 Total 124.5 110.1

PGS Annual report 2013
76PETROLEUM GEO-SERVICESNOTES
Note 14 – Property and Equipment
The changes in property and equipment, including property and equipment under finance leases, are as follows:
(In millions of US dollars)Construction of
vessels in progressVessel
conversionsSeismic vessels and equipment
Fixtures, furniture and fittings
Buildings and other Total
Cost as of January 1, 2012 57.3 58.8 2,234.0 69.5 27.2 2,446.8 Capital expenditures/recoveries 201.7 - 156.1 8.6 1.5 367.9 Capitalized interest 8.0 - - - - 8.0 Asset sales - - (0.2) (0.5) - (0.7)Asset retirements - - (48.6) (6.3) (0.2) (55.1)Reclassified to other short-term assets - - (51.7) - - (51.7)Reclassified to intangible assets - - (3.4) (13.0) - (16.4)Cost as of December 31, 2012 266.9 58.8 2,286.2 58.3 28.5 2,698.7 Capital expenditures/recoveries 258.5 - 158.4 19.2 1.7 437.8 Capitalized interest 14.8 - - - - 14.8 Assets completed for intended use (267.8) - 267.8 - - - Asset retirements - - (53.5) (4.7) (0.6) (58.8)Cost as of December 31, 2013 272.4 58.8 2,658.8 72.9 29.6 3,092.5
Accumulated depreciation as of January 1, 2012 - - 890.3 55.7 11.4 957.5 Impairments as of January 1, 2012 - 33.0 162.1 0.4 1.2 196.7 Depreciation - - 205.0 6.2 2.8 214.0 Impairments - - (0.8) - - (0.8)Asset sales - - (0.1) (0.4) - (0.5)Asset retirements - - (37.5) (6.3) (0.2) (44.0)Reclassified to other short-term assets - - (49.3) - - (49.3)Reclassified to intangible assets - - - (12.5) - (12.5)Depreciation as of December 31, 2012 - - 1,008.4 42.7 14.0 1,065.2 Impairments as of December 31, 2012 - 33.0 161.3 0.4 1.2 195.9 Depreciation - - 226.7 6.9 3.5 237.1 Impairments - - 15.0 - - 15.0 Asset retirements - - (45.1) (4.4) (0.6) (50.2)Depreciation as of December 31, 2013 - - 1,190.0 45.2 16.9 1,252.1 Impairments as of December 31, 2013 - 33.0 176.3 0.4 1.2 210.9
Balance as of December 31, 2012 266.9 25.8 1,116.5 15.2 13.3 1,437.7 Balance as of December 31, 2013 272.4 25.8 1,292.6 27.2 11.5 1,629.5
ImpairmentsThe source vessel Polar Sea is currently stacked. Late in 2013, based upon management's evaluation of market conditions, fleet plan and capital expenditure expectations, management concluded that it no longer expected to re-rig the vessel for use in the fleet. The vessel's carrying value was adjusted down to its estimated sales value of $2.5 million and an impairment of $15 million was recognized.
In 2012, the Company reached an agreement for the sale of Beaufort Explorer for $2.5 million and reversed $1.7 million of previously recorded impairment. The sale was completed in January 2013. In addition, the Company recognized impairment on other seismic equipment of $0.9 million, resulting in a net impairment reversal for the year of $0.8 million.
The net book value of property and equipment under UK leases were zero and $40.2 million at December 31, 2013 and 2012, respectively. See note 21 for further description of these leases and the accounting impact of certain lease terminations.
New build program - Ramform Titan-class vesselsRamform Titan and Ramform Atlas were delivered in May 2013 and January 2014, respectively. Two additional Ramform Titan-class vessels are scheduled for delivery from Mitsubishi Heavy Industries Ltd. in the first and second half of 2015. The estimated cost of each of the additional two vessels is approxi-mately $260 million, subject to project costs, additional costs related to new technology on the seismic equipment and inflationary price increase on equip-ment. As of December 31, 2013 an aggregate of $550 million has yet to be incurred on the two additional vessels and Ramform Atlas.
Arrow – vesselsIn 2007, the Company acquired the Arrow Group which was constructing four 10-12 streamer seismic 3D vessels at the Factorias Vulcano shipyard group in Spain (the Arrow NB’s). Subsequently, three of the new-build contracts were cancelled due to delays (NB 532, NB 533 and NB 534). The Company took deliv-ery of NB 534, named PGS Apollo in 2010. For the cancelled Arrow vessels, NB 532 and NB 533, approximately EUR 7 million per vessel with the addition of

PGS Annual report 2013
77PETROLEUM GEO-SERVICESNOTES
interest, is still outstanding from Factorias Vulcano. Factorias Vulcano has entered into Spanish bankruptcy proceedings. Arrow is currently taking steps to recover the values. The net book value of the receivable from the Spanish yard is $10.1 million and $9.8 million as of December 31, 2013 and 2012, respectively.
Note 15 – MultiClient Library
The changes in the MultiClient library are as follows:
(In millions of US dollars) 2013 2012Balance as of January 1, 382.3 334.1 Capitalized cash costs 373.0 297.4 Capitalized interest 10.5 5.6 Capitalized depreciation 112.9 81.5 Amortization expense (301.8) (344.7)Other - 8.3 Balance as of December 31, 576.9 382.3
Amortization expense for the year ended December 31, 2013 includes $40.1 million of non-sales related amortization. This amount is comprised of $30.0 million in minimum amortization and $10.1 million of impairments to reflect the discounted cash flow of future sales on certain individual surveys. For the year ended December 31, 2012 the non-sales related amortization totaled $35.0 million, comprised of $23.9 million in minimum amortization and $11.1 mil-lion of impairments. For the year ended December 31, 2011, the non-sales related amortization totaled $19.5 million, comprised of $17.0 million of minimum amortization and $2.5 million of impairments.
The net carrying value of the MultiClient library, by the year of survey completion is as follows:
December 31,(In millions of US dollars) 2013 2012Completed surveys:Completed during 2008 - 17.0 Completed during 2009 27.6 54.9 Completed during 2010 20.5 28.5 Completed during 2011 32.1 48.3 Completed during 2012 45.2 63.1 Completed during 2013 60.2 - Completed surveys 185.6 211.8 Surveys in progress 391.3 170.5 MultiClient library 576.9 382.3
For information purposes, the following table shows the hypothetical application of the Company's minimum amortization requirements to the compo-nents of the existing MultiClient library.
(In millions of US dollars) Future minimum amortizationDuring 2014 46.1 During 2015 63.9 During 2016 95.3 During 2017 113.4 During 2018 114.5 During 2019 143.7 Future minimum amortization 576.9
Because the minimum amortization requirements apply to the MultiClient library on a survey-by-survey basis rather than in the aggregate, the Company may incur significant minimum amortization charges in a year even when the aggregate amount of ordinary amortization charges recognized exceeds the aggregate minimum amortization charges.

PGS Annual report 2013
78PETROLEUM GEO-SERVICESNOTES
Note 16 – Other Long-Term Assets
Other long-term assets consist of the following:
December 31,(In millions of US dollars) 2013 2012Investments in joint venture and associated companies (a) 48.1 38.5 Loan to PF Thor (note 21) 10.9 - Claims against yard (NB’s 532 and 533) (note 14) 10.1 9.8 Deferred loan costs on undrawn new-build borrowing facilities (b) 3.8 8.2 Loans to joint venture and associated companies (a) 3.5 16.2 Available-for-sale investments - 1.5 Other long-term receivables 8.6 6.2 Total 85.0 80.4
(a) Specification of investments in and loans to joint venture and associated companies:
(In millions of US dollars)
Net book value as of
December 31, 2013
Loans as of December 31,
2013
Ownership as of
December 31, 2013
Net book value as of
December 31, 2012
Loans as of December 31,
2012
Ownership as of
December 31, 2012
Corporations and limited partnershipsAzimuth Limited 12.2 - 45% 26.7 - 45%Azimuth II Limited 20.3 - 45% - - - Azinam Limited 0.1 - - 2.0 12.8 35%Seafloor Geophysical Solutions (SGS) 13.0 - 33% - - - PGS Overseas Operations (Cyprus) Limited 2.4 3.5 50% 9.6 3.4 50%Other 0.1 - - 0.2 - - Total 48.1 3.5 - 38.5 16.2 -
In addition, Petroleum Geo-Services ASA has a short-term loan of $6.5 million to PGS Khazar LLC which is owned 100% by PGS Overseas Operations (Cyprus) Ltd.
(In millions of US dollars)Share of income
(loss) 2013Share of income
(loss) 2012Corporations and limited partnershipsAzimuth Limited (4.9) (2.2)Azimuth II Limited (2.4) - Azinam Limited 0.5 (0.5)Seafloor Geophysical Solutions (SGS) (0.4) - PGS Overseas Operation (Cyprus) Limited (7.1) (0.5)Other (0.1) (1.0)Total (14.3) (4.2)
The Company owns 45% of both Azimuth Limited and Azimuth II Limited, which together are the holding companies of the Azimuth Group. The Azimuth Group consists of several operating entities which invest in Exploration and Production (E&P) companies and exploration assets.
In 2011, the Company participated in the establishment of Azimuth Limited primarily by contributing existing equity holdings in smaller E&P companies. In 2012, the Company received shares in Azinam Limited as part of the settlement for exploration assets in Namibia. In addition to shares the Company received a convertible loan of $12.8 million. In 2013, the Company participated in the establishment of Azimuth II Limited by contributing exploration assets in UK and Ireland, shares in Azinam Limited and Fortis Petroleum Corporation AS, and the convertible loan provided by Azinam Limited.
The Company has entered into a cooperation agreement whereby the Company provides certain services to the Azimuth Group and whereby Azimuth Group has the right to buy, for cash and at fair value, up to 50% of any future equity settlement that the Company may receive as payment for its library or ser-vices. The Company has a right but no obligation to provide further funding of Azimuth Group and has no guarantees outstanding.
In 2013, the Company acquired 33.4% of Seafloor Geophysical Solutions (SGS). A strategic cooperation agreement with SGS provides PGS exclusive rights to market and offer SGS node services to clients in the Brazilian market. SGS is a marine geophysical company focusing on seafloor acquisition, based on ocean bottom seismic technology. The Company has committed to contribute $13.3 million in cash to SGS, of which $5.3 million has been contributed at December 31, 2013. The Company has no obligation to provide further funding of SGS and has no guarantees outstanding.
The Company owns 50% of PGS Overseas Operations (Cyprus) Ltd (POOL) whose wholly-owned Russian subsidiary, PGS Khazar LLC, performs shallow-

PGS Annual report 2013
79PETROLEUM GEO-SERVICESNOTES
water and transition zone seismic services in the Caspian Sea. In 2013 POOL began marketing the sale of PGS Khazar LLC and has recognized an impairment on long-term assets of PGS Khazar LLC in recording them at the lower of cost and estimated fair value. The Company's share of the impairment is $5 million and is included in share of loss from joint venture and associated companies.
(b) Deferred loan costs is comprised of loan fees, guarantee fees and professional fees associated with separate financing arranged for each of the vessels Ramform Titan and Ramform Atlas. The related portion of deferred loan costs are reclassified and presented as a reduction of long-term debt when each loan facility is drawn (note 19).
Note 17 – Goodwill
The operating segments Marine Contract and MultiClient are cash generating units to which goodwill is allocated for the purpose of evaluating for impairment.
December 31,(In millions of US dollars) 2013 2012Marine Contract 97.9 97.9 MultiClient 42.0 42.0 Total 139.9 139.9
The recoverable amount of goodwill is estimated based upon value-in-use and after tax cash flow projections approved by executive management. The key assumptions used relate to growth rates, revenues, operating profit, capital expenditures and discount rate. An after tax discount rate was used of 10.2% as of December 31, 2013 and 9.4% as of December 31, 2012. The nominal growth rate used to extrapolate cash flows beyond the initial 5 years projection period as of December 31, 2013 and 2012 was 2.5%.
Management believes that any reasonably possible change in key assumptions underlying the calculations of the recoverable amount of each cash generat-ing unit would not trigger an impairment as of December 31, 2013.
Note 18 – Other Intangible Assets
The changes in other intangible assets are summarized as follows:
(In millions of US dollars)Patents and
licensesDevelopment
costTechnology
and otherExploration
expenditures TotalCost as of January 1, 2012 181.6 64.7 22.1 20.8 289.2 Additions to costs 8.9 18.9 0.7 1.7 30.2 Asset sales - - - (16.5) (16.5)Asset retirements (10.5) - - - (10.5)Reclassified from property and equipment 16.4 - - - 16.4 Reclassified as other long-term assets - - - (1.0) (1.0)Cost as of December 31, 2012 196.4 83.6 22.8 5.0 307.8 Additions to costs 12.0 16.4 - 0.9 29.2 Asset retirements (10.7) (0.7) - (0.3) (11.7)Cost as of December 31, 2013 197.7 99.3 22.8 5.5 325.3
Amortization as of January 1, 2012 (a) 133.6 4.6 16.3 - 154.5 Amortization expense 3.6 1.7 3.2 - 8.5 Asset retirements (10.5) - - - (10.5)Reclassified from property and equipment 12.5 - - - 12.5 Amortization as of December 31, 2012 (a) 139.2 6.3 19.5 - 165.0 Amortization expense 3.9 2.2 0.7 - 6.8 Asset retirements (10.7) (0.7) - - (11.4)Amortization as of December 31, 2013 (a) 132.4 7.8 20.2 - 160.4
Balance as of December 31, 2012 57.2 77.3 3.3 5.0 142.8 Balance as of December 31, 2013 65.2 91.5 2.6 5.5 164.9 Estimated useful life 1 to 20 years 1 to 10 years (b) 1 to 12 years (c)
(a) The accumulated impairment charge on intangibles other than goodwill was $99.1 million as of December 31, 2013 and 2012.(b) Estimated useful life from completion of development project.(c) Capitalized exploration expenditures are not amortized until the exploration is complete and the results have been evaluated at which time the asset is evaluated for
de-recognition or tested for impairment.

PGS Annual report 2013
80PETROLEUM GEO-SERVICESNOTES
Note 19 – Debt and Guarantees
Long-term debt:Long-term debt consists of the following:
December 31,(In millions of US dollars) 2013 2012Secured:Term loan B, Libor + 175 Basic points, due 2015 470.5 470.5 Export credit financing, due 2025 119.8 - Unsecured:Senior notes, Coupon 7.375%, due 2018 450.0 450.0 Total 1,040.3 920.5 Less current portion (10.3) - Less deferred loan costs, net of debt premiums (10.4) (4.7)Total long-term debt 1,019.6 915.8
Undrawn facilities consists of the following:December 31,
(In millions of US dollars) 2013 2012Secured:Revolving credit facility, due 2018 (a) 500.0 350.0 Export credit financing 125.0 250.0 Unsecured:Bank facility (NOK 50 mill) 8.2 9.0 Performance bond 14.6 17.3 Total 647.8 626.3
(a) The Senior secured credit facility was amended and extended in September 2013, the Company may now borrow an additional sum of secured debt: $1,850 million less the sum of (A) any RCF commitments outstanding, (B) Term Loans outstanding and (C) Permitted vessel financing indebtedness outstanding, either as a term loan or as an RCF. Such potential additional borrowing is not committed (except for secured undrawn debt in the table) but would be secured by the same collateral that secures the Term Loan and borrowings under the existing RCF. As long as the Company stays below a leverage ratio of 3:1 it can incur further unsecured debt.
Senior Secured Credit Facility (Term loan B and Revolving Credit Facility "RCF")The Term Loan is an obligation of PGS ASA and PGS Finance Inc. as co-borrowers, is secured by pledges of shares of material subsidiaries and is guaranteed by the same material subsidiaries. The Term Loan has no financial maintenance covenants. Any drawings on the “RCF” would be subject to the same security.
In September 2013, the "RCF" was increased from $350 million to $500 million and the maturity extended to September 2018. The margin on the extended facility changed from LIBOR + 2.25% to an initial margin of LIBOR + 1.75% with utilization fees dependent on the amount drawn (Less than $150 million + 0.25%, between $150 million and $300 million + 0.40%, over $300 million + 0.60%).
The Senior secured credit facility contains financial covenants and negative covenants that restrict the Company in various ways. The facility provides that:
1) For the RCF part the total leverage ratio (see note 20 for definitions of leverage ratios) may not exceed 2.75:1.0 (maintenance covenant). The Term Loan has an incurrence test prohibiting the Company from incurring more indebtedness, with certain exceptions, (described in footnote (a) in the table above) if the total leverage is above 3.00:1.0 (rolling last 4 quarters).
2) The credit agreement generally requires the Company to apply 50% of excess cash flow to repay outstanding borrowings for financial years when the total leverage ratio exceeds 2.5:1 or the senior secured leverage ratio exceeds 2:1. Excess cash flow for any period is defined as net cash flow provided by operating activities less capital expenditures and scheduled debt services during that period, minus capital income taxes to be paid in the next period and capital expenditure committed in the period but to be paid in future periods. The Company can make optional prepayments to reduce the outstanding prin-cipal balance at no penalty.
In addition, the credit agreement and the indenture to the $450 million Senior notes (described below) restricts or could restrict the Company's ability, among other things, to sell assets without the sales proceeds being reinvested in the business or used to repay debt; incur additional indebtedness or issue preferred shares; prepay interest and principal on our other indebtedness; pay dividends and distributions or repurchase our capital stock; create liens on assets; make investments, loans, guarantees or advances; make acquisitions; engage in mergers or consolidations; enter into sale and leaseback transac-tions; engage in transactions with affiliates; amend material agreements governing our indebtedness; change our business; enter into agreements that restrict dividends from subsidiaries; and enter into speculative financial derivative agreements.

PGS Annual report 2013
81PETROLEUM GEO-SERVICESNOTES
The RCF has a $45 million sub-limit for issuance of letters of credit, which was increased from $45 million to $60 million in the second amendment to the credit agreement described above. The separate bonding facility of $30 million (for issuance of bid and performance bonds) which was originally included in the sub-limit of the RCF, was discontinued during 2012. Under the RCF, the Company may borrow USD, or any other currency freely available in the London banking market to which the lenders have given prior consent, for working capital and for general corporate purposes. At December 31, 2013 and 2012, the Company had zero outstanding in cash advances, and zero outstanding standby letters of credit under the RCF.
Senior notesIn December 2012, the Company issued $150 million add on to the $300 million Senior notes (issued in November 2011) at a premium of 107.5% of the principal amount. Both the Senior notes issued in 2011 and 2012 will be treated as a single class of debt securities under the same indenture. The Senior notes are senior obligations of the company and rank equally in right of payment with all other existing and future senior debt. The Senior notes have an incurrence test prohib-iting the Company from incurring more indebtedness, with certain exceptions, if the consolidated interest coverage ratio is less than 2.0:1.0. At any time prior to December 15, 2015, the Company may redeem the Senior notes at its option, in whole or in part, at a redemption price equal to 100% of the principal amount thereof plus the applicable premium as of, and accrued and unpaid interest to, the date of redemption. Applicable premium means the greater of (i) 1.0% of the principal amount of the Senior notes; and (ii) the excess of (a) the present value at such redemption date of the redemption price of the Senior notes at Decem-ber 15, 2015 (such redemption price being set forth in the table appearing below plus all required interest payments due on the Senior notes during the period from such redemption date through December 15, 2015 (excluding accrued but unpaid interest), computed using a discount rate equal to the treasury rate as of such redemption date plus 50 basis points, over (b) the principal amount of the Senior notes, if greater. The Senior notes are also redeemable at the Company’s option on or after December 15, 2015, in whole or in part, at the redemption prices (expressed as percentages of principal amount) set forth below, plus accrued and unpaid interest thereon to the applicable redemption date, if redeemed during the 12-month period beginning December 15 of the years indicated below:
Year Percentage2015 103.69%2016 101.84%2017 and thereafter 100.00%
Convertible notesIn 2012, the Company redeemed, at its option, the remaining Convertible notes for a nominal amount $190.6 million at an average price of 100.51%.
Export credit financingOn October 10, 2012, the Company entered into an Export credit financing arrangement which includes two loan agreements of $125 million each with Japan Bank for International Cooperation ("JBIC") and Sumitomo Mitsui Banking Corporation ("SMBC"). The loans will be made available to a wholly owned subsidiary of the Company, PGS Titans AS, and disbursement of the loans become available upon delivery of each of the two new Ramforms, Ramform Titan and Ramform Atlas. Ramform Titan was delivered and the loan drawn in May 2013. Ramform Atlas was delivered from Mitsubishi Heavy Industries in January 2014 and the loan will be drawn before 30th of April 2014. The loans are senior facilities secured by first priority mortgages over the vessels and fittings on board (but excluding "in sea" equipment such as streamers), pledge of the borrower's right under a debt service reserve account and assignment of insurance rights in the vessels. The loans will be repaid over 12 years in semiannual equal installments and will have two tranches whereby JBIC and SMBC each receive 50%. The JBIC tranche bears a fixed interest and is repaid from the 7th to 12th year after draw down, while the SMBC tranche bears a floating interest based on 6 months Libor plus a margin and is repaid from 1st to 6th year after draw down. SMBC has received credit insurance from Nippon Export and Investment Insurance ("NEXI") and the insurance premium is paid by PGS Titans AS.
Letters of credit and guaranteesThe Company has $8 million and $10 million uncommitted bid and performance bond facilities intended for regional use. Drawings under these facilities totaled $3.4 million and $0.7 million as of December 31, 2013 and 2012, respectively.
The Company had aggregate outstanding letters of credit and similar guarantees, not reflected in the accompanying consolidated statements of financial position, of $22.3 million and $16.7 million as of December 31, 2013 and 2012, respectively.
Note 20 – Financial Instruments
Fair values of financial instrumentsThe Company is required to disclose the hierarchy of how fair value is determined for financial instruments recorded at fair value in the consolidated finan-cial statements:
Level 1: quoted prices (unadjusted) in active markets for identical assets and liabilities.Level 2: assets and liabilities whose values are based on quoted prices in markets that are not active or model inputs that are observable either directly or
indirectly.Level 3: techniques for which all inputs which have a significant effect on the recorded fair value that is not based on observable market data.

PGS Annual report 2013
82PETROLEUM GEO-SERVICESNOTES
The carrying amounts of cash and cash equivalents, restricted cash, accounts receivable, accrued revenues and other receivables, other current assets, accounts payable and accrued expenses approximate their respective fair values because of the short maturities of those instruments. The fair values of the long-term debt instruments, forward exchange contracts and interest rate swaps are estimated using quotes obtained from dealers in such financial instruments or latest quoted prices or indexes at Reuters or Bloomberg. Where market prices are not observed or quotes from dealers are not obtained, an indirect method is used by use of implied credit spread from debt instrument with similar risk characteristics.
The carrying amounts, estimated fair values of debt and derivatives instruments including how fair value is determined are summarized as follows:
December 31, 2013 December 31, 2012Carrying Fair Carrying Fair
(In millions of US dollars) amounts values Level amounts values LevelFinancial assets measured at fair valueForward exchange contracts used for hedging 0.1 0.1 2 1.3 1.3 2 Other foreign exchange contracts 3.1 3.1 2 1.3 1.3 2 Equity shares 4.0 4.0 1 4.5 4.5 1, 3
Financial liabilities measured at fair valueForeign exchange contracts used for hedging (1.6) (1.6) 2 - - - Other foreign exchange contracts (0.6) (0.6) 2 (0.3) (0.3) 2 Interest rate swaps used for hedging - - - (18.0) (18.0) 2 Interest rate swaps not hedge accounted (8.3) (8.3) 2 - - -
Financial liabilities not measured at fair valueDebt with fixed interest rate (512.5) (544.8) 2 (450.0) (477.8) 2 Debt with variable interest rate (527.8) (530.8) 2 (470.5) (460.9) 2
Financial risk management policiesThe Company’s objectives when managing capital are to safeguard the Company’s ability to continue as a going concern in order to provide returns for shareholders and benefits for other stakeholders such as dividends and to maintain an optimal capital structure to reduce the cost of capital.
The management of the capital structure involves active monitoring and adjustments in light of changes in economic conditions and the risk characteristics of the underlying assets. In order to maintain or adjust the capital structure the Company may refinance its debt, buy or issue new shares or debt instru-ments, sell assets or return capital to shareholders.
The Company monitors debt on the basis of the leverage ratio and other covenants in credit agreements. This ratio is calculated as gross indebtedness divided by EBITDA less non pre-funded MultiClient library investments. At December 31, 2013, the gross indebtedness was $1,063.2 million and EBITDA less non pre-funded MultiClient library was $811.5 million. In addition, the Company monitors a leverage ratio based on net debt. Net debt is calculated as total indebtedness (including “current and long-term debt” as shown in the consolidated statement of financial position) less cash and cash equivalents. The Company generally seeks to keep net debt below 1 or 2 times EBITDA, dependent on several factors including capital spending commitments, the state of the seismic market and macro risks. The Company is of the opinion that the policy would generally satisfy the requirements for a BB–rating (Standard and Poor’s)/Ba2-rating (Moody’s). The gross leverage ratio at December 31, 2013 and 2012 was 1.31 and 1.22, respectively while the net leverage ratio was 0.76 and 0.72, respectively.
The Company is exposed to market risks such as interest rate risk, foreign exchange rate risk, credit risk and liquidity risk. The Company has written procedures and policies for establishing appropriate exposure levels for the main risks and monitoring such. The Company manages the exposure level through hedging with a mixture of fixed or floating interest rate debt or financial derivatives. The Company's risk management policies are approved by the Board of Directors. The treasury function reports regularly to the Company management and any breach of limits set in the policy shall be reported to the Board of Directors.
Interest rate exposureThe Company is subject to interest rate risk on debt, including finance leases. The risk is managed by using a combination of fixed -and variable rate debt, together with interest rate swaps, where appropriate, to fix or lower the borrowing costs.
December 31, 2013 December 31, 2012
Notional amounts Weighted average
interest rate Notional amounts Weighted average
interest rateDebt at fixed interest rate 512.5 6.74% 450.0 7.38%
Debt at variable interest rate based on US dollar plus a margin 527.8 1.88% 470.5 2.00%Variable interest rate debt with interest fixed 300.0 3.50% 300.0 3.50%

PGS Annual report 2013
83PETROLEUM GEO-SERVICESNOTES
After giving effect to the Company’s interest rate swaps, for every one-percentage point hypothetical increase in LIBOR, our annual net interest expense on our variable rate debt, inclusive finance leases and non-restricted cash holdings, will decrease by approximately $2.5 million and $2.2 million at December 31, 2013 and 2012, respectively.
Interest rate sensitivityThe following table demonstrates the sensitivity to a reasonably possible change in interest rates on the Company’s loans and borrowings, after the impact of hedge accounting. The change in fair value of the derivatives used for cash flow hedges will be effected by a change in the interest rate and is shown as the effect on equity. All other variables are held constant and the effect is calculated based on the Company’s financial instrument at December 31.
(In millions of US dollars)Increase/ (decrease) in
basis pointsEffect on profit
before tax Effect on equity2013 100 (0.1) - 2012 100 (1.7) 5.3
Foreign exchange rate exposureThe Company is exposed to currency fluctuation due to the effects of a predominantly USD based revenue stream, while the Company’s operating expenses and capital expenditures are mainly denominated in USD, GBP, NOK and EUR. The Company maintains a foreign currency risk management strategy that uses foreign currency exchange contracts to protect against fluctuations in cash flow caused by volatility in currency exchange rates. The Company had open forward contracts to buy and sell GBP, NOK, BRL, JPY and GBP, NOK, SGD, BRL and EUR at December 31, 2013 and 2012, respectively. The table shows expo-sures and foreign exchange contracts in currencies that the Company hedges on a regular basis.
December 31, 2013 December 31, 2012(Numbers in millions) NOK GBP BRL NOK GBP BRLRestricted cash 27.4 - 176.6 27.9 - 175.3 Current assets 27.3 2.2 - 33.4 1.5 - Current liabilities (279.2) (8.0) - (244.6) (5.3) - Pension liabilities (105.8) (21.4) - (166.4) (0.6) - Other long term liabilities - (1.7) - - (1.6) - Net statements of financial position exposure (330.3) (28.9) 176.6 (349.7) (6.0) 175.3
Committed capital expenditure:Next year (111.4) - - (112.3) - - 1-2 years (196.5) - - (11.4) - - Net forecast exposure (307.9) - - (123.7) - -
Forward exchange contracts 583.4 24.7 (120.0) 490.5 4.0 (120.0)Net exposure (54.8) (4.2) 56.6 17.1 (2.0) 55.3
Average rate Year end spot rate 2013 2012 2013 2012
USD / NOK 5.848 5.814 6.083 5.587GBP / USD 1.562 1.586 1.653 1.616USD / BRL 2.137 1.934 2.364 2.045
Foreign exchange rate sensitivityA 10% depreciation of the USD would have increased the fair value of the Company's foreign currency derivatives by approximately $9.1 million and $4.4 million, and the effect on income before tax on the consolidated statements of operations would have been $3.6 million and $2.1 million as of December 31, 2013 and 2012, respectively. The Company’s debt and interest swaps are denominated in USD.
Exposure to credit risk The approximate maximum credit exposure related to financial assets is as follows:
December 31,(In millions of US dollars) 2013 2012Cash and cash equivalents 263.8 390.3 Restricted cash (note 11) 89.4 92.3 Accounts receivable 177.1 176.3 Accrued revenues and other receivables 183.3 153.6 Total 713.6 812.5

PGS Annual report 2013
84PETROLEUM GEO-SERVICESNOTES
We continually monitor the counterparty credit risk of our banking partners, including derivatives counterparties and the institutions in which our cash is held on deposit. Trade receivables are primarily with multinational integrated oil companies and independent oil and natural gas companies, including com-panies owned in whole or in part by governments. The Company manages its exposure to credit risk through ongoing credit evaluations of customers and counterparties and has provided for potential credit losses through an allowance for doubtful accounts . The allowance for doubtful accounts reflects man-agement's best estimate of probable losses inherent in accounts receivable from trade customers and is based on a number of factors consisting mainly of aging of accounts, historical experience, customer concentration, customer creditworthiness and current industry and economic trends.
December 31,(In millions of US dollars) 2013 2012Accounts receivable - trade 178.3 181.0 Allowance for doubtful accounts (1.2) (4.7)Total 177.1 176.3
The Company is also exposed to credit risk relating to off-balance items such as agreements to provide future services to customers and counterparties on derivatives and where cash is held on deposit. The Company manages its exposure to such risks through continuously monitoring of counterparties.
Exposure to liquidity riskThe Company tries to minimize liquidity risk through ensuring access to a diversified set of funding sources, and management of maturity profile on debt and derivatives. The Company is exposed to liquidity risk related to the following:
December 31, 2013 Contractual cash flows
Carryingamount
Notionalvalue
Total
0-1 years
1-2 years
2-3 years
3-4 years
4-5 years
Thereafter (In millions of US dollars)
Non-derivative financial assets/liabilitiesTrade payables (66.0) - 66.0 66.0 - - - - - Finance lease liabilities (0.3) - (0.3) (0.3) - - - - - Debt with fixed interest rates (512.5) - (681.9) (34.1) (33.9) (33.9) (33.9) (483.5) (62.6)Debt with variable interest rates (527.8) - (546.4) (21.1) (486.9) (11.2) (11.2) (10.7) (5.3)
Derivative financial assets/liabilitiesInterest rate swaps not hedge accounted (8.3) 300.0 (8.4) (7.8) (0.6) - - - - Forward exchange contracts used for hedging (1.5) 51.4 (1.5) (0.3) (1.2) - - - - Other foreign exchange contracts 2.5 136.8 2.5 2.5 - - - - -
December 31, 2012 Contractual cash flows
Carryingamount
Notionalvalue
Total
0-1 years
1-2 years
2-3 years
3-4 years
4-5 years
Thereafter (In millions of US dollars)
Non-derivative financial assets/liabilitiesTrade payables (61.0) - (61.0) (61.0) - - - - - Finance lease liabilities (0.1) - (0.1) (0.1) - - - - - Debt with fixed interest rates (450.0) - (649.1) (33.2) (33.2) (33.2) (33.2) (33.2) (483.1)Debt with variable interest rates (470.5) - (498.7) (11.7) (11.4) (475.6) - - -
Derivative financial assets/liabilitiesInterest rate swaps used for hedging (18.0) 300.0 (18.1) (9.9) (7.6) (0.6) - - - Forward exchange contracts used for hedging 1.3 19.2 1.3 1.2 0.1 - - - - Other foreign exchange contracts 1.0 134.4 1.0 1.0 - - - - -
In addition, the Company has operating lease commitments and CAPEX commitments, see note 14 and 21.
Interest rate hedge accountingIn the year ended December 31, 2012, the fair value of the interest rate swaps were recorded in other comprehensive income as the effective portion of the designated and qualifying hedging instrument. The profit and loss impact of the cash flow hedges are estimated to be in the same year as the effect of the cash flows. The Company has not excluded any components of the derivative instruments’ gain or loss from the assessment of hedge effectiveness with respect to the qualifying interest rate swaps. In September 2013, the Company discontinued the cash flow hedges and any subsequent change in value of the interest rate swaps has been taken directly to the consolidated statements of operations. The fair value of the derivatives at the time is retained in other comprehensive income and amortized as an adjustment to the effective interest rate over the term of highly probable expected cash flows.

PGS Annual report 2013
85PETROLEUM GEO-SERVICESNOTES
Foreign exchange rate hedge accountingThe company entered into derivatives accounted for under fair value hedge relationships to hedge the currency risk related to NOK equipment purchases. A summary of fair value hedging relationships follows:
December 31, 2013 December 31, 2012
(In millions of US dollars)Notional
valueFair
valueChange in fair
value Notional
valueFair
valueChange in fair
value Foreign currency derivatives designated as fair value hedging instruments 51.4 (1.5) (2.7) 19.2 1.3 2.4 Firm commitments to purchase equipment 50.6 2.1 3.2 22.1 (1.0) (2.1)Foreign currency derivatives not designated as hedges 136.8 2.5 3.7 134.4 1.0 4.9
The difference between the change in the value of the derivatives and the change in the fair value of the firm commitment is primarily caused by the fact that only the spot element of the derivative is designated to hedge the object and that in previous years derivatives at the hedge designation date were already carried at fair value.
Note 21 – Leases, Contingent Liabilities and Provisions
LeasesOperating LeasesThe Company has operating lease commitments expiring at various dates through 2024. Future minimum payments related to non-cancellable operating leases were as follows:
December 31, (In millions of US dollars) 2013 20122013 - 60.2 2014 67.8 61.8 2015 55.6 45.6 2016 41.6 32.5 2017 34.2 29.2 2018 30.2 28.1 thereafter 152.1 129.6 Total 381.5 387.0
The future minimum payments under the Company's operating leases are for the following types of property:
December 31,(In millions of US dollars) 2013 2012Marine seismic and support vessels 278.4 270.2 Buildings 92.3 96.5 Data processing operations equipment 9.1 18.3 Other 1.7 2.0 Total 381.5 387.0
Rental expense for operating leases, including leases with terms of less than one year, was $108.2 million, $106.5 million and $103.3 million for the years ended December 31, 2013, 2012 and 2011, respectively.
Seismic support vesselsThe Company signed 10-year time charter agreements, with renewal options, with P/F Seismic Support for four new seismic support vessels. The Company is providing financing to P/F Seismic Support during the vessel construction phase. The financing is secured by an assignment of bank refund guarantees, a pledge in shares of P/F Seismic Support and a guarantee by its parent, P/F Thor. Upon completion, P/F Seismic Support may require that the Company purchase the vessels for 90% of construction cost, in aggregate $86 million, and charter the vessels back to P/F Seismic Support under a 10-year bareboat agreement during which period P/F Seismic Support may purchase each of the vessels at a predetermined price. Regardless of whether P/F Seismic Support invokes this sale-leaseback financing mechanism, the time charter agreements remain in effect whereby P/F Seismic Support as lessor operates the ves-sels and the Company as lessee uses the vessels in its worldwide seismic activities. The loan balance is $10.9 million at December 31, 2013.
UK leasesThe UK lease agreement for Ramform Valiant was terminated in 2012 pursuant to which the Company paid $2 million and obtained formal ownership of the vessel. The UK lease agreement for Ramform Challenger was terminated in 2013 pursuant to which the Company received $4.3 million.

PGS Annual report 2013
86PETROLEUM GEO-SERVICESNOTES
Contingent liabilitiesBrazil service tax claim The Company has an ongoing dispute in Brazil for municipal services tax (“ISS”) related to the licensing of MultiClient data. The municipality contends that licensing of MultiClient data equates to providing a service to PGS’ clients. ISS is a local service tax and the Company’s primary view is that licensing of MultiClient data held by the Company should be treated as rental of an intangible asset, which is clearly not a service under the relevant provisions, and therefore not subject to ISS. This has been confirmed by several external advisors and the Company intends to vigorously defend its view. The calculated maximum exposure for ISS tax, including interest charges and penalties, was $145 million as of December 31, 2013.
The Company has made deposits equivalent to $94 million in 2010 and 2011 allowing it to file lawsuits covering some of the years, seeking to confirm that licensing of MultiClient data is not subject to ISS. The lawsuits relate to periods before 2002, where the Company has been assessed and lost at administra-tive appeal levels, as well as periods after 2005, which have not yet been assessed. The Company will continue depositing amounts relating to future licensing transactions. Because the Company considers it more likely than not that this contingency will be resolved in its favor, no provision is recognized for any por-tion of the exposure. Amounts deposited are held in an interest-bearing bank account with Banco do Brazil and will be released to the Company if and when a positive final ruling is awarded, which may take several years. The deposit is presented as long-term restricted cash in the statements of financial position.
Petrojarl Following the demerger of Petrojarl in 2006, the Company retained a joint secondary liability for certain obligations of Petrojarl. Petrojarl has agreed to indemnify the Company from liabilities related to its operations. Such liabilities include liabilities related to the floating production, storage and offloading units (“FPSOs”), that the Company transferred to Petrojarl in connection with the demerger. With respect to the Petrojarl Foinaven FPSO, PGS has provided a separate on demand guarantee. The guarantee is made in relation to the FPSO service agreement and is for the benefit of the Foinaven co-ventures and is capped at $10 million. With respect to the Petrojarl Banff FPSO, the Company remains with a joint secondary liability with Petrojarl under their FPSO service agreement with the customer. The guarantee is not capped. If these claims are made and Petrojarl does not honor its obligation to indemnify PGS, it could adversely affect the Company’s business, results of operation or financial condition.
ProvisionsClaim towards Polish yard In 2008, PGS subsidiary Arrow Seismic Invest IV LTD (“Arrow IV”) terminated a contract with Polish yard Stocznia Marynarki Wojennej S.A. (the “yard”) for the conversion of the vessel Southern Explorer. The yard subsequently detained the vessel as security for alleged claims against Arrow IV. In 2009, Arrow IV initiated a lawsuit against the yard, claiming damages and repossession of the vessel. The yard is in bankruptcy proceedings and the estate is party to the dispute which is in litigation before Danish courts. In June 2013, the Court decision concluded with Arrow IV to pay approx. $2.5 million in order to get the vessel released. Subsequently, both parties decided to appeal. PGS does not consider it probable that the outcome will have any adverse effect on the Company’s business, results of operation or financial condition.
Provisions for onerous contracts and dilapidationThe Company has recognized a provision for onerous contract related to lease agreement in Norway for an office which the Company no longer occupies. In addition, the Company has recognized provisions for dilapidation on various office leases. The aggregate provision for the onerous contract and dilapida-tions was $4.8 million and $3.8 million as of December 31, 2013 and 2012, respectively.
Note 22 – Accrued Expenses
Accrued expenses consist of the following:
December 31,(In millions of US dollars) 2013 2012Accrued employee benefits 65.3 83.9 Accrued revenue share 50.2 44.6 Accrued vessel operating expenses 34.8 40.7 Received, not invoiced, property and equipment 30.9 17.8 Customer advances and deferred revenue 25.6 31.7 Accrued commissions 15.9 9.0 Accrued project costs 14.8 13.3 Accrued sales tax and VAT 9.5 9.4 Future capital calls SGS (note 16) 8.0 - Other 24.4 25.2 Total 279.4 275.6

PGS Annual report 2013
87PETROLEUM GEO-SERVICESNOTES
Note 23 – Other Long-Term Liabilities
Other long-term liabilities consist of the following:
December 31,(In millions of US dollars) 2013 2012Pension liability (note 24) 51.3 42.1 Unrealized loss on interest swaps/forward exchange contracts (note 20) 4.1 18.0 Other 7.0 10.8 Total 62.4 70.9
Note 24 – Pension Obligations
Defined benefits plansPlan characteristicsThe Company has defined benefit pension plans for certain Norwegian and UK employees, with eligibility determined by certain period-of-service require-ments. In Norway these plans are generally funded through contributions to insurance companies. In the UK, the plans are funded through a separate pen-sion trust. It is the Company's general practice to fund amounts to these defined benefit plans at rates that are sufficient to meet the applicable statutory requirements. The defined benefit plans have been closed for further entrants, as defined contribution plans have been established for all new employees. As of December 31, 2013, 499 employees were participating in the defined benefit plans.
Actuarial valuations and assumptionsThe actuarial valuations are performed by independent actuaries in Norway and UK.
RisksActuarial valuations as applied in the consolidated financial statements are based upon financial and demographic assumptions which may be impacted by future events. Such future events include, but are not limited to, changes in discount rates, compensation rates and mortality rates. Changes to assump-tions may have significant effect on present net pension liabilities, future pension cost and future cash requirements to fund the plans.
Plan amendments, curtailments and settlementsDue to intra-group transfer of employees one Norwegian defined benefit plan was settled in 2013, and the participants were transferred to another defined benefit plan within the Company.
Financial impactA summary of changes in the plans' aggregate projected benefit obligations and fair values of assets are summarized as follows:
(In millions of US dollars) 2013 2012Projected benefit obligations (PBO) as of January 1, (a) 193.6 185.3 Service cost 6.5 7.8 Interest cost 8.1 8.0 Employee contributions 1.3 1.4 Social security tax (0.1) 0.1 Actuarial loss (gain), arising from changes in demographic assumptions (8.9) (10.4)Actuarial loss (gain), arising from changes in financial assumptions 18.6 (8.0)Plan settlements (0.8) - Benefits paid (1.5) (1.5)Exchange rate effects (0.4) 10.9 Projected benefit obligations (PBO) as of December 31, (a) 216.4 193.6
(a) $2.7 million and $2.1 million arise from unfunded plans as of December 31, 2013 and 2012, respectively.

PGS Annual report 2013
88PETROLEUM GEO-SERVICESNOTES
Change in fair value of pension plan assets:
(In millions of US dollars) 2013 2012Fair value of plan assets as of January 1, 151.5 118.3 Expected return on plan assets 6.5 7.6 Employer contributions 10.8 11.3 Employee contributions 1.3 1.4 Actuarial gain (loss) arising from return on plan assets (2.5) 7.0 Plan settlements (0.8) - Benefits paid (1.5) (1.5)Exchange rate effects (0.2) 7.4 Fair value of plan assets as of December 31, 165.1 151.5
The aggregate funded status of the plans and amounts recognized in the Company's consolidated statements of financial position are summarized as follows:
December 31,(In millions of US dollars) 2013 2012Projected benefit obligation (PBO) 216.4 193.6 Fair value of plan assets 165.1 151.5 Net pension liability 51.3 42.1
Net amount recognized as accrued pension liability is presented as other long-term liabilities (see note 23).
Net periodic pension cost for the Company's defined benefit pension plans are summarized as follows:
Year ended December 31,(In millions of US dollars) 2013 2012 2011Service cost 6.5 7.8 6.8 Interest cost 8.1 8.0 7.8 Expected return on plan assets (6.6) (7.7) (8.2)Adjustments to prior service cost - - (3.9)Administration costs 0.1 0.1 0.1 Social security tax 0.5 0.7 0.6 Other - 1.7 (0.1)Net periodic pension cost 8.6 10.6 3.1
Net periodic actuarial gains and losses charged towards other comprehensive income for the Company's defined benefit plans are summarized as follows:
Year ended December 31,(In millions of US dollars) 2013 2012 2011Actuarial gain (loss), arising from changes in demographic assumptions 8.9 10.4 (7.9)Actuarial gain (loss), arising from changes in financial assumptions (18.6) 8.0 (14.5)Actuarial gain (loss) arising from return on plan assets (2.5) 7.0 (6.4)Net actuarial loss (gain) recognized towards other comprehensive income (12.2) 25.4 (28.8)
Assumptions used to determine periodic pension cost:
2013 2012Norway UK Norway UK
Discount rate 4.00% 4.65% 3.80% 4.55%Return on plan assets 4.00% 4.65% 4.00% 6.81%Compensation increase 3.50% 3.50% 3.00% 3.00%
The discount rate assumptions used for calculating pensions reflect the rates at which the obligations could be effectively settled. Observable long-term rates on corporate bonds are used for the Norwegian and UK plans.

PGS Annual report 2013
89PETROLEUM GEO-SERVICESNOTES
Plan asset allocationThe Company’s pension plan asset allocations, by asset category, are presented by major plan group as follows:
December 31, 2013 December 31, 2012(In millions of US dollars) Norway UK Norway UKFair value plan assets 41.1 124.0 41.5 110.0
Plan assets at fair value with quoted prices in active markets for identical assets:Equity/diversified growth funds 6% 44% 7% 44%Debt securities 2% 42% 2% 44%Real estate - 9% - 10%Other - 5% - 2%
Plan assets valued without quoted prices in active markets:Equity/diversified growth funds 2% - 3% - Debt securities 72% - 68% - Real estate 17% - 17% - Other 1% - 3% - Total 100% 100% 100% 100%
Management of plan assets must comply with applicable laws and regulations in Norway and the UK where the Company provides defined benefits plans. Within constraints imposed by laws and regulations, and given the assumed pension obligations and future contribution rates, the majority of assets are managed actively to obtain a long-term rate of return that at least reflects the chosen investment risk.
SensitivityThe following table show the sensitivity of pension cost (excluding amortization of actuarial gains and losses) and benefit obligation (including payroll tax) related to change in discount rate, compensation level and USD:
(In millions of US dollars)1% increase in discount rate
1% decrease in discount rate
1% increase in annual compens ation
increase
1% decrease in annual compensation
increase10% appreciation
of USD (a)Increase (decrease) in pension cost (2.4) 4.9 3.6 (1.1) (0.8)Increase (decrease) in benefit obligations (PBO) (42.5) 57.6 22.6 (20.8) (19.6)
(a) Based on the Company’s mix of Norwegian plans (NOK denominated) and UK plans (GBP denominated) as of December 31, 2013.
The Company expects to contribute approximately $8.0 million to its defined benefit pension plans in 2014.
As of December 31, 2013, weighted average remaining service period for employees under the Company's defined benefit pension plans is 14.7 years, while weighted average duration of the defined benefit obligation is 24.1 years.
Defined contribution plansSubstantially all employees not eligible for coverage under the defined benefit plans in Norway and the UK are eligible to participate in pension plans in accordance with local industrial, tax and social regulations. All of these plans are considered defined contribution plans.
The Company’s contributions to the Norwegian defined contribution plans for the years ended December 31, 2013, 2012 and 2011 were $2.1 million, $2.0 mil-lion and $1.7 million, respectively.
Under the Company’s U.S. defined contribution 401(k) plan, substantially all US employees are eligible to participate upon completion of certain period --of-service requirements. The plan allows eligible employees to contribute up to 100% of compensation, subject to IRS and plan limitations, on a pre-tax basis, with a 2013 statutory cap of $17,500 ($23,000 for employees aged 50 years and over). Employee pre-tax contributions are matched by the Company as follows: the first 3% are matched at 100% and the next 2% are matched at 50%. All contributions vest when made. The employer matching contribution related to the plan was $1.6 million, $1.2 million and $1.5 million for the years ended December 31, 2013, 2012 and 2011, respectively. Contributions to the plan by employees for these periods were $4.2 million, $3.2million and $4.0 million, respectively.
Aggregate employer and employee contributions under the Company’s other plans for the years ended December 31, were $2.0 million and $0.9 million (2013), $1.8 million and $0.8 million (2012), $1.6 million and $0.7 million (2011).

PGS Annual report 2013
90PETROLEUM GEO-SERVICESNOTES
Note 25 – Shareholder Information
As of December 31, 2013 and 2012, Petroleum Geo-Services ASA had a share capital of NOK 653,399,991 on 217,799,997 shares of par value NOK 3 each, all fully paid.
At the Annual General Meeting ("AGM") held on May 14, 2013, authority was given for the Board of Directors to acquire treasury shares at a maximum par value of the shares of NOK 65,339,999. The shares may be used to meet obligations arising from employee incentive schemes; as part of consideration pay-able or acquisitions made by the Company; as part of consideration for any merger, demerger or acquisition; by way of cancellation of the shares in part or full; to raise funds for specific investments; for the purpose of repaying loans (including convertible loans); or to strengthen the Company's capital base. The Board is free to choose the method of disposal considered expedient for such purposes. Further, the Board of Directors is authorized to increase the Compa-ny's share capital by a total amount of NOK 65,339,999 through one or more subscriptions. The authorization shall be utilized in connection with potential acquisitions of companies or businesses within the oil and energy sector, including the oil service sector, settlement of obligations (including convertible loans), funding of material investments or to raise funds to strengthen the Company's capital base. The Board of Directors was further authorized to increase the share capital with a maximum of NOK 11,000,000 through one or more subscriptions in connection with the share option programs for employ-ees. The Board was also authorized to issue convertible bonds at a total amount of NOK 3,500,000,000. These authorizations are valid until June 30, 2014.
All shares have equal voting rights and equal rights to dividends. Any distribution of the Company’s equity is dependent on the approval of the shareholders, and the ability to make distributions is limited by certain debt covenants and Norwegian Corporate Law. The ordinary shares are listed on the Oslo Stock Exchange.
The Board of Directors will propose to the AGM in 2014 a dividend for the year ended December 31, 2013 of NOK 2.30 per share (NOK 495 million in total). The proposed dividend is recognized as a liability in the financial statements in the period it is approved by the AGM.
The Company’s holding of treasury shares reconciles as follows:
Treasury shares% of total shares
outstanding Balance as of January 1, 2012 1,223,921Used to fulfill 2011 share bonus program (24,700)Acquired in 2012 830,000 Used to fulfill employee share option program in 2012 (note 27) (985,535)Conversion of convertible notes (note 19) (28,079)Balance as of December 31, 2012 1,015,607 0.47%Acquired in 2013 1,864,893 Used to fulfill employee share option program in 2013 (note 27) (221,829)Balance as of December 31, 2013 2,658,671 1.22%
The 20 largest shareholders in Petroleum Geo-Services ASA were as follows:
December 31, 2013Total shares Ownership percent
Folketrygdfondet 21,822,711 10.02 Euroclear Bank S.A. (nominee) 9,897,049 4.54 Clearstream Banking S.A. (nominee) 7,255,245 3.33 State Street Bank and Trust Co. (nominee) 6,788,618 3.12 Deutsche Bank Trust Depository Receipts (nominee) 5,038,678 2.31 Varma Mutual Pension Company 4,789,879 2.20 JPMorgan Chase Bank (nominee) 4,504,814 2.07 JPMorgan Chase Bank (nominee) 4,369,665 2.01 Tapiola Mutual Company 4,300,000 1.97 State Street Bank and Trust Co. (nominee) 3,906,224 1.79 State Street Bank and Trust Co. (nominee) 3,498,132 1.61 Verdipapirfondet DnB 3,427,199 1.57 Verdipapirfondet DnB 3,194,859 1.47 JPMorgan Chase Bank (nominee) 3,127,589 1.44 State Street Bank and Trust Co. (nominee) 3,026,661 1.39 Goldman, Sachs & Co (nominee) 2,932,646 1.35 Petroleum Geo-Services ASA 2,658,671 1.22 HSBC Bank Plc (nominee) 2,360,514 1.08 Citibank, N.A. (nominee) 2,091,641 0.96 Vanguard Intl. - Brown Brother Harriman 2,069,250 0.95 Other shareholders 116,739,952 53.60 Total 217,799,997 100.0

PGS Annual report 2013
91PETROLEUM GEO-SERVICESNOTES
Shares owned or controlled by members of the Board of Directors, Chief Executive Officer and Other Executive Officers were as follows:
December 31, 2013Total shares Ownership percent
Board of DirectorsFrancis Gugen, Chairperson 30,000 (a)Harald Norvik, Vice Chairperson 8,000 (a)Holly Van Deursen 2,000 (a)Daniel J. Piette 7,000 (a)Annette Malm Justad --- ---Carol Bell 5,000 (a)Ingar Skaug --- ---Anne Grethe Dalane --- ---Walter Qvam --- ---
Chief Executive Officer and Other Executive OfficersJon Erik Reinhardsen, President and Chief Executive Officer 87,389 (a)Gottfred Langseth, Executive Vice President and Chief Financial Officer 36,190 (a)Guillaume Cambois, Executive Vice President Imaging and Engineering 9,038 (a)Magne Reiersgard, Executive Vice President Operations 17,427 (a)Per Arild Reksnes, Executive Vice President Marine Contract 14,791 (a)Sverre Strandenes, Executive Vice President MultiClient 16,746 (a)
(a) Less than 1% of the Company’s share as of December 31, 2013.
Note 26 – Related Party Transactions
The following transactions were carried out with related parties:
Year ended December 31,(In millions of US dollars) 2013 2012 2011Sale of goods and servicesAssociates – MultiClient data 5.6 1.9 2.3 Associates – Administrative services 0.1 0.3 0.2 Associates – Data processing services - 0.6 2.3 Associates – Reservoir services 0.4 1.2 0.9
Purchase of goods and servicesThe Kongsberg Group Companies (a) 3.9 n/a n/a
OtherAssociates – Interest income 0.3 0.2 0.2
(a) The Director Mr. Walter Qvam is CEO of the Kongsberg Group and the disclosed transactions are for the period since his election on November 21, 2013 to year end.
The table below detail the outstanding balances with related parties for the years presented:December 31,
(In millions of US dollars) 2013 2012Loan to associate (note 16) 10.0 3.4 Convertible loan to associate (note 16) - 12.8
All transactions with related parties are priced on an arm’s length basis.
Directors of the Company are also on the Board of certain customers and suppliers. As of December 31, 2013 and 2012, the Company did not have any signif-icant outstanding balances with any of these companies.

PGS Annual report 2013
92PETROLEUM GEO-SERVICESNOTES
Note 27 – Employee Share Option and Restricted Stock Unit programs
Options and shares granted under the Company's employee option programs are as follows:
Grant Year Options on
shares/shares granted Additional
options granted year Additional
options granted Description2008 3,060,000 2009 40,000 Employee option program 2009 3,012,500 2010 190,000 Employee option program 2010 1,476,500 2011 28,000 Employee option program 201 1 1,469,000 - - Employee option program 2012 542,300 - - Restricted Stock Plan (RSU) 2013 768,425 - - Restricted Stock Plan (RSU)
The programs The Company’s option programs are considered as equity-settled plans and the options are measured at fair value at date of grant. For the 2008 and 2009 plans one third of the options vest each of the three years subsequent to the date of grant. The first exercise date is one year after grant date. For the 2010 and 2011 plans, the options vest 3 and 4 years, respectively, after the date of grant for each half of the award. The options may only be exercised four times each year, during a defined period after the publication of the Company’s quarterly earnings release. The latest possible exercise date for each plan is five years subsequent to the grant date.
The Restricted Stock Unit programs ("RSU") requires the participant's continued employment with the Company (or a subsidiary) and is settled three years after grant. Upon settlement, the participant will receive at no charge a number of shares in the Company which equals the number of RSUs awarded.
Share option conditionsUnder the 2008-2011 option programs, the number of options subject to exercise by an employee in a calendar year may not exceed the amount which would result in a gain in excess of 1.5 times the employee's salary for the calendar year. The options include a service condition as the individuals participat-ing in the plan must be employed by the Company for a certain period of time in order to earn the right to exercise the options.
Vesting of options granted in the 2011 program is subject to achievements of strategic goals related to business growth and profitability, HSEQ, new build program and internal control. The Board of Directors shall at year end 2014 assess the Company’s achievement of these goals and decide the percentage of options to be vested and that may be exercised subject to the limitations in the preceding paragraph. Options that are not declared vested within four years after the grant date will not become vested or exercisable. Other than for the 2011 program the options include no performance conditions.
Exercise priceThe exercise price for share options granted corresponds to the weighted average trading price for the Company’s ordinary shares on the Oslo Stock Exchange, at the date of grant for the 2008 to the 2011 options.
Effect on financial statementsFor the years ended December 31, 2013, 2012 and 2011, the Company recognized compensation cost with a corresponding increase in shareholders’ equity of $6.2 million, $5.1 million and $5.1 million, respectively. Total net unrecognized compensation cost as of December 31, 2013 was $12.2 million (related to non-vested share-based options and RSU's), which is expected to be recognized over a period of 3 years.
The tables below detail the Company’s outstanding options and share awards (RSU) for the years presented.
Year-ended December 31, 2013
Grant date
Options outstanding
December 31, 2012 Options
exercised in 2013 Options
forfeited in 2013 Options
expired in 2013
Options outstanding
December 31, 2013
Weighted- average remaining
contractual term
Options exercisable
December 31, 2013 2008 2,408,666 - (65,000) (2,343,666) - - - 2009 680,111 (186,829) (7,000) - 486,282 0.4 years 486,282 2010 1,438,500 (35,000) (44,000) - 1,359,500 1.4 years 736,248 201 1 1,427,500 - (76,000) - 1,351,500 2.4 years - Total 5,954,777 (221,829) (192,000) (2,343,666) 3,197,282 1.6 years 1,222,530
Grant date
RSU share awards outstanding
December 31, 2012
Shares granted in 2013
Shares forfeited
in 2013
RSU outstanding December 31,
2013
Weighted-average remaining
contractual term 2012 528,300 - (17,100) 511,200 1.4 years 2013 - 768,425 (5,500) 762,925 2.4 years Total 528,300 768,425 (22,600) 1,274,125 2.0 years

PGS Annual report 2013
93PETROLEUM GEO-SERVICESNOTES
Year-ended December 31, 2012
Grant date
Options outstanding
December 31, 2011 Options
exercised in 2012 Options
forfeited in 2012 Options
expired in 2012
Options outstanding
December 31, 2012
Weighted-average remaining
contractual term
Options exercisable
December 31, 2012 2007 165,000 - - (165,000) - - - 2008 2,434,666 - (26,000) - 2,408,666 0.4 years 2,408,666 2009 1,617,425 (925,535) (11,779) - 680,111 1.4 years 680,111 2010 1,538,500 (60,000) (40,000) - 1,438,500 2.4 years 66,667 201 1 1,482,000 - (54,500) - 1,427,500 3.4 years - Total 7,237,591 (985,535) (132,279) (165,000) 5,954,777 1.7 years 3,155,444
Grant date
RSU share awards outstanding
December 31, 2011
Shares granted in 2012
Shares forfeited
in 2012
RSU outstanding December 31,
2012
Weighted-average remaining
contractual term 2012 - 542,300 (14,000) 528,300 2.4 years Total - 542,300 (14,000) 528,300 2.4 years
The following share options, granted under the share option plans, were exercised for all years presented:
Year ended December 31, 2013 Year ended December 31, 2012
Grant date Options exercised Exercise date Share price at
exercise date Options exercised Exercise date Share price at
exercise date 2009 93,585 February 20, 2013 NOK 96.6527 205,679 February 24, 2012 NOK 85.5154 2009 15,000 May 6, 2013 NOK 85.7439 8,666 May 14, 2012 NOK 74.5693 2009 29,686 July 31, 2013 NOK 80.3358 497,373 August 1, 2012 NOK 89.1462 2010 35,000 July 31, 2013 NOK 80.3358 60,000 August 1, 2012 NOK 89.1462 2009 43,558 October 31, 2013 NOK 72.2214 213,817 October 31, 2012 NOK 98.8904 2009 5,000 November 7, 2013 NOK 74.5014 Total 221,829 985,535
The table below details the Company’s assumptions used to calculate estimated fair value at grant date:
Grant date
Options and shares
outstanding December 31,
2013 Average
exercise price
Weighted average share
price at grant date
Risk free rate
Dividend yield
Volatility factor
Weighted average life
Estimated fair value at grant date (average
NOK/USD per share option)
2009 486,282 NOK 40.30 NOK 40.30 2.28% - 55% 2.4 years NOK 13.25/$2.08 2010 1,359,500 NOK 78.31 NOK 78.31 2.30-2.45% - 60% 3.5 years NOK 28.24/$4.57 201 1 1,351,500 NOK 77.19 NOK 77.19 2.61-2.76% - 60% 3.5 years NOK 30.35/$5.63 2012 (a) 511,200 NOK 0 NOK 67.65 N/A - N/A N/A NOK 59.80/$9.73 2013 (a) 762,925 NOK 0 NOK 83.85 N/A - N/A N/A NOK 72.80/$11.97 Total 4,471,407
(a) Restricted Stock Units ("RSU")
Expected volatility for all grants is based on historical volatility of the Company’s shares after emerging from Chapter 11 in November 2003. As a result of unusually high volatility during the international financial distress 2008 to 2009, the Company has estimated volatility for the 2009, 2010 and 2011 grants in order to reflect the expected volatility going forward.
There are no traded options of the Company’s shares and there are no post vesting restrictions included in the option plan.

PGS Annual report 2013
94PETROLEUM GEO-SERVICESNOTES
Note 28 – Salaries and Other Personnel Costs, Number of Employees, and Remuneration to the Board of Directors, Executive Officers and Auditors
Salary and social expenses that are included in cost of sales, research and development costs and selling, general and administrative costs consist of:
Year ended December 31,(In millions of US dollars) 2013 2012 2011Salaries and bonuses 271.4 279.4 258.0 Social security 21.1 24.3 20.9 Pension 15.8 18.3 7.8 Other benefits 29.6 36.8 31.3 Total 337.9 358.8 318.0
The Company had an average of 2,245, 2,227 and 2,149 employees during the years ended December 31, 2013, 2012 and 2011, respectively.
Chief Executive Officer (CEO) and Other Executive OfficersIn 2013, the Company paid compensation to its President and CEO and other executive officers as follows:
Total compensation paid in 2013 (a)
Fixedsalary
Bonus (b)
Other benefits (c)
Total paidsalary and
compensation(in dollars)
Benefits paid to
pension plan (d)
Accrued targetbonus as of
December31, 2013Name Position
Jon Erik Reinhardsen President and Chief Executive Officer 908,818 1,221,538 89,215 2,219,572 61,351 478,989
Gottfred Langseth Executive Vice President and Chief Financial Officer 592,777 529,459 75,306 1,197,543 65,760 207,658
Guillaume Cambois Executive Vice President,Imaging and Engineering 544,657 435,154 69,668 1,049,479 42,469 189,740
Magne Reiersgard Executive Vice President, Operations 506,089 410,000 17,040 933,129 76,320 178,875
Per Arild Reksnes Executive Vice President, Marine Contract 569,100 435,154 90,928 1,095,181 103,753 189,740
Sverre Strandenes Executive Vice President, MultiClient 569,100 435,154 100,549 1,104,802 104,557 189,740
(a) Amounts in NOK have been translated to US Dollars using average exchange rate for 2013 of NOK/USD 5.86.(b) Includes payments for the 2012 performance bonus plan (paid in March 2013).(c) Includes items such as car allowance, telephone, internet and other minor benefits. In addition, taxable gain on exercised share options.(d) Contribution to defined benefit plans and defined contribution plans (Norway).
Share options and RSUs held by the CEO and executive officers at December 31, 2013 were as follows:
Name
Options and RSUs as of
December 31, 2012
Options and RSUs
granted 2013
Options and RSUs forfeited
2013
Options exercised
2013
Average exercise price
on exercised options (NOK)
Options expired
2013
Options and RSUs as of
December 31, 2013
Average exercise price on
outstanding options
(NOK)
Weighted average
remaining contractual
term Jon Erik Reinhardsen 430,000 41,500 - - - (150,000) 321,500 61.67 1.5 years Gottfred Langseth 258,000 24,900 - - - (90,000) 192,900 61.67 1.5 years Guillaume Cambois 173,000 24,900 - - - (45,000) 152,900 69.84 1.7 years Magne Reiersgard 188,000 24,900 - - - (60,000) 152,900 69.84 1.7 years Per Arild Reksnes 188,000 24,900 - - - (60,000) 152,900 69.84 1.7 years Sverre Strandenes 229,000 24,900 - - - (90,000) 163,900 67.29 1.6 years

PGS Annual report 2013
95PETROLEUM GEO-SERVICESNOTES
In 2012, the Company paid compensation to its President and CEO and other executive officers as follows:
Total compensation paid in 2012 (a)
Fixed salary
Bonus (b)
Other
benefits(c)
Total paidsalary and
compensation(in dollars)
Benefits paid to
pension plan (d)
Accrued targetbonus as of
December31, 2012Name Position
Jon Erik Reinhardsen President and Chief Executive Officer 889,431 573,373 543,691 2,006,495 60,470 1,053,742
Gottfred Langseth Executive Vice President and Chief Financial Officer 560,640 187,111 339,978 1,087,729 65,636 456,730
Guillaume Cambois Executive Vice President, Imaging and Engineering 535,143 196,412 34,408 765,962 42,201 417,582
Magne Reiersgard Executive Vice President, Operations 490,164 159,865 186,956 836,985 74,160 390,638
Per Arild Reksnes Executive Vice President, Marine Contract 557,942 170,777 179,944 908,664 103,563 417,582
Sverre Strandenes Executive Vice President, MultiClient 557,942 227,154 289,938 1,075,035 104,373 417,582
(a) Amounts in NOK have been translated to US Dollars using average exchange rate for 2012 of NOK/USD 5.813.(b) Includes payments for the 2011 performance bonus plan (paid in April 2012).(c) Includes items such as car allowance, telephone, internet and other minor benefits. In addition taxable gain on exercised share options.(d) Contribution to defined benefit plans and defined contribution plans (Norway).
Share options and RSUs held by the CEO and executive officers as of December 31, 2012 were as follows:
Name
Options and RSUs as of
December 31, 2011
Options and RSUs
granted 2012
Options and RSUs forfeited
2012
Options exercised
2012
Average exercise price
on exercised options
(NOK)
Options expired
2012
Options and RSUs as of
December 31, 2012
Average exercise price on
outstanding options (NOK)
Weighted average
remaining contractual
term Jon Erik Reinhardsen 450,000 30,000 - 50,000 (a) 39.19 - 430,000 81.88 1.49 Years Gottfred Langseth 270,000 18,000 - 30,000 (b) 39.19 - 258,000 81.88 1.49 Years Guillaume Cambois 155,000 18,000 - --- --- - 173,000 78.73 2.02 Years Magne Reiersgard 190,000 18,000 - 30,000 (c) 39.19 - 188,000 82.98 1.90 Years Per Arild Reksnes 190,000 18,000 - 20,000 (d) 40.29 - 188,000 82.98 1.90 Years Sverre Strandenes 240,000 19,000 - 30,000 (e) 39.19 - 229,000 87.12 1.69 Years
(a) $509,284 was reported as taxable income as a consequence of the exercise of share options.(b) $305,570 was reported as taxable income as a consequence of the exercise of share options.(c) $165,582 was reported as taxable income as a consequence of the exercise of share options.(d) $154,139 was reported as taxable income as a consequence of the exercise of share options.(e) $255,531 was reported as taxable income as a consequence of the exercise of share options.
See note 25 for shares held by the Company’s CEO and other executive officers and note 27 for further information on the share based payments programs.
CEO key employment termsJon Erik Reinhardsen, President and CEO of the Company, had an annual fixed salary of NOK 4,990,000 in 2013. The CEO has a mutual 6-months period of notice. The CEO is, both during and after the employment, obliged to refrain from taking employment with companies that are direct or indirect competi-tion with PGS. This prohibition applies for a period of two years from the termination date unless the Company sets a shorter period of time.
Other executive officers have similar provisions in their employment terms, with periods of notice of twelve months or less.
Further information on compensation of the CEO and other executive officers are provided in the statement on remuneration below.
Board of DirectorsNone of our Directors has any contract with us providing benefits upon termination of service.

PGS Annual report 2013
96PETROLEUM GEO-SERVICESNOTES
The table below provides information about our Directors and compensation paid during 2013:
CompensationName Position Director since Term expire (In US dollars)Francis Gugen Chairperson 2003 2014 125,250 Harald Norvik Vice Chairperson 2003 2014 92,750 Holly Van Deursen Director 2006 2014 103,750 Daniel J. Piette Director 2007 2014 104,750 Annette Malm Justad Director 2008 2014 80,750 Carol Bell Director 2009 2014 94,750 Ingar Skaug Director 2009 2014 80,000 Anne Grethe Dalane Director 2013 2014 6,542 Walter Qvam Director 2013 2014 6,542
Total 695,084
The table below provides information about our Directors and compensation paid during 2012:
Name Position Director since Term expireCompensation (In US dollars)
Francis Gugen Chairperson 2003 2013 115,028 Harald Norvik Vice Chairperson 2003 2013 91,500 Holly Van Deursen Director 2006 2013 96,526 Daniel J. Piette Director 2007 2013 98,000 Annette Malm Justad Director 2008 2013 77,554 Carol Bell Director 2009 2013 90,250 Ingar Skaug Director 2009 2013 78,554
Total 647,412
See note 25 for shares held by the Company’s Board of Directors.
Board of Directors’ statement on remuneration to the CEO and the Executive Officers In accordance with section 6-16a of the Norwegian Public Limited Companies Act, the Board of Directors has prepared a statement related to the determi-nation of salary and other benefits for our CEO and other executive officers. The guidelines set out below for our CEO and other executive officers salary and other benefits, for the coming fiscal year, will be presented to the shareholders for their advisory vote at the May 2014 Annual General Meeting.
PGS is an international company operating in the global geophysical industry. Our operations are conducted world-wide and our employment base is and needs to be largely international. The total compensation package for our CEO and other executive officers shall therefore be competitive both within the Norwegian labor market and internationally. Both the level of total compensation and the structure of the compensation package for our CEO and other executive officers shall be such that it may attract and retain highly qualified international leaders. This will require the use of several different instruments and measures also meant to provide incentives for enhanced performance and to ensure common goals and interest between the shareholders and man-agement.
The current remuneration package for our CEO and other executive officers includes fixed elements and variable elements. The fixed elements consist of a base salary and other benefits. Other benefits include car allowance, newspaper subscription, mobile phone, internet and similar benefits. The fixed ele-ments also include a defined benefit and a defined contribution pension plan.
The CEO and three executive officers have an early retirement plan allowing for termination of employment without cause when the CEO or the executive officers reach the age of 62. Provided that the CEO or executive officers have been employed as a CEO or an executive officer for 10 years (or in some cases longer) the CEO or the executive officers are entitled to a yearly payment of up to 60% of the last base salary beginning in the year of retirement until the CEO or the executive officers reach the age of 67.
The variable elements today consist of a performance bonus scheme, participation in earlier years’ share option program and participation in restricted stock unit programs.
Participation in the performance bonus scheme and the target levels and the maximum levels of the annual performance bonus scheme are determined annually. Payment under the performance bonus scheme is based partly on achievements of agreed financial key performance indicators (“KPIs”) for the group and partly on achievements of agreed operational, financial and organizational KPIs included in a personal performance contract.
The Group KPIs are financial targets set by the Board of Directors at the start of each fiscal year. The Group KPIs are then broken down to business unit KPIs.

PGS Annual report 2013
97PETROLEUM GEO-SERVICESNOTES
The CEO and other executive officers’ personal performance contract for a given year therefore contains such Group or business unit KPI goals as well as KPI goals linked to other personal measures of success such as HSE, operational effectiveness and organizational development.
The annual performance bonus for the CEO is approved by the Board of Directors in a meeting, based on recommendations from the Remuneration and Corporate Governance Committee. The annual performance bonus scheme for the other executive officers are reviewed and approved by the Remuneration and Corporate Governance Committee on the CEO’s recommendation, and the executive officers’ achievements under the scheme are also reviewed by the Remuneration and Corporate Governance Committee.
In 2013 the CEO participated in a performance bonus scheme where he was entitled to a cash bonus provided the Company and the CEO met certain finan-cial and non-financial performance targets. The target bonus for the CEO which assumes that the company goals and the CEO’s individual goals are met is a cash bonus of 85% of the CEO’s annual base salary. This target bonus can be increased or decreased in cases of performance above or below the targets set for the CEO and the Company. Other executive officers, listed above, who were employed by the Company during 2013 and remain employed as of March 1, 2014 are participants in a bonus scheme where they are entitled to a cash bonus targeted at 57% of the respective executive’s annual base salary. The target bonus can be increased or decreased in cases of performance above or below the targets set for the executive and the Company. The CEO’s performance bonus is capped at 150% of base salary, the executive officers’ at 100% of base salary.
The Board of Directors will continue to use this scheme for determining the level of annual performance bonus in the coming financial year.
The Annual General Meetings in 2012 and 2013 authorized a performance based restricted stock unit program in order to ensure continued long term incen-tives which are linked to the development of the Company’s share price. The Board of Directors will propose to the 2014 Annual General Meeting a Perfor-mance based Restricted Stock Unit program similar to the 2013 program. Under the 2014 Performance based Restricted Stock Unit program the Board of Directors will, based on the previous year’s performance against specific targets, propose a pool of Restricted Stock Units which will be granted to eligible employees in 2014. The targets and achievement against such targets are disclosed in the calling notice to the 2014 Annual General Meeting.
Settlement of these Restricted Stock Units and subsequent transfer to the eligible employee of shares in the Company will take place three years later subject principally to further employment by the Company. The full Performance based Restricted Stock Plan including all terms and conditions will be pre-sented to the Annual General Meeting in May 2014 for approval.
This statement deals primarily with the remuneration of our CEO and other executive officers. However, the above described remuneration policy is to a large extent applicable to a broad group of key employees within the Company. Enhanced performance by the management groups is not achieved by our CEO and other execu-tive officers alone but rather is dependent on a large number of managers and key employees throughout the Company. Therefore, a large and increasing number of managers and key employees are included in performance based remuneration schemes, which contain all or some of the above mentioned elements. More than 500 employees within the Company are currently eligible for performance based remuneration. In addition, all other employees may receive up to a maximum of one month salary in annual bonus. The level of this bonus is determined by the Board of Directors based on the financial results of the Company.
Remuneration of the CEO and other executive officers are evaluated regularly by the Remuneration and Corporate Governance Committee and the Board of Directors. The Remuneration and Corporate Governance Committee annually reviews the total compensation level, the mix between fixed and performance related compensation and the mix between short, medium and long term compensation. The Remuneration and Corporate Governance Committee has developed an annual schedule in order to ensure and facilitate a structured approach to the annual review of executive compensation. The committee has also engaged an external advisor for this work.
A specific peer group of comparable companies and an executive remuneration philosophy has been adopted. The peer group currently consists of seven-teen companies from Norway, Europe and the Americas. All companies are of comparable size and with international operations within the oil service sec-tor. The external advisor collects and combines relevant information on the companies in the peer group. This is used by the Remuneration and Corporate Governance Committee and the Board of Directors for benchmarking of executive remuneration. The executive remuneration philosophy document includes certain targets and guidelines on how the Company’s CEO and executives should compare to the peer group. These tools amongst others, are used by the Remuneration and Corporate Governance Committee and the Board of Directors to decide on an appropriate remuneration structure and to set appropriate total remuneration for the CEO and executive officers.
Since the Annual General Meeting in May 2013 the Board of Directors have followed the guidelines then approved by the Annual General Meeting with respect to remuneration of the CEO and the other executive officers.
Remuneration of auditorFees for audit and other services provided by the Company’s auditor are as follows (exclusive VAT and including out of pocket expenses):
Year ended December 31,(In millions of US dollars) 2013 2012 2011Audit fees 2.6 2.7 2.9 Other attestation services and tax services (a) 0.3 0.1 0.2 Total 2.9 2.8 3.1
(a) Fees for tax services consist of fees for tax filing services and other tax assistance.

PGS Annual report 2013
98PETROLEUM GEO-SERVICESNOTES
Note 29 – Subsidiaries
The ownership percentage in subsidiaries as of December 31, 2013, was as follows:
Company Jurisdiction Shareholding
and voting rightsPGS Onshore (Algeria) EURL Algeria 100%
PGS Australia Pty. Ltd. Australia 100%
Seahouse Insurance Ltd. Bermuda 100%
PGS Investigacào Petrolifera Limitada Brazil 100%
PGS Onshore do Brazil Ltda. Brazil 100%
PGS Onshore Servicos Ltda. Brazil 100%
PGS Suporte Logistico e Servicos Ltda. Brazil 100%
PGS Overseas Trading (Cyprus) Ltd. Cyprus 100%
PGS Data Processing Middle East SAE Egypt 100%
PGS Egypt for Petroleum Services Egypt 100%
PT PGS Nusantara Indonesia 94%
Oslo Challenger Plc Isle of Man 100%
Oslo Explorer Plc Isle of Man 100%
Oslo Seismic Services Ltd. Isle of Man 100%
PGS Marine Services (Isle of Man) Ltd. Isle of Man 100%
PGS Shipping (Isle of Man) Ltd. Isle of Man 100%
PGS Japan K.K. Japan 100%
PGS (Kazakhstan) LLP Kazakhstan 100%
PGS Asia Pacific Labuan Ltd. Labuan 100%
Petroleum Geo-Services Exploration (M) Sdn. Bhd. Malaysia 100%
PGS Data Processing & Technology Sdn. Bhd. Malaysia 100%
PGS Data Processing S.A. de C.V Mexico 100%
Smart Technical Solutions Company S.A. de C.V Mexico 100%
Technical Geophysical Solutions Company S.A. de C.V Mexico 100%
PGS Geophysical (Netherlands) B.V. Netherlands 100%
PGS Exploration (Nigeria) Ltd. Nigeria 100%
Arrow Seismic ASA Norway 100%
Dalmorneftegeofizika PGS AS Norway 49%
Multiklient Invest AS Norway 100%
PGS Falcon AS Norway 100%
PGS Geophysical AS Norway 100%
PGS Overseas AS Norway 100%
PGS Shipping AS Norway 100%
PGS Support AS Norway 100%
PGS Titans AS Norway 100%
Petroleum Geological Services LLC Oman 100%
Natuna Ventures Pte. Ltd. Singapore 100%
Petroleum Geo-Services Asia Pacific Pte. Ltd. Singapore 100%
PGS Technology (Sweden) AB Sweden 100%
Arrow Seismic Invest II Ltd. United Kingdom 100%
Arrow Seismic Invest III Ltd. United Kingdom 100%
Arrow Seismic Invest IV Ltd. United Kingdom 100%
Arrow Seismic Invest V Ltd. United Kingdom 100%
Arrow Seismic Invest VI Ltd. United Kingdom 100%
Panoceanic Energy Limited United Kingdom 100%
Petroleum Geo-Services (UK) Ltd. United Kingdom 100%
PGS EM Limited United Kingdom 100%
PGS Exploration (UK) Ltd. United Kingdom 100%
PGS Geophysical (Angola) Ltd. United Kingdom 100%
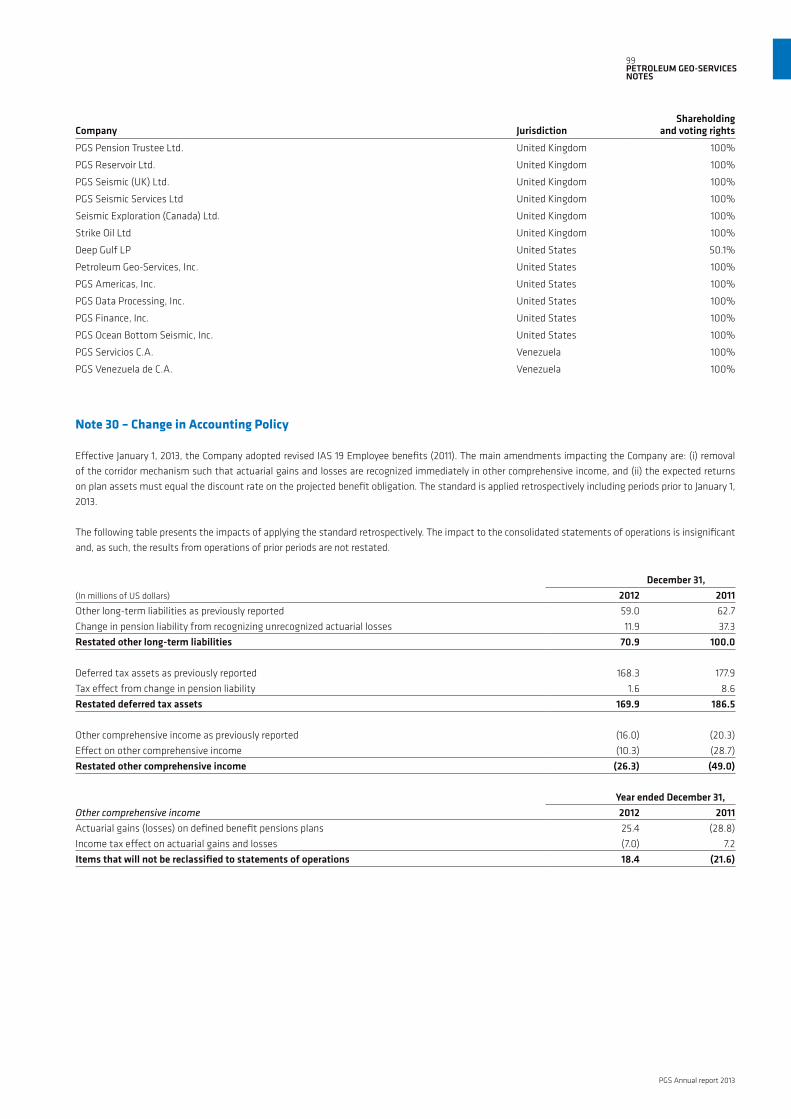
PGS Annual report 2013
99PETROLEUM GEO-SERVICESNOTES
Company Jurisdiction Shareholding
and voting rightsPGS Pension Trustee Ltd. United Kingdom 100%
PGS Reservoir Ltd. United Kingdom 100%
PGS Seismic (UK) Ltd. United Kingdom 100%
PGS Seismic Services Ltd United Kingdom 100%
Seismic Exploration (Canada) Ltd. United Kingdom 100%
Strike Oil Ltd United Kingdom 100%
Deep Gulf LP United States 50.1%
Petroleum Geo-Services, Inc. United States 100%
PGS Americas, Inc. United States 100%
PGS Data Processing, Inc. United States 100%
PGS Finance, Inc. United States 100%
PGS Ocean Bottom Seismic, Inc. United States 100%
PGS Servicios C.A. Venezuela 100%
PGS Venezuela de C.A. Venezuela 100%
Note 30 – Change in Accounting Policy
Effective January 1, 2013, the Company adopted revised IAS 19 Employee benefits (2011). The main amendments impacting the Company are: (i) removal of the corridor mechanism such that actuarial gains and losses are recognized immediately in other comprehensive income, and (ii) the expected returns on plan assets must equal the discount rate on the projected benefit obligation. The standard is applied retrospectively including periods prior to January 1, 2013.
The following table presents the impacts of applying the standard retrospectively. The impact to the consolidated statements of operations is insignificant and, as such, the results from operations of prior periods are not restated.
December 31,(In millions of US dollars) 2012 2011Other long-term liabilities as previously reported 59.0 62.7 Change in pension liability from recognizing unrecognized actuarial losses 11.9 37.3 Restated other long-term liabilities 70.9 100.0
Deferred tax assets as previously reported 168.3 177.9 Tax effect from change in pension liability 1.6 8.6 Restated deferred tax assets 169.9 186.5
Other comprehensive income as previously reported (16.0) (20.3)Effect on other comprehensive income (10.3) (28.7)Restated other comprehensive income (26.3) (49.0)
Year ended December 31,Other comprehensive income 2012 2011Actuarial gains (losses) on defined benefit pensions plans 25.4 (28.8)Income tax effect on actuarial gains and losses (7.0) 7.2 Items that will not be reclassified to statements of operations 18.4 (21.6)

PGS Annual report 2013
100PETROLEUM GEO-SERVICESNOTES
Note 31 – Subsequent Events
Delivery of Ramform AtlasThe Ramform Titan-class vessel Ramform Atlas was delivered in January 2014.
Term loanIn March 2014, the Term Loan was resized from $470.5 million to $400 million and the maturity extended to March 2021. The margin on the extended facil-ity changed from LIBOR + 1.75% to LIBOR (with a floor of 0.75%) + 2.50%. The security of the loan remains unchanged as described in note 19. As a result of this refinancing, deferred loan costs from the original instrument loan and the reserve related to hedging of the interest rate on the loan held in equity will be expensed in the total of $6.4 million, net of tax.
Export credit financingIn March 2014, the Company established Export Credit Financing of $305 million for the two Ramform Titan-class vessels scheduled for delivery in 2015 (note 14). The lenders are Japan Bank for International Cooperation ("JBIC") and Sumitomo Mitsui Banking Corporation ("SMBC") with Nippon Export and Investment Insurance ("NEXI") insuring the SMBC portions of the loans. The loans will have a tenor of 12 years from delivery of the vessels with semi-annual equal installments. Lenders will have first priority mortgage in the two vessels. Half the loan will bear fixed interest rate while the other half will have a revolving 6 months floating interest plus a margin.
Termination of Norwegian defined benefit planIn 2014, the Company decided to terminate the Norwegian defined benefit plan. During 2014, further pension benefit vesting will cease under this plan and the participants will be transferred to the defined contribution plan. The plan assets will be transferred to a 3rd party insurance company who in exchange will assume responsibility for making all benefit payments under that plan. Upon plan termination and transferring of the assets and related obligation tothe 3rd party insurance company in 2014, the net pension liability, comprised of the project benefit obligation net of plan assets, will be de-recognized. As of December 31, 2013 the net pension liability related to this plan is approximately $13.1 million.
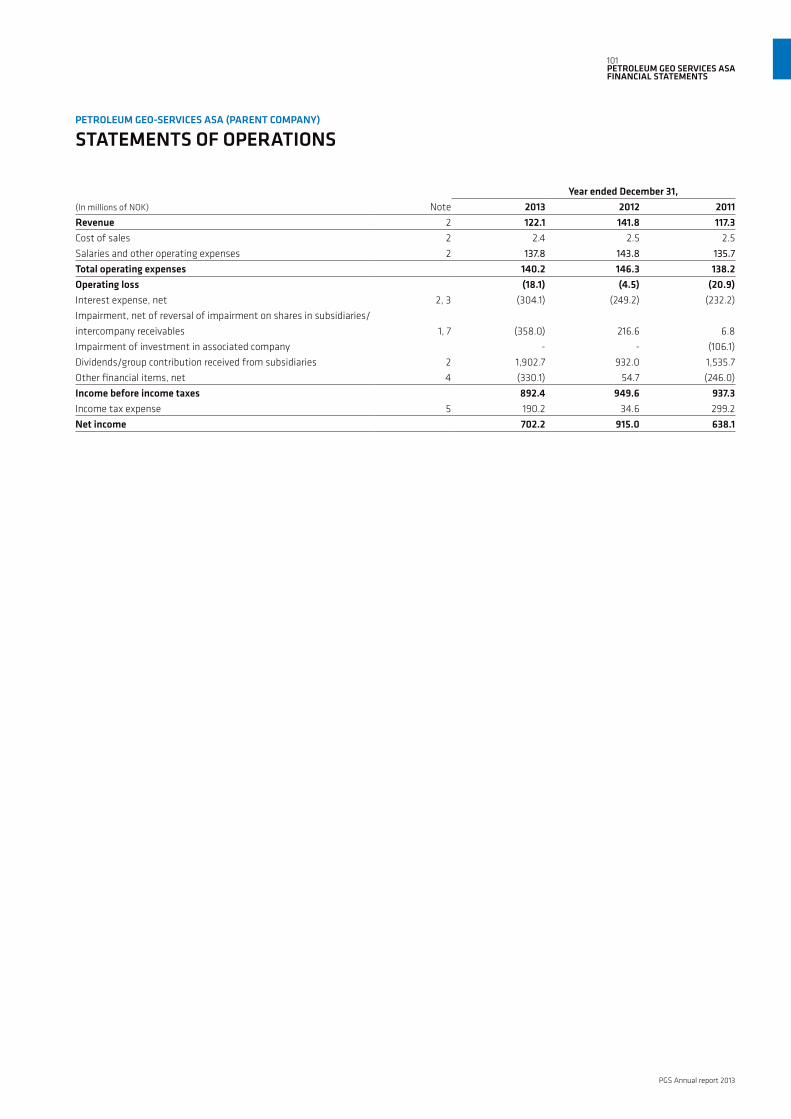
PGS Annual report 2013
101PETROLEUM GEO SERVICES ASAFINANCIAL STATEMENTS
Year ended December 31,(In millions of NOK) Note 2013 2012 2011Revenue 2 122.1 141.8 117.3 Cost of sales 2 2.4 2.5 2.5 Salaries and other operating expenses 2 137.8 143.8 135.7 Total operating expenses 140.2 146.3 138.2 Operating loss (18.1) (4.5) (20.9)Interest expense, net 2, 3 (304.1) (249.2) (232.2)Impairment, net of reversal of impairment on shares in subsidiaries/ intercompany receivables 1, 7 (358.0) 216.6 6.8 Impairment of investment in associated company - - (106.1)Dividends/group contribution received from subsidiaries 2 1,902.7 932.0 1,535.7 Other financial items, net 4 (330.1) 54.7 (246.0)Income before income taxes 892.4 949.6 937.3 Income tax expense 5 190.2 34.6 299.2 Net income 702.2 915.0 638.1
PETROLEUM GEO-SERVICES ASA (PARENT COMPANY)
STATEMENTS OF OPERATIONS

PGS Annual report 2013
102PETROLEUM GEO-SERVICES ASAFINANCIAL STATEMENTS
December 31,(In millions of NOK) Note 2013 2012ASSETS Restated(1)
Long-term assets:Deferred tax assets 5, 18 546.7 748.9 Shares in subsidiaries 1, 7 12,656.6 13,322.9 Intercompany receivables 1, 7 6,529.1 4,129.7 Total long-term assets 19,732.4 18,201.5 Current assets:Short-term intercompany receivables 19.4 44.0 Other current assets 8 62.8 35.9 Restricted cash 9 2.6 5.7 Cash and cash equivalents 1,268.1 2,036.2 Total current assets 1,352.9 2,121.8 Total assets 21,085.3 20,323.3
LIABILITIES AND SHAREHOLDERS' EQUITYShareholders' equity:Common stock; par value NOK 3; issued and outstanding 217,799,997 shares 10 653.4 653.4 Treasury shares, par value 10 (7.9) (3.0)Additional paid-in capital 10 2,386.6 2,348.7 Total paid in capital 3,032.1 2,999.1 Other equity 10, 18 7,989.6 7,898.6 Total shareholders' equity 11,021.7 10,897.7 Long-term liabilities:Long-term debt 11, 12 5,551.6 5,111.1 Intercompany debt 1 3,848.1 3,723.6 Other long-term liabilities 13, 18 37.6 112.5 Total long-term liabilities 9,437.3 8,947.2 Current liabilities:Short-term intercompany debt 42.3 46.9 Accrued dividend 10 494.8 359.4 Accrued expenses and other short-term liabilities 16 89.2 72.1 Total current liabilities 626.3 478.4 Total liabilities and shareholders' equity 21,085.3 20,323.3 (1) The financial information is restated from retrospectively adopting NRS6 (revised) and IAS19R, see note 18.
PETROLEUM GEO-SERVICES ASA (PARENT COMPANY)
STATEMENTS OF FINANCIAL POSITION
London, March 19, 2014Board of Directors
Petroleum Geo-Services ASA
Francis GugenChairperson
Anne Grethe Dalane
Harald Norvik Vice Chairperson
Annette Malm Justad
Carol Bell
Ingar Skaug
Daniel J. Piette
Walter Qvam
Holly Van Deursen
Jon Erik ReinhardsenChief Executive Officer

PGS Annual report 2013
Year ended December 31,(In millions of NOK) 2013 2012 2011Cash flows provided by (used in) operating activities:Net income 702.2 915.0 638.1 Adjustments to reconcile net income to net cash used in operating activities:Changes in deferred tax assets 202.2 49.4 302.3 Impairment, net of reversal of impairment of shares in and loan to subsidiaries 358.0 (216.6) (6.8)Impairment of investment in associated companies - - 106.1 Dividend/ group contribution (1,902.7) (932.0) (1,535.7)Unrealized foreign exchange (gain) loss 339.7 (231.6) (22.2)Changes in current assets and current liabilities 284.4 247.0 213.3 Other items (23.8) 191.3 232.1 Net cash provided by (used in) operating activities (40.0) 22.5 (72.8)
Cash flows provided by (used in) investing activities:Investment in subsidiaries and changes intercompany receivables, net (13.1) 421.1 (904.5)Repayment of long term receivables, net - 142.2 (156.7)Net cash provided by (used in) investing activities (13.1) 563.3 (1,061.2)
Cash flows provided by (used in) financing activities:Proceeds from issuance of long-term debt (31.8) 884.9 1,729.2 Repayment of long-term debt - - (837.2)Net decrease in bank facility and short-term debt - (1,105.9) - Investment in/ sale of own shares, net (158.7) (26.9) (72.6)Receipts of dividend/ group contribution from group companies - - 535.7 Dividend paid to shareholders of PGS ASA (355.6) (238.5) - Other (314.6) (262.7) (280.1)Net cash provided by (used in) financing activities (860.7) (749.1) 1,075.0 Net decrease in cash and cash equivalents (913.8) (163.3) (59.0)Effect of exchange rate changes on cash and cash equivalents 145.7 (164.4) 64.0 Cash and cash equivalents at beginning of year 2,036.2 2,363.9 2,358.9 Cash and cash equivalents at end of year 1,268.1 2,036.2 2,363.9
PETROLEUM GEO-SERVICES ASA (PARENT COMPANY)
STATEMENTS OF CASH FLOWS
103PETROLEUM GEO-SERVICES ASAFINANCIAL STATEMENTS

PGS Annual report 2013
104PETROLEUM GEO-SERVICES ASANOTES
Note 1 – Summary of Significant Accounting Policies
Petroleum Geo-Services Group (“the Company”) prepares its consolidated financial statements in accordance with International Financial Reporting Stan-dards (“IFRS”) as adopted by the European Union, while Petroleum Geo-Services ASA (“PGS ASA”) prepares its financial statements in accordance with the Norwegian Accounting Act and accounting principles generally accepted in Norway (“N GAAP”).
PGS ASA applies the same accounting policies as described in note 2 in the notes to the consolidated financial statements where relevant, except that unre-alized foreign exchange gain (loss) on long-term intercompany loans is recognized in the statements of operations. The financial statements are presented in Norwegian Kroner (“NOK”).
Shares in subsidiaries (see note 7) are presented at cost less impairment. Impairment is recognized based upon the carrying value of the individual shares and net intercompany receivables in the subsidiaries less the estimated recoverable amount (based on discounted estimated future cash flows). If and when estimated recoverable amounts increase, impairment charges are reversed. There is no fixed plan for repayment of long-term intercompany receiv-ables.
The proposed dividend to shareholders for the year is recognized as a liability at year end because it is considered more likely than not that the dividend will be approved by the General Assembly the following year.
New standard adopted in 2013The Company adopted revised NRS6 and IAS 19 Employee benefits (revised 2011; IAS 19R) effective for annual periods beginning on or after January 1, 2013. The standard is applied retrospectively. The main amendments impacting the Company are: (i) removal of the corridor mechanism such that actuarial gains and losses are recognized immediately in other comprehensive income, and (ii) the expected returns on plan assets must equal the discount rate on the projected benefit obligation. Refer to note 18 for further information.
Note 2 – Intercompany Transactions
PGS ASA has significant intercompany transactions with its subsidiaries. Transactions with subsidiaries are mainly related to business support functions and financing activities. Intercompany transactions in the statements of operations consist of:
Year ended December 31,(In millions of NOK) 2013 2012 2011Revenue 120.1 140.3 116.6 Cost of sales 1.9 2.0 2.0 Salaries and other operating expenses 92.2 115.7 37.5 Interest expense (income), net (note 3) (19.0) (26.7) (35.5)Other financial items, net (note 4) 0.4 (0.6) 35.1 Dividends/group contribution received from subsidiaries (1,902.7) (932.0) (1,535.7)Intercompany transactions, net 1,947.3 981.9 1,613.2
Note 3 – Interest Expense, Net
Interest expense, net, consist of:
Year ended December 31,(In millions of NOK) 2013 2012 2011Interest income, external 19.4 14.4 19.5 Interest income, intercompany 492.4 510.7 442.5 Interest expense, external (342.5) (290.3) (287.2)Interest expense, intercompany (473.4) (484.0) (407.0)Total (304.1) (249.2) (232.2)

PGS Annual report 2013
105PETROLEUM GEO-SERVICES ASANOTES
Note 4 – Other Financial Items, Net
Other financial items, net, consist of:
Year ended December 31,(In millions of NOK) 2013 2012 2011Foreign currency (loss) gain (334.5) 151.7 (154.8)Gain on sale of subsidiaries 4.6 - 6.8 Loss on repurchase of convertible bonds - (43.7) (31.2)Write-down of long term receivables - - (44.7)Other (0.2) (53.3) (22.1)Total (330.1) 54.7 (246.0)
Note 5 – Income Taxes
The income tax expense differs from the amounts computed when applying the Norwegian statutory tax rate to income before income taxes as a result of the following:
Year ended December 31,(In millions of NOK) 2013 2012 2011Income before income taxes 892.4 949.6 937.3 Norwegian statutory tax rate 28% 28% 28%Provision for income taxes at the statutory rate 249.9 265.9 262.5 Increase (reduction) in income taxes from:Change in corporate tax rate 20.9 - - Impairment (reversal) of shares in subsidiaries (51.4) (4.1) 147.7 Non-taxable dividends/ group contribution (196.0) (188.9) (356.2)Permanent difference impairment of intercompany receivables 172.4 (59.4) 249.4 Other permanent items (19.7) 21.1 (10.2)Change in unrecognized deferred tax assets 14.1 - 6.0 Income tax expense 190.2 34.6 299.2
December 31,(In millions of NOK) 2013 2012Temporary differences relates to:Pension liabilities (a) 3.3 2.6 Intercompany receivables 109.7 108.7 Unrealized exchange gain (loss) (2.8) 5.9 Shares in foreign subsidiaries 37.0 94.5 Compensation cost employee share options 8.4 0.7 Interest rate swaps (a) 14.9 28.2 Other 6.2 15.6 Tax losses carried forward 407.0 587.2 Deferred tax assets 583.7 843.4 Deferred tax assets not recognized in statements of financial position (37.0) (94.5)Deferred tax assets 546.7 748.9
(a) Change in deferred tax for actuarial gains/losses on pensions and interest swaps are recognized directly to shareholders’ equity (see note 10, 12 and 14).

PGS Annual report 2013
Note 6 – Property and Equipment
Property and equipment consists of fixtures, furniture and fittings and is summarized as follows:
(In millions of NOK) 2013 2012Purchase cost as of January 1 91.0 91.0 Sales/retirements (85.9) - Purchase cost as of December 31 5.1 91.0
Accumulated depreciation as of January 1 89.8 89.5 Sales/retirements (84.7) - Depreciation for the year - 0.3 Accumulated depreciation as of December 31 5.1 89.8
Balance as of December 31 - 1.2
Property and equipment is depreciated between 3 to 5 years.
Note 7 – Shares in Subsidiaries and Intercompany Receivables
Shares in subsidiaries are recognized in PGS ASA balance sheet at cost less any impairment.
Registered office Shareholding (a)
Book value as of 12/31/2013 (in
millions of NOK)
Equity as of 12/31/2012 (in
millions of NOK)
Net income 2012 (in millions
of NOK)PGS Asia Pacific Pte. Ltd. Singapore 100% 3,148.6 3,030.0 117.0 PGS Geophysical AS Oslo 100% 2,818.8 1,519.7 352.9 Petroleum Geo-Services (UK) Ltd. London 100% 1,302.6 954.6 41.3 PGS Falcon AS Oslo 100% 1,254.5 1,344.3 198.4 PGS Shipping AS Oslo 100% 1,141.0 1,619.0 551.8 Multiklient Invest AS Oslo 100% 989.7 918.6 235.1 Arrow Seismic ASA Oslo 100% 786.9 1,670.8 (72.9)PGS Titans AS Oslo 100% 690.0 707.3 17.3 PGS EM Ltd. Scotland 100% 312.3 (523.4) (28.4)PGS Support AS Oslo 100% 150.0 N/A N/A Oslo Seismic Services Ltd. (IoM) Isle of Man 100% 33.6 144.3 5.0 Seahouse Insurance Ltd. Bermuda 100% 27.6 27.2 (10.1)PGS Japan KK Japan 100% 0.6 11.9 2.2 PGS Exploration (Nigeria) Ltd. Nigeria 100% 0.3 (4.5) (23.6)PGS Overseas AS Oslo 100% 0.1 37.4 (0.5)Petroleum Geo-Services Inc. Houston 100% - 930.1 (51.6)PGS Australia Pty. Ltd. Perth 100% - (109.5) (131.2)PGS de Venezuela CA Venezuela 100% - (15.3) 1.5 PGS Investigacao Petrolifera Ltda. Brazil 99% - (583.5) 22.8 PGS Suporte Logistico e Servicios Ltda. (b) Brazil 1% - (87.0) (43.1)PT PGS Nusantara (Indonesia) Indonesia 93% - (17.6) (25.4)Technical Geophysical Solutions Company Mexico 100% - 0.2 0.6 Total 12,656.6
(a) Voting rights are equivalent to shareholding for all companies.(b) The remaining 99% shareholding is held by PGS Overseas AS.
In 2013, PGS ASA recognized net reversal of impairment charges totaling NOK 183.7 million on shares in subsidiaries, mainly due to equity transfers from group companies to Arrow Seismic ASA. In 2012, PGS ASA recognized a net reversal of impairment charges totaling NOK 14.7 million on shares in subsidiar-ies, which included a NOK 73.3 million impairment charge related to reduced equity in Petroleum Geo-Services Inc. and PGS Australia Pty, and a NOK 88.0 million impairment reversal in Petroleum Geo-Services (UK) Ltd. In 2011 PGS ASA recognized a NOK 421.3 million net impairment charge on shares in subsid-iaries, mainly related to reduced equity in Petroleum Geo-Services Inc. and other US subsidiaries.
106PETROLEUM GEO-SERVICES ASANOTES

PGS Annual report 2013
In 2013 PGS ASA recognized impairment charges on intercompany receivables totaling NOK 541.7 million while in 2012 and 2011, PGS ASA reversed previ-ously recognized impairment charges NOK 201.9 million and NOK 428.1 million, respectively.
As of December 31, 2013, PGS ASA has accumulated impairment charges related to shares in subsidiaries and intercompany receivables totaling NOK 4.6 billion and NOK 1.6 billion, respectively.
For additional information on impairment of shares in subsidiaries and intercompany receivables, see note 1.
Note 8 – Other Current Assets
Other current assets consist of:
December 31,(In millions of NOK) 2013 2012Short term receivables 40.3 20.3 Unrealized gain hedge contracts (note 12) 19.4 14.2 Other 3.1 1.4 Total 62.8 35.9
Note 9 – Restricted Cash
Restricted cash as of December 31, 2013 and 2012 consists of payroll withholding taxes.
Note 10 – Shareholders’ Equity
Changes in shareholders’ equity for the years ended December 31, 2013 and 2012 are as follows:
Paid-in capital
(In millions of NOK)Common
stockOwn shares,
par valueAdditional
paid-in capitalOther
equityShareholders’
equityBalance as of December 31, 2011 653.4 (3.7) 2,319.8 7,311.8 10,281.3 Effect of retrospectively adopting NRS6 (revised) and IAS 19R (1) - - - 8.4 8.4 Restated balance as of January 1, 2012 653.4 (3.7) 2,319.8 7,320.2 10,289.7 Acquired treasury shares - (2.5) - (64.2) (66.7)Transferred shares, conversion of convertible notes - 0.1 - 6.0 6.1 Employee benefit plans - 3.1 4.8 38.7 46.6 Employee share options recharged to subsidiaries - - 24.1 - 24.1 Interest rate swaps (net of tax) - - - 38.3 38.3 Dividend to shareholders - - - (359.4) (359.4)Difference between accrued and paid dividend for 2011 - - - 1.1 1.1 Actuarial gains and losses charged to equity (net of tax) - - - 2.9 2.9 Net income - - - 915.0 915.0 Restated balance as of December 31, 2012 653.4 (3.0) 2,348.7 7,898.6 10,897.7 Acquired treasury shares - (5.6) - (162.5) (168.1)Employee benefit plans - 0.7 6.4 8.7 15.8 Employee share options recharged to subsidiaries - - 31.5 - 31.5 Interest rate swaps (net of tax) - - - 33.9 33.9 Actuarial gains and losses charged to equity (net of tax) - - - (0.3) (0.3)Dividend to shareholders - - - (494.8) (494.8)Difference between accrued and paid dividend for 2012 - - - 3.8 3.8 Net income - - - 702.2 702.2 Balance as of December 31, 2013 653.4 (7.9) 2,386.6 7,989.6 11,021.7 (1) The financial information is restated from retrospectively adopting NRS6 (revised) and IAS19R, see note 18.
As of December 31, 2013 and 2012 share capital is NOK 653,399,991 consisting of 217,799,997 shares of par value NOK 3, each fully paid (see note 25 to the consolidated financial statements).
107PETROLEUM GEO-SERVICES ASANOTES

PGS Annual report 2013
All shares have equal voting rights and are entitled to dividends. Distribution of PGS ASA’s equity is dependent upon the approval of the shareholders, and the ability to make distributions is limited by certain debt covenants and Norwegian Corporate Law (see note 19 to the consolidated financial statements). A listing of PGS ASA’s largest shareholders is provided in note 25 to the consolidated financial statements.
For the year ended December 31, 2013, PGS ASA expect to distribute a dividend of NOK 494.8 million. For the year ended December 31, 2012, PGS ASA dis-tributed a dividend of NOK 355.6 million.
Note 11 – Debt and Guarantees
Long-term debtLong-term debt consists of the following:
December 31,(In millions of NOK) 2013 2012Secured:Term loan B, Libor + 175 Basic points, due 2015 2,860.8 2,628.6 Senior notes, Coupon 7.375%, due 2018 2,736.0 2,513.9 Total 5,596.8 5,142.5 Less current portion - - Less deferred loan costs, net of debt premiums (45.2) (31.4)Total long-term debt 5,551.6 5,111.1
Undrawn facilities consists of the following:December 31,
(In millions of NOK) 2013 2012Secured:Revolving credit facility, due 2018 (a) 3,040.0 1,955.3 Unsecured: Bank facility (NOK 50 mill) 50.0 50.0 Performance bond 88.8 96.8 Total 3,178.8 2,102.0
(a) The Senior secured credit facility was amended and extended in September 2013, the Company may now borrow an additional sum of secured debt: $1,850 million (NOK 11.2 billion) less the sum of (A) any RCF commitments outstanding, (B) Term Loans outstanding and (C) Permitted vessel financing indebtedness outstanding, either as a term loan or as an RCF. Such potential additional borrowing is not committed (except for secured undrawn debt in the table) but would be secured by the same collateral that secures the Term Loan and borrowings under the existing RCF. As long as the Company stays below a leverage ratio of 3:1 it can incur further unsecured debt.
Aggregate maturities of long-term debt are as follows:
(In millions of NOK)
Year of repayment:2014 - 2015 2,860.8 2016 - 2017 - 2018 2,736.0 Thereafter - Total 5,596.8
Senior Secured Credit Facility (Term loan B and Revolving Credit Facility "RCF")The Term Loan is an obligation of PGS ASA and PGS Finance Inc. as co-borrowers, is secured by pledges of shares of material subsidiaries and is guaran-teed by the same material subsidiaries. The Term Loan has no financial maintenance covenants. Any drawings on the “RCF” would be subject to the same security .
In September 2013, the RCF was increased from $350 million (NOK 2.1 billion) to $500 million (NOK 3.0 billion) and the maturity extended to September 2018. The margin on the extended facility changed from LIBOR + 2.25% to an initial margin of LIBOR + 1.75% with utilization fees dependent on the amount drawn (Less than $150 million (NOK 0.9 billion) + 0.25%, between $150 million (NOK 0.9 billion) and $300 million (NOK 1.8 billion) + 0.40%, over $300 mil-lion (NOK 1.8 billion) + 0.60%). The Senior secured credit facility contains financial covenants and negative covenants that restrict the Company in various ways. The facility provides that:
108PETROLEUM GEO-SERVICES ASANOTES

PGS Annual report 2013
1) For the RCF part the total leverage ratio (see note 20 in consolidated financial statements for definitions of leverage ratios) may not exceed 2.75:1.0 (main-tenance covenant). The Term Loan has an incurrence test prohibiting the Company from incurring more indebtedness, with certain exceptions, (described in footnote (a) in the table above) if the total leverage is above 3.00:1.0 (rolling last 4 quarters).
2) The credit agreement generally requires the Company to apply 50% of excess cash flow to repay outstanding borrowings for financial years when the total leverage ratio exceeds 2.5:1 or the senior secured leverage ratio exceeds 2:1. Excess cash flow for any period is defined as net cash flow provided by operating activities less capital expenditures and scheduled debt services during that period, minus capital income taxes to be paid in the next period and capital expenditure committed in the period but to be paid in future periods. The Company can make optional prepayments to reduce the outstanding prin-cipal balance at no penalty.
In addition, the credit agreement and the indenture to the $450 million (NOK 2.7 billion) Senior notes (described below) restricts or could restrict the Company's ability, among other things, to sell assets without the sales proceeds being reinvested in the business or used to repay debt; incur additional indebtedness or issue preferred shares; prepay interest and principal on our other indebtedness; pay dividends and distributions or repurchase our capital stock; create liens on assets; make investments, loans, guarantees or advances; make acquisitions; engage in mergers or consolidations; enter into sale and leaseback transactions; engage in transactions with affiliates; amend material agreements governing our indebtedness; change our business; enter into agreements that restrict dividends from subsidiaries; and enter into speculative financial derivative agreements.
The RCF had a $45 million (NOK 273.6 million) sub-limit for issuance of letters of credit, which was increased from $45 million (NOK 273.6 million) to $60 million (NOK 364.8 million) in the second amendment to the credit agreement described above. The separate bonding facility of $30 million (NOK 182.4 million) (for issuance of bid and performance bonds) which was originally included in the sub-limit of the RCF, was discontinued during 2012. Under the RCF, the Company may borrow USD, or any other currency freely available in the London banking market to which the lenders have given prior consent, for work-ing capital and for general corporate purposes. At December 31, 2013 and 2012, the Company had zero outstanding in cash advances, and zero outstanding standby letters of credit under the RCF.
Senior notesIn December 2012, the Company issued $150 million (NOK 0.9 billion) add on to the $300 million (NOK 1.8 billion) Senior notes (issued in November 2011) at a premium of 107.5% of the principal amount. Both the Senior notes issued in 2011 and 2012 will be treated as a single class of debt securities under the same indenture. The Senior notes are senior obligations of the company and rank equally in right of payment with all other existing and future senior debt. The Senior notes have an incurrence test prohibiting the Company from incurring more indebtedness, with certain exceptions, if the consolidated interest coverage ratio is less than 2.0:1.0. At any time prior to December 15, 2015, the Company may redeem the Senior notes at its option, in whole or in part, at a redemption price equal to 100% of the principal amount thereof plus the applicable premium as of, and accrued and unpaid interest to, the date of redemption. Applicable premium means the greater of (i) 1.0% of the principal amount of the Senior notes; and (ii) the excess of (a) the present value at such redemption date of the redemption price of the Senior notes at December 15, 2015 (such redemption price being set forth in the table appearing below plus all required interest payments due on the Senior notes during the period from such redemption date through December 15, 2015 (excluding accrued but unpaid interest), computed using a discount rate equal to the treasury rate as of such redemption date plus 50 basis points, over (b) the principal amount of the Senior notes, if greater. The Senior notes are also redeemable at the Company’s option on or after December 15, 2015, in whole or in part, at the redemp-tion prices (expressed as percentages of principal amount) set forth below, plus accrued and unpaid interest thereon to the applicable redemption date, if redeemed during the 12-month period beginning December 15 of the years indicated below:
Year Percentage2015 103.69%2016 101.84%2017 and thereafter 100.00%
Convertible notesIn 2012, the Company redeemed, at its option, the remaining Convertible notes for a nominal amount $190.6 million (NOK 1.2 billion) at an average price of 100.51%.
Letters of credit and guaranteesPGS ASA had aggregate outstanding letters of credit and related types of guarantees (including counter guarantees), not reflected in the accompanying financial statements, of $5.9 million (NOK 35.3 million) and $3.6 million (NOK 20.1 million) as of December 31, 2013 and 2012, respectively.
Note 12 – Financial Instruments
Fair values of financial instrumentsThe carrying amounts of cash and cash equivalents, restricted cash, accounts receivable, accrued revenues and other receivables, other current assets, accounts payable and accrued expenses approximate their respective fair values because of the short maturities of those instruments.
109PETROLEUM GEO-SERVICES ASANOTES

PGS Annual report 2013
PGS ASA disclose the hierarchy of how fair value is determined for financial instruments recorded at fair value in the financial statements as follows:
Level 1: quoted prices (unadjusted) in active markets for identical assets and liabilities.Level 2: assets and liabilities whose values are based on quoted prices in markets that are not active or model inputs that are observable either directly or
indirectly.Level 3: techniques for which all inputs which have a significant effect on the recorded fair value that is not based on observable market data.
The fair values of the long-term debt instruments, forward exchange contracts and interest rate swaps are estimated using quotes obtained from dealers in such financial instruments or latest quoted prices or indexes at Reuters or Bloomberg. Where market prices are not observed or quotes from dealers are not obtained, an indirect method is used by use of implied credit spread from debt instrument with similar risk characteristics.
The carrying amounts, estimated fair values of debt and derivatives instruments including how fair value is determined are summarized as follows:
December 31, 2013 December 31, 2012
(In millions of NOK)Carrying
amountsFair
values LevelCarrying
amountsFair
values LevelFinancial assets measured at fair valueForward exchange contracts used for hedging 0.6 0.6 2 7.3 7.3 2 Other foreign exchange contracts 18.8 18.8 2 7.3 7.3 2
Financial liabilities measured at fair valueForeign exchange contracts used for hedging (9.8) (9.8) 2 - - - Other foreign exchange contracts (3.7) (3.7) 2 (1.7) (1.7) 2 Interest rate swaps used for hedging - - 2 (100.7) (100.7) 2 Interest rate swaps not hedge accounted (50.6) (50.6) 2 - -
Financial liabilities not measured at fair valueDebt with fixed interest rate (2,736.0) (2,932.4) 2 (2,514.0) (2,669.0) 2 Debt with variable interest rate (2,860.8) (2,878.7) 2 (2,628.5) (2,574.6) 2
Interest rate exposurePGS ASA is subject to interest rate risk on debt, including finance leases. The risk is managed by using a combination of fixed -and variable rate debt, together with interest rate swaps, where appropriate, to fix or lower the borrowing costs.
December 31, 2013 December 31, 2012
(In millions of NOK) Notional amounts Weighted average
interest rate Notional amounts Weighted average
interest rateDebt at fixed interest rate 2,736.0 7.38% 2,514.0 7.38%Debt at variable interest rate based on US dollar plus a margin 2,860.8 1.92% 2,628.5 2.00%Variable interest rate debt with interest fixed 1,824.0 3.50% 1,676.0 3.50%
Foreign exchange rate exposurePGS ASA and its subsidiaries is exposed to currency fluctuation due to the effects of a predominantly USD based revenue stream, while the companies operating expenses and capital expenditures are mainly denominated in USD, GBP, NOK and EUR. PGS ASA maintains a foreign currency risk management strategy that uses foreign currency exchange contracts to protect against fluctuations in cash flow caused by volatility in currency exchange rates. PGS ASA had open forward contracts to buy and sell GBP, NOK, BRL, JPY and GBP, NOK, SGD, BRL and EUR at December 31, 2013 and 2012, respectively.
Note 13 – Other Long-Term Liabilities
Other long-term liabilities consist of:
December 31,(In millions of NOK) 2013 2012Unrealized loss hedge contracts (note 12) 25.0 100.6 Pension liability (note 14) 12.6 9.2 Other long-term liabilities - 2.7 Total 37.6 112.5
110PETROLEUM GEO-SERVICES ASANOTES

PGS Annual report 2013
Note 14 – Pension Obligations
PGS ASA is required to maintain a pension plan in accordance with the Norwegian Pension Benefit Act. The pension plans of PGS ASA comply with the requirements set forth in the Norwegian Pension Benefit Act.
Defined benefit plan PGS ASA sponsors a defined benefit pension plan for certain Norwegian employees, in total 6 participants. This plan is funded through contributions to an insurance company and the insurance company undertakes the responsibility to pay the pension benefits. It is PGS ASA’s general practice to fund amounts to this defined benefit plan in amounts sufficient to meet applicable statutory requirements. As of January 1, 2005, the defined benefit plan was closed for further entrants and a new defined contribution plan was established for new employees (see section below).
The components of net periodic pension cost for PGS ASA’s defined benefit pension plan is summarized as follows:
Year ended December 31,(In millions of NOK) 2013 2012 2011Service cost 2.3 2.8 2.5 Interest cost 0.7 0.5 0.6 Expected return on plan assets (0.7) (0.5) (0.7)Amortization of actuarial gain - (0.9) (1.4)Administrative costs 0.1 0.1 0.1 Payroll tax 0.4 0.4 0.4 Net periodic pension cost 2.8 2.4 1.5
The aggregate funded status of the plan and amounts recognized in Other long-term liabilities (see note 13) is as follows:
December 31,(In millions of NOK) 2013 2012Projected benefit obligations 20.1 18.9 Fair value of plan assets 9.1 10.9 Funded status 11.0 8.0 Accrued payroll tax 1.6 1.2 Net pension liability (a) 12.6 9.2
(a) In 2014 PGS ASA decided to terminate the Norwegian defined benefit plan. See note 31 in the consolidated financial statements for further information.
The accumulated actuarial gains recognized in other equity are as follows:
December 31,(In millions of NOK) 2013 2012Accumulated actuarial gains 15.4 15.7 Deferred tax (4.4) (4.4)Accumulated actuarial gains recognized towards other equity 11.0 11.3
Assumptions used to determine benefit obligations:
December 31,2013 2012
Discount rate 4.0% 3.8%Return on plan assets 4.0% 4.0%Compensation increase 3.5% 3.0%Annual adjustment to pensions 0.6% 0.2%
Defined contribution planAs described above under “Defined Benefit Plan”, as of January 1, 2005, PGS ASA closed the defined benefit plan for further entrants and a new defined contribution plan was established for new employees. PGS ASA’s contributions to this plan for the years ended December 31, 2013 and 2012 was NOK 1.7 million and NOK 1.4 million, respectively.
111PETROLEUM GEO-SERVICES ASANOTES

PGS Annual report 2013
Note 15 – Commitments
PGS ASA’s operating lease commitments relate to estimated office rent from group companies, and expire in 2024. Future minimum payments related to non-cancelable operating leases existing at December 31, 2013 are as follows:
(In millions of NOK) December 31, 2013 (a)2014 1.8 2015 1.8 2016 1.8 2017 1.8 2018 1.8 Thereafter 9.3 Total 18.3
(a) Includes estimated office lease for the periods displayed.
Rental expense for operating leases, including leases with terms of less than one year, was NOK 4.4 million, NOK 9.8 million and NOK 8.3 million for the years ended December 31, 2013, 2012 and 2011, respectively.
Note 16 – Accrued Expenses and Other Short-Term Liabilities
Accrued expenses and other short-term liabilities consist of the following:
December 31,(In millions of NOK) 2013 2012Accrued unrealized loss on hedging (note 12) 39.1 1.8 Accrued employee benefits 15.8 27.4 Foreign taxes 13.4 11.1 Accrued interest expense 9.0 8.2 Account payables 9.4 6.2 Other 2.5 17.4 Total 89.2 72.1
Note 17 – Salaries and Other Personnel Costs, Number of Employees, and Remuneration to the Board of Directors, Executive Officers and Auditors
Salary and social expenses that are included in cost of sales and selling and general and administrative costs consist of:
Year ended December 31,(In millions of NOK) 2013 2012 2011Salaries and bonus 52.9 70.2 54.0 Social security 4.5 10.9 8.0 Pension 4.5 5.3 2.8 Other benefits 6.6 3.5 4.6 Total 68.5 89.9 69.4
As of December 31, 2013, PGS ASA had 30 full time employees. Average labor years for the years ended December 31, 2013 and 2012 were 31 and 33, respectively.
Compensation to Board of Directors, CEO and Other Executive OfficersFor a full listing of Board of Directors, CEO and Other Executive Officers and their compensation, see note 28 to the consolidated financial statements.
PGS ASA has not provided loans or guarantees to the Board of Directors, CEO or Other Executive Officers as of December 31, 2013.
Share option programsIn the 2008, 2009, 2010 and 2011 PGS ASA established employee share option programs and granted options to certain key employees. In 2012 and 2013, PGS ASA established Restricted Stock Unit programs (RSU) which requires the participant's continued employment with PGS ASA and is settled through receipt of shares in PGS ASA three years after grant. See note 27 to the consolidated financial statements for further information on the share option pro-grams and RSU.
112PETROLEUM GEO-SERVICES ASANOTES

PGS Annual report 2013
For the years ended December 31, 2013, 2012 and 2011, PGS ASA recorded compensation costs of NOK 6.4 million, NOK 4.8 million and NOK 4.4 million, respectively, recognized in additional paid-in capital. Total net unrecognized compensation cost as of December 31, 2013 was NOK 12.1 million related to non-vested share-based options and RSU's, which is expected to be recognized over a period of 2.5 years.
In 2013 and 2012, 221,829 and 985,535 options, respectively, were exercised under the PGS Group share option programs. PGS ASA used own treasury shares to facilitate these transactions and recognized a charge of NOK 9.4 million and NOK 41.8 million in shareholders’ equity in 2013 and 2012, respectively. Share option costs related to non-PGS ASA employees are recharged to subsidiaries.
Remuneration of auditor Fees for audit and other services provided by PGS ASA’s auditor are as follows (exclusive VAT and inclusive out of pocket expenses):
Year ended December 31,(In millions of NOK) 2013 2012 2011Audit fees 4.2 4.7 3.3 Other attestation services 0.2 - 2.0 Fees for tax services (a) 0.4 0.1 - All other fees 0.2 0.1 0.2 Total 5.0 4.9 5.5
(a) Include fees for tax filing services and other tax assistance.
Note 18 – Change in Accounting Policy
The Company adopted NRS6 Pension cost (revised) and IAS19R Employee Benefits (revised 2011) effective for annual periods beginning on or after January 1, 2013. The standard is applied retrospectively. The main amendments impacting the Company are: (i) removal of the corridor mechanism such that actu-arial gains and losses are recognized immediately towards other equity, and (ii) the expected returns on plan assets must equal the discount rate on the projected benefit obligation.
The following table presents the impact of applying the standard retrospectively. The impact to the statements of operations is insignificant and, as such, the results from operations of prior periods are not restated.
December 31,(In millions of NOK) 2012 2011Other long-term liabilities as previously reported 128.2 145.4Change in pension liability from recognizing unrecognized actuarial gains (15.7) (11.7)Restated other long-term liabilities 112.5 133.7
Deferred tax assets as previously reported 753.3 802.8Tax effect of change in pension liability (4.4) (3.3)Restated deferred tax assets 748.9 799.5
Other equity as previously reported 7,887.3 7,311.8 Effect on Other equity 11.3 8.4 Restated other equity 7,898.6 7,320.2
113PETROLEUM GEO-SERVICES ASANOTES

PGS Annual report 2013
114PETROLEUM GEO-SERVICES
AUDITOR’S REPORT

PGS Annual report 2013
115PETROLEUM GEO-SERVICES

PGS Annual report 2013
116PETROLEUM GEO-SERVICES116PETROLEUM GEO SERVICESNOTES
OsloPetroleum Geo-Services ASA(Headquarters)Lilleakerveien 4CP.O.Box. 251 LilleakerN-0216 Oslo, NorwayTel: +47 67 52 64 00
HoustonPetroleum Geo-Services, Inc.15150 Memorial DriveHouston, Texas 77079, USATel: +1 281 509 8000
LondonPetroleum Geo-Services (UK) Ltd.4 The HeightsBrooklandsWeybridgeSurrey KT13 0NY, UKTel: +44 1932 37 6000
SingaporePetroleum Geo-Services Asia Pacific Pte. Ltd111 Somerset Road# 15-05/06Triple One SomersetSingapore 23 81 64Tel: + 65 6735 6411
Angola Luanda
Australia Perth
Brazil Rio de Janeiro
China Beijing
Egypt Cairo (Maadi office and Nasr City office)
India Mumbai and New Delhi
Indonesia Jakarta
Japan MakuhariNagasakiTokyo (Toranomon and Uchisaiwai)
Kazakhstan Almaty
Malaysia CyberjayaKuala Lumpur
Mexico Villahermosa
Netherland Leiden
Nigeria Lagos
Norway BergenOsloStavanger
Russia Gelendjik Moscow
Singapore Singapore
Sweden Stockholm
Turkmenistan Ashgabat
UK EdinburghWeybridge
USA Austin Houston (Memorial Office, Park Row 10 and Westway Park)
Vietnam Hanoi
PGSMAINOFFICES
OTHER OFFICES

Design and layout Itera Gazette Photo Nadia Frantzen and PGS.

The dual-sensor GeoStreamer technology has proved its ability to reveal reservoir details and properties of unrivalled resolution
ANN
UAL REPORT 2013