ph. d thesis by shafiq ur rahmanprr.hec.gov.pk/jspui/bitstream/123456789/7306/1/... · certificate...
TRANSCRIPT

PHARMACOGNOSTIC STUDIES
ON
TRILLIUM GOVANIANUM WALL. Ex. ROYLE
Ph. D Thesis
By
SHAFIQ UR RAHMAN
DEPARTMENT OF PHARMACY
UNIVERSITY OF PESHAWAR, PESHAWAR, PAKISTAN
2015

PHARMACOGNOSTIC STUDIES
ON
TRILLIUM GOVANIANUM WALL. Ex. ROYLE
SHAFIQ UR RAHMAN
A THESIS SUBMITTED TO THE DEPARTMENT OF PHARMACY,
UNIVERSITY OF PESHAWAR
IN PARTIAL FULFILLMENT FOR THE DEGREE OF
DOCTOR OF PHILOSOPHY
IN
PHARMACEUTICAL SCIENCES
DEPARTMENT OF PHARMACY
UNIVERSITY OF PESHAWAR, PESHAWAR, PAKISTAN
2015

CERTIFICATE OF APPROVAL
This thesis, entitled, “Pharmacognostic studies on Trillium govanianum Wall. Ex.
Royle” submitted by Mr. Shafiq ur Rahman to University of Peshawar is hereby approved and recommended as partial fulfillment for the award of Degree of “Doctor
of Philosophy in Pharmaceutical Sciences”. Prof. Dr. Muhammad Ismail __________________________
Research Supervisor
Department of Pharmacy
University of Peshawar
Prof. Dr. Muhammad Saeed __________________________
Chairman
Department of Pharmacy
University of Peshawar
Prof. Dr. Taous Khan _________________________
External Examiner Department of Pharmacy COMSATS Institute of Information Technology, Abbottabad
DEPARTMENT OF PHARMACY
UNIVERSITY OF PESHAWAR, PESHAWAR, PAKISTAN
2015

Acknowledgements
First of all I bow down my head to the Omnipotent, the most Merciful and the
Compassionate Al-Mighty ALLAH, Who gave me the courage and provided me all
the resources to complete this Ph.D. Project. I wish to pay homage to the most perfect
personality of the world Hazrat Muhammad (PBUH), who enlightened our minds to
recognize our Creator. My research work would not have been possible without the
help, support, and guidance of many people to whom I want to convey my cordial
gratitude.
I would like to thank my supervisor, Prof. Dr. Muhammad Ismail, for his guidance,
support, understanding and patience during the entire period of my studies. I am very
thankful for his admirable supervision, continuous encouragement during my Ph.D.
studies.
I am thankful to Prof. Dr. Muhammad Saeed, sitting Chairman, Department of
Pharmacy, University of Peshawar, for his support and encouragement throughout my
research studies. I am also grateful to Meritorious Professor. Dr. Zafar Iqbal (T.I)
and Prof. Dr. Fazal Subhan for their inspiring guidance and support during the
course of this PhD project.
I am thankful to Dr. Muhammad Raza Shah, Dr. Achyut Adhikari, Dr. Itrat Anis,
Dr. Muhammad Ateeq, Dr. Burhan and Mr. Farid, International Centre for
Chemical and Biological Sciences (ICCBS), H.E.J. Research Institute of Chemistry,
University of Karachi, Karachi for their help and facilitation during this long course
of research studies.
I am obliged to Prof. Dr. Jamshaid Ali Khan, Dr. Amir Zada Khan, Dr. Fazal
Nasir, Dr. Inam Ullah, Dr. Muhammad Ismail, Dr. Fazal Khuda, Dr. Gohar Ali

and Dr. ZakiUllah Department of Pharmacy, University of Peshawar for their
support.
I would like to thank Dr. Muhammad Khurram (Chairman), Mr. Shujat Ahmad,
Mr. Asaf Khan, Mr. Abidullah, Mr. Imad Afzal and all Teaching, Clerical and
Laboratory Staff, Department of Pharmacy, Shaheed Benazir Bhutto University,
Sheringal Dir (U) for their cooperation. I feel indebted to Dr. Farman Ali and Dr.
Abdul Khaliq Jan, Department of Chemistry, Shaheed Benazir Bhutto University,
Sheringal Dir (U) for their assistance.
I want to extend special thanks to my dear friends Dr. Saeed Ahmad Khan, Mr.
Arsalan, Mr. Farhad Ullah, Mr. Khalid, Mr. Tahir Ali, Mr. Sajid Khan Sadozai,
Mr. Muhammad Shahid, Mr. Irfan Ullah and Mr. Muzaffar Abbas.
Last but not the least; I am very thankful to my sweet Parents, wife, brother, sisters,
my uncle retired Principal Mr. Fazal Halim, and all relatives for their prayers,
support and kindness throughout my studies.
Shafiq ur Rahman

Table of Contents
List of Tables................................................................................................................ i List of Figures............................................................................................................... iv List of Abbreviations.................................................................................................... vi List of Publications from Thesis................................................................................... vii Summary....................................................................................................................... 1 1. Introduction.......................................................................................................... 4 1.1 Medicinal plants.......................................................................................................... 4 1.2 Plants metabolites........................................................................................................ 5 1.3 Traditional medicines and drug discovery................................................................... 7 1.4 Biodiversity of Indo-Pak Subcontinent........................................................................ 10 1.5 The Family Trilliaceae................................................................................................. 11 1.6 Genus Trillium............................................................................................................. 12 1.6.1 Species of genus Trillium................................................................................................ 13 1.6.2 Phytochemical profiling of genus Trillium...................................................................... 17 1.6.3 Medicinal importance and biological studies of genus Trillium...................................... 28 1.7 Trillium govanianum................................................................................................... 30 1.7.1 Plant Morphology............................................................................................................ 31 1.7.2 Distribution...................................................................................................................... 31 1.7.3 Ethnobotanical Uses......................................................................................................... 31 1.8 Aims and Objectives.................................................................................................... 32 2. Materials and Methods......................................................................................... 33 2.1 Drugs and Chemicals.................................................................................................. 33 2.2 Research centers for experimental studies................................................................... 33 2.3 Physical constants........................................................................................................ 34 2.4 Spectroscopic techniques............................................................................................. 34 2.4.1 UV technique.................................................................................................................... 34 2.4.2 IR technique...................................................................................................................... 34 2.4.3 Mass technique................................................................................................................. 34 2.4.4 Nuclear Magnetic Resonance (NMR) technique.............................................................. 35 2.4.5 Gas Chromatography and Gas Chromatography-Mass Spectrometry.............................. 35 2.4.6 GC-MS identification of components............................................................................... 35 2.5 Chromatographic techniques for isolation and purification of compounds............... 36 2.5.1 Column Chromatography (CC)........................................................................................ 36 2.5.2 Thin layer Chromatography (TLC).................................................................................. 36 2.5.3 Reagents for visualizing the spots.................................................................................. 36 2.5.3.1 Ceric sulphate solution as reagent............................................................................ 37 2.5.3.2 Vanillin solution as reagent...................................................................................... 37 2.6 Ethnomedicinal study.................................................................................................. 37 2.6.1 Site selection.................................................................................................................... 37 2.6.2 Sampling informants and ethnomedicinal data collection................................................. 37 2.7 Plant materials.............................................................................................................. 38 2.7.1 Collection......................................................................................................................... 38 2.7.2 Extraction and fractionation............................................................................................. 38 2.8 Macroscopic and microscopic features of rhizome..................................................... 40 2.9 Physicochemical parameters........................................................................................ 40 2.9.1 Total ash............................................................................................................................ 40 2.9.2 Water soluble ash............................................................................................................. 41 2.9.3 Acid insoluble ash............................................................................................................ 41 2.9.4 Loss on drying................................................................................................................ 41 2.9.5 Extractive values............................................................................................................. 42 2.9.5.1 Methanol soluble extractive value........................................................................... 42 2.9.5.2 Water and other soluble extractive values................................................................ 42 2.10 Phytochemical tests.................................................................................................. 42

2.10.1 Test for alkaloids........................................................................................................... 43 2.10.1.1 Mayer’s test.......................................................................................................... 43 2.10.1.2 Wagner’s test........................................................................................................ 43 2.10.1.3 Hager’s test........................................................................................................... 43 2.10.2 Test for flavonoids............................................................................................. 43 2.10.2.1 Ferric chloride test............................................................................................... . 43 2.10.2.2 Sodium hydroxide test.......................................................................................... 44 2.10.3 Test for tannins.................................................................................................. 44 2.10.3.1 Ferric chloride test............................................................................................... . 44 2.10.3.2 Lead Acetate test................................................................................................... 44 2.10.4 Test for saponins................................................................................................ 44 2.10.5 Test for steroids................................................................................................. 45 2.10.6 Test for sterols................................................................................................... 45 2.10.6.1 Salkowski’s test.................................................................................................... 45 2.10.6.2 Liebermann-Burchard test...................................................................................... 45 2.10.7 Test for glycosides............................................................................................. 45 2.10.8 Test for carbohydrates....................................................................................... 46 2.10.8.1 Molisch’s test....................................................................................................... 46 2.10.8.2 Benedict’test......................................................................................................... 46 2.10.8.3 Fehling’s test........................................................................................................ 46 2.11 Isolation of compounds............................................................................................ 47 2.11.1 Isolation of compounds from CHCl3 fraction............................................................... 47 2.11.2 Isolation of compound from butanol fraction.............................................................. 53 2.12 Characterization of isolated compounds.................................................................. 55 2.12.1 Characterization of hexadecanoic acid (compound 1)................................................. 55 2.12.2 Characterization of β-sitosterol (compound 2)............................................................ 56 2.12.3 Characterization of stigmasterol (compound 3).......................................................... 57 2.12.4 Characterization of diosgenin (compound 4).............................................................. 58 2.12.5 Characterization of pennogenin (compound 5)........................................................... 59 2.12.6 Characterization of govanic acid (compound 6)......................................................... 60 2.12.7 Characterization of 20-hydroxy ecdysone and 5,20-dihydroxy ecdysone
(compound 7 and 8) ................................................................................................... 61
2.12.8 Characterization of 5, 20-hydroxy ecdysone (compound 8)....................................... 62 2.12.9 Characterization of borassoside E (compound 9)....................................................... 63 2.12.10 Characterization of govanoside A (compound 10)..................................................... 64 2.13 Biological studies.................................................................................................... 65 2.13.1 In vitro biological activities......................................................................................... 65 2.13.1.1 Antibacterial activity............................................................................................. 65 2.13.1.2 Antifungal activity................................................................................................ 65 2.13.1.3 Antioxidant activity.............................................................................................. 66 2.13.1.4 Anticancer activity................................................................................................ 67 2.13.1.5 Anti-inflammatory activity................................................................................... 68 2.13.1.6 Anti leishmanial activity....................................................................................... 68 2.13.1.7 Brine shrimp cytotoxicity..................................................................................... 69 2.13.1.8 Insecticidal activity............................................................................................... 69 2.13.1.9 Protein antiglycation activity................................................................................ 70 2.13.1.10 Smooth muscle relaxant activity........................................................................... 71 2.13.1.11 β-Glucuronidase inhibitory activity....................................................................... 72 2.13.1.12 α-Chymotrypsin inhibitory activity....................................................................... 73 2.13.1.13 Thymidine phosphorylase inhibitory activity........................................................ 73 2.13.1.14 Acetylcholinesterase inhibitory activity................................................................. 74 2.13.2 In vivo biological studies.................................................................................. 75 2.13.2.1 Experimental animals............................................................................................ 75 2.13.2.2 Acute toxicity test.................................................................................................. 75 2.13.2.3 Anti-inflammatory activity..................................................................................... 75 2.13.2.4 Analgesic activity.................................................................................................. 76

2.13.2.4.1 Tonic-visceral chemical induced nociception test............................................ 76 2.13.2.4.2 Hot plate test..................................................................................................... 77 3. Results and Discussion....................................................................................... 78 3.1 Ethnomedicinal studies.............................................................................................. 78 3.2 Morphological studies............................................................................................... 83 3.2.1 Macroscopic features................................................................................................... 83 3.2.2 Microscopic features................................................................................................... 83 3.3 Physicochemical studies............................................................................................. 85 3.4 Phytochemical studies................................................................................................. 88 3.4.1 Qualitative Phytochemical screening............................................................................ 88 3.4.2 GCMS analysis of n-hexane fraction............................................................................ 90 3.4.3 Isolation of compounds................................................................................................. 92 3.4.3.1 Structure-elucidation of compound 1..................................................................... 92 3.4.3.2 Structure-elucidation of compound 2..................................................................... 94 3.4.3.3 Structure elucidation of compound 3..................................................................... 96 3.4.3.4 Structure elucidation of compound 4..................................................................... 98 3.4.3.5 Structure elucidation of compound 5..................................................................... 100 3.4.3.6 Structure elucidation of compound 6, a new compound......................................... 103 3.4.3.7 Structure-elucidation of compound 7..................................................................... 107 3.4.3.8 Structure elucidation of compound 8..................................................................... 110 3.4.3.9 Structure elucidation of compound 9..................................................................... 112 3.4.3.10 Structure elucidation of compound 10, a new compound...................................... 117 3.5 Biological studies....................................................................................................... 123 3.5.1 In vitro biological activities.......................................................................................... 123 3.5.1.1 Antibacterial activity............................................................................................. 123 3.5.1.2 Antifungal activity................................................................................................ 126 3.5.1.2.1 Antifungal activity of Cr. MeOH-Ext and fractions....................................... 126 3.5.1.2.2 Antifungal activity of isolated compounds..................................................... 126 3.5.1.3 DPPH free radical scavenging activity of Cr. MeOH-Ext and fractions.............. 130 3.5.1.4 Anticancer activity............................................................................................... 133 3.5.1.4.1 Anticancer activity of Cr. MeOH-Ext and fractions...................................... 133 3.5.1.4.2 Anticancer activity of isolated compounds.................................................. 133 3.5.1.5 Anti-inflammatory activity (Oxidative burst assay)............................................ 136 3.5.1.5.1 Anti-inflammatory activity of Cr. MeOH-Ext and fractions.......................- 136 3.5.1.5.2 Anti-inflammatory activity of isolated compounds...................................... 136 3.5.1.6 Anti leishmanial activity of Cr. MeOH-Ext and fractions.................................... 139 3.5.1.7 Insecticidal activity of Cr. MeOH-Ext and fractions............................................ 140 3.5.1.8 Brine shrimp cytotoxic activity of Cr. MeOH-Ext and fractions.......................... 143 3.5.1.9 Muscle relaxant (Spasmolytic) activity of Cr. MeOH-Ext.................................. 146 3.5.1.10 Antiglycation activity of Cr. MeOH-Ext and fractions......................................... 149 3.5.1.11 β-Glucuronidase inhibitory activity of Cr. MeOH-Ext and fractions.................... 150 3.5.1.12 α-Chymotrypsin inhibitory activity of Cr. MeOH-Ext and fractions.................... 152 3.5.1.13 Thymidine phosphorylase inhibitory activity of isolated compounds.................. 152 3.5.1.14 Acetylcholinesterase inhibitory activity of Cr. MeOH-Ext and fractions............. 153 3.5.2 In vivo biological studies.................................................................................. 155 3.5.2.1 Acute toxicity........................................................................................................ 155 3.5.2.2 Anti-inflammatory activity of Cr. MeOH-Ext and fractions................................. 155 3.5.2.3 Analgesic activity of Cr. MeOH-Ext and fractions................................................ 161 3.5.2.3.1 Tonic-visceral chemical induced nociception............................................... 161 3.5.2.3.2 Thermal induced nociception........................................................................ 162 Concluding Remarks.................................................................................................... 168 References.................................................................................................................... 169

List of Tables
Table 1.1 Important drugs discovered from plants with their ethnomedical
correlations and sources
8
Table 1.2 Natural product derived drugs in market since 2005 9
Table 1.3 Species of genus Trillium 14
Table 1.4 List of phytochemicals isolated from genus Trillium 17
Table 1.5 Reported biological activities of genus Trillium 29
Table 1.6 Taxonomical classification of T. govanianum 30
Table 2.1 Drugs and chemicals used with their sources 33
Table 2.2 Characterization of hexadecanoic acid 55
Table 2.3 Characterization of β-sitosterol 56
Table 2.4 Characterization of stigmasterol 57
Table 2.5 Characterization of diosgenin 58
Table 2.6 Characterization of pennogenin 59
Table 2.7 Characterization of govanic acid (a new compound) 60
Table 2.8 Characterization of 20-hydroxyecdysone 61
Table 2.9 Characterization of 5,20-dihydroxyecdysone 62
Table 2.10 Characterization of borassoside E 63
Table 2.11 Characterization of govanoside A (a new compound) 64
Table 3.1 Informants and therapeutic uses of T. govanianum rhizomes in different districts of Khyber Pakhtunkhwa
82
Table 3.2 Preliminary phytochemical profile of T. govanianum rhizomes 89
Table 3.3 Chemical composition of n-Hex-fr of T. govanianum rhizomes 91
Table 3.4 1H-NMR and 13C-NMR data of compound 1 93
Table 3.5 1H-NMR and 13C-NMR data of compound 2 95
Table 3.6 1H-NMR and 13C-NMR data of compound 3 97
Table 3.7 1H-NMR and 13C-NMR data of compound 4 99
Table 3.8 1H-NMR and 13C-NMR data of compound 5 102
Table 3.9 1H-NMR and 13C-NMR data of compound 6 105
Table 3.10 1H-NMR and 13C-NMR data of compound 7 109
Table 3.11 1H-NMR and 13C-NMR data of compound 8 111
i

Table 3.12 1H-NMR and 13C-NMR data of compound 9 115
Table 3.13 1H-NMR and 13C-NMR data of compound 10 120
Table 3.14 Antibacterial results of Cr. MeOH-Ext and fractions of T. govanianum rhizomes
125
Table 3.15 Antifungal activity of Cr. MeOH-Ext and fractions of T. govanianum rhizomes
128
Table 3.16 Antifungal activity of compounds isolated from T. govanianum rhizomes
129
Table 3.17 DPPH free radical scavenging activity of T. govanianum extract, fractions and standards (ascorbic acid and BHT)
131
Table 3.18 Anticancer activity of T. govanianum rhizomes Cr. MeOH-Ext, fractions and reference drug (doxorubicin) against cancer cells
135
Table 3.19 Anticancer activity of compounds isolated from T. govanianum rhizomes
135
Table 3.20 Anti-inflammatory effect of T. govanianum rhizomes Cr. MeOH-Ext, fractions and isolated compounds
138
Table 3.21 Leishmanicidal activity of Cr. MeOH-Ext and fractions of T. govanianum rhizomes
140
Table 3.22 Insecticidal activity of Cr. MeOH-Ext and its subsequent fractions of T. govanianum rhizomes against an insect Tribolium castaneum
142
Table 3.23 Insecticidal activity of Cr. MeOH-Ext and its subsequent fractions of T. govanianum rhizomes against an insect Rhyzopertha dominica
142
Table 3.24 Brine shrimp cytotoxic activity of Cr. MeOH-Ext and fractions of T. govanianum rhizomes
144
Table 3.25 Antiglycation activity of Cr. MeOH-Ext and fractions 150
Table 3.26 IC50 values (µg/mL) of extract and fractions of T. govanianum
rhizomes
151
Table 3.27 α-Chymotrypsin inhibitory activity of Cr. MeOH-Ext and fractions 152
Table 3.28 Thymidine phosphorylase inhibitory activity of isolated compounds 153
Table 3.29 Acetylcholinesterase inhibitory activity of Cr. MeOH-Ext and its fractions
154
Table 3.30 Acute toxicity of Cr. MeOH-Ext of T. govanianum rhizomes 155
ii

Table 3.31 Anti-inflammatory activity Cr. MeOH-Ext and fractions of T.
govanianum rhizomes against carrageenan induced paw edema in mice
158
Table 3.32 Antinociceptive effect of T. govanianum rhizomes Cr. MeOH-Ext and its fractions in tonic-visceral chemical induced nociception
161
Table 3.33 Antinociceptive effect of Cr. MeOH-Ext and fractions of T.
govanianum rhizomes in thermal induced nociception 165
iii
List of Figures
Figure 1.1 Trillium govanianum plant 30
Figure 3.1 Informants for the ethnomedicinal uses of T. govanianum
rhizomes from different districts of Khyber Pakhtunkhwa 81
Figure 3.2 Trillium govanianum plant and rhizomes 83
Figure 3.3 Transverse section of T. govanianum rhizome 84
Figure 3.4 Physicochemical parameters of T. govanianum rhizomes 87
Figure 3.5 Chemical structure of compound 1 93
Figure 3.6 Chemical structure of compound 2 95
Figure 3.7 Chemical structure of compound 3 97
Figure 3.8 Chemical structure of compound 4 99
Figure 3.9 Chemical structure of compound 5 102
Figure 3.10 Chemical structure of compound 6 105
Figure 3.11 Linked scan measurements in compound 6 106
Figure 3.12 Major fragmentation and 1H-1H-COSY correlations in compound 6
106
Figure 3.13 Chemical structure of compound 7 109
Figure 3.14 Chemical structure of compound 8 111
Figure 3.15 Chemical structure of compound 9 116
Figure 3.16 Key HMBC correlations in compound 9 116
Figure 3.17 Chemical structure of compound 10 121
Figure 3.18 Key-HMBC-correlations-in compound 10 121
Figure 3.19 Key-NOESY-correlations-in compound 10
122
Figure 3.20 DPPH free radical scavenging activity of extract and fractions 132
iv

Figure 3.21 Percent cytotoxic effect of Cr. MeOH-Ext and fractions of T.
govanianum rhizomes
145
Figure 3.22 Inhibitory effects of T. govanianum rhizomes Cr. MeOH-Ext and verapamil in isolated rabbit jejunum preparations
148
Figure 3.23 Ca++ concentration response curves (CRCs) of Cr. MeOH-Ext and verapamil in isolated rabbit jejunum preparations
148
Figure 3.24A Anti-inflammatory effect of Cr. MeOH-Ext on carrageenan induced paw edema
159
Figure 3.24B Anti-inflammatory effect of CHL-fr on carrageenan induced paw edema
159
Figure 3.24C Anti-inflammatory effect of EtOAc-fr on carrageenan induced paw edema
160
Figure 3.24D Anti-inflammatory effect of BuOH-fr on carrageenan induced paw edema
160
Figure 3.25 Antinociceptive effect of T. govanianum rhizomes in tonic-visceral chemical induced nociception
162
Figure 3.26A Antinociceptive effect of Cr. MeOH-Ext and fractions after thirty minutes
166
Figure 3.26B Antinociceptive effect of Cr. MeOH-Ext and fractions after sixty minutes
166
Figure 3.26C Antinociceptive effect of Cr. MeOH-Ext and fractions after ninety minutes
167
Figure 3.26D Antinociceptive effect of Cr. MeOH-Ext and fractions after one hour and twenty minutes
167
v

List of Abbreviations
Cr. MeOH-Ext Crude Methanolic extract
n-Hex-fr n-hexane fraction CHL-fr Chloroform fraction
EtOAc-fr Ethyl acetate fraction BuOH-fr Butanol fraction
Aq-fr Aqueous fraction WHO World Health Organization
NP Natural Products ADHD Attention deficit hyperactivity disorder
CVS Cardio vascular system DPPH 2,2-diphenyl-1-picrylhydrazyl
BHT Butylated hydroxytoluene MeOD Methanol CDCl3 Chloroform
CC Column Chromatography TLC Thin Layer Chromatography
GCMS Gas Chromatography Mass Spectrometry ppt Precipitate UV Ultraviolet spectroscopy IR Infrared spectroscopy
NMR Nuclear Magnetic Resonance NOESY Nuclear Overhauser Effect Spectroscopy
COSY Correlation Spectroscopy HMBC Heteronuclear Multiple Bond Coherence HSQC Heteronuclear Singal Quantum Coherence
HREI-MS High Resolution Electron Ionization Mass Spectrometry 1H-NMR Proton Nuclear Magnetic Resonance
13C-NMR Carbon Nuclear Magnetic Resonance HRFAB-MS High Resolution Fast Atomomic Bombardment Mass Spectrometry
DMSO Dimethyl sulfoxide MTT 3-[4,5-dimethylthiazol-2-yl]-2,5-diphenyltetrazolium bromide COX Cyclo-oxygenase
AChE Acetylcholinesterase AIDS Acquired Immune Deficiency Syndrome ROS Reactive oxygen species CCB Calcium channel blocker
AGEs Advanced glycation end products vi
List of Publications from Thesis
1 Shafiq-ur-Rahman, Muhammad Ismail, Muhammad Raza Shah, Marcello Iriti, and
Muhammad Shahid. "GC/MS analysis, free radical scavenging, anticancer and β-glucuronidase inhibitory activities of Trillium govanianum rhizomes". Bangladesh
Journal of Pharmacology Vol. No. 10 (2015): 577-583. Impact factor; 1.05 2 Shafiq-ur-Rahman, Muhammad Ismail, Muhammad Raza Shah, Achyut Adhikari,
Itrat Anis, Malik Shoaib Ahmad, and Muhammad Khurram. "Govanoside A, a new steroidal saponin from rhizomes of Trillium govanianum". Steroids Vol. No. 104 (2015): 270-275. doi:10.1016/j.steroids.2015.10.013. Impact factor; 2.63
3 Shafiq-ur-Rahman, Muhammad Ismail, Muhammad Khurram and Inam ul
Haq."Pharmacognostic and ethnomedicinal studies on Trillium govanianum." Pakistan Journal of Botany Vol. No. 47(SI) (2015): 187-192. Impact factor; 0.82
4 Shafiq-ur-Rahman, Muhammad Ismail, Achyut Adhikari, Muhammad Raza Shah,
Muhammad Khurram, Muhammad Shahid. "Scientific confirmation of anti inflammatory and analgesic uses of Trillium govanianum rhizomes". Journal of
Ethnopharmacology. Submitted. Impact factor; 2.99 vii

Summary
1
Summary
This dissertation describes ethnomedicine based morphological, chemical and
biological evidences of Trillium govanianum rhizome. T. govanianum belongs to the
family Trilliaceae and is mainly distributed in Asia, from Pakistan to Bhutan. The
ethnomedicinal survey in the four Districts of Khyber Pukhtoonkhwa revealed that
highest presumed indications of T. govanianum rhizomes include inflammatory
disorders, cancers, backache, headache, joint pains, kidney problems and
gastrointestinal disorders.
The transverse section of rhizome showed the presence of cortex cells, trichomes,
carinal canal, sclereids, vascular bundles (xylem and phloem), fibers, cambium,
calcium oxalate crystals and starch grains. Extractive values were high for solvents
like water and methanol, which is indicative of abundance of sugars, and other polar
compounds like glycosides and saponins. Phytochemical screening revealed the
presence of steroids, steroidal glycosides, saponins, tannins, and carbohydrates in
crude methanolic extract (Cr. MeOH-Ext) as well as in chloroform fraction (CHL-fr),
ethyl acetate fraction (EtOAc-fr) and butanol fraction (BuOH-fr). GC/MS analyses of
n-hexane fraction (n-Hex-fr) identified twelve (12) compounds, including 70%
unsaturated and 30% saturated fatty acids.
Using different chromatographic techniques, eight compounds from CHL-fr and two
compounds from BuOH-fr were isolated. The chemical structures of isolated
compounds were elucidated using latest spectroscopic and spectrometric techniques
i.e. 1H-NMR, 13C-NMR, COSY, NOESY, HSQC, HMBC, EI-MS, FAB, HR-FAB,
HREI-MS, IR and UV. Among these compounds, two [govanic acid (6) and
govanoside A (10)] were new, while the rest were [hexadecanoic acid (1), β-sitosterol

Summary
2
(2), stigmasterol (3), diosgenin (4), pennogenin (5), 20-hydroxyecdysone (7), 5,20-
dihydroxyecdysone (8), borassoside E (9)] previously known. However, all the
compounds are reported for the first time from this plant species.
In MTT assay, based on IC50 ± SD (µg/mL) values, significant antiproliferative
activity against HeLa cells was observed for CHL-fr (0.84 ± 0.16), EtOAc-fr (1.41 ±
0.08) and BuOH-fr (1.60 ± 0.34). Similarly, all fractions exhibited good cytotoxicity
against PC-3 cell lines. The isolated compounds, govanoside A (1.74 ± 0.12 against
PC-3; 0.51 ± 0.26 against HeLa) and borassoside E (2.34 ± 0.21 against PC-3; 0.67 ±
0.22 against HeLa) exhibited significant cytotoxicity compared to standard
doxorubicin (1.69 ± 0.28 against PC-3; 0.50 ± 0.15 against HeLa). In DPPH free
radical scavenging assay, higher scavenging capacity was observed in n-Hex-fr and
CHL-fr compared to other fractions, however the scavenging capacity of all fractions
was less than ascorbic acid.
In antifungal assay, the Cr. MeOH-Ext was found active against all tested fungal
strains, with maximum activity against Trichophyton rubrum, Microsporum canis,
and Candida albicans. The compounds, govanoside A and borassoside E showed
good to moderate activities against Aspergillus niger, A. flavus, C. albicans, and C.
glabrata strains, while govanic acid exhibited moderate activity for T. rubrum and M.
canis. In antibacterial assay, the Cr. MeOH-Ext and fractions exhibited moderate
antibacterial potentials against the tested gram positive and gram negative bacteria.
Furthermore, the Cr. MeOH-Ext exhibited good potential against Leishmania major.
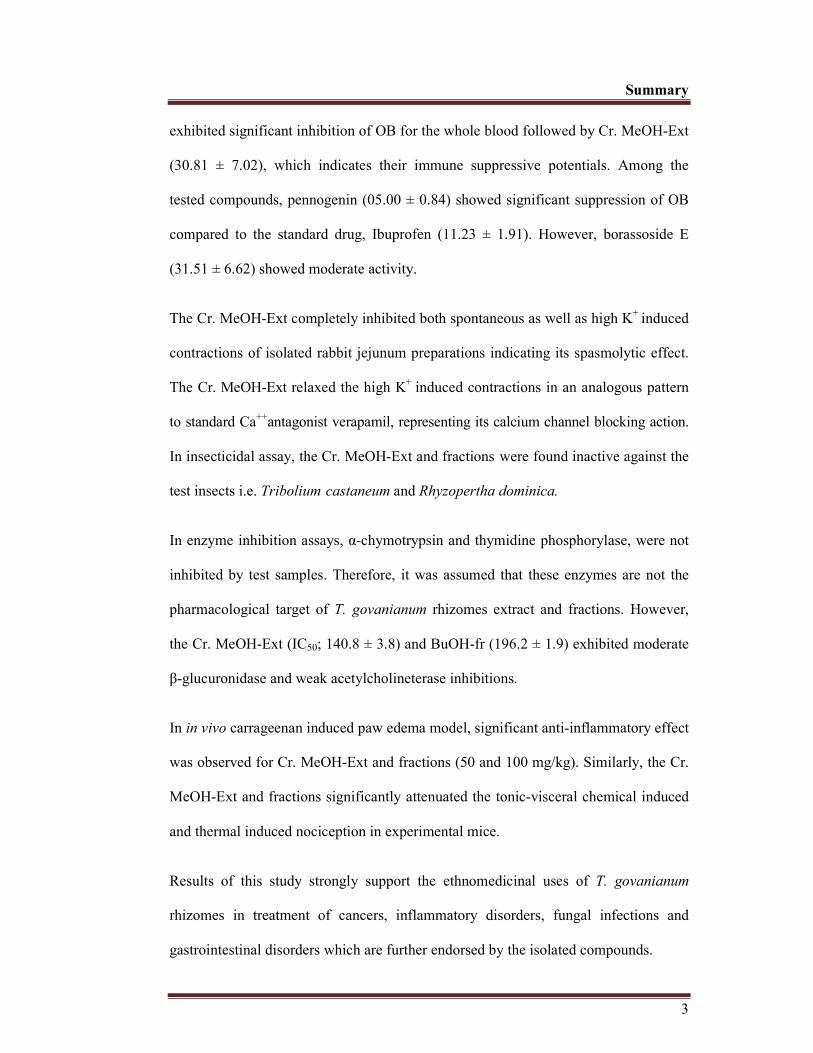
Suppression of oxidative burst (OB) was evaluated through luminol enhanced
chemiluminescence assay. Based on IC50 ± SD (µg/mL), the BuOH-fr (16.53 ± 7.54)
Summary
3
exhibited significant inhibition of OB for the whole blood followed by Cr. MeOH-Ext
(30.81 ± 7.02), which indicates their immune suppressive potentials. Among the
tested compounds, pennogenin (05.00 ± 0.84) showed significant suppression of OB
compared to the standard drug, Ibuprofen (11.23 ± 1.91). However, borassoside E
(31.51 ± 6.62) showed moderate activity.
The Cr. MeOH-Ext completely inhibited both spontaneous as well as high K+ induced
contractions of isolated rabbit jejunum preparations indicating its spasmolytic effect.
The Cr. MeOH-Ext relaxed the high K+ induced contractions in an analogous pattern
to standard Ca++antagonist verapamil, representing its calcium channel blocking action.
In insecticidal assay, the Cr. MeOH-Ext and fractions-were found inactive against the
test insects i.e. Tribolium-castaneum and Rhyzopertha dominica.
In enzyme inhibition assays, α-chymotrypsin and thymidine phosphorylase, were not
inhibited by test samples. Therefore, it was assumed that these enzymes are not the
pharmacological target of T. govanianum rhizomes extract and fractions. However,
the Cr. MeOH-Ext (IC50; 140.8 ± 3.8) and BuOH-fr (196.2 ± 1.9) exhibited moderate
β-glucuronidase and weak acetylcholineterase inhibitions.
In in vivo carrageenan induced paw edema model, significant anti-inflammatory effect
was observed for Cr. MeOH-Ext and fractions (50 and 100 mg/kg). Similarly, the Cr.
MeOH-Ext and fractions significantly attenuated the tonic-visceral chemical induced
and thermal induced nociception in experimental mice.
Results of this study strongly support the ethnomedicinal uses of T. govanianum
rhizomes in treatment of cancers, inflammatory disorders, fungal infections and
gastrointestinal disorders which are further endorsed by the isolated compounds.

Chapter 1 Introduction
4
1. Introduction
1.1 Medicinal plants
In the current era, it is extremely desired to discover effective remedies, for diseases,
which are potent, with least adverse effects, and cost effective. Discovering such
products, medicinal plants and herbal medicines can be the best choice as plants are
known to produce a wide range of bioactive molecules, making them a rich source of
different types of medicines1.
Medicinal plants are known to be used by mankind as a source of medicines since
immemorial times. These plants are source of valuable medicines that are used to
prevent diseases, maintain health and cure ailments. In one way or other, they benefit
almost every living being on this planet earth2. They are used to be the basis of
sophisticated traditional medicine systems for long time, and are still at service of
mankind by providing new medicines3.
Natural products obtained from plants have played remarkable role in the
improvement of health care system. According to the World Health Organization
(WHO) estimate about 80% of world population rely on natural sources for their
primary health care need while the remaining 20% of the population uses integrated
natural sources4. Even at the dawn of 21stcentury, 11% of the 252 drugs, considered as
basic and essential by the WHO were exclusively of flowering plant origin2.
At present, the prime pharmacopoeias in the world i.e. European Pharmacopoeia (Ph
Eur 8), United States Pharmacopeia (USP XXXIV), British Pharmacopoeia (BP 2015)
all have mention of plant drugs which heralds the true significance and medicinal
importance of these remedies5.

Chapter 1 Introduction
5
In scientific literature around the world, about 35,000 or more plants species have
been reported, to be used in different human cultures for medicinal purposes6.
Nevertheless, this number could be much higher as knowledge of indigenous use of
medicinal plants mainly passes verbally from one generation to another and largely
remain undocumented. Among the 250,000 reported higher plants species, only 5-
15% have been scrutinized for their bioactive molecules7.
In conclusion, the medicinal plants are an area under focus since their secondary
metabolites encompass a significant number of drugs used in current therapeutics and
their potential as the source of new medicines is beyond any doubts.
1.2 Plants metabolites
The plant primary metabolites like proteins, carbohydrates, lipids and vitamins etc.
are synthesized as a consequence of photosynthesis by green plants, and are involved
in the development, reproduction and normal growth of the plants. The humans and
other organism utilize these primary metabolites chiefly for their dietary purpose8.
The secondary metabolites like alkaloids, glycosides, tannins, saponins, flavonoids,
terpenoids, volatile oils, phytoestrogens, carotenoids and phenols etc. are synthesized
from primary metabolites by different biosynthetic pathways, and are capitalized in
plant defense mechanisms, to fight off herbivores, pests and pathogens9. These
bioactive metabolites were used by people in different cultures, in a variety of ways in
different traditions in every era in cure of diseases and still prevail in this modern
world10.
These metabolites are present in different parts of the plant like barks, roots,
rhizomes, stems, [ flowers, fruits, seeds [and leaves, which are medicinally used either in
Chapter 1 Introduction
6
raw form or in the form of decoctions, infusions or extracts11. Among the secondary
metabolites terpenoids constitute the largest class of secondary metabolites that are
grouped together on basis of their common biosynthetic origin i.e. from acetyl CoA or
glycolytic intermediates. Some nitrogenous terpene derivatives possess potent anti-
hypertensive property. The antimicrobial and insecticidal properties of terpenoids
have led to their utilization as pesticides and fungicides in agriculture and
horticulture12,13. Tannins (polyphenols with multi facet chemistry) are useful as an
anti-inflammatory agent and in the treatment of burns and other wounds based on
their anti-hemorrhagic and antiseptic potentials. In particular, tannins rich recipes are
used as antihelmintics, antioxidants, and antimicrobials14.
Flavonoids consist of a large group of polyphenolic compounds having a benzo
pyrone structure with potent anti-oxidant, anti-cancer, hepatoprotective, anti-
inflammatory, antibacterial and antiviral properties15. Saponins are steroid or
triterpene glycosides widely distributed in the plant that possess hemolytic properties
and poisonous effects against fishes. Crude drugs containing saponins that have less
irritating effects on oral administration are generally used as expectorant and
antitussive agents16. It is worth to mention, that many saponins have been reported to
exhibit significant anti-inflammatory, antinociceptive and antipyretic activities as well
as many other diverse potentials such as antiallergic and anti-cancer17,18. Similarly
alkaloids are one of the most diverse groups of plant secondary bioactive metabolites
and comprise substances possessing remarkable range of pharmacological activities.
Many alkaloids have been reported to be used for hundreds of years in medicine and
some are still important drugs today19,20. In fact million of hidden recipes are present
in medicinal plants, by virtue of which these plants are capitalized for treatment and
preventions of various diseases21.

Chapter 1 Introduction
7
1.3 Traditional medicines and drug discovery
There are various approaches that how plants are selected as a potential candidate for
drug discovery; these approaches includes random selection for phytochemical
screening or random selection followed by biologic assay, the most common
approach, frequently used is based on capitalization of knowledge from traditional
system of medicine (ethno-medicinal)22. In fact numerous drugs have entered the
international pharmacopoeias through the study of ethnopharmacology and traditional
medicine23. Some of the important drugs discovered through ethnomedicinal approach
are given in Table 1.1. Research on medicinal plants, which are used traditionally for
the treatment of systemic and topical infections, has shown that they contain varieties
of anti-cancer, antiparasitic, antifungal, antibacterial, analgesics, anti-inflammatory
and antihistaminic compounds24-26.
From centuries, China and India exercising plants based traditional system of
medicine. According to a report of WHO, plants based traditional system still
continue to play an essential role in health care. At least 119 bioactive chemical
substances derived from plant species from 1959 to 1980 have been considered as
important drugs and are still in practice27. Amongst these drugs, 74% were discovered
from plants used in traditional system of medicine through bioassay guided isolation.
It has been documented that during 1940s to 2007, 155 drug molecules were
discovered, in which 73% were non synthetic with 47% being either natural product
derivatives or natural products. In U.S.A, during 2005 to 2007 thirteen new natural
product derived drugs were approved, amongst these five were novel members of new
classes28. Up to 50% of the approved drugs during the last 30 years are either directly
or indirectly from natural products and in the area of cancer, over the time frame from

Chapter 1 Introduction
8
around the 1940s to date, of the 175 small molecules 85 actually being either natural
products or their direct derivatives2. From 2005 to date natural products or natural
products derived marketed drugs are tabulated in Table 1.2.
Table 1.1: Important drugs discovered from plants with their ethnomedical
correlations and sources29
Drug B. Source Common Name Therapeutic uses
Atropine Atropa belladonna Deadly nightshade Parasympatholytic
Caffeine Camellia sinensis Tea plant CNS stimulant
Cocaine Erythroxylum coca Coca Local anesthetic
Codeine Papaver somniferum Opium Poppy Analgesic
Colchicine Colchicum autumnale Autumn crocus Gouty arthritis
Digoxin Digitalis purpurea Foxglove Cardiac stimulant
Emetine Cephaelis ipecacuanha Ipecacuanha Emetic
Ephedrine Ephedra sinicа Ma Huang Sympathomimetic
Glycyrrhizin Glycyrrhizia glabra Liquorice Antiulcer
Hyoscamine Hyoscamus niger Henbane Anticholinergic
Lobeline Lobelia inflata Astmaweeed Respiratory stimulant
Morphine Papaver somniferum Opium Poppy Analgesic
Nimbidin Azadirachta indica Neem Antiulcer
Noscapine Papaver somniferum Opium Poppy Analgesic, anti tussive
Papain Carica papaya Papaya Mucolytic
Physostigmine Physostigma venenosum Calabar bean Para sympathomimetic
Pilocarpine Pilocarpus jaborandi Jaborandi Para sympathomimetic,
Quinine Cinchona succirubra Peruvian bark Anti-malarial
Reserpine Rauwolfiа serpentinа Sarpagandha Anti-hypertensive
Salicin Salix alba White willow Analgesic
Santonin Artemisa maritima Sea wormwood Ascaricide
Silymarin Silybum marianum Blessed milk thistle
Hepatotonic
Teniposide Podophyllum paltatum Mayapple, Anticancer
Theophylline Camellia sinensis Tea plant Bronchodialator
Tubocurarine Chondodendron
Tomentosum
Curare Parasympatholytic
Yohimbine Pausinystalia johimbe Yohimbe Aphrodisiac

Chapter 1 Introduction
9
Table 1.2: Natural product derived drugs in market since 200529
Year Trade
Name
Generic Name/
(Active compound)
Classification Therapeutic Uses
2005 Prialt® Ziconotide NP Pain
2005 Flisint® Fumagillin NP Antiparasitic
2005 Sativex® Tetrahydrocannabinol NP Pain
2005 Tygacil® Tigecycline Semi synthetic NP Antibacterial
2005 Doribax® Doripenem NP derived Antibacterial
2006 Chantix® Varenicline NP derived Nicotine dependence
2006 Byetta® Exenatide NP Diabetes
2007 Yondelis ® Trabectedin NP Oncology
2007 Vyuanse® Lisdexamfetamine NP derived ADHD
2007 Altabax® Retapamulin Semi synthetic NP Antibacterial
2007 Ixempra® Ixabepilone Semi synthetic NP Oncology
2008 Zeftera® Ceftobiprolemedocaril Semi synthetic NP Antibacterial
2008 Relistor® Methylnaltrexone NP derived Constipation
2009 Vibativ® Telavancin Semi synthetic NP Antibacterial
2009 Istodax ® Romidepsin NP Cancer
2009 Javlor® Vinflunine Semi synthetic NP Cancer
2009 Remitch® Nalfurafine Semi synthetic NP Pruritis
2010 Javtena® Cabazitaxel Semi synthetic NP Cancer
2010 Gilenya® Fingolimod NP derived Multiple sclerosis
2010 Halaven® Eribulin NP derived Cancer
2010 Mepact® Mifamurtide NP derived Cancer
2010 Zuacta® Zucapsaicin NP derived Pain
2011 Dificid® Fidaxomicin NP Antibacterial
2011 Natroba® Spinosad NP Antiparastic
2012 Picato® Ingenolmebutate NP Actinic Keratosis
2012 Forxiga® Dapagliflozin NP derived Type 2 diabetes
2012 Synribo® Omacetaxinmepesucinate NP Oncology
2012 Kyprolis® Carfilzomib NP derived Oncology
2012 Synriam® Arterolane/piperaquine NP derived Antimalerial
2012 Desyne® Novolimus Semi synthetic NP CVS surgery
2013 Invokana® Canagilflozin NP derived Type 2 Diabetes
NP = Natural Product
Chapter 1 Introduction
10
1.4 Biodiversity of Indo-Pak Subcontinent
The Indo-Pak subcontinent has unique distinction, utilizing allopathic or modern
medicines as well as other six known systems of medicine i.e. ayurveda, unani,
siddha, yoga, naturopathy and homoeopathy30. The geography of Pakistan indicates
that it covers an area of 796,095 sq. km, lies between 60° 55’ to 75° 30’ east longitude
and 23° 45’ to 36° 50’ north latitude. Pakistan has a diverse climatic zones and
biodiversity because of wide ranging altitude from 0 to 8611 m. In Pakistan
approximately 6,000 species of higher plants have been reported, out of these 600 to
700 plant species are capitalized for medicinal purposes. Pakistan has four phyto-
geographical regions: (i) Irano-Turanian (45% of species); (ii) Sino-Himalayan (10%
of species); (iii) Saharo-Sindian (9.5% of species); and (iv) Indian element (6% of
species)31.
In Pakistan, the local population of different areas has centuries old knowledge,
regarding traditional uses of plants available in their respective localities. From
generation to generation this indigenous knowledge of plants has been transferred.
These plants are used to treat a range of ailments from headache to stomachic and
from cuts to wounds32. Nearly 250,000 higher plants species have been reported from
around the world, in which nearly 10% are found in the Hindukush-Himalayas ranges,
of which two-third are of medicinal significance8.
Furthermore, there is widespread interest in advancing traditional health systems to
fulfill basic health care needs. This is especially true in this country, as prices of
modern medicines are much higher, and governments find it more difficult to meet the
cost of pharmaceutical-based health care. However, it is a common observation that
many medicinal plants growing in this country remain taxonomically unidentified and
Chapter 1 Introduction
11
there are many more of them, which have not been phytochemically examined.
Furthermore, no attention has yet been paid to characterize them from the
pharmacognostic point of view. Thus, it is expected that the number of medicinal
plants growing or available in Pakistan may be more than what has so far been
reported. It is also important that the countless herbs found in Pakistan should be used
for promotion of health and for fighting diseases. Thus, medicinal plants of Pakistan
hold good promise as potential sources for new drug development. In order to develop
useful drugs from these medicinal plants, efforts should be made to identify them
scientifically, phytochemically, biologically and followed by standardized pre-clinical
studies so as to establish the authenticity of their claimed therapeutic potentials.
1.5 The Family Trilliaceae
The family has been recognized as distinct by Lindley since 184633. Steven Elliott
wrote “This family is an attractive one; A spiral of leaves at the peak of a stem,
sustaining solitary flower, it enclose and covers numerous species”. Family
Trilliaceae includes perennial herbs possessing characteristics underground rhizomes,
slender to stout, frequently creeping, unbranched, occasionally erect, monopodial.
Aerial stems are simple, frequently glabrous, and sometimes pubertal. Foliage leaves
3–22 in a pseudo whorl at top of stem, petiolate to sessile, thinner to broadly ovate, at
the bottom rounded, or sometimes cordate or narrowing, sometimes multicolored,
glabrous or pubescent along core veins on axial surface. Flowers are bisexual, and
frequently solitary. Perianth fragments are persistent, in two whorls. Stamens as
numerous as the perianth fragments; usually anthers are longer than the filaments.
Ovary superior, 1 to 10, locular, Carpels are 3 to 10, ovules numerous, styles are 3 to
5. Fruit are fleshy capsule or a berry, usually maroon, green, blackish or dark purple,

Chapter 1 Introduction
12
rarely white, yellow, or red. Seeds sometimes afforded with an scarlet sarcotesta34,35.
Schilling and Farmer reported that the Trilliaceae family, which showed an arcto-
tertiary distribution, encompass of five genera36. Out of these, three exhibit an
extensive distribution.
• Paris from Iceland to Japan
• Daiswa from Eastern Asia
• Trillium from Eastern Asia and North America
1.6 Genus Trillium
Trillium is the most important genus of Trilliaceae. The genus consists of perennial
herbs with characteristics rhizomes that are horizontal or erect, semi erect, branched
or faintly unbranched, compressed to shortened, elongated to bulky and fleshy, distal
end pointed or premorse, the apex bears large terminal shoot/bud. Stem has leaf-
sheaths and brown scales at the base. Leaves are three located at the top of the main
stem. Flowers are some totally to partly pedicellate, sessile, or syncarpous. Sepals are
separate, green, light maroon, or possessing maroon spotings, ovate to oblong, or
lanceolate, irregular with bracts. Petals are characteristically 3, erect or ovate to linear,
scattering, or recurved, discrete, red, white, yellow, pink, green, or mixture of all
these colors. Stamens are 6 in numbers, irregular in 2 whorls of 3, incurved, erect, or
divergent. Anthers are 2-locular, equal or longer than the filaments, superior ovary,
proximal segment 3-locular, 3- or 6-lobed, some axile, some parietal or a blend of
both, the distal part forms stigmas, stigmas often persistent, occasionally connate,
sessile or with very little style, subulate to linear. Filaments generally short basally
extended. Seeds are numerous and fruit is a berry. The genus Trillium contains about
forty eight interrelated species in eastern North America and temperate eastern Asia,

Chapter 1 Introduction
13
as well as in western North America37. Most of the Trillium species are related with
the deciduous forests (ancient Arcto-Tertiary), which have continued with remarkable
changes in geographical ranges since the early Tertiary period in the northern
hemisphere. At present, each species of Trillium is limited to one of three
geographical areas: western Asia, eastern and eastern North America38. In Pakistan
the genus is represented by single species i.e T. govanianum39.
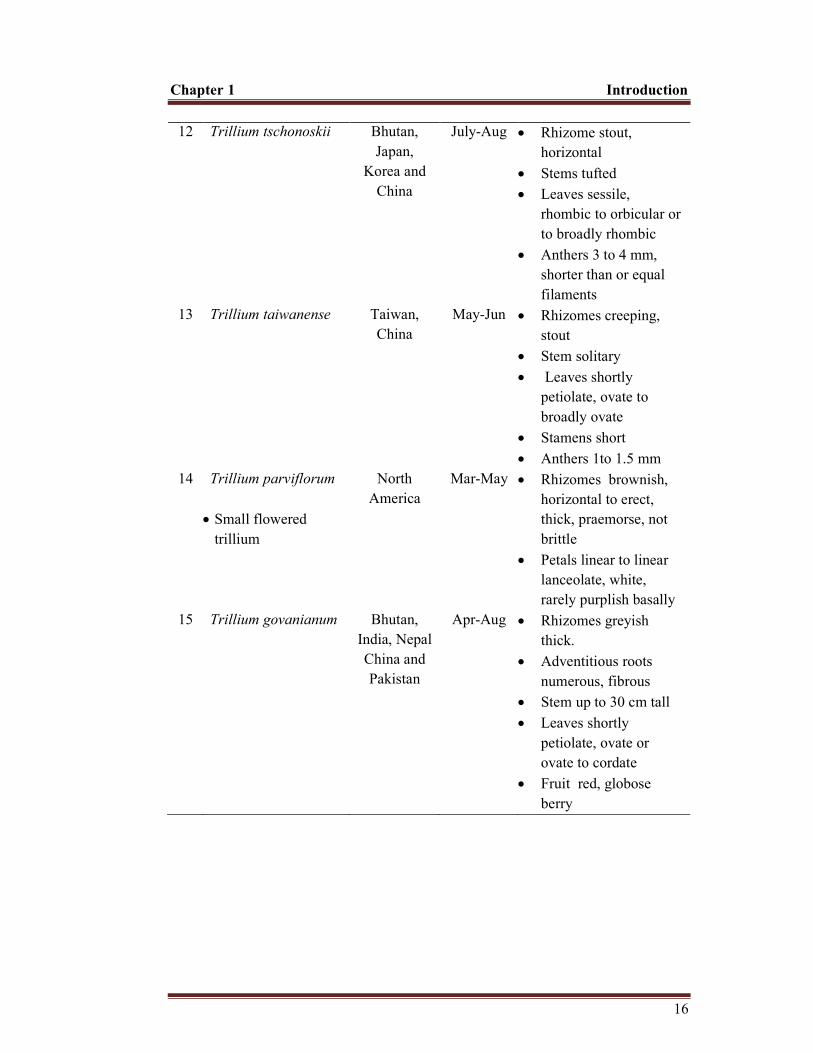
1.6.1 Species of genus Trillium40-42
Genus Trillium comprises of more than twenty species, and is mainly distributed in
North America and Asia. Some of its important species with specific characteristics
are shown in Table 1.3.

Chapter 1 Introduction
14
Table 1.3: Species of genus Trillium
No Species with
common Name
Occurrence Flowering
period
Specific characteristics
1 Trillium erectum
• Wake robin
• Red trillium
North America
Apr-Jun • Rhizomes short, thick, praemorse
• Petals typically red, maroon, or dark purple
• Petals usually present in same plane as sepals
2 Trillium nivale
• Snow trillium
• Dwarf white trillium
United States (U.S.)
Mar-Aprl • Rhizomes stout, short, praemorse
• Bracts blade bluish green
• Scapes six gonal in cross section
3 Trillium undulatum
• Painted trillium
• Painted lady
Wisconsin (U.S.)
Apr-Jun • Rhizomes short, horizontal, stout
• Petals with distinctive dark red colour
• Bracts are strongly petiolate
4 Trillium pusillum
• Dwarf trillium
• Least trillium
United States
Mar-May • Rhizomes thin, horizontal, branched
• Bracts very short, subsessilepetiolate
• Sepals about as large and prominent aspetals,
• petals spreading ascendingly
5 Trillium
grandiflorum
• Great white trillium
• White wake-robin
Mountains of Virginia.
(North America)
Apr-Jun • Rhizomes thick and short
• Petals erected basally
• Ovary ovate to lanceolate, white or rarely pink
6 Trillium ovatum
• Western white trillium
North America
Mar-May • Rhizomes horizontal to semi erect, short, stout, praemorse
• Bracts sessile

Chapter 1 Introduction
15
7 Trillium luteum
• Yellow trillium
• Yellow toadshade
Joseph rivers and
elsewhere in Michigan,
(U.S.)
Apr-May • Rhizomes brownish, horizontal, short, thick, not fragile, praemorse
• Petals oblanceolate to lanceolate, greenish yellow to lemon yellow in color
• Flower odor strongly of lemon
8 Trillium petiolatum
• Purple trillium
• Round-leaved trillium
North America
Apr-May • Rhizomes erect, very deep often, praemorse
• Petals long lasting
• Ovary, erect to incurved, light maroon to red, purple, or greenish to yellowish, flat, linear to lanceolate
9 Trillium simile
• Sweet white trillium
North America
Apr-May • Rhizome forming clumps, stout, praemorse
• Petals creamy white in color
• Flowers facing upward, odour sweet like apple
10 Trillium lancifolium
• Lance leaved trillium
North America
Feb-May • Rhizome white, horizontal, very brittle, inter-nodes elongated
• Petals linear to narrowly spatulate
11 Trillium
kamtschaticm Korea,Japan
Russia, N. America and China
Apr-Jun • Rhizome stout and straight
• Stems tufted
• Leaves sessile, broadly rhombic to orbicular or ovate to orbicular
• Anthers 7 to 8 mm and longer than filaments
• Fruit a berry, globose to ovoid
Chapter 1 Introduction
16
12 Trillium tschonoskii
Bhutan, Japan,
Korea and China
July-Aug • Rhizome stout, horizontal
• Stems tufted
• Leaves sessile, rhombic to orbicular or to broadly rhombic
• Anthers 3 to 4 mm, shorter than or equal filaments
13 Trillium taiwanense Taiwan, China
May-Jun • Rhizomes creeping, stout
• Stem solitary
• Leaves shortly petiolate, ovate to broadly ovate
• Stamens short
• Anthers 1to 1.5 mm 14 Trillium parviflorum
• Small flowered trillium
North America
Mar-May • Rhizomes brownish, horizontal to erect, thick, praemorse, not brittle
• Petals linear to linear lanceolate, white, rarely purplish basally
15 Trillium govanianum
Bhutan, India, Nepal China and Pakistan
Apr-Aug • Rhizomes greyish thick.
• Adventitious roots numerous, fibrous
• Stem up to 30 cm tall
• Leaves shortly petiolate, ovate or ovate to cordate
• Fruit red, globose berry

Chapter 1 Introduction
17
1.6.2 Phytochemical profiling of genus Trillium
Literature citing different species of genus Trillium indicates a thorough investigation
for phytochemicals, which has yielded a large number of phytochemicals/secondary
metabolites. The results indicate that the genus is very rich source of biologically
active compounds like steroids, terpenoids, sterols, flavonoids, steroidal glycosides
and saponin derivatives43-45. A list of secondary metabolites/phytochemicals reported
from the genus Trillium is shown in Table 1.4.
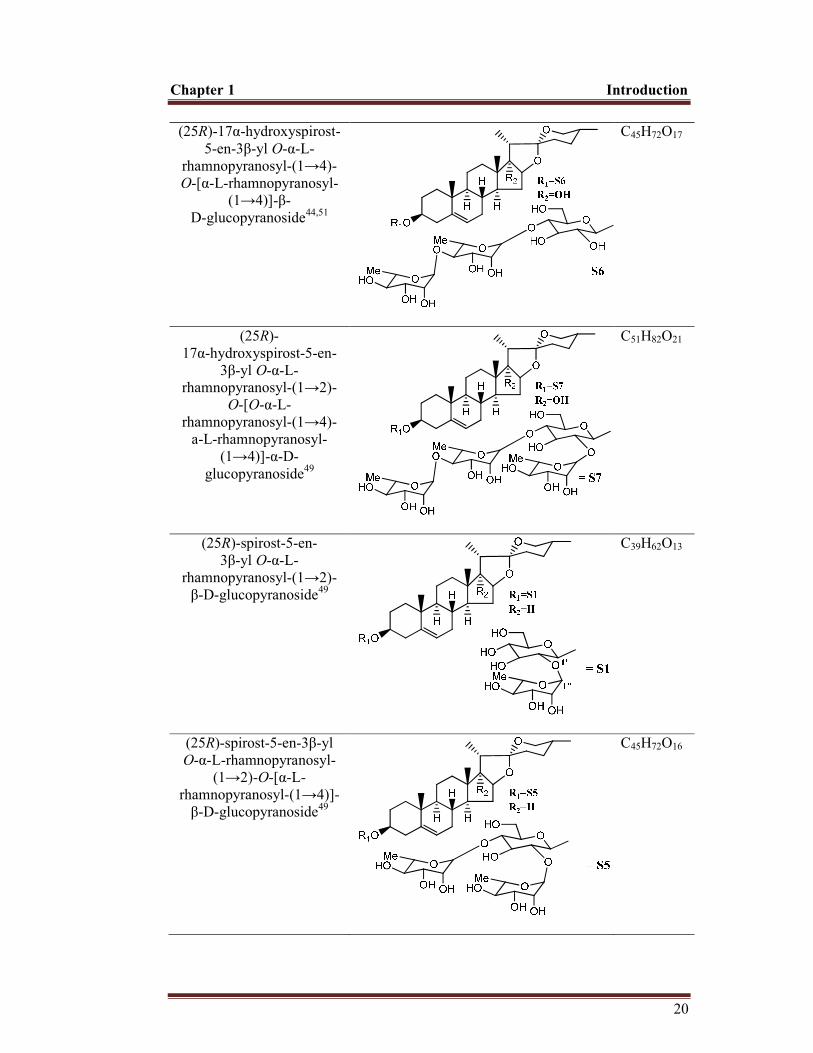
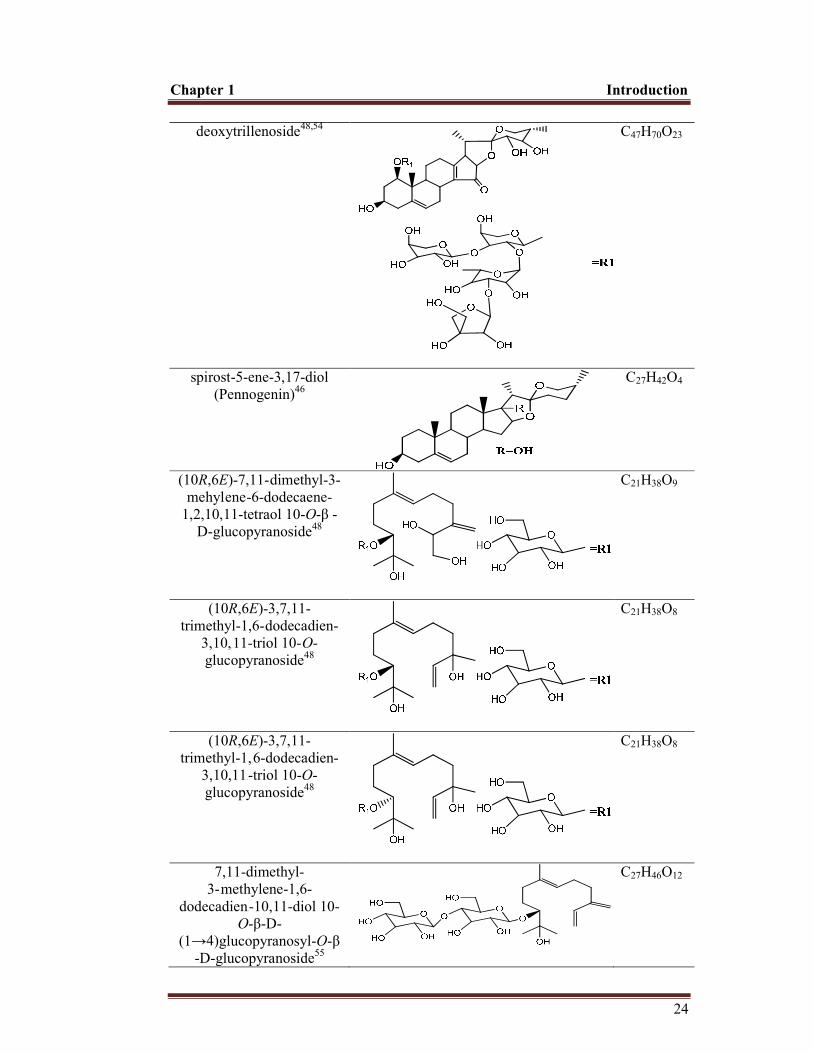
Table 1.4: List of phytochemicals isolated from genus Trillium
Chemical Name Chemical Structure Molecular
Formula
spirost-5-en-3-ol (diosgenin)46
C27H42O3
(25S)-spirost-5-ene-3β, 17α,27-triol44,47
C27H42O5
(25S)-3β,17α -dihydroxyspirost-5-en-27-yl β-D-glucopyranoside44
C33H52O10
(25S)-17α ,27-dihydroxyspirost-5-en-3 β -yl β-D-glucopyranoside44
C33H52O10

Chapter 1 Introduction
18
(25S)- 27-[( β-D-
glucopyranosyl)oxy]-17α -hydroxyspirost-5-en-3β -yl
O α - L-rhamnopyranosyl-
(1→2)- β -D-glucopyranoside44
C45H72O19
(25S)-27-[( β - D-glucopyranosyl)oxy]-17 α,27-dihydroxyspirost-5-
en-3-yl O-(4- O-acetyl- α -L-
rhamnopyranosyl)-(1→2)- β -D-glucopyranoside44
C33H52O10
(25S)-27-[( β-D-glucopyranosyl)oxy]-
17α,27- dihydroxyspirost-5-en-3 β -D-glucopyranosyl-(1→6)-O-[ α-L-rhamnopyranosyl-
(1→2)]- β-D-glucopyranoside44
C51H82O24
(25S)-17α, 27-dihydroxyspirost-
5-en-3β-yl O-(4-O-acetyl- α -L-rhamnopyranosyl)-
(1→2)- β - D-glucopyranoside44
C41H64O15

Chapter 1 Introduction
19
(25S)-17α,27-dihydroxyspirost-5-en-3 β-
yl O- α -L-rhamnopyranosyl-
(1→2)- β-D-glucopyranoside48
C39H62O14
(25R)-17α -hydroxyspirost-5-en-3 β-yl O- α -L-rhamnopyranosyl-
(1→2)-β- D-glucopyranoside49
C39H62O13
(25R)-17α -hydroxyspirost-5-en-3 β -yl O- α -L-
rhamnopyranosyl-(1→4)-β -D-glucopyranoside50
C39H62O13
(25R)-17α-hydroxyspirost- 5-en-3β-yl O-α-L-
rhamnopyranosyl-(1→2)-O-[α-L-rhamnopyranosyl-
(1→4)]-β- D-glucopyranoside49
C45H72O17
Chapter 1 Introduction
20
(25R)-17α-hydroxyspirost- 5-en-3β-yl O-α-L-
rhamnopyranosyl-(1→4)-O-[α-L-rhamnopyranosyl-
(1→4)]-β- D-glucopyranoside44,51
C45H72O17
(25R)- 17α-hydroxyspirost-5-en-
3β-yl O-α-L-rhamnopyranosyl-(1→2)-
O-[O-α-L-rhamnopyranosyl-(1→4)-
a-L-rhamnopyranosyl-(1→4)]-α-D-
glucopyranoside49
C51H82O21
(25R)-spirost-5-en- 3β-yl O-α-L-
rhamnopyranosyl-(1→2)-β-D-glucopyranoside49
C39H62O13
(25R)-spirost-5-en-3β-yl O-α-L-rhamnopyranosyl-
(1→2)-O-[α-L-rhamnopyranosyl-(1→4)]-
β-D-glucopyranoside49
C45H72O16

Chapter 1 Introduction
21
(25R)-spirost-5-en-3β-yl O-α-Lrhamnopyranosyl-
(1→2)-O-[O-α-L-rhamnopyranosyl-(1→4) -α-Lrhamnopyranosyl-
(1→4)]-β- D-glucopyranoside49
C51H82O20
(25R)-26-[β-D-glucopyranosyl]oxy]-22 α -
methoxyfurost-5- en-3 β -yl O-α-L-
rhamnopyranosyl-(1→2)-O-[α-L-rhamnopyranosyl-
(1→4)]-β- D-glucopyranoside44
C53H88O22
(25R)-26-[β -D-glucopyranosyl]
oxy]-17 α -hydroxy-22β -methoxyfurost-5-en-3β -yl O-α-L-rhamnopyranosyl-
(1→2)-β- D-glucopyranoside52
C47H78O19

Chapter 1 Introduction
22
(25R)-26-[β -D-glucopyranosyl]oxy]-17 α -
hydroxy-22amethoxyfurost- 5-en-3β -yl O-α-L-
rhamnopyranosyl-(1→2)-O-[α-L-rhamnopyranosyl-
(1→4)]-β- D-glucopyranoside52
C53H88O23
(25R)-26-[β -D-glucopyranosyl]
oxy]-3β -[(O-α-L-rhamnopyranosyl-(1→2)-
β-D-glucopyranosyl) oxy]-cholesta-5,17-diene-
16,22-dione49
C45H70O18
l-O-[2,3,4-tri-O-acetyl- α-L-rhamnopyranosyl- (1→2)4-O-acetyl-α-L-
arabinopyranosyl]- 21-O-acetyl-
epitrillenogenin53
C45H61AcO20
(25S)-27-hydroxypenogenin- [3-O-
α-L-rrhamnopyranosyl-(1→2)-O-β-D-
glucopyranoside]53
C39H62O14

Chapter 1 Introduction
23
(25R)-27- hydroxypenogenin 3-O-α-
L-rhamnopyranosyl-(1→2)-O-β-D-
glucopyranoside48
C39H62O14
penogenin 3-O-α-L-rhamnopyranosyl-(1→2)-O-β-D-glucopyranoside49
C39H62O13
penogenin 3-O-β-D-glucopyranosyl- (1→6)-[O--α-L[-
rhamnopyranosyl-(1→2)]-O-β-[[[D-glucopyranoside48
C45H72O18
penogenin 3-[O-β-[D-glucopyranoside[
49
C33H52O9
Chapter 1 Introduction
24
deoxytrillenoside48,54
C47H70O23
spirost-5-ene-3,17-diol (Pennogenin)46
C27H42O4
(10R,6E)-7,11-ddimethyl-3-mehyl3ene--6-dodecaene-
1,2,10,11-tetraol 10-O-β - D-glucopyranoside48
C21H38O9
(10R,6E)-3,7,11- trimethyl-1,6-ddodecadien-
3,10,1111-triol 10-oO-glucopyranoside48
C21H38O8
(10R,6E)-3,7,11- trimethyl-1,666-dodecadien-
3,10,1110-triol 10-O-glucopyranoside48
C21H38O8
7,11-dimethyl- 3-mmethylene-1,6-
dodecadien10-10,11-diol 10-oO-β-D-
(1→4)glucopyranosyl-O-β -D-glucopyranoside55
C27H46O12

Chapter 1 Introduction
25
methylferulorate55,56
C11H12O4
astragalin48
C21H20O11
β-ecdysone48
C27H44O7
2626-O-β-dD-glucopyranosyl (22,[25R)-[furost-5-eene-
3β,17α,22,26-tetraol 3-O-α-L-rhamnopyranosyl-
(1→2)-O-β-D-glucopyranoside49
C45H74O19
26-dO-β-aD-23glucopyranosyl (22,25R)-
furost-5-eene-3β,17α, 22,26-tetraol 3-O-α-L-
rhamnopyranosyl- (1→ 42)-[O-α-L-
[rhamnopyranosyl-(1→04)]-O-β-D-glucopyranoside48
C51H84O23

Chapter 1 Introduction
26
a26-O-β-D-glucopyranosyl 17(20)-
dehydrokryptogenin 3-O-α-L-rhamnopyranosyl-
(1→2)-[O-α-L-rhamnopyranosyl-
(1→4)]-O-β- D-glucopyranoside48
C51H80O22
26-O-β-D-glucopyranosyl 17(20)-
dehydrokryptogenin 3-O-α-L-rhamnopyranosyl-
(1→2)-O-β- D-glucopyranoside49
C45H70O18
3,4,5,7-tetrahydroxyflavone45
C15H10O6
quercetin 3-O-rutinoside; [3-O-β-L-
rhamnopyranosyl-(1→6)-β-D-glucopyranoside]45
C26H28O16

Chapter 1 Introduction
27
kaempferol 3-O-α-rhamnosyl-(1→2)-
O- [α-rhamnosyl- (l→6)]-β-glucoside45
C33H40O20
p-hydroxymethyl benzyl alcohol57
C8H10O2
3,7,11-trimethyl-3,9,11-trihydroxyl-1,6-
dodecadiene glycerol57
C18H36O6
2-methyl-3,4 dihydroxy-hexanedioic acid57
C7H12O6
Chapter 1 Introduction
28
1.6.3 Medicinal importance and biological studies of genus Trillium
A number of studies indicate that plant species of Trillium have been extensively used
as a remedy for various diseases. The reported biological/pharmacological activities
of different species (Table 1.5) indicate potentials in crude extracts, solvent fractions
and isolated pure compounds. Trillium tschonoskii has been traditionally used in
China for at least one thousand years58,59. Rhizomes of this plant species have been
used in folk medicine as medicinal herbs for treatment of hypertension, neurasthenia,
giddiness, headache, removing carbuncles, and ameliorating pains60. The anticancer
activity of n-BuOH extract has also been reported59. The rhizomes of T. erectum
called beth roots have been used in folk medicine for the treatment of hemorrhages
from uterus, urinary tract and lungs61. The cytotoxic activity of the isolated
compounds (spirostanol saponins and furostanol saponins) from T. erectum against
HL-60 leukemia cells has been reported44. Dried underground parts of T. tschonoskii
were used as a folk medicine to remove carbuncles and to ameliorate pains, etc62. The
marked inhibitory action against COX-2 production in macrophagocytes of the mouse
abdominal cavity by isolated compounds has also been reported38. It has also been
described that the ethanol extracts, ethyl acetate extracts and butanol extracts of T.
tschonoskii. significantly suppress the edema of rat hind paw swelling elicited by
injection of carrageenan63. T. tschonoskii can improve learning and memory, and
these effects were associated with enhancement of anti-oxidase expression64. The
antifungal activity of ethanol extract of the rhizomes and above ground portion of T.
grandiflorum has also been reported46.

Chapter 1 Introduction
29
Table 1.5: Reported biological activities of genus Trillium
Activity Part
used
Extract/Isolated
compounds
Source
anti metastatic effect against colorectal cancer cells58
Rhizome Isolated compounds
Trillium tschonoskii
antibacterial and anti oxidant65
Rhizome Extracts Trillium tschonoskii
antifungal46 Rhizome Extracts and fractions
Trillium grandiflorum
antifungal46 Rhizome Isolated compounds
Trillium grandiflorum
cytotoxicity against HL-60 human promyelocytic leukemia cells44
Rhizome Isolated compounds
Trillium erectum
cytotoxicity against human lung cancer cells66
Rhizome Isolated compounds
Trillium tschonoskii
cytotoxicity against adriamycin resistant breast cancer cells58
Rhizome Isolated compound
Trillium tschonoskii
cytotoxicity against malignant sarcoma cells67
Rhizome Isolated compounds
Trillium tschonoskii
cytotoxicity against malignant neuroblastoma68
Rhizome Extract/fractions Trillium pendulum
cytotoxicity against multi drug resistance (MDR) hepatocellular carcinoma cells69
Rhizome Isolated compounds
Trillium tschonoskii
expression of anti-oxidase of aging rat induced with haloperidol70
Rhizome Extracts Trillium tschonoskii
analgesic, anti-inflammatory and thrombisis effects63
Rhizome Extract/fractions Trillium tschonoskii
learning and memory enhancement effect64
Rhizome Extract/fractions Trillium tschonoskii

Chapter 1 Introduction
30
1.7 Trillium govanianum
The medicinal plant Trillium govanianum (Fig. 1.1) belongs to family Trilliaceae, and
is used in the traditional system of medicine in subcontinent for different aliments71. It
was selected for detailed scientific study following a thorough literature survey of
their ethnomedicinal uses and reported data. The taxonomical position of T.
govanianum is given in Table 1.6.
Figure 1.1: Trillium govanianum plant.
Table 1.6: Taxonomical classification of T. govanianum
Kingdom Plantae
Sub Kingdom Tracheobionta
Class Liliopsida
Sub class Liliidae
Order Liliales
Family Trilliaceae
Genus Trillium
Species Govanianum

Chapter 1 Introduction
31
1.7.1 Plant Morphology
T. govanianum plant is a perennial herb about 12-20 cm tall. The plant can be
identified by its three leaves in one whorl at the summit of the stem and a solitary,
flower in the center. Leaves are broadly ovate, acute and conspicuously stalked.
Rhizomes are thick. Adventitious roots are numerous and fibrous. Flower is one and
terminal. Stamens are 6, shorter than the perianth and in 2 whorls, filaments are long
about 4 mm. Basifixed anthers are about 5 mm long. Fruit is a red, 0.5-3.0 cm in
diameter, and seeds are abundant, rhombus, with a pulpy lateral appendage.
Flowering periods is from april to august39,40.
1.7.2 Distribution
The T. govanianum is distributed in south Asia, especially in India, Nepal, China,
Pakistan and Bhutan at an altitude of 2700 -4000 m71. In Khyber Pakhtunkhwa the
plant is present at high altitudes in District Dir, Swat and Shangla39.
1.7.3 Ethnobotanical Uses
T. govanianum rhizomes are used in the traditional system of medicine in
subcontinent (Pakistan, India and China) for different ailments. In folk medicine, the
rhizomes is used to cure dysentery, backache, healing of wound, skin boils, menstrual
and sexual disorders71-73. The powdered rhizomes is also used as anthelmintic74.
Chapter 1 Introduction
32
1.8 Aims and Objectives
Due to folkloric knowledge, increased market demand and usage of this plant species,
it is important to provide scientific evidence to its traditional uses, as well as to screen
this valuable herb for phytochemical and potential biological activities. Therefore,
following aims and objectives were set for the present study;
1. Explore the phytochemical constituents of rhizomes, utilizing various
chromatographic, spectrometric and spectroscopic techniques.
2. Evaluate the pharmacognostic features such as physicochemical and
histological characteristics.
3. Perform acute toxicity studies for evaluation of safety profile of the plant
extract.
4. Perform biological activities to find out valid scientific rationale for its
folkloric uses.
5. Investigate potential therapeutic uses, other than folkloric uses, by performing
bioactivity screenings.

Chapter 2 Materials and Methods
33
2. Materials and Methods
2.1 Drugs and chemicals
The chemicals, solvents and drugs consumed in different experimental procedures
were analytical as well as commercial grade (Table 2.1). The commercial grade
solvents were distilled before the start of experiments.
Table 2.1: Drugs and chemicals used with their source
Chemicals/Drugs Source/Supplier
Silica Sigma Chemical Co, St L-ouis, MO, USA
Diclofenac sodium Sigma Chemical Co, St L[ouis, MO, USA
Imipenem Cirin Pharmaceutical, Hattar, Pakistan
Amphotericin B Medinet Pharmaceutical, Karachi, Pakistan
Ibuprofen Allaince Pharmaceutical, Peshawar, Pakistan
Doxorubicin Atco Laboratories, Karachi, Pakistan
Etoposide Atco Laboratories, Karachi, Pakistan
Permethrin Atco Laboratories, Karachi, Pakistan
Ascorbic acid S[igma Aldrich, G-ermany
Carrageenan Si-gma Chemical Co, St L-ouis, MO, USA
DPPH Waka Ltd. Japan
Butylated hydroxytoluene (BHT) Sigma-Aldrich, Germany
Dimethyl Sulfoxide (DMSO) Sigma-Aldrich, Germany
Ceric sulphate Merck, Darmstadt, Germany
Magnesium chloride Me[rck, D[armstadt, Germany
Sodium bicarbonate Mer[ck, D.armstadt, G-ermany
Magnesium sulfate Merc -k, D[[armstadt, Ge-rmany
Calcium chloride Me-rck, D.armstadt, Ger-many
Sodium dihydrogen phosphate Mer-ck, D.armstadt, Ger[many
Potassium dihydrogen phosphate Merck, Darmstadt, Germany

Chapter 2 Materials and Methods
34
2.2 Research centers for experimental studies
Experimental studies were performed in the Department of Pharmacy, University of
Peshawar, H.E.J. Research Institute of Chemistry, International Center for Chemical
and Biological Sciences (ICCBS), University of Karachi, Department of Pharmacy,
Shaheed Benazir Bhutto University, Sheringal, Dir (U) and Institute of Basic Medical
Sciences, Khyber Medical University, Peshawar.
2.3 Physical constants
Melting points of isolated compounds were determined by melting point apparatus
model-MPA-100, while optical rotations were determined by digital Polarimeter
model-JASCO DIP-360.
2.4 Spectroscopic techniques
Most of the spectroscopic studies were carried out through highly sensitive
sophisticated instruments available at H.E.J. Research Institute of Chemistry,
International Center for Chemical and Biological Sciences (ICCBS), University of
Karachi, Karachi.
2.4.1 UV technique
Hitachi Spectrophotometer, model-U-3900/3900H (fully automated) was used for UV
spectroscopic analysis of isolated compounds.
2.4.2 IR technique
Infrared Spectrometer, model- JASCO 302-A was used for IR spectroscopic analysis
of isolated compounds.
Chapter 2 Materials and Methods
35
2.4.3 Mass technique
For the mass spectral studies of isolated compounds, the Mass Spectrophotometer
model-MAT311A linked with computer system of PDP11/34 was used for low
resolution electron impact spectra while Jeol Mass Spectrometer model JMS HX 110
was used for FAB and HR mass spectra.
2.4.4 Nuclear Magnetic Resonance (NMR) technique
For the 1H-NMR and 13C-NMR spectra of isolated compounds, NMR Spectrometer
(Bruker; AMX-600, AM-400 and AM-300) was used. The 1H-NMR spectra were
taken at different MHz i.e. 300, 400, or 600. The Distort-ionless Enhancement by
Polarization Transfer (DEPT) experiments were executed at 90o and 135o
for
determination of CH3, CH2, and CH moieties of isolated compounds.
2.4.5 Gas Chromatography and Gas Chromatography-Mass Spectrometry
GC/MS analysis was carried out on a 6890N Agilent gas chromatograph coupled with
a JMS 600 H JEOL mass spectrometer. The compound mixture was separated on a
fused silica capillary SPBI column, 30 m × 0.32 mm, 0.25 µm film thicknesses, in a
temperature program from 50 to 256°C with a rate of 4°C/minute (min) with 2 min
hold. The injector was at 260°C and the flow rate of the carrier gas (helium) was 1
mL/min. The EI mode of JMS 600 H JEOL mass spectrometer has ionization volt of
70 eV, electron emission of 100 µA, ion source temperature of 250°C and analyzer
temperature of 250°C. Sample was injected manually in split mode. Total elution time
was 90 min. MS scanning was performed from m/z 85 to m/z 39075.

Chapter 2 Materials and Methods
36
2.4.6 GC-MS identification of components
Identification of proximate fatty acid components of the non-polar fraction (n-hexane)
was based on the computer evaluation of mass spectra of sample through NIST-based
AMDIS (automated mass spectral deconvolution and identification software), direct
comparison of peaks and retention times with those for the standard compounds as
well as by following the characteristic fragmentation patterns of the mass spectra of
particular classes of compounds.
2.5 Chromatographic techniques for isolation and purification of compounds
Different chromatographic techniques76 were used for isolation and purification of
compounds from the fractions of T. govanianum rhizomes.
2.5.1 Column Chromatography (CC)
For column chromatography technique, silica gel (column silica; 70-230 mesh size,
flash silica; 230-400 mesh size) was used as a stationary phase. Mobile phase used
includes various organic solvents either alone or in combination like, n-hexane, ethyl
acetate, chloroform, butanol and methanol. Different spots of compounds were made
visible by either UV light (short λ, 254 nm; long λ, 365 nm) or by spraying different
locating reagent. On TLC cards/plates, purity of the isolated compounds were
confirmed.
2.5.2 Thin Layer Chromatography (TLC)
For this technique, silica gel pre-coated cards (PF 0.25, 254 mm) were used. Silica gel
pre coated plates (0.5 mm thickness, 20 x 20 cm) were also applied for pre-parative
thin layer chromatography for purification of isolated compounds.
Chapter 2 Materials and Methods
37
2.5.3 Reagents for visualizing the spots
For visualization or locating the spots of compounds on TLC cards, various spraying
reagents were prepared as per procedure given and sprayed through a suitable spray
gun on TLC cards/plates. The UV light (254 nm and 365 nm) was also used for
visualization of spots on TLC plates/cards.
2.5.3.1 Ceric sulphate solution as reagent
For ceric sulphate reagent preparation, ceric sulphate (0.1 g) was dissolved in distilled
water (4 mL). To avoid any turbidity of solution, heated the solution and sulphuric
acid (few drops) were added. Upon spraying on TLC card/plates and exposure to
heating, the formation of colors indicates the presence of different classes of
compounds.
2.5.3.2 Vanillin solution as reagent
Vanillin solution was prepared by dissolving 1 g of vanillin in 50% phosphoric acid.
The appearance of pink or deep purple color after spraying vanillin solution on TLC
plates and heating up to 100-110oC, confirmed the presence of terpenes and steroids.
2.6 Ethnomedicinal study
2.6.1 Site selection
Four main districts of Khyber Pakhtunkhwa were selected for the study i.e Buner,
Swat, Shangla and Dir, keeping in view the fact that the plant under study is found in
these areas.

Chapter 2 Materials and Methods
38
2.6.2 Sampling informants and ethnomedicinal data collection
The ethnomedicinal survey was carried out from March, 2013 to November, 2013. In
addition to local people who had practical knowledge on medicinal plants, traditional
healers/hakims and pansaries (crude drug and general items sellers) were interviewed
according to reported method77 with slight modifications.
2.7 Plant materials
2.7.1 Collection
Rhizomes of T. govanianum Wall were collected from Kohistan valley (34° 54' and
35° 52' North latitudes and 72° 43' and 73° 57' East longitudes), Dir Upper, Khyber
Pakhtunkhwa, in August, 2013. The plant was identified by Mr. Ghulam Jelani
(Curator), Department of Botany, University of Peshawar. A voucher specimen [No.
Bot. 20092 (PUP)] has been deposited in the herbarium Department of Botany,
University of Peshawar, Pakistan for future reference. The rhizomes were then
washed by water (distilled) and dried at ambient temperature under shade, and then
crushed to powder for analysis.
2.7.2 Extraction and fractionation
The shade-dried rhizomes of T. govanianum (7 Kg) were ground and extracted with
MeOH (40 L) at room temperature, three times for a period of seven days (3 × 40 L)
78. The combined methanolic extract was evaporated to dryness by using a rotary
evaporator (Heidolph, Laborota-4010) fitted with recirculation chiller (Mini-chiller,
Huber w-H1 plus) and a heating bath (B-490) at 40oC, yielded a semi solid brownish
gummy residue as crude methanolic extract (512 g). For screening of different
biological activities about 35 g of extract (Cr. MeOH-Ext) was reserved, and the

Chapter 2 Materials and Methods
39
remaining extract was further fractionated on the base of their solvent affinity (solid-
liquid partition) into n-hexane (n-Hex-fr; 81 g), chloroform (CHL-fr; 94 g), ethyl
acetate (EtOAc-fr; 85 g) and butanol (BuOH-fr; 105 g) fractions. The remaining
fraction, after the above process was considered as aqueous (Aq-fr; 107 g) fraction 79.
The complete process is documented in Scheme 2.1.
Scheme 2.1: Extraction and fractionation of T. govanianum rhizomes
Powder rhizomes of T. govanianum
(7 Kg)
Extraction with MeOH
Crude MeOH Extract (512 g)
Fractionation
For biological activities
(35 g)
Ethyl acetate fraction (85 g)
Aqueous fraction (107 g)
Butanol fraction (105 g)
n-hexane fraction (81 g)
Chloroform fraction (94 g)

Chapter 2 Materials and Methods
40
2.8 Macroscopic and microscopic features of rhizome
Macroscopic appearances of the fresh rhizome and the color, shape, size, surface,
odor and taste of the crude drug were determined. Thin transverse section of the
rhizome was prepared. The material was mounted in center of potato pith and a large
number of transverse cuts were made across the material with the help of a sharp
razor and was kept moist in water. The thin section was selected and staining was
done on glass slide. The staining was carried out by putting the section in safranin for
3-4 min. The section was then gradually dehydrated in 10%, 30%, 50%, and 90% of
alcohols. The dehydrated section was then put into a drop of methylene green and
then washed with absolute alcohol for 2-3 min. Finally the section was mounted with
Canada balsam to make them permanent and was examined under Olympus Digital
microscope (MIC-D). The powder drug was also treated on glass slide, mounted with
Canada balsam and was subjected to microscopic examinations76,80.
2.9 Physicochemical parameters
The various physico-chemical parameters like loss on drying, total ash, water soluble
ash, acid insoluble ash, and extractive values were determined following well
established reported methods76,81,82. Detail procedures of which are given below.
2.9.1 Total ash
For the purpose of total ash determination, crude drug 2 g (air dried) was taken in the
silica dish or platinum (tarred) and ignited upto maximum temperature (not exceeding
450°C), until become carbon free, was cooled then and weighed. Percent total ash was
calculated by using formula,

Chapter 2 Materials and Methods
41
Percenttotalashvalue = weightoftotalash
weightofcrudedrugtaken× 100
2.9.2 Water soluble ash
For the purpose of water soluble ash determination, the ash was mixed with water (25
mL) and boiled for 5 min. On filter paper (ash-less), insoluble matter was collected
and washed continuously with warm water, and then ignite for about 15 min at high
temperature (not exceeding 450°C). From the weight of total ash, weight of the
insoluble matter was subtracted. The water soluble ash (percentage) was calculated
with reference to the air dried drug.
2.9.3 Acid insoluble ash
For the determination of acid insoluble ash, hydrochloric acid (25 mL) was added to
the crucible containing the total ash and boiled for 5 min. The insoluble matter was
collected on the ash less filter paper and washed with hot water until the filtrate is
neutral. The filter paper was transferred to the crucible and ignited to a constant
weight. The residue was to cool in a suitable desiccator for 30 min. The ash was
weighed and percentage of acid-insoluble ash was calculated with reference to air
dried powder.
2.9.4 Loss on drying
For the determination of loss on drying, one gram of dried powder was placed in a
previously dried weighing beaker. The sample was dried in an oven at 100-105oC.
The loss of weight in mg per air dried material was calculated.

Chapter 2 Materials and Methods
42
2.9.5 Extractive values
2.9.5.1 Methanol soluble extractive value
Powder drug (2.0 g) was macerated with 100 mL of methanol in a closed flask for 24
h, shaken frequently during the first 6 hours (h) and allowed to stand for 18 h. The
mixture was then filtered and the methanol was evaporated and allowed the filtrate to
dryness in a tarred shallow dish, and weighed. The percentage of methanol soluble
extractive value was calculated with reference to the air dried drug.
2.9.5.2 Water and other soluble extractive values
The procedure for the determination of extractive values of water, ethanol, butanol,
ethyl acetate, chloroform and n-hexanes was similar to the methanol soluble
extractive value, using the respective solvents instead of methanol.
2.10 Phytochemical tests
For the determination of plant metabolites like alkaloids, tannins, flavonoids,
saponins, sterols and carbohydrates, different qualitative phytochemical tests (color
reactions) of the crude methanolic extract and its subsequent solvents soluble
fractions like n-hexane, chloroform, ethyl acetate, butanol were performed according
to the recommended standard protocols81,83-85.

Chapter 2 Materials and Methods
43
2.10.1 Test for alkaloids
2.10.1.1 Mayer’s test
To the plant extract/fraction solution, few drops of Mayer’s reagent was added. The
appearance of white creamy precipitate (ppt) represents the presence alkaloid contents
in the sample.
2.10.1.2 Wagner’s test
To the plant extract/fraction solution, few drops of Wagner’s reagent was added. The
appearance of reddish brown ppt indicates the presence alkaloid contents in the
sample.
2.10.1.3 Hager’s test
The plant extract/fraction solution was treated with few drops of Hager’s reagent
(saturated solution of picric acid). The appearance of yellow ppt indicates the
presence of alkaloid contents in the sample.
2.10.2 Test for flavonoids
2.10.2.1 Ferric chloride test
To the plant extract/fraction, few drops of 1% ferric chloride solution was added. The
formation of blue-green or violet color indicates the presence of flavonoids in the test
sample.
Chapter 2 Materials and Methods
44
2.10.2.2 Sodium hydroxide test
To the plant extract/fraction, small quantity of distilled water was added and then
filtered. To the filtrate added few drops of 10% sodium hydroxide (NaOH), a yellow
color was produced. The change in color from yellow to colorless after the addition of
few drops of dilute hydrochloric acid indicates the presence of flavonoids in the test
sample.
2.10.3 Test for tannins
2.10.3.1 Ferric chloride test
To the plant extract/fraction, few drops of 1% ferric chloride was added. The
formation of blue-green color indicates the presence of tannins in the test sample86.
2.10.3.2 Lead acetate test
The plant extract/fraction was dissolved in distilled water, heated to boil. After boiling
filtered the solution, and then added lead acetate to the filtrate. The formations of
precipitates represent the presence of tannins in the sample.
2.10.4 Test for saponins
The presence of saponin contents was identified by the simplest frothing test. A
specific quantity of the tested extract/fraction was treated with boiling water, allows
to cool, and is then vigorously stirred in a test tube. The presence of saponins was
confirmed by the appearance and perseverance of the froth.

Chapter 2 Materials and Methods
45
2.10.5 Test for steroids
The plant extract/fraction solution (5 mL) was taken in a test tube and acetic
anhydride (1 mL) was added to it. Change of color to green or blue indicates the
presence of steroidal compounds in the test sample.
2.10.6 Test for triterpenes
2.10.6.1 Salkowski’s test
To the plant extract/fraction, sufficient amount of chloroform and few drops of
concentrated sulphuric acid were added. The mixture was shaked in test tube and
allowed to stand for some time. The appearance of red brown color in the lower layer
indicates the presence of sterols, while the appearance of yellow color in the lower
layer indicates triterpenoids in the test sample.
2.10.6.2 Liebermann-Burchard test
To the plant extract/fraction, few drops of acetic anhydride was added. Concentrated
sulphuric acid (H2SO4) was then added to the test tube containing reaction mixture of
extract and acetic anhydride. Two layers were formed. The green appearance of the
upper layer was the indication of sterols, while deep red color was the indication of
the presence of triterpenoids in the test sample86.
2.10.7 Test for glycosides
The plant extract/fraction aqueous solution (5 mL) was mixed with glacial acetic acid
(2 mL) containing a drop of ferric chloride and added this mixture carefully to
concentrated sulphuric acid (1 mL) in the test tube, so that the concentrated sulphuric
Chapter 2 Materials and Methods
46
acid come beneath the mixture. A brown ring appearance, indicates the presence of
the cardiac glycoside87.
2.10.8 Test for carbohydrates
2.10.8.1 Molisch’s test
To the plant extract/fraction, few drops of Molisch’s reagent were added.
Concentrated sulphuric acid was then added slowly to the sample in the test tube. The
formation of purple to violet color at the junction was the indication of the presence of
carbohydrates in the test sample.
2.10.8.2 Benedict’test
To the plant extract/fraction, few drops of Benedict’s reagent were added in a test
tube and boiled for some time on water bath. The formation of reddish brown
precipitate indicates the presence of reducing sugar in the test sample.
2.10.8.3 Fehling’s test
Few drops of the extract/fraction, were added to equal volume of Fehling’s A and B
and then heated till boiling. The Fehling’s A is the aqueous solution of copper
sulphate and the Fehling’s B reagent is the aqueous solution of potassium tatarate and
sodium hydroxide. A brick red ppt indicates the presence of reducing sugar in the test
sample.

Chapter 2 Materials and Methods
47
2.11 Isolation of compounds
2.11.1 Isolation of compounds from CHCl3 fraction
The chloroform (CHCl3) fraction of T. govanianum rhizomes was selected for
isolation of compounds. Column chromatographic technique was used for separation
of compounds. Slurry was prepared with silica gel and was subjected to column
chromatography88. Using n-hexane and EtOAc solvent system as mobile phase in
increasing order of polarity, the fraction was further fractionated into eleven sub-
fractions (CFA-CFK) [Scheme 2.2].
The sub fraction CFB obtained with 20-40% chloroform in n-hexane were re-
chromatographed over silica gel eluting with mixture of n-hexane and EtOAc in
increasing order of polarity yielded five sub fractions (CFB(a)-CFB(e)). The sub fraction
CFB(b) obtained with 5-10% EtOAc/n-hexane when analyzed on TLC showed few
prominent spots and thus were subjected to further separation processes through
column chromatography with gradient solvent elution system yielded compound 1
(2% EtOAc in n-hexane; 13 mg), compound 2 (5% EtOAc in n-hexane; 16 mg) and
compound 3 (5% EtOAc in n-hexane; 11 mg) [Scheme 2.3].
The sub fraction CFE obtained with 20-40% EtOAc in chloroform was re-
chromatographed over silica gel eluting with mixture of EtOAc and n-hexane in
increasing order of polarity yielded compound 4 (20% EtOAc in n-hexane; 94 mg),
compound 5 (20% EtOAc in n-hexane; 21 mg) and compound 6 (60% EtOAc in n-
hexane; 132 mg) [Scheme 2.4].
The sub fraction CFH obtained with 5% MeOH in EtOAc was re-chromatographed
over silica gel eluting with mixture of MeOH and EtOAc in increasing order of

Chapter 2 Materials and Methods
48
polarity yielded five sub fractions. The sub fraction CFHh obtained with 5% MeOH in
EtOAc when analyzed by TLC under UV light showed few prominent spots. Thus this
sub fraction was further subjected to separation process through preparative thin layer
chromatography using mobile phase of MeOH : EtOAc (1 : 9). As a result of this
separation process, compounds 7 (13 mg) and 8 (18 mg) were obtained [Scheme 2.5].

Chapter 2 Materials and Methods
49
Scheme 2.2: Fractionation of chloroform fraction
Chloroform fraction
(CHL.fr)
(62 g)
CFB
CFA CFC
CFD CFH CFJ
CFE
CFF
CFG CFI CFK
100%
n-h
exan
e
100%
CH
L
20-4
0% C
HL
in h
ex
40-8
0% C
Hl i
n he
x
20-4
0% E
tOA
c in
CH
L
60-8
0% E
tOA
c in
CH
L
25%
MeO
H
100%
MeO
H
5% M
eOH
in E
tOA
c
50%
MeO
H in
EtO
Ac
Column chromatography (CC) with
gradient elution system Hex-CHL (0-100%)
CHL-EtOAc (0-100%) and EtOAc-MeOH (0-100%)
100%
EtO
Ac

Chapter 2 Materials and Methods
50
Scheme 2.3: Isolation of compounds from sub fraction (CFB)
CFB
(Sub fraction)
CFB(b)
5-10% EtOAc in n-hexane
Column chromatography (CC) with
gradient elution
Compound 1
(13 mg)
2% EtOAc in n-hexane
(CC) (gradient elution)
Compound 2
(16 mg) Compound 3
(11 mg)
5% EtOAc in n-hexane

Chapter 2 Materials and Methods
51
Scheme 2.4: Isolation of compounds from sub fraction (CFE)
Column chromatography (CC) with
gradient elution
Compound 4
(94 mg)
20% EtOAc in n-hexane
Compound 5
(21 mg) Compound 6
(132 mg)
60% EtOAc in n-hexane
CFE
(Sub fraction)
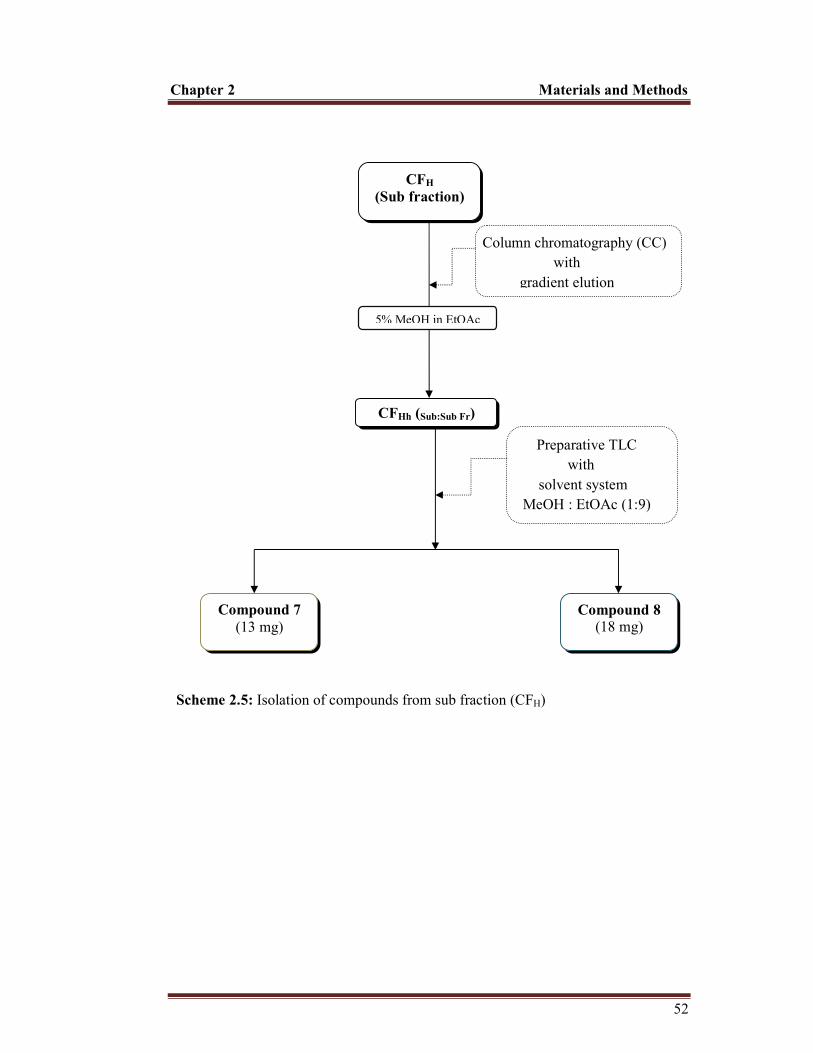
Chapter 2 Materials and Methods
52
Scheme 2.5: Isolation of compounds from sub fraction (CFH)
CFH
(Sub fraction)
Column chromatography (CC) with
gradient elution
Compound 7
(13 mg) Compound 8
(18 mg)
5% MeOH in EtOAc
CFHh (Sub:Sub Fr)
Preparative TLC with
solvent system MeOH : EtOAc (1:9)

Chapter 2 Materials and Methods
53
2.11.2 Isolation of compounds from butanol fraction
For isolation of compounds from butanol soluble fraction, the fraction was subjected
to column chromatography over silica gel and gradient elution was carried out with
mixtures of EtOAc and MeOH in increasing order of polarity yielded five sub
fractions (BFA-BFE). The sub fraction, BFA which was obtained with 10% MeOH in
EtOAc was re-chromatographed over silica gel and eluted with mixture of MeOH and
EtOAc in increasing order of polarity afforded compound 9 (borassoside E, 48 mg, 5-
10% MeOH in EtOAc). The sub fraction BFB which was obtained with 20% MeOH in
EtOAc was re-chromatographed over silica gel, eluted with mixture of MeOH and
EtOAc in increasing order of polarity yielded sub fractions (BFBa-BFBe). The sub
fraction, BFBc which was obtained with 30% MeOH in EtOAc when analyzed by TLC
and cerric sulphate reagent showed few prominent spots. Further re-chromatography
over silica gel eluted with mixture of MeOH and EtOAc in increasing order of
polarity yielded compound 10 (govanoside A, 32 mg, 20% MeOH in EtOAc)
[Scheme 2.6].
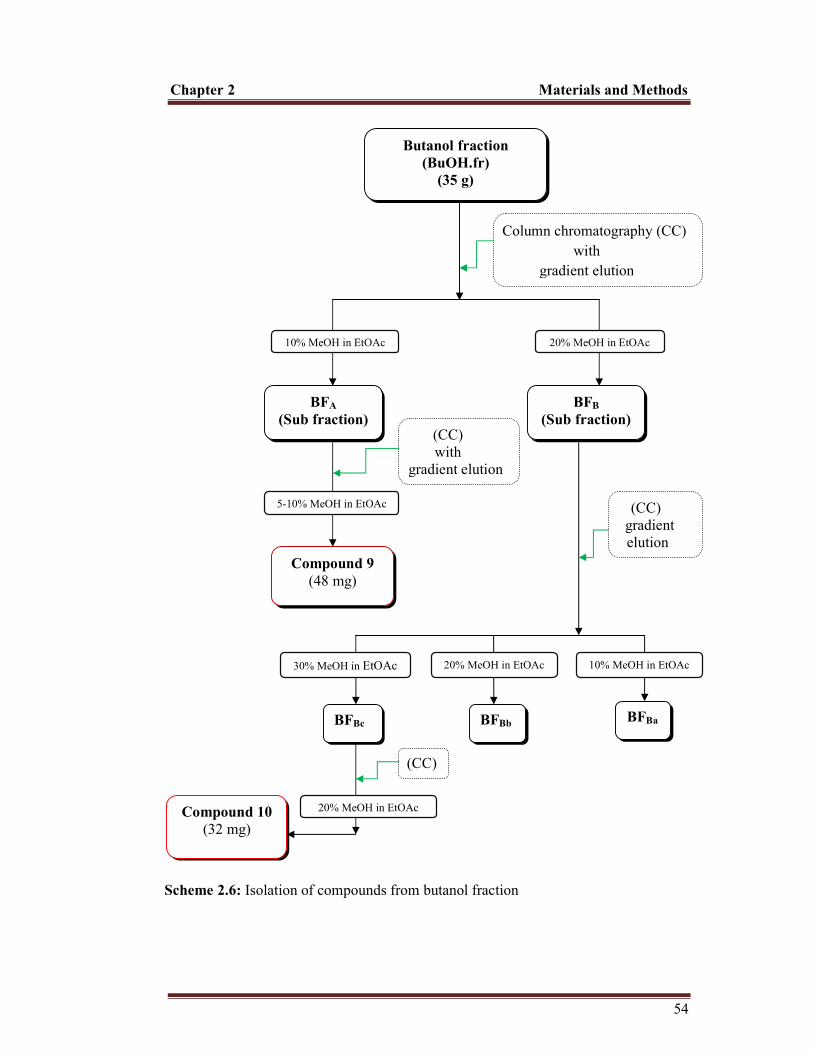
Chapter 2 Materials and Methods
54
Scheme 2.6: Isolation of compounds from butanol fraction
Butanol fraction
(BuOH.fr)
(35 g)
BFBc BFBb
BFB
(Sub fraction)
BFBa
Column chromatography (CC) with
gradient elution
BFA
(Sub fraction)
Compound 9
(48 mg)
10% MeOH in EtOAc
5-10% MeOH in EtOAc
Compound 10
(32 mg)
20% MeOH in EtOAc
10% MeOH in EtOAc
20% MeOH in EtOAc
30% MeOH in EtOAc
(CC) gradient elution
(CC) with
gradient elution
(CC)
20% MeOH in EtOAc

Chapter 2 Materials and Methods
55
2.12 Characterization of isolated compounds
2.12.1 Characterization of hexadecanoic acid (compound 1)
Compound 1 was isolated as white amorphous powder from the sub fraction, CFB(b) of
chloroform soluble fraction. The compound was characterized through modern
spectroscopic data analysis, and was confirmed as hexadecanoic acid.
Table 2.2: Characterization of hexadecanoic acid
Parameters Observations
Physical state white to colorless solid
Molecular formula C16H32O2
HR ESI-MS (m/z) 256.2361
UV activity UV inactive on TLC
Melting point 60-64oC
Isolated quantity 13 mg
Solubility at room temperature Chloroform/Methanol 1H-NMR (CDCl3; 600 MHz) (Table 3.4)
13C-NMR (CDCl3; 150 MHz) (Table 3.4)

Chapter 2 Materials and Methods
56
2.12.2 Characterization of β-sitosterol (compound 2)
Compound 2 was isolated and purified as colorless amorphous powder from the
chloroform soluble sub fraction, CFB(b). The compound was identified and
characterized through modern spectroscopic data analysis and was confirmed as β-
sitosterol.
Table 2.3: Characterization of β-sitosterol
Parameters Observations
Physical state Colorless amorphous powder
Molecular formula C29H50O
HR ESI-MS (m/z) 414.3621
UV activity UV inactive on TLC
Melting point 135-138oC
Isolated quantity 16 mg
Solubility at room temperature Chloroform 1H-NMR (CDCl3; 600 MHz) (Table 3.5)
13C-NMR (CDCl3; 150MHz) (Table 3.5)

Chapter 2 Materials and Methods
57
2.12.3 Characterization of stigmasterol (compound 3)
Compound 3 was isolated and purified as colorless amorphous powder from the
chloroform soluble sub fraction, CFB(b). The compound was identified and
characterized through modern spectroscopic data analysis and was confirmed as
stigmasterol.
Table 2.4: Characterization of stigmasterol
Parameters Observations
Physical state Colorless amorphous powder
Molecular formula C29H48O
HR ESI-MS (m/z) 412.3624
UV activity UV inactive on TLC
Melting point 161-168oC
Isolated quantity 11 mg
Solubility at room temperature Chloroform 1H-NMR (CDCl3; 600 MHz) (Table 3.6)
13C-NMR (CDCl3; 150 MHz) (Table 3.6)

Chapter 2 Materials and Methods
58
2.12.4 Characterization of diosgenin (compound 4)
Compound 4 was isolated and purified as whit to off white needles/powder from the
chloroform soluble sub fraction, CFE. This compound was identified and
characterized through modern spectroscopic data analysis and was confirmed as
diosgenin.
Table 2.5: Characterization of diosgenin
Parameters Observations
Physical state White to off white needles/powder
Molecular formula C27H42O3
HR ESI-MS (m/z) 414.3042
[α]26 D -124o (in MeOH)
UV activity UV inactive on TLC
Melting point 204-207oC
Isolated quantity 94 mg
Solubility at room temperature Chloroform 1H-NMR (CDCl3; 600 MHz) (Table 3.7)
13C-NMR (CDCl3; 150 MHz) (Table 3.7)

Chapter 2 Materials and Methods
59
2.12.5 Characterization of pennogenin (compound 5)
Compound 5 was isolated and purified as white to off white powder from the
chloroform soluble sub-fraction, CFE through column chromatography. The
compound was identified and characterized through modern spectroscopic data
analysis and was confirmed as pennogenin.
Table 2.6: Characterization of pennogenin
Parameters Observations
Physical state White powder
Molecular formula C27H42O4
HR ESI-MS (m/z) 430.2960
[α]26 D -99.8o (in MeOH)
UV activity UV inactive on TLC
Melting point 206-208oC
Isolated quantity 21 mg
Solubility at room temperature Chloroform 1H-NMR (CDCl3; 600 MHz) (Table 3.8)
13C-NMR (CDCl3; 150 MHz) (Table 3.8)

Chapter 2 Materials and Methods
60
2.12.6 Characterization of govanic acid (compound 6)
Compound 6 was isolated and purified as white powder from the chloroform soluble
sub-fraction, CFE. The compound was identified and characterized as a new fatty acid
through modern spectroscopic data analysis and was given common name, govanic
acid.
Table 2.7: Characterization of govanic acid
Parameters Observations
Physical state White powder
Molecular formula C18H34O5
HR ESI-MS (m/z) 330.4566
[α]26 D -52.8 (in MeOH)
UV activity UV inactive on TLC
Melting point 78-83oC
Isolated quantity 132 mg
Solubility at room temperature Methanol 1H-NMR (CD3OD; 600 MHz) (Table 3.9)
13C-NMR (CD3OD; 150 MHz) (Table 3.9)

Chapter 2 Materials and Methods
61
2.12.7 Characterization of 20-hydroxyecdysone and 5,20-dihydroxyecdysone
(compounds 7 and 8)
The sub fraction, CFH obtained from CHCl3 soluble fraction was subjected to column
chromatography (CC) over silica gel using gradient solvent system (n-hexane /
EtOAc). The sub fraction (CFHh) eluted with EtOAc/MeOH (9.5:0.5v/v) solvent
system was subjected to preparative thin layer chromatography (TLC), using
EtOAc/MeOH (9:1) solvent system yield, 20-hydroxyecdysone (7) and 5,20
dihydroxyecdysone (8).
Table 2.8: Characterization of 20-hydroxyecdysone
Parameters Observations
Physical state White powder
Molecular formula C27H44O7
HR ESI-MS (m/z) 480.5527
UV activity UV active on TLC
Melting point 243-245oC
Isolated quantity 13 mg
Solubility at room temperature Methanol 1H-NMR (CD3OD; 600 MHz) (Table 3.10)
13C-NMR (CD3OD; 150 MHz) (Table 3.10)

Chapter 2 Materials and Methods
62
2.12.8 Characterization of 5, 20-hydroxyecdysone (compound 8)
Table 2.9: Characterization of 5,20-dihydroxyecdysone
Parameters Observations
Physical state White powder
Molecular formula C27H44O8
HR ESI-MS (m/z) 496.5510
UV activity UV active on TLC
Melting point 248-251oC
Isolated quantity 18 mg
Solubility at room temperature Methanol 1H-NMR (CD3OD; 600 MHz) (Table 3.11)
13C-NMR (CD3OD; 150 MHz) (Table 3.11)

Chapter 2 Materials and Methods
63
2.12.9 Characterization of borassoside E (compound 9)
Compound 9 was isolated and purified as white to off white amorphous powder from
butanol soluble sub-fraction, BFA. This compound was identified and characterized
through modern spectroscopic data analysis and was confirmed as steroidal glycoside
borassoside E.
Table 2.10: Characterization of borassoside E
Parameters Observations
Physical state White to off white amorphous powder
Molecular formula C45H72O16
HR FAB+ (m/z) 869.4725
[α]26 D - 47.2o (in MeOH)
UV activity UV inactive on TLC
Melting point 263-266oC
Isolated quantity 48 mg
Solubility at room temperature Methanol 1H-NMR (CD3OD; 600 MHz) (Table 3.12)
13C-NMR (CD3OD; 150 MHz) (Table 3.12)
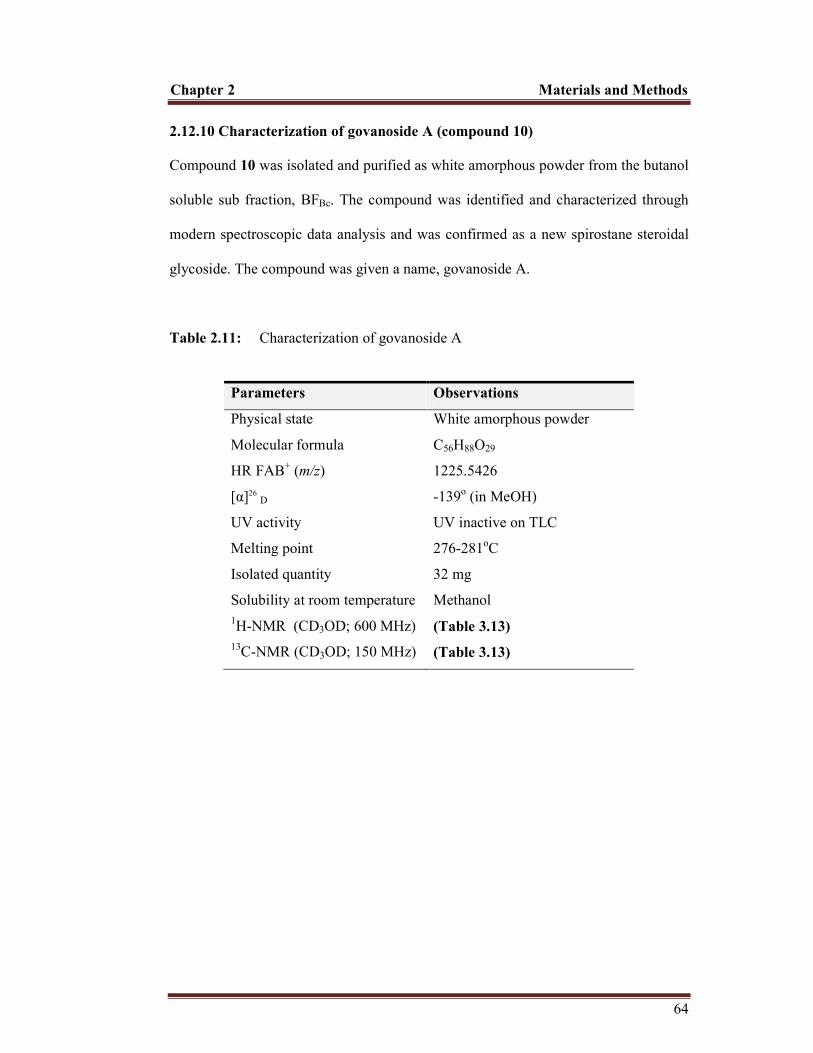
Chapter 2 Materials and Methods
64
2.12.10 Characterization of govanoside A (compound 10)
Compound 10 was isolated and purified as white amorphous powder from the butanol
soluble sub fraction, BFBc. The compound was identified and characterized through
modern spectroscopic data analysis and was confirmed as a new spirostane steroidal
glycoside. The compound was given a name, govanoside A.
Table 2.11: Characterization of govanoside A
Parameters Observations
Physical state White amorphous powder
Molecular formula C56H88O29
HR FAB+ (m/z) 1225.5426
[α]26 D -139o (in MeOH)
UV activity UV inactive on TLC
Melting point 276-281oC
Isolated quantity 32 mg
Solubility at room temperature Methanol 1H-NMR (CD3OD; 600 MHz) (Table 3.13)
13C-NMR (CD3OD; 150 MHz) (Table 3.13)

Chapter 2 Materials and Methods
65
2.13 Biological studies
2.13.1 In vitro biological activities
The following in vitro biological activities were performed on Cr. MeOH-Ext, its
subsequent solvent soluble fractions and isolated compounds.
2.13.1.1 Antibacterial activity
The Cr. MeOH-Ext and its subsequent solvents soluble fractions of T. govanianum
rhizomes were screened for their antibacterial potential, against different gram
negative (E. coli, S. flexenari, P. aeruginosa and S. typhi) and gram positive bacteria
(B. subtilis and S. aureus), following agar well diffusion method89. Cr. MeOH-Ext or
subsequent solvent fraction (3 mg/mL) was dissolved in dimethyl sulfoxide (DMSO)
for the preparation of stock solution. Molten nutrient agar (approximately 45 mL) was
distributed in sterilized petri plates, and was permitted to harden. Bacterial culture
was dispersed on these nutrient agar plates by preparing sterile soft agar accumulating
100 µL of bacterial culture. Sterile metallic borer was used for well digging (6 mm
long) at suitable distance and spotted for identification. Sample (100 µL) was poured
into each well, and kept in incubator at 37 oC for 24 h. The antibacterial activity was
observed in the form of zone of inhibition (mm), and percent inhibition was
calculated. Standard antibacterial drug (broad spectrum antibacterial) used was
imipenem in the assay while DMSO was used as negative control.
2.13.1.2 Antifungal activity
Antifungal susceptibility testing of Cr. MeOH-Ext its subsequent solvent soluble
fractions and isolated compounds was performed with slight modification of
previously reported method90. Shortly, samples were serially diluted using 20%

Chapter 2 Materials and Methods
66
dimethyl sulfoxide in 0.9% saline and transferred in duplicate to 96-well flat-bottom
microplates. Candida spp. inocula were prepared by picking 1 to 3 colonies from agar
plates and resuspending in ≈4 ml 0.9% sterile saline. The optical density at 630 nm of
the saline suspensions was compared to the 0.5 McFarland standards. The
microorganisms were diluted in broth (RPMI 1640 at pH 4.5) to afford final target
inocula of 5.0 × 10³ for Candida spp. The Aspergillus spp. inocula were made by
carefully removing spores from agar slants, transferring to ≈ 4 ml 0.9 % saline, and
filtering through Miracloth (Merck Millipore, USA). The filtrate was diluted
appropriately in 5% Alamar blue (Life technologies, USA)-RPMI 1640 broth (at pH
7.3) to afford a final target inoculum of 4.0 ×10⁴ CFU/mL. The fungal inocula were
added to the samples to achieve a final volume of 200 µL. Negative control (media
only) and positive control (amphotericin B) were included on each test plate. All
organisms were read at 630 nm using BioTek reader (Bio-Tek, USA) prior to and
after incubation (Candida spp. at 25°C for 18 to 24 h; Aspergillus spp. at 25°C for 72
h). The concentration range, used for determination of MIC was from 0.312 to 20
µg/mL. The MIC was defined as the lowest test concentration that allowed no
detectable growth in comparison to controls.
2.13.1.3 Antioxidant activity
DPPH free radical scavenging assay was used for in vitro antioxidant evaluation of
Cr. MeOH-Ext and its subsequent fractions following previously reported method91
with slight modifications. Two mL of 0.1 mM DPPH free radical solution in methanol
were added to 1 mL of different concentrations (1, 10, 30, 50, 100 and 200 µg/mL) of
the fractions or standards in methanol. The solutions were shaken thoroughly on a
vortex (Gyromixer, Pakland Scientific Production, Pakistan) and incubated in the dark

Chapter 2 Materials and Methods
67
at ambient temperature for 30 min. Absorbance was then measured at 517 nm using
UV visible spectrophotometer (Lambda 25, PerkinElmer, USA) against control which
consisted of 0.1 mM DPPH free radical solution without extracts or standards. Blank
consisted of methanol alone. Ascorbic acid and butylated hydroxytoluene (BHT) were
used as standards antioxidants. The percent DPPH free radical scavenging was
calculated using the following formula;
PercentDPPH = AI − AII
AI× 100
AI = absorbance of the reaction (control)
AII = absorbance of the sample.
2.13.1.4 Anticancer activity
The cytotoxic activity of Cr. MeOH-Ext its subsequent fractions and isolated
compounds was determined by the MTT assay, according to previously reported
method92,93 on two cancer cell lines, i.e. HeLa (cervical cancer cells) and PC-3
(prostate cancer cells). For MTT assay, cells were grown in DMEM (Dulbecco’s
modified Eagle medium) and MEM (modified Eagle’s medium) containing 10% FBS
and 2% antibiotic (penicillin and streptomycin) and maintained at 37°C, in 5 % CO2,
for 24 h, in a flask. Cells were plated (1 × 10⁵ cell/mL) in 96-well flat bottom plates
and incubated for 24 h for cell attachment. Various concentrations of test
sample/fractions ranging from 1.25-20 µM were added into the well and incubated for
48 h. A 50 µL MTT [3-(4, 5-dimethylthiazol-2-yl)-2,5-diphenyl-tetrazolium bromide;
0.5 mg/mL] aliquot was added to each well 4 h before the end of incubation. Medium
and reagents were aspirated and 100 µL DMSO was added and mixed thoroughly for
15 min to dissolve the formazan crystals. The absorbance was measured at 570 nm

Chapter 2 Materials and Methods
68
using a microplate reader (Spectra Max 340; Molecular Devices, CA, USA). Finally,
IC50 values were calculated. For positive control, doxorubicin was used.
2.13.1.5 Anti-inflammatory activity
The in vitro anti inflammatory potential of Cr. MeOH-Ext, its subsequent fractions
and isolated compounds was determined through Luminol-enhanced
chemiluminescence assay following well define protocol previously reported94.
Briefly, 25 µL of the diluted whole blood HBSS++ (Hanks-Balanced Salt Solution,
containing standard amount of magnesium and calcium chloride) and samples (25 µL)
with different dilutions (1, 10 and 100 µg/mL) were incubated in triplicate. Only cells
and HBSS++ were added to control wells, while HBSS++, cells and testing samples
were added to other wells. The procedure was carried-out in 96-well plate (white-half
area), incubated (for 15 min.) at 37ºC in thermostatic chamber of luminometer. On
completion of incubation, 25 µL each SOZ (serum opsonized-zymosan) and intra-
cellular reactive oxygen species (ROS), detecting probe, (luminal) were supplemented
to well containing testing samples. The intensity of ROS was obtained by mean of
relative light units (RLU) in luminometer. The standard drug ibuprofen was used as
positive control.
2.13.1.6 Anti leishmanial activity
The Cr. MeOH-Ext and its fractions were investigated for leishmanicidal potential
against leishmania major, using previously reported protocol95,96. Promastigotes
of leishmania were cultured in Roswell Park Memorial Institute (RPMI) medium,
augmented with 10% thermally inactivated fetal bovine serum. At log-phase of
growth promastigotes were centrifuged (2000 rpm) for 10 min, maintaining the same

Chapter 2 Materials and Methods
69
experimental conditions and were washed (three times) with saline. Fresh culture
medium was used to obtain parasites final density by dilution (1×10⁶ cells mL-1).
Medium was added to different 96 wells micro titer-plate, tested samples (20 mL) was
diluted serially by adding medium. Parasite culture (100 mL) was added to each well.
First two rows were specified for controls (medium served as negative control, while
Amphotericin B was used as positive control). Loaded plates were incubated (22-
25°C) for consecutive 72 h. Parasites were counted using on an improved Neubaure’s
chambers. The IC50 of tested samples were determined through Windows operating
Ezfit 5.03 Perella Scientific software. The assay was performed as triplicate.
2.13.1.7 Brine shrimp cytotoxicity
In this bioassay technique artificial sea water was taken in a Jar, brine-shrimp eggs
(Artemia salina; 1 mg) was added to it and cover the Jar by aluminum foil, to darken
it. The Jar was kept at 25oC for 24 h, resulted in hatching ample of larvae. Test sample
(20 mg) was liquefied in 2 mL chloroform (10 mg/mL) to prepare stock solution.
From the stock solution, various concentration (10, 100 and 1000 µg/mL) were
prepared. The DMSO was used for the dilution of each concentration and then sea
water (5 mL) was poured to each vial containing ten brine shrimps and kept for 24 h.
For positive control, the drug etoposide was used. The percent mortality was
calculated for tested groups as well as for positive control97.
2.13.1.8 Insecticidal activity
The insecticidal potential of crude extract methanolic extract and subsequent fractions
were determined against Tribolium castaneum and Rhyzopertha dominica. For the
assay first stock solution was prepared by dissolving test sample (200 mg) in acetone

Chapter 2 Materials and Methods
70
(3 mL). A 90 mm filter paper was positioned in petri dishes and loaded with test
sample (1019.10 µg/cm2). In order to evaporate the volatile organic solvent the petri
dishes was left for 24 h. Ten active insects were transferred to each petri dish next
day, and incubated at 27 ± 1oC for 24 h. Permethrin (239.50 µg/cm2) and acetone were
used as positive control and negative control respectively. By comparison results of
test sample with positive control percent mortality was calculated95,96,98.
By using the following formula percentage mortality was determined.
Percentmotality = 100 −Numberoflivinginsectsintest
Numberoflivinginsectsincontrol× 100
2.13.1.9 Protein antiglycation activity
For the in vitro antiglycation assay, previously reported method99,100 was used to
determine the antiglycation potential of Cr. MeOH-Ext, fractions and isolated
compounds. The fructose mediated production of fluorescent AGEs on Human Serum
Albumin (HSA) assay was employed with slight modifications. Test samples were
dissolved in absolute DMSO at 1 mM Concentration. HSA was employed as the
model protein to be glycated at 10 mg/mL concentration with 0.5 M fructose as
glycating agent. Test samples were incubated in triplicates on 96-well plate at various
concentrations with 10 mg/mL HSA, 0.5 M fructose, 0.1 M phosphate buffer (pH 7.4)
containing 0.1 M sodium azide as bactericidal agent and incubated at 37ºC for 7 days.
HSA, fructose, and phosphate buffer were incubated with the same concentration for
positive control and conditions with absolute DMSO. After 7 days of incubation, the
96-well plate was observed for fluorescence at wavelength of 330-440 nm on
microtitre plate spectrophotometer (Spectra Max M2, Molecular Devices, USA).

Chapter 2 Materials and Methods
71
Rutin was used for positive control. The percent inhibition values were calculated by
the following formula;
PercentInhibition = 1 −"luorescenceoftestsample
"luorescenceofthecontrolgroup× 100
The samples that exhibit 50% or above percent inhibition, were processed for IC50
value calculation by using Ez-fit software (Perrella Scientific, USA).
2.13.1.10 Smooth muscle relaxant activity
The muscle relaxant (spasmolytic) potential of Cr. MeOH-Ext was studied on isolated
rabbit jejunum preparations in according to the previously reported protocol101. In an
organ bath filled with Tyrode’-s solution (37°C) and aerated with natural air, rabbit
jejunum (1-1.5 cm) was suspended. Intestinal contractions were recorded with the
help of isometric transducer attached with Power-lab Data Acquisition System
connected to computer executing Lab-chart software. The tissue was equilibrated for
30 min before tricking with any chemical. Suspended tissue was made stabilized by
subsequent exposure to acetylcholine (0.3 µM) solution, following washing
thoroughly with Tyrode’s solution, until responses (sub--[maximal) of even magnitude
were achieved. The pragmatic tone of impulsive rhythmic contraction was used to
test muscle relaxant (anti-spasmodic) potential in isolated rabbit jejunum tissue.
For the study of Ca++ channel blocking (CCB) effect, previously reported method was
followed with slight modification27. In this analysis high potassium (K+, 80 mM) was
implicated to depolarize the tissue. Testing sample was added in cumulative manner
(on achieving induced contraction plateau) to observe dose-reliant inhibitory
contractions. To validate the Ca++ antagonistic activity of the testing sample, the

Chapter 2 Materials and Methods
72
suspended tissue was stabilized in Tyrode’s[solution, later on the solution was
substituted with another solution (similar to Tyrode’s solution, instead of
Ca++ containing EDTA 0.1 mM) to deprive the tissue from Ca++ for 30 min). The
Ca++free solution was superseded with another solution [containing (mM): KCl, 50;
NaCl, 91.03; NaHCO3, 11.9; EDTA-Na2.2H2O, 0.1; glucose, 5.05; NaH2PO4.2H2O,
0.32 and MgCl2.6H2O, 0.50]. By incubating (30 min) at same temperature, CRCs
(control concentration reaction curves) of Ca++ were observed. Constructing, control
CRCs for Ca ++, the suspended tissue was re-treated with test sample for a period of 1
h. The Ca++ CRCs were plotted in the existence of variable concentration of the
sample to monitor the Ca ++antagonist potential.
2.13.1.11 β-Glucoronidase inhibitory activity
The Cr. MeOH-Ext, fractions and isolated compounds were screened for β-
glucuronidase inhibition. The previously reported assay102 was followed while using p
nitrophenyl β-D-glucuronide as substrate. The enzyme mixture (total volume 250 mL)
contained 50 mL of p-nitrophenyl glucuronide, 190 mL of acetate buffer, 5 mL
enzyme and 5 mL of inhibitor. The assay mixture was incubated at 37oC for 40 min,
the reaction was stopped by the addition of 50 mL of 0.2 M Na2CO3, and the
absorbance was measured at 405 nm. D saccharic acid-1,4-lactone was used as a
standard inhibitor. The percent inhibitory activity (%) was calculated using the
following formula;
Percentinhibition = E − S
E× 100
Where ‘‘E’’ is the activity of enzyme without test material and ‘‘S’’ is the activity of
enzyme with test material.
Chapter 2 Materials and Methods
73
2.13.1.12 α-Chymotrypsin inhibitory activity
The Cr. MeOH-Ext, fractions and isolated compounds were tested for enzyme α-
chymotrypsin inhibition following reported protocol103. For the assay enzyme
chymotrypsin (12 units/mL) prepared in Tris–HCl buffer (pH 7.6) was pre incubated
with test samples (prepared in final concentration of 7% DMSO) at 30°C for 25 min.
The substrate, N-succinyl-phenylalanine-p-nitroanilide (0.4 mM, final) was added to
start the enzyme reaction. The absorbance of released p-nitroaniline was constantly
monitored at 410 nm until a significant color change was observed using a microplate
reader and SoftMax Pro software (Molecular Device, CA, USA). Chymostatin was
used as the standard inhibitor.
The percent inhibition was calculated as,
Percentinhibition = 100 −ODoftestSample
ODoftheControl× 100
The samples that exhibit 50% or above percent inhibition, were processed for IC50
value calculation by using Ez-fit software (Perrella Scientific, USA).
2.13.1.13 Thymidine phosphorylase inhibitory activity
The Cr. MeOH-Ext and its fractions of T. govanianum were tested for enzyme
thymidine phosphorylase inhibition. The assay was performed as previously reported
method104. TP/PD-ECGF (E. coli, thymidine phosphorylase (Sigma T6632) activity
was calculated by measuring the absorbance at 290 nm spectro photometrically.
Shortly, total reaction mixture of 200 µL containing 145 µL of potassium phosphate
buffer (pH 7.4), 30 µl of enzyme (E. coli thymidine phosphorylase (Sigma T6632) at
concentration 0.05 and 0.002 U, respectively, were incubated with 5 µL of test

Chapter 2 Materials and Methods
74
materials for 10 min at 25oC in microplate reader. After incubation, pre reading at 290
nm was taken to deduce the absorbance of substrate particles. Substrate (20 µL, 1.5
mM) dissolved in potassium phosphate buffer was immediately added to plate and
continuously read after 10, 20, and 30 min in microplate reader. 7-Deazaxanthine was
used as the positive control.
2.13.1.14 Acetylcholinesterase inhibitory activity
The Cr. MeOH-Ext and fractions of T. govanianum rhizomes were tested for acetyl
cholineesterase (AChE) inhibitory potential. The assay was carried out according to
the previously reported protocol105,106. The reaction mixture contain 50 mM Tris-Hcl
with pH 8.0, (200 µl), BSA buffer (1%), test sample (100 µL) keeping final
concentration at 100 µg/mL. The method based on the hydrolysis of acetyl thiocholine
iodide by the respective enzymes and the formation of 5-thio-2-nitrobenzoate anion
followed by complexation with DTNB to give yellow color compound, which is then
detected with spectrophotometer. The yellow color was measured at 405 nm after 4
min. Galantamine (final conc. 100 µg/mL) was used as positive control. The AChE
percent inhibition was calculated by below given formula;
PercentAChEinhibition = A − B
A× 100
Where A represent change in absorbance without test sample, while B represent
change in the absorbance with test sample.

Chapter 2 Materials and Methods
75
2.13.2 In vivo biological studies
The Cr. MeOH-Ext and its subsequent solvent soluble fractions of T. govanianum
rhizomes were evaluated for various in vivo biological activities. The detailed
procedures for the in vivo biological activities are described below.
2.13.2.1 Experimental animals
BALB/c mice of either sex (25-35 g) used were acclimatized at 25 ± 2°C under a 12 h
dark/light cycle for ten days. Clean and properly dried food was given to the mice and
the water was changed on daily basis. The experimental protocols for this study were
approved by the Ethical Committee of the Department of Pharmacy, University of
Peshawar, Pakistan.
2.13.2.2 Acute toxicity test
The acute toxicity test was carried out to determine the lethal and non lethal doses of
the Cr. MeOH-Ext of T. govanianum rhizomes. The experimental animals (mice)
were divided into six groups, each containing six animals. The extract was
administered in doses of 250, 500, 1000, 1500, 3000 and 6000 mg/kg body weight
(p.o.). The control animals received an equal volume of saline. The mortality rate was
measured 24 h post drug administration107.
2.13.2.3 Anti-inflammatory activity
The anti-inflammatory activity of Cr. MeOH-Ext and subsequent fractions was
performed on mice of either sex (25-35 g) following carrageen induced paw edema
protocol previously reported108,109. The animals were randomly divided in five groups
each comprises of six animals. Group I was treated with normal saline (10 ml/kg)

Chapter 2 Materials and Methods
76
negative control, group II was treated with diclofenac sodium (10 mg/kg) positive
control, the remaining groups (III, IV and V) were treated with T. govanianum
rhizomes Cr. MeOH-Ext (50, 100, and 200 mg/kg, orally) and fractions (25, 50, and
200 mg/kg, orally). After thirty min of administration, carrageenan (1%, 0.05 mL)
was injected subcutaneously in the sub plantar tissue of the right hind paw of each
mouse. For the measurement of inflammation plethysmometer (model; LE 7500 plan
lab S.L) was used, directly after injection of carrageenan and then after an intervals of
1, 2, 3, 4 and 5h. The average paw swelling in samples treated animals as well as
standard was compared with that of control, and the percent inhibition of edema was
determined using the following formula;
Percentinhibition = A − B
A× 100
Where, "A" represent paw edema volume of control and "B" as paw edema volume of
tested group.
2.13.2.4 Analgesic activity
2.13.2.4.1 Tonic-visceral chemical induced nociception test
For tonic visceral chemical induced nociception, acetic acid induced abdominal
constriction assay was performed for elucidating the peripheral antinociceptive effect
of T. govanianum rhizomes110. The animals were withdrawn from food 2 h before the
start of experiment. All the extract and fractions of T. govanianum rhizomes were
administered orally through an oral gavage tube at doses of 50 and 100 mg/kg.
Diclofenac sodium was used as standard and was orally administered at a dose of 50
mg/kg. After 1 h of treatment, all animals were injected with 1% acetic acid, (i.p.).

Chapter 2 Materials and Methods
77
The number of writhes was counted after 5 min of acetic acid injection and was
continued for 20 min.
2.13.2.4.2 Hot plate test
The central analgesic effect of T. govanianum rhizomes was evaluated by the hot plate
method111. Animals were withdrawn from food 2 h before the start of experiment. All
animals were screened for pre test latency and only those animals having a pre test
latency of <15 second (sec) were selected for the experiment. A cut off time of 30 sec
was set to avoid thermal injury. All the extract and fractions of the rhizomes were
administered orally through an oral gavage tube at doses of 50 and 100 mg/kg.
Tramadol was used as standard and was administered orally at a dose of 30 mg/kg.
After 1 h of extract and 30 min of standard administration, the latency time was
measured at 30, 60, 90 and 120 min using a hot plate (Havard apparatus) maintained
at 54 ± 0.1°C.

Chapter 3 Results and Discussion
78
3. Results and Discussion
3.1 Ethnomedicinal studies
In this study, regarding the medicinal uses of T. govanianum rhizomes, information
was collected from people of four districts of Khyber Pakhtunkhwa. Informants
included plant collectors, local drug sellers, Hakims and local elders having drug
knowledge (Fig. 3.1). From ethnomedicinal survey, it was found that this plant is
abundantly available in District Upper Dir (Kohistan) and District Swat (Kohistan and
mountainous areas) of Khyber Pakhtunkhwa in comparison to District Shangla and
Buner. Furthermore, during field survey, it was observed that a large number of local
people were involved in digging and collection of this plant species for commercial
sale and earning purposes. Majority of the informants in these areas were unaware of
the uses of rhizomes. They were engaged only in the collection and marketing of the
rhizomes as their earning source. Only a limited number (<17% in any category) of
informants knew about the uses of rhizomes (Table 3.1). The Hakims and local
elderly people of District Dir and Swat confirmed the medicinal uses of the rhizomes
in the treatment of cancer, GI disorders, sexual disorders, backache, kidney problems
and as vermicide. The percent information of informants regarding the uses of
rhizomes were higher in district Dir followed by district Swat in comparison to
district Shangla and Buner.
The ethnomedicinal uses of this plant as reported by the informants from the four
districts indicate that highest presumed indication is inflammatory disorders including
backache, headache, general inflammation, joint pains and kidney problems (with
highest 21.6% and 14.7% informants from Dir and Swat having a consensus at this
use) followed by anti-cancer use (15% and 12.8% from Swat and Dir respectively at

Chapter 3 Results and Discussion
79
this use). In case of other indications, applications in infections (16.8% from Swat and
13.4% from Dir); GI disorders (14.7% from Swat and 10.4% from Dir); and sexual
disorders (9.2% from Dir and 7.3% from Swat) came to picture. From this survey, an
interesting finding was the response from people of Swat who appeared to have more
information regarding the uses of this plant followed by the people of district Dir.
This probably is due to the higher educational level in these two districts in
comparison to Shangla and Buner districts. Moreover, highest numbers of informants
(124) were from Swat followed by Dir (81), Shangla (39) and Buner (9) that shows
the level of understanding in these districts (Fig. 3.1). It was also evident from the
survey that local elders were having appreciable information on the plant use, and that
is shared and transferred to other people. These presumed uses are in confirmation to
some recent reports of plants of genus Trillium that have reported impact in sexual
disorders71, skin infections112, infections other than skin infections72,113, as
anthelmintic114,115, and other inflammatory disorders73. However, the use in cancer
needs to be sifted scientifically and if found to have an impact will be of great
significance in cancer treatment research and thus will serve humanity and will also
be a source of great earning for the people associated with the collection and
processing of this plant as well as will generate revenue for our country. However,
scientific conservation of this plant is needed as over collection may endanger this
therapeutically precious plant.
The ethnomedicinal study enables researchers to work with common population to
investigate knowledge based on experiences of ages116. Moreover, the indigenous
plants which is particularly medicinal species even in this modern era, play a key role
in the socioeconomic strengthening of the rural areas, and a variety of locally
produced medicines are still commonly used as household remedies for treating

Chapter 3 Results and Discussion
80
different aliments117. If this medicinal herb is processed, commercialized and sold in
such a way that no conservation strategy is adopted, there is chance of extinction of
this herb from these areas. Therefore, it is necessary for the concerned authorities and
the government to prepare a conservation strategy to safeguard this valuable asset of
this region. There is also need for creating awareness among the local people
regarding the propagation and cultivation methods in order to conserve this valuable
medicinal herb.

Chapter 3 Results and Discussion
81
Figure 3.1: Informants for the ethnomedicinal uses of T. govanianum rhizomes
from different districts of Khyber Pakhtunkhwa
15
24
10
32
81
42
31
21
30
124
10
4
4
21
39
0
1
3
5
9
Plant collectors
Local drug sellers
Hakims (Traditional healers)
Local elderly people
Total
Informants for the ethnomedicinal uses of T. govanianum
rhizome from different districts of Khyber Pakhtunkhwa
Buner Shangla Swat Dir

Chapter 3 Results and Discussion
82
Table 3.1: Informants and therapeutic uses of T. govanianum rhizomes in different Districts of Khyber Pakhtunkhwa
Therapeutic Uses Dir (U)
(%)
Swat
(%)
Shangla
(%)
Buner
(%)
Reported References
Cancer 12.8 15.0 3.8 0.5 - Sexual disorders (Erectile dysfunction; Sexual tonic)
9.2 7.3 1.9 1.2 71
GI Disorders (Abdominal spasms) 10.4 14.7 1.7 - - Skin Infections 6.2 11.1 2.1 - 112 Infectious diseases (Healing of wounds, antiseptic, bacterial diarrhea, dysentry)
13.4 16.8 - 2.1 72,113
Anthelmintic 15.3 7.2 3.4 - 114,115 Others (backache; fever; inflammation; headache; kidney problems)
14.7 21.6 4.4 - 73
Plant Information - Local name Matarzela Matajarra Matajarai Matajarra - Plant parts used Rhizome Rhizome Rhizome Rhizome - Availability Abundant Abundant Rare Rare -

Chapter 3 Results and Discussion
83
3.2 Morphological studies
3.2.1 Macroscopic features
The macroscopic findings of rhizome can serve as diagnostic parameters. The
collected rhizomes were observed grayish to brown in color (Fig. 3.2a and b) while
their internal matrix was slightly whitish in color. The external surface was rough
having striation and fractures. The pieces were 3 to 5 cm long and up to 0.8 to 1.5 cm
thick slightly curved and twisted. The dried powder was slightly whitish in color
having bitter taste and pungent odor.
Figure 3.2a: Trillium govanianum plant.
Figure 3.2b: T. govanianum rhizomes.
3.2.2 Microscopic features
In the current scientific era, although modern and sensitive techniques for evaluation
of the plant drugs are available but still microscopic examination methods are one of

Chapter 3 Results and Discussion
the simplest and economic ways for correct identification of the source materials118.
The transverse section of rhizomes (Fig. 3.3a and b) showed presence of cortex cells,
trichomes, carinal canal, sclereids, vascular bundles (xylem and phloem), fibers,
cambium, calcium oxalate crystals and starch grains. Calcium oxalate crystals were
abundant in rhizome. These histological and morphological studies of the rhizome are
key in rapid identification of T. govanianum rhizome.
Figure 3.3a: Transverse section of T. govanianum rhizome.
Vascular bundles (Phloem)
Cortex cells
Cambium Carinal

Chapter 3 Results and Discussion
85
Figure 3.3b: Transverse section of T. govanianum rhizome.
3.3 Physicochemical studies
In physicochemical studies, different physicochemical parameters were analyzed. The
extractive values are helpful to assess the chemical constituents present in the crude
drugs, and also help in assessment of definite constituents, soluble in a particular
solvent118,119. Ash values of a drug provide an insight into the earthy matter, inorganic
composition and other impurities present along with the crude drug. With respect to
physicochemical parameters obtained from this study, total ash value was determined
to be 12.5%, water soluble ash 4.0%, acid soluble ash 2.4% and acid insoluble ash
0.8% w/w (Fig. 3.4).
Calcium oxalate crystals
Starch grains
Trichomes
Xylem
Sclereids
Fibers

Chapter 3 Results and Discussion
86
Loss on drying of powder rhizomes was 14.8%. Ultimate dryness is not necessary for
the drug, and majority of the drugs contain some percent of moisture contents, but
higher moisture can result in spoilage by microorganisms especially the fungi, and
also chemical reactions such as hydrolysis and oxidation can deteriorate crude
drugs76. Thus it is key element in drug preparation to know the rate and condition at
which moisture is removed. The loss on drying observed was 14.8% w/w, which
shows high proportion of moisture, and it can be assumed that the powder drug has
high moisture content, and it is also likely, that it is highly hygroscopic.
Extractive values (Fig. 3.4) were high for solvents like water (21.5%) and methanol
(18.75%) as compared to non-polar solvents, which is an indicative of abundance of
sugars, and other polar compounds like glycosides, saponins, flavonoids and steroidal
glycosides.

Chapter 3 Results and Discussion
87
Figure 3.4: Physicochemical parameters of T. govanianum rhizomes.
14.8
12.5
4
2.4
0.8
21.5
18.75
13.62
7.1
2.25
5.8
1.2
Loss on drying
Total ash
Water soluble ash
Acid soluble ash
Acid insoluble ash
Water soluble
Methanol soluble
Ethanol soluble
Butanol soluble
Ethyl acetate soluble
Chloroform soluble
n-hexanes soluble
Ash
val
ues
Ext
ract
ive
valu
esPhysicochemical parameters of T. govanianum rhizome
Percentage value (W/W %)

Chapter 3 Results and Discussion
88
3.4 Phytochemical studies
3.4.1 Qualitative phytochemical screening
The preliminary (qualitative) phytochemical tests of T. govanianum rhizomes
revealed the presence of secondary metabolites like steroids, glycosides and saponins
(Table 3.2), and these metabolites have been previously reported in the genus
Trillium44,120 , which includes species traditionally used in the treatment of different
diseases by virtue of these phytochemicals121-123.

Chapter 3 Results and Discussion
89
Table 3.2: Preliminary phytochemical profile of T. govanianum rhizomes
Phytochemical Qualitative test Cr. MeOH-Ext n-Hex-fr CHL-fr EtOAc-fr BuOH-fr
Alkaloids Mayer’s test - - - - -
Wagner’s test - - - - -
Glycosides Keller Killiani test + - + + +
Tannins Ferric chloride test + - + - +
Lead acetate test + - - - +
Flavonoids Ferric chloride test + - + - +
Sodium hydroxide test + - + + -
Carbohydrates Molisch’s test + - + + +
Sterols Liebermann-Burchard test + + + + +
Salkowski’s test + + + + +
Saponins Frothing test + - + + +
+ indicates the presence of phytochemicals

Chapter 3 Results and Discussion
90
3.4.2 GCMS analysis of n-hexane fraction
The proximate fatty acid composition of n-Hex-Fr was carried out by GC/MS
analysis. Twelve compounds were identified by comparison of GC/MS spectra with
the mass library (NIST based AMDIS), as shown in Table 3.3. Unsaturated fatty
acids (70%) were more abundant than saturated fatty acids (30%). Among the
unsaturated fatty acids, high levels of 9,12-octadecadienoic acid methyl ester
(C19H34O2), pentanoic acid-5-hydroxy-2,4-di-t-butylphenyl ester (C19H30O3), 9-
hexadecenoic acid methyl ester (C17H32O2) and cis-13-eicosenoic acid (C20H38O2)
were detected, whereas 2-methyl hexadecanoic acid methyl ester (C18H36O2) and ethyl
13-methyl tetradecanoate (C17H34O2) represented the saturated fatty acids present at
higher concentrations.
GC/MS analysis of n-Hex-fr showed the presence of saturated and unsaturated fatty
acids, and thus n-Hex-fr represents the biologically active compounds with relevant
antibacterial, antifungal and anticancer activities124,125. Therefore the presence of
these fatty acids in T. govanianum rhizomes supports its potential uses as an
antimicrobial and anticancer agent.

Chapter 3 Results and Discussion
91
Table 3.3: Chemical composition of n-Hex-fr of T. govanianum rhizomes
*In bold, saturated fatty acids
No Chemical Name Formula Molecular
Weight
Retention time
(min)
Abundance
(%)
1 2,4-Decadienal C10H16O 152 18.11 2.07 2 Pentanoic acid-5-hydroxy-2,4-di-t-butylphenyl ester C19H30O3 306 23.2 7.83 3 Ethyl 13-methyl-tetradecanoate C17H34O2 270 33.59 6.53 4 Hexadecanoic acid methyl ester C17H34O2 270 34.35 7.19 5 9-Hexadecenoic acid methyl ester C17H32O2 268 35.15 9.65 6 2-Methyl hexadecanoic acid methyl ester C18H36O2 284 35.58 15.00 7 9,12-Octadecadienoic acid methyl ester C19H34O2 294 36.25 12.50 8 9,12-Octadecadienoic acid ethyl ester C20H36O2 308 37.58 3.98 9 9,12-Hexadecadienoic acid methyl ester C17H30O2 266 38.03 13.86 10 9-Octadecanoic acid methyl ester C19H36O2 296 36.22 2.50 11 cis-13-Eicosenoic acid C20H38O2 310 39.42 7.27 12 9,12-Octadecadienoic acid-2-hydroxy-1-(hydroxy methyl) ethyl ester C21H38O4 354 43.25 4.53

Chapter 3 Results and Discussion
92
3.4.3 Isolation of compounds
3.4.3.1 Structure-elucidation of compound 1
Compound 1 was isolated as white amorphous powder from the sub fraction, CFB(b) of
chloroform soluble fraction. The molecular ion peak at m/z 256 in EI-MS spectrum
was used to calculate its molecular formula as C16H32O2, supported by its HREI-MS
(C16H32O2, 256.2404). The other major characteristic peaks were observed at m/z 85,
71 and 57. The successive methylenic losses observed for compound 1, was as a
characteristic pattern for straight chain fatty acids. The IR spectrum indicated the
presence of acid functionality by the strong absorption at 3420 cm-1 along with
carbonyl absorption at 1680 cm-1.
The 1H-NMR (CDCl3, 600 MHz) spectrum helped in the assigning of chemical shifts
values to almost all the protons. The terminal methyl proton resonated at δ 0.87 as
triplet (J = 8.1 Hz) while the C-2 methylene protons also appeared as triplet-at δ 2.26
(J = 7.1 Hz). The other methylenic. protons appeared as large multiplet between δ
1.31-1.50. The 13C-NMR (CDCl3, 150 MHz) exhibited signals for almost all the
carbon atoms, including one methyl, one quaternary and fourteen methylene (Table
3.4). The acidic carbon atom resonated at δ 178.8 (C-1) while the terminal methyl
carbon resonated at δ 14.3 (C-16). The physical and spectral data of compound 1 was
in close resemblance to that of a known compound, hexadecanoic acid previously
reported126. Thus the compound 1 was characterized as hexadecanoic acid.

Chapter 3 Results and Discussion
93
Table 3.4: 1H-NMR and 13C-NMR (CDCl3, 600 and 150 MHz) chemical shift
assignments in compound 1
C No. δ C δ H (J, Hz)
1 2 3-15 16
178.8 34.4 24.5 – 31.9 14.3
- 2.26, t (7.1) 1.31-1.50 br, m 0.87, t (8.1)
Figure 3.5: Chemical structure of compound 1.

Chapter 3 Results and Discussion
94
3.4.3.2 Structure-elucidation of compound 2
Compound- 2 was isolated and purified as colorless amorphous powder from the
chloroform. soluble sub fraction, CFB(b). Its EI-MS spectrum exhibited molecular ion
peak at m/z 414, corresponded to the molecular- formula, C29H50O (calcd; 414.3892) in
HREI-MS. The other major fragments peaks observed at m/z 399, 396, 380, and 303
representing a β-sitosterol nucleus. The. IR[ spectrum revealed strong absorption at
3450 and 1625 cm-1 for hydroxy and olefinic functionalities. The 1H-NMR spectrum
(600 MHz, CDCl3) revealed characteristic peaks for steroidal nucleus. The two
tertiary methyl group protons (CH3 -18 and CH3-19) resonated as singlets at δ 0.61
and 0.91, respectively. The olefinic proton (H-6) was observed as multiplet at δ 5.30
while the chemical shift of sole H-3α proton was observed at δ 3.34 (J = 4.0 and 9
Hz) confirming the presence of a 3β-hydroxyl functionality at position 3 in ring A.
The 13C-NMR (150 MHz, CDCl3) spectrum revealed the presence of all the twenty
nine carbon atom signals as three quaternary, nine methine, six methyl and eleven
methylene carbons (Table 3.5). Signals for the methyl carbons were appeared at δ
13.4 (C-18), 19.7 (C-19.), 19.1 (C-21.), 19.3 (C-26[), 19.3 (C-27.) and.11.9 (C-29) while
chemical shift values for olefinic carbons were reported at δ 140.3 (C-5) and 121.1
(C-6), respectively. The physical and spectral data of compound 2 was an agreement
with the reported data for known compound β sitosterol127. Therefore, compound 2
was characterized as β-sitosterol.

Chapter 3 Results and Discussion
95
Table 3.5: 1H-NMR and 13C-NMR (CDCl3, 600 and 150 MHz) chemical shift
assignments in compound 2
C No. δC δ H (J, Hz) C No. δC δ H (J, Hz)
1 2 3 4 5 6 7 8 9 10 11 12 13 14 15
37.4 31.8 71.1 41.3 140.3 121.1 32.0 31.5 50.7 36.9 21.4 40.0 42.5 56.7 25.34
1.34, 1.14 m 1.55, 1.25 m 3.34 m 2.24 dd (7.1, 6.8) - 5.30 d (5.3) 2.04, 1.78 m 1.42 m 1.40 m - 1.46 m 1.5, 1.32 m - 1.40 m 1.63, 1.36 m
16 17 18 19 20 21 22 23 24 25 26 27 28 29
26.5 56.4 13.4 19.7 36.1 19.1 34.0 33.8 45.8 27.2 19.3 19.3 23.1 11.9
1.60, 1.34 m 1.46 m 0.61 s 0.90 s 1.56 m 0.79 d (6.5) 1.32 m 1.36 m 1.52 m 1.81 m 0.82 d (6.5) 0.80 d (6.5) 1.58 m 0.75 t (7.0)
Figure 3.6: Chemical structure of compound 2.

Chapter 3 Results and Discussion
96
3.4.3.3 Structure elucidation of compound 3
Compound 3 was isolated and purified as colorless amorphous powder from the
chloroform soluble sub fraction, CFB(b). The compound was identified and
characterized through modern spectroscopic methods and comparison with available
literature. The EI mass- spectrum displayed molecular ion peak at m/z 412 [M+] which
was in agreement with molecular-formula C29H48O (calcd; 412.3689). The mass
fragmentation represents characteristics peaks of steroidal nucleus at m/z 55.0, 314,
351, 300, 229, 271 and 213. The IR spectrum showed the strong absorptions at 3329
(hydroxyl group) and 1630 cm-1 (cyclo-alkene).
The 1H-NMR, (CDCl3, 600 MHz) spectrum showed a strong multiplet at δ 3.39
assigned to H-3 proton. The H-22 and 23 protons showed chemical shift values at δ
5.23 (m) and 5.26 (m), respectively. The H-6 protons appeared doublet at δ 121.7
suggesting double bonds in the molecule. The methyl groups protons of H-18, 19, 21,
26, 27 and 29 resonated at δ 1.06, 1.29, 1.12, 0.92, 0.92 and 0.9, respectively (Table
3.6).
The 13C-NMR (CDCl3, 150 MHz) spectrum exhibited signals for all the twenty nine
carbon atoms (Table 3.6). The hydroxy carbon (C-3) resonated δ 71.7 while the
olefinic carbons at C-5, 6 , 22 and 23 appeared at δ 141.5 and 121.7, 138.2 and 129.2,
respectively. All the physical and spectral data showed close resemblance with that
for a known compound, stigmasterol128.

Chapter 3 Results and Discussion
97
Table 3.6: 1H-NMR and 13C-NMR (CDCl3, 600 and 150 MHz) chemical shift
assignments in compound 3
C No. δC δ H (J, Hz) C No. δC δ H (J, Hz)
1 2 3 4 5 6 7 8 9 10 11 12 13 14 15
36.9 31.3 71.7 42.2 141.5 121.7 32.0 36.0 50.7 37.49 21.6 38.4 42.1 57.3 24.5
1.33, 1.16 m 1.57,1.24 m 3.39 m 2.24 dd (7.1, 6.8) - 5.30 d (5.2) 2.04, 1.72 m 1.45 m 1.40 m - 1.45 m 1.60, 1.35 m - 1.45 m 1.61, 1.35 m
16 17 18 19 20 21 22 23 24 25 26 27 28 29
30.0 54.5 12.0 20.3 33.8 22.1 138.2 129.2 47.6 32.1 22.4 20.1 25.3 12.0
1.56, 1.38, m 1.51 m 1.06 s 1.29 s 1.54 m 1.12 d (6.5) 5.23 m 5.26 m 1.50 mm 1.79 m 0.92 d (6.5) 0.92 d (6.4) 1.60 m 0.93 t (7.0)
Figure 3.7: Chemical structure of compound 3.

Chapter 3 Results and Discussion
98
3.4.3.4 Structure elucidation of compound 4
Compound 4 was isolated and purified as whit to off white needles/powder from the
chloroform soluble sub fraction, CFE. The molecular ion peak was observed at m/z
414.3012, corresponding to the molecular formula of C27H42O3 (calcd; 414.3134) in
HR-EIMS. The molecular ion peak was also supported by positive FAB-MS
spectrum, showed [M+H]+ at m/z 415. The IR spectrum afforded strong absorption at
3450 cm–1 for a hydroxyl group, at 2970 cm–1 for CH3 stretching, at 1600 cm–1 for a
vinylic group and at 1050 cm–1 for a carboxyl group.
The 1H-NMR (CDCl3, 600 MHz) spectrum revealed signals for almost all the protons,
a multiplet was observed at δ 3.57 for the methine proton (H-3) followed by the
double doublet at δ 2.26 (2H, H-4, J = 7.2 and 6.4 Hz) (Table 3.7). A strong doublet
at δ 5.33 was assigned to the olefinic proton (H-6, J = 5.2 Hz), indicative of the sole
double bond in the steroidal skeleton. Furthermore, the methine protons H-16 and H-
17 resonated- at δ 4.38 (1H, q, J. = 15.60Hz) and 1.80 (1H, dd, J = 8.8, 6.00Hz). The
two tertiary methyl group protons appeared as singlets at δ 0.80 (3H, H-18) and 1.04
(3H, H-19) while the two secondary methyl group protons appeared as δ 0.79 (3H, d,
J = 4.2 Hz, H-21) and 0.78 (0.78, d, J = 6.1 Hz, H-27), respectively.
The 13C-NMR and DEPT spectra (CDCl3, 150 MHz) afforded twenty seven peaks for
all carbon atoms i.e, four [methyl, ten methylene, nine methine and four quaternary
(Table 3.7). The methyl-carbons resonated at δ 16.3 (C-18), 19.4 (C-19), 14.5 (C-21)
and 17.1 (C-27) respectively. The spectrum also exhibited characteristic signals for
three carbons at δ 140.8 (C-5), 121.4 (C-6) and 109.3 (C-22), diagnostic for 5-
spirostane type sapogenin129.

Chapter 3 Results and Discussion
99
Chemical shift for β-hydroxyl group carbon atom was observed at δ 71.7 (C-3). All
the other carbon atoms chemical shift values as well as 2D-NMR correlations showed
resemblance with the reported values for a known compound, diosgenin130,131, thus
compound 4 was identified as diosgenin.
Table 3.7: 1H-NMR and 13C-NMR (CDCl3, 600 and 150 MHz) chemical shift
assignments in compound 4
C No. δC δ H (J, Hz) C No. δC δ H (J, Hz)
1 2 3 4 5 6 7 8 9 10 11 12 13 14
37.2 31.4 71.7 41.6 140.8 121.4 31.6 31.8 50.1 36.6 20.9 39.8 40.2 56.5
1.30, 1.17 m 1.52, 1.35 m 3.57 m 2.26 dd (7.2, 6.4) 1.78 m - 5.33 d (5.2) 2.07, 1.90 m 1.42 m 1.30 m - 1.44 m 1.45, 1.37 m - 1.40 m
15 16 17 18 19 20 21 22 23 24 25 26 27
32.0 80.8 62.1 16.3 19.4 42.3 14.5 109.3 31.4 28.8 30.3 66.8 17.1
1.73, 1.56 m 4.38 q (15.6) 1.80 dd (6.0, 8.8) 0.80 s 1.04 s 2.42 m 0.79 d (7.2) - 1.60, 3.56 m 1.56 m 1.76 m 3.40 t (10.3) 3.45 dd (10.3, 4.2) 0.78 d (6.1)
Figure 3.8: Chemical structure of compound 4.

Chapter 3 Results and Discussion
100
3.4.3.5 Structure elucidation of compound 5
Compound 5 was isolated and purified as white to off white powder from the
chloroform soluble sub fraction, CFE through column chromatography. The
compound was identified and characterized through modern spectroscopic data
analysis. The molecular formula C27H42O4 for compound 5 was established form its
molecular ion peaks at m/z 430 in EI-MS and at m/z 431 [M+H]+ in FAB positive,
which was further confirmed from its HR-EIMS (calcd; 430.3083). The IR spectrum
exhibited absorption bends for hydroxyl functionality at 3571 cm–1, stretching methyl
group at 2871, ring olefinic group at 1620 cm–1 and for C-O functional group at 1057
cm–1.
The 1H-NMR (CDCl3, 600 MHz) spectrum showed similar pattern of chemical shift
values for all the protons to that of diosgenin except the signal at C-17 (Table 3.8). A
methine proton appeared as multiplet at δ 3.27 (H-3), vinylic proton as doublet at δ
5.32 (H-6, J = 5.2 Hz), methine proton H-16 as triplet at δ 3. 80 (1H, t, J= 15.0 Hz)
and methine proton H-20 as double doublet at δ 1.80 (1H, dd, J = 8.8, 6.0 Hz)
respectively. The two tertiary methyl group protons appeared as singlets at δ 0.83
(3H, H-18) and 1.04 (3H, H-19) while the two secondary methyl group protons
appeared as δ 0.89 (3H, d, J = 4.2 Hz, H-21) and 0.87 (0.78, d, J = 6.1 Hz, H-27)
respectively.
The 13C-NMR and DEPT spectra (CDCl3, 150 MHz) exhibited twenty seven peaks for
all the-carbon atoms comprising four methyls, ten methylene, eight methine and five
quaternary (Table 3.8). The spectrum exhibited characteristic signals for all the
carbon atoms, closely resemble to the diosgenin, except with the appearance of a

Chapter 3 Results and Discussion
101
quaternary carbon signal at δ 90.1 (C-17) for hydroxyl group. The methyl carbons
resonated at δ 17.1 (C-18), 19.4 (C-19), 13.6 (C-21) and 17.1 (C-27) respectively. The
other entire carbon atoms chemical shift values as well as 2D-NMR correlations
showed resemblance with the reported values in literature for a known compound
pennogenin132.

Chapter 3 Results and Discussion
102
Table 3.8: 1H-NMR and 13C-NMR (CDCl3, 600 and 150 MHz) chemical shift
assignments in compound 5
C No. δC δ H (J, Hz) C No. δC δ H (J, Hz)
1 2 3 4 5 6 7 8 9 10 11 12 13 14 15
37.1 31.6 71.7 42.2 140.8 121.3 31.6 31.6 49.6 36.6 20.7 31.9 44.6 52.9 31.2
1.34, 1.17 m 1.55,1.32 m 3.27 m 2.24 dd (7.2, 6.9) 1.98 m - 5.32 d (5.2) 2.05, 1.80 m 1.43 m 1.34 m - 1.44 m 1.50, 1.33 m - 1.40 m 1.72, 1.49 m
16 17 18 19 20 21 22 23 24 25 26 27
90.9 90.1 17.1 19.4 43.7 13.6 110.1 30.7 28.1 30.1 66.8 17.1
3.80, t (15.0) - 0.83 s 1.04 s 2.42 m 0.89 d (7.2) - 1.60, 3.56 m 1.56 m 1.76 m 3.35 t (10.8) 3.45 dd (m) 0.87 d (12.0)
Figure 3.9: Chemical structure of compound 5.

Chapter 3 Results and Discussion
103
3.4.3.6 Structure elucidation of compound 6
Compound 6 was isolated and purified as white powder from the chloroform soluble
sub fraction, CFE. The compound was identified and characterized through modern
spectroscopic data analysis and was confirmed as a trihydroxy fatty acid. In EI-MS
spectrum the molecular ion peak was displayed at m/z 330, while FAB-MS showed
ion peak at m/z 331 [M+H]+. Its molecular formula of C18H34O5 was obtained from
HREI-MS at m/z 330.4566 (calcd; 330.2402). The molecular formula showed two
degrees of unsaturation due to the presence of an olefinic and a carbonyl group in the
molecule.
The IR spectrum also revealed strong absorptions for acid carbonyl (C=O) and
olefinic (C=C) functionalities at 1690 and 1470 cm-1, respectively. The absorption at
3404 cm-1 showed the existence of acid hydroxyl group. The three extra oxygen atoms
in molecule were placed as hydroxyl groups on the basis of 1H-NMR and connectivity
data.
The linked scan measurements of major peaks in mass spectrum also helped in
establishing the chemical structure as a trihydroxy fatty acid. Accordingly, the linked
scanned measurements were supportive in this regards which have been depicted in
Fig. 3.11. M+ at m/z 330 [M]+, 273 (M+ - 57), 245 (M+ -57-28), 223 (M+ -57-28-
24+2H), 205 (M+ -57-28-20-2H-18), 187 (M+ -57-28-20-2H-18-18), 167 (M+ -57-28-
20-2H-18-18-18-2H) and 123 (M+ -57-28-20-2H-18-18-18+2H-44) in EI-MS. The
consecutive loss of three 18 fragments was evident of three OH groups in the
molecule.

Chapter 3 Results and Discussion
104
The 1H-NMR (MeOD, 600 MHz) spectrum revealed signals for all the protons at
various chemical shift values as observed for a known compound, trihydroxy mono
unsaturated fatty acid133, expect the position of double bond in chain at position 10-
11. The two olefinic methine protons -resonated at. δ 5.46 (1H, dd, J- = 11.1, 6.4 Hz, H-
10) and 5.56 (1H, dd, J[ = 11.1, 6.1 Hz, H-11), respectively.
The location of double bond was confirmed from the daughter ion peaks for these left
side chain losses as given. The fragment ion at m/z 57, 169 (cleavage at C-8, 9), 152
(OH loss) due to [C4H9]+, [CH3(CH2)7CH=CH-CHOH]+
, [CH3(CH2)7CH=CH-CH]+
fragment losses as well as at 171 (right side chain, [OH-CH-OH-CH(CH2)4COOH]+),
155 (O loss) and 137 (H2O loss) which were reported due to the possible breakage of
C-7, 8 points in the chain as depicted in Fig. 3.12.
The terminal methyl protons (H-18) resonated at δ 0.90 (t, J = 8 Hz), while the
methylenic protons (H-3, 4, 5, 14, 15, 16 and 17) resonated in range of δ 1.34 to 2.26
respectively. A triplet was assigned to the methylenic protons of H-2 at δ 2.26 (7.1
Hz) as well as for H-12 protons at δ 2.15 (7.1 Hz) while a multiplet was observed for
H-13 at δ 2.10.
The 13C-NMR (MeOD, 150 MHz) spectrum revealed signals for almost all the carbon
atoms including carbonyl quaternary carbon at δ 177.7 (C-1), olefinic carbons at δ
130 and 134.6 (C-10 and 11) along with the hydroxyl bearing carbons at δ 71.7 (C-7),
76.9 (C-8) and 69 (C-9) (Table 3.9). 1H-1H COSY was helpful in assigning the
correlations among the chain protons (Fig. 3.12) while the cis confirmation was
supporting by the coupling constants (11.1 Hz) between H-10 and H-11.
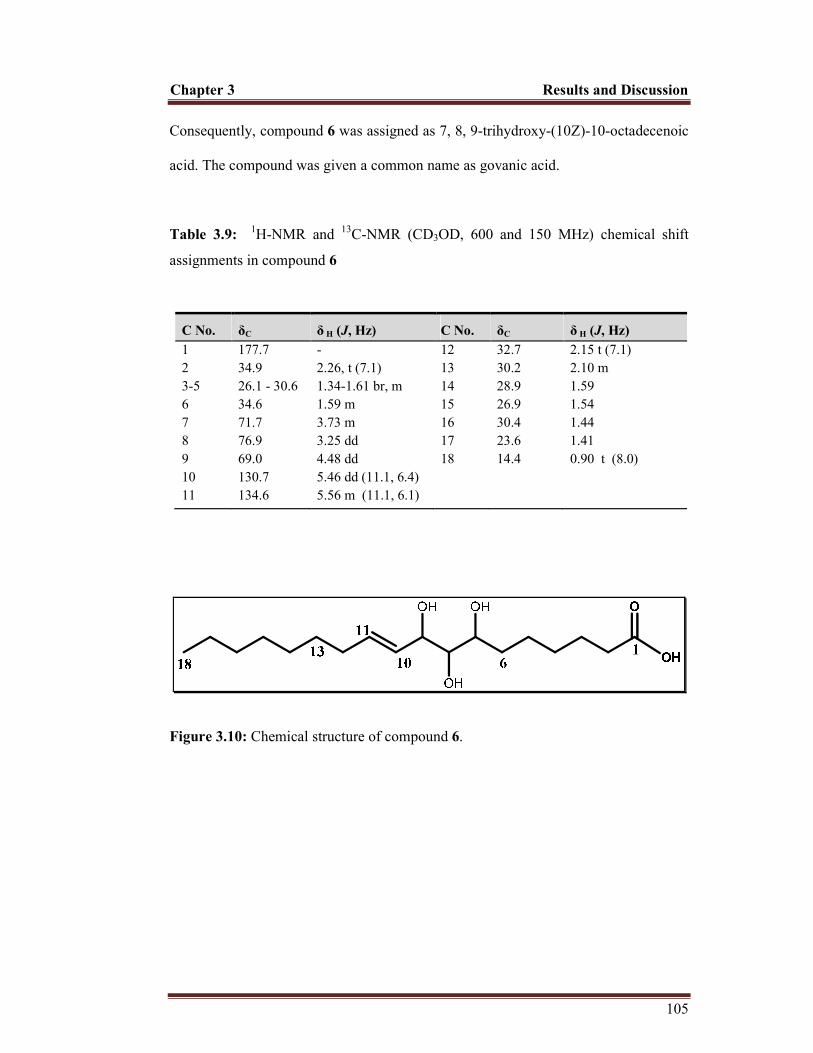
Chapter 3 Results and Discussion
105
Consequently, compound 6 was assigned as 7, 8, 9-trihydroxy-(10Z)-10-octadecenoic
acid. The compound was given a common name as govanic acid.
Table 3.9: 1H-NMR and 13C-NMR (CD3OD, 600 and 150 MHz) chemical shift
assignments in compound 6
C No. δC δ H (J, Hz) C No. δC δ H (J, Hz)
1 2 3-5 6 7 8 9 10 11
177.7 34.9 26.1 - 30.6 34.6 71.7 76.9 69.0 130.7 134.6
- 2.26, t (7.1) 1.34-1.61 br, m 1.59 m 3.73 m 3.25 dd 4.48 dd 5.46 dd (11.1, 6.4) 5.56 m (11.1, 6.1)
12 13 14 15 16 17 18
32.7 30.2 28.9 26.9 30.4 23.6 14.4
2.15 t (7.1) 2.10 m 1.59 1.54 1.44 1.41 0.90 t (8.0)
Figure 3.10: Chemical structure of compound 6.

Chapter 3 Results and Discussion
106
Figure 3.11: Linked scan measurements in compound 6 (EIMS spectrum).
Figure 3.12: Major fragmentation in compound 6 with correlations
in 1H-1H-COSY( ).

Chapter 3 Results and Discussion
107
3.4.3.7 Structure-elucidation of compound 7
Compound- 7 was obtained as amorphous white powder from the sub fraction, CFHh
eluted with EtOAc in MeOH (9.5 : 0.5) solvent system by preparative thin layer
chromatography. The mass spectrum in HR-EIMS afforded the molecular ion peak at
m/z 480.5521 [M]+ consistent with the molecular formula of C27H44O7 (calcd;
480.3121). The formula mass was also confirmed by FAB-MS (negative) in glycerol
at m/z 479 [M-H+]. The six degrees of unsaturation was determined as four accounted
for the tetracyclic skeleton while one each for carbonyl (C=O) and a vinylic C=C
group. The overall fragmentation pattern was consistent with that observed for
ecdysteroids skeleton reported for many ecdysteroids134.
The IR spectrum showed similar pattern of peaks, common for ecdysteroids. An
intense absorption at 3378 and 2871 cm-1 indicated hydroxyl group and aliphatic C-H
stretch, respectively. The absorption at 3068, 1472, 1055 and 879 cm-1 indicated and
confirmed a vinyl group, while a strong absorbance at 1646 cm-1 indicated the
existence of cyclo hexenone in the molecule. Similarly, absorption at 1380 cm-1
showed the presence of C-O functionality. The UV spectrum showed absorption at
240 nm indicating an α and β unsaturated carbonyl moieties in the molecule.
The 1H-NMR spectrum, showed two secondary methine protons, C-2 and C-3
resonated downfield at � 3.84 and 3.94 suggesting to be spin coupled (J = 3.2 Hz, 1H-
1H- COSY) with each other and further coupled to adjacent methylenic protons of C-1
and C-4 which in turn resonated at � 1.75 and 1.76, respectively, indicating the
presence of –CH2-CH(OH)-CH(OH)-CH2- system that is placed at C-1-C-4 in the

Chapter 3 Results and Discussion
108
molecule (Table 3.10). The signal pattern for all protons was mostly similar to 20-
hydroxyecdysone previously reported in literature135.
The 13C-NMR spectrum (Table 3.10) showed signals for all 27 carbons comprising
five methyl, six methylenic, nine methine and seven quaternary carbons. The side
chain methylene carbon (C-22) resonated on δ 77.9, while signals for the methylenic
carbons C-23 and C-24 were observed at δ 27.3 and 43.8, respectively. The three
methyl carbon signals were observed at δ 21.5 (C-21), 28.9 (C-26) and 29.7 (C-27)
while the quaternary carbon (C-25) of the side chain resonated at δ 71.3 which was
analogue to that of the 20-hydroxy ecdysone for the sixth hydroxyl carbon in the
molecule. The methyl carbons of C-18 and C-19 resonated at � 18.1 and 24.4,
respectively. Signals for the two hydroxyl methine carbons of ring A were observed at
� 68.7 (C-2) and 68.5 (C-3) while C-5 methine carbon resonated at � 50.5. The
carbonyl carbon appeared on � 206.4 (C-6) along with the two vinyllic carbons
showing chemical shift values � 122.1 (C-7) and 168.0 (C-8) in ring B. These data
suggested α,β unsaturated ketone moiety ascribable to 7 en-6-one system in the
steroid nucleus, also supported by HMBC correlations. The signal pattern was mostly
similar to 20-hydroxyecdysone previously reported in literature136. Thus, on the basis
physical and spectral similarities with the reported 20-hydroxyecdysone, compound 7
was identified as 20-hydroxyecdysone.

Chapter 3 Results and Discussion
109
Table 3.10: 1H-NMR and 13C-NMR (CD3OD, 600 and 150 MHz) chemical shift
assignments in compound 7
C No. δC δ H (J, Hz) C No. δC δ H (J, Hz)
1 2 3 4 5 6 7 8 9 10 11 12 13 14
37.4 68.7 68.5 32.2 50.5 206.4 122.1 168.0 35.1 39.1 21.5 32.5 57.3 85.2
1.75 3.84 m 3.94 dt (11.7, 3.2) 1.76, 2.13 2.40 - 5.80 d (2.6) - 3.14 - 1.42, 1.46 2.13, 1.33 - -
15 16 17 18 19 20 21 22 23 24 25 26 27
31.7 24.4 37.4 18.1 24.4 78.4 21.5 77.9 27.3 43.8 71.3 28.9 29.7
1.61 1.58, 1.55 2.00 0.88 0.99 - 1.13 3.14 1.42 1.37 - 1.19 1.18
Figure 3.13: Chemical structure of compound 7.

Chapter 3 Results and Discussion
110
3.4.3.8 Structure elucidation of compound 8
Compound 8 was obtained as white amorphous powder from the sub fraction, CFHh
by preparative thin layer chromatography (TLC). The mass spectrum in HR-EIMS
afforded the molecular ion peak at m/z 496.5510 [M] + which was in agreement with
the molecular formula of C27H44O8 (calcd; 496.3021). The formula mass was also
confirmed by FAB-MS (positive) in glycerol at m/z 497 [M+H]+. The six degrees of
unsaturation was determined as four accounted for the tetracyclic skeleton while one
each for carbonyl (C=O) and vinylic C=C functional group. The overall fragmentation
pattern was in consistent with that observed for 20-hydroxy ecdysone skeleton
reported for many ecdysteroids134.
The IR spectrum showed similar pattern of peak, observed in the reported 20-hydroxy
ecdysone skeleton135. The UV spectrum showed absorption at 240 nm confirming the
existence of an α and β unsaturated carbonyl moiety in the compound.
The 1H-NMR signal pattern was mostly similar to 5,20-dihydroxy ecdysone
previously reported135,137. The 13C-NMR spectrum in MeOD (BB and DEPT) showed
signals for all 27 carbons comprising five methyl, six methylenic, nine methine and
seven quaternary carbon atoms (Table 3.11). The side chain methylenic carbon (C-
22) resonated on δ 77.8 while signals for the methylenic carbons, C-23 and C-24 were
observed at δ 27.0 and 43.8 respectively. The quaternary carbon (C-25) of the side
chain resonated at δ 71.3 which was analogues to that of the 20-hydroxy ecdysone.
However compound 8 showed a distinct signal for C-5 at 80.3 as compared to C-5 of
20-hydroxy ecdysone (δ 71.3). The same chemical shift value for C-5 has been
reported for 5,20 dihydroxyecdysone135,137. Thus, on the basis physical and spectral

Chapter 3 Results and Discussion
111
similarities with the reported data, compound 8 was identified as
5,20 dihydroxyecdysone.
Table 3.11: 1H-NMR and 13C-NMR (CD3OD, 600 and 150 MHz) chemical shift
assignments in compound 8
C No. δC δ H (J, Hz) C No. δC δ H (J, Hz)
1 2 3 4 5 6 7 8 9 10 11 12 13 14
36.1 70.2 68.4 32.2 80.3 202.4 120.6 167.5 35.1 39.1 30.2 71.3 57.4 85.3
1.75 3.64 d (3.5) 3.98 1.97, 1.94 - - 5.84 d (2.7) - 3.18 br m - 1.74, 1.72 2.00, 1.78 - -
15 16 17 18 19 20 21 22 23 24 25 26 27
31.5 23.3 43.6 14.8 24.2 78.4 26.1 77.8 27.0 43.8 71.3 28.9 29.6
1.84, 1.60 1.97, 1.54 2.38 0.89 0.99 - 1.24 3.31 1.42 1.38 - 1.19 1.18
Figure 3.14: Chemical structure of compound 8.

Chapter 3 Results and Discussion
112
3.4.3.9 Structure elucidation of compound 9
Compound 9 was isolated and purified as white to off white amorphous powder from
a butanol soluble sub fraction, BFA. The HRFAB-MS-showed-pseudo molecular ion
[M+H]+ at m/z 869.4790 (calcd; 868.4832), which was consistent with the molecular
composition of C45H72O16.
The IR spectrum (KBr) exhibited prominent absorption for hydroxyl functionality at
3410 cm-1, olefinic (endocyclic) absorption at 1420 cm-1 and C-O linkage at 1305 cm-
1 in the skeleton. The 13C-NMR signals at δ 141.8 (C-5), 122.6 (C-6) and 110.6 (C-
22), showed the same basic skeleton of 5-spirostane type sapogenin129.
As 1H and 13C-NMR data (Table 3.12) of compound 9 were mostly similar to
diosgenin, except the difference in the mass and the presence of sugar moieties which
yielded several signals in the region between δC 70-105. The 1H-NMR (600 MHz,
MeOD) spectrum showed the presence of one olefinic proton signal at δ 5.63 as broad
doublet (J = 5.4 Hz), due to the presence of one double bond in compound. The 1H-
NMR also showed the signals for three anomeric protons at δ 4.87 (1H, d, J = 6.9 Hz,
H-1’), 6.27 (1H, s, H-1’’) and 5.60 (1-H, s, H-1’’’, which suggested the presence of
three monosaccharide moieties. Moreover, the 1H-NMR spectrum showed signals for
two tertiary methyl group protons at δ 1.02 (3H, H-18) and 1.08 (3H, H-19) and two
secondary methyl doublets separately at δ 1.08 (3H, J = 7.6 Hz, H-21), and 1.01 (3H,
J = 6.6 Hz, H-27) respectively.
The 13C-NMR and DEPT (150 MHz, CD3OD) spectra showed signals for all the
carbons including sugar moieties and olefinic functionalities. Furthermore, the 1H and
13C connectivities in steroidal skeleton of aglycone and sugar moieties were made
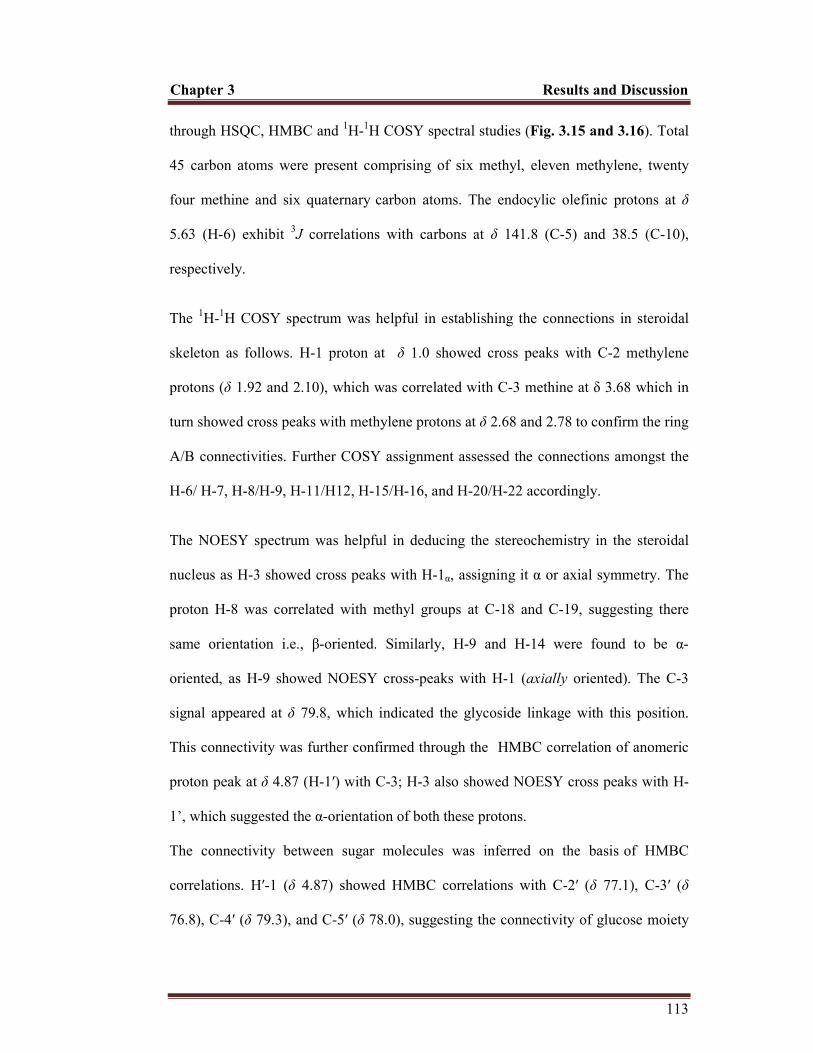
Chapter 3 Results and Discussion
113
through HSQC, HMBC and 1H-1H COSY spectral studies (Fig. 3.15 and 3.16). Total
45 carbon atoms were present comprising of six methyl, eleven methylene, twenty
four methine and six quaternary-carbon atoms. The endocylic olefinic protons at δ
5.63 (H-6) exhibit 3J correlations with carbons at δ 141.8 (C-5) and 38.5 (C-10),
respectively.
The 1H-1H COSY spectrum was helpful in establishing the connections in steroidal
skeleton as follows. H-1 proton at δ 1.0 showed cross peaks with C-2 methylene
protons (δ 1.92 and 2.10), which was correlated with C-3 methine at δ 3.68 which in
turn showed cross peaks with methylene protons at δ 2.68 and 2.78 to confirm the ring
A/B connectivities. Further COSY assignment assessed the connections amongst the
H-6/ H-7, H-8/H-9, H-11/H12, H-15/H-16, and H-20/H-22 accordingly.
The NOESY spectrum was helpful in deducing the stereochemistry in the steroidal
nucleus as H-3 showed cross peaks with H-1α, assigning it α or axial symmetry. The
proton H-8 was correlated with methyl groups at C-18 and C-19, suggesting there
same orientation i.e., β-oriented. Similarly, H-9 and H-14 were found to be α-
oriented, as H-9 showed NOESY cross-peaks with H-1 (axially oriented). The C-3
signal appeared at δ 79.8, which indicated the glycoside linkage with this position.
This connectivity was further confirmed through the- HMBC correlation of anomeric
proton peak at δ 4.87 (H-1′) with C-3; H-3 also showed NOESY cross peaks with H-
1’, which suggested the α-orientation of both these protons.
The connectivity between sugar molecules was inferred on the basis-of HMBC
correlations. H′-1 (δ 4.87) showed HMBC correlations with C-2′ (δ 77.1), C-3′ (δ
76.8), C-4′ (δ 79.3), and C-5′ (δ 78.0), suggesting the connectivity-of glucose moiety

Chapter 3 Results and Discussion
114
with C-3. Furthermore, the HMBC-correlations of H-1′′ (δ 6.27), with C-5′ (δ 78.0)
indicated the C-1′-O-C-1′′ connectivity, i.e. the α-L-rhamnose molecule attached with
C′-4. The nature and connectivity of this rhamnose molecule was inferred through 1H
and 13C-NMR while the HMBC correlations of H-2′ (δ 4.21) with C-1′′′ (δ 102.6),
revealed the connectivity between the glucose and another α-L-rhamnose molecule.
The presence of another α-L-rhamnose was deduced through the HMBC correlations.
The physical and spectral data coincided with the reported data of borassoside E138,
hence the compound was characterized as a known compound, borassoside E.

Chapter 3 Results and Discussion
115
Table 3.12: 1H-NMR and 13C-NMR (CD3OD, 600 and 150 MHz) chemical shift
assignments in compound 9
C No. δC δ H (J, Hz) C No. δC δ H (J, Hz)
1 2 3 4 5 6 7 8 9 10 11 12 13 14 15 16 17 18 19 20 21 22 23 24 25 26 27
38.0 30.7 79.8 39.5 141.8 122.6 32.4 31.4 51.7 38.5 21.9 41.4 40.9 57.8 33.2 80.0 61.9 16.7 19.8 42.9 17.4 110.6 29.8 28.2 32.8 69.7 17.8
1.10, 1.68 m 1.92, 2.10 m 3.68 m 2.68 dd (11.2, 12.9) 2.78 dd (2.2, 13.6) - 5.63 br 1.52, 1.90 m 1.42 m 1.10 m - 1.44 m 1.10, 1.88 m - 1.12 m 1.56, 1.90 m 4.02 m 1.80 dd (6.0, 8.8) 1.02 s 1.08 s 2.52 m 1.08 d (7.6) - 1.60 m 1.24 m 1.44 m 3.80 br 1.01 d (6.2)
3-O-D-Glc 1’ 2’ 3’ 4’ 5’ 6’ 2’-O-Rha 1’’ 2’’ 3’’ 4’’ 5’’ 6’’ 4’-O-Rha 1’’’ 2’’’ 3’’’ 4’’’ 5’’’ 6’’’
100.4 77.7 76.8 79.3 78.0 62.10 102.2 72.5 73.0 74.2 70.4 19.2 102.6 73.0 72.8 74.6 70.2 18.8
4.87 d (6.9) 4.21 m 3.58 m 3.92 m 4.10 m 3.90, 4.10 6.27 br s 4.66 m 4.35 dd (1.9, 9.4) 4.72 m 4.70 m 1.52 d (6.4) 5.60 br s 3.98 m 4.26 dd (2.2, 9.0) 4.10 m 4.62 m 1.82 d (6.3)
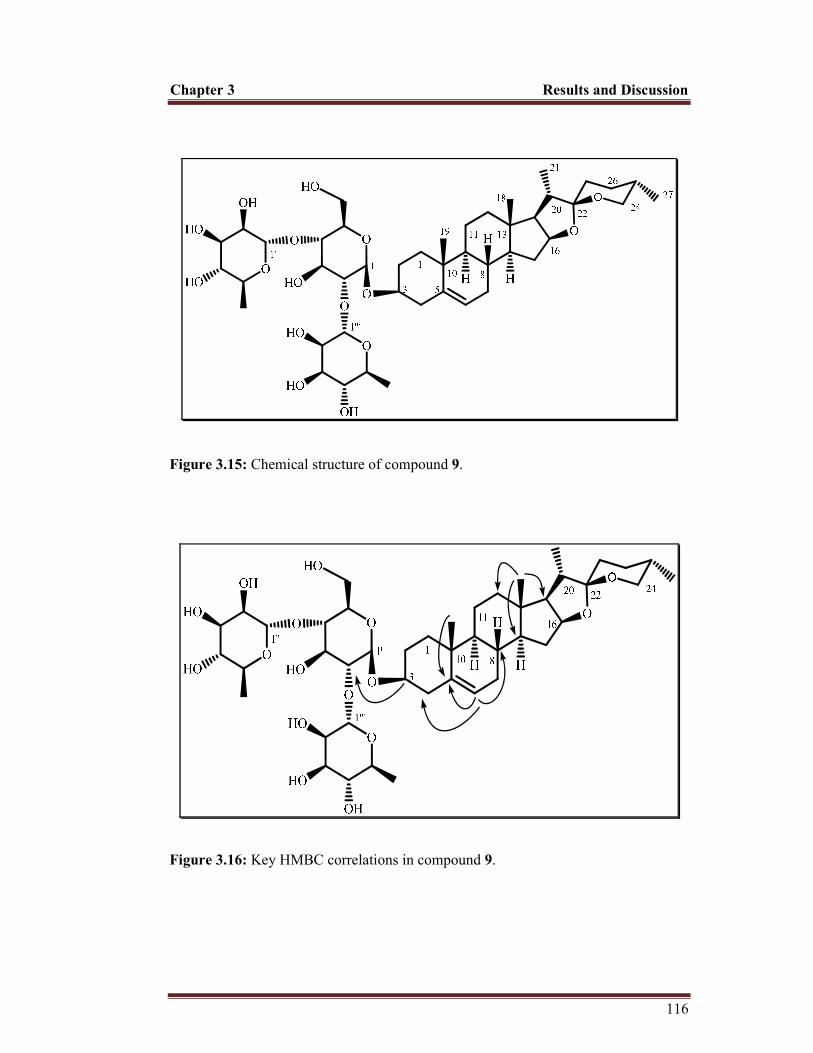
Chapter 3 Results and Discussion
116
Figure 3.15: Chemical structure of compound 9.
Figure 3.16: Key HMBC correlations in compound 9.

Chapter 3 Results and Discussion
117
3.4.3.10 Structure elucidation of compound 10
Compound 10 was isolated and purified as white amorphous powder from the butanol
soluble sub fraction, BFBC. The compound was identified and characterized through
modern spectroscopic data analysis.
The HRFAB-MS showed pseudo molecular ion [M+H]+ at m/z 1225.5426 (calcd;
1224.5490), which was consistent with the molecular composition of C56H88O29.
The 1H-NMR (CD3OD, 600 MHz) and 13C-NMR (CD3OD, 150 MHz) data (Table
3.13) of compound 10 was largely similar to the basic skeleton of diosgenin, and the
difference in compound 10 was the number of sugar moieties. The 1H-NMR spectrum
showed the presence of three olefinic protons signals at δ 5.55 as broad doublet (J =
5.4 Hz), 5.08 as br (s) and 4.98 br (s), which showed the presence of two C=C in
compound 10. Similarly, 1H-NMR also showed the signals for five anomeric protons
at δ 5.41 br s, 5.18 d (J = 2.4 Hz), 4.72 (dd, J = 8.4 Hz), 4.39 (d, J = 7.2 Hz), 4.38 (d,
J = 7.2 Hz), which suggested the presence of five monosaccharides including one
apiose. In addition to this, the 1H-NMR spectrum showed signals for two methyls at δ
0.91 (s) and 1.08 (s) attached to quaternary carbon, and two methyl signals at δ 1.10
(d, J = 6.6 Hz), and 1.24 (d, J = 6.6 Hz), attached to tertiary carbon. The 13C-NMR
spectrum showed signals for sugar moieties and olefinic functionalities. The
attachment of carbon in steroidal skeleton of saponin and sugar moieties was assigned
on the basis of HSQC, HMBC and COSY correlations (Fig. 3.18 and 3.19). The
olefinic proton at δ 5.55 (H-6) showed HMBC correlations to two quaternary carbons
at δ 139.5 and 43.4 attributed to C-5, and C-10, respectively.

Chapter 3 Results and Discussion
118
The HSQC spectrum showed the correlations of protons at δ 3.51 and 3.39 with
carbon at δ 84.5 and 69.2, suggesting the presence of two OH groups in ring A of
steroidal skeleton. The C-C bond connectivity in ring A and B was inferred through
COSY correlations. H-1 (δ 3.51) indicated COSY cross peaks with C-2 methylene
protons (δ 2.09, 1.71), which further showed cross peaks with H-3 (δ 3.39). Similarly,
H-3 showed COSY cross peaks with methylene protons at δ 2.24 and 2.22. This
suggested the connectivity of C-1 to C-4. H-6 (δ 5.55) showed COSY correlations
with H2-7 (δ 1.96, 1.55), which further showed connectivity with C-8 through COSY
cross peaks with H-8 (δ 1.54).
The COSY correlation of H-20 with H-17 (δ 1.82) and H2-21 (δ 3.63, 3.2), along with
HMBC correlations of H-21 (δ 3.63, 3.63) with C-20 (δ 46.6) and C-22 (δ 112.1)
inferred an OH at C-21. Similarly, the HMBC correlations of H-24 (δ 4.26), H2-26 (δ
4.46, 3.71) with C-22 suggested oxygenated nature of ring-F.
The stereochemistry of steroidal skeleton was deduced on the basis of NOESY
correlations (Fig. 3.19). H-1 showed NOESY cross-peaks with H-3, this could be only
possible if both these protons are axially oriented. Therefore, H-1 and H-3 are α-
oriented. H-8 showed NOESY correlations with H3-18 and H3-19, suggesting there
same orientation i.e., β-oriented. Likewise, H-9 and H-14 were found to be α-oriented,
as H-9 displayed NOESY cross-peaks with H-1 (axially oriented).
The HMBC correlations of H-24 (δ 4.26) with C-23 (δ 72.1), C-25, (δ 144.5), and C-
27 (δ 114.0), along with COSY cross peaks of H-24 with proton at δ 3.74 suggested
the position of OH groups at C-23 and C-24, and an exocyclic C=C bond between C-
25/C-27. The C-24 signal appeared at δ 83.3, which indicated the glycoside linkage

Chapter 3 Results and Discussion
119
with this position. This connectivity was further confirmed through the HMBC
correlation of anomeric proton at δ 4.72 (H-1′′′′) with C-24. H-23 showed NOESY
cross peaks with H-20 and H-24, which suggested the β-orientation of these protons.
The coupling constant value of H-23 and H-24 was consistent with literature reported
value of similar structure i.e. 4.2 Hz, which further confirmed an α-OH at C-23 and C-
24.
The connectivity between sugar molecules was inferred on the basis of HMBC
correlations. H′-1 (δ 4.40) showed HMBC correlations with C-1 (δ 84.5), C-2′ (δ
77.3), C-3′ (δ 88.6), and C-5′ (δ 78.1), suggesting the connectivity of glucose moiety
with C-1. Furthermore, the HMBC correlations of H-1′′ (δ 4.38), with C-3′ (δ 88.6)
indicated the C-3′-O-C-1′′ connectivity, i.e. the second glucose molecule attached
with C′-3. The connectivity of an apiose molecule was inferred through the HMBC
correlations of H-1′′′ (δ 5.18) with C-6′′ (δ 67.1), C-2′′′ (δ 77.5), and C-5′′′ (δ 75.0).
The coupling constant (J = 5.18) and 13C-NMR data were similar to the literature
reported139, which indicated the presence of an apiose unit connected to glucose. The
presence of a deoxy β-D-gulose in connection with C-24 was inferred through HMBC
correlation of H-1′′′′ with C-24. Similarly, the presence of an α-L-rhamnose was
deduced through the HMBC correlations of H-1′′′′′ with C-4′′′′ (δ 80.3) and NMR data
similar to the previously reported data53. Compound 10 was structurally characterized
as (1β,3β,23S,24S)-1-[O-β-D-glucopyranosyl (1→3)-O-β-D-glucopyranosyl (1→6)-
O-β-D-apiofuranosyl]-3,23dihydroxyspirosta-5,25-dienyl-24-[O-α-L rhamnopyranosyl
(1→4)-β-D-6-deoxygulopyranoside] (Fig. 3.17). To the best of our knowledge this
compound is not reported previously and is a new compound. A common name was
proposed for compound 10 as govanoside A.

Chapter 3 Results and Discussion
120
Table 3.13: 1H-NMR and 13C-NMR (CD3OD, 600 and 150 MHz) chemical shift
assignments in compound 10
C No. δC δ H (J, Hz) C No. δC δ H (J, Hz)
1 2 3 4 5 6 7 8 9 10 11 12 13 14 15 16 17 18 19 20 21 22 23 24 25 26 27
84.5 37.5 69.2 43.3 139.5 126.1 32.6 34.2 51.0 43.4 24.8 40.9 41.7 57.9 33.2 84.4 58.8 17.2 15.4 46.6 62.9 112.1 72.1 83.5 144.5 62.1 114.0
3.51 overlap 1.71, 2.09 m 3.39 m 2.22, 2.24 m - 5.55 br d (5.4) 1.55, 1.96 1.54 m 1.38 m - 1.41, 2.46 1.19, 1.69 m - 1.22 m 1.54, 1.98 m 4.56 q (7.2) 1.82 dd (7.8, 6.6) 0.91 s 1.08 s 2.71 dd (7.2, 6.6) 3.52, 3.63 overlap - 3.74 d (4.2) 4.26 d (4.2) - 3.71 d (12.0), 4.46 d (12.0) 4.98 br s 5.08 br s
1-O-β-D-Glc. 1’ 2’ 3’ 4’ 5’ 6’ 3’-O-β-D-Glc. 1’’ 2’’ 3’’ 4’’ 5’’ 6’’ 6’’-O-β-Api. 1’’’ 2’’’ 3’’’ 4’’’ 5’’’ 24-O-6-deoxy-β-D-Gul 1’’’’ 2’’’’ 3’’’’ 4’’’’ 5’’’’ 6’’’’ 4’’’’-O-α-L-Rha 1’’’’’ 2’’’’’ 3’’’’’ 4’’’’’ 5’’’’’ 6’’’’’
100.2 77.3 88.6 69.8 78.1 63.6 105.3 74.8 78.0 71.8 77.5 67.1 112.6 77.5 65.4 80.0 75.0 103.4 70.2 70.9 80.3 70.7 16.1 101.6 72.8 72.1 73.4 69.9 18.7
4.40 d (7.2) 3.50 m 3.66 m 3.37 m 3.25 m 3.60, 3.69 4.38 d (7.2) 3.51 m 3.67 m 3.37 m 3.27 m 3.60, 3.73 5.18 d (2.4) 3.99 d (3.0) 3.35 s - 3.76 s, 3.78 d 4.72 d (8.4) 3.64 m 3.90 m 3.45 m 4.10 m 1.10 d (6.6) 5.37 br s 3.90 m 3.67 m 3.41 m 4.13 (9.6, 6) 1.24 d (6.6)

Chapter 3 Results and Discussion
121
Figure 3.17: Chemical structure of compound 10
Figure 3.18: Key-HMBC-correlations-in Compound 10.
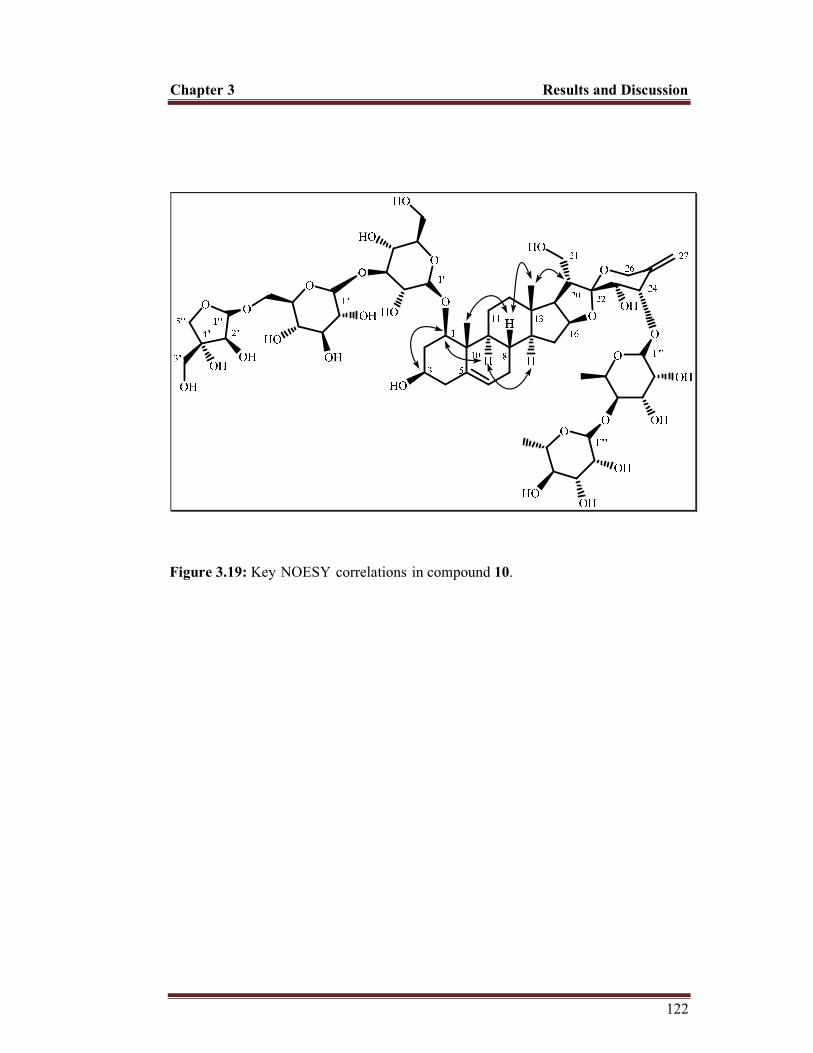
Chapter 3 Results and Discussion
122
Figure 3.19: Key-NOESY-correlations-in compound 10.

Chapter 3 Results and Discussion
123
3.5 Biological studies
3.5.1 In vitro biological activities
3.5.1.1 Antibacterial activity of Cr. MeOH-Ext and fractions
In antibacterial assay, the Cr. MeOH-Ext and its subsequent solvent soluble fractions
were screened against gram positive (B. subtilis and S. aureus) as well as gram
negative (E. coli, S. flexenari, P. aeruginosa and S. typhi) bacteria in order to explore
its antibacterial potential. The inhibition zone of the extract and all the fractions was
compared with a broad spectrum antibacterial drug, Imipenem, (10 µg/disc) and
percent inhibitions were calculated. The antibacterial results as shown in Table 3.14
pointed out that in general, the Cr. MeOH-Ext and its subsequent solvent soluble
fractions are fairly active against some of the tested bacterial strains. All tested
samples, showed antibacterial activity against S. flexenari. Among the test samples n-
Hex-fr was more active with 47% inhibition followed by Cr. MeOH-Ext, CHL-fr and
EtOAc-fr with 40%, 35% and 26% inhibitions, respectively. All fractions except
BuOH-fr were found active against E. coli with maximum activity in EtOAc-fr (33%)
inhibition. Only butanol and aqueous fractions were found active against S. typhi,
with 25% inhibition each. Similarly, Cr. MeOH-Ext, n-hexane and CHL-fr showed
antibacterial activity against P. aeruginosa with 23%, 32% and 18% inhibitions,
respectively. The Cr. MeOH-Ext, CHL-fr, BuOH-fr and Aq-fr also showed
antibacterial potential against B. subtilis and S. aureus with a maximum of 43%
activity in CHL-fr. The Cr. MeOH-Ext exhibited 38% inhibition against S. aureus.
The n-Hex-fr and EtOAc-fr were found inactive against two gram positive bacteria, S.
aureus and B. subtilis.

Chapter 3 Results and Discussion
124
The global turn down in antibiotic discovery programs by different pharmaceutical
firms and increase of antibiotic resistant micro-organisms, are promptly the scientific
community to look for new or novel and also re-examine old sources of bioactive
chemicals if any, in order to discover potential anti-bacterial compounds. Medicinal
plants are an area under focus, since their secondary metabolites included a
noteworthy number of drugs used in current therapeutics and there is no doubt in their
potential as the source of new drugs140. Keeping in view the fact, the anti-bacterial
screening of T. govanianum rhizomes extract and subsequent fractions was
performed. Our results suggest that the Cr. MeOH-Ext and some of the subsequent
solvent soluble fractions as described above possess moderate antibacterial potential
to some of the tested gram positive as well as gram negative bacterial strains. The
antibacterial potential in the Cr. MeOH-Ext and its successive solvent soluble
fractions might be due to the occurrence of steroids, glycosides, tannins, and saponins.
These medicinally important secondary metabolites exert their antimicrobial action by
virtue of different mechanism141. For example, saponins exerts their antibacterial
action by inhibiting the growth of bacteria and also through leakage of certain
enzymes and proteins from the cell142 that may be the reason for inhibition in present
study. In addition, antibacterial mechanisms for steroids are specifically related with
membrane lipids and cause leakage from the liposomes143. Similarly, the anti-bacterial
action of n-Hex-fr is strongly supported by the presence of certain fatty acids i.e.
octadecanoic acid and hexadecanoic acids (presence suggested from data in (Table
3.3; Page No. 91) possessing antibacterial properties143.
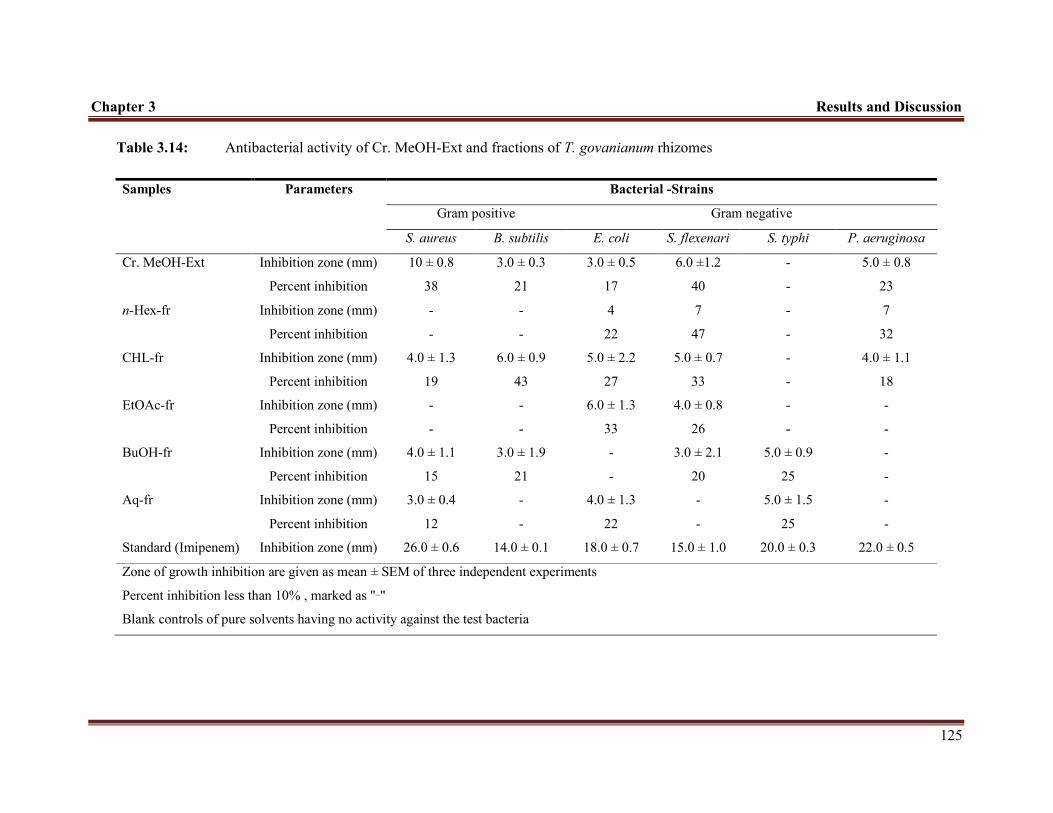
Chapter 3 Results and Discussion
125
Table 3.14: Antibacterial activity of Cr. MeOH-Ext and fractions of T. govanianum rhizomes
Samples Parameters Bacterial -Strains
Gram positive Gram negative
S. aureus B. subtilis E. coli S. flexenari S. typhi P. aeruginosa
Cr. MeOH-Ext Inhibition zone (mm) 10 ± 0.8 3.0 ± 0.3 3.0 ± 0.5 6.0 ±1.2 - 5.0 ± 0.8
Percent inhibition 38 21 17 40 - 23
n-Hex-fr Inhibition zone (mm) - - 4 7 - 7
Percent inhibition - - 22 47 - 32
CHL-fr Inhibition zone (mm) 4.0 ± 1.3 6.0 ± 0.9 5.0 ± 2.2 5.0 ± 0.7 - 4.0 ± 1.1
Percent inhibition 19 43 27 33 - 18
EtOAc-fr Inhibition zone (mm) - - 6.0 ± 1.3 4.0 ± 0.8 - -
Percent inhibition - - 33 26 - -
BuOH-fr Inhibition zone (mm) 4.0 ± 1.1 3.0 ± 1.9 - 3.0 ± 2.1 5.0 ± 0.9 -
Percent inhibition 15 21 - 20 25 -
Aq-fr Inhibition zone (mm) 3.0 ± 0.4 - 4.0 ± 1.3 - 5.0 ± 1.5 -
Percent inhibition 12 - 22 - 25 -
Standard (Imipenem) Inhibition zone (mm) 26.0 ± 0.6 14.0 ± 0.1 18.0 ± 0.7 15.0 ± 1.0 20.0 ± 0.3 22.0 ± 0.5
Zone of growth inhibition are given as mean ± SEM of three independent experiments
Percent inhibition less than 10% , marked as "_"
Blank controls of pure solvents having no activity against the test bacteria

Chapter 3 Results and Discussion
126
3.5.1.2 Antifungal activity
3.5.1.2.1 Antifungal activity of Cr. MeOH-Ext and fractions
In antifungal screening, the Cr. MeOH-Ext and its subsequent solvent soluble
fractions were examined against seven different fungal strains (Candida albicans,
Candida glabrata, Aspergilllus flavus, Aspergillus niger, Aspergillus fumigatus,
Trichphyton rubrum and Microsporum canis). The results (Table 3.15) showed good
to moderate antifungal potential with maximum in Cr. MeOH-Ext and BuOH-fr. The
Cr. MeOH-Ext were found active against all tested strains except A. fumigatus with
maximum inhibition against T. rubrum, (60%), M. canis, (55%), and C. albicans (
40%). The n-Hex-fr exhibited good inhibition (40%) against M. canis. The CHL-fr
showed significant inhibition (70%) against T. rubrum and good (40%) towards M.
canis. The EtOAc-fr was least active with no activity against fungal strains C.
glabrata, A. fumigatus and M. canis. The BuOH-fr was found active against all strains
except T. rubrum with maximum inhibition of 40% against A. niger. The Aq-fr
showed weak inhibition with no activity against test C. albicans and A. niger. The
standard drugs used were amphotericin B and miconazole.
3.5.1.2.2 Antifungal activity of isolated compounds
The isolated compounds [govanoside A and govanic acid (two new compounds),
borassoside E, pennogenin and diosgenin] were screened for their antifungal potential
as the fractions containing them possessed promising antifungal activities. The results
of isolated compounds (Table 3.16) indicated that govanoside A and borassoside E
have good to moderate activities against Aspergillus niger, A. flavus, C. albicans, and

Chapter 3 Results and Discussion
127
C. glabrata strains, while govanic acid exhibited moderate potential against T. rubrum
and M. canis.
Moreover, pennogenin and diosgenin were inactive at the highest test concentration of
20 µg/mL against all tested fungi. In comparison, borassoside E exhibited good
activities (MIC = 2.5-10 µg/mL) against Candida spp. In case of A. niger, govanoside
A exhibited good activity (MIC = 5 µg/mL) while borassoside E was slightly less
active (MIC = 10 µg/mL). As far as A. flavus is concerned Borassoside E had a better
control in comparison to govanoside A. Govanic acid exhibited better result (MIC =
10 µg/mL) for T. rubrum in comparison to M. canis and showed no activity for the
rest of tested fungal strains.
To best of our knowledge, the in vitro antifungal activities of isolated compounds,
govanoside A, borassoside E and govanic acid are reported for the first time in this
study. As govanoside A and borassoside E are steroidal saponins and steroidal
saponins have shown to possess antifungal potentials, our findings are coherent to
earlier findings144,145 in this domain. Similarly, trihydroxy fatty acid have also been
reported for antifungal properties146, which endorse the findings of this study.
As fungal infections are a major cause of morbidity and mortality147, there is need for
the discovery of new antifungal drugs. Therefore, this is a significant finding, though
further detail experiments are required to establish the-exact-mechanism of antifungal
actions of these compounds.

Chapter 3 Results and Discussion
128
Table 3.15: Antifungal activity of Cr. MeOH-Ext and fractions of T. govanianum rhizomes (% inhibition)
Fungal strains
Samples
Cr. MeOH-Ext n-Hex-fr--- CHL-fr EtOAc-fr BuOH-fr [Aq-fr
Percent inhibition
Candida albicans 40 - 20 10 30 -
Candida glabrata 25 - 15 - 25 10
Aspergilllus flavus 20 10 - 20 30 15
Aspergillus niger 10 - - 15 40 -
Aspergillus fumigatus - 10 10 - 30 10
Trichphyton rubrum 60 30 70 10 - 20
Microsporum canis 55 40 40 - 10 15
* Percent inhibition less than 10 is marked as "_".

Chapter 3 Results and Discussion
129
Table 3.16: Antifungal activity of isolated compounds of T. govanianum rhizomes
*Concentration range 0312-20 µg/mL; MIC (minimum inhibitory concentration)
MIC (µg/mL)
Compounds C. glabrata C. albicans A.niger A. fumigatus A. flavus T. rubrum M. canis
Govanoside A 20 5.0 5.0 >20 20 >20 >20
Borassoside E 10 2.5 10 >20 10 >20 >20
Pennogenin >20 >20 >20 >20 >20 >20 >20
Diosgenin >20 >20 >20 >20 >20 >20 >20
Govanic acid >20 >20 >20 >20 >20 10 20
Amphotericin B 2.5 0.6 5.0 5.0 5.0 - -
Miconazole - - - - - 2.5 5.0

Chapter 3 Results and Discussion
130
3.5.1.3 DPPH free radical scavenging activity of Cr. MeOH-Ext and fractions
DPPH free radical scavenging assay is considered as a standard method for the
assessment of the antioxidant potential of natural crude extracts, fractions and pure
compounds91,148,149. Antioxidant potential bearing natural phytochemicals are
effective in reducing the toxic effects in human, due to xenobiotic exposure150. The
Cr. MeOH-Ext and its succeeding solvent soluble fractions were examined for their
antioxidant effect at different concentrations i.e. 1, 10, 20, 50, 100 and 200 µg/mL.
The results (Table 3.17 and Fig. 3.20) indicated that the n-Hex-fr and CHL-fr
possessed relatively higher free radical scavenging capacity as compared to the other
tested fractions. This finding is suggestible due to the presence of certain antioxidant
fatty acids (9,12-octadecadienoic acid and hexadecanoic acid) in n-Hex-fr, and
glycosides, saponins and flavonoids (Table 3.2; Page No. 89) in CHL-fr, as
previously reported in diverse plant species151-154.
The results also demonstrated that the antioxidant potential of Cr. MeOH-Ext as well
as its successive solvent soluble fractions was lower than BHT and ascorbic acid. The
low free radical scavenging capacity of the Cr. MeOH-Ext or its fractions might be
attributed due to the presence of large sized fatty constituents as revealed from their
phytochemical and GC/MS analyses. As DPPH assay is limited by steric accessibility,
thus molecules having small molecular weight, have better access to the DPPH
molecules than larger molecular weight molecules and therefore possess strong free
radical scavenging capacity154. Furthermore, there is also a non-linear relationship
between antioxidant activity and hydrophobicity because an increase of alkyl chain
length results in low scavenging capacity155.
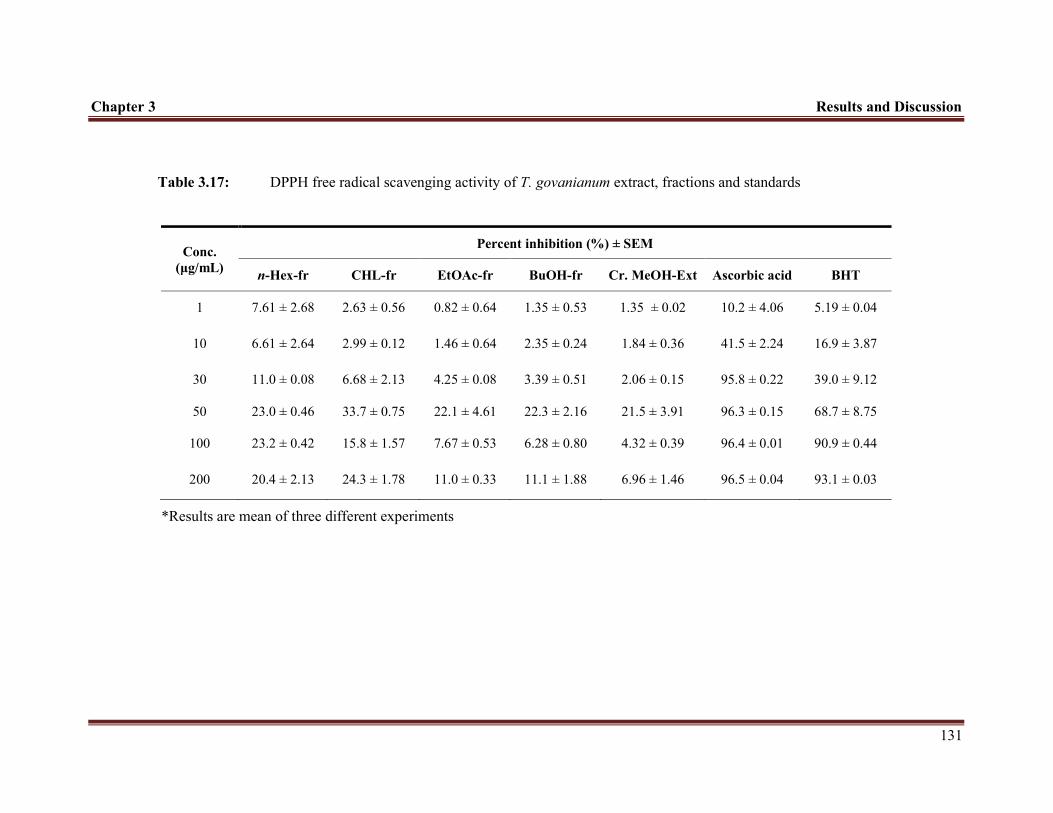
Chapter 3 Results and Discussion
131
Table 3.17: DPPH free radical scavenging activity of T. govanianum extract, fractions and standards
Conc.
(µg/mL)
Percent inhibition (%) ± SEM
n-Hex-fr CHL-fr EtOAc-fr BuOH-fr Cr. MeOH-Ext Ascorbic acid BHT
1 7.61 ± 2.68 2.63 ± 0.56 0.82 ± 0.64 1.35 ± 0.53 1.35 ± 0.02 10.2 ± 4.06 5.19 ± 0.04
10 6.61 ± 2.64 2.99 ± 0.12 1.46 ± 0.64 2.35 ± 0.24 1.84 ± 0.36 41.5 ± 2.24 16.9 ± 3.87
30 11.0 ± 0.08 6.68 ± 2.13 4.25 ± 0.08 3.39 ± 0.51 2.06 ± 0.15 95.8 ± 0.22 39.0 ± 9.12
50 23.0 ± 0.46 33.7 ± 0.75 22.1 ± 4.61 22.3 ± 2.16 21.5 ± 3.91 96.3 ± 0.15 68.7 ± 8.75
100 23.2 ± 0.42 15.8 ± 1.57 7.67 ± 0.53 6.28 ± 0.80 4.32 ± 0.39 96.4 ± 0.01 90.9 ± 0.44
200 20.4 ± 2.13 24.3 ± 1.78 11.0 ± 0.33 11.1 ± 1.88 6.96 ± 1.46 96.5 ± 0.04 93.1 ± 0.03
*Results are mean of three different experiments
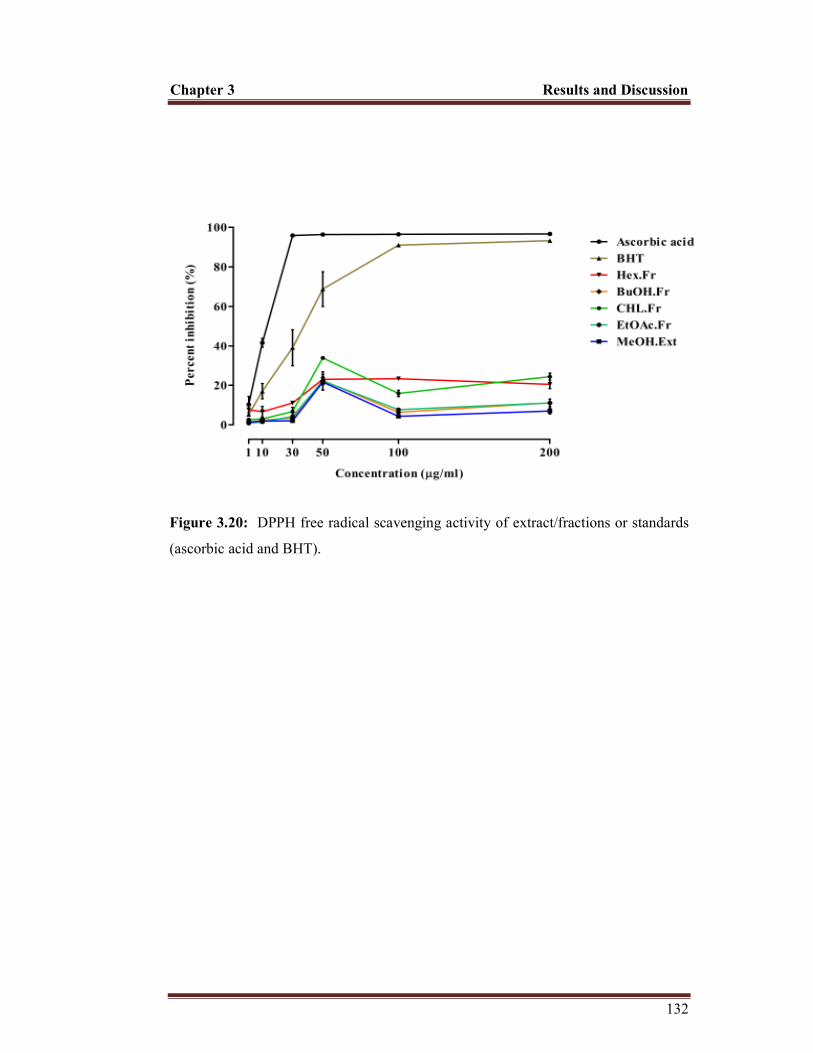
Chapter 3 Results and Discussion
132
Figure 3.20: DPPH free radical scavenging activity of extract/fractions or standards
(ascorbic acid and BHT).

Chapter 3 Results and Discussion
133
3.5.1.4 Anticancer activity
3.5.1.4.1 Anticancer activity of Cr. MeOH-Ext and fractions
The anticancer activities of Cr. MeOH-Ext and its subsequent solvent soluble
fractions against two cancer cell lines; HeLa (cervical cancer cells) and PC-3 (prostate
cancer cells), were determined by MTT (3-(4,5-dimethylthazol-2-yl)-2,5-diphenyl
tetrazonium bromide) assay. The Cr. MeOH-Ext and its fractions exhibited significant
cytotoxicity towards both cancer cell lines (Table 3.18). The cytotoxic activity of
CHL-fr towards HeLa cells was slightly lower than that of standard drug doxorubicin,
with IC50 of 0.84 ± 0.16 and 0.34 ± 0.01 µg/mL, respectively. Similarly, this fraction
was also most effective against PC-3 cells (IC50 of 2.70 ± 0.35 µg/mL), though to a
lesser extent than doxorubicin (IC50 = 1.38 ± 0.16). Moreover, the BuOH-fr, although
possessed strong cytotoxic effect against the HeLa cells (IC50 of 1.60 ± 0.34 µg/mL),
but was less effective in inhibiting the PC-3 cells (IC50 of 4.04 ± 0.35 µg/mL). The
EtOAc-fr was also effective towards both cancer cells, with prominent against HeLa
cells (IC50 of 1.41 ± 0.08 µg/mL).
3.5.1.4.2 Anticancer activity of isolated compounds
Keeping in view the significant anticancer potential in the extract and fractions, the
isolated compounds [govanoside A, govanic acid (two new compounds) borassoside
E, diosgenin and pennogenin] from the chloroform and BuOH-fr were tested against
HeLa and PC-3 cell lines for their anticancer effects. The results indicated that
govanoside A and borassoside E exhibited significant cytotoxicity against both cancer
cell lines (Table 3.19). In particular, govanoside A showed significant anticancer
potential against PC-3 and HeLa cells, with IC50 of 1.74 ± 0.12 and 0.51 ± 0.26

Chapter 3 Results and Discussion
134
µg/mL respectively, in comparison to the standard, doxorubicin whose IC50 values
were 1.69 ± 0.28 and 0.50 ± 0.15 µg/mL, towards PC-3 and HeLa cells, respectively.
Govanoside A also showed good anticancer activity with IC50 of 0.67 ± 0.22 µg/mL
against HeLa cells. Pennogenin (IC50 of 9.83 ± 0.37 µg/mL) was found active against
HeLa cells, while diosgenin and govanic acid were found less cytotoxic against both
cell lines with IC50 greater than 30 µg/mL.
So far, a number of anticancer metabolites have been reported in the genus
Trillium53,120,156. These anticancer metabolites include steroidal glycosides and
saponins isolated from Trillium erectum and Trillium tschonoskii44,157. As the
phytochemical analyses of the tested fractions revealed the presence of anticancer
metabolites (steroidal glycosides, flavonoids and saponins), therefore, the potent
anticancer potential in the Cr. MeOH-Ext and its fractions of T. govanianum rhizomes
might be attributed to the presence of these secondary metabolites, which is further
augmented by the pure isolated compounds from these fractions, exhibiting good
anticancer potential. Therefore the rhizomes of this Asian plant species may prove to
be effective in the treatment of cancer.

Chapter 3 Results and Discussion
135
Table 3.18: Anticancer activity of Cr. MeOH-Ext and fractions from T.
govanianum rhizomes
Results are mean ± SEM of three independent experiments; PC-3, human prostate
cancer cells; HeLa, human epithelial carcinoma cells
Table 3.19: Anticancer activity of isolated compounds from T. govanianum
rhizomes
Results are mean ± SEM of three independent experiments
Samples IC50 (µg/mL)
HeLa cells PC-3 cells
Cr. MeOH-Ext 3.14 ± 0.72 6.50 ± 0.52
CHL-fr 0.84 ± 0.16 2.70 ± 0.35
EtOAc-fr 1.41 ± 0.08 5.15 ± 0.34
BuOH-fr 1.60 ± 0.34 4.04 ± 0.35
Doxorubicin 0.34 ± 0.01 1.38 ± 0.16
Compounds IC50 (µg/mL)
PC-3cells HeLa cells
Govanoside A 1.74 ± 0.12 0.51 ± 0.26 Borassoside E 2.34 ± 0.21 0.67 ± 0.22 Pennogenin >30 9.83 ± 0.37 Diosgenin >30 >30 Govanic acid >30 >30 Doxorubicin 1.69 ± 0.28 0.50 ± 0.15

Chapter 3 Results and Discussion
136
3.5.1.5 Anti-inflammatory activity (Oxidative burst assay)
3.5.1.5.1 Anti-inflammatory activity of Cr. MeOH-Ext and fractions-
The in vitro immune suppressive activity, evaluated through suppression of oxidative
burst was performed by luminol enhanced chemiluminescence assay. The results are
presented in Table 3.20. The results showed that the BuOH-fr exhibited significant
inhibition of oxidative burst for the whole blood followed by Cr. MeOH-Ext with IC50
of 16.53 ± 7.54 and 30.81 ± 7.02 µg/mL respectively. The CHL-fr also showed
moderate inhibition with IC50 of 81.64 ± 24.61 µg/mL. Similarly the n-Hex-fr and
EtOAc fraction were found less effective in comparison to other fraction with IC50 of
107 ± 38.40 and 114.81 ± 12.35 µg/mL, respectively. The standard drug used as
positive control was ibuprofen with IC50 of 11.23 ± 1.91 µg/mL.
3.5.1.5.2 Anti-inflammatory activity of isolated compounds
Based on the good results in the Cr. MeOH-Ext and its succeeding solvents soluble
fractions, the isolated compounds borassoside E, diosgenin and pennogenin from
BuOH-fr and CHL-fr were screened for suppression of oxidative burst for the whole
blood. The results are tabulated in Table 3.20. Among the tested compounds,
pennogenin exhibited significant in vitro immune suppressive effect by suppression of
oxidative burst with IC50 of 05.00 ± 0.84 µg/mL in comparison to standard drug
ibuprofen with IC50 of 11.23 ± 1.91 µg/mL. Similarly borassoside E also showed
considerable inhibition for the whole blood with IC50 of 31.51 ± 6.62 µg/mL. The
compound diosgenin was found less active as compare to other tested compounds.

Chapter 3 Results and Discussion
137
Luminol enhanced chemiluminescence assay is based on detection of intracellular
reactive oxygen species (ROS) released by opsonized zymosan activated immune
cells. A determination of chemiluminescence is a proficient and extremely susceptible
assay to investigate various kinds of reactive oxygen species. Thus this method is
suitable for detection of super oxide (free radical anions) in a biological system158.
Inflammation and reactive oxygen species have mutual promotion relationship. ROS
are connected with the inflammatory response and frequently they contribute to the
tissue damaging effects of inflammatory reactions159.
The inflammation can lead to the raise of free radicals. Similarly oxidative stress is
consider to play an imperative role in the pathogenesis of inflammation, not merely
through direct injurious effects, but also by association through molecular
mechanisms160. There is a large amount of evidence indicated that the reactive species
production, such as hydrogen peroxide (H2O2), hypochlorous acid (HOCl), occurs at
the site of inflammation, contributes to tissue damage and potentially promoting
inflammatory processes161,162.
Drugs that inhibit the formation or release of these toxic ROS are effective in
treatment of variety of diseases that involves stimulation of immune cells like AIDS,
rheumatoid arthritis and cancer163. Our study suggests that the Cr. MeOH-Ext and its
fractions considerably inhibit the formation of ROS, which is further confirmed by the
isolated compounds from these fractions, especially, pennogenin and borassoside E
exhibiting significant inhibition of ROS production. Thus, these findings prove
scientifically the traditional use T. govanianum rhizomes in the treatment of various

Chapter 3 Results and Discussion
138
inflammatory diseases. Although studies are in progress, it is necessary to investigate
different mechanisms involved, and also to develop an effective dosage form.
Table 3.20: Anti inflammatory effect of T. govanianum rhizomes Cr. MeOH-Ext,
fractions and isolated compounds
Samples IC50± SD (µg/mL)
Cr. MeOH-Ext 30.81 ± 7.02
n-Hex-fr 107.12 ± 38.40
CHL-fr 81.64 ± 24.61
EtOAc-fr 114.81 ± 12.35
BuOH-fr 16.53 ± 7.54
Pennogenin 05.00 ± 0.84
Borassoside E 31.51 ± 6.62
Diosgenin 53.23 ± 2.71
Ibuprofen (Positive control) 11.23 ± 1.91
Results are mean ± SEM of three independent experiments

Chapter 3 Results and Discussion
139
3.5.1.6 Anti-leishmanial activity of Cr. MeOH-Ext and fractions
The Cr. MeOH-Ext and the fractions were examined for in vitro antiparasitic effect
against promastigotes of Leishmania major (DESCO). The results (Table 3.21)
indicated that the Cr. MeOH-Ext exhibited prominent leishmanicidal potential against
the tested strain, L. major with IC50 of 36.34 ± 2.51 µg/mL. The butanol and aqueous
fractions also showed activity with IC50 of 62.61 ± 3.23 and 94.63 ± 1.84 µg/mL
respectively. The other tested fractions i.e n-Hex-fr, CHL-fr and EtOAc-fr were found
less active with IC50 greater than 100 µg/mL. The standard drug used was
amphotericin B, IC50 of 0.29 ± 0.05 µg/mL.
Leishmaniasis is caused by Leishmania, a genus comprising of protozoan parasites.
The two main types of leishmaniasis are the cutaneous, (skin sores) and visceral,
which involve the internal body organs (liver, spleen, and bone marrow)164.
Leishmaniasis is also considered by the World Health Organization (WHO) as one of
six major infectious diseases, with a high detection rate and ability to produce
deformities, and caused significant morbidity and mortality in different
countries165,166. According to the WHO, the population of eighty eight (88) countries
are threatened by leishmaniasis and about three fifty (350) million people are at risk
from this disease167. At present, a limited number of chemotherapeutic agents are
available for the treatment of this disease; therefore the search for new effective drugs
has become really imperative. Keeping in view these facts, this study was performed,
and as a result it was observed that the Cr. MeOH-Ext possess a good potential for
leishmaniasis and thus can be a promising candidate as an antileishmanial agent.

Chapter 3 Results and Discussion
140
Table 3.21: Leishmanicidal activity against Leishmania major of Cr. MeOH-Ext and
fractions of T. govanianum rhizomes
Samples IC50 ± SD [µg/mL]
Cr. MeOH-Ext 36.34 ± 2.51
n-Hex-fr >100
CHL-fr >100
EtOAc-fr >100
BuOH-fr 62.61 ± 3.23
Aq-fr 94.63 ± 1.84
Amphotericin B 0.29 ± 0.05
Results are mean ± SEM of three independent experiments
Amphotericin B was used as positive control
3.5.1.7 Insecticidal activity of Cr. MeOH-Ext and fractions
The in vitro insecticidal potential of Cr. MeOH-Ext and its subsequent solvent soluble
fractions-was determined against two insects, Tribolium-castaneum and Rhyzopertha-
dominica. The results presented in term of percent mortality are presented in Table
3.22 and 3.23, indicate that all of the test samples were not active against the tested
insects as no mortality was observed in this study.
Currently, synthetic pesticides are largely used for protection of stored grains from
insect168. Most of these species have developed resistance to current insecticides, and
therefore the scientists and academia of the globe are currently trying to isolate
effective compounds from medicinal plants as natural new insecticides. Keeping in
view the search for effective insecticides this screening was performed.

Chapter 3 Results and Discussion
141
Several mechanisms have been reported in the literature by which plant extract exerts
their insecticidal activity. One of the mechanisms for insecticidal activity is blocking
of sterol uptake in the insect gut by plant secondary metabolite saponins169. For the
steroids synthesis, (cholesterol, and insect moulting hormone 20-hydroxyecdysone)
insects requires sterol because they are not able to synthesize sterol structures by
themselves170 and thus get them from their different foodstuff (cholesterol or
phytosterols from plants as precursors). The secondary metabolite saponins form
insoluble complexes with sterols containing foods, there by prevent their absorption.
Similarly, if larvae feed on a food (saponin-rich), the ingested food saponins may
form complex with cholesterol in their body, and thus hinder the biosynthesis of
ecdysteroids necessary for ecdysis171. Moreover, it was also observed and reported in
the literature that the action of saponins, could be opposed by adding of surplus
cholesterol or plant sterols to the diet containing saponins and sapogenins. The
insecticidal activity of saponins also depends upon their sugar moieties attached to
them. So it is expected that glycosylated saponins exert their insecticidal action only
when they are hydrolyzed in the insect gut by enzyme glycosidases169,172.
From this discussion, we postulate that the extract and fractions particularly those
containing saponins that are not very polar, cannot exert their insecticidal action
because these extract/fractions along with saponins are also rich in sterols, steroids
and phytoecdysteroids especially 20-hydroxyecdysone (as we isolated from CHL-fr).
So in the presence of excess of these sterols, steroids, and phytoecdysteroids in the
tested samples dilute the action of saponin and thus the fractions were ineffective
against the tested insets. In addition, those fractions which contain saponins and are
polar, the glycosylated saponins (as we isolated borassoside E, govanoside A from

Chapter 3 Results and Discussion
142
BuOH-fr) could be the reason for its ineffectiveness because it has been reported that
glycosylated saponins are less active than sapogenins against red flour beetles172.
Table-3.22: Insecticidal activity of Cr. MeOH-Ext and its subsequent fractions of T.
govanianum rhizomes against insect Tribolium castaneum
Test Sample
Tribolium castaneum
Total-No.-of
insects-
No. of-survived
insects
No. of-dead
insects
%
Mortality
Cr. MeOH-Ext 10 10 0 0
n-Hex-fr 10 10 0 0
CHL-fr 10 10 0 0
EtOAc-fr 10 10 0 0
BuOH-fr 10 10 0 0
Aq-fr 10 10 0 0
Negative control 10 10 0 0
Positive control* 10 0 10 100
*Permethrin
Table-3.23: Insecticidal activity of Cr. MeOH-Ext and its subsequent fractions of T.
govanianum rhizomes against insect Rhyzopertha dominica
Test Sample
Rhyzopertha dominica
Total No.-of
insects
No. of-survived
insects
No.-of dead
insects
%
Mortality
Cr. MeOH 10 10 0 0
n-Hex-fr 10 10 0 0
CHL-fr 10 10 0 0
EtOAc-fr 10 10 0 0
BuOH-fr 10 10 0 0
Aq-fr 10 10 0 0
Negative control 10 10 0 0
Positive control* 10 0 10 100
*Permethrin

Chapter 3 Results and Discussion
143
3.5.1.8 Brine shrimp cytotoxic activity of Cr. MeOH-Ext and fractions
The results of brine shrimp cytotoxic activity of Cr. MeOH-Ext and fractions are
given in Table 3.24 and Fig. 3.21. Based on LD50 (µg/mL), the cytotoxicity of test
samples was in following order; Aq-fr > BuOH-fr > EtOAc-fr > Cr. MeOH-Ext. The
maximum cytotoxic activity was observed for aqueous fraction and BuOH-fr with
LD50 (µg/mL) of 256 (138-466) and 260 (141-469) respectively. Similarly, EtOAc-fr
and Cr. MeOH-Ext also showed moderate cytotoxicity. The LD50 values for n-Hex-fr
and CHL-fr were found greater than 1000 µg/mL, and thus were considered less
cytotoxic in this study.
The brine shrimp test is an economical and frequently used for detection of cytotoxic
potential173,174. It has been reported that a positive co-relation exists between brine
shrimp cytotoxicity and human nasopharyngeal carcinoma175,176. The findings of this
study suggested significant cytotoxicity against brine shrimp, which is further
validated from its high potential for PC-3 and HeLa cell lines in MTT assay (Table
3.18 and 3.19). Therefore, these results provide a prediction for some potent
anticancer compounds in the extract and fractions, which is up to some extant verified
through isolation of steroids and steroidal glycosides (diosgenin, pennogenin,
borassoside E and govanoside A) that showed anticancer potential.
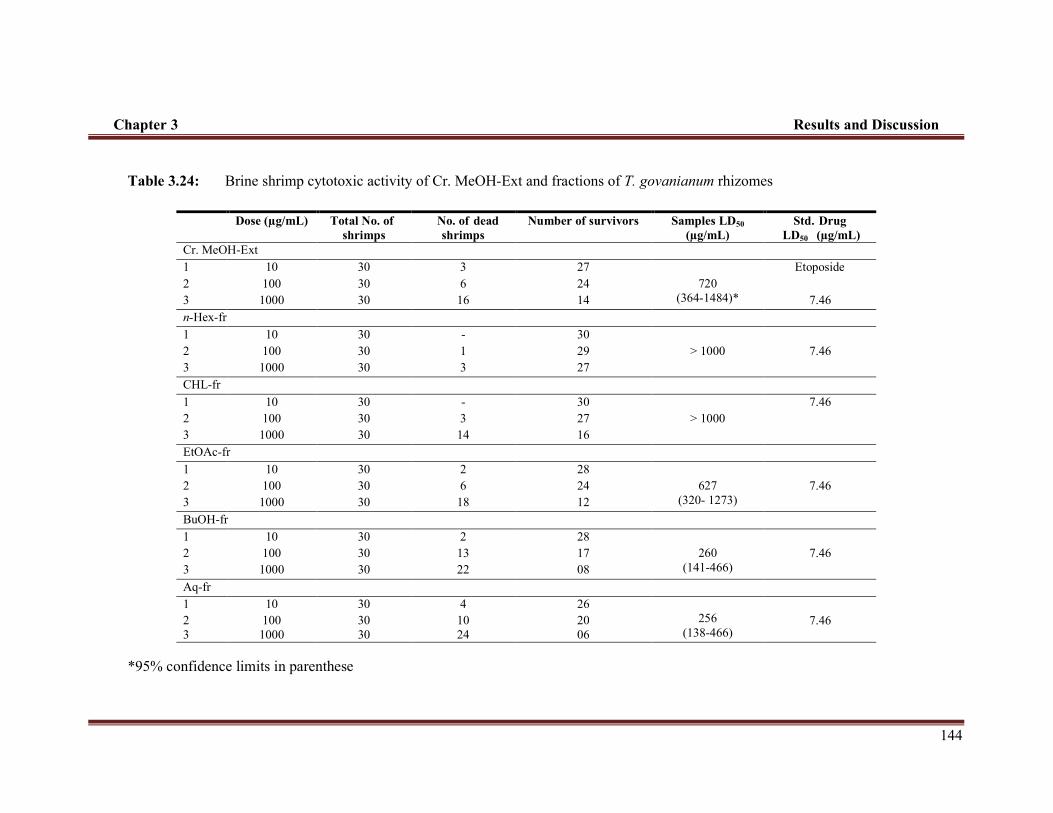
Chapter 3 Results and Discussion
144
Table 3.24: Brine shrimp cytotoxic activity of Cr. MeOH-Ext and fractions of T. govanianum rhizomes
- Dose (µg/mL) Total No. of-
shrimps
No. of-dead
shrimps
Number of survivors Samples LD50
(µg/mL)
Std.-Drug
LD50--(µg/mL)
Cr. MeOH-Ext 1 10 30 3 27
720 (364-1484)*
Etoposide
7.46 2 100 30 6 24 3 1000 30 16 14 n-Hex-fr
1 10 30 - 30
> 1000
7.46 2 100 30 1 29 3 1000 30 3 27 CHL-fr
1 10 30 - 30 > 1000
7.46 2 100 30 3 27 3 1000 30 14 16 EtOAc-fr
1 10 30 2 28
627 (320- 1273)
7.46 2 100 30 6 24 3 1000 30 18 12
BuOH-fr
1 10 30 2 28
260 (141-466)
7.46 2 100 30 13 17 3 1000 30 22 08
Aq-fr 1 10 30 4 26
256 (138-466)
7.46 2 100 30 10 20 3 1000 30 24 06
*95% confidence limits in parenthese

Chapter 3 Results and Discussion
145
Figure-3.21: Percent cytotoxic effect of Cr. MeOH-Ext and fractions of T.
govanianum rhizomes.

Chapter 3 Results and Discussion
146
3.5.1.9 Muscle relaxant (Spasmolytic) activity of Cr. MeOH-Ext
The results of in vitro effect of Cr. MeOH-Ext on isolated rabbit jejunum are
presented in Fig. 3.22 and 3.23. The results indicated that both spontaneous as well as
high K+ induced contractions of isolated preparations (rabbit jejunum) were
completely inhibited by the Cr. MeOH-Ext at a dose of 5 and 3 mg/mL, comparable
to the standard drug verapamil (calcium channel blocker) which inhibited the high K+
induced and as well as spontaneous contractions at a dose of 3 and 1 µM, respectively
as shown in Fig. 3.22.
Furthermore, in Ca++ channel blocking (CCB) effect, the Cr. MeOH-Ext at a dose of
(0.1-0.3 mg/mL) . caused-rightward shift of the-Ca++concentration response curves
(CRCs) exhibited the suppression of the maximum contraction effect, comparable to
that caused by standard drug verapamil (0.03-0.1 µM) as given in Fig. 3.23.
Isolated rabbit jejunum is a spontaneously contracting gut preparation177, allowing to
examine the relaxant effect, without induced contraction. The Cr. MeOH-Ext when
tested on rabbit jejunum, inhibited high K+ induced and spontaneous contractions in
the rabbit jejunum. It has been reported in different studies, that the
relaxant/spasmolytic activity of medicinal plants is generally mediated through
Ca++channels blockage178-180. Therefore, in order to investigate the CCB mechanism for
spasmolytic effect of T. govanianum rhizomes, the extract was tested on high K+
induced contractions in the jejunum. It is well known, that high K+ (>30 mM) level by
virtue of opening the voltage dependent L-type Ca++channels induced smooth muscle
contractions, and consequently permitting the inward movement of extracellular Ca++
which ultimately results a contractile effect181. therefore, the agents causing

Chapter 3 Results and Discussion
147
inhibition of high K+ induced contractions are regarded as Ca++influx inhibitors182. As
the Cr. MeOH-Ext relaxed the high K+ induced contractions in a analogous pattern just
like standard Ca++antagonist verapamil183, indicating its calcium Ca++antagonist effect.
This effect (Ca++antagonist) was further confirmed when the Cr. MeOH-Ext shifted
the Ca++ concentration response curves to the right with inhibition of the max response,
analogous to the standard drug verapamil.
It has been reported that Ca++ antagonists have beneficial effect in gut disorders, such
as abdominal cramps and diarrhea177. Therefore, the findings (relaxant effect
mediated through Ca++ channel blocking) of this study, rationalize the medicinal use
of this plant in conditions related to hyperactive gut disorders like diarrhea etc and
this also justifies its ethnomedicinal use in diarrhea.

Chapter 3 Results and Discussion
148
Figure 3.22: Inhibitory effects of T. govanianum rhizomes Cr. MeOH-Ext and
verapamil in isolated rabbit jejunum preparations. Values expressed as mean ± SEM.
Figure 3.23: Ca++ concentration response curves (CRCs) of Cr. MeOH-Ext and
verapamil in isolated rabbit jejunum preparations. Values expressed as mean ± SEM
(S1= Cr. MeOH-Ext).

Chapter 3 Results and Discussion
149
3.5.1.10 Antiglycation activity of Cr. MeOH-Ext and fractions
Antiglycation effect of Cr. MeOH-Ext and its fractions of T. govanianum rhizomes
were tested for antiglycation potential. The result presented in Table 3.25, indicated
that all the tested samples exhibit weak antiglycation effect at test concentration of 0.5
mg/mL, with maximum in Cr. MeOH-Ext (16% inhibition).
One of the harmful effects of hyperglycemia is the formation of sugar derived
molecules called advanced glycation end products (AGEs). These AGEs are
heterogeneous group of substances, formed from the reaction (non enzymatic) of
reducing sugars with free amino groups of proteins, nucleic acids and lipids. The
formation of AGEs is highly accelerated in condition like diabetes, where glucose
molecules are available in excess amount184. Thus glycation is also one of the
important factors to be kept in mind, while treating diabetic complications. At present,
a lot of plant extracts, fractions and purified compounds have been tested and verified
for suppression of AGEs formation. Moreover, several scientific reports demonstrate
that antiglycation effect of plant extract and fractions can be attributed to the presence
of phenolic compounds185-187.
Since the Cr. MeOH-Ext and its fractions contains little amount of phenolic
compounds or even deprived of it, and are very rich in steroids and saponins as clear
from the phytochemical tests and isolated compounds (chloroform and BuOH-frs),
Our observation in this context could be due to the absence or little quantity of these
phenolic compounds.

Chapter 3 Results and Discussion
150
Table 3.25: Antiglycation activity of Cr. MeOH-Ext and fractions at dose of 0.5
mg/mL
3.5.1.11 β-glucoronidase inhibitory activity of Cr. MeOH-Ext and fractions
The Cr. MeOH-Ext and its fractions were screened for β-glucoronidase inhibition.
The results are presented in Table 3.26, based on the IC50± SD (µg/mL), the Cr.
MeOH-Ext (140.8 ± 3.8) and BuOH-fr (196.2 ± 1.9) exhibited a moderate level of
enzyme inhibitory activity in comparison to the standard D-saccharic acid-1,4-
lactone, IC50 of 46.7 ± 2.2. The CHL-fr and EtOAc-fr were found less effective in
this study.
β-glucuronides enzyme (present in animal, plants, and bacteria) catalyzes the
hydrolysis of β-glucuronides conjugates of exogenous and endogenous compounds
produced in the body188. Increased level of β-glucuronides in blood has been observed
in liver injury. Over expression of this enzyme may also be related to liver cancer,
arthritis and AIDS. Similarly, β-glucuronidase of intestinal bacteria in human and rats
Samples Percent inhibition IC50 ± SD (µg/mL)
Cr. MeOH-Ext 16
-
n-Hex-fr- 4 - CHL-fr-- 11 - EtOAc-fr- 3 -
BuOH-fr--- 6 -
Aq-fr 9 -
Rutin (Positive control) 96.2 26.4 ± 0.28

Chapter 3 Results and Discussion
151
are connected to colon cancer65. In addition to this β-glucuronidase of bacteria, which
are found in the biliary tract is also associated with gall stone formation189,190. As the
phytochemical analysis (Table 3.2) revealed the presence of steroidal glycosides,
flavonoids and saponins, which explain the moderate β-glucuronidase inhibitory
activity in the extract and fractions. Therefore the rhizomes of T. govanianum may
prove, to be effective in the treatment of various inflammatory disorders, prostate and
cervical cancer and also in the management of liver and colon cancer associated with
an increase activity of β-glucuronidase.
Table 3.26: IC50 values (µg/mL) of extract and fractions of T. govanianum rhizomes
and reference drug against β-glucuronidase
*Results are mean ± SEM of three independent experiments.
D-saccharic acid-1, 4-lactone was used as positive control.
Samples IC50± SD (µg/mL)
Cr. MeOH-Ext 140.8 ± 3.8
CHL-fr >200
EtOAc-fr >200
BuOH-fr 196.2 ± 1.9
D-saccharic acid-1, 4-lactone 46.7 ± 2.2

Chapter 3 Results and Discussion
152
3.5.1.12 α-Chymotrypsin inhibitory activity of Cr. MeOH-Ext and fractions
The Cr. MeOH-Ext and its subsequent fractions were screened for α-chymotrypsin
inhibition. The results (Table 3.27) indicated that none of the tested samples inhibited
the enzyme, therefore it is concluded that, this enzyme is not the pharmacological
target of T. govanianum rhizomes extract and fractions thereof.
Table 3.27: α-Chymotrypsin inhibitory activity of Cr. MeOH-Ext and fractions
*Chymostatin was used as positive control
3.5.1.13 Thymidine phosphorylase inhibitory activity of isolated compounds
The isolated pure compounds from T. govanianum rhizomes were screened for
thymidine phosphorylase inhibition, in order to check their affinity towards this
enzyme. The results of this assay (Table 3.28) revealed that all the tested compounds
were inactive, and none of them exhibit significant inhibition.
Thymidine phosphorylase, is an enzyme involved in the pyrimidine metabolism, is an
angiogenic factor that is over expressed in various cancerous conditions, in which it is
involved in angiogenesis, metastasis and cancer cell growth. It has been reported that
inhibitors of this enzyme suppresses tumor growth by increasing the percentage of
Test sample Concentration (µM) Inhibition (%)
Cr. MeOH-Ext 500 Inactive
n-Hex-fr 500 Inactive
CHL-fr 500 Inactive
EtOAc-fr 500 Inactive
BuOH-fr 500 Inactive
Aq-fr 500 Inactive
Chymostatin 125 98.4

Chapter 3 Results and Discussion
153
apoptotic cells and inhibiting angiogenesis191,192. As the compounds, did not show any
thymidine phosphorylase inhibitory activity, thus indicating that this enzyme is not
the pharmacological target of tested compounds.
Table 3.28: Thymidine phosphorylase inhibitory activity of isolated compounds
*7-Deazaxanthine was used as positive control.
3.5.1.14 Acetylcholinesterase inhibitory activity of Cr. MeOH-Ext and fractions
The Cr. MeOH-Ext and its subsequent fractions were screened for acetylcholineterase
(AChE) inhibition. The results indicated that the extract and fraction exhibited a weak
activity with maximum 19% inhibition in BuOH-fr at test concentration of 500 µg/mL
(Table 3.29). The Cr. MeOH-Ext showed 16% inhibition, and all other fractions were
found less active. The weak inhibition of the tested samples may be attributed to the
presence of steroids and steroidal glycosides as these secondary metabolites possess
AChE inhibitory activity193,194. Thus further confirmation is necessary to isolate
AChE enzyme inhibitory compounds.
Compounds Concentration (mM) Inhibition (%)
Borassoside E 0.5 Inactive
Pennogenin 0.5 Inactive
Diosgenin 0.5 Inactive
7-Deazaxanthine 0.5 99.0

Chapter 3 Results and Discussion
154
Table 3.29: Acetylcholineteras inhibitory activity of Cr. MeOH-Ext and fractions
Samples Concentration Percent inhibition
Cr. MeOH-Ext 250-µg/mL 11
500-µg/mL 16
n-Hex-fr
250-µg/mL -
500-µg/mL -
CHL-fr
250-µg/mL 8
500-µg/mL 11
EtOAc-fr
250-µg/mL 14
500-µg/mL 19
BuOH-fr
250-µg/mL 13
500-µg/mL 19
Aq-fr
250-µg/mL 6
500-µg/mL 10
Galanthamine (positive control)
100-µg/mL 66
200-µg/mL 78
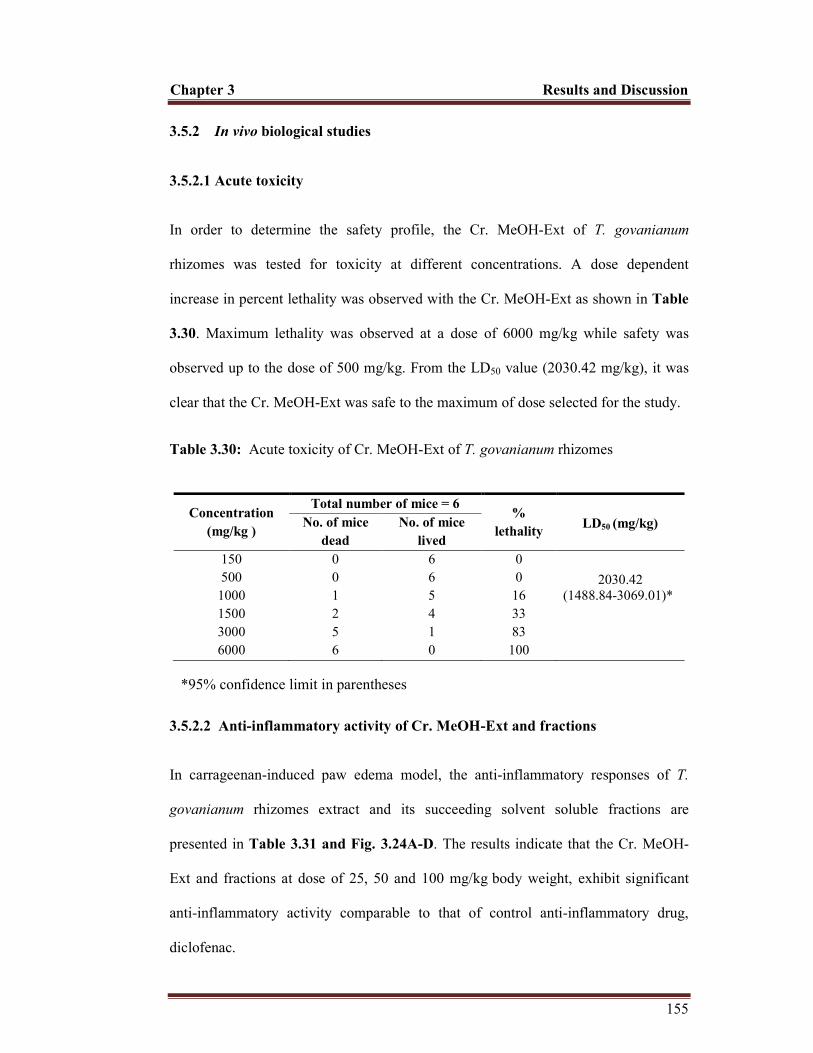
Chapter 3 Results and Discussion
155
3.5.2 In vivo biological studies
3.5.2.1 Acute toxicity
In order to determine the safety profile, the Cr. MeOH-Ext of T. govanianum
rhizomes was tested for toxicity at different concentrations. A dose dependent
increase in percent lethality was observed with the Cr. MeOH-Ext as shown in Table
3.30. Maximum lethality was observed at a dose of 6000 mg/kg while safety was
observed up to the dose of 500 mg/kg. From the LD50 value (2030.42 mg/kg), it was
clear that the Cr. MeOH-Ext was safe to the maximum of dose selected for the study.
Table 3.30: Acute toxicity of Cr. MeOH-Ext of T. govanianum rhizomes
Concentration
(mg/kg )
Total number of mice = 6 %
lethality LD50 (mg/kg) No. of mice
dead
No. of mice
lived
150 0 6 0
2030.42 (1488.84-3069.01)*
500 0 6 0 1000 1 5 16 1500 2 4 33 3000 5 1 83 6000 6 0 100
*95% confidence limit in parentheses
3.5.2.2 Anti-inflammatory activity of Cr. MeOH-Ext and fractions
In carrageenan-induced paw edema model, the anti-inflammatory responses of T.
govanianum rhizomes extract and its succeeding solvent soluble fractions are
presented in Table 3.31 and Fig. 3.24A-D. The results indicate that the Cr. MeOH-
Ext and fractions at dose of 25, 50 and 100 mg/kg body weight, exhibit significant
anti-inflammatory activity comparable to that of control anti-inflammatory drug,
diclofenac.

Chapter 3 Results and Discussion
156
The Cr. MeOH-Ext and its fractions at dose of 100 mg and 200 mg/kg showed an
anti-inflammatory potential, which became significant (P < 0.01) at second phase, 2 h
after the administration of carrageenan and was retained in the second phase with a
maximum percent inhibition of 64.67 ± 4.055a, 63.50 ± 0.500a, 47.50 ± 0.500 aand
72.67 ± 3.930a by Cr. MeOH-Ext, CHL-fr, EtOAc-fr and n-BuOH-fr, respectively.
The extract and its subsequent fractions showed a relatively weak activity in the early
phase of inflammation (0- 1.5 or 2 h). However, it was good in case of BuOH-fr at a
dose of 100 mg/kg.
Carrageenan-induced paw oedema is a valuable model to evaluate the involvement of
mediators concerned in vascular changes related with acute inflammation195. Within
first hour following carrageenan injection, oedema is induced by the release of
mediators i.e. histamine, bradykinin and 5-HT, but not by prostaglandins (PG). These
mediators, following activation of their receptors on endothelial cells, activate
constitutive nitric oxide synthase (cNOS) activation resulting in the production of
nitric oxide (NO). In mice following the intraplantar injection of carrageenan, TNF-
cx, IFN-y as well as cytokines such as IL-1 and IL-2 are produced196. COX-2 is also
induced within 2 h after carrageenan administration197. The NOS and COX pathways
appear to operate together to augment the inflammatory response. The dual inhibition
of PG and NO obtained with NOS inhibitors might be accounted for their marked
anti-inflammatory effect195.
Therefore, from our results we can conclude that the inhibitory effect of Cr. MeOH-
Ext and fractions on carrageenan induced edema inflammation could be due to the
dual inhibition of enzyme cyclo-oxygenase and later inhibition of prostaglandin

Chapter 3 Results and Discussion
157
synthesis. This significant in vivo anti-inflammatory effect of the tested samples were
also endorsed by the in vitro inhibition of ROS in oxidative burst assay (Table 3.20)
by all Cr. MeOH-Ext, subsequent fraction and isolated compounds. Furthermore, the
significant anti-inflammatory potential, particularly of Cr. MeOH-Ext and BuOH-fr
may be attributed to the presence of steroids and steroidal glycosides (saponins). In
phytochemical study of these samples we confirmed the presence of steroids and
saponins, which endorsed these anti-inflammatory findings. Furthermore, it is worthy
to note, that the significant anti-inflammatory, antinociceptive, and antipyretic
activities of plant extract are associated with steroids and saponins133,198-200.

Chapter 3 Results and Discussion
158
Table 3.31: Anti-inflammatory activity Cr. MeOH-Ext and fractions of T. govanianum rhizomes against carrageenan induced
paw edema in mice
Percent inhibition is expressed as mean ± SEM. a = P< 0.001, b = P< 0.01, c = P< 0.05 compared to control
Sample Dose
(mg/kg)
Inhibition (%)
1sth 2
ndh 3
rdh 4
thh 5
thh
Diclofenac 10 27.33 ± 2.7a 47.67 ± 0.8a 67.00 ± 2.5a 70.67 ± 0.6a 74.33 ± 0.6a
Cr. MeOH-Ext
50 8.00 ± 1.7c 18.00 ± 1.7b 22.63 ± 2.3a 32.00 ± 5.2a 34.00 ± 5.2a
100 12.00 ± 1.1b 44.33 ± 4.6a 65.00 ± 4.6a 63.67 ± 1.7a 66.33 ± 4.6a
200 19.00 ± 2.3b 44.67 ± 3.8a 62.67 ± 3.7a 62.67 ± 1.4a 64.67 ± 4.0a
CHL-fr
25 4.00 ± 1.0 8.50 ± 0.5c 21.35 ± 3.5b 35.00 ± 1.0a 42.50 ± 2.5a
50 4.03 ± 2.0b 18.80 ± 1.0b 20.30 ± 2.0b 43.00 ± 1.0a 58.00 ± 1.0a
100 12.12 ± 3.0c 21.50 ± 0.5b 43.50 ± 3.5a 45.00 ± 1.0a 63.50 ± 0.5a
EtOAc-fr
25 3.500 ± 0.5 9.500 ± 0.5c 18.00 ± 3.0b 18.50 ± 1.5b 39.50 ± 0.5a
50 10.50 ± 0.5c 16.00 ± 1.0b 29.50 ± 0.5a 30.50 ± 2.5a 44.50 ± 3.5a
100 9.500 ± 0.5c 22.50 ± 1.5b 30.50 ± 0.5a 33.00 ± 2.0a 47.50 ± 0.5a
BuOH-fr
25 12.94 ± 3.7c 14.33 ± 5.5b 35..25 ± 1.0a 58.00 ± 1.5a 61.00 ± 3.4a
50 18.80 ± 3.4a 46.67 ± 4.9a 68.67 ± 2.3a 66.00 ± 1.7a 69.00 ± 4.3a
100 25.67 ± 1.7a 47.67 ± 2.1a 68.67 ± 1.4a 70.33 ± 2.6a 72.67 ± 3.9a

Chapter 3 Results and Discussion
159
Figure 3.24A: Anti-inflammatory effect of Cr. MeOH-Ext on carrageenan induced
paw edema. a = P< 0.001, b = P< 0.01, c = P< 0.05 compared to control.
Figure 3.24B: Anti-inflammatory effect of CHL-fr on carrageenan induced paw
edema. a = P< 0.001, b = P< 0.01, c = P< 0.05 compared to control.

Chapter 3 Results and Discussion
160
Figure 3.24C: Anti-inflammatory effect of EtOAc-fr on carrageenan induced paw
edema. a = P< 0.001, b = P< 0.01, c = P< 0.05 compared to control.
Figure 3.24D: Anti-inflammatory effect of BuOH-fr on carrageenan induced paw
edema. a = P< 0.001, b = P< 0.01, c = P< 0.05 compared to control.
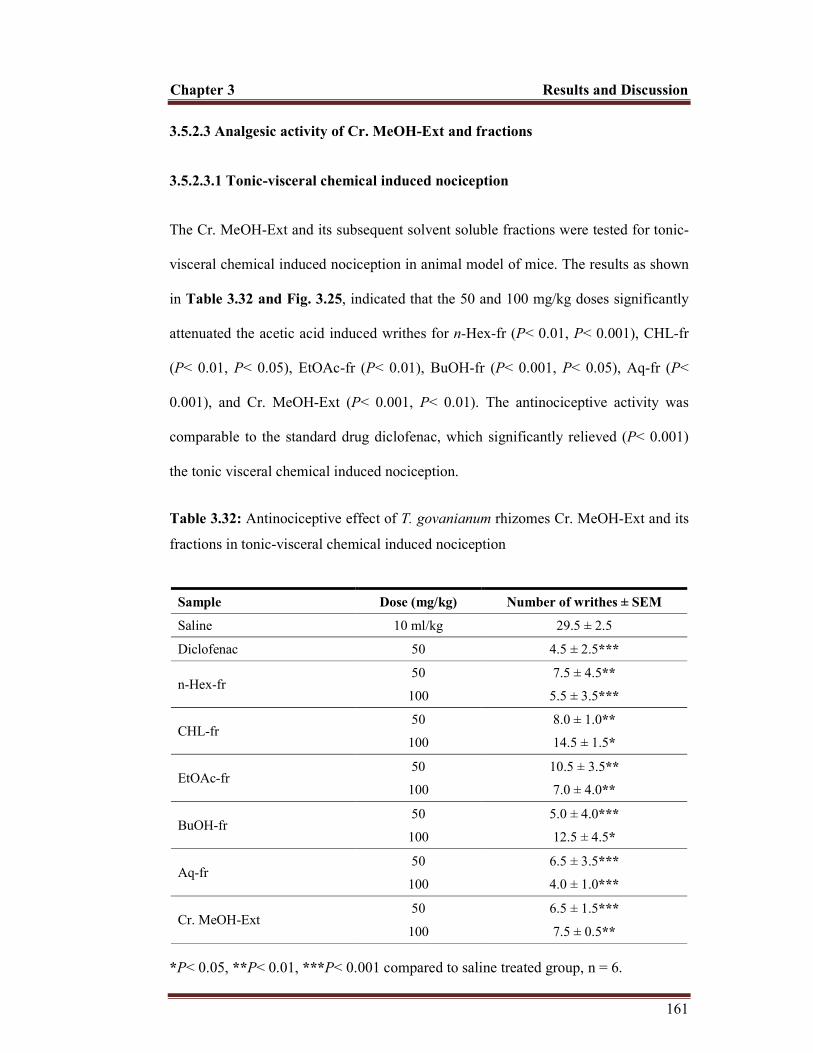
Chapter 3 Results and Discussion
161
3.5.2.3 Analgesic activity of Cr. MeOH-Ext and fractions
3.5.2.3.1 Tonic-visceral chemical induced nociception
The Cr. MeOH-Ext and its subsequent solvent soluble fractions were tested for tonic-
visceral chemical induced nociception in animal model of mice. The results as shown
in Table 3.32 and Fig. 3.25, indicated that the 50 and 100 mg/kg doses significantly
attenuated the acetic acid induced writhes for n-Hex-fr (P< 0.01, P< 0.001), CHL-fr
(P< 0.01, P< 0.05), EtOAc-fr (P< 0.01), BuOH-fr (P< 0.001, P< 0.05), Aq-fr (P<
0.001), and Cr. MeOH-Ext (P< 0.001, P< 0.01). The antinociceptive activity was
comparable to the standard drug diclofenac, which significantly relieved (P< 0.001)
the tonic visceral chemical induced nociception.
Table 3.32: Antinociceptive effect of T. govanianum rhizomes Cr. MeOH-Ext and its
fractions in tonic-visceral chemical induced nociception
Sample Dose (mg/kg) Number of writhes ± SEM
Saline 10 ml/kg 29.5 ± 2.5
Diclofenac 50 4.5 ± 2.5***
n-Hex-fr 50 7.5 ± 4.5**
100 5.5 ± 3.5***
CHL-fr 50 8.0 ± 1.0**
100 14.5 ± 1.5*
EtOAc-fr 50 10.5 ± 3.5**
100 7.0 ± 4.0**
BuOH-fr 50 5.0 ± 4.0***
100 12.5 ± 4.5*
Aq-fr 50 6.5 ± 3.5***
100 4.0 ± 1.0***
Cr. MeOH-Ext 50 6.5 ± 1.5***
100 7.5 ± 0.5**
*P< 0.05, **P< 0.01, ***P< 0.001 compared to saline treated group, n = 6.
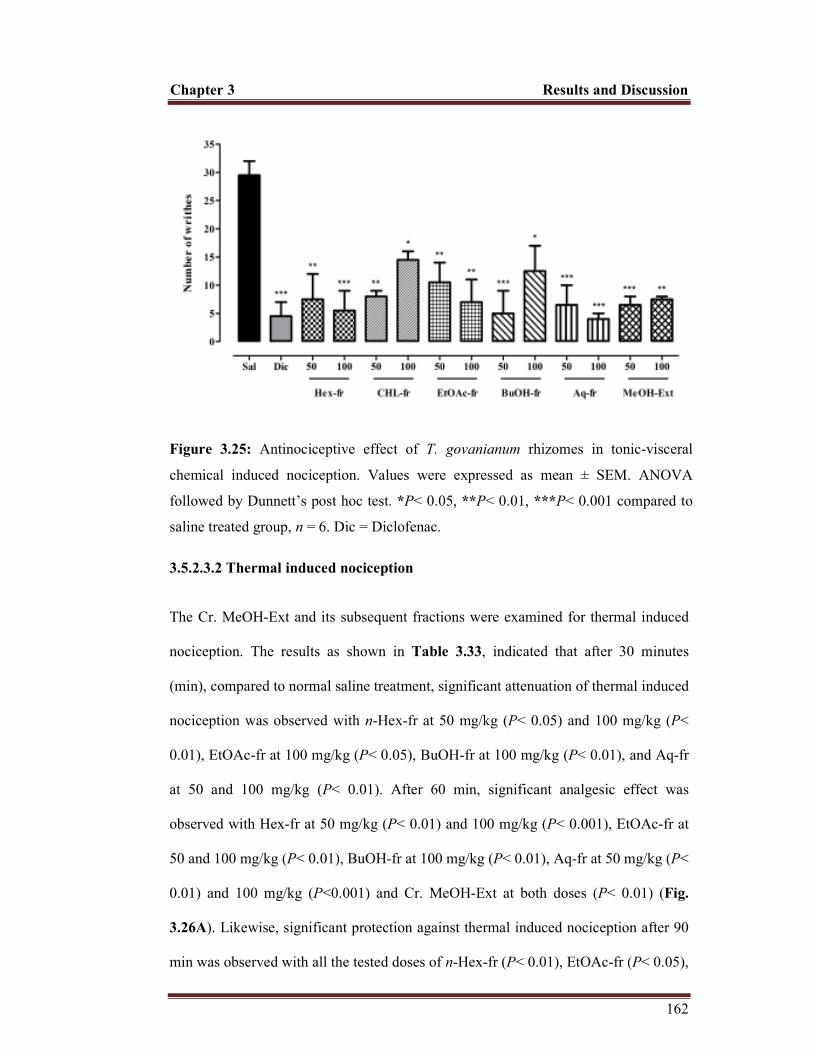
Chapter 3 Results and Discussion
162
Figure 3.25: Antinociceptive effect of T. govanianum rhizomes in tonic-visceral
chemical induced nociception. Values were expressed as mean ± SEM. ANOVA
followed by Dunnett’s post hoc test. *P< 0.05, **P< 0.01, ***P< 0.001 compared to
saline treated group, n = 6. Dic = Diclofenac.
3.5.2.3.2 Thermal induced nociception
The Cr. MeOH-Ext and its subsequent fractions were examined for thermal induced
nociception. The results as shown in Table 3.33, indicated that after 30 minutes
(min), compared to normal saline treatment, significant attenuation of thermal induced
nociception was observed with n-Hex-fr at 50 mg/kg (P< 0.05) and 100 mg/kg (P<
0.01), EtOAc-fr at 100 mg/kg (P< 0.05), BuOH-fr at 100 mg/kg (P< 0.01), and Aq-fr
at 50 and 100 mg/kg (P< 0.01). After 60 min, significant analgesic effect was
observed with Hex-fr at 50 mg/kg (P< 0.01) and 100 mg/kg (P< 0.001), EtOAc-fr at
50 and 100 mg/kg (P< 0.01), BuOH-fr at 100 mg/kg (P< 0.01), Aq-fr at 50 mg/kg (P<
0.01) and 100 mg/kg (P<0.001) and Cr. MeOH-Ext at both doses (P< 0.01) (Fig.
3.26A). Likewise, significant protection against thermal induced nociception after 90
min was observed with all the tested doses of n-Hex-fr (P< 0.01), EtOAc-fr (P< 0.05),
Chapter 3 Results and Discussion
163
Aq-fr (P< 0.05) as well as with100 mg/kg dose of BuOH-fr (P< 0.05) and Cr. MeOH-
Ext (P< 0.01) (Fig. 3.26C). Moreover, the analgesia produced after 120 min was
significant for all the tested doses of n-Hex-fr (P< 0.01), EtOAc-fr (P< 0.05, P< 0.01)
and Aq-fr (P< 0.01), and for only the 100 mg/kg dose of BuOH-fr (P< 0.01) and Cr.
MeOH-Ext (P< 0.05) (Fig. 3.26D).
For evaluating the analgesic potential of drugs, hot plate test is one of the most
common tests used. The mice paws are very sensitive to heat at temperatures, not that
high to damage the skin. The mice responses to heat are jumping, licking or
withdrawal the paws. These responses take prolonged time after administration of
centrally acting analgesic drugs. Thus, the hot plate test model measures the different
response to acute nociceptive or non-inflammatory inputs and is one of the models
normally used for studying central antinociceptive activity201.
In the tonic visceral chemical induced nociception model, the injection of acetic acid
into the peritoneal cavity of mice induces, contraction tracked by extension of the
hind limbs called writhing. This visceral pain model is simple, reliable and rapid for
investigation of peripheral analgesics. In our findings, the significant inhibition of
writhing by extract and fractions suggested peripherally mediated analgesic activity
which is based on the connection of the model with stimulation of peripheral
receptors especially the local peritoneal receptors at the surface of cells lining the
peritoneal cavity202.
The chemical constituent's analyses of T. govanianum rhizomes showed that it is
saponin rich part, and from its fractions (chloroform and butanol) steroids and
saponins have also been isolated in this study. It has been reported in the literature
that saponins are the major chemical constituents in medicinal preparations

Chapter 3 Results and Discussion
164
responsible for most of the anti-inflammatory and analgesic activities. Recent reports
indicate that most saponins can suppress the expression of iNOS and COX-2, thus
resulted in a noticeable lowering of prostaglandin E2 levels203,204. Thus, the findings of
this study are further endorsed by the reported literature.
In conclusion, T. govanianum rhizomes Cr. MeOH-fr and fractions exhibit significant
peripheral and central antinociceptive activities, which support the traditional
analgesic uses of this plant species.

Chapter 3 Results and Discussion
165
Table 3.33: Antinociceptive effect of Cr. MeOH-Ext and fractions of T. govanianum rhizomes in thermal induced nociception
Sample Dose (mg/kg) 30 min 60 min 90 min 120 min
Saline 10 ml/kg 13.3 ± 0.4 13.3 ± 0.5 13.0 ± 1.0 13.6 ± 0.3
Tramadol 30 29.0 ± 1.0*** 28.3 ± 1.7*** 28.4 ± 1.4** 26.0 ± 1.0**
n-Hex-fr 50 23.4 ± 0.7* 25.6 ± 2.3** 29.0 ± 1.0** 26.4 ± 2.1**
100 25.3 ± 0.8** 25.8 ± 1.1*** 29.7 ± 0.2** 25.3 ± 1.6**
CHL-fr 50 17.2 ± 1.5 21.4 ± 1.4 22.6 ± 2.0 20.3 ± 0.4
100 20.3 ± 2.1 19.3 ± 0.1 16.9 ± 2.8 19.0 ± 1.9
EtOAc-fr 50 17.5 ± 0.9 24.3 ± 2.6** 24.2 ± 1.1* 23.9 ± 3.3*
100 22.2 ± 0.1* 23.0 ± 0.9** 23.7 ± 0.6* 25.6 ± 2.5**
BuOH-fr 50 13.7 ± 1.9 18.1 ± 0.6 18.2 ± 4.4 18.2 ± 0.1
100 27.5 ± 1.3** 23.4 ± 0.5** 25.8 ± 4.2* 25.4 ± 2.5**
Aq-fr 50 24.6 ± 3.2** 25.6 ± 2.8** 23.6 ± 0.6* 25.0 ± 0.1**
100 24.8 ± 2.0** 27.1 ± 2.9*** 25.8 ± 1.4* 24.2 ± 1.3**
Cr. MeOH-Ext 50 18.7 ± 3.9 23.9 ± 0.1** 18.4 ± 0.5 16.7 ± 1.0
100 21.3 ± 2.5 25.2 ± 1.2** 26.6 ± 3.4** 22.9 ± 2.7*
Values expressed as mean ± SEM. *P< 0.05, **P< 0.01, ***P< 0.001 compared to saline treated group, n = 6

Chapter 3 Results and Discussion
166
Figure 3.26A: Antinociceptive effect of Cr. MeOH-Ext and fractions after 30 min
* = P< 0.05, ** = P< 0.01, *** = P< 0.001 compared to control.
Figure 3.26B: Antinociceptive effect of Cr. MeOH-Ext and fractions after 60 min
* = P< 0.05, ** = P< 0.01, *** = P< 0.001 compared to control.
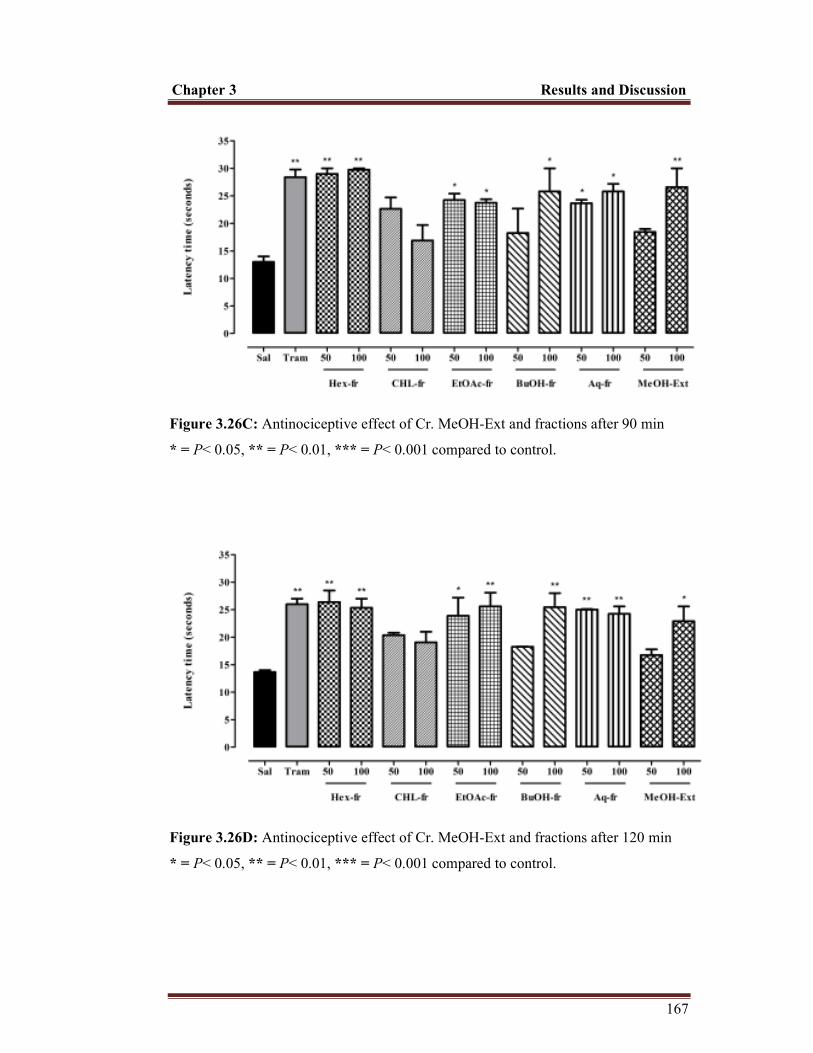
Chapter 3 Results and Discussion
167
Figure 3.26C: Antinociceptive effect of Cr. MeOH-Ext and fractions after 90 min
* = P< 0.05, ** = P< 0.01, *** = P< 0.001 compared to control.
Figure 3.26D: Antinociceptive effect of Cr. MeOH-Ext and fractions after 120 min
* = P< 0.05, ** = P< 0.01, *** = P< 0.001 compared to control.

Conclusion
168
Concluding Remarks
Trillium govanianum is an indigenous medicinal herb of Pakistan. The rhizome of this
plant species is used as crude drug in Indo-Pak to cure different ailments. From this
Ph.D. work/project, which is based on ethno-medicinal, phytochemical and biological
investigations of crude drug “rhizomes” we concluded that;
� The rhizomes of T. govanianum are rich source of compounds like steroids,
glycosides and steroidal glycosides (saponins). It also contains trihydroxy fatty
acids and phytoecdysteroids.
� The presence of these phytochemicals and biological testing of crude extract
and its sub-fractions, the crude drug rhizomes validated and proved the
reported folkloric ethnomedicinal uses scientifically.
� The rhizomes of this plant species can be effectively used in the treatment of
cancers, inflammatory disorders, algesia, diarrhoea, abdominal cramps,
bacterial and fungal infections.
� It is recommended that the concerned authorities and Government prepare
conservation strategy to safeguard this valuable asset (T. govanianum herb) of
this region.
Further detail phytochemical and biological studies are required, as the rhizomes of
this plant species possesses great potential for discovery of new lead compounds,
effective in the treatment and management of cancers, inflammatory disorders and
infectious diseases.

References
169
References
(1) Munuswamy, H.; Thirunavukkarasu, T.; Rajamani, S.; Elumalai, E. K.; Ernest, D. Journal of Acute Disease 2013, 2, 99.
(2) Veeresham, C. Journal of Advanced Pharmaceutical Technology Research 2012, 3, 200.
(3) Khan, I. A.; Abourashed, E. A. Leung's Encyclopedia of Common Natural
Ingredients; Used in Food, Drugs and Cosmetics, Third ed, John Wiley and Sons 2009, 183.
(4) Cragg, G. M. Puerto Rico Health Sciences Journal 2002, 21, 97.
(5) Petrovska, B. B. Pharmacognosy Reviews 2012, 6, 1.
(6) Lewington, A. Traffic International, Cambridge, UK 1993.
(7) Cragg, G. M.; Newman, D. J. Pharmaceutical Biology 2001, 39, 8.
(8) Hamayun, M.; Khan, M. A.; Begum, S. Ethnobotanical Leaflets 2003, 2003, 13.
(9) Gurib-Fakim, A. Molecular Aspects of Medicine 2006, 27, 1.
(10) Fowler, M. W. Journal of the Science of Food and Agriculture 2006, 86, 1797.
(11) Kadir, M. F.; Sayeed, M. S. B.; Mia, M. Journal of Ethnopharmacology 2013, 147, 148.
(12) Mazid, M.; Khan, T.; Mohammad, F. Biology and Medicine 2011, 3, 232.
(13) Martin-Smith, M.; Khatoon, T. In Progress in Drug Research/Progrès des
Recherches Pharmaceutiques, Springer: 1963, 279.
(14) Ukoha, P. O.; Cemaluk, E. A.; Nnamdi, O. L.; Madus, E. P. African Journal of
Pure and Applied Chemistry 2011, 5, 237.
(15) Kumar, S.; Pandey, A. K. The Scientific World Journal 2013, 2013. http://dx.doi.org/10.1155/2013/162750.
(16) Shibata, S. In New Natural Products and Plant Drugs with Pharmacological,
Biological or Therapeutical Activity, Springer: 1977, 177.
(17) Yassin, N.; Melek, F.; Selim, M.; Kassem, I. Der Pharmacia Lettre 2013, 5, 247.

References
170
(18) Yan, L.; Zhang, Y.; Gao, W.; Man, S.; Wang, Y. Experimental Oncology 2009, 31, 27.
(19) Barbosa Filho, J. M.; Piuvezam, M. R.; Moura, M. D.; Silva, M. S.; Lima, K. V. B.; da Cunha, E. V. L.; Fechine, I. M.; Takemura, O. S. Revista Brasileira
de Farmacognosia 2006, 16, 109.
(20) Singh, A.; Duggal, S.; Kaur, N.; Singh, J. Journal of Natural Products 2010, 3, 64.
(21) Patwardhan, B.; Partwardhan, A. World Health Organization; 2005, 1-172.
(22) Fabricant, D. S.; Farnsworth, N. R. Environmental Health Perspectives 2001, 109, 69.
(23) Patwardhan, B.; Warude, D.; Pushpangadan, P.; Bhatt, N. Evidence Based
Complementary and Alternative Medicine 2005, 2, 465.
(24) Gupta, S. Indian Journal of Pharmacology 1994, 26, 1.
(25) Khan, H.; Tariq, S. A.; Khan, M. A. Journal of Medicinal Plants Research 2011, 5, 7031.
(26) Adonizio, A.; Leal, S. M.; Ausubel, F. M.; Mathee, K. Journal of Medical
Microbiology 2008, 57, 809.
(27) Farnsworth, N. R.; Akerele, O.; Bingel, A. S.; Soejarto, D. D.; Guo, Z. Bulletin of the World Health Organization 1985, 63, 965.
(28) Harvey, A. L. Drug Discovery Today 2008, 13, 894.
(29) Shadma Wahab, A. H. International Journal of Pharmaceutical and Chemical
Sciences 2013, 2, 1462.
(30) Leslie, C. M. Asian Medical Systems, A Comparative Study; Motilal Banarsidass Publishe, 1998, 3.
(31) Ali, S. I.; Qaiser, M. Proceedings of the Royal Society of Edinburgh. Section
B. Biological Sciences 1986, 89, 91.
(32) Bhardwaj, S.; Gakhar, S. Indian Journal of Traditional Knowledge 2005, 4, 75.
(33) Reveal, J. L. Taxon 1998, 851.
(34) Zomlefer, W. B. Harvard Papers in Botany 1996, 91.

References
171
(35) Tamura, M. In Flowering Plants· Monocotyledons; Springer, 1998, 444.
(36) Farmer, S. B.; Schilling, E. E. Systematic Botany 2002, 27, 674.
(37) Osaloo, S. K.; Utech, F. H.; Ohara, M.; Kawano, S. Journal of Plant Research 1999, 112, 35.
(38) Wang, J.; Zou, K.; Zhang, Y.; Liu, C.; Wu, J.; Zhou, Y.; Dan, F.; Zhang, Y. Chemical & Pharmaceutical Bulletin 2007, 55, 679.
(39) Ur Rahman, S.; Ismail, M.; Shah, M. R.; Iriti, M.; Shahid, M. Bangladesh
Journal of Pharmacology 2015, 10, 577.
(40) Nasir, E.; Ali, S. Flora of Pakistan 1970.
(41) Torrey, J.; Gray, A. A Flora of North America; Hafner Pub. Co. 1969, 2.
(42) Zhengyi, W.; Raven, P. H.; Deyuan, H. Flora of China, Menispermaceae
through Capparaceae; Science Press, 2008, 7.
(43) Hayes, P. Y.; Lehmann, R.; Penman, K.; Kitching, W.; De Voss, J. J. Phytochemistry 2009, 70, 105.
(44) Yokosuka, A.; Mimaki, Y. Phytochemistry 2008, 69, 2724.
(45) Yoshitama, K.; Oyamada, T.; Yahara, S. Journal of Plant Research 1997, 110, 379.
(46) Hufford, C. D.; Liu, S.; Clark, A. M. Journal of Natural Products 1988, 51, 94.
(47) Zhang, Y.; Yin, F.; Hu, L. Heterocycles 2005, 65, 1197.
(48) Ono, M.; Takamura, C.; Sugita, F.; Masuoka, C.; Yoshimitsu, H.; Ikeda, T.; Nohara, T. Chemical & Pharmaceutical Bulletin 2007, 55, 551.
(49) Nohara, T.; Miyahara, K.; Kawasaki, T. Chemical & Pharmaceutical
Bulletin 1975, 872.
(50) Mahato, S. B.; Sahu, N. P.; Ganguly, A. N. Phytochemistry 1981, 20, 1943.
(51) Mimaki, Y.; Kuroda, M.; Obata, Y.; Sashida, Y.; Kitahara, M.; Yasuda, A.; Naoi, N.; Xu, Z. W.; Li, M. R.; Lao, A. N. Natural Product Letters 2000, 14, 357.
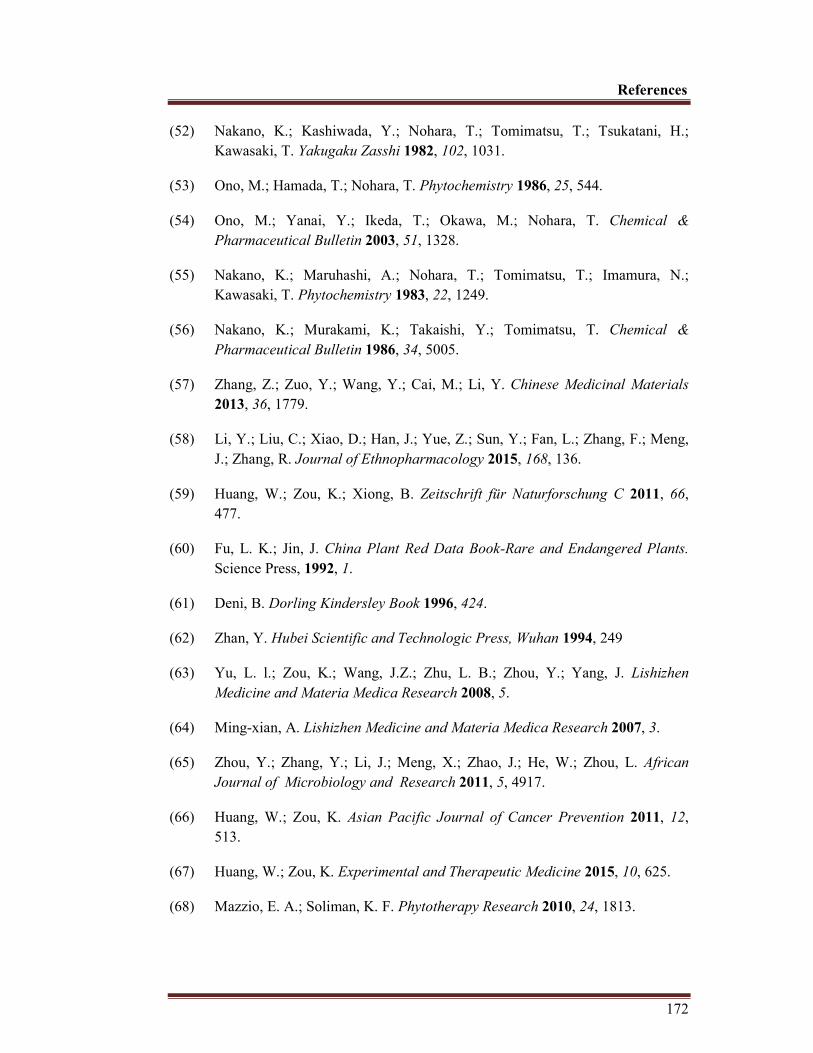
References
172
(52) Nakano, K.; Kashiwada, Y.; Nohara, T.; Tomimatsu, T.; Tsukatani, H.; Kawasaki, T. Yakugaku Zasshi 1982, 102, 1031.
(53) Ono, M.; Hamada, T.; Nohara, T. Phytochemistry 1986, 25, 544.
(54) Ono, M.; Yanai, Y.; Ikeda, T.; Okawa, M.; Nohara, T. Chemical &
Pharmaceutical Bulletin 2003, 51, 1328.
(55) Nakano, K.; Maruhashi, A.; Nohara, T.; Tomimatsu, T.; Imamura, N.; Kawasaki, T. Phytochemistry 1983, 22, 1249.
(56) Nakano, K.; Murakami, K.; Takaishi, Y.; Tomimatsu, T. Chemical &
Pharmaceutical Bulletin 1986, 34, 5005.
(57) Zhang, Z.; Zuo, Y.; Wang, Y.; Cai, M.; Li, Y. Chinese Medicinal Materials 2013, 36, 1779.
(58) Li, Y.; Liu, C.; Xiao, D.; Han, J.; Yue, Z.; Sun, Y.; Fan, L.; Zhang, F.; Meng, J.; Zhang, R. Journal of Ethnopharmacology 2015, 168, 136.
(59) Huang, W.; Zou, K.; Xiong, B. Zeitschrift für Naturforschung C 2011, 66, 477.
(60) Fu, L. K.; Jin, J. China Plant Red Data Book-Rare and Endangered Plants.
Science Press, 1992, 1.
(61) Deni, B. Dorling Kindersley Book 1996, 424.
(62) Zhan, Y. Hubei Scientific and Technologic Press, Wuhan 1994, 249
(63) Yu, L. l.; Zou, K.; Wang, J.Z.; Zhu, L. B.; Zhou, Y.; Yang, J. Lishizhen
Medicine and Materia Medica Research 2008, 5.
(64) Ming-xian, A. Lishizhen Medicine and Materia Medica Research 2007, 3.
(65) Zhou, Y.; Zhang, Y.; Li, J.; Meng, X.; Zhao, J.; He, W.; Zhou, L. African
Journal of Microbiology and Research 2011, 5, 4917.
(66) Huang, W.; Zou, K. Asian Pacific Journal of Cancer Prevention 2011, 12, 513.
(67) Huang, W.; Zou, K. Experimental and Therapeutic Medicine 2015, 10, 625.
(68) Mazzio, E. A.; Soliman, K. F. Phytotherapy Research 2010, 24, 1813.

References
173
(69) Wang, H.; Zhai, Z.; Li, N.; Jin, H.; Chen, J.; Yuan, S.; Wang, L.; Zhang, J.; Li, Y.; Yun, J. Phytomedicine 2013, 20, 985.
(70) Liya, H. Journal of Hubei Institute for Nationalities (Medical Edition) 2006, 2, 5.
(71) Rani, S.; Rana, J.; Rana, P. Journal of Medicinal Plants Research 2013, 7, 3147.
(72) Mahmood, A.; Mahmood, A.; Malik, R. N. Journal of Ethnopharmacology 2012, 143, 338.
(73) Shah, A.; Bharati, K. A.; Ahmad, J.; Sharma, M. Journal of
Ethnopharmacology 2015, 166, 119.
(74) Lone, P.; Bhardwaj, A.; Bahar, F. International Journal of Recent Science and
Research 2013, 4, 1755.
(75) Faizi, S.; Sumbul, S.; Versiani, M. A.; Saleem, R.; Sana, A.; Siddiqui, H. Asian Pacific Journal of Tropical Biomedicine 2014, 4, 650.
(76) Evans, W. C. Trease and Evans' Pharmacognosy; Elsevier Health Sciences, 2009.
(77) Bruni, A.; Ballero, M.; Poli, F. Journal of Ethnopharmacology 1997, 57, 97.
(78) Muhammad, N.; Saeed, M. African Journal of Pharmacy and Pharmacology 2011, 5, 2323.
(79) Khan, H.; Ali Khan, M.; Hussan, I. Journal of Enzyme Inhibition and
Medicinal Chemistry 2007, 22, 722.
(80) Akcin, T. A.; Ulu, S.; Akcin, A. Pakistan Journal of Botany 2010, 42, 2231.
(81) Shome, U.; Joshi, P.; Sharma, H. Proceedings: Plant Sciences 1984, 93, 151.
(82) Jain, S.; Argal, A. Asian Journal of Plant Science and Research 2013, 3, 126.
(83) Ismail, M.; Muhammad, N.; Mohani, N.; Khan, M. A.; Hussain, J. Journal of
Medicinal Plants Research 2011, 5, 3891.
(84) Siddiqui, A. A.; Ali, M. Ist Edition. CBS Publishers and distributors, New
Delhi 1997, 126.
(85) Sofowora, A. Medicinal plants and traditional medicine in Africa; John Wiley and Sons Ltd., 1982.
References
174
(86) Musa, Y.; Haruna, A.; Ilyas, M.; Yaro, A.; Ahmadu, A.; Usman, H. African
Journal of Traditional, Complementary and Alternative Medicines 2008, 5, 92.
(87) Edeoga, H.; Okwu, D.; Mbaebie, B. African Journal of Biotechnology 2005, 4, 685.
(88) Khan, H.; Saeed, M.; Khan, M. A.; Khan, I.; Ahmad, M.; Muhammad, N.; Khan, A. Medicinal Chemistry Research 2012, 21, 1278.
(89) Khan, H.; Ali Khan, M.; Mahmood, T.; Choudhary, M. Journal of Enzyme
Inhibition and Medicinal Chemistry 2008, 23, 855.
(90) Yang, C.-R.; Zhang, Y.; Jacob, M. R.; Khan, S. I.; Zhang, Y.-J.; Li, X.-C. Antimicrobial Agents and Chemotherapy 2006, 50, 1710.
(91) Lue, B.M.; Nielsen, N. S.; Jacobsen, C.; Hellgren, L.; Guo, Z.; Xu, X. Food
Chemistry 2010, 123, 221.
(92) Baydoun, E.; Bibi, M.; Iqbal, M. A.; Wahab, A. T.; Farran, D.; Smith, C.; Sattar, S. A.; Rahman, A. U.; Choudhary, M. I. Chemistry Central Journal 2013, 7, 57.
(93) Mosmann, T. Journal of Immunological Methods 1983, 65, 55.
(94) Helfand, S. L.; Werkmeister, J.; Roder, J. C. The Journal of Experimental
Medicine 1982, 156, 492.
(95) Saeed, M.; Khan, H.; Khan, M. A.; Simjee, S. U.; Muhammad, N.; Khan, S. A. African Journal of Biotechnology 2010, 9.
(96) Atta-ur-Rahman; Choudhary, M. I.; Thomsen, W. J. Bioassay Techniques for
Drug Development; Harwood Academic Publishers, The Netherlands, 2001, 16.
(97) Qayum, M.; Nisar, M.; Shah, M. R.; Zia-Ul-Haq, M.; Kaleem, W. A.; Marwat, I. K. Pakistan Journal of Botany 2012, 44, 355.
(98) Rashid, R.; Farah, M.; Mirza, M. Pakistan Journal of Botany 2009, 41, 1453.
(99) Rahbar, S.; Figarola, J. L. Archives of Biochemistry and Biophysics 2003, 419, 63.
(100) Choudhary, M. I.; Adhikari, A.; Rasheed, S.; Marasini, B. P.; Hussain, N.; Kaleem, W. A. Phytochemistry Letters 2011, 4, 404.

References
175
(101) Khan, A.; AlKharfy, K. M.; Gilani, A.-H. Bangladesh Journal of
Pharmacology 2011, 6, 111.
(102) Collins, R.; Ng, T.; Fong, W.; Wan, C.; Yeung, H. IUBMB Life 1997, 42, 1163.
(103) Uddin, N.; Siddiqui, B. S.; Begum, S.; Ali, M. I.; Marasini, B. P.; Khan, A.; Choudhary, M. I. Fitoterapia 2013, 84, 202.
(104) Khan, K. M.; Ambreen, N.; Hussain, S.; Perveen, S.; Choudhary, M. I. Bioorganic & Medicinal Chemistry 2009, 17, 2983.
(105) Ingkaninan, K.; Temkitthawon, P.; Chuenchom, K.; Yuyaem, T.; Thongnoi, W. Journal of Ethnopharmacology 2003, 89, 261.
(106) Ayaz, M.; Junaid, M.; Ahmed, J.; Ullah, F.; Sadiq, A.; Ahmad, S.; Imran, M. BMC Complementary and Alternative Medicine 2014, 14, 145.
(107) Khan, H.; Saeed, M.; Khan, M. A.; Dar, A.; Khan, I. Journal of
Ethnopharmacology 2010, 127, 521.
(108) Muhammad, N.; Saeed, M.; Khan, H. BMC Complementary and Alternative
Medicine 2012, 12, 59.
(109) Khan, I.; Nisar, M.; Ebad, F.; Nadeem, S.; Saeed, M.; Khan, H.; Khuda, F.; Karim, N.; Ahmad, Z. Journal of Ethnopharmacology 2009, 121, 175.
(110) Collier, H.; Dinneen, L.; Johnson, C. A.; Schneider, C. British Journal of
Pharmacology and Chemotherapy 1968, 32, 295.
(111) Ocallaghan, J. P.; Holtzman, S. G. J. Pharmacol. Exp. Ther. 1975, 192, 497.
(112) Lone, P. A.; Bhardwaj, A. K.; Shah, K. W.; Tabasum, S. Journal of Medicinal
Plants Research 2014, 8, 1362.
(113) Sharma, P.; Samant, S. Asian Journal of Advance Basic Science 2014, 2, 77.
(114) Bhardwaj, A. K.; Lone, P. A.; Dar, M.; Parray, J. A.; Shah, K. W. International Journal of Traditional Natural Medicine 2013, 2, 164.
(115) Lone, P. A.; Bhardwaj, A. K.; Bahar, F. A. International Journal of Pharma
and Bio Science 2013, 4, 440.
(116) Martin, G. J. Champa and Hall. London 1995.
(117) Qureshi, R.; Ghufran, M. Pakistan Rose Annual 2005, 24.
References
176
(118) Kumar, S.; Kumar, V.; Prakash, O. Asian Pacific Journal of Tropical
Biomedicine 2011, 1, 337.
(119) Thomas, S.; Patil, D.; Patil, A.; Chandra, N. Journal of Herb Medical
Toxicology 2008, 2, 51.
(120) Chai, J.; Song, X.; Wang, X.; Mei, Q.; Li, Z.; Cui, J.; Tang, Z.; Yue, Z. Phytochemistry Letters 2014, 10, 113.
(121) Abbasi, A. M.; Khan, M. A.; Ahmad, M.; Qureshi, R.; Arshad, M.; Jahan, S.; Zafar, M.; Sultana, S. Pakistan Journal of Botany 2010, 6, 3747.
(122) Ososki, A. L.; Lohr, P.; Reiff, M.; Balick, M. J.; Kronenberg, F.; Fugh Berman, A.; O'Connor, B. Journal of Ethnopharmacology 2002, 79, 285.
(123) Ullah, M.; Khan, M. U.; Mahmood, A.; Malik, R. N.; Hussain, M.; Wazir, S. M.; Daud, M.; Shinwari, Z. K. Journal of Ethnopharmacology 2013, 150, 918.
(124) Hou, C. T. Asian Pacific Journal of Clinical Nutrition 2008, 17, 192.
(125) Xu, Q. M.; Liu, Y. L.; Li, X. R.; Li, X.; Yang, S. L. Natural Product Research 2011, 25, 640.
(126) Chen, C. Y.; Chang, F. R.; Teng, C. M.; Wu, Y. C. Journal of the Chinese
Chemical Society 1999, 46, 77.
(127) Liao, Y.-H.; Houghton, P. J.; Hoult, J. Journal of Natural Products 1999, 62, 1241.
(128) Kamboj, A.; Saluja, A. K. International Journal of Pharmacy and
Pharmaceutical Science 2011, 3, 94.
(129) Agrawal, P.; Jain, D.; Gupta, R.; Thakur, R. Phytochemistry 1985, 24, 2479.
(130) Han, X.; Yu, H.; Liu, X.; Bao, X.; Yu, B.; Li, C.; Hui, Y. Magnetic Resonance
in Chemistry 1999, 37, 140.
(131) Pazhanichamy, K.; Bhuvaneswari, K.; Kunthavai, B.; Eevera, T.; Rajendran, K. JPC-Journal of Planar Chromatography Modern TLC 2012, 25, 566.
(132) Tapondjou, L. A.; Ponou, K. B.; Teponno, R. B.; Mbiantcha, M.; Djoukeng, J. D.; Nguelefack, T. B.; Watcho, P.; Cadenas, A. G.; Park, H. J. Archives of
Pharmacal Research 2008, 31, 653.
(133) Gao, J. M.; Wang, C.Y.; Zhang, A. L.; Liu, J. K. Lipids 2001, 36, 1365.

References
177
(134) Takemoto, T.; Hikino, Y.; Hikino, H.; Ogawa, S.; Nishimoto, N. Tetrahedron 1969, 25, 1241.
(135) Nishimoto, N.; Shiobara, Y.; Fujino, M.; Inoue, S. S.; Takemoto, T.; De Oliveira, F.; Akisue, G.; Akisue, M. K.; Hashimoto, G.; Tanaka, O. Phytochemistry 1987, 26, 2505.
(136) Vokac, K.; Budesnsky, M.; Harmatha, J.; Kohoutova, J. Phytochemistry 1998, 49, 2109.
(137) Simon, A.; Vanyolos, A.; Beni, Z.; Dekany, M.; Toth, G.; Bathori, M. Steroids 2011, 76, 1419.
(138) Yoshikawa, M.; Xu, F.; Morikawa, T.; Pongpiriyadacha, Y.; Nakamura, S.; Asao, Y.; Kumahara, A.; Matsuda, H. Chemical & Pharmaceutical Bulletin 2007, 55, 308.
(139) Da Silva, B. P.; Parente, J. P. Zeitschrift fur Naturforschung C 2004, 59, 81.
(140) Khurram, M.; Lawton, L. A.; Edwards, C.; Iriti, M.; Hameed, A.; Khan, M. A.; Khan, F. A.; Rahman, S. U. International Journal of Molecular Sciences 2015, 16, 20290.
(141) Aslam, F.; Rehman, K.; Asghar, M.; Sarwar, M. Pakistan Journal of
Agriculture Science 2009, 46, 209.
(142) Zablotowicz, R. M.; Hoagland, R. E.; Wagner, S. C. In Saponins Used in Food
and Agriculture, Springer, 1996, 83.
(143) Mujeeb, F.; Bajpai, P.; Pathak, N. Bio Medical Research International 2014, 2014.
(144) Sata, N.; Matsunaga, S.; Fusetani, N.; Nishikawa, H.; Takamura, S.; Saito, T. Bioscience, Biotechnology, and Biochemistry 1998, 62, 1904.
(145) Favel, A.; Kemertelidze, E.; Benidze, M.; Fallague, K.; Regli, P. Phytotherapy
Research 2005, 19, 158.
(146) Hou, C.; Forman, R. Journal of Industrial Microbiology and Biotechnology 2000, 24, 275.
(147) Viscoli, C.; Girmenia, C.; Marinus, A.; Collette, L.; Martino, P.; Vandercam, B.; Doyen, C.; Lebeau, B.; Spence, D.; Krcmery, V. Clinical Infectious
Diseases 1999, 28, 1071.

References
178
(148) Loo, A.; Jain, K.; Darah, I. Food Chemistry 2007, 104, 300.
(149) Rufino, M. S.; Fernandes, F. A.; Alves, R. E.; de Brito, E. S. Food Chemistry 2009, 114, 693.
(150) Wong, C. C.; Li, H. B.; Cheng, K. W.; Chen, F. Food Chemistry 2006, 97, 705.
(151) Bodoprost, J.; Rosemeyer, H. International Journal of Molecular Sciences 2007, 8, 1111.
(152) Ha, Y. L.; Storkson, J.; Pariza, M. W. Cancer Research 1990, 50, 1097.
(153) Naga, V.; Venkata, R.; Kasetti, R.; Chippada, A. International Research
Journal of Pharmacy 2012, 3, 252.
(154) Chen, Y.; Miao, Y.; Huang, L.; Li, J.; Sun, H.; Zhao, Y.; Yang, J.; Zhou, W. BMC Complementary and Alternative Medicine 2014, 14, 86.
(155) Laguerre, M.; Sorensen, A. D. M.; Bayrasy, C.; Lecomte, J.; Jacobsen, C.; Decker, E. A.; Villeneuve, P.; Logan, A.; Nienaber, U.; Pan, X. Lipid
Oxidation, Challenges in Food Systems 2013, 261.
(156) Ono, M.; Sugita, F.; Shigematsu, S.; Takamura, C.; Yoshimitsu, H.; Miyashita, H.; Ikeda, T.; Nohara, T. Chemical & Pharmaceutical Bulletin 2007, 55, 1093.
(157) Zhao, W.; Gao, W.; Wei, J.; Wang, Y.; Huang, L.; Xiao, P. Latin American
Journal of Pharmacy 2011, 30.
(158) Sultana, N.; Arayne, M. S.; Naz, A.; Mesaik, M. A. Chemistry Central Journal 2013, 7, 6.
(159) Pawliczak, R. Polski Merkuriusz Lekarski: Organ Polskiego Towarzystwa
Lekarskiego 2003, 14, 493.
(160) Cuzzocrea, S.; Mazzon, E.; Dugo, L.; Serraino, I.; Ciccolo, A.; Centorrino, T.; De Sarro, A.; Caputi, A. P. The FASEB Journal 2001, 15, 1187.
(161) Salvemini, D.; Wang, Z.-Q.; Bourdon, D. M.; Stern, M. K.; Currie, M. G.; Manning, P. T. European Journal of Pharmacology 1996, 303, 217.
(162) Fridovich, I. Journal of Biological Chemistry 1997, 272, 18515.
(163) Uttara, B.; Singh, A. V.; Zamboni, P.; Mahajan, R. Current
Neuropharmacology 2009, 7, 65.

References
179
(164) Meyre-Silva, C.; Niero, R.; Bolda Mariano, L. N.; Gomes do Nascimento, F.; Vicente Farias, I.; Gazoni, V. F.; dos Santos Silva, B.; Giménez, A.; Gutierrez-Yapu, D.; Salamanca, E. Evidence Based Complementary and
Alternative Medicine 2013, 2013.
(165) Calderon, L. d. A.; Silva-Jardim, I.; Zuliani, J. P.; Ciancaglini, P.; Silva, L. H. P. d.; Stábeli, R. G. Journal of the Brazilian Chemical Society 2009, 20, 1011.
(166) Mitropoulos, P.; Konidas, P.; Durkin-Konidas, M. Journal of the American
Academy of Dermatology 2010, 63, 309.
(167) Sadeghi-Nejad, B.; Saki, J.; Khademvatan, S.; Nanaei, S. Journal of Medicinal
Plants Research 2011, 5, 5912.
(168) Adeniyi, S.; Orjiekwe, C.; Ehiagbonare, J.; Arimah, B. International Journal
of Biological and Chemical Sciences 2010, 4, 12.
(169) Shany, S.; Gestetner, B.; Birk, Y.; Bondi, A. Journal of the Science of Food
and Agriculture 1970, 21, 508.
(170) Belles, X.; Martín, D.; Piulachs, M. D. Annual Review of Entomology 2005, 50, 181.
(171) De Geyter, E.; Lambert, E.; Geelen, D.; Smagghe, G. Pest Technology 2007, 1, 96.
(172) Avato, P.; Bucci, R.; Tava, A.; Vitali, C.; Rosato, A.; Bialy, Z.; Jurzysta, M. Phytotherapy Research 2006, 20, 454.
(173) Ahmad, M. S.; Hussain, M.; Hanif, M.; Ali, S.; Mirza, B. Molecules 2007, 12, 2348.
(174) Shaheen, F.; Badshah, A.; Gielen, M.; Dusek, M.; Fejfarova, K.; de Vos, D.; Mirza, B. Journal of Organometallic Chemistry 2007, 692, 3019.
(175) McLaughlin, J. L.; Chang, C. J.; Smith, D. L. In ACS Symposium Series (USA) 1993.
(176) Ateeq-ur-Rehman; Mannan, A.; Inayatullah, S.; Akhtar, M. Z.; Qayyum, M.; Mirza, B. Pharmaceutical Biology 2009, 47, 628.
(177) Gilani, A. H.; Khan, A.; Khan, A .; Bashir, S.; Rehman, N .; Mandukhail, S. R. Pharmaceutical Biology 2010, 48, 1240.
(178) Ali, N.; Shah, S. W. A. Journal of Young Pharmacists 2010, 2, 261.

References
180
(179) Ali, N.; Shah, I.; Shah, S. W. A.; Ahmed, G.; Shoaib, M.; Junaid, M.; Ali, W.; Ahmed, Z. BMC Complementary and Alternative Medicine 2013, 13, 96.
(180) Ali, N.; Shah, S.; Shah, I. Journal of Young Pharmacists 2011, 3, 125.
(181) Bolton, T. Physiological Reviews 1979, 59, 606.
(182) Godfraind, T. O. In Cerebral Ischemia and Calcium; Springer, 1989, 7.
(183) Fleckenstein, A. Annual Review of Pharmacology and Toxicology 1977, 17, 149.
(184) Mahomoodally, F. M.; Subratty, A. H.; Gurib-Fakim, A.; Choudhary, M. I. BMC Complementary and Alternative Medicine 2012, 12, 165.
(185) Peng, X.; Cheng, K.-W.; Ma, J.; Chen, B.; Ho, C.-T.; Lo, C.; Chen, F.; Wang, M. Journal of Agricultural and Food Chemistry 2008, 56, 1907.
(186) Wang, W.; Yagiz, Y.; Buran, T. J.; do Nascimento Nunes, C.; Gu, L. Food
Research International 2011, 44, 2666.
(187) Kaewnarin, K.; Niamsup, H.; Shank, L.; Rakariyatham, N. Chiang Mai
Journal of Science 2014, 41, 105.
(188) Saleem, M.; Afza, N.; Anwar, M. A.; Hai, S. M. A.; Ali, M. S. Natural
Product Research 2003, 17, 369.
(189) Kim, D.-H.; Shim, S.-B.; Kim, N.-J.; Jang, I. S. Biological & Pharmaceutical
Bulletin 1999, 22, 162.
(190) Saleem, M.; Afza, N.; Anwar, M. A.; Hai, S. M. A.; Ali, M. S.; Shujaat, S.; Atta-Ur-Rahman. Natural Product Research 2003, 17, 159.
(191) Matsushita, S.; Nitanda, T.; Furukawa, T.; Sumizawa, T.; Tani, A.; Nishimoto, K.; Akiba, S.; Miyadera, K.; Fukushima, M.; Yamada, Y. Cancer Research 1999, 59, 1911.
(192) Toyoda, Y.; Tabata, S.; Kishi, J.; Kuramoto, T.; Mitsuhashi, A.; Saijo, A.; Kawano, H.; Goto, H.; Aono, Y.; Hanibuchi, M. Arthritis and Rheumatology 2014, 66, 560.
(193) Lee, B.; Jung, K.; Kim, D. H. Pharmacology Biochemistry and Behavior 2009, 93, 121.
(194) Ahmed, F.; Chandra, J. N. S.; Manjunath, S. Pharmacognosy Research 2011, 3, 246.

References
181
(195) Salvemini, D.; Wang, Z. Q.; Wyatt, P. S.; Bourdon, D. M.; Marino, M. H.; Manning, P. T.; Currie, M. G. British Journal of Pharmacology 1996, 118, 829.
(196) Ianaro, A.; O'donnell, C.; Di Rosa, M.; Liew, F. Immunology 1994, 82, 370.
(197) Seibert, K.; Zhang, Y.; Leahy, K.; Hauser, S.; Masferrer, J.; Perkins, W.; Lee, L.; Isakson, P. Proceedings of the National Academy of Sciences 1994, 91, 12013.
(198) Lacaille. D. M.; Wagner, H. Phytomedicine 1996, 2, 363.
(199) Francis, G.; Kerem, Z.; Makkar, H. P.; Becker, K. British Journal of Nutrition 2002, 88, 587.
(200) Wu, S.; Xu, H.; Peng, J.; Wang, C.; Jin, Y.; Liu, K.; Sun, H.; Qin, J. Biochimie 2015, 110, 62.
(201) Hosseinzadeh, H.; Younesi, H. M. BMC Pharmacology 2002, 2, 7.
(202) Zakaria, Z. A.; Ghani, Z. D. F. A.; Nor, R. N. S. R. M.; Gopalan, H. K.; Sulaiman, M. R.; Jais, A. M. M.; Somchit, M. N.; Kader, A. A.; Ripin, J. Journal of Natural Medicines 2008, 62, 179.
(203) Wang, J. R.; Zhou, H.; Jiang, Z. H.; Wong, Y. F.; Liu, L. Biological &
Pharmaceutical Bulletin 2008, 31, 643.
(204) Navarro, P.; Giner, R. M.; Recio, M. C.; Máñez, S.; Cerdá-Nicolás, M.; Rı́os, J. L. Life Sciences 2001, 68, 1199.