phage auxiliary metabolic genes and the redirection of
TRANSCRIPT

Phage auxiliary metabolic genes and the redirectionof cyanobacterial host carbon metabolismLuke R. Thompsona,1, Qinglu Zengb,1, Libusha Kellyb, Katherine H. Huangb, Alexander U. Singerc, JoAnne Stubbea,d,2,and Sallie W. Chisholma,b,2
Departments of aBiology and bCivil and Environmental Engineering, Massachusetts Institute of Technology, Cambridge, MA 02139; cBanting and BestDepartment of Medical Research, University of Toronto, Toronto, Ontario Canada M5G 1L6; and dDepartment of Chemistry, Massachusetts Institute ofTechnology, Cambridge, MA 02139
Edited by James M. Tiedje, Michigan State University, East Lansing, MI, and approved July 29, 2011 (received for review February 15, 2011)
Cyanophages infecting the marine cyanobacteria Prochlorococcusand Synechococcus encode and express genes for the photosyn-thetic light reactions. Sequenced cyanophage genomes lack Calvincycle genes, however, suggesting that photosynthetic energy har-vested via phage proteins is not used for carbon fixation. We re-port here that cyanophages carry and express a Calvin cycleinhibitor, CP12, whose host homologue directs carbon flux fromthe Calvin cycle to the pentose phosphate pathway (PPP). PhageCP12 was coexpressed with phage genes involved in the lightreactions, deoxynucleotide biosynthesis, and the PPP, includinga transaldolase gene that is the most prevalent PPP gene in cya-nophages. Phage transaldolase was purified to homogeneity fromseveral strains and shown to be functional in vitro, suggesting thatit might facilitate increased flux through this key reaction in thehost PPP, augmenting production of NADPH and ribose 5-phos-phate. Kinetic measurements of phage and host transaldolasesrevealed that the phage enzymes have kcat/Km values only approx-imately one third of the corresponding host enzymes. The lowerefficiency of phage transaldolase may be a tradeoff for other se-lective advantages such as reduced gene size: we show that morethan half of host-like cyanophage genes are significantly shorterthan their host homologues. Consistent with decreased Calvin cy-cle activity and increased PPP and light reaction activity under in-fection, the host NADPH/NADP ratio increased two-fold in infectedcells. We propose that phage-augmented NADPH production fuelsdeoxynucleotide biosynthesis for phage replication, and that theselection pressures molding phage genomes involve fitness advan-tages conferred through mobilization of host energy stores.
coevolution | photosynthesis | virus
The use of host-likemetabolic genes by viruses is a central themein the coevolution of viruses and their hosts, and the particular
metabolic genes carried by viruses provide clues to the mechanismsof viral replication. Bacteriophages typically carry multiple genesfor nucleic acid biosynthesis and replication (1, 2), critical processesfor replication of the phage genome. Cyanophages (cyanobacterialdsDNA bacteriophages) infecting the marine cyanobacteriaProchlorococcus and Synechococcus carry a much richer cache ofmetabolic genes than most sequenced phages, encoding elementsof photosynthesis (3), the pentose phosphate pathway (PPP) (4),and phosphate acquisition (5). Such genes have been termed“auxiliarymetabolic genes” (6) because they are thought to providesupplemental support to key steps in host metabolism of signifi-cance to phage, thereby fostering a more successful infection.Photosynthetic light reaction genes in phage genomes have
attracted particular attention because photosystems are sophis-ticated macromolecular complexes with functions in core cya-nobacterial metabolism, and they are not traditionally associatedwith the phage infection process. Nevertheless, physiologicalstudies of cyanophage infection have shown that a phage copy ofpsbA, which encodes the D1 protein essential for photosystem II(PSII), is transcribed and translated during infection (7–9). Thisresult suggested that phage gene products may integrate into
host photosystems and contribute to host photosynthesis duringinfection (7), possibly fueling phage dNTP biosynthesis (10, 11).It has long been recognized that both light and the photosyn-thetic light reactions are necessary for optimal cyanophageproduction (7, 12–14). However, in the host, the energy (i.e.,ATP) and reducing equivalents (i.e., NADPH) generated by thelight reactions are typically used for carbon fixation by the Calvincycle. The presence of genes encoding Calvin cycle enzymes hasnot been reported for any sequenced cyanophages (5, 15–21),suggesting that phage use the ATP and NADPH generated bythe light reactions of photosynthesis for other functions.Clues to the role of photosynthesis during infection have been
provided by our observation that some cyanophages carry a genefor CP12 (21), an inhibitor of the Calvin cycle. CP12 is an in-trinsically unstructured protein that in plants (22) and cyano-bacteria (23) binds and inhibits two key enzymes in the Calvincycle (phosphoribulokinase, PRK, prkB gene; and glyceralde-hyde-3-phosphate dehydrogenase, GAPDH, gap2 gene). CP12binding has the effect of directing carbon flux away from glucosesynthesis and toward the PPP, where glucose 6-P is oxidized byNADP to ribose 5-P and NADPH (Fig. 1A). We were promptedto look for CP12 in cyanophages after our studies of the light–dark cycle of Prochlorococcus (24) indicated its probable role inregulating the Calvin cycle and PPP in these cyanobacteria. Weshowed that host cp12 is maximally expressed at night in Pro-chlorococcus (24), consistent with its functioning to direct carbonflux away from the Calvin cycle and toward the PPP in the dark.Cyanophages that encode CP12 also encode proteins for the
PPP, the light reactions, and dNTP biosynthesis (21). Of particularinterest among these phage-encoded functions is a putativetransaldolase, widely represented in cyanophage genomes (5),which could boost the host PPP during infection. As a whole, theset of carbon metabolism genes carried by cyanophages is con-sistent with the hypothesis that, under phage infection, the ATPand NADPH produced by photosynthesis are not used by theCalvin cycle but rather are used to fuel phage dNTP biosynthesis.We now report our genomics and metagenomics studies, ourenzymological studies of transaldolase, and our analyses of gene
Author contributions: L.R.T., Q.Z., L.K., K.H.H., J.S., and S.W.C. designed research; L.R.T.,Q.Z., L.K., K.H.H., and A.U.S. performed research; L.R.T., Q.Z., L.K., K.H.H., and A.U.S.analyzed data; and L.R.T., J.S., and S.W.C. wrote the paper.
The authors declare no conflict of interest.
This article is a PNAS Direct Submission.
Freely available online through the PNAS open access option.
Data deposition: The atomic coordinates and structure factors have been deposited in theProtein Data Bank, www.pdb.org (PDB ID code 3HJZ). The sequences reported in thispaper have been deposited in the GenBank database [GU071107 (P-SSP2), GU071104(P-HP1), and GU071102 (P-RSP5)].1L.R.T. and Q.Z. contributed equally to this work.2To whom correspondence may be addressed: [email protected] or [email protected].
See Author Summary on page 16147.
This article contains supporting information online at www.pnas.org/lookup/suppl/doi:10.1073/pnas.1102164108/-/DCSupplemental.
www.pnas.org/cgi/doi/10.1073/pnas.1102164108 PNAS | September 27, 2011 | vol. 108 | no. 39 | E757–E764
MICRO
BIOLO
GY
PNASPL
US
expression and cellular redox balance in uninfected and infectedcells, which support this hypothesis.
Results and DiscussionCP12 and PPP Genes in Cultured and Wild Cyanophages. We first ex-amined the genetic potential of all sequenced cyanophages for
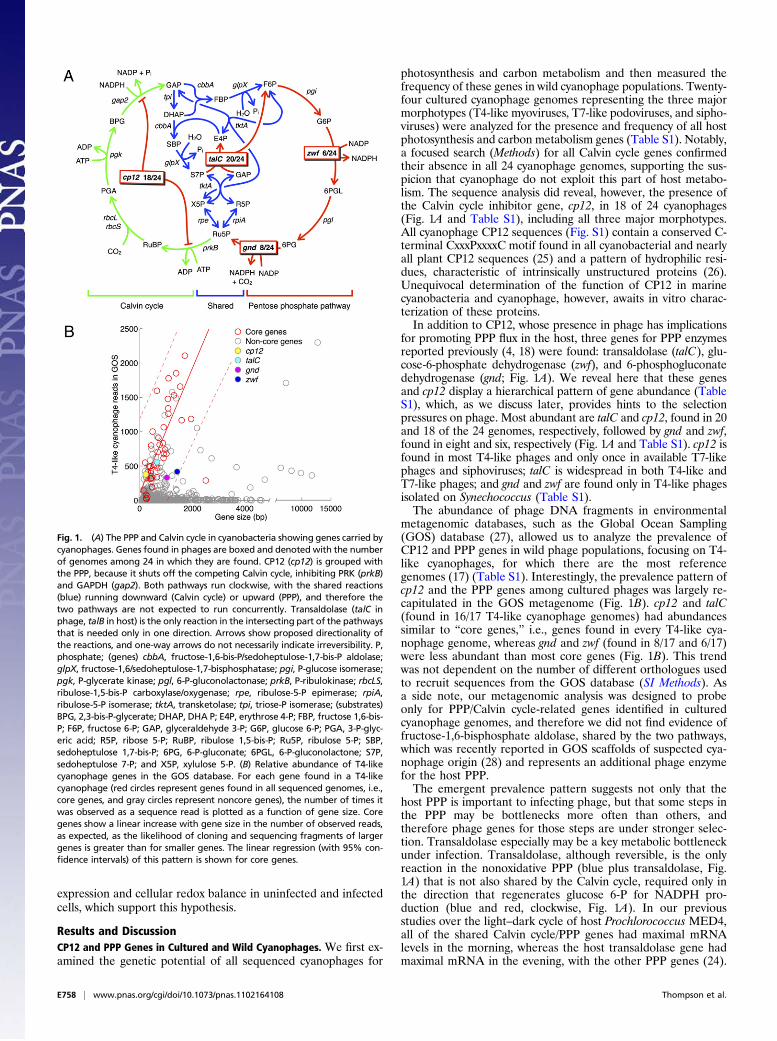
photosynthesis and carbon metabolism and then measured thefrequency of these genes in wild cyanophage populations. Twenty-four cultured cyanophage genomes representing the three majormorphotypes (T4-like myoviruses, T7-like podoviruses, and sipho-viruses) were analyzed for the presence and frequency of all hostphotosynthesis and carbon metabolism genes (Table S1). Notably,a focused search (Methods) for all Calvin cycle genes confirmedtheir absence in all 24 cyanophage genomes, supporting the sus-picion that cyanophage do not exploit this part of host metabo-lism. The sequence analysis did reveal, however, the presence ofthe Calvin cycle inhibitor gene, cp12, in 18 of 24 cyanophages(Fig. 1A and Table S1), including all three major morphotypes.All cyanophage CP12 sequences (Fig. S1) contain a conserved C-terminal CxxxPxxxxC motif found in all cyanobacterial and nearlyall plant CP12 sequences (25) and a pattern of hydrophilic resi-dues, characteristic of intrinsically unstructured proteins (26).Unequivocal determination of the function of CP12 in marinecyanobacteria and cyanophage, however, awaits in vitro charac-terization of these proteins.In addition to CP12, whose presence in phage has implications
for promoting PPP flux in the host, three genes for PPP enzymesreported previously (4, 18) were found: transaldolase (talC), glu-cose-6-phosphate dehydrogenase (zwf), and 6-phosphogluconatedehydrogenase (gnd; Fig. 1A). We reveal here that these genesand cp12 display a hierarchical pattern of gene abundance (TableS1), which, as we discuss later, provides hints to the selectionpressures on phage. Most abundant are talC and cp12, found in 20and 18 of the 24 genomes, respectively, followed by gnd and zwf,found in eight and six, respectively (Fig. 1A and Table S1). cp12 isfound in most T4-like phages and only once in available T7-likephages and siphoviruses; talC is widespread in both T4-like andT7-like phages; and gnd and zwf are found only in T4-like phagesisolated on Synechococcus (Table S1).The abundance of phage DNA fragments in environmental
metagenomic databases, such as the Global Ocean Sampling(GOS) database (27), allowed us to analyze the prevalence ofCP12 and PPP genes in wild phage populations, focusing on T4-like cyanophages, for which there are the most referencegenomes (17) (Table S1). Interestingly, the prevalence pattern ofcp12 and the PPP genes among cultured phages was largely re-capitulated in the GOS metagenome (Fig. 1B). cp12 and talC(found in 16/17 T4-like cyanophage genomes) had abundancessimilar to “core genes,” i.e., genes found in every T4-like cya-nophage genome, whereas gnd and zwf (found in 8/17 and 6/17)were less abundant than most core genes (Fig. 1B). This trendwas not dependent on the number of different orthologues usedto recruit sequences from the GOS database (SI Methods). Asa side note, our metagenomic analysis was designed to probeonly for PPP/Calvin cycle-related genes identified in culturedcyanophage genomes, and therefore we did not find evidence offructose-1,6-bisphosphate aldolase, shared by the two pathways,which was recently reported in GOS scaffolds of suspected cya-nophage origin (28) and represents an additional phage enzymefor the host PPP.The emergent prevalence pattern suggests not only that the
host PPP is important to infecting phage, but that some steps inthe PPP may be bottlenecks more often than others, andtherefore phage genes for those steps are under stronger selec-tion. Transaldolase especially may be a key metabolic bottleneckunder infection. Transaldolase, although reversible, is the onlyreaction in the nonoxidative PPP (blue plus transaldolase, Fig.1A) that is not also shared by the Calvin cycle, required only inthe direction that regenerates glucose 6-P for NADPH pro-duction (blue and red, clockwise, Fig. 1A). In our previousstudies over the light–dark cycle of host Prochlorococcus MED4,all of the shared Calvin cycle/PPP genes had maximal mRNAlevels in the morning, whereas the host transaldolase gene hadmaximal mRNA in the evening, with the other PPP genes (24).
Fig. 1. (A) The PPP and Calvin cycle in cyanobacteria showing genes carried bycyanophages. Genes found in phages are boxed and denoted with the numberof genomes among 24 in which they are found. CP12 (cp12) is grouped withthe PPP, because it shuts off the competing Calvin cycle, inhibiting PRK (prkB)and GAPDH (gap2). Both pathways run clockwise, with the shared reactions(blue) running downward (Calvin cycle) or upward (PPP), and therefore thetwo pathways are not expected to run concurrently. Transaldolase (talC inphage, talB in host) is the only reaction in the intersecting part of the pathwaysthat is needed only in one direction. Arrows show proposed directionality ofthe reactions, and one-way arrows do not necessarily indicate irreversibility. P,phosphate; (genes) cbbA, fructose-1,6-bis-P/sedoheptulose-1,7-bis-P aldolase;glpX, fructose-1,6/sedoheptulose-1,7-bisphosphatase; pgi, P-glucose isomerase;pgk, P-glycerate kinase; pgl, 6-P-gluconolactonase; prkB, P-ribulokinase; rbcLS,ribulose-1,5-bis-P carboxylase/oxygenase; rpe, ribulose-5-P epimerase; rpiA,ribulose-5-P isomerase; tktA, transketolase; tpi, triose-P isomerase; (substrates)BPG, 2,3-bis-P-glycerate; DHAP, DHA P; E4P, erythrose 4-P; FBP, fructose 1,6-bis-P; F6P, fructose 6-P; GAP, glyceraldehyde 3-P; G6P, glucose 6-P; PGA, 3-P-glyc-eric acid; R5P, ribose 5-P; RuBP, ribulose 1,5-bis-P; Ru5P, ribulose 5-P; SBP,sedoheptulose 1,7-bis-P; 6PG, 6-P-gluconate; 6PGL, 6-P-gluconolactone; S7P,sedoheptulose 7-P; and X5P, xylulose 5-P. (B) Relative abundance of T4-likecyanophage genes in the GOS database. For each gene found in a T4-likecyanophage (red circles represent genes found in all sequenced genomes, i.e.,core genes, and gray circles represent noncore genes), the number of times itwas observed as a sequence read is plotted as a function of gene size. Coregenes show a linear increase with gene size in the number of observed reads,as expected, as the likelihood of cloning and sequencing fragments of largergenes is greater than for smaller genes. The linear regression (with 95% con-fidence intervals) of this pattern is shown for core genes.
E758 | www.pnas.org/cgi/doi/10.1073/pnas.1102164108 Thompson et al.
By 10:00 AM, the level of host transaldolase protein had de-creased to half its maximum level, whereas all other proteins inthe PPP and Calvin cycle remained relatively constant over thisperiod (29). Thus, if phage exploit host photosynthetic lightreactions by infecting during the day, expression of their owntransaldolase may be critical to overcoming low levels of the hostenzyme at this time.
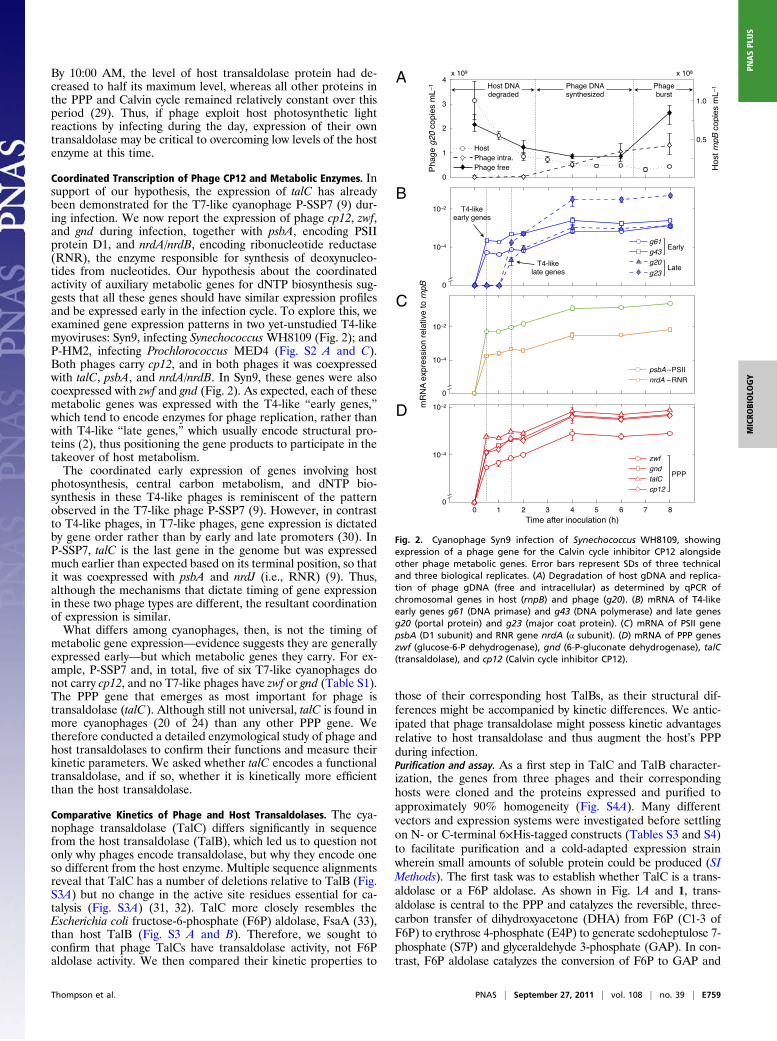
Coordinated Transcription of Phage CP12 and Metabolic Enzymes. Insupport of our hypothesis, the expression of talC has alreadybeen demonstrated for the T7-like cyanophage P-SSP7 (9) dur-ing infection. We now report the expression of phage cp12, zwf,and gnd during infection, together with psbA, encoding PSIIprotein D1, and nrdA/nrdB, encoding ribonucleotide reductase(RNR), the enzyme responsible for synthesis of deoxynucleo-tides from nucleotides. Our hypothesis about the coordinatedactivity of auxiliary metabolic genes for dNTP biosynthesis sug-gests that all these genes should have similar expression profilesand be expressed early in the infection cycle. To explore this, weexamined gene expression patterns in two yet-unstudied T4-likemyoviruses: Syn9, infecting Synechococcus WH8109 (Fig. 2); andP-HM2, infecting Prochlorococcus MED4 (Fig. S2 A and C).Both phages carry cp12, and in both phages it was coexpressedwith talC, psbA, and nrdA/nrdB. In Syn9, these genes were alsocoexpressed with zwf and gnd (Fig. 2). As expected, each of thesemetabolic genes was expressed with the T4-like “early genes,”which tend to encode enzymes for phage replication, rather thanwith T4-like “late genes,” which usually encode structural pro-teins (2), thus positioning the gene products to participate in thetakeover of host metabolism.The coordinated early expression of genes involving host
photosynthesis, central carbon metabolism, and dNTP bio-synthesis in these T4-like phages is reminiscent of the patternobserved in the T7-like phage P-SSP7 (9). However, in contrastto T4-like phages, in T7-like phages, gene expression is dictatedby gene order rather than by early and late promoters (30). InP-SSP7, talC is the last gene in the genome but was expressedmuch earlier than expected based on its terminal position, so thatit was coexpressed with psbA and nrdJ (i.e., RNR) (9). Thus,although the mechanisms that dictate timing of gene expressionin these two phage types are different, the resultant coordinationof expression is similar.What differs among cyanophages, then, is not the timing of
metabolic gene expression—evidence suggests they are generallyexpressed early—but which metabolic genes they carry. For ex-ample, P-SSP7 and, in total, five of six T7-like cyanophages donot carry cp12, and no T7-like phages have zwf or gnd (Table S1).The PPP gene that emerges as most important for phage istransaldolase (talC). Although still not universal, talC is found inmore cyanophages (20 of 24) than any other PPP gene. Wetherefore conducted a detailed enzymological study of phage andhost transaldolases to confirm their functions and measure theirkinetic parameters. We asked whether talC encodes a functionaltransaldolase, and if so, whether it is kinetically more efficientthan the host transaldolase.
Comparative Kinetics of Phage and Host Transaldolases. The cya-nophage transaldolase (TalC) differs significantly in sequencefrom the host transaldolase (TalB), which led us to question notonly why phages encode transaldolase, but why they encode oneso different from the host enzyme. Multiple sequence alignmentsreveal that TalC has a number of deletions relative to TalB (Fig.S3A) but no change in the active site residues essential for ca-talysis (Fig. S3A) (31, 32). TalC more closely resembles theEscherichia coli fructose-6-phosphate (F6P) aldolase, FsaA (33),than host TalB (Fig. S3 A and B). Therefore, we sought toconfirm that phage TalCs have transaldolase activity, not F6Paldolase activity. We then compared their kinetic properties to
those of their corresponding host TalBs, as their structural dif-ferences might be accompanied by kinetic differences. We antic-ipated that phage transaldolase might possess kinetic advantagesrelative to host transaldolase and thus augment the host’s PPPduring infection.Purification and assay. As a first step in TalC and TalB character-ization, the genes from three phages and their correspondinghosts were cloned and the proteins expressed and purified toapproximately 90% homogeneity (Fig. S4A). Many differentvectors and expression systems were investigated before settlingon N- or C-terminal 6×His-tagged constructs (Tables S3 and S4)to facilitate purification and a cold-adapted expression strainwherein small amounts of soluble protein could be produced (SIMethods). The first task was to establish whether TalC is a trans-aldolase or a F6P aldolase. As shown in Fig. 1A and 1, trans-aldolase is central to the PPP and catalyzes the reversible, three-carbon transfer of dihydroxyacetone (DHA) from F6P (C1-3 ofF6P) to erythrose 4-phosphate (E4P) to generate sedoheptulose 7-phosphate (S7P) and glyceraldehyde 3-phosphate (GAP). In con-trast, F6P aldolase catalyzes the conversion of F6P to GAP and
A
B
C
D
Fig. 2. Cyanophage Syn9 infection of Synechococcus WH8109, showingexpression of a phage gene for the Calvin cycle inhibitor CP12 alongsideother phage metabolic genes. Error bars represent SDs of three technicaland three biological replicates. (A) Degradation of host gDNA and replica-tion of phage gDNA (free and intracellular) as determined by qPCR ofchromosomal genes in host (rnpB) and phage (g20). (B) mRNA of T4-likeearly genes g61 (DNA primase) and g43 (DNA polymerase) and late genesg20 (portal protein) and g23 (major coat protein). (C) mRNA of PSII genepsbA (D1 subunit) and RNR gene nrdA (α subunit). (D) mRNA of PPP geneszwf (glucose-6-P dehydrogenase), gnd (6-P-gluconate dehydrogenase), talC(transaldolase), and cp12 (Calvin cycle inhibitor CP12).
Thompson et al. PNAS | September 27, 2011 | vol. 108 | no. 39 | E759
MICRO
BIOLO
GY
PNASPL
US
DHA. Thus, for transaldolase activity, both F6P and E4P are re-quired, whereas for F6P aldolase, only the former is required (33).
F6Pþ E4P⇌GAPþ S7P [1]
The assay for transaldolase activity (34) involves two couplingenzymes: triosephosphate isomerase (TPI) and glycerol-3-phos-phate dehydrogenase (G3PDH). TPI converts GAP (as shown in1) to DHA phosphate, which is then reduced to glycerol 3-phosphate by G3PDH using an NADH cofactor, whose oxida-tion is monitored spectrophotometrically by a decrease in A340.The results of these experiments (Fig. S4B) reveal that all threeTalCs and all three TalBs required E4P for turnover and are thustransaldolases. This result is consistent with a role for TalC in thehost PPP (Fig. 1A), with 1 proceeding from right to left.Structures of TalC and TalB. Further comparison of host and phageenzymes has been possible by structural determination of Pro-chlorococcus MIT9312 TalB (1.90-Å resolution by X-ray crys-tallography; Table S5) and homology modeling of cyanophage P-SSP7 TalC using sequence alignments and the Thermotogamaritima TalC structure [Protein Data Bank (PDB) ID no.1VPX; 41% identity]. An overlay of the two structures (SIMethods) reveals a superimposable α8/β8-barrel including theconserved active site residues (Fig. S3C) previously demon-strated to be important in catalysis (31, 32). The major dis-tinguishing feature between these transaldolases is the numberand orientation of exterior α-helices, with TalB containing moreexternal α-helices relative to TalC’s more compact structure. Toreveal the quaternary structures of TalB and TalC, the same tworepresentatives (MIT9312 TalB and P-SSP7 TalC) were exam-ined by size-exclusion chromatography (Fig. S3D). Comparisonof the elution profiles with a standard curve generated fromglobular proteins of known molecular weight revealed that TalBappears to form a monomer and TalC a pentamer. Most otherTalBs are reported to be dimers in solution (35), but it is in-teresting to note that a monomeric state is also observed in ourcrystal structure. Most other TalCs form decamers in solution(35), consisting of a dimer of doughnut-shaped pentamers (31).Thus, both host and phage transaldolases have unusual quater-nary structures.Kinetic properties of TalC and TalB. Finally, to assess the potential ofphage transaldolase to substitute for or even outperform the hosttransaldolase, we compared the kinetic parameters of the threephage TalCs and three host TalBs by using the coupled assay.The results are summarized in Table 1. In general, the kcat andkcat / Km values for host transaldolases are approximately three-fold higher than for phage transaldolases. Our hypothesis wasthat the TalCs might have higher efficiencies than the TalBs.However, in all three phage–host pairs of TalC and TalB, thiswas shown not to be the case. We consider three explanations forwhy a phage would carry a kinetically less efficient enzyme thanits host. First, for phage, the acquisition and use of host-like
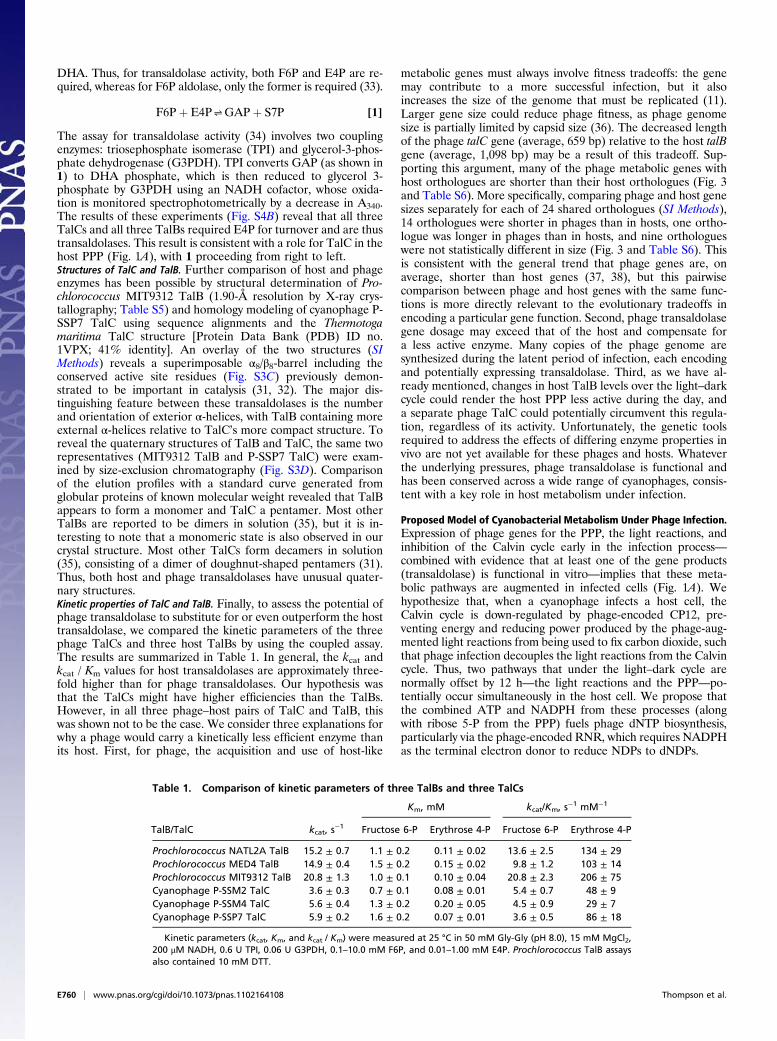
metabolic genes must always involve fitness tradeoffs: the genemay contribute to a more successful infection, but it alsoincreases the size of the genome that must be replicated (11).Larger gene size could reduce phage fitness, as phage genomesize is partially limited by capsid size (36). The decreased lengthof the phage talC gene (average, 659 bp) relative to the host talBgene (average, 1,098 bp) may be a result of this tradeoff. Sup-porting this argument, many of the phage metabolic genes withhost orthologues are shorter than their host orthologues (Fig. 3and Table S6). More specifically, comparing phage and host genesizes separately for each of 24 shared orthologues (SI Methods),14 orthologues were shorter in phages than in hosts, one ortho-logue was longer in phages than in hosts, and nine orthologueswere not statistically different in size (Fig. 3 and Table S6). Thisis consistent with the general trend that phage genes are, onaverage, shorter than host genes (37, 38), but this pairwisecomparison between phage and host genes with the same func-tions is more directly relevant to the evolutionary tradeoffs inencoding a particular gene function. Second, phage transaldolasegene dosage may exceed that of the host and compensate fora less active enzyme. Many copies of the phage genome aresynthesized during the latent period of infection, each encodingand potentially expressing transaldolase. Third, as we have al-ready mentioned, changes in host TalB levels over the light–darkcycle could render the host PPP less active during the day, anda separate phage TalC could potentially circumvent this regula-tion, regardless of its activity. Unfortunately, the genetic toolsrequired to address the effects of differing enzyme properties invivo are not yet available for these phages and hosts. Whateverthe underlying pressures, phage transaldolase is functional andhas been conserved across a wide range of cyanophages, consis-tent with a key role in host metabolism under infection.
Proposed Model of Cyanobacterial Metabolism Under Phage Infection.Expression of phage genes for the PPP, the light reactions, andinhibition of the Calvin cycle early in the infection process—combined with evidence that at least one of the gene products(transaldolase) is functional in vitro—implies that these meta-bolic pathways are augmented in infected cells (Fig. 1A). Wehypothesize that, when a cyanophage infects a host cell, theCalvin cycle is down-regulated by phage-encoded CP12, pre-venting energy and reducing power produced by the phage-aug-mented light reactions from being used to fix carbon dioxide, suchthat phage infection decouples the light reactions from the Calvincycle. Thus, two pathways that under the light–dark cycle arenormally offset by 12 h—the light reactions and the PPP—po-tentially occur simultaneously in the host cell. We propose thatthe combined ATP and NADPH from these processes (alongwith ribose 5-P from the PPP) fuels phage dNTP biosynthesis,particularly via the phage-encoded RNR, which requires NADPHas the terminal electron donor to reduce NDPs to dNDPs.
Table 1. Comparison of kinetic parameters of three TalBs and three TalCs
TalB/TalC kcat, s−1
Km, mM kcat/Km, s−1 mM−1
Fructose 6-P Erythrose 4-P Fructose 6-P Erythrose 4-P
Prochlorococcus NATL2A TalB 15.2 ± 0.7 1.1 ± 0.2 0.11 ± 0.02 13.6 ± 2.5 134 ± 29Prochlorococcus MED4 TalB 14.9 ± 0.4 1.5 ± 0.2 0.15 ± 0.02 9.8 ± 1.2 103 ± 14Prochlorococcus MIT9312 TalB 20.8 ± 1.3 1.0 ± 0.1 0.10 ± 0.04 20.8 ± 2.3 206 ± 75Cyanophage P-SSM2 TalC 3.6 ± 0.3 0.7 ± 0.1 0.08 ± 0.01 5.4 ± 0.7 48 ± 9Cyanophage P-SSM4 TalC 5.6 ± 0.4 1.3 ± 0.2 0.20 ± 0.05 4.5 ± 0.9 29 ± 7Cyanophage P-SSP7 TalC 5.9 ± 0.2 1.6 ± 0.2 0.07 ± 0.01 3.6 ± 0.5 86 ± 18
Kinetic parameters (kcat, Km, and kcat / Km) were measured at 25 °C in 50 mM Gly-Gly (pH 8.0), 15 mM MgCl2,200 μM NADH, 0.6 U TPI, 0.06 U G3PDH, 0.1–10.0 mM F6P, and 0.01–1.00 mM E4P. Prochlorococcus TalB assaysalso contained 10 mM DTT.
E760 | www.pnas.org/cgi/doi/10.1073/pnas.1102164108 Thompson et al.
The hypothesis that cyanophage need to boost dNTP synthesisbecause dNTPs are limiting during infection is supported bydifferences in phage and host molecular composition and by hostphysiology. As described in Table S7, the protein/DNA ratio ofa cyanobacterial host cell is 20 times the protein/DNA ratio ofa T4 phage; therefore, the metabolic fluxes required for phagereproduction relative to host reproduction are biased towardDNA synthesis. However, the host chromosome (2 Mbp), even ifcompletely digested, would be insufficient to supply all of thedNTPs needed by progeny phage: assuming an average burst sizeof 100 phage cell−1 [range of 40–150 phage cell−1 (39, 40)] anda phage genome size of 200 kbp phage−1 (Table S1), the hostchromosome could supply only 10% of the dNTPs in the progenyphage. Phytoplankton living in low-nutrient environments arethought to have limited dNTP pools (10, 41). Indeed, for manymarine viruses, the majority of phage dNTPs are derived fromthe host chromosome (41) and host genome size limits burst sizein dNTP equivalents (10). Modeling of the phage infectionprocess (11) suggests that phage infecting hosts with smallgenomes like Prochlorococcus are more likely to encode auxiliarymetabolic genes for dNTP synthesis. Cyanophages are able toyield significantly higher burst sizes than predicted by their hostgenomes (10), possibly resulting from an ability to help the hostproduce large quantities of dNTPs de novo.
Dynamics of NADPH and Its Derivatives. In our model of phage-augmented nucleotide biosynthesis, the shared Calvin cycle/PPPreactions are proposed to run in the direction of the PPP(clockwise in Fig. 1A) such that ribose 5-P provides the sugars fornew dNTPs. However, much of the pentose phosphate producedis recycled back to glucose 6-P for additional NADPH pro-duction. Meanwhile, the light reactions of photosynthesis pro-
duce ATP and additional NADPH for making dNTPs. Ourmodel therefore makes the following predictions: first, phage-infected cells produce more NADPH than uninfected cells;second, light is required for optimal NADPH production underinfection; and third, phage-encoded proteins are partially re-sponsible for this increase in NADPH production. To test thesepredictions, we grew Prochlorococcus MED4 cultures in constantlight, inoculated with cyanophage P-HM2 or spent medium, andreturned to constant light or shifted to darkness. At regularintervals following inoculation, we measured ratios of NADPHand its derivatives (NADP, NADH, NAD) by using an enzymaticassay (23), and we measured gene expression and phage repli-cation dynamics by quantitative PCR (qPCR). Additionally, tobetter understand what phage in the wild might encounter wheninfecting cells during the day or night, we synchronized Pro-chlorococcus MED4 on a 24-h light–dark cycle, took samples atregular intervals over a period of 48 h, and measured ratios ofNADPH and its derivatives by using the enzymatic assay. Wenow describe the results of these experiments and compare themwith those predicted by our model.First, our model predicts that, in order for infected cells to
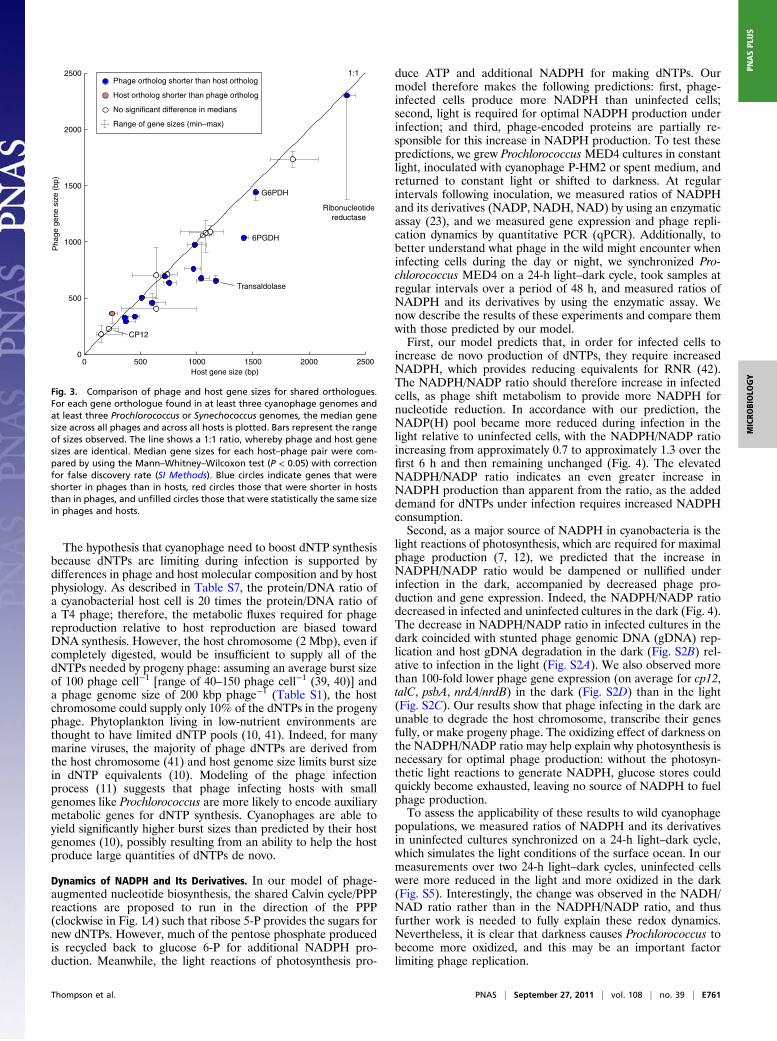
increase de novo production of dNTPs, they require increasedNADPH, which provides reducing equivalents for RNR (42).The NADPH/NADP ratio should therefore increase in infectedcells, as phage shift metabolism to provide more NADPH fornucleotide reduction. In accordance with our prediction, theNADP(H) pool became more reduced during infection in thelight relative to uninfected cells, with the NADPH/NADP ratioincreasing from approximately 0.7 to approximately 1.3 over thefirst 6 h and then remaining unchanged (Fig. 4). The elevatedNADPH/NADP ratio indicates an even greater increase inNADPH production than apparent from the ratio, as the addeddemand for dNTPs under infection requires increased NADPHconsumption.Second, as a major source of NADPH in cyanobacteria is the
light reactions of photosynthesis, which are required for maximalphage production (7, 12), we predicted that the increase inNADPH/NADP ratio would be dampened or nullified underinfection in the dark, accompanied by decreased phage pro-duction and gene expression. Indeed, the NADPH/NADP ratiodecreased in infected and uninfected cultures in the dark (Fig. 4).The decrease in NADPH/NADP ratio in infected cultures in thedark coincided with stunted phage genomic DNA (gDNA) rep-lication and host gDNA degradation in the dark (Fig. S2B) rel-ative to infection in the light (Fig. S2A). We also observed morethan 100-fold lower phage gene expression (on average for cp12,talC, psbA, nrdA/nrdB) in the dark (Fig. S2D) than in the light(Fig. S2C). Our results show that phage infecting in the dark areunable to degrade the host chromosome, transcribe their genesfully, or make progeny phage. The oxidizing effect of darkness onthe NADPH/NADP ratio may help explain why photosynthesis isnecessary for optimal phage production: without the photosyn-thetic light reactions to generate NADPH, glucose stores couldquickly become exhausted, leaving no source of NADPH to fuelphage production.To assess the applicability of these results to wild cyanophage
populations, we measured ratios of NADPH and its derivativesin uninfected cultures synchronized on a 24-h light–dark cycle,which simulates the light conditions of the surface ocean. In ourmeasurements over two 24-h light–dark cycles, uninfected cellswere more reduced in the light and more oxidized in the dark(Fig. S5). Interestingly, the change was observed in the NADH/NAD ratio rather than in the NADPH/NADP ratio, and thusfurther work is needed to fully explain these redox dynamics.Nevertheless, it is clear that darkness causes Prochlorococcus tobecome more oxidized, and this may be an important factorlimiting phage replication.
0 500 1000 1500 2000 25000
500
1000
1500
2000
2500
Host gene size (bp)
Pha
ge g
ene
size
(bp
)
Ribonucleotide reductase
G6PDH
6PGDH
Transaldolase
CP12
Phage ortholog shorter than host ortholog
Host ortholog shorter than phage ortholog
1:1
Fig. 3. Comparison of phage and host gene sizes for shared orthologues.For each gene orthologue found in at least three cyanophage genomes andat least three Prochlorococcus or Synechococcus genomes, the median genesize across all phages and across all hosts is plotted. Bars represent the rangeof sizes observed. The line shows a 1:1 ratio, whereby phage and host genesizes are identical. Median gene sizes for each host–phage pair were com-pared by using the Mann–Whitney–Wilcoxon test (P < 0.05) with correctionfor false discovery rate (SI Methods). Blue circles indicate genes that wereshorter in phages than in hosts, red circles those that were shorter in hoststhan in phages, and unfilled circles those that were statistically the same sizein phages and hosts.
Thompson et al. PNAS | September 27, 2011 | vol. 108 | no. 39 | E761
MICRO
BIOLO
GY
PNASPL
US
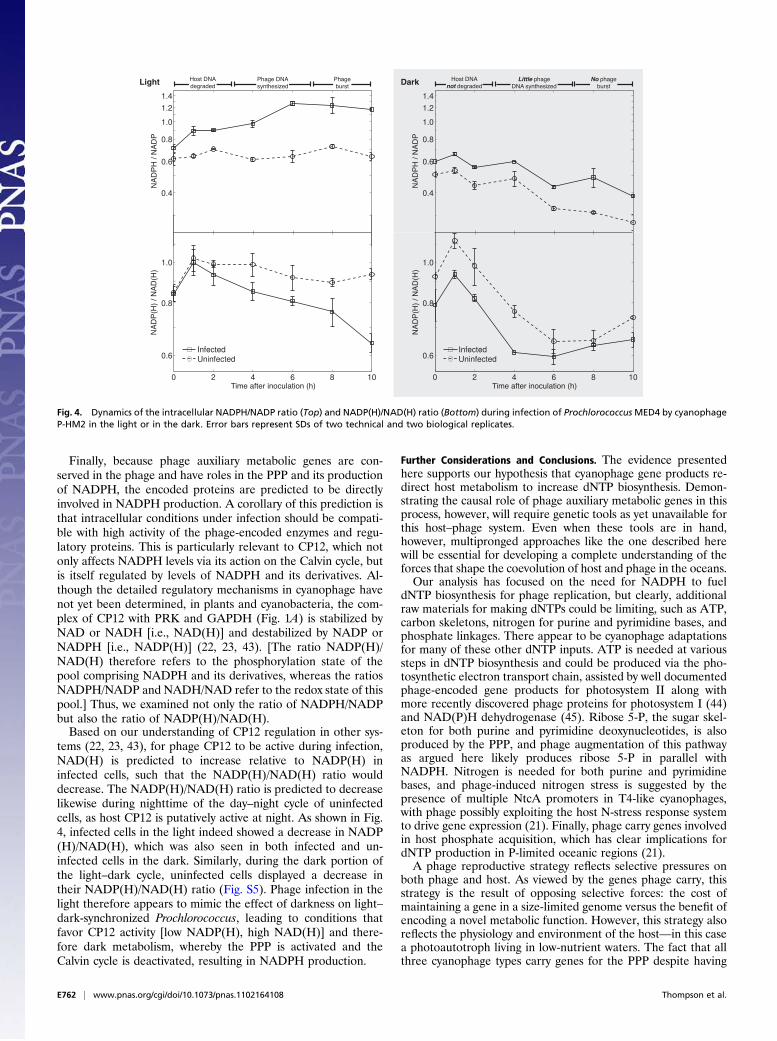
Finally, because phage auxiliary metabolic genes are con-served in the phage and have roles in the PPP and its productionof NADPH, the encoded proteins are predicted to be directlyinvolved in NADPH production. A corollary of this prediction isthat intracellular conditions under infection should be compati-ble with high activity of the phage-encoded enzymes and regu-latory proteins. This is particularly relevant to CP12, which notonly affects NADPH levels via its action on the Calvin cycle, butis itself regulated by levels of NADPH and its derivatives. Al-though the detailed regulatory mechanisms in cyanophage havenot yet been determined, in plants and cyanobacteria, the com-plex of CP12 with PRK and GAPDH (Fig. 1A) is stabilized byNAD or NADH [i.e., NAD(H)] and destabilized by NADP orNADPH [i.e., NADP(H)] (22, 23, 43). [The ratio NADP(H)/NAD(H) therefore refers to the phosphorylation state of thepool comprising NADPH and its derivatives, whereas the ratiosNADPH/NADP and NADH/NAD refer to the redox state of thispool.] Thus, we examined not only the ratio of NADPH/NADPbut also the ratio of NADP(H)/NAD(H).Based on our understanding of CP12 regulation in other sys-
tems (22, 23, 43), for phage CP12 to be active during infection,NAD(H) is predicted to increase relative to NADP(H) ininfected cells, such that the NADP(H)/NAD(H) ratio woulddecrease. The NADP(H)/NAD(H) ratio is predicted to decreaselikewise during nighttime of the day–night cycle of uninfectedcells, as host CP12 is putatively active at night. As shown in Fig.4, infected cells in the light indeed showed a decrease in NADP(H)/NAD(H), which was also seen in both infected and un-infected cells in the dark. Similarly, during the dark portion ofthe light–dark cycle, uninfected cells displayed a decrease intheir NADP(H)/NAD(H) ratio (Fig. S5). Phage infection in thelight therefore appears to mimic the effect of darkness on light–dark-synchronized Prochlorococcus, leading to conditions thatfavor CP12 activity [low NADP(H), high NAD(H)] and there-fore dark metabolism, whereby the PPP is activated and theCalvin cycle is deactivated, resulting in NADPH production.
Further Considerations and Conclusions. The evidence presentedhere supports our hypothesis that cyanophage gene products re-direct host metabolism to increase dNTP biosynthesis. Demon-strating the causal role of phage auxiliary metabolic genes in thisprocess, however, will require genetic tools as yet unavailable forthis host–phage system. Even when these tools are in hand,however, multipronged approaches like the one described herewill be essential for developing a complete understanding of theforces that shape the coevolution of host and phage in the oceans.Our analysis has focused on the need for NADPH to fuel
dNTP biosynthesis for phage replication, but clearly, additionalraw materials for making dNTPs could be limiting, such as ATP,carbon skeletons, nitrogen for purine and pyrimidine bases, andphosphate linkages. There appear to be cyanophage adaptationsfor many of these other dNTP inputs. ATP is needed at varioussteps in dNTP biosynthesis and could be produced via the pho-tosynthetic electron transport chain, assisted by well documentedphage-encoded gene products for photosystem II along withmore recently discovered phage proteins for photosystem I (44)and NAD(P)H dehydrogenase (45). Ribose 5-P, the sugar skel-eton for both purine and pyrimidine deoxynucleotides, is alsoproduced by the PPP, and phage augmentation of this pathwayas argued here likely produces ribose 5-P in parallel withNADPH. Nitrogen is needed for both purine and pyrimidinebases, and phage-induced nitrogen stress is suggested by thepresence of multiple NtcA promoters in T4-like cyanophages,with phage possibly exploiting the host N-stress response systemto drive gene expression (21). Finally, phage carry genes involvedin host phosphate acquisition, which has clear implications fordNTP production in P-limited oceanic regions (21).A phage reproductive strategy reflects selective pressures on
both phage and host. As viewed by the genes phage carry, thisstrategy is the result of opposing selective forces: the cost ofmaintaining a gene in a size-limited genome versus the benefit ofencoding a novel metabolic function. However, this strategy alsoreflects the physiology and environment of the host—in this casea photoautotroph living in low-nutrient waters. The fact that allthree cyanophage types carry genes for the PPP despite having
Fig. 4. Dynamics of the intracellular NADPH/NADP ratio (Top) and NADP(H)/NAD(H) ratio (Bottom) during infection of ProchlorococcusMED4 by cyanophageP-HM2 in the light or in the dark. Error bars represent SDs of two technical and two biological replicates.
E762 | www.pnas.org/cgi/doi/10.1073/pnas.1102164108 Thompson et al.
evolved from completely separate phage lineages (46) points tothe pressures brought on by their common host type and itsaustere habitat. This remarkable example of convergent evolu-tion in phage demonstrates the unifying pressures of infecting anobligate photoautotrophic host with a very small genome, a hostthat alone may not be able to supply the DNA building blocksa phage needs to replicate effectively.
MethodsSequences and Gene Annotation. Twenty-four genomes from cyanophagesinfecting Prochlorococcus and marine Synechococcus were included in theanalyses (Table S1), three of which are being introduced in the presentstudy. We searched the 24 cyanophage genomes for each Calvin cycle andPPP gene, along with known cyanophage genes in photosynthetic electrontransport and nucleotide biosynthesis, using the genome annotations. Tocheck for the possibility of uncalled or miscalled genes in the annotations,we also searched the 24 genomes by using TBLASTN with default parame-ters, an E-value cutoff of 10-5, and using all Prochlorococcus or Synecho-coccus Calvin cycle and PPP genes as queries. In cases of positive hits forgenes not reported in the annotations, multiple sequence alignments wereused to confirm the presence of key conserved residues. Hydrophobicityplots were used to compare hydrophobicity patterns of CP12 sequences.More details are provided in SI Methods.
Metagenomic Analyses. Sequence reads from the GOS database (27) wererecruited to cyanophage gene clusters from 17 T4-like cyanophage genomesdefined previously (21). Reads were kept only if the top five BLAST hits wereto the same gene cluster and only if the read did not have a better hit whenblasted against an exhaustive set of marine genomes and the GenBank da-tabase. To test whether the size (i.e., number of orthologues) of a gene clusteradversely affected the number of sequence reads that could be recruited, werandomly excluded different orthologues from talC, cp12, gnd, and zwf geneclusters and repeated the recruitment; we found that as few as one ortho-logue of each gene was sufficient to recruit most of the reads recruited by thefull gene cluster. Additional details are provided in SI Methods.
Infection of SynechococcusWH8109 by Cyanophage Syn9. Choice of strains wasbased on the fact that cyanophage Syn9 carries all four of the PPP genes ofinterest (cp12, talC, zwf, gnd; Table S1), and it readily infects SynechococcusWH8109, which has a sequenced genome. Log-phase SynechococcusWH8109 in the light was inoculated with cyanophage Syn9 at a multiplicityof infection (MOI) of 3. Three infected and three uninfected replicates weremaintained. Uninfected controls were given spent medium instead of phagelysate. Samples were taken at regular intervals to be analyzed for gDNA andRNA. For phage and host gDNA quantification, samples were filtered with0.2-μm polycarbonate filters, and the filtrate was used for extracellularphage gDNA quantification, whereas the retentate was used for in-tracellular phage gDNA quantitation and host gDNA quantification. ForRNA, Synechococcus culture was harvested by centrifugation, flash-frozen inliquid nitrogen, and stored at −80 °C. Detailed descriptions of materials andmethods are provided in SI Methods.
Infection of Prochlorococcus MED4 by Cyanophage P-HM2. Choice of strainswas based on the fact that the transcriptional (24) and proteomic (29) dy-namics of MED4 grown on a light–dark cycle have been studied extensively,and cyanophage P-HM2 was isolated on MED4 and carries the most preva-lent auxiliary metabolic genes (cp12, talC, psbA; Table S1). Procedures wereidentical to those described above except that the MOI was 1, duplicateexperiments were done in which bottles were moved to the light or the darkafter inoculation (two infected and two uninfected replicates for eachtreatment), and culture aliquots were centrifuged for pyridine nucleotideextraction. Detailed descriptions of materials and methods are provided inSI Methods.
qPCR and RT-PCR. qPCR primers (Table S2) were designed from the genomesof cyanophages P-HM2 and Syn9, Prochlorococcus MED4, and SynechococcusWH8109, and were tested by using gDNA and shown to have specific and
concentration-dependent amplification of target DNA. For mRNA quantifi-cation, RNA was extracted from lysed Prochlorococcus or Synechococcus cellpellets, gDNA degraded with DNase I, and first-strand cDNA synthesized fromthe RNA. For both gDNA and mRNA quantitation, copies were measured byusing the QuantiTect SYBR Green PCR Kit (Qiagen) with a LightCycler 480Real-Time PCR System (Roche Diagnostics). Relative copy numbers of eachcDNA over the time course were determined by the ΔΔCT method, with rnpB(RNA component of ribonuclease P) as the internal calibrator gene. Detaileddescriptions of materials and methods are provided in SI Methods.
Cloning, Expression, and Purification of Transaldolases. Transaldolases fromProchlorococcus and cyanophages were PCR-amplified, cloned into pETvectors (Tables S3 and S4) encoding N- or C-terminal 6×His-tags, and trans-formed into BL21 (DE3) expression strains. Large-scale cultures of thesestrains were induced with isopropyl β-D-1-thiogalactopyranoside (IPTG) andincubated for 15 to 35 h at 25 °C or 13 °C. The cells were harvested and lysedby French press or sonication. The recombinant proteins were then purifiedto homogeneity by Ni-NTA affinity chromatography (elution with imidazole)and dialyzed into 50 mM Gly-Gly. Detailed descriptions of materials andmethods are provided in SI Methods.
Transaldolase Assay and Determination of Kinetic Parameters. Transaldolaseactivity was measured by using a coupled assay as described previously (34)and in SI Methods. Enzymes and reagents were from Sigma-Aldrich. Kineticdata were fitted to the Michaelis–Menten equation to determine kineticparameters as described in SI Methods.
Crystal Structure Determination. Prochlorococcus MIT9312 TalB was crystal-lized and its structure solved by X-ray crystallography with molecular re-placement as described in SI Methods. The atomic coordinates and structurefactors for Prochlorococcus MIT9312 TalB have been deposited in the PDB(accession no. 3HJZ).
Structure Homology Modeling and Alignment.A homology model was built forcyanophage P-SSP7 TalC using the structure of T. maritima TalC (PDB ac-cession no. 1VPX) with SWISS-MODEL software, and this structure wasoverlaid with the structure of Prochlorococcus MIT9312 TalB by using UCSFChimera software, both as described in SI Methods.
SEC Determination of Transaldolase Quaternary Structure. SEC was performedwith a Superose 12 column (10 × 300 mm; GE Healthcare) attached toa Waters 2487 HPLC detector. Gel filtration molecular weight standardswere run at the beginning of each experiment and used to determine themolecular weights of Prochlorococcus MIT9312 TalB and cyanophage P-SSP7TalC as described in SI Methods.
Measurement of Pyridine Nucleotides in Prochlorococcus. Pyridine nucleotidesNAD, NADH, NADP, and NADPH were extracted fresh from Prochlorococcuscultures and measured enzymatically as described previously (23) and inSI Methods.
ACKNOWLEDGMENTS. The authors thank Jacob Waldbauer and Erik Zinserfor valuable discussions on carbon metabolism and its regulation; MatthewSullivan for providing phages for genome sequencing; Debbie Lindell forproviding Synechococcus WH8109 gene sequences; Brianne Holmbeck andSara Roggensack for assistance in maintaining cultures; Hong Cui and XiaohuiXu for help in crystallization and data collection; Allison Ortigosa, DanielaHristova, Mohammad Seyedsayamdost, Joseph Cotruvo, Kenichi Yokoyama,Sumit Chakraborty, Alexa Price-Whelan, Arne Materna, Katya Frois-Moniz,Sébastien Rodrigue, Kolea Zimmerman, Daniel Sher, and Nadav Kashtan foradvice on technical issues; James Calvin for statistical assistance; MarciaOsburne for comments on the manuscript; and Jeffrey Palm for assistancein manuscript preparation. This research was funded in part by the Gordonand Betty Moore Foundation (GBMF) through a grant to the Broad Institute.Samples G1170, G1171, and G1172 were sequenced and assembled at theBroad Institute. This study was supported by GBMF, the Department of En-ergy (Genomics:GTL Program), the National Science Foundation (Center forMicrobial Oceanography: Research and Education), and a National Institutesof Health Training Grant (to L.R.T.).
1. De Waard A, Paul AV, Lehman IR (1965) The structural gene for deoxyribonucleic acidpolymerase in bacteriophages T4 and T5. Proc Natl Acad Sci USA 54:1241–1248.
2. Miller ES, et al. (2003) Bacteriophage T4 genome. Microbiol Mol Biol Rev 67:86–156.
3. Mann NH, Cook A, Millard A, Bailey S, Clokie M (2003) Marine ecosystems: Bacterialphotosynthesis genes in a virus. Nature 424:741.
4. Millard A, Clokie MRJ, Shub DA, Mann NH (2004) Genetic organization of the psbADregion in phages infecting marine Synechococcus strains. Proc Natl Acad Sci USA 101:11007–11012.
5. Sullivan MB, Coleman ML, Weigele P, Rohwer F, Chisholm SW (2005) Three Proch-lorococcus cyanophage genomes: signature features and ecological interpretations.PLoS Biol 3:e144.
Thompson et al. PNAS | September 27, 2011 | vol. 108 | no. 39 | E763
MICRO
BIOLO
GY
PNASPL
US

6. Breitbart M, Thompson LR, Suttle CA, Sullivan MB (2007) Exploring the vast diversityof marine viruses. Oceanography (Wash DC) 20:135–139.
7. Lindell D, Jaffe JD, Johnson ZI, Church GM, Chisholm SW (2005) Photosynthesis genesin marine viruses yield proteins during host infection. Nature 438:86–89.
8. Clokie MRJ, et al. (2006) Transcription of a ‘photosynthetic’ T4-type phage duringinfection of a marine cyanobacterium. Environ Microbiol 8:827–835.
9. Lindell D, et al. (2007) Genome-wide expression dynamics of a marine virus and hostreveal features of co-evolution. Nature 449:83–86.
10. Brown C, Lawrence J, Campbell D (2006) Are phytoplankton population densitymaxima predictable through analysis of host and viral genomic DNA content? J MarBiol Assoc UK 86:491–498.
11. Bragg JG, Chisholm SW (2008) Modeling the fitness consequences of a cyanophage-encoded photosynthesis gene. PLoS ONE 3:e3550.
12. Mackenzie JJ, Haselkorn R (1972) Photosynthesis and the development of blue-greenalgal virus SM-1. Virology 49:517–521.
13. Sherman LA (1976) Infection of Synechococcus cedrorum by the cyanophage AS-1M.III. Cellular metabolism and phage development. Virology 71:199–206.
14. Kao CC, Green S, Stein B, Golden SS (2005) Diel infection of a cyanobacterium bya contractile bacteriophage. Appl Environ Microbiol 71:4276–4279.
15. Chen F, Lu J (2002) Genomic sequence and evolution of marine cyanophage P60:a new insight on lytic and lysogenic phages. Appl Environ Microbiol 68:2589–2594.
16. MannNH, et al. (2005) The genome of S-PM2, a “photosynthetic” T4-type bacteriophagethat infects marine Synechococcus strains. J Bacteriol 187:3188–3200.
17. Pope WH, et al. (2007) Genome sequence, structural proteins, and capsidorganization of the cyanophage Syn5: a “horned” bacteriophage of marinesynechococcus. J Mol Biol 368:966–981.
18. Weigele PR, et al. (2007) Genomic and structural analysis of Syn9, a cyanophageinfecting marine Prochlorococcus and Synechococcus. Environ Microbiol 9:1675–1695.
19. Millard AD, Zwirglmaier K, Downey MJ, Mann NH, Scanlan DJ (2009) Comparativegenomics of marine cyanomyoviruses reveals the widespread occurrence ofSynechococcus host genes localized to a hyperplastic region: implications formechanisms of cyanophage evolution. Environ Microbiol 11:2370–2387.
20. Sullivan MB, et al. (2009) The genome and structural proteome of an oceansiphovirus: a new window into the cyanobacterial ‘mobilome’. Environ Microbiol 11:2935–2951.
21. Sullivan MB, et al. (2010) Genomic analysis of oceanic cyanobacterial myovirusescompared with T4-like myoviruses from diverse hosts and environments. EnvironMicrobiol 12:3035–3056.
22. Wedel N, Soll J, Paap BK (1997) CP12 provides a new mode of light regulation ofCalvin cycle activity in higher plants. Proc Natl Acad Sci USA 94:10479–10484.
23. Tamoi M, Miyazaki T, Fukamizo T, Shigeoka S (2005) The Calvin cycle in cyanobacteriais regulated by CP12 via the NAD(H)/NADP(H) ratio under light/dark conditions. PlantJ 42:504–513.
24. Zinser ER, et al. (2009) Choreography of the transcriptome, photophysiology, and cellcycle of a minimal photoautotroph, Prochlorococcus. PLoS ONE 4:e5135.
25. Groben R, et al. (2010) Comparative sequence analysis of CP12, a small proteininvolved in the formation of a Calvin cycle complex in photosynthetic organisms.Photosynth Res 103:183–194.
26. Tompa P (2002) Intrinsically unstructured proteins. Trends Biochem Sci 27:527–533.27. Rusch DB, et al. (2007) The Sorcerer II Global Ocean Sampling expedition: Northwest
Atlantic through eastern tropical Pacific. PLoS Biol 5:e77.
28. Sharon I, et al. (2011) Comparative metagenomics of microbial traits within oceanicviral communities. ISME J 5:1178–1190.
29. Waldbauer JR (2009) Molecular biogeochemistry of modern and ancient marinemicrobes. PhD Thesis (Massachusetts Institute of Technology and Woods HoleOceanographic Institution, Woods Hole, MA).
30. Bräutigam AR, Sauerbier W (1973) Transcription unit mapping in bacteriophage T7. I.In vivo transcription by Escherichia coli RNA polymerase. J Virol 12:882–886.
31. Thorell S, Schürmann M, Sprenger GA, Schneider G (2002) Crystal structure ofdecameric fructose-6-phosphate aldolase from Escherichia coli reveals inter-subunithelix swapping as a structural basis for assembly differences in the transaldolasefamily. J Mol Biol 319:161–171.
32. Schneider S, Sandalova T, Schneider G, Sprenger GA, Samland AK (2008) Replacementof a phenylalanine by a tyrosine in the active site confers fructose-6-phosphatealdolase activity to the transaldolase of Escherichia coli and human origin. J Biol Chem283:30064–30072.
33. Schürmann M, Sprenger GA (2001) Fructose-6-phosphate aldolase is a novel class Ialdolase from Escherichia coli and is related to a novel group of bacterial transaldolases.J Biol Chem 276:11055–11061.
34. Bergmeyer HU, Gawehn K, Grassl M (1974) Enzymes as biochemical reagents.Methods of Enzymatic Analysis, ed Bergmeyer HU (Academic, New York), Vol 1, pp425–522.
35. Samland AK, Sprenger GA (2009) Transaldolase: From biochemistry to human disease.Int J Biochem Cell Biol 41:1482–1494.
36. Russell PW, Müller UR (1984) Construction of bacteriophage ϕX174 mutants withmaximum genome sizes. J Virol 52:822–827.
37. McGrath S, van Sinderen D (2007) Bacteriophage: Genetics and Molecular Biology(Caister, Norfolk, UK).
38. Hatfull GF, et al. (2010) Comparative genomic analysis of 60 Mycobacteriophagegenomes: Genome clustering, gene acquisition, and gene size. J Mol Biol 397:119–143.
39. Wilson W, Carr N, Mann N (1996) The effect of phosphate status on the kinetics ofcyanophage infection in the oceanic cyanobacterium Synechococcus sp. WH 7803.J Phycol 32:506–516.
40. Thompson LR (2010) Auxiliary metabolic genes in viruses infecting marinecyanobacteria. PhD Thesis (Massachusetts Institute of Technology, Cambridge, MA).
41. Wikner J, Vallino J, Steward G, Smith DC, Azam F (1993) Nucleic acids from the hostbacterium as a major source of nucleotides for three marine bacteriophages. FEMSMicrobiol Ecol 12:237–248.
42. Jordan A, Reichard P (1998) Ribonucleotide reductases. Annu Rev Biochem 67:71–98.43. Wedel N, Soll J (1998) Evolutionary conserved light regulation of Calvin cycle activity by
NADPH-mediated reversible phosphoribulokinase/CP12/glyceraldehyde-3-phosphatedehydrogenase complex dissociation. Proc Natl Acad Sci USA 95:9699–9704.
44. Sharon I, et al. (2009) Photosystem I gene cassettes are present in marine virusgenomes. Nature 461:258–262.
45. Alperovitch-Lavy A, et al. (2010) Reconstructing a puzzle: Existence of cyanophagescontaining both photosystem-I and photosystem-II gene suites inferred from oceanicmetagenomic datasets. Environ Microbiol 13:24–32.
46. Glazko G, Makarenkov V, Liu J, Mushegian A (2007) Evolutionary history ofbacteriophages with double-stranded DNA genomes. Biol Direct 2:36.
E764 | www.pnas.org/cgi/doi/10.1073/pnas.1102164108 Thompson et al.
Supporting InformationThompson et al. 10.1073/pnas.1102164108SI MethodsSequences and Gene Annotation. Twenty-four genomes from cya-nophages infecting Prochlorococcus and marine Synechococcuswere included in the analyses (Table S1), three of which arebeing introduced in this study. Complete genome sequences andannotations of published genomes were downloaded from In-tegrated Microbial Genomes (1) and GenBank (2). New cya-nophage genomes P-SSP2 (G1170), P-HP1 (G1171), and P-RSP5 (G1172) were sequenced and assembled at the BroadInstitute by using the method of Henn et al. (3) and annotatedusing the annotation pipeline described by Sullivan et al. (4).We searched the 24 cyanophage genomes for each Calvin cycle
and PPP gene, along with known phage genes in photosyntheticelectron transport and nucleotide biosynthesis, using the genomeannotations. To check for the possibility of uncalled or miscalledgenes in the annotations, we also searched the 24 genomes usingTBLASTN with default parameters, an E-value cutoff of 10−5,and by using all Prochlorococcus or Synechococcus Calvin cycleand PPP genes as queries. In cases of positive hits for genes notreported in the annotations, multiple sequence alignments wereused to confirm the presence of key conserved residues.Hydrophobicity plots were used to compare hydrophobicity
patterns of hypothetical cyanophage CP12 sequences and knownCP12 sequences from plants, algae, and cyanobacteria, by usingthe method of Kyte and Doolittle (5) with a window size of 11residues. Before plotting hydrophobicity, sequences were alignedusing MUSCLE (6) and then trimmed to remove all gappedpositions.
Metagenomic Analyses. The GOS database (7) was downloadedfrom CAMERA (8). The database contained 9,893,120 sequencesfrom 78 unique sites and 8,047,788,530 bp of sequence, with anaverage read length of 813 bp. GOS reads were first recruited toa protein database containing 1,306 previously defined cyano-phage gene clusters (4) from 17 T4-like cultured cyanophagegenomes using BLASTX with an e-value cutoff of 10−4. Geneclusters are referred to as “core” if they are found in all 17 ge-nomes. To improve the fidelity of our recruitment, all reads wererequired to have their top five hits be to the same gene cluster.Each read meeting these criteria was then compared with
a nucleotide database containing 11,770 sequences representingmarine bacteria and phage genomes to recruit each read to itsclosest identifiably homologous marine genome. This databaseincludes genomes of sequenced marine isolates, including Gor-don and Betty Moore Foundation Marine Microbial Initiativegenomes, National Center for Biotechnology Information marineisolates, and cultured cyanophages available from the GenBank(2) and CAMERA (8) databases using BLASTN. All reads witha best hit to a cyanophage sequence (82 total sequences) werethen compared with all sequences in the National Center forBiotechnology Information nucleotide database (downloadedJune 10, 2010) using BLASTN with default parameters to ensurethat there were no better hits to a nonphage sequence in thenucleotide database.To test whether genes with more representatives among the
phage genomes would, as a result, be able to recruit propor-tionally more reads from GOS, we repeated the analysis with sixmodified cyanophage gene cluster databases in which orthologuesof talC, cp12, gnd, and zwf were randomly excluded. Databases 1and 2 contained one orthologue each of the four genes chosenrandomly, databases 3 and 4 contained three orthologues each,and databases 5 and 6 contained five orthologues each. We
found that the number or orthologues of these genes used torecruit GOS reads had little effect on the final counts of iden-tified genes, with talC and cp12 most abundant, followed by gndand zwf, in all analyses.
Infection of Synechococcus WH8109 by Cyanophage Syn9. Synecho-coccus WH8109 was maintained in SN medium (9) made with75% filtered seawater from the Environmental Systems Labo-ratory (Woods Hole, MA). Salts and metals for SN medium werefrom Sigma-Aldrich. Cultures were grown in a “sunbox,”a modified Percival Scientific I-35LL plant growth chamber witha 24-h light–dark cycle consisting of 5 h of increasing light from0 to 320 μE m−2 s−1, 5 h of 320 μE m−2 s−1, 4 h of decreasinglight from 320 to 0 μE m−2 s−1, and 10 h of dark. Temperaturewas maintained at 24 ± 0.2 °C. On the day of infection, 2 hbefore dark, log-phase Synechococcus WH8109 (1 × 10⁸ cellsmL−1 by flow cytometry; Influx; Cytopeia-BD) was inoculatedwith cyanophage Syn9 [3 × 10⁸ infective phage mL−1 by the mostprobable number assay (10)], resulting in an MOI of 3. Threereplicate infected cultures and three replicate uninfected controlcultures of 1 L each were maintained. Uninfected controls weregiven spent medium instead of phage lysate. Both spent mediumand phage lysate were filtered through 0.2-μm polycarbonatefilters (Millipore) before addition. Following addition of phagelysate or spent medium, bottles were transferred to constant lightof 50 μE m−2 s−1.Samples were taken at regular intervals for RNA and gDNA
quantification. For RNA, 1-mL samples were centrifuged at15,000 × g for 2 min at 4 °C, the supernatant aspirated, and thecell pellet flash-frozen in liquid nitrogen and stored at −80 °C.For phage and host gDNA quantification, 100-μL samples werefiltered with 0.2-μm polycarbonate filters. The filtrate was diluted1:1,000 for extracellular phage gDNA quantification. For in-tracellular phage and host gDNA quantification, the filter waswashed with three 1-mL volumes of preservation solution (10mM Tris-HCl, 100 mM EDTA, 500 mM NaCl, pH 8.0) and flash-frozen; the cells were subsequently resuspended in 650 μL 10-mMTris-HCl (pH 8.0) by agitation in a Mini-Beadbeater (BioSpec),the supernatant heated to 95 °C for 15 min, then diluted 1:100.
Infection of Prochlorococcus MED4 by Cyanophage P-HM2. AxenicProchlorococcus MED4 was maintained in Pro99 medium (11)made with filtered Sargasso seawater. Salts and metals for Pro99medium were from Sigma-Aldrich. Cultures were grown in con-stant light of 90 μE m−2 s−1 with cool white fluorescent lamps orconstant dark. Temperature was maintained at 19 to 22 °C. Log-phase ProchlorococcusMED4 (4 × 10⁷ cells mL−1) was inoculatedwith cyanophage P-HM2 (4 × 10⁷ infective phage mL−1), result-ing in an MOI of 1. Cell concentration was determined by flowcytometry, and phage concentration was determined by the mostprobable number assay (10). For both light and dark experiments,which were conducted on separate days, two replicate infectedcultures and two replicate uninfected control cultures of 2 L eachwere maintained. Uninfected controls were given spent mediuminstead of phage lysate. Both spent medium and phage lysatewere filtered through 0.2-μm polycarbonate filters (Millipore)before addition.Following inoculation, cultures were placed in a dark incubator
or returned to the light incubator. Samples were taken at regularintervals to be analyzed for RNA, gDNA, and pyridine nucleo-tides. For phage and host gDNA quantification, 100-μL sampleswere filtered with 0.2-μm polycarbonate filters. The filtrate was
Thompson et al. www.pnas.org/cgi/content/short/1102164108 1 of 13
diluted 1:1,000 for extracellular phage gDNA quantification. Forintracellular phage and host gDNA quantification, the filter waswashed with three 1-mL volumes of preservation solution (10mM Tris-HCl, 100 mM EDTA, 500 mM NaCl, pH 8.0) and flash-frozen; the cells were subsequently resuspended in 650 μL 10mM Tris-HCl (pH 8.0) by agitation in a Mini-Beadbeater, thesupernatant heated to 95 °C for 15 min, then diluted 1:100. ForRNA and pyridine nucleotide samples, 200 mL axenic Pro-chlorococcus culture was harvested by centrifugation at 15,000 × gfor 10 min at 4 °C, decanted, resuspended in approximately 1 mLsupernatant, divided into equal aliquots into four tubes, andcentrifuged again at 15,000 × g for 5 min at 4 °C. Samples forRNA (two tubes) were flash-frozen in liquid nitrogen and storedat −80 °C. Samples for pyridine nucleotides (two tubes) wereextracted fresh as described later.
qPCR and RT-PCR. qPCR primers were designed from the genomesof cyanophage P-HM2 (4), Prochlorococcus MED4 (12), cyano-phage Syn9 (13), and Synechococcus WH8109 (GenBank) usingPrimer3 (14) with a GC clamp of at least 2 bp, yielding productsof 150 to 200 bp. Sequences are given in Table S2. Primers weretested using gDNA and were shown to have specific and con-centration-dependent amplification of target DNA.Cell pellets were resuspended in 100 μL of 10 mM Tris-HCl
(pH 8.0), 100 U RNase inhibitor (SUPERASE-In; Ambion), and15,000 U lysozyme (Ready-Lyse; Epicentre), and incubated at37 °C for 30 min, after which 15,000 U additional lysozyme wereadded, followed by 30 min at 37 °C. RNA was extracted from thislysate by using the Mini RNA Isolation II Kit (Zymo Research),and RNA was eluted with nuclease-free water. This RNA wastreated with 6 U Turbo DNase I (Ambion). cDNA was madefrom this DNase-treated RNA using the iScript cDNA SynthesisKit (Bio-Rad); before cDNA synthesis, the reaction mixturelacking reverse transcriptase was heated to 65 °C for 5 min andthen cooled on ice.gDNA or cDNA copies were quantified by using the Quanti-
Tect SYBR Green PCR Kit (Qiagen) with a LightCycler 480Real-Time PCR System (Roche Diagnostics). qPCR reactionscontained 0.5 μM forward and reverse primers and approxi-mately 0.5 ng μL−1 cDNA. The amplification reaction consistedof an initial activation step of 15 min at 95 °C, followed by 50cycles of 15 s at 95 °C (denaturation), 30 s at 56 °C (annealing),and 30 s at 72 °C (extension), followed by extension for 5 min at72 °C, followed by a melting curve from 50 to 90 °C. Thresholdcycle (CT) of amplification was determined by the second de-rivative maximum method. Concentrations of phage and hostgDNA over the time course were determined with standardcurves of log(concentration of standard) versus CT. Relativecopy numbers of each cDNA over the time course were de-termined by the ΔΔCT method (15), with rnpB (RNA compo-nent of ribonuclease P) as the internal calibrator gene (16).
Measurement of Pyridine Nucleotides in Prochlorococcus. Pyridinenucleotides NAD, NADH, NADP, and NADPH were extractedand measured enzymatically as described previously (17–19).NADH and NADPH standards were from Calbiochem, and allother reagents and enzymes were from Sigma-Aldrich. Pyridinenucleotides were extracted as follows: fresh cell pellets wereresuspended in 200 μL 100 mM HCl, 500 mM NaCl (for de-termination of NAD and NADP), or 200 μL 100 mM NaOH, 500mM NaCl (for determination of NADPH and NADH); theseresuspensions were then heated at 95 °C for 5 min and centri-fuged at 15,000 × g for 5 min at 4 °C, and the supernatants re-moved, flash-frozen in liquid nitrogen, and stored at −80 °C.NADH and NADPH standards of 20, 50, 100, 200, 500, and1,000 nM were prepared in 100 mM NaOH, 500 mM NaCl fromstock solutions whose concentrations were determined by A340.
All assays were carried out at 30 °C in 200-μL reactions.Concentrated master solutions were made such that combining180 μL master solution with 20 μL sample or unknown wouldyield the following final concentrations: 100 mM bicine (pH 8.0),4 mM EDTA, 1.66 mM phenazine ethosulfate, and 0.42 mM 3-(4,5-dimethyl-2-thiazolyl)-2,5-diphenyl-2H-tetrazolium bromide.For determination of NAD and NADH, master solutions alsocontained 10% ethanol and 0.2 U alcohol dehydrogenase (finalconcentrations). For determination of NADP and NADPH,master solutions also contained 5 mM glucose 6-phosphate and0.2 U glucose-6-phosphate dehydrogenase (final concentrations).Assays were initiated by combining 180 μL master solution with20 μL Prochlorococcus extract or 20 μL NADH or NADPHstandard. All assays were performed in duplicate. Time-de-pendent increases in A550 were monitored using an UltramarkMicroplate Reader (Bio-Rad) for approximately 20 min. Ab-sorbance data were smoothed by using the robust LOESSmethod (span, 20%), and rates were calculated by linear re-gression analysis, implemented with MATLAB software. Stan-dard curves were then used to calculate NAD, NADH, NADP,or NADPH concentrations, from which relevant ratios werecalculated.
Sequence Alignment and Phylogenetics. Transaldolase proteinsequences were downloaded from GenBank (2) or pulled directlyfrom genome sequences. Multiple sequence alignments werebuilt by using ClustalW 1.83 (20), with alignment of trans-aldolase sequences assisted by the structure-based alignment ofThorell et al. (21). For phylogenetic analysis, positions with gapswere removed if they were present in at least 50% of sequences.A tree was built by using the maximum likelihood algorithmimplemented by PhyML (22), and statistical tests of brancheswere done using aLRT (approximate likelihood-ratio test)parametric statistics with χ2-based parametric branch supports(23). The tree was then midpoint rooted and displayed usingTreeView (24).
Gene Size Comparison of Shared Phage and Host Orthologues. Sizesof genes predicted to encode the same functions in cyanophagesand their hosts were compared. Predicted protein functionsshared by phage and host genomes were identified and gene sizesobtained from clusters of orthologous groups (COG) functions onthe ProPortal Web site (http://proportal.mit.edu). Gene ortho-logues were included in the analysis only if they were found in atleast three cyanophage genomes and at least three Pro-chlorococcus or Synechococcus genomes, and only if they wereenriched in cyanophages relative to noncyanophages, as definedby Sullivan et al. (4). For the phage class Ia RNR, made fromone catalytic subunit (α, encoded by nrdA) and a second essentialsubunit that contains the metallo-cofactor (β, encoded by nrdB),only the length of nrdA was used. For phycoerythrobilin syn-thase, two genes are required in the host for the same activitycarried out by one gene in phage, and thus the sum of the twohost gene sizes was used (plus sign in Table S6). Median phageand host gene sizes were compared using the Mann–Whitney–Wilcoxon rank-sum test (25). Differences were considered sig-nificant if P < 0.05, corrected for false discovery rate using theBenjamini–Hochberg method for multiple comparisons (26).Additional information on the COGs used and statistical tests isfound in Table S6.
Materials for Cloning, Expression, Purification, and Assay ofTransaldolase Proteins. Phusion High-Fidelity Polymerase wasfrom New England Biolabs. Champion pET Directional TOPOvectors and E. coli BL21 Star (DE3) One Shot chemicallycompetent cells were from Invitrogen. BL21-CodonPlus (DE3)-RIPL competent cells and ArcticExpress (DE3) competent cellswere from Stratagene. F6P (w98% by enzymatic assay; lot no.
Thompson et al. www.pnas.org/cgi/content/short/1102164108 2 of 13

015K7013), E4P (w60% by enzymatic assay; lot no. 115K3789),rabbit-muscle TPI (4,400 U/mg; lot no. 035K7457), and rabbit-muscle G3PDH (270 U/mg; lot no. 035K7457) were from Sigma-Aldrich. IPTG and 1,4-DTT were from Promega. DNase andComplete Mini EDTA-free protease inhibitor tablets were fromRoche. BugBuster protein extraction reagent was from Novagen.Gel filtration molecular weight standards were from Bio-Rad.NADH was from Calbiochem.
Cloning of Recombinant Transaldolases. Prochlorococcus and cya-nophage gDNA were isolated using a Qiagen DNeasy Blood andTissue kit (cells) or used directly (phage) and amplified by PCRby using Phusion High-Fidelity Polymerase, with primer se-quences given in Tables S3 and S4. Amplicons were cloned intoChampion pET Directional TOPO vector pET100 or pET101 orplasmid p15TvLic. Plasmid p15TvLic is a modified version ofvector pET-15b from Novagen in which the tobacco etch virus(TEV) protease cleavage site replaces the thrombin cleavage siteand a double stop codon is inserted downstream of the BamHIsite (27). Additional information on constructs is contained inTables S3 and S4. Sequences of talB and talC constructs wereconfirmed by DNA sequencing at the Massachusetts Institute ofTechnology Biopolymers Laboratory. Cyanophage talC pET101constructs were transformed into E. coli BL21 Star (DE3) OneShot chemically competent cells, Prochlorococcus MIT9312 talBp15TvLic construct was transformed into BL21-CodonPlus(DE3)-RIPL competent cells, and Prochlorococcus talB pET100constructs were transformed into ArcticExpress (DE3) compe-tent cells.
Expression and Purification of Prochlorococcus TalB. The expressionand purification of Prochlorococcus MED4 TalB is described;similar expression and purification protocols were used forProchlorococcus MIT9312 TalB and Prochlorococcus NATL2ATalB. Cells carrying the pET constructs were grown in Luria–Bertani medium containing 100 μg/mL ampicillin and 20 μg/mLgentamicin, with shaking at 37 °C. When OD600 reached 0.5,temperature was reduced to 13 °C and cultures incubated untilOD600 was 1.0 (w3 h), at which time they were induced with 0.5mM IPTG. Following 35 h of growth at 13 °C, cells were har-vested by centrifugation for 10 min at 3,000 × g. Typical yield was4 g cell paste per liter of culture.Cell paste (16 g) was resuspended in 80 mL of buffer A [50 mM
Gly-Gly (pH 8.0), 500 mM NaCl, and 5% glycerol] with 10 mMimidazole, 1 mg/mL lysozyme, 10 U/mL DNase, and two Com-plete Mini EDTA-free protease inhibitor tablets. This resus-pension was lysed using a French pressure cell press (ThermoScientific) at 14,000 psi, and the lysate was centrifuged for 10 minat 40,000 × g. The supernatant fraction was incubated with Ni-NTA resin (16 mL; Qiagen) and buffer A with 10 mM imidazolein a final volume of 160 mL. The slurry was poured into a col-umn, and material unbound to the resin was allowed to flowthrough, followed by washes of 40 column volumes of buffer Acontaining 10 mM imidazole. Bound proteins were eluted witha 100 × 100-mL linear gradient of 10 to 300 mM imidazole inBuffer A. TalB eluted at 120 mM imidazole, and fractions withhigh protein content (based on A280) or high activity were pooledand concentrated with Amicon Ultra-15 centrifugal filter units(Millipore). Concentrated protein was diluted 1:100 to reducethe salt concentration, and this solution was loaded onto a QSepharose Fast Flow anion-exchange column (5.5 × 6.5 cm, 150mL) preequilibrated with 50 mM Gly-Gly (pH 8.0) containing 5mM NaCl. Protein was eluted by using a 250 × 250-mL lineargradient of 5 to 500 mM NaCl in 50 mM Gly-Gly (pH 8.0). TalBeluted at 250 mM NaCl, and fractions with high A280 or highactivity were pooled and concentrated. The concentrated proteinwas loaded onto a Sephadex G-25 size-exclusion column (2.5 ×41 cm, 200 mL) preequilibrated with 50 mM Gly-Gly (pH 8.0).
Fractions with high A280 were pooled and concentrated. PurifiedTalB aliquots were stored in 10% glycerol at −80 °C. Proteinconcentrations were determined according to a previously de-scribed method (28).Purification of Prochlorococcus MIT9312 TalB was similar to
that described earlier with the following exceptions. Protein ex-pression was induced overnight at 18 °C. Cells were lysed bysonication rather than French press. Following purification byNi-NTA affinity chromatography, the protein was dialyzed andconcentrated in a buffer with 10 mM Hepes (pH 7.5), 300 mMNaCl, and 0.5 mM Tris(2-carboxyethyl)phosphine (TCEP).
Expression and Purification of Cyanophage TalC. The expression andpurification of cyanophage P-SSM2 TalC is described; nearlyidentical expression and purification protocols were used forcyanophage P-SSM4 TalC and cyanophage P-SSP7 TalC. Cellscarrying the pET constructs were grown in Luria–Bertani mediumcontaining 100 μg/mL ampicillin, with shaking at 37 °C. WhenOD600 reached 0.7, temperature was reduced to 25 °C and culturesincubated until OD600 was 1.0 (w1 h), at which time they wereinduced with 0.5 mM IPTG. Following 15 h of growth at 25 °C,cells were harvested by centrifugation for 10 min at 3,000 × g.Typical yield was 5 g cell paste per liter of culture.Cell paste (20 g) was resuspended in 100 mL of buffer A with 20
mM imidazole, 1 mg/mL lysozyme, 10 U/mL DNase, and twoComplete Mini EDTA-free protease inhibitor tablets. Thisresuspension was lysed by using a French pressure cell press at14,000 psi, and the lysate was centrifuged for 10 min at 40,000 × g.The supernatant fraction was incubated with Ni-NTA resin (40mL) and buffer A with 20 mM imidazole in a final volume of 400mL. The slurry was poured into a column and material notbound to the resin was allowed to flow through, followed bywashes with 40 column volumes of buffer A containing 20 mMimidazole. Bound proteins were eluted with a 200 × 200-mLlinear gradient of 20 to 500 mM imidazole. TalC eluted at 160mM imidazole, and fractions with high protein content (based onA280) or high activity were pooled and concentrated with AmiconUltra-15 centrifugal filter units. The concentrated protein wastransferred into 50 mM Gly-Gly (pH 8.0) by using dialysis witha Slide-A-Lyzer dialysis cassette. Purified TalC aliquots werestored in 10% glycerol at −80 °C. Protein concentrations weredetermined according to a previously published method (28).
Transaldolase Assay. Transaldolase activity was measured by usinga coupled assay as described previously (29). A typical assay ina final volume of 500 μL contained 50 mM Gly-Gly (pH 8.0), 15mM MgCl2, 10 mM F6P, 1 mM E4P, 0.2 mM NADH, 10 mMDTT, 0.6 U TPI, 0.06 U G3PDH, and transaldolase (w0.5 μg or0.005 U). F6P and E4P concentrations were determined by usingendpoint assays. NADH consumption was measured by A340 (εof 6.2 mM−1 cm−1) with a Cary 3 UV–visible spectrophotometer(Varian) or an Ultramark Microplate Reader (Bio-Rad). Cu-vettete path length for Cary 3 assays was 1 cm, whereas pathlength for microtiter plate wells was determined empirically withNADH standards, and a correction factor of 1.785 was applied toUltramark A340 measurements to make them comparable toCary 3 A340 measurements. For assays using the Cary 3 spec-trophotometer, a solution containing Gly-Gly, MgCl2, F6P, E4P,NADH, and DTT (480 μL, final concentrations as describedearlier) was equilibrated at 25 °C and monitored for 1 min toconfirm no change in A340. A solution of TPI and G3PDH (10μL, final concentrations as described earlier) was added and anychange in A340 allowed to dissipate for approximately 5 min.Transaldolase (10 μL) was added, and the change in A340monitored for 5 min. For assays using the Ultramark reader, twomicrotiter plates were used, and the assay volume was reduced to200 μL. In plate A, buffer, F6P, and transaldolase (180 μL, finalconcentrations as described earlier) were premixed and in-
Thompson et al. www.pnas.org/cgi/content/short/1102164108 3 of 13

cubated at 25 °C for 10 min. In plate B, E4P, NADH, TPI, andG3PDH (20 μL, final concentrations as described earlier) wereincubated at room temperature for 10 min. The contents of plateA (180 μL) were added to plate B to initiate the assay.
Determination of Kinetic Parameters. Kinetic parameters weredetermined using Eq. S1, where F6P (10 mM) or E4P (1 mM)was kept constant and the other substrate was varied from 0.05to 20 × Km. Kinetic data were fitted to Eq. S1 by using linearleast-squares analysis implemented with MATLAB software(MathWorks).
v ¼ Vmax½S�Km þ ½S� [S1]
Crystallization Conditions. Prochlorococcus MIT9312 TalB (19 mg/mL) in 0.2 M Hepes (pH 7.5), 500 mM NaCl, and 0.5 mM TCEPwas transferred to 10 mM Hepes (pH 7.5), 300 mM NaCl, and0.5 mM TCEP by dialysis and concentrated to 19 mg/mL.Crystallization was performed at room temperature (21 °C), anda homemade preparation of TEV protease was added in a ratioof protease to TalB of 1:20 to remove the His-tag from TalB; theprotease was not removed before crystallization. Crystallizationtrials were performed by using hanging-drop vapor diffusion withan optimized sparse matrix crystallization screen (30). Thecrystal used for the data collection (Table S5) was obtained byusing a crystallization liquor containing final concentrations of20% PEG10K and 0.1 M Hepes (pH 7.5). Crystals were cry-oprotected in 20% PEG10K, 0.1 M Hepes (pH 7.5), and 10%ethylene glycol, then rinsed in Paratone-N oil (Hampton Re-search) and immediately flash-frozen in liquid nitrogen andstored in liquid nitrogen before data collection.
Data Collection, Structure Determination, and Refinement. Diffrac-tion data were collected at 100 °K on a Rigaku Micromax-007rotating anode generator equipped with Osmic mirrors. Dif-fraction data were recorded on an R-Axis IV++ detector andintegrated and scaled by using HKL2000 (31). The structure ofProchlorococcus MIT9312 TalB was solved by molecular re-placement by using the coordinates of human TALDO1 (PDBaccession no. 1F05) (32) as the initial model. The programPHASER (33), as part of the CCP4 program suite (34), was usedto find the position of TalB monomer in the unit cell. The modelwas then improved by alternate cycles of manual building andwater-picking by using COOT (35) and restrained refinementagainst a maximum-likelihood target with 5% of the reflectionsrandomly excluded as an Rfree test set. All refinement steps were
performed by using REFMAC (36) in the CCP4 program suite.Only one residue (residue 333) of the 333-residue protein wasomitted in the model because of poor electron density. The finalmodel contains one molecule of TalB, 341 water molecules, and45 atoms from other small molecules and ions, and was refinedto an Rwork and Rfree of 15.6% and 20.3%, respectively. Datacollection, phasing, and structure refinement statistics are sum-marized in Table S5. The Ramachandran plot generated byPROCHECK (37) showed excellent stereochemistry overall,with 100% of the residues in the most favored and additionalallowed regions. The atomic coordinates and structure factorsfor Prochlorococcus MIT9312 TalB have been deposited in PDB(accession no. 3HJZ).
Structure Homology Modeling and Alignment. Homology modelswere built by using the ClustalW multiple sequence alignmentdescribed earlier, and existing crystal structures using the align-ment mode of the SWISS-MODEL workspace (38, 39). Se-quences of TalC from cyanophages P-SSM2, P-SSM4, and P-SSP7 were modeled by using the structure of T. maritima TalC(Joint Center for Structural Genomics; PDB accession no.1VPX), and sequences of TalB from Prochlorococcus MED4 andNATL2A were modeled by using the structure of Pro-chlorococcusMIT9312 (present study; PDB accession no. 3HJZ).For visualization of superimposed 3D structures, structure
alignments and molecular graphics images were produced usingthe University of California, San Francisco, Chimera package(40). Alignments were done using the MatchMaker tool in Chi-mera, with best-aligning pairs of chains aligned using the Nee-dleman–Wunsch algorithm and the BLOSUM-30 scoring matrix,depending on the average sequence identity among pairs of se-quences. Raytraced images were produced with Persistence ofVision Raytracer (version 3.6) software (http://www.povray.org/).
SEC Determination of Oligomerization State. SEC was performed byusing a Superose 12 column (10 × 300 mm; GE Healthcare)attached to a Waters 2487 HPLC detector. Gel filtration mo-lecular weight standards were vitamin B12 (1.35 kDa), myoglo-bin (17 kDa), ovalbumin (44 kDa), γ-globulin (158 kDa), andthyroglobulin (670 kDa). The elution buffer was 50 mM Gly-Gly(pH 8.0), 150 mM NaCl. Molecular mass standards were run atthe beginning of each experiment. TalB or TalC (40 μL, 10 mg/mL) was injected onto the column. The flow rate was 0.5 mL/min. A280 was monitored. Plots of log(molecular weight stan-dard) vs. retention time were used to estimate molecular weightsof TalB and TalC.
1. Markowitz VM, et al. (2006) The integrated microbial genomes (IMG) system. NucleicAcids Res 34(database issue):D344eD348.
2. Benson DA, Karsch-Mizrachi I, Lipman DJ, Ostell J, Wheeler DL (2008) GenBank.Nucleic Acids Res 36(database issue):D25eD30.
3. Henn MR, et al. (2010) Analysis of high-throughput sequencing and annotationstrategies for phage genomes. PLoS ONE 5:e9083.
4. Sullivan MB, et al. (2010) Genomic analysis of oceanic cyanobacterial myovirusescompared with T4-like myoviruses from diverse hosts and environments. EnvironMicrobiol 12:3035e3056.
5. Kyte J, Doolittle RF (1982) A simple method for displaying the hydropathic characterof a protein. J Mol Biol 157:105e132.
6. Edgar RC (2004) MUSCLE: Multiple sequence alignment with high accuracy and highthroughput. Nucleic Acids Res 32:1792e1797.
7. Rusch DB, et al. (2007) The Sorcerer II Global Ocean Sampling expedition: NorthwestAtlantic through eastern tropical Pacific. PLoS Biol 5:e77.
8. Seshadri R, Kravitz SA, Smarr L, Gilna P, Frazier M (2007) CAMERA: A communityresource for metagenomics. PLoS Biol 5:e75.
9. Waterbury J, Willey J (1988) Isolation and growth of marine planktonic cyanobacteria.Methods Enzymol 167:100e105.
10. Tillett HE (1987) Most probable numbers of organisms: Revised tables for the multipletube method. Epidemiol Infect 99:471e476.
11. Moore L, et al. (2007) Culturing the marine cyanobacterium Prochlorococcus. LimnolOceanogr Methods 5:353e362.
12. Rocap G, et al. (2003) Genome divergence in two Prochlorococcus ecotypes reflectsoceanic niche differentiation. Nature 424:1042e1047.
13. Weigele PR, et al. (2007) Genomic and structural analysis of Syn9, a cyanophageinfecting marine Prochlorococcus and Synechococcus. Environ Microbiol 9:1675e1695.
14. Rozen S, Skaletsky H (2000) Primer3 on the WWW for general users and for biologistprogrammers. Methods Mol Biol 132:365e386.
15. Pfaffl MW (2001) A new mathematical model for relative quantification in real-timeRT-PCR. Nucleic Acids Res 29:e45.
16. Fernández-González B, Martínez-Férez IM, Vioque A (1998) Characterization of twocarotenoid gene promoters in the cyanobacterium Synechocystis sp. PCC 6803.Biochim Biophys Acta 1443:343e351.
17. Maciejewska U, Kacperska A (1987) Changes in the level of oxidized and reducedpyridine nucleotides during cold acclimation of winter rape plants. Physiol Plant 69:687e691.
18. Leonardo MR, Dailly Y, Clark DP (1996) Role of NAD in regulating the adhE gene ofEscherichia coli. J Bacteriol 178:6013e6018.
19. Tamoi M, Miyazaki T, Fukamizo T, Shigeoka S (2005) The Calvin cycle in cyanobacteriais regulated by CP12 via the NAD(H)/NADP(H) ratio under light/dark conditions. PlantJ 42:504e513.
20. Thompson JD, Higgins DG, Gibson TJ (1994) CLUSTAL W: Improving the sensitivity ofprogressive multiple sequence alignment through sequence weighting, position-specific gap penalties and weight matrix choice. Nucleic Acids Res 22:4673e4680.
Thompson et al. www.pnas.org/cgi/content/short/1102164108 4 of 13

21. Thorell S, Schürmann M, Sprenger GA, Schneider G (2002) Crystal structure ofdecameric fructose-6-phosphate aldolase from Escherichia coli reveals inter-subunithelix swapping as a structural basis for assembly differences in the transaldolasefamily. J Mol Biol 319:161e171.
22. Guindon S, Gascuel O (2003) A simple, fast, and accurate algorithm to estimate largephylogenies by maximum likelihood. Syst Biol 52:696e704.
23. Anisimova M, Gascuel O (2006) Approximate likelihood-ratio test for branches: A fast,accurate, and powerful alternative. Syst Biol 55:539e552.
24. Page RDM (2002) Visualizing phylogenetic trees using TreeView. Curr ProtocBioinformatics Chapter 6:Unit 6.2.
25. Mann HB, Whitney DR (1947) On a test of whether one of two random variables isstochastically larger than the other. Ann Math Stat 18:50e60.
26. Benjamini Y, Hochberg Y (1995) Controlling the false discovery rate: A practical andpowerful approach to multiple testing. J Roy Stat Soc B Met 57:289e300.
27. Zhang RG, et al. (2001) Structure of Thermotoga maritima stationary phase survivalprotein SurE: A novel acid phosphatase. Structure 9:1095e1106.
28. Bradford MM (1976) A rapid and sensitive method for the quantitation of microgramquantities of protein utilizing the principle of protein-dye binding. Anal Biochem 72:248e254.
29. Bergmeyer HU, Gawehn K, Grassl M (1974) Enzymes as biochemical reagents. InMethods of Enzymatic Analysis, ed Bergmeyer HU (Academic, New York), Vol Vol 1,pp 425e522.
30. Kimber MS, et al. (2003) Data mining crystallization databases: Knowledge-basedapproaches to optimize protein crystal screens. Proteins 51:562e568.
31. Minor W, Cymborowski M, Otwinowski Z, Chruszcz M (2006) HKL-3000: Theintegration of data reduction and structure solution—from diffraction images to aninitial model in minutes. Acta Crystallogr D Biol Crystallogr 62:859e866.
32. Thorell S, Gergely P Jr., Banki K, Perl A, Schneider G (2000) The three-dimensionalstructure of human transaldolase. FEBS Lett 475:205e208.
33. McCoy AJ, Grosse-Kunstleve RW, Storoni LC, Read RJ (2005) Likelihood-enhanced fasttranslation functions. Acta Crystallogr D Biol Crystallogr 61:458e464.
34. Collaborative Computational Project Number 4 (1994) The CCP4 suite: Programs forprotein crystallography. Acta Crystallogr D Biol Crystallogr 50:760e763.
35. Emsley P, Cowtan K (2004) Coot: model-building tools for molecular graphics. ActaCrystallogr D Biol Crystallogr 60:2126e2132.
36. Murshudov GN, Vagin AA, Dodson EJ (1997) Refinement of macromolecularstructures by the maximum-likelihood method. Acta Crystallogr D Biol Crystallogr 53:240e255.
37. Laskowski RA, MacArthur MW, Moss DS, Thornton JM (1993) AQUA and PROCHECK-NMR: Programs for checking the quality of protein structures solved by NMR. J ApplCryst 26:283e291.
38. Schwede T, Kopp J, Guex N, Peitsch MC (2003) SWISS-MODEL: An automated proteinhomology-modeling server. Nucleic Acids Res 31:3381e3385.
39. Arnold K, Bordoli L, Kopp J, Schwede T (2006) The SWISS-MODEL workspace: a web-based environment for protein structure homology modelling. Bioinformatics 22:195e201.
40. Pettersen EF, et al. (2004) UCSF Chimera—a visualization system for exploratoryresearch and analysis. J Comput Chem 25:1605e1612.
Fig. S1. Multiple sequence alignment of CP12 sequences from cyanophages, cyanobacteria, algae, and plants. Despite amino acid identities between CP12orthologues of less than 10%, all sequences exhibit a similar pattern of predominantly hydrophilic residues, characteristic of intrinsically unstructured proteinslike CP12, and all sequences contain the C-terminal motif CxxxPxxxxC, which is conserved in nearly all CP12 proteins.
Thompson et al. www.pnas.org/cgi/content/short/1102164108 5 of 13

0 2 4 6 80
0.5
1
1.5
2
2.5
3
3.5x 10
8
Time after infection (h)
Gen
ome
copi
es m
L−1
Free phageIntracellular phageHost cells
0 2 4 6 810
−6
10−5
10−4
10−3
10−2
10−1
Time after infection (h)
mR
NA
exp
ress
ion
rela
tive
to rn
pB
psbAcp12talCnrdAnrdBg61 (early)g20 (late)
0 2 4 6 80
0.5
1
1.5
2
2.5
3
3.5x 10
8
Gen
ome
copi
es m
L−1
Free phageIntracellular phageHost cells
0 2 4 6 810
−6
10−5
10−4
10−3
10−2
10−1
Time after infection (h)
mR
NA
exp
ress
ion
rela
tive
to rn
pB
psbAcp12talCnrdAnrdBg61 (early)g20 (late)
A
C
B
D
Time after inoculation (h) Time after inoculation (h)
0 0
Light Dark
Fig. S2. Infection dynamics and mRNA levels of Prochlorococcus MED4 infected by cyanophage P-HM2 in the light and in the dark. Error bars represent SDs ofthree technical and two biological replicates. (A and B) Degradation of host gDNA and replication of phage gDNA (free and intracellular) as determined byqPCR of chromosomal genes. Host DNA degradation and phage replication in the dark were severely stunted relative to infection in the light. (C and D)Expression of phage metabolic genes as determined by RT-qPCR. Known T4-like phage early (g61, DNA primase) and late (g20, portal protein) genes were usedto calibrate the timing of expression, showing that all phage metabolic genes were expressed early. In the light, cp12 was coexpressed with genes for pho-tosystem II (psbA), the PPP (talC), and RNR (nrdA, nrdB). In the dark, these genes were also coexpressed but at levels 100 to 1,000 fold lower than in the light.
Thompson et al. www.pnas.org/cgi/content/short/1102164108 6 of 13
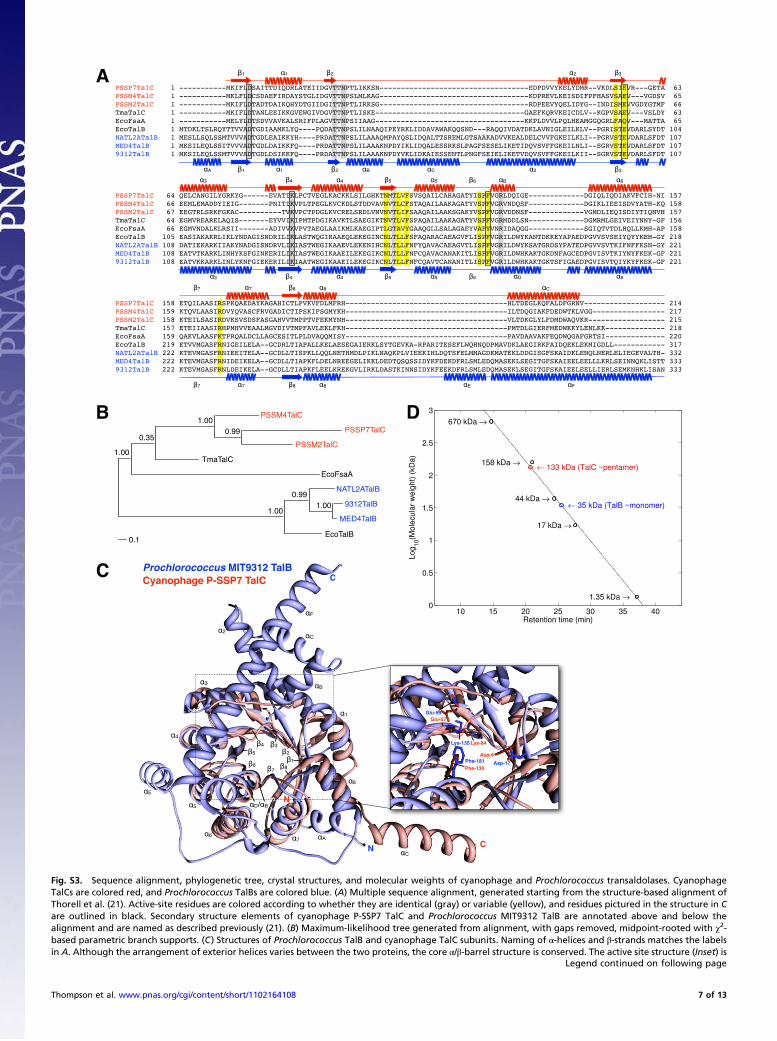
Fig. S3. Sequence alignment, phylogenetic tree, crystal structures, and molecular weights of cyanophage and Prochlorococcus transaldolases. CyanophageTalCs are colored red, and Prochlorococcus TalBs are colored blue. (A) Multiple sequence alignment, generated starting from the structure-based alignment ofThorell et al. (21). Active-site residues are colored according to whether they are identical (gray) or variable (yellow), and residues pictured in the structure in Care outlined in black. Secondary structure elements of cyanophage P-SSP7 TalC and Prochlorococcus MIT9312 TalB are annotated above and below thealignment and are named as described previously (21). (B) Maximum-likelihood tree generated from alignment, with gaps removed, midpoint-rooted with χ2-based parametric branch supports. (C) Structures of Prochlorococcus TalB and cyanophage TalC subunits. Naming of α-helices and β-strands matches the labelsin A. Although the arrangement of exterior helices varies between the two proteins, the core α/β-barrel structure is conserved. The active site structure (Inset) is
Legend continued on following page
Thompson et al. www.pnas.org/cgi/content/short/1102164108 7 of 13

also conserved, including the arrangement of the Schiff base-forming lysine (Lys-135, MIT9312 TalB numbering), proton-donating/accepting glutamate (Glu-99)and aspartate (Asp-17), and specificity-determining phenylalanine (Phe-181). (D) Molecular weights of Prochlorococcus MIT9312 TalB and cyanophage P-SSP7TalC determined by size-exclusion chromatography. Retention times for TalB are shown in blue, TalC in red, and molecular weight standards in black. TmaTalC,T. maritima TalC; PSSM2TalC, cyanophage P-SSM2 TalC; PSSM4TalC, cyanophage P-SSM4 TalC; PSSP7TalC, cyanophage P-SSP7 TalC; EcoFsaA, E. coli FsaA;EcoTalB, E. coli TalB; NATL2ATalB, Prochlorococcus NATL2A TalB; MED4TalB, Prochlorococcus MED4 TalB; and 9312TalB, Prochlorococcus MIT9312 TalB.
Fig. S4. SDS/PAGE and transaldolase activity of Prochlorococcus TalB and cyanophage TalC. (A) SDS/PAGE gels of purified TalB and TalC loaded with 2 to 10 μgprotein. Molecular weight standards were run in each gel; standards of 37 kDa or 25 kDa are labeled. (B) A typical assay demonstrating transaldolase activity,showing A340 (NADH) decrease over time as an indicator, via coupling enzymes, of transaldolase activity (SI Methods). No appreciable activity was detectedwithout the addition of E4P, which in transaldolase serves as an acceptor substrate for DHA. This is shown here for cyanophage P-SSP7 TalC and was dem-onstrated for all cyanophage and Prochlorococcus transaldolases tested.
0.5
1
2
NA
DP
H /
NA
DP
or
NA
DH
/ N
AD
2009−12−20−Errorbar−Redox−Both
NADH / NADNADPH / NADP
0
1
PA
R
1pm 5pm 9pm 1am 5am 9am 1pm 5pm 9pm 1am 5am 9am 1pm
0.5
0.7
0.9
Time of day
NA
DP
(H)
/ NA
D(H
)
NADP(H) / NAD(H)
Fig. S5. Redox (Top) and phosphorylation state (Bottom) dynamics of pyridine nucleotides NADPH, NADP, NADH, and NAD in ProchlorococcusMED4 over two24-h light–dark cycles. Relative photosynthetically available radiation (PAR) is shown above the graphs. Error bars represent SDs of two technical and twobiological replicates.
Thompson et al. www.pnas.org/cgi/content/short/1102164108 8 of 13

Table
S1.
DistributionofallP
PP,selectphotosyntheticelectrontran
sport,a
ndselect
nucleo
tidebiosynthesisgen
esin
24cyan
ophag
egen
omes,w
ithad
ditional
inform
ationforthree
new
T7-likepodovirusgen
omes
Strain
Type
Original
host
Locationisolated
Size
,kb
pGC,%
Ref.
PPP
Photosynthetic
electrontran
sport
Nucleo
tide
biosynthesis
talC
cp12
gnd
zwf
psbA
psbD
petE
petF
PTOX
hli
nrd
cobS
thyX
P-SS2
SPro.MIT93
13Atlan
ticslopewaters
107.5
52.3
1—
x—
——
——
——
—J
—x
P-SSP7
T7Pro.MED
4Sa
rgasso
Sea
45.0
38.8
2x
——
—x
——
——
xJ
——
P-SSP2
aT7
Pro.MIT93
12Sa
rgasso
Sea
45.9
37.9
Presen
tstudy
x—
——
x—
——
—x
J—
—
P-RSP
5bT7
Pro.NATL
1ARed
Sea
47.7
38.7
Presen
tstudy
x—
——
x—
——
—x
J—
—
P-HP1
cT7
Pro.NATL
2AHaw
ai’i
47.5
39.9
Presen
tstudy
xx
——
x—
——
—x
J—
—
P60
T7Syn.W
H78
03Geo
rgia
coastalrive
r47
.953
.23
——
——
——
——
——
J—
xSyn5
T7Syn.WH81
09Sa
rgasso
Sea
46.2
55.0
4—
——
——
——
——
—J
—x
P-HM2
T4Pro.MED
4Haw
ai’i
183.8
38.0
5x
x—
—x
x—
——
xAB
xx
P-HM1
T4Pro.MED
4Haw
ai’i
181.0
38.0
5x
x—
—x
x—
—x
xAB
xx
P-SSM4
T4Pro.NATL
2ASa
rgasso
Sea
178.2
36.7
2x
x—
—x
x—
—x
xAB
xx
P-RSM
4T4
Pro.MIT93
03Red
Sea
176.4
38.0
5x
x—
—x
——
—x
xAB
xx
P-SSM7
T4Pro.NATL
1ASa
rgasso
Sea
182.2
37.0
5x
x—
—x
——
x—
xAB
xx
P-SSM2
T4Pro.NATL
1ASa
rgasso
Sea
252.4
35.5
2x
x—
—x
—x
x—
xAB
xx
S-PM
2T4
Syn.W
H78
03En
glishChan
nel
196.3
37.8
6—
——
—x
x—
——
xAB
xx
S-SSM7
T4Syn.WH81
09Sa
rgasso
Sea
232.9
39.0
5x
x—
—x
—x
—x
xAB
xx
Syn33
T4Syn.WH78
03GulfStream
174.4
40.0
5x
x—
—x
xx
x—
xAB
xx
S-Sh
M2
T4Syn.WH81
02Atlan
ticshelfwaters
179.6
41.0
5x
xx
—x
xx
——
xAB
xx
Syn1
T4Syn.W
H81
01W
oodsHole
191.2
41.0
5x
xx
—x
xx
——
xAB
xx
S-SM
1T4
Syn.WH65
01Atlan
ticslopewaters
178.5
41.0
5x
xx
xx
xx
—x
xAB
xx
S-SSM5
T4Syn.WH81
02Sa
rgasso
Sea
176.2
40.0
5x
xx
xx
xx
—x
xAB
xx
Syn9
T4Syn.W
H80
12W
oodsHole
177.3
40.5
7x
xx
xx
xx
—x
xAB
xx
Syn19
T4Syn.WH81
09Sa
rgasso
Sea
175.2
41.0
5x
xx
xx
xx
—x
xAB
xx
S-RSM
4T4
Syn.W
H81
03Red
Sea
194.5
41.1
8x
xx
xx
xx
xx
xAB
xx
S-SM
2T4
Syn.WH80
17Atlan
ticslopewaters
190.8
40.0
5x
xx
xx
xx
xx
xAB
xx
Phag
estrainsareclassified
byphag
etype(S,siphovirus;T7
,T7-lik
epodovirus;T4
,T4-lik
emyo
virus)an
dhostofisolation(Pro.,Proch
loroco
ccus;Sy
n.,Sy
nechoco
ccus).A
dditional
sourcewater
inform
ationfornew
gen
omes:a
,P-SSP
2isolatedfrom
31°48’N64
°16’W
at12
0m
onSe
ptember
28,1
995;
b,P
-RSP
5isolatedfrom
29°28’N34
°55’Eat
130m
onSe
ptember
13,2
000;
c,P-HP1
isolatedfrom
22°45’N15
8°00
’Wat
25m
on
March
8,20
06.G
eneproducts:talC,transaldolase;cp12
,CP1
2;gnd,6
-phosphogluco
natedeh
ydrogen
ase;
zwf,gluco
se-6-phosphatedeh
ydrogen
ase;
psbA,p
hotosystem
IIprotein
D1;
psbD,p
hotosystem
IIprotein
D2;
petE,
plastocyan
in;petF,
ferred
oxin;PT
OX,plastoquinolterm
inal
oxidase;
hli,
high-lightinducible
protein;nrdJ,classIIRNR;nrdAB,classIa
RNR;co
bS,
cobaltch
elatase;
andthyX
,thym
idylatesynthase.
1.Su
lliva
nMB,et
al.(200
9)Th
egen
omean
dstructuralproteomeofan
ocean
siphovirus:A
new
window
into
thecyan
obacterial
‘mobilo
me’.En
vironMicrobiol11
:293
5e29
51.
2.Su
lliva
nMB,Coleman
ML,
WeigeleP,
Rohwer
F,Chisholm
SW(200
5)Th
reeProch
loroco
ccuscyan
ophag
egen
omes:signature
featuresan
decological
interpretations.PL
oSBiol3:e1
44.
3.Chen
F,Lu
J(200
2)Gen
omic
sequen
cean
dev
olutionofmarinecyan
ophag
eP6
0:A
new
insightonlytican
dlysogen
icphag
es.ApplEn
vironMicrobiol68
:258
9e25
94.
4.Po
peW
H,et
al.(200
7)Gen
omesequen
ce,structuralproteins,an
dcapsidorgan
izationofthecyan
ophag
eSy
n5:
A“horned
”bacteriophag
eofmarinesynechoco
ccus.JMolBiol36
8:96
6e98
1.5.
Sulliva
nMB,et
al.(201
0)Gen
omic
analysisofocean
iccyan
obacterial
myo
virusesco
mpared
withT4
-likemyo
virusesfrom
diverse
hostsan
den
vironmen
ts.En
vironMicrobiol12
:303
5e30
56.
6.Man
nNH,et
al.(200
5)Th
egen
omeofS-PM
2,a“photosynthetic”T4
-typ
ebacteriophag
ethat
infectsmarineSy
nechoco
ccusstrains.JBacteriol18
7:31
88e32
00.
7.W
eigelePR
,et
al.(200
7)Gen
omic
andstructuralan
alysisofSy
n9,
acyan
ophag
einfectingmarineProch
loroco
ccusan
dSy
nechoco
ccus.En
vironMicrobiol9:16
75e16
95.
8.MillardAD,Zw
irglm
aier
K,Downey
MJ,
Man
nNH,Scan
lan
DJ(200
9)Comparativegen
omicsofmarinecyan
omyo
virusesreve
alsthewidespread
occurren
ceofSy
nechoco
ccushost
gen
eslocaliz
edto
ahyp
erplastic
region:Im
plicationsfor
mechan
ismsofcyan
ophag
eev
olution.En
vironMicrobiol11
:237
0e23
87.
Thompson et al. www.pnas.org/cgi/content/short/1102164108 9 of 13
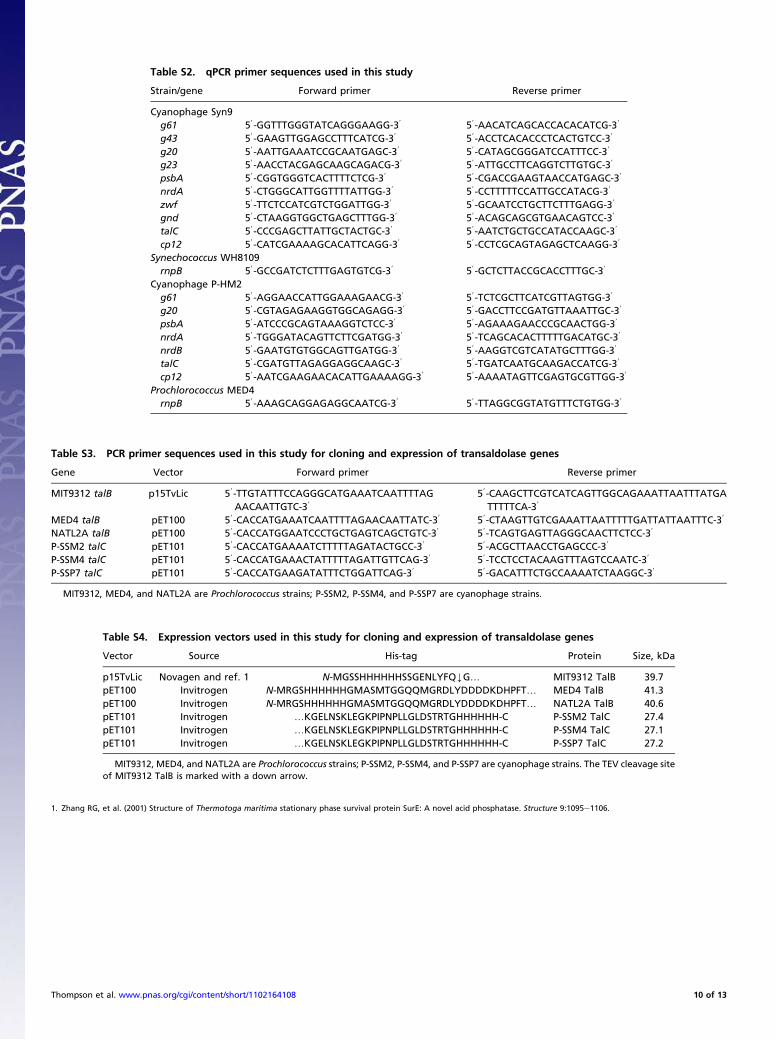
Table S3. PCR primer sequences used in this study for cloning and expression of transaldolase genes
Gene Vector Forward primer Reverse primer
MIT9312 talB p15TvLic 59-TTGTATTTCCAGGGCATGAAATCAATTTTAGAACAATTGTC-39
59-CAAGCTTCGTCATCAGTTGGCAGAAATTAATTTATGATTTTTCA-39
MED4 talB pET100 59-CACCATGAAATCAATTTTAGAACAATTATC-39 59-CTAAGTTGTCGAAATTAATTTTTGATTATTAATTTC-39
NATL2A talB pET100 59-CACCATGGAATCCCTGCTGAGTCAGCTGTC-39 59-TCAGTGAGTTAGGGCAACTTCTCC-39
P-SSM2 talC pET101 59-CACCATGAAAATCTTTTTAGATACTGCC-39 59-ACGCTTAACCTGAGCCC-39
P-SSM4 talC pET101 59-CACCATGAAACTATTTTTAGATTGTTCAG-39 59-TCCTCCTACAAGTTTAGTCCAATC-39
P-SSP7 talC pET101 59-CACCATGAAGATATTTCTGGATTCAG-39 59-GACATTTCTGCCAAAATCTAAGGC-39
MIT9312, MED4, and NATL2A are Prochlorococcus strains; P-SSM2, P-SSM4, and P-SSP7 are cyanophage strains.
Table S4. Expression vectors used in this study for cloning and expression of transaldolase genes
Vector Source His-tag Protein Size, kDa
p15TvLic Novagen and ref. 1 N-MGSSHHHHHHSSGENLYFQYG. MIT9312 TalB 39.7pET100 Invitrogen N-MRGSHHHHHHGMASMTGGQQMGRDLYDDDDKDHPFT. MED4 TalB 41.3pET100 Invitrogen N-MRGSHHHHHHGMASMTGGQQMGRDLYDDDDKDHPFT. NATL2A TalB 40.6pET101 Invitrogen .KGELNSKLEGKPIPNPLLGLDSTRTGHHHHHH-C P-SSM2 TalC 27.4pET101 Invitrogen .KGELNSKLEGKPIPNPLLGLDSTRTGHHHHHH-C P-SSM4 TalC 27.1pET101 Invitrogen .KGELNSKLEGKPIPNPLLGLDSTRTGHHHHHH-C P-SSP7 TalC 27.2
MIT9312, MED4, and NATL2A are Prochlorococcus strains; P-SSM2, P-SSM4, and P-SSP7 are cyanophage strains. The TEV cleavage siteof MIT9312 TalB is marked with a down arrow.
Table S2. qPCR primer sequences used in this study
Strain/gene Forward primer Reverse primer
Cyanophage Syn9g61 59-GGTTTGGGTATCAGGGAAGG-39 59-AACATCAGCACCACACATCG-39
g43 59-GAAGTTGGAGCCTTTCATCG-39 59-ACCTCACACCCTCACTGTCC-39
g20 59-AATTGAAATCCGCAATGAGC-39 59-CATAGCGGGATCCATTTCC-39
g23 59-AACCTACGAGCAAGCAGACG-39 59-ATTGCCTTCAGGTCTTGTGC-39
psbA 59-CGGTGGGTCACTTTTCTCG-39 59-CGACCGAAGTAACCATGAGC-39
nrdA 59-CTGGGCATTGGTTTTATTGG-39 59-CCTTTTTCCATTGCCATACG-39
zwf 59-TTCTCCATCGTCTGGATTGG-39 59-GCAATCCTGCTTCTTTGAGG-39
gnd 59-CTAAGGTGGCTGAGCTTTGG-39 59-ACAGCAGCGTGAACAGTCC-39
talC 59-CCCGAGCTTATTGCTACTGC-39 59-AATCTGCTGCCATACCAAGC-39
cp12 59-CATCGAAAAGCACATTCAGG-39 59-CCTCGCAGTAGAGCTCAAGG-39
Synechococcus WH8109rnpB 59-GCCGATCTCTTTGAGTGTCG-39 59-GCTCTTACCGCACCTTTGC-39
Cyanophage P-HM2g61 59-AGGAACCATTGGAAAGAACG-39 59-TCTCGCTTCATCGTTAGTGG-39
g20 59-CGTAGAGAAGGTGGCAGAGG-39 59-GACCTTCCGATGTTAAATTGC-39
psbA 59-ATCCCGCAGTAAAGGTCTCC-39 59-AGAAAGAACCCGCAACTGG-39
nrdA 59-TGGGATACAGTTCTTCGATGG-39 59-TCAGCACACTTTTTGACATGC-39
nrdB 59-GAATGTGTGGCAGTTGATGG-39 59-AAGGTCGTCATATGCTTTGG-39
talC 59-CGATGTTAGAGGAGGCAAGC-39 59-TGATCAATGCAAGACCATCG-39
cp12 59-AATCGAAGAACACATTGAAAAGG-39 59-AAAATAGTTCGAGTGCGTTGG-39
Prochlorococcus MED4rnpB 59-AAAGCAGGAGAGGCAATCG-39 59-TTAGGCGGTATGTTTCTGTGG-39
1. Zhang RG, et al. (2001) Structure of Thermotoga maritima stationary phase survival protein SurE: A novel acid phosphatase. Structure 9:1095e1106.
Thompson et al. www.pnas.org/cgi/content/short/1102164108 10 of 13

Table S5. Data collection and refinement statistics for the Prochlorococcus MIT9312 TalBstructure (PDB accession no. 3HJZ)
Data collection Statistic
Space group P212121Cell dimensionsa, b, c, Å 42.8, 80.4, 97.9Wavelength, Å 1.54178Resolution, Å 40.19–1.9 (1.97–1.9)Rmerge, %* 0.083 (0.372)I/σI 22.25 (5.7)Completeness, % 96.1 (68.3)Redundancy 7.0 (5.5)
RefinementResolution, Å 40.19–1.95No. reflections 26,218Rwork, %
† 15.6Rfree, %
‡ 20.3No. atomsProtein 2,723Water 341Other 45
B-factors, Å2
Overall 16.5Protein 15.1Water 25.9Other 35.0
RmsdBond lengths, Å 0.017Bond angles, ° 1.45
Ramachandran plotIn most favored regions, % 93.1In additionally allowed regions, % 6.9In generously allowed or disallowed regions, % 0
Values in parentheses are for the highest-resolution shell.*Rmerge ¼ P
hkl jI− hIij=Phkl I.†Rwork ¼ P jFobs − Fcalc j=
P jFobsj, where Fobs and Fcalc are the observed and the calculated structure factors, re-spectively.‡Rfree is calculated by using 5% of total reflections randomly chosen and excluded from the refinement.
Thompson et al. www.pnas.org/cgi/content/short/1102164108 11 of 13

Table
S6.
Comparisonofgen
esize
betwee
nsh
ared
orthologues
incyan
ophag
esan
dhost
cyan
obacteria
Function
Phag
eHost
MW
W/BH
test
COG
NMed
ian
COG
NMed
ian
P(k/m
)*α
Significant?
Tran
saldolase
PhCOG20
522
654
CyC
OG29
1324
1171
.54.93
×10
−9
2.08
×10
−3
Yes
RNR
PhCOG2,
956
2323
01CyC
OG30
6224
2337
1.42
×10
−8
4.17
×10
−3
Yes
PhoH
PhCOG23
718
762
CyC
OG37
9524
972
3.69
×10
−8
6.25
×10
−3
Yes
6PGDH
PhCOG
964
910
38CyC
OG32
0024
1419
2.15
×10
−7
8.33
×10
−3
Yes
CpeT
PhCOG19
,76
213
459
CyC
OG54
6027
606
4.06
×10
−7
1.04
×10
−2
Yes
Plastocyan
inPh
COG44
712
324
CyC
OG29
7523
360
8.65
×10
−7
1.25
×10
−2
Yes
PurM
PhCOG11
2,65
112
678
CyC
OG41
4424
1039
.51.02
×10
−6
1.46
×10
−2
Yes
G6P
DH
PhCOG96
97
1440
CyC
OG35
6524
1524
6.85
×10
−6
1.67
×10
−2
Yes
SpeD
PhCOG10
897
336
CyC
OG41
2724
448.5
7.30
×10
−5
1.88
×10
−2
Yes
Carboxy
lesterase
PhCOG49
65
363
CyC
OG33
2729
249
4.74
×10
−4
2.08
×10
−2
Yes
Ferred
oxin
PhCOG22
55
291
CyC
OG33
5424
370.5
4.84
×10
−4
2.29
×10
−2
Yes
PTOX
PhCOG44
810
504
CyC
OG26
91,10
759
1151
07.78
×10
−4
2.50
×10
−2
Yes
Phycoerythrobilinsynthase
PhCOG42
34
636
CyC
OG41
48+41
4744
756
1.09
×10
−3
2.71
×10
−2
Yes
Hem
eoxy
gen
ase
PhCOG71
13
693
CyC
OG41
4925
714
9.56
×10
−3
2.92
×10
−2
Yes
PstS
PhCOG17
410
972
CyC
OG31
2940
982.5
1.48
×10
−2
3.13
×10
−2
Yes
PcyA
PhCOG20
471
1CyC
OG31
7724
736.5
3.63
×10
−2
3.33
×10
−2
No
Carbam
oyltran
sferase
PhCOG39
64
1734
CyC
OG37
629
1854
4.20
×10
−2
3.54
×10
−2
No
Cobaltch
elatase
PhCOG15
418
1089
CyC
OG30
4124
1119
1.82
×10
−1
3.75
×10
−2
No
CP1
2Ph
COG18
1522
8CyC
OG53
4627
219
2.29
×10
−1
3.96
×10
−2
No
Thym
idylatesynthase
PhCOG23
521
702
CyC
OG25
93,54
22,86
8730
639
2.86
×10
−1
4.17
×10
−2
No
PsbA
PhCOG22
323
1080
CyC
OG25
73,93
8669
1080
3.16
×10
−1
4.38
×10
−2
No
PsbD
PhCOG11
6613
1056
CyC
OG36
6235
1056
4.33
×10
−1
4.58
×10
−2
No
Highlig
ht-inducible
protein
PhCOG21
3,49
439
177
CyC
OG24
11,24
43,36
34,38
29,39
18,39
19,39
38,40
37,52
20,70
13,95
1825
915
05.94
×10
−1
4.79
×10
−2
No
Maz
GPh
COG18
218
403.5
CyC
OG33
67,42
4048
640.5
7.97
×10
−1
5.00
×10
−2
No
Forea
chprotein
function,thereleva
ntCOGsfrom
ProPo
rtal
aregiven
,alongwiththenumber
Nofgen
esin
theCOG(s)a
ndthemed
iangen
esize
inbp.M
ann–W
hitney
–W
ilcoxo
nPva
lues
aregiven
,andtherows
areordered
byPva
lue(smallest
tolargest).T
heex
pression(k/m
)*αrepresents
therankkofthePva
luedivided
bythetotaln
umber
oftestsm
(24)
multiplie
dbythePva
luecu
toff
α(0.05).U
singtheBen
jamini–
Hoch
bergco
rrectionforfalsedisco
very
rate,themed
iansareco
nsidered
significantlydifferentupthroughthelargestva
lueforksuch
that
P<
(k/m
)*α.
Thompson et al. www.pnas.org/cgi/content/short/1102164108 12 of 13
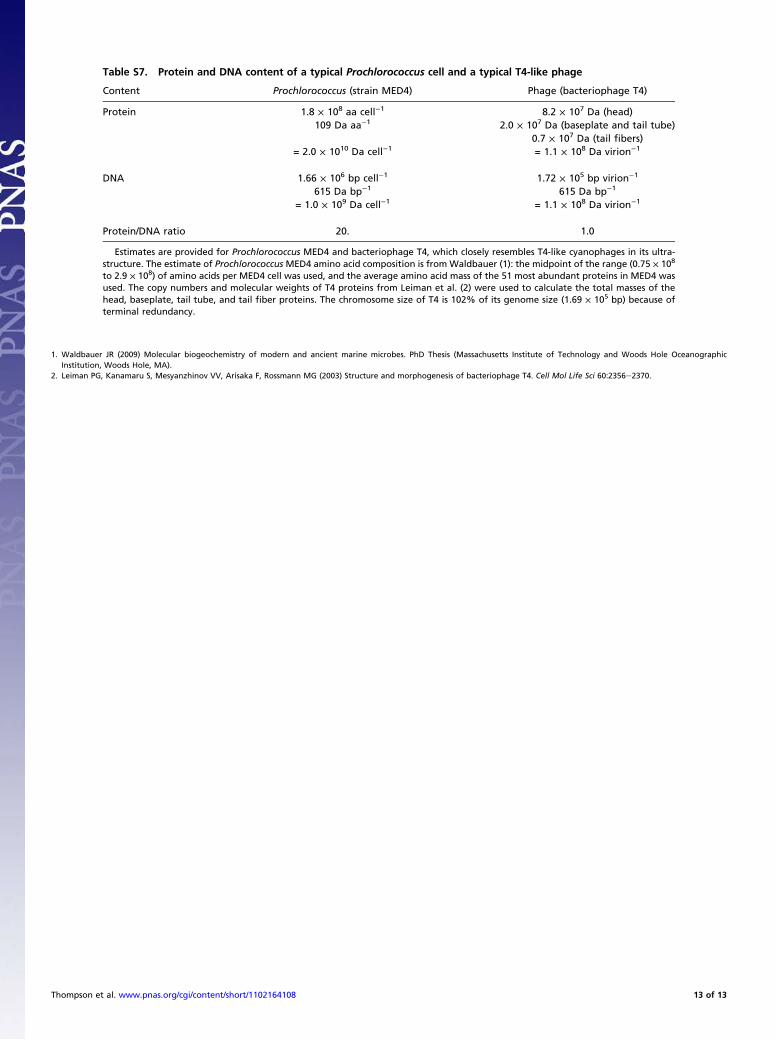
Table S7. Protein and DNA content of a typical Prochlorococcus cell and a typical T4-like phage
Content Prochlorococcus (strain MED4) Phage (bacteriophage T4)
Protein 1.8 × 10⁸ aa cell−1 8.2 × 10⁷ Da (head)109 Da aa−1 2.0 × 10⁷ Da (baseplate and tail tube)
0.7 × 10⁷ Da (tail fibers)= 2.0 × 10¹⁰ Da cell−1 = 1.1 × 10⁸ Da virion−1
DNA 1.66 × 10⁶ bp cell−1 1.72 × 10⁵ bp virion−1
615 Da bp−1 615 Da bp−1
= 1.0 × 10⁹ Da cell−1 = 1.1 × 10⁸ Da virion−1
Protein/DNA ratio 20. 1.0
Estimates are provided for Prochlorococcus MED4 and bacteriophage T4, which closely resembles T4-like cyanophages in its ultra-structure. The estimate of Prochlorococcus MED4 amino acid composition is from Waldbauer (1): the midpoint of the range (0.75 × 10⁸
to 2.9 × 10⁸) of amino acids per MED4 cell was used, and the average amino acid mass of the 51 most abundant proteins in MED4 wasused. The copy numbers and molecular weights of T4 proteins from Leiman et al. (2) were used to calculate the total masses of thehead, baseplate, tail tube, and tail fiber proteins. The chromosome size of T4 is 102% of its genome size (1.69 × 10⁵ bp) because ofterminal redundancy.
1. Waldbauer JR (2009) Molecular biogeochemistry of modern and ancient marine microbes. PhD Thesis (Massachusetts Institute of Technology and Woods Hole OceanographicInstitution, Woods Hole, MA).
2. Leiman PG, Kanamaru S, Mesyanzhinov VV, Arisaka F, Rossmann MG (2003) Structure and morphogenesis of bacteriophage T4. Cell Mol Life Sci 60:2356e2370.
Thompson et al. www.pnas.org/cgi/content/short/1102164108 13 of 13

Phage auxiliary metabolic genes and the redirectionof cyanobacterial host carbon metabolismLuke R. Thompsona,1, Qinglu Zengb,1, Libusha Kellyb, Katherine H. Huangb, Alexander U. Singerc, JoAnne Stubbea,d,2,and Sallie W. Chisholma,b,2
Departments of aBiology and bCivil and Environmental Engineering, Massachusetts Institute of Technology, Cambridge, MA 02139; cBanting and BestDepartment of Medical Research, University of Toronto, Toronto, Ontario Canada M5G 1L6; and dDepartment of Chemistry, Massachusetts Institute ofTechnology, Cambridge, MA 02139
AUTHOR SUMMARY
Approximately half of all photosynthesis on Earth takes place inthe ocean, and a sizable portion of that is carried out by tiny(about 1 μm in diameter) unicellular cyanobacteria, or blue-green algae, called Prochlorococcus and Synechococcus, whichoften reach densities of 100 million per liter of seawater. Evenmore abundant are viruses, called cyanophage, that can attach tothese “host” cells, inject their DNA, and use the host’s bio-chemical machinery to make more phage. The phage then breakopen the host cell, killing it, and release their progeny into theseawater. One of the ways cyanophages are thought to take overtheir hosts is via the use of host-like metabolic genes—acquiredover eons of intimate coevolution—that encode enzymes thatboost metabolic steps that might be bottlenecks in the phagereproduction process. An apparent contradiction arises, how-ever, in that many cyanophages carry genes for both photosyn-thesis and a carbon metabolism pathway called the pentosephosphate pathway, and these two processes achieve oppositegoals, with photosynthesis “fixing” carbon and the pentosephosphate pathway “burning” carbon. Are host-like metabolicgenes in cyanophage steering host metabolism toward fixingcarbon or toward burning carbon? In this work, we used a com-bination of physiology, enzymology, and sequencing approachesto address this question. Our evidence suggests that cyanophagesdirect host metabolism to mobilize carbon stores, burning butnot fixing carbon to fuel the synthesis of DNA building blocksand phage replication.The first clues to the strategy used by cyanophages for
directing host metabolism came from the analysis of cyanophagegenomes. These genomes revealed the widespread presence ofthe “auxiliary metabolic genes” mentioned earlier, which encodeproteins similar to those used in host metabolism. These genestend to be absent from viruses infecting noncyanobacterial hosts,suggesting that they are a specific adaptation suited to infectingcyanobacteria. The metabolic pathways that these phage genesare associated with in host cells include the light reactions ofphotosynthesis (1), the pentose phosphate pathway (1), nutrientacquisition pathways (2), and pathways for nucleotide bio-synthesis that are also commonly found in noncyanophages (2).To make sense of host cyanobacterial metabolism as it relates
to phage infection, we first constructed a simple model of hostmetabolism (Fig. P1A), facilitated by an analysis of gene ex-pression patterns over the light–dark cycle of Prochlorococcus(3). In this model, cyanobacteria use the light reactions of pho-tosynthesis to harness light energy (hv) and split water to pro-duce NADPH (electron carrier) and ATP (energy carrier), usingthese metabolites to fix CO2 in the Calvin cycle (green) andproduce glucose 6-phosphate during the day. At night, this sugaris oxidized in the pentose phosphate pathway (red) to NADPHand ribose 5-phosphate, which can be used for carbon skeletonsor recycled back through the pathway. Finally, nucleotide bio-synthesis takes the NADPH and ribose 5-phosphate produced bythe pentose phosphate pathway, combined with NADPH andATP produced by the light reactions of photosynthesis, to pro-
duce nucleotides, the DNA building blocks of chromosomes. Inessence, taking energy from the sun, electrons from water, and
A
B
Fig. P1. Model of cyanobacterial metabolism during cyanophageinfection. (A) In uninfected cells, four interrelated pathways combineto make DNA building blocks (nucleotides): the light reactions ofphotosynthesis, the Calvin cycle (the so-called “dark reactions” ofphotosynthesis), the pentose phosphate pathway, and nucleotidebiosynthesis. (B) In infected cells, host-like genes (blue ovals) acquired byphage over evolutionary time are proposed to augment or inhibit keysteps in host metabolism, leading to increased nucleotide biosynthesisfor phage reproduction.
Author contributions: L.R.T., Q.Z., L.K., K.H.H., J.S., and S.W.C. designed research; L.R.T.,Q.Z., L.K., K.H.H., and A.U.S. performed research; L.R.T., Q.Z., L.K., K.H.H., and A.U.S.analyzed data; and L.R.T., J.S., and S.W.C. wrote the paper.
The authors declare no conflict of interest.
This article is a PNAS Direct Submission.
Freely available online through the PNAS open access option.
Data deposition: The atomic coordinates and structure factors have been deposited in theProtein Data Bank, www.pdb.org (PDB ID code 3HJZ). The sequences reported in thispaper have been deposited in the GenBank database [GU071107 (P-SSP2), GU071104(P-HP1), and GU071102 (P-RSP5)].1L.R.T. and Q.Z. contributed equally to this work.2To whom correspondence may be addressed: [email protected] or [email protected].
See full research article on page E757 of www.pnas.org.
Cite this Author Summary as: PNAS 10.1073/pnas.1102164108.
www.pnas.org/cgi/doi/10.1073/pnas.1102164108 PNAS | September 27, 2011 | vol. 108 | no. 39 | 16147–16148
MICRO
BIOLO
GY
PNASPL
US

carbon from carbon dioxide, cyanobacteria are able to makesugar and transform it into nucleotides for replicating theirgenomes.In the context of this simplified view of host metabolism, we
noticed something peculiar about the collection of host-likegenes found in cyanophage genomes: Genes for the light reac-tions and the pentose phosphate pathway were commonly found,as were those for nucleotide biosynthesis; however, no genes forthe Calvin cycle were apparent, despite a search of more than 20phage genomes. Although the presence of cyanophage photo-synthesis proteins initially led to the proposal of increased car-bon fixation in the sea (4), the absence of Calvin cycle genes andthe presence of pentose phosphate genes suggested that an al-ternative model was required. Our model (Fig. P1B) suggeststhat NAPDH and ATP, the products of the light reactions,and redirection of carbon flux away from the Calvin cycle andthrough the pentose phosphate pathway to generate ribose 5-phosphate and NADPH, together would lead to enhanced nu-cleotide biosynthesis required for phage replication.In support of this hypothesis was the discovery of a gene
for a Calvin cycle inhibitor, CP12, in many phage genomes (5).CP12 is a host regulatory protein that binds to and inhibits twoenzymes in the Calvin cycle, limiting carbon flux through thispathway and favoring flux through the pentose phosphate path-way. Thus, we propose that phages use the CP12 that they en-code to shut down the Calvin cycle in the host, and redirect theproducts of the light reactions to their own ends.Here we reveal that the cp12 gene is widespread in both cul-
tured and wild cyanophages, and is expressed during infection,concurrently with phage genes involved in the pentose phosphatepathway, genes for the light reactions of photosynthesis, andnucleotide biosynthesis. Thus, cyanophage infection appears toshort-circuit host carbon metabolism, shutting down the Calvincycle while boosting the three other pathways. As shown in Fig.P1B, cyanophages carry many genes (blue ovals) with putativefunctions in host metabolism. According to our model, the lightreactions, aided by phage-encoded proteins, lead to increasedproduction of NADPH and ATP. These storage molecules arenot used to power carbon fixation because the Calvin cycle isblocked by phage-encoded CP12, forcing carbon flux throughthe pentose phosphate pathway, boosted by phage-encodedenzymes. NADPH, ATP, and ribose 5-phosphate produced bythese processes are used to power phage nucleotide biosynthesis.Several additional pieces of evidence support this model.
NADPH, an electron carrier, is a product of the light reactionsand the pentose phosphate pathway, and NADP is its electron-poor version. We show that, under infection, the ratio ofNADPH to NADP increases. This result is compatible with in-
creased activity of the light reactions and the pentose phosphatepathway for production of NADPH, the source of electrons forthe synthesis of DNA building blocks. Furthermore, calculationsimply that replicating cyanophages require significant de novoproduction of these nucleotides, and our model suggests how thismight occur.Finally, we studied the properties of the phage transaldolase
enzyme, whose gene is the most widespread pentose phosphatepathway gene in cyanophages. The phage transaldolase is sig-nificantly shorter than the host transaldolase, and therefore wewondered why this enzyme would have been evolutionarily se-lected by phages over the host enzyme. We proposed that thephage transaldolase would have a higher activity than the hosttransaldolase. We therefore cloned, expressed, and purifiedseveral phage and host transaldolase enzymes, and measuredtheir kinetic properties in vitro. We found that, to our surprise,the phage enzymes in fact had one third the kinetic efficiencies ofthe host enzymes. We therefore sought other explanations forphage use of this smaller enzyme. We hypothesized that thesmaller size of the phage gene could be a significant benefit tothe phage, with its small genome and limited resources from thehost for replication. Indeed, we found that many phage genes aresignificantly shorter than their host orthologues, providing anevolutionary explanation for differences in gene sizes of sharedphage–host orthologues in general.The marine cyanobacteria–cyanophage system has proven to
be an intriguing example of coevolution. In this study, we haveattempted to tie the various evidentiary threads together tounveil the selective pressures that have led cyanophages to in-corporate a particular set of host-like genes into their genomes.The key finding that cyanophages express the Calvin cycle in-hibitor CP12 suggests that there are strong selective pressures forcyanophages to redirect host metabolism toward mobilizingenergy, electrons, and carbon skeletons for DNA biosynthesis.Ultimate validation of this model will require a genetic systemfor phage and host, which is at present not available forthese strains.
1. Millard A, Clokie MRJ, Shub DA, Mann NH (2004) Genetic organization of the psbADregion in phages infecting marine Synechococcus strains. Proc Natl Acad Sci USA 101:11007–11012.
2. SullivanMB, ColemanML,Weigele P, Rohwer F, Chisholm SW (2005) Three Prochlorococcuscyanophage genomes: Signature features and ecological interpretations. PLoS Biol 3:e144.
3. Zinser ER, et al. (2009) Choreography of the transcriptome, photophysiology, and cellcycle of a minimal photoautotroph, Prochlorococcus. PLoS ONE 4:e5135.
4. Sharon I, et al. (2007) Viral photosynthetic reaction center genes and transcripts in themarine environment. ISME J 1:492–501.
5. Sullivan MB, et al. (2010) Genomic analysis of oceanic cyanobacterial myovirusescompared with T4-like myoviruses from diverse hosts and environments. EnvironMicrobiol 12:3035–3056 10.1111/j.1462–2920.2010.02280.x.
16148 | www.pnas.org/cgi/doi/10.1073/pnas.1102164108 Thompson et al.