pharmaceutical expenditure – how much are we spending? · 2018-03-16 · payments and may include...
TRANSCRIPT
P o l i c y a n d P l a n n i n g D i v i s i o n – M i n i s t r y o f H e a l t h
2014
Pharmaceutical
expenditure – how much
are we spending?
NHA Policy Brief Series – Policy Brief No. 3

This Policy brief was developed by the Policy and Planning Division of the Ministry of Health in conjunction with the Centre for Health Information Policy and Systems Research (CHIPSR) at the Fiji
National University. Funding was provided by the World Health Organization. For any questions please contact Mr Idrish Khan on email [email protected] |
1
Pharmaceutical expenditure – how much are we spending? 2014
Pharmaceutical expenditure – how much are we spending?
In Fiji private pharmaceutical expenditure has increased faster than public (Government)
pharmaceutical expenditure. This means that households are spending more out-of-pocket on
pharmaceuticals even though pharmaceuticals dispensed from public health facilities are free.
Since 2008, public pharmaceutical actual expenditure has surpassed budgeted allocations. This
policy brief suggests that there is a need for increased monitoring and reporting of
pharmaceutical expenditure from the private sector, including an analysis of current drug
utilization, stock-outs and pharmaceutical surpluses in the public health system to improve
Government budget allocation to pharmaceuticals in 2015 and beyond.
How much should Fiji spend on pharmaceuticals1 and is current spending sufficient?
How much is Fiji spending on pharmaceuticals?
In Fiji there is both government and private spending on pharmaceuticals. Government spending
refers to expenditure incurred by the Ministry of Health (MoH) to supply generic medicines as
per Ministry of Health Essential Medicine List to public2 health facilities. These medicines are
provided free of charge to patients using health services provided at government operated health
facilities. Private expenditure on medicines pertains to expenditure generated from private
pharmacies and private health facilities which includes both generic and branded medicines. This
expenditure is mainly funded from individuals and households through out-of-pocket (OOP)
payments and may include private insurance payments. Figure 1 shows government, private and
total expenditure on pharmaceuticals for the period 2007 to 2012.
Government expenditure on pharmaceuticals has remained fairly constant over the period 2007
to 2012 however private expenditure has increased over the same period. Total drug expenditure
has increased but this is largely driven by the private sector. While this increase does not tell us
the volume of medicines consumed or if the population is getting sicker and thus requiring more
medicines, it does show a thriving pharmaceutical private market and a possible increase in OOP
expenditure on health.
In the private sector, pharmaceutical expenditure is reported to be largely prescribed medicines
rather than over the counter medicines. In 2011 and 2012, prescribed medicines accounted for
more than 60% of total private pharmaceutical expenditure.
1 Pharmaceutical used in this document refers to medicines only. The word medicines and pharmaceuticals are
used interchangeably throughout the document. 2 Public health facilities in this document refer to those health facilities that are funded, operated and managed by
the government.

This Policy brief was developed by the Policy and Planning Division of the Ministry of Health in conjunction with the Centre for Health Information Policy and Systems Research (CHIPSR) at the Fiji
National University. Funding was provided by the World Health Organization. For any questions please contact Mr Idrish Khan on email [email protected] |
2
Pharmaceutical expenditure – how much are we spending? 2014
Figure 1: Pharmaceutical expenditure private and public, 2007-2012
Source: National Health Accounts 2007-2012
Government spending on pharmaceuticals
The Fiji Pharmaceutical and Biomedical Services (FPBS) is the department of the Ministry of
Health that purchases and distributes pharmaceuticals to all government health providers. Figure
2 shows the actual and budgeted expenditure of FPBS over the period 2007 to 2012. It is evident
that actual expenditure of FPBS exceeded the amount budgeted from 2009 to 2011. In 2012 the
increased budgeted amount pertains to the addition of the biomedical and dental equipment
incorporated into the FPBS budget (this was in a separate budget allocation in previous years).
This increase was not for medicines. However FPBS is also responsible for non-medical goods, consumables, and bio-medical
equipment. Only a proportion of FPBS expenditure is allocated to pharmaceuticals. In Figure 3
we look at the pharmaceutical budget and actual expenditure incurred. Apart from 2007 all other
years showed actual expenditure exceeding budgeted amount. Pharmaceutical actual expenditure
was highest in 2008 where the expenditure of $FJD 11.5 million accounted for 64% of FPBS
total expenditure. Pharmaceutical actual expenditure was lowest in 2009 (FJD 5.5 million).
0
10
20
30
40
50
60
2007 2008 2009 2010 2011 2012
Dru
g e
xpe
nd
itu
re in
FJD
Mill
ion
s
Pharmaceutical expenditures between private and public, 2007-2012
Total drugs Drugs (Actual expenditure) Drugs (Private)

This Policy brief was developed by the Policy and Planning Division of the Ministry of Health in conjunction with the Centre for Health Information Policy and Systems Research (CHIPSR) at the Fiji
National University. Funding was provided by the World Health Organization. For any questions please contact Mr Idrish Khan on email [email protected] |
3
Pharmaceutical expenditure – how much are we spending? 2014
Figure 2: FPBS budget and actual expenditure
Source: National Health Accounts 2007-2012 and FMIS
Figure 3: Government pharmaceutical spending: Actual vs. Budgeted
Source: National Health Accounts 2007-2012 and FMIS
0
5
10
15
20
25
30
35
2007 2008 2009 2010 2011 2012
Exp
en
dit
ure
in F
JD M
illio
ns
FPBS (Budgeted) FPBS (Actuals)
0
2
4
6
8
10
12
14
2007 2008 2009 2010 2011 2012
Dru
exp
en
dit
ure
in F
JD M
illio
ns
Drug (Revised Budget) Drugs (Actual expenditure)
This Policy brief was developed by the Policy and Planning Division of the Ministry of Health in conjunction with the Centre for Health Information Policy and Systems Research (CHIPSR) at the Fiji
National University. Funding was provided by the World Health Organization. For any questions please contact Mr Idrish Khan on email [email protected] |
4
Pharmaceutical expenditure – how much are we spending? 2014
Over the period 2009 to 2012, budget allocation for pharmaceuticals has slowly increased but
still remains less than budgets allocated in the years 2007 and 2008. Furthermore despite the
increasing budget trend from 2009 to 2012, actual expenditure still exceeds budgeted amount
during this period.
Country Comparison
There are no benchmarks for how much a country should spend on pharmaceuticals since this
expenditure is driven by a variety of factors. However it is often useful to compare expenditure
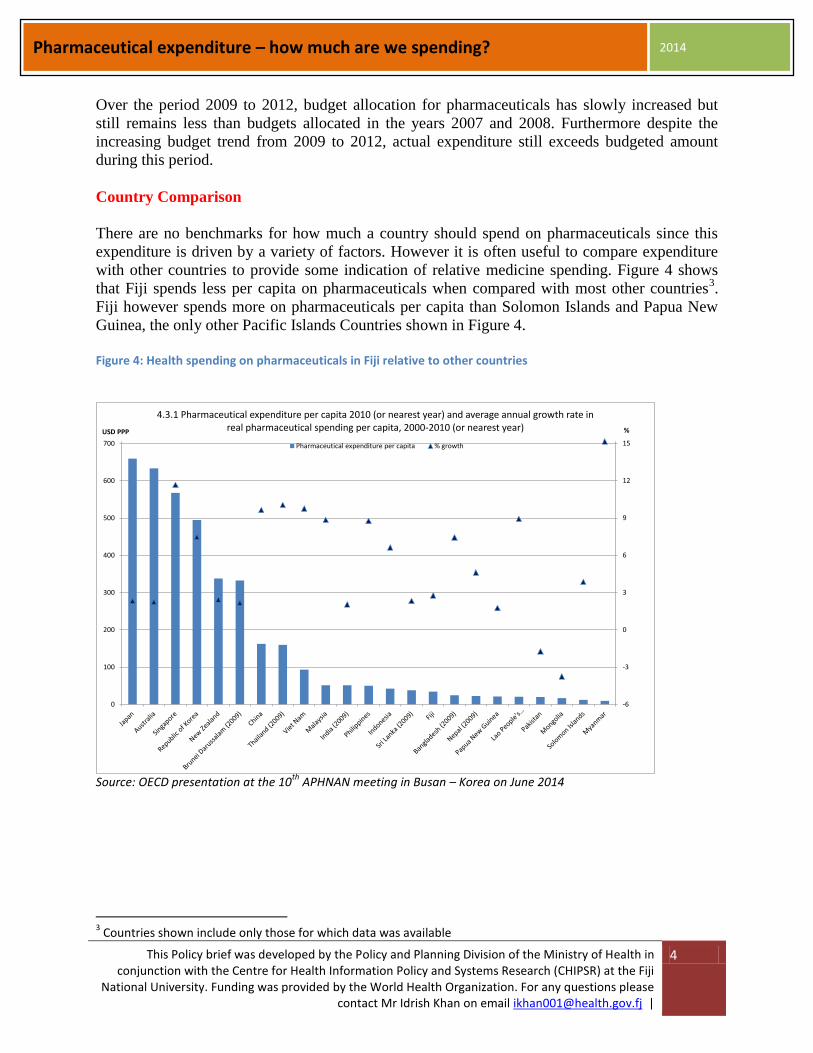
with other countries to provide some indication of relative medicine spending. Figure 4 shows
that Fiji spends less per capita on pharmaceuticals when compared with most other countries3.
Fiji however spends more on pharmaceuticals per capita than Solomon Islands and Papua New
Guinea, the only other Pacific Islands Countries shown in Figure 4. Figure 4: Health spending on pharmaceuticals in Fiji relative to other countries
Source: OECD presentation at the 10
th APHNAN meeting in Busan – Korea on June 2014
3 Countries shown include only those for which data was available
-6
-3
0
3
6
9
12
15
0
100
200
300
400
500
600
700
%USD PPP
4.3.1 Pharmaceutical expenditure per capita 2010 (or nearest year) and average annual growth rate in real pharmaceutical spending per capita, 2000-2010 (or nearest year)
Pharmaceutical expenditure per capita % growth

This Policy brief was developed by the Policy and Planning Division of the Ministry of Health in conjunction with the Centre for Health Information Policy and Systems Research (CHIPSR) at the Fiji
National University. Funding was provided by the World Health Organization. For any questions please contact Mr Idrish Khan on email [email protected] |
5
Pharmaceutical expenditure – how much are we spending? 2014
Is government spending enough on pharmaceuticals?
This unfortunately is a question this brief cannot answer. But using the findings from National
Health Account reports, three things can be concurred that suggests some policy change:
1. The private sector spending is higher than what the public sector spends on
pharmaceuticals (despite the health sector being largely public)
2. The annual actual expenditure (public - government) on pharmaceuticals continue to
surpass allocated government budgeted amounts
3. Fiji spends less per capita on pharmaceuticals than most other countries
Here we identify three policy options that may be considered in trying to ascertain whether an
increase in pharmaceutical expenditure is required.
Policy Option One
Problem – Private expenditure on pharmaceuticals is comparatively higher that of Public
(Government)
While this scenario is common to most countries, it is unique to Fiji where the health system is
largely a public health system and where medicines are largely free of charge. A large private
pharmaceutical expenditure indicates two possible situations: (1) Government is not spending
enough, or (2) the private sector medicine prices are high. If the reason is the latter case
(situation 2) then this leads to a greater burden on households in terms of out-of-pocket
expenditure on pharmaceuticals. However as of March 2011, the Fiji Commerce Commission
has reviewed the prices of pharmaceuticals. The prices of seventy five essential medicines have
been fixed (price control) and the overall mark-up on medicines has been significantly reduced.
Certainly continuous monitoring and evaluation of the private sector to ensure that these price
controls are adhered to is required. Improved data reporting from private pharmaceuticals is also
necessary to have some indication of the volume of medicines consumed in the country and
segregated by public and private sectors. Improved data reporting will also shed light on the
prescribing habits both in the public and private sectors.
However if Government is not spending enough (situation 1) then evidence to substantiate this
claim needs to be provided and validated. A study to look into medicine utilization patterns of
public health facilities, including some research into medicine stock outs and un-used expired
medicines will assist in determining whether an increase of funds is required for
pharmaceuticals. Regardless if the situation is 1 or 2, the government needs to undertake this
exercise to ensure that a right budget (neither excessive nor insufficient) is allocated annually to
pharmaceuticals.
This Policy brief was developed by the Policy and Planning Division of the Ministry of Health in conjunction with the Centre for Health Information Policy and Systems Research (CHIPSR) at the Fiji
National University. Funding was provided by the World Health Organization. For any questions please contact Mr Idrish Khan on email [email protected] |
6
Pharmaceutical expenditure – how much are we spending? 2014
Policy Option Two
Problem – Public actual expenditure on pharmaceuticals surpass budgeted funding
allocation
Similar to policy option 1, the Ministry needs to assess whether current budgeted allocations are
insufficient to meet the pharmaceutical needs of the public health facilities. OECD countries on
average spend approximately 20% of their total health spending on pharmaceuticals (OECD,
2011). Over the period 2007 to 2012, Fiji averaged public spending on pharmaceuticals at 6.8%.
While we perhaps should not compare ourselves with more developed economies, it does
provide a benchmark as to where we see ourselves.
At the first instance, pharmaceutical budgets need to return to budgeted levels of the past years
(2007 and 2008). The increasing budget trend from 2009 to 2012 shows that this is perhaps what
is already happening. However with the double disease burden, the epidemic of NCDs and the
escalating medicine prices globally, an increase in pharmaceutical expenditure is most likely.
Again a thorough assessment of current pharmaceutical utilization in the public sector, including
medicine stock outs and surpluses and pharmaceutical purchasing is necessary to determine what
budget should be allocated in 2015 and beyond.
Policy Option Three Problem – Lack of complete information on both public and private pharmaceutical data
In policy options 1 and 2 above, part of the recommendations has been to improve
pharmaceutical data reporting in areas such as utilization, purchasing, and medicine stock-outs.
A solution to this would be to look at obtaining a warehouse management system that will be
able to track pharmaceutical data in all these areas. At the time of writing this brief, it was told
that the Ministry had considered this and arrangements were underway to have such a system
included in budgets for 2015. This is certainly recommended.
References Fiji National Health Accounts Reports 2007 to 2012 in SHA 2011 (forthcoming), Fiji Ministry of Health Health as a glance 2011. OECD indicators. http://www.oecd-ilibrary.org/sites/health_glance-2011-en/ World Bank 2012. The economic costs of non-communicable diseases in the Pacific Islands. A rapid stock take of the situation in Samoa, Tonga and Vanuatu.