pharmaceutical supply chain risk management the …
TRANSCRIPT

ADDIS ABABA UNIVERSITY SCHOOL OF COMMERCE
PHARMACEUTICAL SUPPLY CHAIN RISK MANAGEMENT THE CASE OF PHARMACEUTICAL FUND AND SUPPLY AGENCY
A Thesis Submitted to Addis Ababa University, school of Commerce Department of Logistics and Supply Chain Management for the Partial Fulfillment of the Requirements
for Masters of Art Degree in Logistics and Supply Chain Management.
BY: Bisrat Mengistu
ADVISOR: Worku Mekonnen (PhD)
August, 2016
Addis Ababa, Ethiopia

I
ADDISABABAUNIVERSITY
SCHOOLOF COMMECE
DEPARTMENTOF LOGISTICS AND SUPPLY CHAIN MANAGEMENT
PHARMACEUTICAL SUPPLY CHAIN RISK MANAGEMENT THE CASE OF
PHARMACEUTICAL FUND AND SUPPLY AGENCY
BY: Bisrat Mengistu
Board of Examiners Approval
External Examiner Signature
Internal Examiner Signature
Adviser Signature

II
Statement of Certification
This is to certify that Bisrat Mengistu has carried out his research work on the topic entitled:
“Pharmaceutical Supply Chain Risk Management the Case of Pharmaceutical Fund and Supply
Agency” is h is original work and is suitable for submission for the award of Masters of Art
Degree in Logistics and Supply chain management.
Advisor: Dr. Worku Mekonnen (PhD)
Date & Signature

III
Statement of Declaration
I, Bisrat Mengistu, declare that this Master’s research “Pharmaceutical Supply Chain Risk
Management the Case of Pharmaceutical Fund and Supply Agency” is submitted in partial
fulfilment of the requirements for the degree of Master’s of Arts in Logistics and Supply
Management at the School of Commerce, Addis Ababa University. The thesis is my original
work and has not been presented for a degree in any other university and all sources of materials
used for the thesis have been duly acknowledged.
Declared by:
Bisrat Mengistu
Date & Signature

IV
ACKNOWLEDGEMENT
Above all, I would like to glorify the Almighty God for providing me the strength,
courage, wisdom, and inspiration throughout the period of my study.
I would like to take the opportunity to acknowledge the support and help of my Adviser
Dr. Worku Mekonnen (PhD). I would also like to thank all the staffs of PFSA for their
unlimited support in giving valuable information and participating in the study
Finally I am certainly indebted to all my cherished classmates & friends for their support
and encouragement.

V
Table of Contents Statement of certification.................................................................................................................. II
Statement of declaration...................................................................................................................III
Acknowledgment ..............................................................................................................................IV
List of figure .....................................................................................................................................VII
List of table .....................................................................................................................................VIII
Acronym and abbreviation............................................................................................................... IX
Abstracts........................................................................................................................................... XI
CHAPTER ONE INTRODUCTION ........................................................................................................... 1
1.1 Background of the study ............................................................................................................... 1
1.2 The Pharmaceutical Fund and supply agency (PFSA) ................................................................... 5
1.3 Statement of the problem ............................................................................................................ 8
1.4 Objective of the Research ............................................................................................................. 9
1.4.1 General objectives.....................................................................................................................9
1.4.1 Specific objectives......................................................................................................................9
1.5 Research question ......................................................................................................................... 9
1.6 Significance of the study ............................................................................................................... 9
1.7 Scope of the study ........................................................................................................................ 9
1.8 Limitation of the study .................................................................................................................. 9
1.9 Operational definition.................................................................................................................10
1.10 Organization of the study.........................................................................................................10
CHAPTER TWO RELATED LITERATURE REVIEW ................................................................................. 12
2.1 Theoretical literature review .....................................................................................................12
2.1.1 Sources of supply chain risks....................................................................................................12
2.1.2 The SCRM process....................................................................................................................14
2.1.3 Approaches in managing SCR...................................................................................................17
2.1.3.1 Contingency management theory ........................................................................................ 17
2.1.3.2 Agency theory ....................................................................................................................... 18
2.2 Empirical literature review..........................................................................................................19
2.3 Conceptual framework ............................................................................................................... 22
CHAPTER THREER RESEARCH DESIGN AND METHODOLOGY...........................................................25
Introduction ...................................................................................................................................... 25
3.1 Study area ................................................................................................................................... 25

VI
3.2 Research design .......................................................................................................................... 26
3.3 Research participant ................................................................................................................... 26
3.4 Study population ......................................................................................................................... 26
3.5 Method of data collection, sources and research instrument ................................................... 27
3.6 Data quality assurance...............................................................................................................27
3.7 Method of data analysis and presentation.....................................................................................28
3.8 instrument validity..........................................................................................................................28
3.9 Ethical consideration......................................................................................................................28
CHAPTER FOUR RESULTS, DISCUSSION AND INTERPRETATION ........................................................... 29
Introduction..........................................................................................................................................29
4.1 General information........................................................................................................................ 29
4.2 Methods employed in identifying risks and main SCR faced by PFSA ............................................ 30
4.3 Mitigation strategies adopted by PFSA in managing risks ............................................................. 36
4.4 Barriers in adopting SCRM practises ............................................................................................... 43
CHAPTER FIVE Summary, Conclusion, and recommendation...............................................................48
5.1 Summary of findings.......................................................................................................................48
5.2 Conclusion......................................................................................................................................49
5.3 Recommendation...........................................................................................................................50
5.4 Implication for further research.....................................................................................................51
References............................................................................................................................................52
Annexes

VII
List of figure
Figure 1 Source of risk in a supply chain...............................................................................4
Figure 2 Organizational structure of PFSA............................................................................7
Figure 3 SCRM process.........................................................................................................16
Figure 4 SCRM a conceptual framework..............................................................................23

VIII
List of tables
Table 1 Cronbach's Alpha........................................................................................................29
Table 2 Methods employed in identifying risk by PFSA.........................................................30
Table 3 External end to end supply chain risk.........................................................................31
Table 4 external supply risk.....................................................................................................32
Table 5 distribution risks..........................................................................................................33
Table 6 Environmental disruption risk.....................................................................................34
Table 7 Internal (agency’s) risks..............................................................................................35
Table 8 Collective risk.............................................................................................................36
Table 9 Extent of SCRM practise at PFSA.............................................................................36
Table 10 Frequency of use of SCRM tools.............................................................................37
Table 11 Practises employed in managing SCR........................................................................38
Table12 Methods employed to manage supplier’s related risk................................................39
Table 13 Strategic sourcing or advanced procurement practises...............................................40
Table 14 Real-Time supply chain management practises employed at PFSA............................41
Table 15 Real-Time base operation management practises employed at PFSA.........................42
Table 16 Capability to mitigate key supply chain risks faced by PFSA.....................................43
Table 17 Potential barriers affect strategic sourcing at PFSA....................................................44
Table 18 Potential barriers affecting implementation Real-Time SCRM...................................45
Table 19 Potential barriers affecting implementation Real-Time SC base operation management as
SCRM practiser.........................................................................................................................46
Table 20 Potential barriers affecting implementation of management of supplier related risk...47

IX
Acronyms and Abbreviations
AHP-Analytical Hierarchy Process
AIDS- Acquired Immune Deficiency Syndrome
ET- Event Tree
ETA- Event Tree Analysis
FMEA- Failure Mode Effect Analysis
FTA- Fault tree analysis
GS- General Service
HCMI- Health Commodity Management Information System
HIV- Human Immune deficiency Virus
HR- Human Resource
IGS- Interim Group Secession
IPLS- Integrated Pharmaceutical Logistics System
IT- information technology
JIT- Just In Time
LMIS- Logistic Information Management Systems
MDG- Millennium Development Goal
MIS- management information science
MoH-Ministry of Health
PFSA- Pharmaceutical Fund and Supply Agency
PHARMID –Pharmaceutical and Medical Supplies Import and Whole Sale Enterprise
PSC- Pharmaceutical Supply Chain
RDF- Revolving Drug Fund
RPN- Risk priority number

X
RSV-Risk score values
SC- Supply Chain
SCM- Supply Chain Management
SCOR- Supply Chain Operation Reference
SCRM- Supply Chain Risk Management
SCR-Supply Chain Risk
SD- Standard Deviation
SD-Standard deviation
SPSS- Statistical Package for the Social Sciences
USA- United States of America
WHO- World Health Organization

XI
Abstract
Supply chain risk management is the systemic identification, assessment, and mitigation of
potential disruption in logistics network with the objective to reduce their negative impact on
the logistics network performance. Whilst risk has always been present in the process of
reconciling supply with demand there are a number of factors that have emerged in last
decades which have increased the level of risk. Increased demand for just in time deliveries,
the trend to outsourcing, ever changing customer demand, a reduction in supplier base are
some to mention. Any risk affecting the pharmaceutical supply chain not only waste resources
but also threaten patients’ life by hindering access to medicines. The pharmaceutical fund
and supply agency was established back in 2007 in order to introduce efficiency in the supply
chain of pharmaceuticals and medical supplies management system as well as to address
issues of drug availability and affordability. Observed problems in the supply chain
operation of the agency such as frequent shortage and stock out of medicines, and purchase
of poor quality pharmaceutical initiate to conduct this study. The study is conducted with the
objectives of identifying main supply chain risks faced by pharmaceutical fund and supply
agency, access the extent to which supply chain risk management is practised by
pharmaceutical fund and supply agency, and determine the barriers in adopting Supply chain
risk management. A case study research approach was chosen as the research strategy for
investigating the research questions. The research is a quantitative descriptive type which
originates from the prevailing descriptive qualities of both a case study approach and the
research’s conceptual frame work. The findings of the study showed weak risk identification,
a higher supplier risk, a weak implementation of supply chain risk management, and a
number of barriers in adopting supply chain risk management. Factors like; supplier
geographical distance, inadequate technology, poor communication across a supply chain,
and lack of supply chain management knowledge stated as frequently occurring barriers. The
paper recommends the Agency to adopt a better risk identification technique since risk
identification is a key and first step in implementing supply chain risk management.
Moreover a much better work should be done in handling supplier’s risk since it is found to
be the primary risk factor in the pharmaceutical supply chain of the Agency, barriers in
adopting a better supply chain risk management like supplier geographical distance can be
addressed by making use of better communication technologies as well as building the
capacity of local pharmaceutical manufacturers.
Key words Disruption, risk, supply chain risk management, and threat.

1
CHAPTER ONE
1. INTRODUCTION
The World Health Organization (WHO) estimates about one-third of the world's population
lack access to essential medicine, mostly in Asia and Africa. For this, availability and
affordability of essential medicines is taken as one of the Millennium Development Goal
(MDG) in developing countries (who.int). Access to medicine is one of the elements of the
right to health which is outlined in article twelve of the international covenant on economic,
social and cultural rights which has been ratified by approximately 150 countries including
Ethiopia. Kaufmann, Thiel, and Becker (2005) stated pharmaceutical supply chain (PSC)
should provide medicines in the right quantity, with the acceptable quality, to the right place
and customers, at the right time and with optimum cost to be consistent with health system‟s
objectives and also it should make benefits for its stockholders.
1.1 Background of the study
Any risk affecting the PSC not only wastes the resources but also threaten the patients‟ life by
hindering access to medicines (Schneider and Wilson 2010). But the use of the term „risk‟
can be confusing because it is perceived as a multidimensional construct. On one hand, it is
used to refer to uncertain internal or external (environmental) variables that reduce outcome
predictability. In this sense, „risk‟ actually refers to a source of risk and uncertainty, such as
„political risks‟ and „market risks‟ or from a supply chain views „the volatility of customer
demand‟. On the other hand, the term risk is also used when referring to the consequences of
risks, i.e. to the potential outcome indicators. In this sense, the terms „operational risks‟,
„human risks‟ or „risks to customer service levels‟ are consequences of risk becoming events
( Kilubi and Dietrich, 2015).
According to Liz Breen (2008) risk can be defined as the probability of unwanted outcome
happening or the probability and magnitude of a loss, disaster, or other undesirable event.
More elaborately it can be stated as the chance, in quantitative terms, of a defined hazard
occurring. It therefore combines a probabilistic measure of the occurrence of the primary
event(s) with a measure of the consequences of that/those event(s). Management can be
defined as the planning, organizing, coordinating, controlling, and directing of resources
toward a defined objective.

2
By combining the definitions given above and various definitions developed by others supply
chain management (SCM) can be defined as the management of material, information, and
financial flows through a network of organizations (i.e., suppliers, manufacturers, logistics
providers, wholesalers/distributors, retailers) that aims to produce and deliver products or
services for the consumers. It includes the coordination and collaboration of processes and
activities across different functions such as marketing, sales, production, product design,
procurement, logistics, finance, and information technology within the network of
organizations (Ritchie and Brindley, 2007a; Shah,2004).
Supply Chain Risk Management (SCRM) is the systematic identification, assessment, and
mitigation of potential disruptions in logistics networks with the objective to reduce their
negative impact on the logistics network‟s performance (Norman and Jansson, 2004). SCRM
is also defined as to collaborate with partners in a supply chain, apply risk management
process tools to deal with risks and uncertainties caused by or impacting on logistics related
activities or resources (Norrman and Lindroth, 2002). Piyush et al. (2011) stated SCRM
emerged as a natural extension of SCM with the prime objective of identifying the potential
sources of risks and suggesting suitable action plans to mitigate them. Hence the focus of
SCRM is to understand, and try to avoid, the devastating ripple effects that disasters or even
minor business disruptions can have in a supply chain. SCRM is a crucial and indivisible part
of SCM to achieve mentioned objectives of any given firm and risk management has now
become an integral part of every aspect of business operations (Norman and Jansson, 2004).
Any glitch within the supply chain can cause delays and even disruption to the supply chain
(Buzacott, 1971). Most recent incidents, such as the Arab Spring protests, the Sendai
earthquake, and the Thailand floods in 2011 have shown how such disruptions can severely
affect even the most stable supply chain. According to Tang, (2006a) the increasing numbers
of research studies on supply chain disruptions resulting from economic and political
instability, volatile market dynamics, natural disasters or human actions, have shown that risk
issues are becoming the new norm in supply chain (SC) operations. Occurrence of several
well-documented incidents, both natural and manmade such as (e.g. Tsunami 2004,
Hurricane Katrina 2005, Taiwan earthquakes 1999, 2009, and 2010 Iceland volcano 2010, the
nuclear disaster in Fukushima 2011, or Hurricane Sandy in 2012), terrorist attacks (e.g. New
York, 2001; Madrid, 2004; London, 2005; Jakarta, 2009) and diseases (e.g. foot- and mouth
disease 2001 in the UK; SARS-pandemic 2003/2004; Avian influenza, 2005; Swine influenza

3
2009), make interest in supply chain risk (SCR) issues to steadily grow (Wagner and Neshat,
2012).
Whilst risk has always been present in the process of reconciling supply with demand, there
are a number of factors that have emerged in the last decade or so which might be considered
to have increased the level of risk (Kut and Zheng, 2003). These include; a focus on
efficiency rather than effectiveness, the globalization of supply chains, focused factories and
centralized distribution, the trend to outsourcing, Low Cost Country (LCC) sourcing, ever-
changing customer demand, expanding product variety, shorter product life cycles and
compressed time-to-market, fast and heavy ramp-up of demand early in product life cycles,
capacity limitation of key components, and a reduction of the supplier base (Jüttner, 2003 and
Norman and Jansson, 2004). Moreover increased demand for just-in-time (JIT) deliveries,
reduced inventory buffers, and e-business play a significant role in repeated and unexpected
disruption in a supply chain (Fawcett et al, 2011; Irene and Haasis, 2015).
Additionally the demands of the business environment and the progression of emerging
markets are leading to the development of dynamic and complex SC networks which hinder
visibility and consequently reduce ones control over the process (Irene and Haasis, 2015).
What's more is service supply chain should be managed differently from manufacturing
supply chain, because they are characterized by intangibility, and heterogeneity in
consumption (Liz Breen, 2008).
The risks in supply chains arise mainly due to (I) Operational fluctuations such as variability
in supply, demand uncertainties, and price variability Juttner, (2005); Christopher and
Lee,(2004) (ii) Natural events such as earthquakes, cyclones, epidemics and (iii) Manmade
crises such as terrorist attacks, unethical business practices and economic recessions
(Kleindorfer and Saad, 2005). The supply chain involves every stage from planning and pro-
curement to the final delivery of products and any organization within a supply chain
performs activities of sourcing, making and delivery while each of these activities are prone
to disruption. It is better to have a closer look at each of these activities to better understand
sources of risk.
a. Source
Sourcing involves the acquisition of physical products or services. Source of risk from
activities of sourcing consists: single sourcing risk, sourcing flexibility risk, supplier
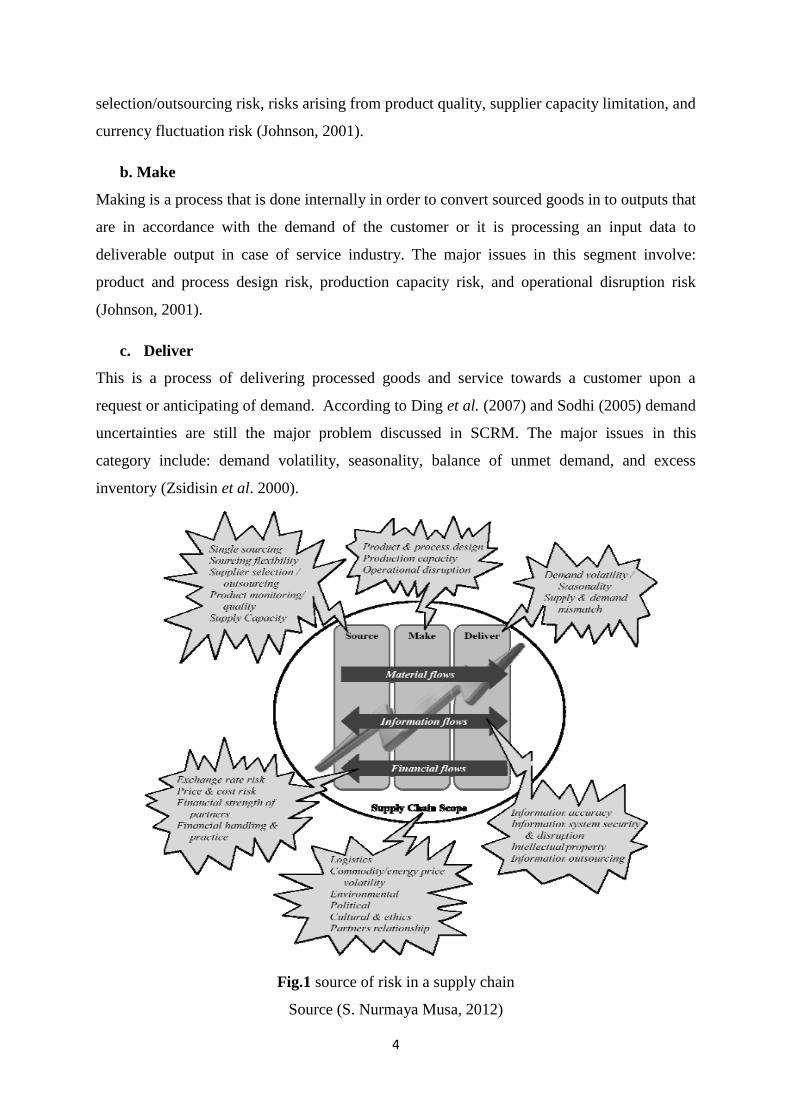
4
selection/outsourcing risk, risks arising from product quality, supplier capacity limitation, and
currency fluctuation risk (Johnson, 2001).
b. Make
Making is a process that is done internally in order to convert sourced goods in to outputs that
are in accordance with the demand of the customer or it is processing an input data to
deliverable output in case of service industry. The major issues in this segment involve:
product and process design risk, production capacity risk, and operational disruption risk
(Johnson, 2001).
c. Deliver
This is a process of delivering processed goods and service towards a customer upon a
request or anticipating of demand. According to Ding et al. (2007) and Sodhi (2005) demand
uncertainties are still the major problem discussed in SCRM. The major issues in this
category include: demand volatility, seasonality, balance of unmet demand, and excess
inventory (Zsidisin et al. 2000).
Fig.1 source of risk in a supply chain
Source (S. Nurmaya Musa, 2012)

5
1.2 The Pharmaceutical Fund and supply agency (PFSA)
To address issues of drug availability and affordability, the government of Ethiopia supported
the creation of revolving drug funds (RDF) as part of the new health care financing strategy
back in 1998. These funds aim to increase resources at facility-level through the sale of
medicines with a mark-up, thereby generating additional funds for the procurement of new
drugs and quality improvements. The strategy aims to enhance affordable and sustainable
supply of medicines to the public, improve overall quality of services provided, and promote
sustainability of health services. This approach is also in line with a body of work arguing
that charging for services and drugs can improve the efficiency of the system, improve
availability and affordability of medicines and result in increased health utilization and
particularly improve procurement of drugs though there are arguments that states charging for
health services deter use.
In order to introduce efficiency in the supply chain of pharmaceuticals and medical supplies
management system, the former Pharmaceutical and Medical Supplies Import & Wholesaler
Enterprise (PHARMID) has been transformed into PFSA with several measures taken to
strengthen the capacity of the new agency. PFSA was established back in 2007 with
proclamation 553/2007 as an autonomous federal organ having its own legal personality. It is
established by the government of Ethiopia upon the understanding of health as the pillar of
securing proper life and productivity of the people and pharmaceuticals share a vital role in
the health service, pharmaceutical expenditure is much significant as compared to other
health service budget, a necessity to supply quality assured essential pharmaceuticals at
affordable price in a sustainable manner to the public, appropriateness of designing a system
of mobilizing funds to different sources to insure uninterrupted and sustainable supply of
pharmaceuticals to all health facilities and service the public in equitable manner (Federal
Negarit Gazetta, 2007).
PFSA has stated its vision and mission as “to see the public access quality pharmaceuticals
with honourable service” and ''avail affordable and quality pharmaceuticals sustainably to all
public health facilities by using revolving drug fund" respectively. The agency is established
with the sole objectives of supplying quality assured and affordable pharmaceuticals, medical
supplies, and medical instruments to the public, to play complementary role in developmental
efforts for health service expansions and strengthening by ensuring enhanced and sustainable
supply of pharmaceuticals, and to create enabling condition for the accumulation of the Fund

6
in revolving and cost recovery process thereby ensuring the realization of its objectives.
PFSA has financial sources from net income generated from the supply of pharmaceuticals
pursuant to the proclamation, resources allocated from the government in kind or in cash, and
grants in kind or in cash from donor agencies.
The agency is vested with power and duties that ranges from implementing effective and
efficient procurement and distribution system of pharmaceuticals and medical supplies to
providing proper storage for the item and collecting service charge pursuant to the directives
of the board. Regarding modalities of procurement of pharmaceuticals and payment of
service fees the proclamation states that the agency shall without prejudice to the general
government procurement principles have its own procurement manual. Moreover public
heath institution shall place orders to the agency for the supply of essential pharmaceuticals
and the agency shall in case of failure to supply the pharmaceuticals advice the institution of
the best alternatives and the institution shall be responsible to effect payment in cash to the
agency accordingly (Federal Negarit Gazetta, 2007).

7
Fig. 2 PFSA organizational structure
Source: HR Directorate of PFSA

8
1.3 Statement of the problem
Accessing affordable essential medicines is an important factor to address patients'
satisfaction and increase their health seeking behavior. According to WHO most leading
causes of death such as malaria, infectious diseases, and Human Immunodeficiency
Virus/Acquired immunity deficiency syndrome (HIV/AIDS) can only be prevented or treated
effectively by having appropriate medicines consistently available.
In Ethiopia the Pharmaceutical Fund and Supply Agency (PFSA) is established back in 2007
with proclamation 553/2007 as an autonomous federal organ having its own legal personality
with a mission of addressing issues of drug availability and affordability in the health sector
(Federal Negarit Gazeta, 2007). But there are noticed risks in the core supply chain activities
of the agency. These risk factors which normally exist in the process of reconciling demand
with supply frequently seen posing a problem in the operational activities of PFSA. Supply
risk commonly noticed in the operations of PFSA in the form of shortage and unavailability
of medicines and medical supplies in governmental health facilities which ought to be
primarily supplied by PFSA and the unavailability last even for months and those medicines
in shortage are meant to patients with critical health condition. Purchase of poor quality
pharmaceuticals is also the other problem a very recent example being the purchase and
disposal of two million dollar worth aid money substandard condoms from an Indian supplier
HLL Life Care Ltd. Internal risks which are exhibited in the form of over stock and
expiration of medication in warehouses and poor distribution system which lacks agility also
pose a significant risk in the efficiency of the firm operation in case of emergency conditions.
More importantly all this incompetence are happening while PFSA is operating in a relatively
non turbulent market which normally enable companies to operate with a flawed strategy or
structure and still achieve an average performance while a turbulent environment take such
firms to a complete chaos and consequently a significant risk to the health care system
(Smeltzer and Siferd, 1998; Sislian, 2000; Meixell and Gargeya, 2005).
Absence of a dedicated risk management department in the organizational structure of PFSA
is also the other problem noted since SCRM is concerned with the systematic identification,
assessment, and mitigation of potential disruption in logistics networks with the objective to
reduce their negative impact on the logistics networks performance. (Norman and Jansson,
2004). It is the above mentioned situations that led the researcher to ask a question about
what SCRM looks like at PFSA.

9
1.4 Objective of the Research
1.4.1 General Objectives
The general objective of this research is to assess the pharmaceutical supply chain risk
management practise of PFSA.
1.4.2 Specific Objectives
Identify the main supply chain risks faced by PFSA
To assess current SCRM practises employed by PFSA
Identify the barriers in adopting SCRM practises by PFSA
1.5 Research question
In order to achieve the research objective the following research questions are proposed.
RQ1) what are the different types of potential risks in PFSA?
RQ2) what possible mitigation strategies are adopted to manage these risks?
RQ3) what are the barriers in adopting a better SCRM practise in PFSA?
1.6 Significance of the study
This study apart from its contribution to developments in the academics subject area it also
increase awareness about the ever presence of risks and the need for designing a proactive
supply chain risk management strategy. Its contribution can also extend to other non
pharmaceutical supply chains sectors in the country. It can also serve as a springboard for
other researchers who would like to conduct further research in the area of SCRM in other
governmental or private companies. Additionally, the finding of the study contributes to the
existing literature in area of SCRM.
1.7 Scope of the study
As stated in the problem of the statement and cited by other authors PFSA faced a number of
problems that compromise its efficiency. But this research paper will focus on unpredictable
supply chain risks of various frequency, and severity that will pose a disruption in normal
operational activities of the Agency from head office perspective. The study doesn‟t aim to
investigate risks at branch level for two main reasons. The first is by assuming risk problems
to be similar with that of the central hub except presences of supplementary problems in
connection with distribution from the central hub while the second being scarcity of resources

10
financial, time, and personnel) to carry out the study at every branches. Furthermore the study
does not aim to examine the detailed outbound logistics activities (distribution system
throughout the country) of PFSA which limits achieving a comprehensive understanding of
supply chain risks that the Agency might face.
1.8 Limitation of the study
Since today‟s supply chains are too complex and interconnected in order to better understand
the firm‟s position a larger network has to be studied and not just from a single firm
perspective. Therefore a firms risk exposure in a given supply chain is a function of not only
a particular firms capabilities but also the supplier network that provides input to the
enterprise i.e. both foreign and local pharmaceutical manufacture (Modi and Mabert, 2007).
This perspective also to some extent limits the contribution of the study for final decision
making as well as generalization to other non pharmaceutical supply chain. Finally the
research takes a descriptive approach in assessing status of SCRM and do not tried to
examine how these risk affect SCRM at PFSA.
1.9 Operational definitions
Supply chain risk management- the systematic identification, assessment and mitigation of
potential disruptions in logistics networks with the objective to reduce their negative impact
on the logistics network‟s performance
Risk- it is the probability of unwanted outcome happening or the probability and magnitude
of a loss, disaster, or other undesirable events.
Threat- negative event that can cause a risk to become a loss expressed as an aggregate of
risk, and the likelihood of occurrence of the event
Disruption- major breakdown in the production or distribution nodes that comprise in a
supply chain
The agency- Pharmaceutical Fund and Supply Agency
1.10 Organization of the Study
The study is organized into five chapters. Chapter one is the introductory chapter that
covers the background of the study, statement of the problem, objectives of the study,
scope of the study & significance of the study. It introduces and focuses upon giving the
reader an overview of the study‟s development.

11
The second chapter presents, a review of related literature. It covers both theoretical and
empirical back grounds, as well as the theoretical framework of trends in SCRM.
Chapter three presents in detail a discussion and explanation of the research methodology. It
will begin with a discussion of the research design, population of the study, sampling
techniques, sample size, data collection instruments, the data collection procedures and ends
with data analysis approach.
Chapter four presents the results of the research and the discussion upon the findings. It
begins with data analysis on the general information of the research participant and proceeds
to the findings from questionnaire and discussion of the findings from a view point of the
research question. Chapter five finally presents the conclusion and recommendations of the
research.

12
CHAPTER TWO
2. RELATED LITERATURE REVIEW
Introduction
This literature review covers subject matters pertaining to SCRM that raise issues, both
theoretical and empirical that has been discussed in the past studies. The information
covered in the literature review was obtained mostly from published articles, books, both
governmental and nongovernmental websites, Newspapers, proclamations, and conference
papers.
2.1 Theoretical literature review
Though the subject risk is not a new concept it is gaining more focus from the beginning of
the twenty one century onwards in literatures of supply chain management (Smallman 1996;
khan et al 2007). Due to repeated occurrence of events that lead to supply chain disruption
which consequently disrupt the operation of one or more supply chain member a number of
authors acknowledged that more and more papers focusing on SCRM are being published
indicating the growing importance of SCRM (Zsidisin et al 2006; Melo et al 2006).
Temporal trends in the field of SCRM take a pattern of risk definitions and investigation for
focal firm perspectives usually influenced by financial risk analysis with papers written in the
period of 1996-2000 while papers that published during 2001-2005 focused on consideration
of global risk issues, investigation of operational parameters such as inventory policies,
demand and supply, capacity planning and those paper that published from 2006 and onwards
became more interested in examining and explaining cross country relationship issues, issues
related to information sharing and security, focus on brand image and comprehensive supply
chain risk management program, agility and resilience, issues with the advent of globalization
and repeated occurrence of natural and manmade disaster (Melo et al. 2006).
2.1.1 Sources of Supply Chain Risks
A number of authors have contributed to the development of the subject while considering
risk from different perspective. Chopra and Sodhi (2004) classifies the causes of risk in to
nine risk categories which include disruptions, delays, systems, forecast, intellectual property,
procurement, receivables, inventory, and capacity. Some classify supply chain risk as
organizational risk (inventory risk, operational risk, quality risk, and management risk),
network risk (supply risk, supplier default, and demand risk) and environmental risk (events

13
driven by external forces). Risks internal to the supply chain involve those risks that lie
within the boundaries of the supply chain parties and ranges from labor strike, production
disruption to communication failure. Environmental risk sources comprise any uncertainties
arising from the supply chain-environment interaction (Social, political, natural, and
industrial or market risk). These may be the result of accidents (e.g. fire), socio-political
actions (e.g. fuel protests or terrorist attacks) or acts of God (e.g. extreme weather or
earthquakes) (Normann and Jansson, 2004; Abhijeet et al. 2012). Whatever damage which
caused by suboptimal interaction between the organizations along the chain is attributable to
the third risk category network-related risk sources and there are three different types of
network- related risk sources: lack of ownership, chaos and inertia (Christopher and Lee,
2004). In this sense, environmental and organizational uncertainties are risk sources „to‟ the
various links in the supply chain and network-related uncertainties are risk sources „of‟ the
various links (Das and Teng, 1998).
Other classifications include based on probability and impact, Hallikas et al. (2004)
operational and disruption risk, Tang, (2006a) capacity limitation, technological
incompatibility, supply disruption, and currency fluctuation Berger and Zeng, (2006) as well
as strategic, and operational risk (Fawcett et al. 2011). Yet other authors choose to focus on
the concept of risk application, Cousins, (2004); Fraser and Henery, (2012); Harland et al.
(2003) sources of risks Smallman, (1996), risk assessment, Frosdick (1997); Blackhurst et al
(2008) risk mitigation Christopher and Lee (2004), risk modeling Faisal (2006), flexibility
Tang and Tomlin (2008), risk management Fawcett et al. (2011); Manuj and Mentzer (2008);
Savage et al. (2006), and associated economic repercussions Papadakis (2006).
Risk events were also studied with core supply chain activities (source, make, and deliver)
and investigated with common business practices. Supply risks are associated with
procurement and are considered to be threats to supply assurance. Supply risk relates to
potential or actual disturbances to the flow of product or information emanating within the
network, upstream of the focal company. Therefore, it is risk associated with a company's
suppliers, or supplier's suppliers being unable to deliver the materials the company needs to
effectively meet its production requirements/demand forecasts. It adversely affects inward
flow of any type of resource to enable operations to take place; also termed as „input risk‟.
These risk sources include; possibility of improper supplier selection, uncertainty in supply
lead time, supply system design (number of suppliers (single/multiple sourcing)), location of
suppliers (local/global sourcing) and supplier‟s agility, flexibility, delivery reliability,

14
infrastructural strength, coordination and information sharing (Smeltzer and Siferd, 1998;
Faizal and Palaniappan, 2012).
Demand risk relates to potential or actual disturbances to flow of product, information, and
cash, emanating from within the network, between the focal company and the market. This
demand risk can be a failure on either the high or low side to accurately accommodate the
level of demand. It encompasses uncertainties in both product volume and mix which
includes; loss of major accounts, volatility of demand, and concentration of customer base
(Ding et al, 2007; Sodhi, 2005)
The other source of risk is process risk. Processes are the sequences of value-adding and
managerial activities undertaken by the company. Process risk relates to disruptions to these
processes. It affects a firm‟s internal ability to produce and supply goods/services, which
results from the consequences of a breakdown in a core operating, manufacturing or
processing capability. It includes; manufacturing yield variability, lengthy set-up times and
inflexible processes, equipment reliability, limited capacity/bottlenecks, and outsourcing key
business processes (Johnson, 2001).
Control risk can also be a source of risk. Controls are the assumptions, rules, systems and
procedures that govern how an organization exerts control over the processes. In terms of the
supply chain they may be order quantities, batch sizes, safety stock policies etc. Control risk
is therefore the risk arising from the application or misapplication of these rules. It includes
inappropriate rules that distort demand poor visibility along the pipeline lack of collaborative
planning and forecasts bullwhip effects due to multiple echelons (Iwan et al, 2009).
2.1.2 The SCRM Process
Apart from discussing different source of risk and classification of risk a number of authors
have also discussed steps or processes in SCRM (Faizal and Palaniappan, 2012). Accordingly
SCRM process classified into two broad categories: risk assessment and risk control. Risk
assessment is used to analyze the degree of risk associated with each hazard. The goal of risk
assessment is to indicate which areas and activities in the value chain are most susceptible to
hazards. It balances the probability of demand, the likelihood of reliable supply, the most
effective allocation of resources, the probability of success of new product introductions,
market conditions, and the opportunity costs of alternative decision paths.

15
Performing such assessments will involve clarifying the nature of the risk, understanding
conditions that may lead to the event, knowing how frequently such events have happened or
can be expected to happen, and the potential impact of such events.
Risk assessment is typically made up of two measures: Likelihood and Impact. Likelihood
measures the probability that the event will occur. The exact probability may be difficult to
determine unless there is historical data that can be used to find the frequency of the event
occurring. Alternatively an organization can use a subjective likelihood, or degree of belief,
based on the opinions of experts. A time horizon is necessary to define the probability in a
useful way (e.g., the likelihood that an event will occur in the next year or 50 years). Impact
measures the consequences on the organization if the event occurs. It can be measured
directly, for example in terms of dollars. It can also be measured on a scale, for example from
zero to one with zero being very little negative consequence and one being a very bad
consequence. Methods for measuring impact include “what-if” simulations, financial models,
and opinions of teams of experts. Impact may also be measured in terms of other Supply
Chain Operation Reference (SCOR) metrics besides financials. A summary risk score then
can be calculated for each risk by multiplying the impact times the probability to get an
expected value of the risk. Then risks can be ranked by risk score (Faizal and Palaniappan,
2012).
There are a number of tools used in assessment of a risk; Failure Mode Effect Analysis
(FMEA) is used to prioritize the risk using Risk Priority Number (RPN), which can be
calculated from probability of occurrence, severity and detection of risk and also using Risk
Score Values (RSV) in which severity and occurrence of risk is calculated. The other method
is Fault Tree Analysis (FTA) this is a graphical technique that provides a systematic
description of the combinations of possible occurrences in a system, which can result in an
undesirable outcome. This method can combine hardware failures and human failures. The
most serious outcome is selected as the “Top Event”. A fault tree is then constructed by
relating the sequence of events, which individually or in combination, could lead to the top
event. FTA is both a design and a diagnostic tool. As a design tool FTA is used to compare
alternative design solutions and the resulting top event probability. As a diagnostic tool FTA
is used to investigate scenarios that may have led to the top event (Ritchie et al, 2008).

16
Event tree analysis (ETA) is also a risk assessment tool for identifying and evaluating the
sequence of events in a potential accident scenario following the occurrence of an initiating
event. ETA utilizes a visual logic tree structure known as an Event Tree (ET). The objective
of ETA is to determine whether the initiating event will develop into a serious mishap or if
the event is sufficiently controlled by the safety systems and procedures implemented in the
system design. An ETA can result in many different possible outcomes from a single
initiating event, and it provides the capability to obtain a probability for each outcome
(Ritchie et al, 2008).
Activities under risk assessment include risk identification, risk estimation and risk
evaluation. Risk identification is regarded as a key aspect of SCRM. It involves generating a
list of potential events that could hamper the supply chain performance. Risk identification
enables an organization to be proactive in managing risks which makes it efficient and cost
effective. Inputs for identification of risk can be obtained from past experience or industry
research. Tools for risk identification include cause and effect diagram which trace back the
cause for an effect, and a Gant chart which is a bar chart showing the precedence and timing
of activities. A Gant chart enable in identifying a critical path i.e. the most critical
organization and processes that would be in trouble if a disruption is experienced (Zsidisin et
al, 2004).
On the other hand the risk control category consists of risk control and risk mitigation.
Multiple source of supply; strategic agreement or partnership with supplier; collaborative,
planning, forecasting, and replenishment, and joint product design and delivery are listed as
strategic risk mitigation methods (Faizal and Palaniappan, 2012).
Fig.3 SCRM process
Source (S. Nurmaya Musa, 2012)

17
2.1.3 Approaches in managing SCR
This section discuss on two selected management theories (contingency management theory
and agency theory) in relation to their applicability in the management of SCR.
2.1.3.1 Contingency management theory
This theory emphasizes the importance of situational influences on the management of
organizations and questions the existence of a single, best way to manage or organize a firm.
According to this theory appropriate strategies are contextual and structured, based on the
characteristics of the situation. Superior firm performance is achieved when strategy
appropriately matches up with environmental contexts. Studies consistently indicate that, in
supply chain contexts, mismatches between strategic approaches and environmental
characteristics are associated with inferior organizational performance (Zsidisin et al 2000;
Woojung et al, 2015). Contingency theory is an appropriate lens for investigating mitigation
choices for supply chain risk as there is no one right approach for managing and preventing
supply chain risk (Chopra and sodhi, 2004).
Confronted by a wide variety of potential supply chain-related risks, managers may focus on
applying one primary supply chain risk mitigation strategy assuming that the selected
approach effectively alleviates all supply chain risks. However such an approach is
inconsistent with the key tenets of contingency theory, which suggests that there is no single
approach for most effectively controlling all kinds of supply chain risks (Woojung et al,
2015). Rather, given that supply chain risk can be sparked by multiple different sources or
contexts, this paper proposes that a firm‟s supply chain risk mitigation strategies should be
tailored to accommodate the particular characteristics of risk contexts.
Well-established existing SCRM research identifies the probability (or likelihood) and the
severity (loss, impact, or seriousness) associated with risk occurrence as the two primary
characteristics for risk assessment (Zsidisin et al, 2004). Evaluating risk contexts (i.e. risk
probability and severity) is important for assessing appropriate supply chain risk mitigation
strategy because, as posited by contingency theory, risk contexts can determine appropriate
approaches for mitigation. For example, the optimal approach for mitigating a high-
severity/low-probability risk like the 2011 earthquake in Japan may be very different from
the optimal approach for mitigating the effect of recurrent low-severity/high-probability risks
like transportation breakdowns or late deliveries (Woojung et al, 2015). Therefore, consistent
with contingency theory, the conceptual framework of this paper proposes that the particular

18
situation or nature of the potential supply chain risk is critical when selecting an appropriate
mitigation strategy.
2.1.3.2 Agency theory
From a management perspective, the evolution of agency theory can be dated to the 1960s
and 1970s. Eisenhardt (1989) states that agency theory is relevant for the situations wherein
one party (the principal) delegates authority – in terms of control and decision-making about
certain tasks – to another party (the agent). When the agent is acting for the principal it
resembles behaviours such as performing for the benefit of the principal or acting as the
principal's representative or employee. It is found important to include the agency theory
within the conceptual frame work of this research since PFSA work with other partners by
subcontracting some of its duties in order to deliver an end to end solution to its customers.
Influential contributions made by different scholars have substantially improved our
understanding of how agency theory informs economic relations (Mitnick, 1975; Ross, 1979).
Previously application of agency theory in with different discipline such as economics and
finance Sappington (1991), information systems Mahaney and Lederer (2003), and
management Eisenhardt (1998) have been studied by different scholars. More recently,
(SCM) scholars have shown growing interest in using agency theory to understand how
participants within the SC manage risks, align incentives and forge relationships (Norrman,
2008).
Essentially, Ketchen et al (2007a) hypothesize that agency theory provides a mechanism that
may be used to explain how players (both independently and as a collective) within the SC
respond to transaction cost dilemmas where rational and non-rational behaviour occurs. Stock
(1997) put forwarded that agency theory may also assist managers in understanding SC
behaviour by focusing attention on the following issues. The development of inter- and intra-
organisational relationships; the maintenance of complex relationships between suppliers and
customers (e.g. vendors and third-party logistics providers); the dynamics of risk sharing,
capital outlay, power and conflict between channel intermediaries; and identifying the costs
and benefits of SC integration.

19
2.2 Empirical literature review
Globally abundant amount of article could be found which focuses on risk factors and
management in the pharmaceutical sector; among them some review studies in supply chain
risk management with focus on counterfeit, Jakson et al. (2012); Deus (2006); Goldhammer
and Lassman (2006) supply chain logistics Bishara (2006), quality assurance Deus (2006),
and enterprise risk management (Rogachev, 2008). In Ethiopian context an article that is
focused on PSC risk management could not be found as to my knowledge.
Melo et al. (2006) stated that about 56% of the related papers focus on supply risks. Analysis
of the literature focusing on supply risks shows that information sharing and coordination
issues have been paid the highest attention (44%) followed by the supply system design
issues (36%). The downstream issues also make a significant contribution (44%), which
shows that market uncertainties, demand fluctuations and associated risk issues are also well
addressed by researchers.
A major incident that is quoted in a number of articles dealing with SCRM is a supply
disruption faced by Ericsson on 18 March 2000 (Nurmaya, 2012; Faizal and Palaniappan,
2012; Iwan et al. 2009). Since it is a classic example of how seemingly minor disruption can
cause great consequence it is worth to narrate the incident briefly.
A major accident from an Ericsson perspective was a fire on 18 March 2000 in a very small
production cell (small as a conference room for ten people) at a sub-supplier‟s plant in
Albuquerque, New Mexico United States of America (USA). The ten-minute fire was an
effect of a lightning bolt hitting an electric line in New Mexico, causing power fluctuations
throughout the state. The problem was that when the power was out, there was no spare diesel
motor to supply the fans with power, so the fans stopped. From a plant perspective, the
resulting fire was almost negligible, and when the fire brigade arrived it was sent home as the
fire already was out. But for Ericsson, the impact was huge. In the spring of 2001, when the
annual report from Ericsson was announced, a major loss of about $400 million was
indicated, primarily due to gaps in the supply of radio-frequency chips from this supplier. The
reason was that the fire occurred in one of the plant‟s “clean rooms”, where absolutely no
dust is tolerated. Due to the fire, and especially the smoke and sprinkler water, it took almost
three weeks until the production was up and running. After six months, the yield was only 50
percent, and it would take years to get new equipment delivered and installed. As this plant
was Ericsson‟s only source for this chip, Ericsson was not able to sell and deliver one of its

20
key consumer products during its booming “market window”. The company lost many
months of mobile phone production, and the accident finally had a great impact on Ericsson‟s
decision to withdraw from the mobile phone terminal business in contrast the other telecom
giant Nokia‟s profit rose by 42% that year (Norrman and Lindroth, 2002).
In a review of empirical literature it is also worthy to have a look in to research and data
synthesis methods that were followed by authors. Data synthesis of research methods used for
decision-making in SCRM field can be broadly classified as qualitative and quantitative
methods. From a review of past literatures it is evident that the preferred methodology has
been qualitative (Abhijeet et al, 2012). Qualitative research methods could further divided
based on research approaches as empirical study, conceptual theory and literature survey.
Similarly, quantitative research methods were divided into mathematical modeling, statistics
and probabilistic theory and simulation for detailed thematic analysis.
Empirical study employs case study, industrial survey, and structured / informal interview
and focus group methodologies for analyzing information gained by means of observation or
secondary data study. Use of Interviews (Questionnaires) and focus group study is a common
qualitative methodology in the study of SCRM and repeatedly employed by a number of
authors to study SC disruption, the severity of supply chain disruptions and providing
mitigation strategies for the disruption (Lewis, 2003; Jiang et al, 2007; Autry and Bobbitt,
2008; Perry, 2007).
Quantitative research methods are broadly classified into mathematical modeling, simulation
and statistical testing for detailed thematic analysis (Abhijeet et al, 2012). Mathematical
modeling can be linear programming Lai et al. (2009), Analytical Hierarchy Process (AHP)
Levary (2008); Gaudenzi and Borghesi (2006), though Melo et al (2006) argue about the
subjectivity involved in AHP. Other mathematical modeling methods include stochastic
modeling Goh et al (2007) and scenario planning (Norrman and Lindroth, 2002).
In general underlying complexities and impractical assumptions limit the utility of
mathematical modeling. Moreover, in some cases the explicit relationships between decision
variables are difficult to model. In such situations, simulation techniques provide an
alternative approach to analyzing the supply chains by constructing an artificial environment
within which the dynamic behavior of the risks can be assessed (Melo et al, 2006).

21
Simulation methods are also widely used in evaluating and modeling supply chain risks
(Zsidisin et al, 2004). Several types of simulation modeling namely, agent based simulation
Datta et al (2007), Monte Carlo simulation Wagner and Neshat (2010), and discrete-event
simulation Manuj and Mentzer (2009) are used in the literature of SCRM.
The simulation models also have certain limitations, such as the models can only be run with
previously defined conditions and there are limited capabilities to design the system
parameter itself (Swaminathan et al. (1998); Hung and Ryu, 2008). To overcome these
shortcomings, multi-agent approaches, supported by advanced computational methods, have
been introduced. In these approaches the problem is modeled as agent elements (supplier,
manufacturer, distributor etc), control elements (inventory control, scheduling, logistics and
transportation etc) and their interaction protocols. These approaches are better than individual
programs as they combine the various autonomous agents/programs in one platform (Melo et
al, 2006). Statistics and Probability testing approach is also the other quantitative technique
used in study that aid in SCRM hypothesis testing with the help of linear regression model
Hung and Ryu, 2008).
So far this paper covers what is discussed in related previous literatures about SCRM.
Temporal trends in the field of SCRM that shows the progress how previous literature used to
address issues of SCRM, approaches in considering risk issue from different perspectives,
employed methods in classification of risks, steps in the process of SCRM, management
theories recommended for implementation during SCRM have been discussed. Moreover in
the empirical literature part related literature that have a focus on PSC which conducted with
a focus on one particular PSC such as counterfeiting, and quality assurance are discussed.
Apart from this the case of Ericsson single supplier policy failure which is considered as a
classic example in the literatures of SCRM have been discussed in detail in order to achieve
the awareness of how seemingly minor disruption in a SC result in critical consequences.
Though the presence of all these research articles in the field of SCRM the author of this
research couldn‟t come across any research paper that has a focus on PSC risk issues in
Ethiopia. It is this gap that leads me to conduct PSC risk management research on the
country‟s single and only state owned provider of pharmaceuticals; PFSA. Implication of this
research can also be further emphasized since any risk affecting the PSC not only wastes the
resources but also threaten the patients‟ life by hindering access to medicines (Schneider and
Wilson 2010).

22
2.3 Conceptual framework
Conceptual framework guides the flow of a research and visualizes the interaction of factors
and their relationship across a path. Supply chain because of its very nature comprised of a
number of stakeholder and risks in a supply chain can also originated from these various
stakeholders along its length. The approaches in managing these risks should also take in to
consideration the need to act contextually and acknowledging the roles of both the upstream
and downstream parties beyond the internal situation of a given company. Since the supply
chain involves every activity from planning and procurement to the final delivery of products
and service each activity within this chain is vulnerable to disruption. Apart from this risks in
supply chains categorized as operational risks (those risk factors that happen during
reconciling demand with supply), and environmental (natural and manmade events that cause
disruptions) (Juttner, 2005; Christopher and Lee,2004). A risk classification method
recommended by SCRLC (2011) and adopted by this research grouped risks into two major
categories as either internal or external risks. The paper further classified external risks in to
end-to-end, supplier and distribution risks.
End-to-end risks, accidents, sabotage, terrorism, political uncertainty, labor unavailability,
market challenges, lawsuits, technological trends, theft and adulteration, regulatory approval,
currency fluctuation, external regulation, and quality assurance.
Supplier risks include physical and regulatory, production problems, financial losses and
premiums, management and upstream supply risks.
Distribution risks include infrastructure unavailability, lack of capacity, labor unavailability,
cargo damage or theft, warehouse inadequacies, IT system inadequacies or failure, long,
multi-party supply pipelines, and demand uncertainties.
Environmental risk includes natural disasters, terrorism and war, regulatory changes, tax,
duties and quotas and strikes (Khan, 2010).
Internal risks include operational, political uncertainty, demand variability, personnel
availability, design uncertainty, planning failures, financial uncertainty, facility
unavailability, testing unavailability, enterprise underperformance, and supplier relationship
management.

23
The SCRM process as discusses in previous pages is composed of defined steps. These steps
are broadly classified as risk analysis and risk control. The former step consists of risk
identification, risk estimation, and risk evaluation while the latter step includes risk
mitigation and risk monitoring (S. Nurmaya Musa, 2012). The conceptual framework of this
research comprehend risk identification methods and their frequency of use in the Agency,
tools used in SCRM, as well as potential barriers in the implementation of SCRM at PFSA.
SCRM tools these are tools that can be utilized in the processes of SCRM to aid in advance
planning and facilitation of flow of finance, goods, and information.
Barriers in adopting supply chain risk management these are factors both internal and
external that hampers the implementation of SCRM (Christopher & Lee, 2001). Concerns
about increased costs, poor communication across supply chain, inadequate technology, lack
of management support, supplier geographical distance, and lack of supply chain
management knowledge are listed in this study as a potential barrier that could hinder the
implementation of SCRM mitigation strategy.
Fig. 4 SCRM a conceptual frame work
Source: Self Developed

24
As long as different risks of variable source, probability of occurrence, and magnitude of
consequences are present in order to reduce the negative outcome of these risks on the
logistics performance of the network a SCRM should be part of the given organization
management strategy and it is also an element of the conceptual frame work of this research.
In this conceptual frame work SCRM commence with identifying existing risks of various
sources as well as rating their relative treat to the operations of the Agency, followed by
identifying used SCRM tools employed for identifying these risk, and identifying potential
barriers which hinders implementation and progression of SCRM. Therefore the conceptual
frame work of this research takes factors described as sources of risk, risk identification
method, tools in identifying risks, and potential barriers in implementing SCRM as deciding
factors in controlling the SCR mitigation capability of PFSA.

25
CHAPTER THREE 3. RESEARCH DESIGN AND METHODOLOGY
Introduction
A research design, as defined by Kothari (2004) is the arrangement of conditions for
collection and analysis of data in a manner that aims to combine relevance to the
research purpose with economy in procedure. In fact, it is the conceptual structure within
which research is conducted; it constitutes the blueprint for the collection, measurement and
analysis of data. Research design stands for advance planning of the methods to be adopted
for collecting the relevant data and the techniques to be used in their analysis, keeping in
view the objective of the research and availability of staff, time and money. Data are
empirical evidence or information that should be gathered carefully by following certain rules
or procedures. The data can be quantitative (i.e. expressed in numbers) or qualitative (i.e.
expressed in words, pictures, objects).
Quantitative research involves data collection procedures that result primarily in numerical
data which is then analyzed by statistical methods whereas qualitative research involves data
collection procedures that result primarily in open-ended, non-numerical data which is then
analyzed primarily by non-statistical methods. The survey method can be used for three types
of research, namely descriptive (which focuses on the determination of the frequency with
which an event occurs and how variables are related/associated in a particular context),
exploratory (which emphasizes on the discovery of ideas and insights), and explanatory
(concerned with determining the impact and cause and effect relationships among variables),
(Bhattacherjee, 2012; Adams, et al, 2007).
3.1 Study area
Since the paper aims to study PSC risk management at PFSA the study is conducted at PFSA
head office located at Guillele Addis Ababa, Ethiopia. The rationale behind the selection of
the study area is because of all the staffs that manages the key activities of the agency with an
elaborated knowledge regarding the overall activities of the agency can be accessed
altogether. Moreover the researcher believed that managers and staffs at the head office are
more intellectual and experienced than those who work at the branch level which enables
them to better understand and respond to the research questionnaires better. Beside
circumstances at the head office level are reflections of that of the branches.
26
3.2 Research design
A case study research approach is chosen as the research strategy for investigating the
research questions. The research is a quantitative descriptive type which originates from the
prevailing descriptive qualities of both a case study approach and the research‟s theoretical
frame work.
3.3 Research participant
Participants of the study are selected based on their relevance to the subject of the research.
From the sixteen directorates of PFSA six main directorates that have more ties with PSC are
included in the study. The selected directorates are branch coordination directorate,
forecasting and capacity building directorate, pharmaceutical and medical supplies
procurement directorate, Pharmaceutical and medical supplies storage and distribution
directorate, planning, monitoring, and evaluation directorate, and medical device utilization
and specification preparation directorate. The other ten directorates namely Women and
youth affair directorate, reform and good governance directorate, public relation and
communication directorate, ethics and anti-corruption directorate, law service directorate,
audit service directorate, pharmaceutical supply management and Information Technology
(IT) directorate, HR and GS directorate, laboratory directorate, and finance directorate. These
directorates are excluded from the study because the researcher believed that it could be
challenging for them to respond to the entire questionnaire provide on the survey because of
the irrelevance with their main tasks.
3.4 Study population
The entire personnel in each selected directorate is listed and all members of the staff
excluding support staff like secretaries, cashiers, dispatch officers, daily labourer, stock
clerks, janitors, get men, and IT technicians are taken as study population. The number of
study population become eighty (one from branch coordination directorate, three from
planning monitoring and evaluation directorate, fifteen from pharmaceutical and medical
equipment procurement directorate, five from medical device utilization and specification
preparation directorate, twenty from forecasting and capacity building directorate, thirty six
from medicine and medical equipment storage and distribution directorate). Since the total
number of the study population become less than hundred a census approach is used in order
to achieve a desirable precision.

27
3.5 Method of data collection, sources and research instrument
The objective of data-collection is to get a good overall picture of how a process performs.
Though there are several methods of collecting primary data, particularly in surveys based
and descriptive researches. Some of the most important ones are: observation method,
interview method, questionnaires, schedules, and other methods (Hair et al, 2002).
However, for this paper a case study is followed since it is advantageous for the collection of
significant amount of primary data in an economic and efficient manner, common in
business research, it is particularly useful for the analysis of organisations, and it typically
allows for better understanding of particular phenomena in a defined setting.
Questionnaires are used as a research instrument for the collection of a primary data.
Questionnaires are a formalized set of questions involving one or more measurement scales
designed to collect specified primary data. Often they are the only feasible way to reach
a number of reviewers large enough to allow statistically analysis of the results. The
questionnaire is developed in order to gain vital information on risk identification, currently
employed SCRM practises, and barriers in adopting supply chain risk management practises
at the Agency. Adapted questionnaire from Kenneth (2015) is used which is a structured,
close ended type, prepared in English and divided in to four parts (Appendix 2). Part A
consisted of general information, Part B sought to identify the main supply chain risks
confronted by PFSA, part C determined supply chain risks management practices employed
by PFSA while part D determine the barriers to adoption of supply chain risk management
practices. The questionnaires are composed of a rating scale type of question to identify the
main supply chain risks faced by PFSA, establish SCRM practises employed by PFSA and
determine the barriers in adopting SCRM practises by PFSA. One question in part C also
provides an open ended type of alternative to let the respondent their say if they can‟t find
their choice from the given potential SCRM tools.
3.6 Data quality assurance
In compliance to (Wilkinson and Birmingham, 2003), before final administrating the
instruments the questionnaires were piloted and tested for validity in order to spot mistakes
and ambiguous questions so that to make necessary amendments. Test of reliability
Cronbach‟s Alpha was conducted on the research questionnaires in order to ascertain
the internal consistency of the research instrument. Acceptable level of Cronbach alpha of
above 0.80 is used as a reasonable test of scale reliability.
28
3.7 Method of data analysis and presentation
After questionnaires are distributed and collected back, analysis of data continued. The
collected data was processed using Statistical Package for Social Sciences (SPSS) 16.0.
Descriptive statistics and frequency table was used to interpret the responses of the
participants. To review the internal consistency of the scale items, Cronbach coefficients
(alpha) was computed. Accordingly, the summarized data was interpreted vis-à-vis the
raised research questions and the objective of the research to arrive at a meaningful
conclusion and recommendations are forwarded.
3.8 Instrument validity
In an attempt to ensure content validity as recommended by Kothari (2004) the questionnaire
was developed on the basis of a thorough review of the existing literature concerning the area
of inquiry. Furthermore, apart from the initial attempt to strongly ground the adaption of the
questionnaire on the extant literature, it was subjected to pre-test to further ensure its content
validity as suggested by Chen et al. (2004). Therefore six experienced experts from various
directorate of PFSA were made to critically review the items in the questionnaire for possible
ambiguity, lack of clarity, appropriateness, and whether or not it sufficiently address the
objectives. Comments were taken as an input to make the questionnaire more clear,
unambiguous, and comprehensive.
3.9 Ethical consideration
With a written cooperation letter from the School of commerce (Annex 2) respondents
were approached and informed about the intent of the research. Furthermore the participant
was informed that their response will be kept confidential and will be used for academic
purpose only, both verbally and written on the first page of the questionnaire. All the
participants are made to participate in the survey only with their full consent and their
identity stayed anonyms.

29
CHAPTER FOUR
4. RESULTS, DISCUSSION AND INTERPRETATION
Introduction This chapter presents the findings of the survey and discussions based on the results. The first
section deals with the general information of the research participant while the second part
presents answers to the research objectives; what are the different types of risks or potential
risks in PFSA, how does a risk event affects supply chain operations of PFSA, what possible
mitigation strategies are adopted to manage these risks, and what are the barriers in adopting
a better SCRM practise in PFSA. From the eighty PFSA staffs approached and taken the
questionnaires three participants (3.75%) fail to show up during two days of the questionnaire
collection and a further five respondents (6.25%) questionnaire rejected because of
uncompleted responses making the final effective respondents seventy two in number.
4.1 General information
The general information of this study consist of the respondents‟ gender, highest academic
qualification, duration of time the respondent worked in PFSA, and the directorate in which
he/she belongs to. From the seventy two respondent who completed the questionnaire eight
respondents (11.1%) were female while the rest sixty four (88.9%) were male. Regarding the
highest academic qualification achieved eight respondents (11.1%) are diploma holder, fifty
four (75%) have a bachelor degree, and ten (13.9%) of the respondents have a master degree.
The participants were also asked for how long they have worked at PFSA. The result show
nine (12.5%) of the respondent worked here for less than a year, fifteen (20.8%) between 1-2
years, thirty one (43.1%) between 3-5 years, and seventeen (23.6%) for more than five years.
Table 1 Cronbach's Alpha
Cronbach's
Alpha
Cronbach's Alpha
Based on Standardized
Items N of Items
Risk identification .801 .808 38
Employed SCRM practises .893 .890 28
Capability to mitigate key SCR .890 .887 22
Source: own study

30
4.2 Methods employed in identifying risks and main SCR faced by PFSA
As discussed in the literature review risk identification is regarded as a key aspect of SCRM
which enables an organization to be proactive in managing risks in turn making it efficient
and cost effective. Risk identification mainly deals with generating a list of potential events
that could potentially hamper the supply chain performance. In this research methods in
identifying risk events are listed and participant asked to rate to what extent they used the
listed methods in identifying risks. A choice is given for each risk identification method from
very “great extent” (5) to “not at all” (1).the result is presented on table 2.
Table 2: Methods employed in identifying risk by PFSA.
Risk
estimation
Previous risk
assessment
Developing
risk register
Brainstorming
session
survey
Freq
.
% Freq. % Freq. % Freq. % Freq. %
Not at all (1) 4 5.6% 5 6.9 12 16.7 9 12.5 19 26.4
Small extent (2) 30 41.7% 34 47.2 39 54.2 40 55.6 35 48.6
Moderate extent (3) 33 45.8% 29 40.3 18 25.0 19 26.4 15 20.8
Great extent (4) 4 5.6% 4 5.6 3 4.2 4 5.6 3 4.2
Very great extent (5) 1 1.4%% 0 0 0 0 0 0 0 0
N Mean SD. Deviation
Risk estimation 72 2.56 .748
Previous risk assessment 72 2.44 .710
Brainstorming session 72 2.25 .746
Developing risk register 72 2.17 .751
Surveys 72 2.03 .804
Valid N (list wise) 72
Source: own study
From the findings it can be seen that PFSA is using the listed risk identification methods
small to moderate extent with risk estimation better employed with a mean of 2.56 and
standard deviation (SD) 0.748 followed by, previous risk assessment mean 2.44 and SD 0
.710, brain storming session 2.25 mean and 0.746 SD, developing a risk register mean 2.17
and SD 0.751, and surveys mean 2.03 and SD 0.804.

31
The implication of the finding is PFSA is using risk estimation and previous risk assessment
better than the other methods even though these two methods are also used from small to
moderate extent. More importantly it is shown that the Agency is even much weaker in using
the methods of risk register and conducting surveys which are more formal, reliable, and
proactive methods of risk identification (Faizal and Palaniappan, 2012).
The other question raised is how a risk event affects supply chain operations of PFSA which
is the severity of threats posed on the SC of PFSA by listed potential risks. The potential risks
are subdivided in to five subcategories namely; external end to end supply chain risk (SCR),
external supplier risk, external distribution risk, environmental disruption risk, and internal
agency‟s risk. Each subdivision of SCR consists of a list of potential risks which participant
asked to rate it from “no treat” (1) to “highest treat” (5). The results are presented on table 3.
Table 3: External end to end supply chain risk
Quality
assurance
Regulatory
approval
Currency
fluctuation
Taxes, custom, &
other regulation
Theft and
adulteration
Freq % Freq % Freq % Freq % Freq %
No treat (1) 0 0 0 0 0 0 1 1.4 2 2.8
Low treat (2) 13 18.1 10 13.9 11 15.3 18 25.0 14 19.4
Moderate treat (3) 26 36.1 39 54.2 30 41.7 25 34.7 18 25.0
High treat (4) 31 43.1 20 27.8 24 33.3 21 29.2 34 47.2
Highest treat (5) 2 2.8 3 4.2 7 9.7 7 9.7 4 5.6
N Mean Std. Deviation
currency fluctuation 72 3.37 .863
theft and adulteration 72 3.33 .949
quality assurance 72 3.31 .799
regulatory approval 72 3.22 .736
taxes, custom, and other regulation 72 3.21 .978
Valid N (list wise) 72
Source: Own study
The findings indicate that all the listed end to end potential risk factor pose a significant treat
(between moderate to high) to the supply chain activities of PFSA. Currency fluctuation,
adulteration, and quality assurance risks pose a significant threat from the other risks with a
mean and SD of 3.37 SD 0.863 and 3.31 SD 0.799 respectively. This also agrees with
Goldhammer and lassman (2006); Jackson et al. (2012) as pharmaceutical counterfeiting is

32
one of the main threat in the PSC of even the developed countries. Currency fluctuation is
also discussed as a major risk issue in SC Kleindorfer and Saad (2005) and its consequence
could be even severe for the case of PFSA who majorly depends on imported of
pharmaceutical to meet the health care demands of the country.
Table 4: External supply risk
No treat (1) Low treat (2) Moderate treat (3) High treat (4) Highest treat (5)
Freq % Freq % Freq % Freq % Freq %
Possibility of
improper supplier
selection only
based on
minimum price
2 2.8 14 19.4 22 30.6 30 41.7 4 5.6
Performance of
supplier 0 0 8 11.1 25 34.7 35 48.6 4 5.6
Lead time 0 0 5 6.9 23 31.9 39 54.2 5 6.9
Cost escalation 2 2.8 5 6.9 26 36.1 35 48.6 4 5.6
Poor
communication
and coordination 2 2.8 6 8.3 36 50.0 27 37.5 1 1.4
Unavailability of
item 1 1.4 9 12.5 15 20.8 40 55.6 7 9.7
Single supplier 1 1.4 8 11.1 22 30.6 21 29.2 20 27.8
N Mean Std. Deviation
single supplier 72 3.71 1.041
Lead time 72 3.61 .723
unavailability of items 72 3.60 .883
performance of supplier 72 3.49 .769
cost escalation 72 3.47 .822
possibility of improper supplier selection 72 3.28 .938
poor communication and coordination 72 3.26 .750
Valid N (list wise) 72
Source Own study
From the result it is shown that a supplier risk pose a much higher treat in PFSA supply
chain. Potential risk factors like single supplier, lead time, and unavailability of item pose
higher treat than the other potential risk factors listed in supplier‟s risk category. This finding
also agree with Juttner (2005) that states supply risks poses a significant higher treat to the
integrity of the given company supply chain as it is a risk associated with a company's

33
suppliers, or supplier's suppliers being unable to deliver the materials the company needed to
effectively meet its demand forecasts.
Table 5: Distribution risks
No treat (1) Low treat (2) Moderate treat (3) High treat (4) Highest treat (5)
Freq % Freq % Freq % Freq % Freq %
Infrastructure
unavailability 0 0 11 15.3 46 63.9 13 18.1 2 2.8
Cargo damage
and theft 2 2.8 13 18.1 34 47.2 21 29.2 2 2.8
Warehouse
inadequacies 1 1.4 16 22.2 29 40.3 20 27.8 6 8.3
Longer lead time 0 0 2 2.8 28 38.9 38 52.8 4 5.6
Communication
barrier with
branch 1 1.4 11 15.3 31 43.1 27 37.5 2 2.8
Unexpected rise
in demand 0 0 3 4.2 25 34.7 39 54.2 5 6.9
N Mean Std. Deviation
unexpected rise in demand 72 3.64 .678
longer lead time 72 3.61 .640
communication barrier with
branch 72 3.25 .801
warehouse inadequacies 72 3.19 .929
cargo damage and theft 72 3.11 .832
infra structure unavailability 72 3.08 .666
Valid N (list wise) 72
Source: own study
The findings indicate that all potential risk factors under the category of distribution risk pose
more than high treat to the SC activities of PFSA. Unexpected rise in demand and longer lead
time pose a higher threat to the supply chain relative to the other potential risk factors. The
result also matches the findings on the previous page which states theft as a moderate extent
risk in the end to end SCR. Unexpected rise in demand (moderate to great extent) with a
mean of 3.64 and SD 0.678 is also justifiable as it is observed that stock out of medication is
common classic example being stock out of Oral Rehydration Salt (ORS) during epidemics
of cholera in the rainy season. On the other hand it is not unexpected if unexpected rise in
demand pose a high treat to the PSC of PFSA as it is ill prepared for environmental
disruption risk like natural catastrophe and manmade disaster.

34
Table 6: Environmental disruption risk
Political
risk
Natural
catastrophe
Manmade
disaster
Occurrence of
epidemic
Freq % Freq % Freq % Freq %
No treat (1) 12 16.7 11 15.3 2 2.8 0 0
Low treat (2) 33 45.8 34 47.2 33 45.8 9 12.5
Moderate treat (3) 17 23.6 21 29.2 25 34.7 27 37.5
High treat (4) 8 11.1 5 6.9 10 13.9 29 40.3
Highest treat (5) 2 2.8 1 1.4 2 2.8 7 9.7
N Mean Std. Deviation
occurrence of epidemic 72 3.47 .839
manmade disaster 72 2.68 .853
political risk 72 2.37 .985
natural catastrophe 72 2.32 .869
Valid N (list wise) 72
Source: own study
Environmental disruption risks are characterized by low probability of occurrence and a
higher magnitude of disruption consequence (Norrman and Jansson, 2004; Abhijeet et al,
2012). Here from the research findings it is shown that environmental disruption risks like
natural catastrophe, political risk, and manmade disaster perceived as a low treat by the
respondents of this research with a mean of 2.32, 2.37, and 2.68. From the listed potential
threats in the category of environmental disruption risk only occurrence of epidemic get a
better attention from the respondent with a mean of 3.47, and SD of 0.839 and this is mostly
from previous lessons of occurred epidemics. But the overall score of lower environmental
disruption risk indicate that PFSA may be ill prepared to respond to a potentially occurring
environmental disruption risk and also this is reflected as unexpected rise in demand pose a
higher treat to PFSA with a mean of 3.64 and SD .678 as the findings under distribution risk
indicates.
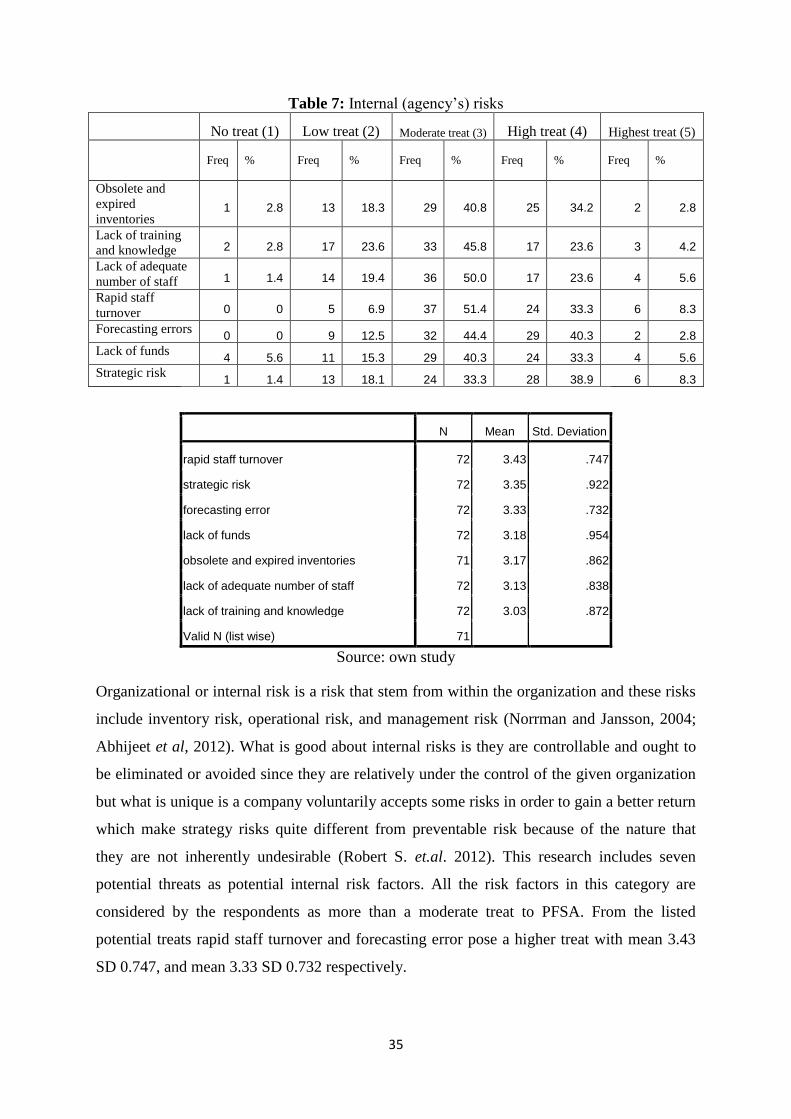
35
Table 7: Internal (agency‟s) risks
No treat (1) Low treat (2) Moderate treat (3) High treat (4) Highest treat (5)
Freq % Freq % Freq % Freq % Freq %
Obsolete and
expired
inventories 1 2.8 13 18.3 29 40.8 25 34.2 2 2.8
Lack of training
and knowledge 2 2.8 17 23.6 33 45.8 17 23.6 3 4.2
Lack of adequate
number of staff 1 1.4 14 19.4 36 50.0 17 23.6 4 5.6
Rapid staff
turnover 0 0 5 6.9 37 51.4 24 33.3 6 8.3
Forecasting errors 0 0 9 12.5 32 44.4 29 40.3 2 2.8
Lack of funds 4 5.6 11 15.3 29 40.3 24 33.3 4 5.6
Strategic risk 1 1.4 13 18.1 24 33.3 28 38.9 6 8.3
N Mean Std. Deviation
rapid staff turnover 72 3.43 .747
strategic risk 72 3.35 .922
forecasting error 72 3.33 .732
lack of funds 72 3.18 .954
obsolete and expired inventories 71 3.17 .862
lack of adequate number of staff 72 3.13 .838
lack of training and knowledge 72 3.03 .872
Valid N (list wise) 71
Source: own study
Organizational or internal risk is a risk that stem from within the organization and these risks
include inventory risk, operational risk, and management risk (Norrman and Jansson, 2004;
Abhijeet et al, 2012). What is good about internal risks is they are controllable and ought to
be eliminated or avoided since they are relatively under the control of the given organization
but what is unique is a company voluntarily accepts some risks in order to gain a better return
which make strategy risks quite different from preventable risk because of the nature that
they are not inherently undesirable (Robert S. et.al. 2012). This research includes seven
potential threats as potential internal risk factors. All the risk factors in this category are
considered by the respondents as more than a moderate treat to PFSA. From the listed
potential treats rapid staff turnover and forecasting error pose a higher treat with mean 3.43
SD 0.747, and mean 3.33 SD 0.732 respectively.
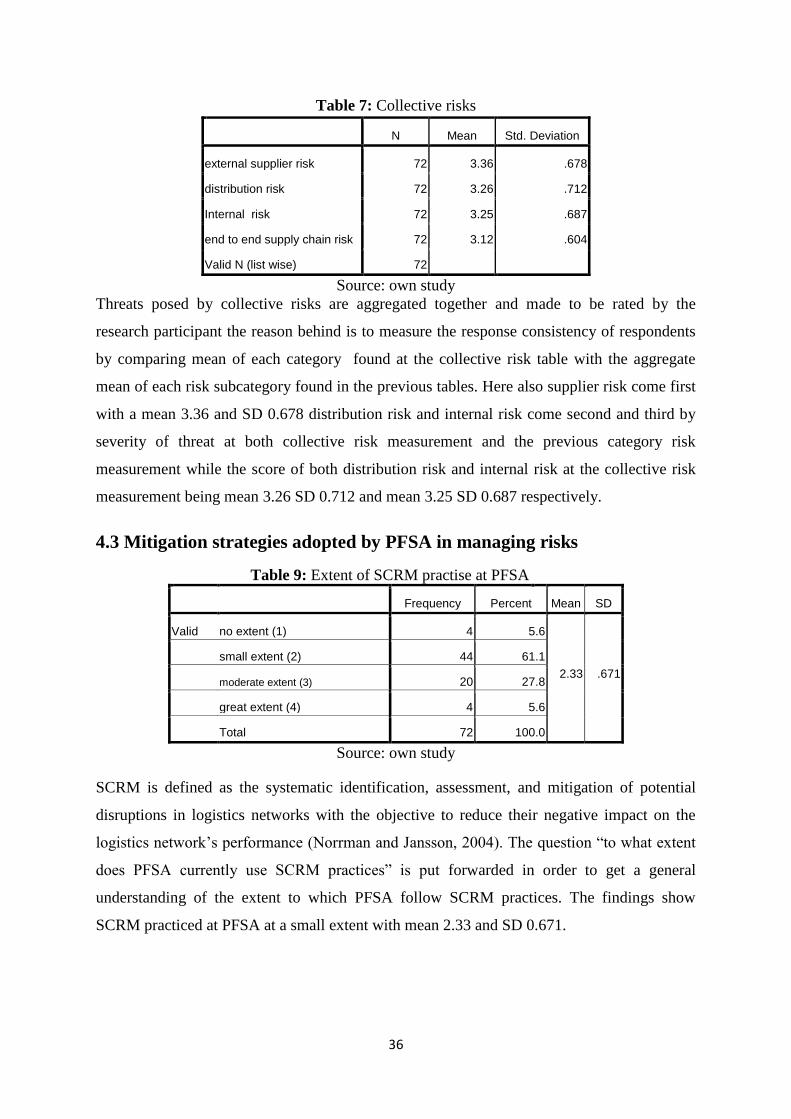
36
Table 7: Collective risks
N Mean Std. Deviation
external supplier risk 72 3.36 .678
distribution risk 72 3.26 .712
Internal risk 72 3.25 .687
end to end supply chain risk 72 3.12 .604
Valid N (list wise) 72
Source: own study
Threats posed by collective risks are aggregated together and made to be rated by the
research participant the reason behind is to measure the response consistency of respondents
by comparing mean of each category found at the collective risk table with the aggregate
mean of each risk subcategory found in the previous tables. Here also supplier risk come first
with a mean 3.36 and SD 0.678 distribution risk and internal risk come second and third by
severity of threat at both collective risk measurement and the previous category risk
measurement while the score of both distribution risk and internal risk at the collective risk
measurement being mean 3.26 SD 0.712 and mean 3.25 SD 0.687 respectively.
4.3 Mitigation strategies adopted by PFSA in managing risks
Table 9: Extent of SCRM practise at PFSA
Frequency Percent Mean SD
Valid no extent (1) 4 5.6
2.33
.671
small extent (2) 44 61.1
moderate extent (3) 20 27.8
great extent (4) 4 5.6
Total 72 100.0
Source: own study
SCRM is defined as the systematic identification, assessment, and mitigation of potential
disruptions in logistics networks with the objective to reduce their negative impact on the
logistics network‟s performance (Norrman and Jansson, 2004). The question “to what extent
does PFSA currently use SCRM practices” is put forwarded in order to get a general
understanding of the extent to which PFSA follow SCRM practices. The findings show
SCRM practiced at PFSA at a small extent with mean 2.33 and SD 0.671.

37
Table 10: Frequency of use of SCRM tools
Never (1) Rarely (2) Sometimes (3) Very often (4) Always (5)
Freq % Freq % Freq % Freq % Freq %
Sourcing tool 8 11.1 32 44.4 28 38.9 3 4.2 0 0
Inventory
optimization tool 10 13 17 23.6 32 44.4 12 16.7 1 1.4
Sales tool 23 32.4 28 39.4 9 12.7 10 14.1 1 1.4
Operation
planning tool 8 11.1 26 36.1 26 36.1 10 13.9 2 2.8
Master
management data
tool 12 16.7 28 38.9 21 29.2 10 13.9 1 1.4
Spend
management
analysis tool 19 26.4 28 38.9 19 26.4 6 8.3 0 0
N Mean Std. Deviation
inventory optimization tool 72 2.68 .962
operation planning tool 72 2.61 .958
master data management tool 72 2.44 .977
sourcing tool 71 2.37 .741
spend management analysis tool 72 2.17 .919
sales tool 71 2.13 1.068
Valid N (list wise) 71
Source: own study
In order to manage risks SCRM tools must be employed. These tools can be engaged in any
or all stages of SCRM i.e. from risk identification to control. There are a number of risk
management tools available which are applicable for different circumstances. Among these
by the judgement of the researcher the listed six SCRM tools are included for participants to
respond. More over participants were also provided with a blank space if they think they are
using a risk management tool that is not included in the list. No respondent quoted a tool
other than those in the list. From the listed SCRM tools the finding show that PFSA is using
inventory optimization tool relatively better even though it is rarely with a score of mean 2.68
and SD 0.962. The finding also concur with the assumption which recommends use of
inventory optimization tool for firms dealing with larger amount and assortment of stocks in
order to manage gaps between consumption and on hand inventory. Factors like
unpredictability of consumption demand due to demand rise and fall, and longer lead time,
which scores a higher mean in the previous pages, could push for a higher safety stock that
can make the use of inventory optimization tool indispensable.

38
Table 11: Practises employed in managing SCR
Improve
demand
forecasting
Stream line
processes
Creation of
SCR register
Increase
inventory
level
Decentralize
distribution
Freq % Freq % Freq % Freq % Freq %
Never (1) 2 2.8 2 2.8 6 8.3 1 1.4 2 2.8
Rarely (2) 13 18.1 26 36.1 31 43.1 8 11.1 1 1.4
Sometimes (3) 38 52.8 25 34.7 27 37.5 28 38.9 16 22.2
Very often (4) 13 18.1 16 22.2 6 8.3 31 43.1 41 56.9
always (5) 6 8.3 3 4.2 2 2.8 4 5.6 12 16.7
N Mean Std. Deviation
Decentralize distribution 72 3.83 .822
Increase inventory level 72 3.40 .816
Improve demand forecasting 72 3.11 .897
Streamline process 72 2.89 .928
Creation of supply chain risk register 72 2.54 .871
Valid N (list wise) 72
Source: own study
Managing SCR has different approaches and this section questioned the frequency of
practised SCR managing mechanisms that can be executed by tuning internal processes and
capabilities. From the list of activities listed under this section findings from the participant
response indicate that decentralizing distribution and increasing inventory level employed
frequently “very often” relative to the other mechanisms with a score of mean 3.83 SD 0.822
and mean 3.40 SD 0.816 respectively. This finding is also in line with the approaches of
PFSA as it is constantly expanding its branch reaching seventeen branches currently. The
distribution pattern at PFSA also shows similar as procured pharmaceuticals and medical
equipments are transported to the central hub then distributed to the seventeen branches all
over the country and all regional governmental health institutions are ought to be supplied by
the respective branches. Increasing inventory level is also the other frequently followed
practised approach as seen from the finding. This is also justifiable as risk mitigation since
findings at the previous page shows` unexpected rise in demand mean 3.64 SD 0.678, longer
lead time mean 3.61 SD 0.64, probability of occurrence of epidemic mean 3.47 SD 0.839 and
a risk of single supplier mean 3.71 SD 1.041.

39
Table12: Methods employed to manage supplier‟s related risk
Improve
collaboration
with supplier
Shift from
single to
multiple
supplier base
Conduct risk
audit of key
supplier
Supplier
development
Freq % Freq % Freq % Freq %
Never (1) 1 1.4 4 5.6 13 18.1
Rarely (2) 12 16.7 8 11.1 32 44.4 21 29.2
Sometimes (3) 46 63.9 34 47.2 21 29.2 20 27.8
Very often (4) 9 12..5 26 36.1 14 19.4 16 22.2
always (5) 4 5.6 4 5.6 1 1.4 2 2.8
N Mean Std. Deviation
shift from single to multiple supplier base 72 3.36 .756
improve collaboration with supplier 72 3.04 .759
conduct risk audits of key supplier 72 2.67 .904
supplier development 72 2.62 1.106
Valid N (list wise) 72
Source: own study
As discussed before supply risk poses a significant higher treat to the overall smooth SC
operation of a given organization and it is a more frequently happening and studied risk
factor within a supply chain (Melo et al, 2006). Findings discussed in the previous page
show a supply risk pose a relatively higher risk in the supply chain of PFSA with a treat score
of mean of 3.36 SD 0.678 as a collective treat. Findings here show that PFSA use supplier
strategies to manage supplier‟s related risk. Among the listed supplier management strategies
a shift from single to multiple supplier is employed with a better frequency by PFSA with a
score of mean 3.36 and SD 0.756. This approach taken by PFSA is justifiable and the finding
match previous section finding which on supplier related risk section shows a treat by single
supplier pose a relatively higher treat from other risk factors in the category of supply risk
with mean of 3.71 and SD1.041. Other supplier managing strategies listed in this category
employed with a lesser frequency. Supplier development scores the least frequency with a
mean of 2.62 SD 1.106. PFSA initiative in taking affirmative action for procurement from
domestic pharmaceutical manufacture defined in terms of advance partial payment for
ordered pharmaceuticals and price priority for local manufacturer can define why the
respondent dare to state supplier development practised by PFSA rarely.

40
Table 13: Strategic sourcing or advanced procurement practises
Regular screening
and monitoring of
current supplier
Require critical
suppliers to
produce a detailed
plan of disruption
awareness
Include
expected cost of
disruption in the
total cost of
equation
Require supplier to
provide timely
information and
visibility of
material flow
Freq % Freq % Freq % Freq %
Never (1) 3 4.2 11 15.3 7 9.7 11 15.3
Rarely (2) 29 40.3 22 30.6 20 27.8 19 26.4
Sometimes (3) 30 41.7 27 37.5 36 50.0 24 33.3
Very often (4) 7 9.7 11 15.3 6 8.3 15 20.8
always (5) 3 4.2 1 1.4 3 4.2 3 4.2
N Mean Std. Deviation
require supplier for timely information and visibility of material flow 72 2.72 1.091
include expected cost of disruption in the total cost of equation 72 2.69 .914
regular screening and monitoring of current supplier 72 2.69 .866
require critical supplier to produce a plan of disruption awareness 72 2.57 .976
Valid N (list wise) 72
Source: own study
Strategic sourcing can be stated as a systematic and fact based approach for optimizing an
organization‟s supply base and improving the overall value proposition. It mostly focuses
with getting the best value for money, recognizing total cost of ownership, and continuous
visibility (Sislian and Satir, 2000). Findings from this section show listed strategic sourcing
elements employed only “rarely” to “sometimes” by PFSA. This also shows that the Agency
is not in a strategic relation with its suppliers as the relation between PFSA and its supplier
should be stronger beyond a mere buying and selling encounter. Since strategic sourcing is a
continuous process and it should be bounded with visibility and it is not about focusing only
on cost, getting the cheapest product, focusing on beating up suppliers, and a onetime project
decision (Sislian and Satir, 2000). More over preparing for disruption management and
awareness only from self perspective is not enough and it is essential to require critical
suppliers to produce a plan of disruption awareness since a disruption can occur not only
internally but it could happen externally such as upon a critical supplier which consequently
can pose a high treat from lack of that critical supply. The Philips fire incident which was a
critical supplier to Ericsson and the consequential bankruptcy of Ericsson can be a good
example (Musa, 2012; Iwan et al, 2009).

41
Table 14: Real-Time supply chain management practises employed at PFSA
Conducting
frequent
meetings/tele
conferences
with critical
supplier
Implement
technologies to
track containers
in distribution
channel
Conduct a
detailed
disruption
incident report
and analysis
following a
major
disruption event
Create an
exception event
detection and
early warning
system
Freq % Freq % Freq % Freq %
Never (1) 4 5.6 8 11.1 3 4.2 7 9.7
Rarely (2) 20 27.8 33 45.8 34 47.2 37 51.4
Sometimes (3) 46 63.9 21 29.2 28 38.9 20 27.8
Very often (4) 2 2.8 10 13.9 7 9.7 8 11.1
always (5) 0 0 0 0 0 0 0 0
N Mean Std. Deviation
conducting frequent meeting with critical supplier 72 2.64 .635
conduct detailed disruption analysis following major disruption 72 2.54 .730
Implement techno. to track containers in distribution channel 72 2.46 .871
create an exception event detection and early warning system 72 2.40 .816
Valid N (list wise) 72
Source: Own study
This section of the survey request the research participant about the frequency of real-time
supply chain risk management practises followed by PFSA so far. The result shows none of
the listed approaches are used often or always. Conducting frequent meeting with critical
supplier is indicated by the respondents as it is employed with a relative better frequency with
a mean of 2.64 and SD 0.635 the scores of the other methods is even lower; conducting
detailed disruption analysis following major disruption mean 2.54 SD 0.730 implementing
technology to track containers in disruption channel mean 2.46 SD 0.871, and creating an
excellent event detection and early warning system mean 2.40 SD 0.816. A better score of
conducting frequent meeting with critical supplier is also justifiable as PFSA frequently hold
meetings with local pharmaceutical manufacture which aims at enhancing coordination
between local pharmaceutical manufacturer and PFSA. Conducting detailed disruption
analysis following major disruption is also justifiable as it discussed in the findings of risk
identification as previous risk assessment is scored as the second most frequently risk
identification method employed by the agency next to risk estimation.

42
Table 15: Real-Time base operation management practises employed at PFSA
Improve
visibility of
inventory
buffer in
domestic
distribution
channel
Classify
buffered
materials for
different levels
of criticality
Training key
employees
Developing real
time supply
chain
configuration
decision report
Freq % Freq % Freq % Freq %
Never (1) 1 1.4 3 4.2 2 2.8 5 6.9
Rarely (2) 28 38.9 35 48.6 17 23.6 34 47.2
Sometimes (3) 37 51.4 22 30.6 35 48.6 20 27.8
Very often (4) 5 6.9 10 13.9 18 25.0 11 15.3
always (5) 1 1.4 2 2.8 0 0 2 2.8
N Mean Std. Deviation
training key employees 72 2.96 .777
improve visibility of inventory buffer in a domestic dist. channel 72 2.68 .688
classify buffered materials for different levels of criticality 72 2.62 .879
developing real time supply chain configuration decision report 72 2.60 .929
Valid N (list wise) 72
Source: Own study
Real time base operation management practises are those activities that are performed
internally in order to achieve a real time (current, up to date, and right on the spot) control
over SC ongoing processes. These real time base operation practises are done internally in
order to be in equal pace with ongoing real time SCM practices that incorporate external
stakeholders like suppliers and customers. Here the findings from the respondent shows
training of key employees is practised with a better frequency with a mean of 2.96 SD 0.777
the other practises are performed less frequently; improving visibility of inventory buffer in
domestic distribution channel mean 2.68 SD 0.688, classifying buffered materials for
different levels of criticality mean 2.62 SD 0.879, developing a real time supply chain
configuration decision report mean 2.6SD 0.929. A better score for training key employees,
and improving visibility of inventory buffer in a domestic distribution channel could be a
credit of currently implemented programmes like Health Commodity Management
Information System (HCMI), which has two versions. The facility version is employed in
managing inventory transaction and product report while the warehouse edition used for
inventory management, warehouse management, and costing. The other intervention that can

43
have a role in real time base operation management of PFSA is the Integrated Pharmaceutical
Logistics System (IPLS). It is one of the major interventions taken by PFSA to create a
strong, unified, healthcare supply chain, to connect all levels of the supply chain, and to
provide accurate and timely data for decision making. To initiate IPLS, a number of
interventions were implemented, including (1) large-scale capacity building trainings for
health facilities and higher levels, (2) a program of supportive supervision, (3) physical
improvements to warehouses and storerooms, and (4) implementing paper-based and
automated Logistic Information Management Systems (LMIS) (USAID/DElIVER
PROJECT, 2015).
4.4 Barriers in adopting SCRM practises
Table 16: Capability to mitigate key supply chain risks faced by PFSA
Frequency Percent
Mean
SD
Valid no extent 1 1.4
small extent 39 54.2
moderate extent 28 38.9
great extent 4 5.6
Total 72 100.0 2.49 .628
Source: Own study
The fourth section of the questionnaire probed for possible barriers that hamper PFSA in adopting
SCRM. A list of possible barriers in adopting SCRM is given on the questionnaire so that respondent
could rate their relative strength in holding back the SCRM practise from no extent (1) to very great
extent (5). The first question of section four ask the respondent to rate the capability of PFSA in
mitigating key supply chain risks faced. The findings show currently PFSA has a small to moderate
extent capability in mitigating key supply chain risk. The mean is 2.49 and SD 0.628. The finding has
implication in showing the overall SCRM effectiveness of PFSA. Risk mitigation is one of the steps
included in the processes of SCRM specifically it is a step with in the risk control category (S.
Nurmaya Musa, 2012). Risk mitigation deals with diminishing the consequential disruption effects
of risks as well as their probability of occurrence. A lower risk mitigation capability score for PFSA
has a negative implication in the effectiveness of PFSA SCRM. A lower capacity in identifying risks
as well as a higher treat posed by risks of different sources which are indicated in previous findings of
this research adds up to a difficulty in achieving an effective SCRM

44
Table 17: Potential barriers affect strategic sourcing at PFSA
Never [1] Rarely [2] Sometimes [3] Very often [4] Always [5]
Freq % Freq % Freq % Freq % Freq %
Concern about
increased costs 0 0 9 12.5 39 54.2 20 27.8 4 5.6
Poor
communication
across supply chain 1 1.4 14 19.4 30 41.7 24 33.3
3 4.2
Inadequate
technology 1 1.4 10 13.9 29 40.3 27 37.5 5 6.9
Lack of
management
support 0 0 16 22.2 36 50.0 17 23.6
3 4.2
Supplier
geographical
distance 0 0 9 12.5 25 34.7 29 40.3 9 12.5
Lack of supply
chain management
knowledge 2 2.8 11 15.3 38 52.8 17 23.6
4 5.6
N Mean Std. Deviation
supplier geographical distance 72 3.53 .872
inadequate technology 72 3.35 .858
concern about increased cost 72 3.26 .750
poor communication across supply chain 72 3.19 .850
lack of supply chain management knowledge 72 3.14 .844
lack of management support 72 3.10 .790
Valid N (list wise) 72
Source: Own study
This section asks the research participants to rate the frequency potential barriers affecting
strategic sourcing at PFSA. From the list of potential barriers included supplier geographical
distance is stated as a relatively more frequent potential barrier with a mean 3.53 and SD
0.872, the scores of other barriers was inadequate technology mean 3.35 SD 0.858. Supplier
geographical distance pose as a more frequent barrier to the strategic sourcing activities of
PFSA because of majority of PFSA procurement are from overseas which sets hurdles in
achieving smooth flow of supplies because of longer lead time and failure to assure visibility
as inadequate technology is cited as a second frequent barrier in achieving strategic sourcing.
Inadequate technology is cited as a potential barrier in achieving strategic sourcing because
of the fact that technologies aid in harmonizing communication across a geographical
distance which is a potential barrier by itself as well as it aids in maintaining visibility along
the supply chain so as in order to reach a decision on a real time basis.

45
Table 18: Potential barriers affecting implementation Real-Time SCRM
Never [1] Rarely [2] Sometimes [3] Very often [4] Always [5]
Freq % Freq % Freq % Freq % Freq %
Concern about
increased costs 0 0 9 12.5 46 63.9 15 20.8 2 2.8
Poor
communication
across supply chain 0 0 10 13.9 33 45.8 28 38.9
1 1.4
Inadequate
technology 2 2.8 6 8.3 33 45.8 29 40.3 2 2.8
Lack of
management
support 0 0 17 23.6 36 50.0 17 23.6
2 2.8
Supplier
geographical
distance 1 1.4 6 8.3 18 25.0 39 54.2 8 11.1
Lack of supply
chain management
knowledge 2 2.8 7 9.7 39 54.2 18 25.0
6 8.3
N Mean Std. Deviation
supplier geographical distance 72 3.65 .842
inadequate technology 72 3.32 .784
poor communication across supply chain 72 3.28 .716
lack of supply chain management knowledge 72 3.26 .856
concern about increased cost 72 3.14 .657
lack of management support 72 3.06 .767
Valid N (list wise) 72
Source: Own study
Real-time SCRM is all about agility, being up to date, and on the spot management approach that
greatly call for being on time and staying informed. This section asked the research participant to rate
the frequency of potential barriers that affects implementation of real-time SCRM. The findings
indicate supplier geographical distance as a relatively more frequent barrier with mean 3.65 and SD
0.842.The scores of the barriers affecting implementation of SCRM was inadequate technology mean
3.32 SD 0.784, poor communication across supply chain mean 3.28 SD 0.716, lack of supply chain
management knowledge mean 3.26 SD 0.856, concern about increased cost mean 3.14 SD 0.657, and
lack of management support mean 3.06 SD 0.767. Supplier geographical distance is sated as a more
frequent barrier from achieving real-time SCRM which also supported by inadequate technology to
communicate with suppliers, track orders and ensure visibility as well as which further explained by
poor communication across the supply chain. As the frequency of occurrence of the mentioned
barriers increased it also become even harder to implement real time SCRM as it is all about being on
time.

46
Table 19: Potential barriers affecting implementation Real-Time SC base operation management as
SCRM practise
Never [1] Rarely [2] Sometimes [3] Very often [4] Always [5]
Freq % Freq % Freq % Freq % Freq %
Concern about
increased costs 1 1.4 6 8.3 44 61.1 19 26.4 2 2.8
Poor
communication
across supply chain 1 1.4 12 16.7 37 51.4 18 25.0
4 5.6
Lack of
management
support 1 1.4 14 19.4 32 44.4 24 33.3
1 1.4
Lack of supply
chain management
knowledge 4 5.6 7 9.7 30 41.7 25 34.7
6 8.3
N Mean Std. Deviation
lack of supply chain management knowledge 72 3.31 .959
concern about increased cost 72 3.21 .691
poor communication across supply chain 72 3.17 .822
lack of management support 72 3.14 .793
Valid N (list wise) 72
Source: Own study
Real time base operation for management of supply chain risks are actions that are
accomplished internally within the organization in order to be more informed and up-to-date
in a preparation to mitigate SC risks and to act with agility if they occur. Research participant
were asked to rate the frequency of occurrence of these potential barrier that hampers the
implementation of real-time base operation management as SCRM practise. Concern about
increased cost stated as a more frequent barrier with a mean of 3.21 SD 0.691 while the other
potential barriers score is as follow; lack of supply chain management knowledge mean 3.31
SD 0.959, poor communication across supply chain mean 3.17 SD 0.822, and lack of
management support with a mean of 3.14 and SD 0.793. Concern about increased cost as it
frequently occur can explained in terms of reluctance for investing in infra structure and other
inputs for technologies that could help in configuration of SCRM or reluctance for holding
extra inventories with the aim to operate lean and economical. But According to Chopra and
Sodhi (2004), supply chain disruptions can occur for a wide variety of reasons such as
industrial plant fires, transportation delays, work slowdowns or stoppages, or natural
disasters. Companies running lean operations no longer have inventory or excess capacity to
make up for production losses, so that material flow problems rapidly escalate to wide-scale
network disruptions.

47
Table 20: Potential barriers affecting implementation of management of supplier related risk
Never [1] Rarely [2] Sometimes [3] Very often [4] Always [5]
Freq % Freq % Freq % Freq % Freq %
Concern about
increased costs 1 1.4 7 9.7 44 61.1 18 25.0 2 2.8
Poor
communication
across supply chain 0 0 8 11.1 38 52.8 21 29.2
5 6.9
Lack of
management
support 0 0 13 18.1 36 50.0 20 27.8
3 4.2
Supplier
geographical
distance 1 1.4 11 15.3 28 38.9 23 31.9 9 12.5
Lack of supply
chain management
knowledge 2 2.8 7 9.7 31 43.1 26 36.1
6 8.3
N Mean Std. Deviation
supplier geographical distance 72 3.39 .943
lack of supply chain management knowledge 72 3.38 .879
poor communication across supply chain 72 3.32 .766
lack of management support 72 3.18 .775
concern about increased cost 72 3.18 .699
Valid N (list wise) 72
Source: Own study
As discussed before supply risk poses a significant higher treat to the overall smooth SC
operation of a given organization and it is a more frequently happening and studied risk
factor within a supply chain (Melo et al, 2006). Therefore Management of supplier related
risk is considered to have a key role in the overall SCRM processes. Here potential barriers
that could affect implementation of management of supplier related risk overall show a
relatively higher frequency. Lack of supply chain management knowledge shows a higher
frequency with mean 3.38 and SD 0.879, supplier geographical distance has also similar
frequency with mean 3.39 SD 0.943, poor communication across supply mean 3.32 SD 0.766
lack of management support mean 3.18 SD 0.775, and concern about increased cost has a
mean of 3.18 and SD 0.699. An overall high frequency for this question shows though supply
risk is considered as a prime risk category yet there are highly frequently occurring barriers
that can potentially hampers the implementation of management of supplier related risk.

48
CHAPTER FIVE
5. SUMMARY OF FINDINGS, CONCLUSION AND RECOMMENDATION
5.1 Summary of findings
From the findings of the research it is shown that external (supplier) risk pose a higher treat
to the supply chain activities of PFSA while internal risk factors, distribution risk, and end to
end supply chain risk present the next level of risks for PFSA. Supplier risk which poses a
relative higher treat was rated in terms of factors like supplier lead time, single supplier risk,
unavailability of items, poor supplier performance, cost escalation, poor communication and
coordination with supplier, and possibility of improper supplier selection only based on
minimum price. Internal risks which constitute the second higher treat at PFSA are composed
of factor like rapid staff turnover, forecasting error, strategic risk, lack of funds, obsolete and
expired inventories, lack of adequate number of staffs, and lack of training and knowledge
when listed with descending threat score.
External distribution risks are found to be the third factor that can cause supply chain
disruption. Factors included and rated in the distribution risk are unexpected rise in demand;
longer lead time in meeting demands, communication barrier with branches, warehouse
inadequacies, cargo damage and theft, and infrastructure unavailability when listed with
descending threat score. External end to end supply chain risks are ranked as the fourth
possible disruption causing risks and factors include currency fluctuation, theft and
adulteration, quality assurance risk, and as well as other environmental disruption risk like
occurrence of epidemic, manmade disaster, political risk and natural catastrophe.
The research also pin point methods employed in identifying risk by the Agency. None of the
listed risk identification methods employed more than moderately. According to the result
risk estimation is used in a small to moderate extent followed by previous risk assessment,
brain storming session, developing a risk register, and surveys.
The other objective of the research was to assess currently employed SCRM practises at the
agency. The findings show SCRM is practised small to moderate extent currently. The
findings show none of the supply management tools are used regularly and activities like
decentralizing distribution, increasing inventory level, improving demand forecasting, shift
from single to multiple supplier base, improving collaboration with supplier are practised as a
SCRM approach.
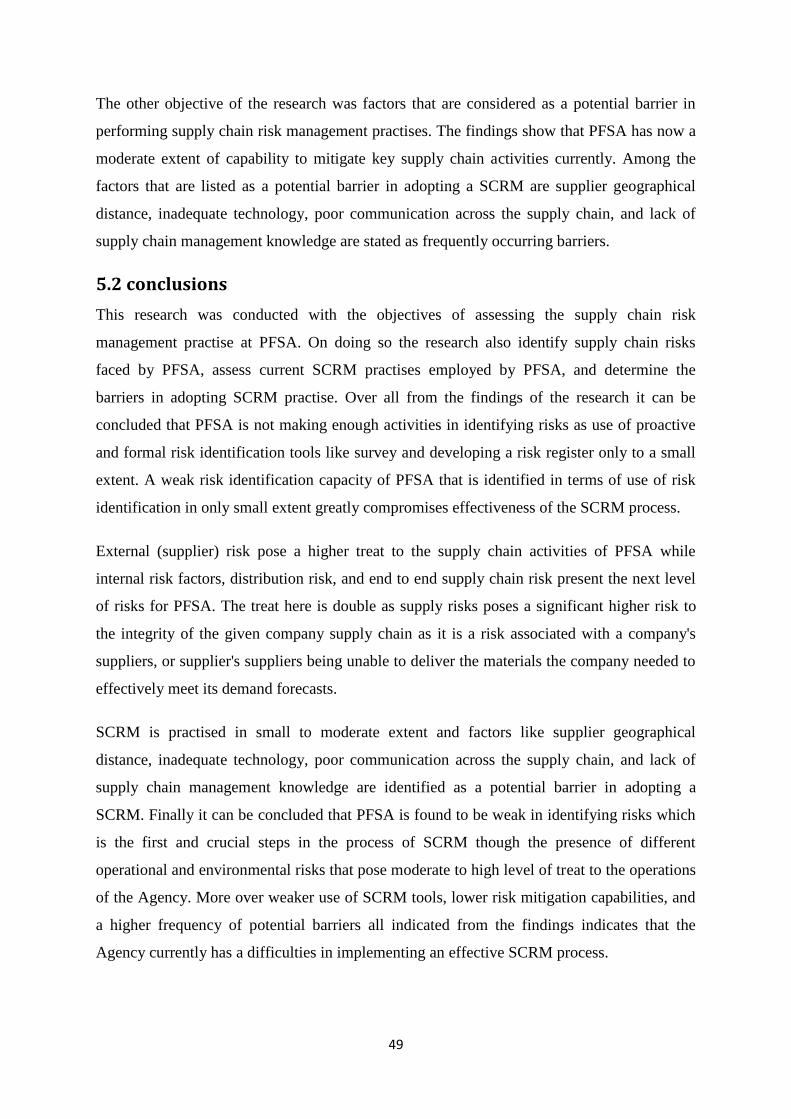
49
The other objective of the research was factors that are considered as a potential barrier in
performing supply chain risk management practises. The findings show that PFSA has now a
moderate extent of capability to mitigate key supply chain activities currently. Among the
factors that are listed as a potential barrier in adopting a SCRM are supplier geographical
distance, inadequate technology, poor communication across the supply chain, and lack of
supply chain management knowledge are stated as frequently occurring barriers.
5.2 conclusions
This research was conducted with the objectives of assessing the supply chain risk
management practise at PFSA. On doing so the research also identify supply chain risks
faced by PFSA, assess current SCRM practises employed by PFSA, and determine the
barriers in adopting SCRM practise. Over all from the findings of the research it can be
concluded that PFSA is not making enough activities in identifying risks as use of proactive
and formal risk identification tools like survey and developing a risk register only to a small
extent. A weak risk identification capacity of PFSA that is identified in terms of use of risk
identification in only small extent greatly compromises effectiveness of the SCRM process.
External (supplier) risk pose a higher treat to the supply chain activities of PFSA while
internal risk factors, distribution risk, and end to end supply chain risk present the next level
of risks for PFSA. The treat here is double as supply risks poses a significant higher risk to
the integrity of the given company supply chain as it is a risk associated with a company's
suppliers, or supplier's suppliers being unable to deliver the materials the company needed to
effectively meet its demand forecasts.
SCRM is practised in small to moderate extent and factors like supplier geographical
distance, inadequate technology, poor communication across the supply chain, and lack of
supply chain management knowledge are identified as a potential barrier in adopting a
SCRM. Finally it can be concluded that PFSA is found to be weak in identifying risks which
is the first and crucial steps in the process of SCRM though the presence of different
operational and environmental risks that pose moderate to high level of treat to the operations
of the Agency. More over weaker use of SCRM tools, lower risk mitigation capabilities, and
a higher frequency of potential barriers all indicated from the findings indicates that the
Agency currently has a difficulties in implementing an effective SCRM process.

50
5.3 Recommendation
The study has shown weak risk identification, a higher supplier risk, a weak implementation
of SCRM, and a number of barriers in adopting SCRM. From the findings and conclusion of
the study there are a number of issues PFSA should address in order to accomplish an
efficient PSC by reducing the occurrence of disruptions, and their magnitude of consequences
by making use of an efficient SCRM.
Since risk identification is regarded as a key aspect of SCRM process PFSA should primarily
improve its risk identification potential. Once risk are identified and anticipated it makes
easier to propose methods in managing the identified risks. More over proactive identification
of risks prior to their occurrence is more economical than dealing with the risks once they
occurred (Zsidisin et al, 2004).
PFSA should also work its best in addressing supply risk as it is rated as of prime importance
by the respondents of this research. Issues under supply risk like, longer lead time, single
supplier, unavailability of items, performance of supplier, and possibility of improper
supplier selection only based on price should be addressed in detail in order to reduce
probability of disruption from failed supply. Addressing supply risk should given a
significant focus as supply risks are found to be the single most cause of SC disruption. Other
factors of risk under the category of internal and distribution risk factors should also be
addressed. Environmental disruption risks like occurrence of epidemic, manmade disaster,
and natural catastrophe are also rated as they pose treat to the PSC and preparation should be
done for minimizing their consequential damage since they could occur any time.
A number of factors are identified as a potential barrier in implementing a SCRM practise.
These factors like inadequate technology, concern about increased cost, poor communication
across supply chain should be deal with in order to tackle them. The other barrier supplier
geographical distance can be solved by establishing a better communication and visibility of
processes by making use of modern technologies as well as building the capacity of local
pharmaceutical manufacturer is also recommended since it has pure advantage in simplifying
processes, cutting lead time and costs involved.

51
5.4 Implication for further research This research assessed SCRM practice, risk factors, and barriers in implementation of SCRM
at PFSA. However other researches can be conducted with broader scope which could
involve stakeholders like suppliers, public health institution, and regulatory bodies like MOH.
Researches with a cause and effect kind of approach can also be conducted in determining
factors affecting SCRM processes at PFSA or other organizations.

52
References
Abhijeet Ghadge, Samir Dani, and Roy K. (2012). Supply Chain Risk Management:
Present and Future Scope. The International Journal of Logistics Management, Vol. 23
Iss: 3 pp.313-339.
Andreas Norrman and Ulf J. (2004). Ericsson‟s Proactive Supply Chain Risk
Management Approach After A Serious Sub-Supplier Accident. International Journal of
Physical Distribution & Logistics Management, Vol. 34 No. 5, pp. 434-456.
Autry, C.W. and Bobbitt, L.M. (2008). Supply Chain Security Orientation: Conceptual
Development and a Proposed Framework. The International Journal of Logistics
Management, Vol. 19 No.1, pp. 42-64.
Barbara S. Carasso1, Mylene Lagarde1, Addis Tesfaye and Natasha P. (2009).
Availability Of Essential Medicines In Ethiopian Efficiency-Equity Trade-Off. Tropical
Medicine and International Health, Vol. 14, No. 11 pp. 1394–1400.
Berger, P.D and Zeng, A.Z. (2006). Single Versus Multiple Sourcing In The Presence Of
Risks. Journal of the Operational Research Society, Vol. 57 No. 3, pp. 250-261.
Bishara RH. (2006). Cold Chain Management an Essential Component of The Global
Pharmaceutical Supply Chain. American Pharmaceutical Review, pp. 105–109.
Blackhurst, J.V., Scheibe, K.P. and Johnson, D.J. (2008). Supplier Risk Assessment and
Monitoring For the Automotive Industry. International Journal of Physical Distribution
and Logistics Management, Vol.38, No. 2, pp. 143-165.
Buzacott J. A. (1971). The Role of Inventory Banks in Flow-Line Production Systems.
International Journal of Production Research, Vol. 9, pp. 425-436.
Chopra, S. and Sodhi, M.S. (2004). Managing Risk to Avoid Supply-Chain Breakdown.
MIT Sloan Management Review, Vol.46 No.1, pp. 53-61.
Christopher, M. and Lee, H. (2004). Mitigating Supply Chain Risk through Improved
Confidence. International Journal of Physical Distribution and Logistics Management,
vol. 34, No. 5, pp. 388-396.

53
Cousins, P., Lamming, R.C. and Bowen, F. (2004). The Role of Risk in Environment-
Related Initiatives. International Journal of Operations and Production Management,
Vol. 24, No 6, pp. 554-565.
Dani, S. and Deep, A. (2010). Fragile Food Supply Chains Reacting to Risks.
International Journal of Logistics Research and Applications, Vol. 13 No.5, pp. 395-410.
DAS, T.K. & TENG, B. (1998). Resource and Risk Management In The Strategic
Alliance Making Process. Journal of Management, Vol. 24, No 1, pp. 21-42.
Datta, P.P., Christopher, M. and Allen, P. (2007). Agent-Based Modeling of Complex
Production/Distribution Systems to Improve Resilience. International Journal of
Logistics Research and Applications, Vol. 10 No.3, pp. 187-203.
Deus L. (2006). Technological Roles in Combating Drug Diversion and Counterfeiting.
Journal of Pharmacy Practice. pp. 146–152.
Ding, Q., Dong, L., Kouvelis, P. (2007). On The Integration of Production And Financial
Hedging Decisions In Global Markets. Operations Research Vol.55 No.3, pp. 470–489.
Douglas W. Hubbard John (2009). The Failure of Risk Management: Why It‟s Broken
and How to Fix It. Wiley & Sons, Inc, pp. 8.
Eisenhardt, K.M. (1988). Agency and Institutional-Theory Explanations: The Case of
Retail Sales Compensation, The Academy of Management Journal, Vol. 31 No.3, pp.488-
511.
Eisenhardt, K.M. (1989). Agency Theory: An Assessment and Review. The Academy of
Management Review, Vol. 14 No.1, pp.57-74.
Faisal, M.N., Banwet, D.K. and Shankar, R. (2006). Supply Chain Risk Mitigation:
Modeling the Enablers. Business Process Management Journal, Vol.12 No.4, pp. 535-
552.
Faizal. K & Dr. Palaniappan. K. (2012). Risk Assessment and Management in Supply
Chain. Global Journal of Researches in Engineering, Vol.14 Issue 2 Version 1.0
Fawcett, S.E., Wallin, C., Allred, C., Fawcett, A.M. and Magnan, G.M. (2011).
Information Technology as an Enabler Of Supply Chain Collaboration: A Dynamic
Capabilities Perspective. Journal of Supply Chain Management, Vol.47 No.1, pp. 38–56.

54
Federal Negarit Gazeta of the federal democratic republic of Ethiopia. (2007). Drug fund
and pharmaceutical supply agency proclamation, pp. 3939-3947.
Fraser, I. and Henry, W. (2012). Embedding Risk Management: Structures and
Approaches. Managerial Auditing Journal, Vol. 4, pp. 392-409.
Frosdick, S. (1997). The techniques of risk analysis are insufficient in themselves.
Disaster Prevention and Management, Vol. 6 No.3, 2007, pp. 165-177.
Gaudenzi, B. and Borghesi, A. (2006). Managing Risks in Supply Chain Using AHP
Method. The International Journal of Logistics Management, Vol. 17, No. 1, pp. 114-
136.
Goh, M., Lim, J.Y.S. and Meng, F. (2007). A Stochastic Model for Risk Management In
Global Supply Chain Networks. European Journal of Operational Research, Vol. 182
No. 1, pp. 164-173.
Goldhammer A, Lassman SM. (2006). Pharmaceutical Supply Chain Security: A View
From The Pharmaceutical Research And Manufacturers Of America. Journal of
Pharmacy Practice. pp. 239–243.
Hallikas, J., Karvina, I., Pulkkinen, U., Virolainen, V.-M. and Tuominen, M. (2004). Risk
Management Process in Supplier Networks. International Journal of Production
Economics, Vol. 90 No. 1, pp. 47-58.
Harland, C., Brenchley, R. and Walker, H. (2003). Risk in Supply Networks. Journal of
Purchasing and Supply Management, Vol. 9, pp. 51-62.
Hung, K.T. and Ryu, S. (2008). Changing risk preferences in supply chain inventory
decisions. Production Planning and Control, Vol. 19 No. 8, pp. 770-780.
Irène Kilubi, Hans–D.H. (2015). Supply Chain Risk Management Enablers-A Framework
Development through Systematic Review of the Literature from 2000 to 2015.
International Journal of Business Science and Applied Management, Vol.10, No. 1, pp.
35-54.
Iwan Vanany, Suhaiza Zailani, and Nyoman Pujawan (2009). Supply Chain Risk
Management:Literature Review And Future Research. International Journal of
Information Systems and Supply Chain Management, Vol.2 No. 1, pp. 16-33.

55
Jackson G, Patel S, Khan S. (2012). Assessing the Problem of Counterfeit Medications in
the United Kingdom. International Journal of clinical practice. pp. 241–250
Jiang, B, Belohlav, J. and Young, S. (2007). Outsourcing impact on manufacturing firms‟
value: Evidence from Japan. Journal of Operations Management, Vol. 25 No. 4, pp. 885-
900.
John Adams, Hafiz T.A Khan, Robert Reside, David W. (2007). Research Methods: For
graduate business and social science studies. New Delhi, Response Books, pp. 161-162.
Johnson, E. (2001). Learning from Toys: Lessons in Managing Supply Chain Risk From
the Toy Industry, California Management Review, Vol.43, No.3, pp. 106-124.
Juttner, U. (2005). Supply chain risk management: understanding the business
requirements from practitioners perspective. The International Journal of Logistics
Management, Vol. 16, No. 1, pp. 120-141.
Kaufmann L, Thiel C, Becker A. (2005). 16th Annual North American
Research/Teaching Symposium on Purchasing and Supply Chain Management. Otto
Beisheim Graduate School of Management; Supply chain management in the Mexican
pharmaceutical industry, pp. 327–353.
Kenneth Musungu Aluda, (2015). Supply Chain Risk Management Practices among
Telecommunications Equipment Vendors in Kenya: A Case Study Of Nokia Kenya
Ketchen, D.J., Hult, G.T.M. (2007a). Bridging Organization Theory And Supply Chain
Management: The Case Of Best Value Supply Chains. Journal of Operations
Management, Vol. 25 No.2, pp.573-580.
Khan, O., Burnes, B. and Christopher, M. (2007). Risk and supply chain management:
creating a research agenda. The International Journal of Logistics Management, 18 (2),
pp. 197-216.
Kleindorfer, P.R. and Saad, G. H.(2005), Managing Disruption Risks in Supply Chains,
Production and Operations Management, Vol. 14, No. 1, pp. 53-68.
Kothari C.R, (2004) Research Methodology, 2nd
edition, Pearson Education, New Delhi
pp. 184- 185.

56
Kut, C.S. and Zheng, X. (2003). Impact of supplier‟s lead time and forecast demand
updating on retailer‟s order quantity variability in a two-level supply chain. Int. J.
Production Economics, Vol. 86, No. 2, pp.169-179.
Lai, G., Debo, L. and Sycara, K. (2009). Sharing Inventory Risk In Supply Chain: The
Implication of Financial Constraint. Omega: The International Journal of Management
Science, Vol. 37 No. 4, pp. 811-825.
Levary, R.R. (2008). Using The Analytic Hierarchy Process To Rank Foreign Suppliers
Based On Supply Risks. Computers and Industrial Engineering, Vol. 55, No. 2, pp. 535-
542.
Lewis, M. (2003). Cause, Consequence And Control: Towards A Theoretical And
Practical Model Of Operational Risk. Journal of Operations Management, Vol. 21 No. 2,
pp. 205-224.
Liz Breen (2008). A Preliminary Examination of Risk in the Pharmaceutical Supply
Chain (PSC) in the National Health Service (NHS) (UK) J. Serv. Sci. & Management, pp.
193-199.
Mahaney, R.C., Lederer, A.L. (2003). Information Systems Project Management: An
Agency Theory Interpretation. Journal of Systems and Software, Vol. 68 No.1, pp.1-9.
Manuj, I and Mentzer, J.T. (2008).Global Supply Chain Risk Management Strategies.
International Journal of Physical Distribution and Logistics Management, Vol. 38 No.3,
pp. 192-223.
Manuj, I., Mentzer, J.T. and Bowers, M.R. (2009). Improving the Rigor Of Discrete-
Event Simulation In Logistics And Supply Chain Research, International Journal Of
Physical. Distribution and Logistics Management, Vol. 39 No. 3, pp. 172-201.
Meixell, M.J. and Gargeya, V. B. (2005). Global Supply Chain: A Literature Review And
Critique. Transportation Research, Part E, vol. 41, No. 6, pp. 531-550.
Melo MT, NickelS, Saldanhada Gama F. (2006). Dynamic Multi-Commodity Capacitated
Facility Location: A Mathematical Modeling Framework for Strategic Supply Chain
Planning. Computers and Operations Research, Vol. 33 No.1 pp 181-208.

57
Mitnick, B. (1975). The Theory of Agency: The Policing „Paradox‟ and Regulatory
Behaviour. Public Choice, Vol. 24 No.1, pp.27-42.
Modi, S., Mabert, V. (2007). Supplier Development: Improving Supplier Performance
through Knowledge Transfer. Journal of Operations Management, Vol.25 No.1, pp 42-
64.
Norrman, A. (2008). Supply Chain Risk-Sharing Contracts from A Buyers' Perspective:
Content And Experiences. International Journal of Procurement Management, Vol. 1
No.4, pp.371-393.
Norrman, A. and Lindroth, R. (2002). Supply Chain Risk Management: Purchasers‟
Versus Planners‟ Views on Sharing Capacity Investment Risks In The Telecom Industry.
Proceedings of the 11th International Annual IPSERA Conference, Twente University, pp
577-595.
Papadakis, I. (2006). Financial Performance or Supply Chains After Disruptions: An
Event Study. Supply Chain Management: An International Journal, Vol.11 No.1, pp. 25-
33.
Perry, M. (2007). Natural Disaster Management Planning: A Study of Logistics Managers
Responding to the Tsunami. International Journal of Physical Distribution and Logistics
Management, Vol. 37 No. 5, pp. 409-433.
Piyush singhal, Gopel Agarawal, and Murali L. M. (2011). Supply Chain Risk
Management: Review, Classification and Future Research Directions. International
Journal of Business Science and Applied Management, Vol. 6, Issue 3, 2011 pp. 15-42.
Policy Perspectives on Medicines - Equitable access to essential medicines: a framework
for collective action, WHO. Available at http://www.who.int/health systems, Accessed
January 14 2016.
Ritchie, B. and Brindley, C. (2007a). Supply Chain Risk Management and Performance:
A Guiding Framework For Future Development. International Journal of Operations &
Production Management, Vol. 27 No.3, pp. 303-322.

58
Ritchie, B., Brindley, C.S., Armstrong, N. (2008). Risk assessment and relationship
management: practical approach to supply chain risk management. International Journal
of Agile Systems and Management, Vol. 3 No.3, pp.228-247.
Robert S. Kaplan and Antte M. (2012). Managing Risks: A new frame work. Harvard
business review.
Rogachev AY. (2008). Enterprise risk management in a pharmaceutical company. Risk
Manage, Vol.10 No. 2 pp 76–84.
Ross, S.A. (1979), Equilibrium And Agency – Inadmissible Agents In The Public Agency
Problem, The American Economic Review, Vol. 69 No.2, pp.308-12.
S. Nurmaya Musa inköping (2012). Supply Chain Risk Management: Identification,
Evaluation and Mitigation Techniques. Linköping University Linköping Studies in
Science and Technology Dissertations, No. 145.
Sappington, D. (1991). Incentives in Principal-Agent Relationships. The Journal of
economic Perspectives, Vol. 5 No.2, pp.45-66.
Savage, C.J., Roberts, K.J., and Wang, X.Z. (2006). A Holistic Analysis Of
Pharmaceutical Manufacturing and Distribution: are Conventional Supply Chain
Techniques Appropriate? Pharmaceutical Engineering, pp. 10-18.
SCRLC (2011). Supply Chain Risk Management: A compilation of Best Practices.
Schneider JL, Wilson A, Rosenbeck JM. (2010). Pharmaceutical companies and
sustainability: an analysis of corporate reporting. Benchmarking an international journal,
Vol.17, pp. 421–434.
Shah N. (2004). Pharmaceutical Supply Chains: Key Issues And Strategies For
Optimisation. Journal of Computer and Chemical Engineering, Vol. 21, pp. 929–941.
Sislian, E. and Satir, A. (2000). Strategic Sourcing: A Framework and a Case Study, The
Journal of Supply Chain Management, Vol. 36, No. 3, pp 4-11.
Smallman, C. (1996). Risk and Organizational Behavior: A Research Model. Disaster
Prevention and Management, Vol.5 No. 2, pp. 12-26.

59
Smeltzer, L.R. and Siferd, S.P. (1998). Proactive Supply Management: The Management
of Risk. The Journal of Supply Chain Management, vol. 34, No. 1, pp. 38-45
Sodhi, M.S., (2005). Managing Demand Risk In Tactical Supply Chain Planning For A
Global Consumer Electronics Company. Production and Operations Management, Vol.
14 No.1, pp. 69–79.
Stock, J. (1997). Applying Theories from Other Disciplines To Logistics. International
Journal of Physical Distribution & Logistics Management, Vol. 27 No.9/10, pp.515-539.
Swaminathan, J. M., Smith, S.F. and Zadeh, N.M. (1998). Modeling supply chain
dynamics: A multi-agent approach. Decision Sciences, Vol. 29, No. 3, pp. 607-632.
Talluri, S., Kull, T.J., Yildiz, H. and Yoon, J. (2013). Assessing the efficiency of risk
mitigation strategies in supply chains. Journal of Business Logistics, Vol.34 No.4, pp.
253-269.
Tang, C.S. (2006a). Perspectives in supply chain risk management. International Journal
of Production Economics, Vol.103 No.2, pp. 451-488.
Tang, C.S. and Tomlin, B. (2008). The power of flexibility for mitigating supply chain
risks. International Journal of Production Economics, Vol.116 No.1, pp. 12–27.
Tummala, R., & Schoenherr, T. (2011). Assessing And Managing Risks Using The
Supply Chain Risk Management Process. Supply Chain Management: An International
Journal, Vol.16 No.6, pp.474 – 483.
USAID/ DELIVER PROJECT, (2015) Ethiopia: National Survey of the Integrated
Pharmaceutical Logistics System.
Uta Jüttner, Helen Peck, and Martin Christopher (2003). Supply Chain Risk
Management: Outlining an Agenda For Future Research. International Journal of
Logistics: Research & Applications, Vol. 6, No. 4, pp. 197-210.
Wagner, S.M. and Neshat, N. (2010). Assessing the Vulnerability of Supply Chains Using
Graph Theory. International Journal of Production Economics, Vol. 126 No. 1, pp. 121-
129.

60
Wagner, S.M., Neshat, N. (2012). A Comparison of Supply Chain Vulnerability Indices
For Different Categories of Firms. International Journal of Production Research, Vol.50
No.11, pp. 2877-2891.
Woojung Chang Alexander E. Ellinger Jennifer Blackhurst (2015). A Contextual
Approach to Supply Chain Risk Mitigation. The International Journal of Logistics
Management, Vol. 26 No. 3 pp. 642 – 656.
Zsidisin, G., Panelli, A. and Upton, R. (2000). Purchasing Organizational Involvement In
Risk Assessment, Contingency Plans And Risk Management: An Exploratory Survey.
Supply Chain Management: An International Journal, Vol. 5, No. 4, pp. 187-198.
Zsidisin, G.A., Ellram, L.M., Carter, J.R. and Cavinato, J.L. (2004). An analysis of supply
risk assessment techniques. International Journal of Physical Distribution and Logistics
Management, Vol. 34, No. 5, pp. 397- 413.
Zsidisin, G., Melnyk, S.A., Ragatz, G.L. and Burns, L.A. (2006). Preliminary Findings
from a Supply Risk Audit Instrument. Proceedings to IPSERA Conference, Paper 43.

I
Annex 1

II
Annex 2
Questionnaire
Introduction
Dear respondent Thank you for agreeing to participate in this survey and for
your valuable inputs. I am currently conducting a research with the theme
“Supply chain risk management (SCRM) the case of PFSA” For the partial
fulfilment of the requirements for Master of Arts in logistics and supply
chain management, school of commerce Addis Ababa University. The aim of
the research is to gain a general understanding of trends in SCRM at PFSA.
The research is purely for academic purpose and your identity stay
anonyms (no need for names). The survey will take around 25 minutes to
complete but allow yourself enough time so that you do not have to rush.
Please be responsible to answer honestly in order to get the most accurate
result. Thank you.
Should you have any question about the survey please feel free to contact
Name Bisrat Mengistu Mob. 0911-355-500 Email [email protected]

III
PART A Kindly respond to the question by ticking the most appropriate
response you think
1. Gender
Male Female
2. The highest academic qualification you achieved
College certificate Diploma
Bachelor degree Master’s degree
Others specify__________________________
3. For how long have you worked in PFSA
Less than a year 1-2 years
3-5 years more than 5 years
4. Please indicate your current directorate
Storage and Distribution Directorate
Forecasting and Capacity Building Directorate
Procurement Directorate
Fund Management Directorate
Human Resource and General Service Directorate
Planning, monitoring, and evaluation directorate
Branch co-ordination directorate
Medical device utilization specification preparation & evolution
directorate
Pharmaceutical supply management IT directorate
Human resource and general service directorate

IV
Part B identifying the main supply chain risk faced by PFSA
1. To what extent does PFSA use the following in identifying risks?
Not at
all [1]
Small
extent [2]
Moderate
extent [3]
Great
extent [4]
Very great
extent [5]
Risk estimation
Previous risk assessment
Developing risk register
Brainstorming session
Surveys
2. In your opinion how much threat is posed on PFSA by the below
mentioned potential risks.
External end to end supply chain risks
No treat [1]
Low treat [2]
Moderate treat [3]
High treat [4]
Highest treat [5]
Quality assurance
Regulatory approval
Currency fluctuation
Taxes, customs, and
other regulation
Theft and adulteration
External , supplier risk
No
treat [1]
Low treat
[2]
Moderate
treat [3]
High treat
[4]
Highest
treat [5]
Possibility of improper
supplier selection only
based on minimum price
Performance of supplier
Lead times
Cost escalation
Poor communication and
coordination
Unavailability of items
Single supplier

V
External , distribution risks
No
treat [1]
Low treat
[2]
Moderate
treat [3]
High treat
[4]
Highest
treat [5]
Infrastructure
unavailability
Cargo damage and theft
Warehouse inadequacies
Longer lead time
Communication barrier
with branches
Unexpected rise in
demand
External environmental disruption risk
No treat [1]
Low treat [2]
Moderate treat [3]
High treat [4]
Highest treat [5]
Political risk
Natural catastrophe
e.g. Flooding, earthquake
Manmade disaster
e.g. fire, war
Occurrence of epidemic
Internal, agency’s risk
No
treat [1]
Low treat
[2]
Moderate
treat [3]
High treat
[4]
Highest
treat [5]
Obsolete and expired
inventories
Lack of training and
knowledge
Lack of adequate number
of staff
Rapid staff turn over
Forecasting errors
Lack of funds
Strategic risk

VI
3. In your opinion how much threats is posed on PFSA by the above
mentioned potential risks collectively.
No
treat [1]
Low treat
[2]
Moderate
treat [3]
High treat
[4]
Highest
treat [5]
End to end supply chain
risk
External supplier risk
External distribution risk
Internal agency’s risks
PART C determine supply chain risk management practises employed by PFSA
1. to what extent does PFSA currently use supply chain risk management
practise
No extent (1) Small extent (2)
Moderate extent (3) Great extent (4)
Very great extent (5)
2. How often do PFSA use the following potential SCRM tools?
Never
[1]
Rarely [2] Sometimes
[3]
Very often
[4]
Always [5]
Sourcing tool
Inventory optimization
tool
Sales tool
Operation planning tool
Master data
management tool
Spend management
analysis tool
Others specify__________________________

VII
3. How often do PFSA use the following as a practise to manage supply
chain risks?
Never
[1]
Rarely [2] Sometimes
[3]
Very often
[4]
Always [5]
Improve demand
forecasting
Stream line processes
Creation of supply chain
risk register
Increase inventory level
Decentralize distribution
4. How often do PFSA use the following supplier strategies to mange
suppliers’ related risk?
Never
[1]
Rarely [2] Sometimes
[3]
Very often
[4]
Always [5]
Improve collaboration
with supplier
Shift from single to
multiple supplier base
Conduct risk audits of
key suppliers
Supplier development
5. How often do PFSA use the following strategic sourcing or advanced
procurement practises?
Never [1]
Rarely [2] Sometimes [3]
Very often [4]
Always [5]
Regular screening and
monitoring of current
suppliers
Require critical suppliers
to produce a detailed
plan of disruption
awareness

VIII
Include expected costs of
disruption in the total
cost of equation
Require supplier to
provide timely
information and visibility
of material flow
6. How often do the following Real-Time supply chain management practises are
used in PFSA?
Never
[1]
Rarely [2] Sometimes
[3]
Very often
[4]
Always [5]
Conducting frequent
meetings/teleconferences
with critical supplier
Implement technologies
to track containers in
distribution channel
Conduct a detailed
disruption incident
report and analysis
following a major
disruption event
Create an exception
event detection and early
warning system

IX
7. How often do these real time base operation management practises are
employed in PFSA?
Never
[1]
Rarely [2] Sometimes
[3]
Very often
[4]
Always [5]
Improve visibility of
inventory buffer in
domestic distribution
channel
Classify buffered
materials for different
levels of criticality
Training key employees
Developing real time
supply chain
configuration decision
report
PART D determine the barriers to adopting supply chain risk management
practises
1. In your opinion to what extent is PFSA capable to mitigate key supply
chain risks it faces right now?
No extent (1) small extent (2)
Moderate extent (3) great extent (4)
Very great extent (5)

X
2. How often do the following potential barriers affect implementation of
strategic sourcing or advanced procurement practise as a SCRM
practice in PFSA?
Never
[1]
Rarely [2] Sometimes
[3]
Very often
[4]
Always [5]
Concern about increased
costs
Poor communication
across supply chain
Inadequate technology
Lack of management
support
Supplier geographical
distance
Lack of supply chain
management knowledge
3. How often do the following potential barriers affect implementation of Real-
Time supply chain risk management practise as SCRM practise in PFSA?
Never
[1]
Rarely [2] Sometimes
[3]
Very often
[4]
Always [5]
Concern about increased
costs
Poor communication
across supply chain
Inadequate technology
Lack of management
support
Supplier geographical
distance
Lack of supply chain
management knowledge

XI
4. How often do the following potential barriers affect implementation of Real-
Time supply chain base operations management practise as SCRM practice
in PFSA?
Never
[1]
Rarely [2] Sometimes
[3]
Very often
[4]
Always [5]
Concern about increased
costs
Poor communication
across supply chain
Lack of management
support
Lack of supply chain
management knowledge
5. How often do the following potential barriers affect implementation of
supplier strategies as SCRM practise at PFSA in management of supplier
related risk?
Never [1]
Rarely [2] Sometimes [3]
Very often [4]
Always [5]
Concern about increased
costs
Poor communication
across supply chain
Lack of management
support
Supplier geographical
distance
Lack of supply chain
management knowledge
Thank you!!!