pharmacokinetics and pharmacodynamics of oxycodone and ...169935/fulltext01.pdf(pk) and...
TRANSCRIPT
ACTAUNIVERSITATISUPSALIENSISUPPSALA2007
Digital Comprehensive Summaries of Uppsala Dissertationsfrom the Faculty of Pharmacy 50
Pharmacokinetics andPharmacodynamics of Oxycodoneand Morphine with Emphasison Blood-Brain Barrier Transport
EMMA BOSTRÖM
ISSN 1651-6192ISBN 978-91-554-6840-8urn:nbn:se:uu:diva-7772

To my family

Papers discussed
Th is thesis is based on the following papers, which will be referred to by their Roman numerals in the text.
I Boström E, Jansson B, Hammarlund-Udenaes M and Simonsson USH.Th e use of liquid chromatography/mass spectrometry for quantitative analysis of oxycodone, oxymorphone and noroxycodone in Ringer solution, rat plasma and rat brain tissue.Rapid Commun Mass Spectrom. 18:2565-76 (2004).
Copyright John Wiley & Sons Limited. Reproduced with permission.
II Boström E, Simonsson USH and Hammarlund-Udenaes M.Oxycodone pharmacokinetics and pharmacodynamics in the rat in the presence of the P-glycoprotein inhibitor PSC833.J Pharm Sci. 94:1060-6 (2005).
Copyright John Wiley & Sons Incorporated. Reproduced with permission.
III Boström E, Simonsson USH and Hammarlund-Udenaes M.In vivo blood-brain barrier transport of oxycodone in the rat: indications for active infl ux and implications for pharmacokinetics/pharmacodynamics.Drug Metab Dispos. 34:1624-31 (2006).
Reprinted with permission of the American Society for Pharmacology and Experimental Th erapeutics. All rights reserved.
IV Boström E, Hammarlund-Udenaes M and Simonsson USH.Blood-brain barrier transport help explain discrepancies in in vivo potency between oxycodone and morphineIn manuscript

Contents
INTRODUCTION .............................................................................11Opioids ........................................................................................................... 11
Opioid pharmacology ................................................................................... 13Th e central nervous system .............................................................................13Th e blood-brain barrier .................................................................................. 14BBB transport processes ................................................................................. 15
Passive diff usion .............................................................................................15Carrier mediated transport .............................................................................15
Facilitated diff usion .....................................................................................15Active transport across the BBB .....................................................................15
PK considerations of BBB transport ...............................................................16Rate of transport ............................................................................................16Extent of transport .........................................................................................16Binding within the brain ................................................................................17
Methods to study BBB transport .................................................................... 17Microdialysis ..................................................................................................18
Modelling .......................................................................................................20
AIMS OF THE THESIS ......................................................................21
MATERIALS AND METHODS............................................................22Animals ..........................................................................................................22
Animal surgery .............................................................................................. 22Experimental procedures ................................................................................23
Study designs ................................................................................................ 23Sample treatment .........................................................................................25Antinociceptive measurements .......................................................................25
Microdialysis probe recovery ......................................................................... 25Blood to plasma partitioning ......................................................................... 25
Chemical assay ...............................................................................................26Oxycodone and metabolites .......................................................................... 26
Standard and quality control sample preparations ..........................................27Sample preparation ......................................................................................27Validation ................................................................................................... 28
Morphine ...................................................................................................... 28Data analysis ..................................................................................................29
Non compartmental analysis ......................................................................... 29Statistics ...................................................................................................... 30
Modelling ..................................................................................................... 30
RESULTS AND DISCUSSION ..............................................................32Chemical assay of oxycodone and metabolites (Paper I) .................................32Infl uence of PSC833 on the PK and PD of oxycodone (Paper II) ...................32Oxycodone and morphine PK (Paper III and IV) ..........................................35
BBB transport of oxycodone and morphine .................................................. 37Rate of BBB transport ...................................................................................39Extent of BBB transport ................................................................................39Binding within the brain ............................................................................. 40
PKPD of oxycodone and morphine (Paper IV) ..............................................40
CONCLUSIONS ...............................................................................44
ACKNOWLEDGEMENTS ...................................................................45
REFERENCES .................................................................................47
Abbreviations
ABC ATP-binding cassetteAbrain Amount of drug in brain tissue at steady-stateATP Adenosine triphosphateAUC0-∞ Area under the concentration-time curve from time 0 until
infi nityAUCu,brain Area under the unbound ISF concentration-time curve AUCu,blood Area under the unbound blood concentration-time curve AUEC Area under the eff ect-time curveAUMC0-∞ Area under the fi rst moment-time curve from time 0 until infi nityBBB Blood-brain barrierBCSFB Blood-cerebrospinal fl uid barrierBCRP Breast cancer resistance proteincAMP Cyclic adenosine monophosphateCblood Concentration in bloodCcalc Calculated concentration at the last time pointCin Concentration of the microdialysis perfusateCL ClearanceCLin Infl ux clearance from blood to brainCLout Effl ux clearance from brain to bloodCNS Central nervous systemCout Concentration of the microdialysis dialysateCplasma Concentration in plasmaCRBC Concentration in red blood cellsCSF Cerebrospinal fl uidCtot,brain Concentration in total brain tissueCu Unbound concentration in bloodCu,brain,ss Unbound concentration in brain ISF at steady-stateCu,blood,ss Unbound concentration in blood at steady-stateCV Coeffi cient of variationDoseiv Intravenous doseECF Extracellular fl uidFOCE INTER First order conditional estimation with interaction method fu Fraction unbound in plasmaGTP Guanosine triphosphateGTPγS Guanosine-5 -O-(γ-thio)-triphosphateH HematocritIS Internal standardISF Interstitial fl uidIv Intravenous

GLUT Glucose transporterk0 Rate of the infusionKp Equilibrium distribution ratio of drug between tissue and plasma
based on total concentrations in tissue and plasmaKp,u Equilibrium distribution ratio of drug between tissue and
blood based on total concentrations in tissue and unbound concentrations in blood
Kp,uu Equilibrium distribution ratio of drug between tissue and blood based on unbound concentrations in tissue and blood
LC/MS/MS Liquid chromatography tandem mass spectrometryLLOQ Lower limit of quantifi cationM3G Morphine-3-glucorunideM6G Morphine-6-glucorunideMRP Multidrug resistant proteinOFV Objective function valuePD PharmacodynamicP-gp P-glycoproteinPK PharmacokineticPKPD Pharmacokinetic / pharmacodynamicPSA Permeability surface area productQ Inter-compartmental clearanceQC Quality controlRBC Red blood cellsRSE Relative standard errorSD Standard deviationSPE Solid phase extractionT Time of the infusiont½ Half-lifetlast Last time pointTFA Trifl uoroacetic acidVblood Volume of blood in brainVc Central volume of distributionVss Volume of distribution at steady-stateVu,brain Unbound volume of distribution in brainγ Shape factor of the concentration-eff ect relationshipε Diff erence between observed and predicted observationsη Diff erence between population and individual parameter estimateθ Typical value of a parameterλz Slope of the terminal phase of the concentration-time profi leσ2 Variance of the εsω2 Variance of the ηs
11
PK, PD and BBB Transport of Oxycodone and Morphine
Introduction
Th e central nervous system (CNS) is the target of drug therapy for many therapeutic areas. Th e entry of a drug molecule from the blood to the brain is restricted by endothelial cells connected by tight junctions, the blood-brain barrier (BBB). In the case of a centrally acting drug, the passage across the BBB is essential for the pharmacological activity. However, for a peripherally acting drug, the entry across the BBB may cause CNS side eff ects and needs to be minimized. Th e function of the BBB is still not fully understood, and new insights into this area may give rise to new opportunities for drug development and delivery of centrally acting drugs to its site of action.
A variety of transport proteins are incorporated in the BBB. Th ese include both effl ux transporters, limiting the entry of molecules into the brain, and infl ux transporters that enhance the entry of molecules into the brain. Knowledge of the BBB transport properties is of importance when investigating the pharmacokinetics (PK) and pharmacodynamics (PD) of centrally acting drugs such as opioids.
Opioids are used to treat moderate to severe pain, which requires that a part of the systemically given dose must cross the BBB to reach the active sites within the CNS. Oxycodone and morphine are opioids that act at the µ-opioid receptors, and were used as the model substances in this thesis.
OpioidsReference to opium was fi rst made in the third century B.C., when Arabian traders introduced opium to the Orient, where it was used as an anti-diarrhoeal agent (Goodman and Gilman, 2001). Opium contains more than 20 alkaloids, including morphine and thebaine, the precursor of oxycodone. Today, the use of opioids is an essential part in the pharmacotherapy of moderate to severe pain (MacPherson, 2002).
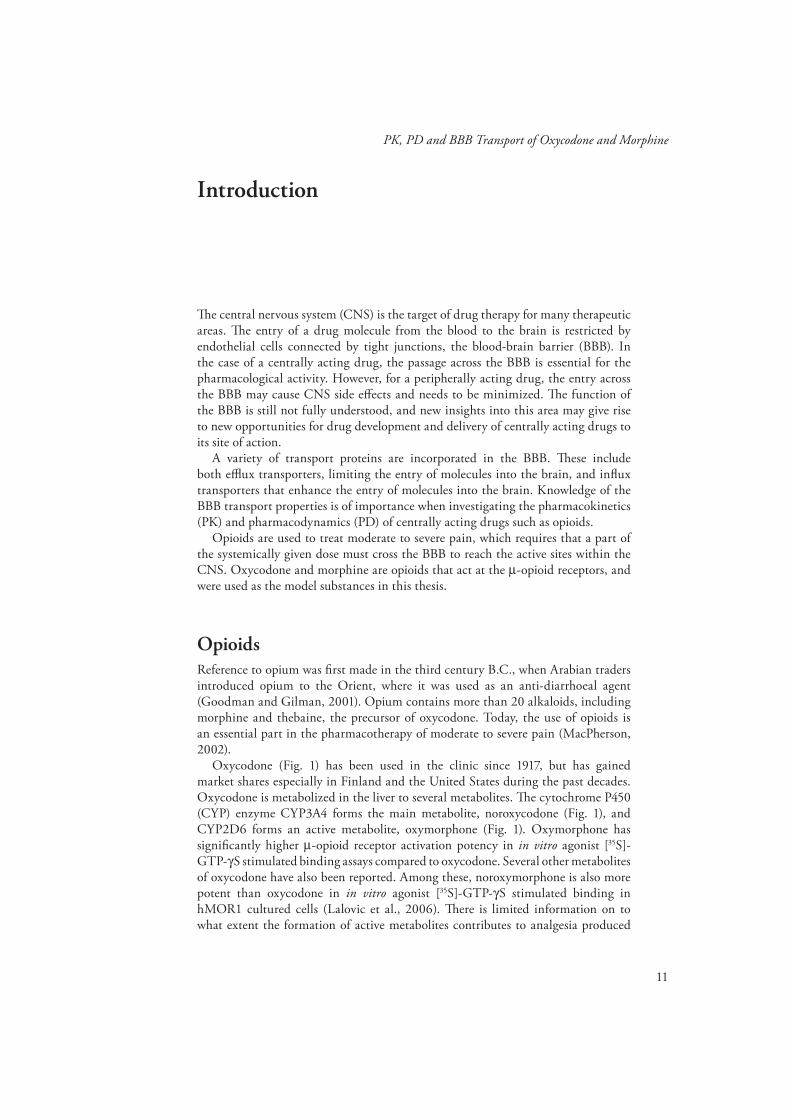
Oxycodone (Fig. 1) has been used in the clinic since 1917, but has gained market shares especially in Finland and the United States during the past decades. Oxycodone is metabolized in the liver to several metabolites. Th e cytochrome P450 (CYP) enzyme CYP3A4 forms the main metabolite, noroxycodone (Fig. 1), and CYP2D6 forms an active metabolite, oxymorphone (Fig. 1). Oxymorphone has signifi cantly higher µ-opioid receptor activation potency in in vitro agonist [35S]-GTP-γS stimulated binding assays compared to oxycodone. Several other metabolites of oxycodone have also been reported. Among these, noroxymorphone is also more potent than oxycodone in in vitro agonist [35S]-GTP-γS stimulated binding in hMOR1 cultured cells (Lalovic et al., 2006). Th ere is limited information on to what extent the formation of active metabolites contributes to analgesia produced
12
Emma Boström
by a dose of oxycodone. However, a recent investigation have shown that the contribution of oxymorphone and noroxymorphone antinociception to oxycodone analgesia is negligible (Lalovic et al., 2006).
Figure 1. Th e molecular structures of oxycodone (a) and its metabolites oxymorphone (b) and noroxycodone (c).
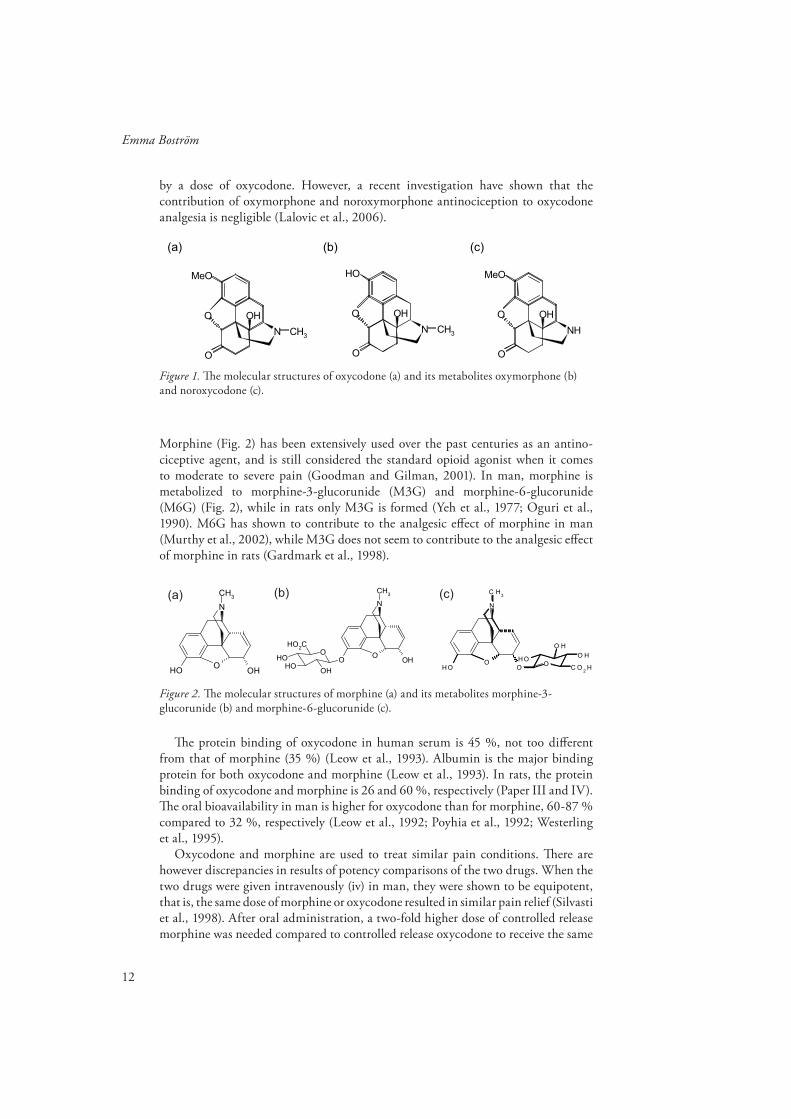
Morphine (Fig. 2) has been extensively used over the past centuries as an antino-ciceptive agent, and is still considered the standard opioid agonist when it comes to moderate to severe pain (Goodman and Gilman, 2001). In man, morphine is metabolized to morphine-3-glucorunide (M3G) and morphine-6-glucorunide (M6G) (Fig. 2), while in rats only M3G is formed (Yeh et al., 1977; Oguri et al., 1990). M6G has shown to contribute to the analgesic eff ect of morphine in man (Murthy et al., 2002), while M3G does not seem to contribute to the analgesic eff ect of morphine in rats (Gardmark et al., 1998).
N
OHO
OH
CH3
N
OHO
O
CH3
OOH
OHOH
HO2C
N
OO
OH
C H3
O
O H
O HOH
C O2
H
(a) (b) (c)
Figure 2. Th e molecular structures of morphine (a) and its metabolites morphine-3-glucorunide (b) and morphine-6-glucorunide (c).
Th e protein binding of oxycodone in human serum is 45 %, not too diff erent from that of morphine (35 %) (Leow et al., 1993). Albumin is the major binding protein for both oxycodone and morphine (Leow et al., 1993). In rats, the protein binding of oxycodone and morphine is 26 and 60 %, respectively (Paper III and IV). Th e oral bioavailability in man is higher for oxycodone than for morphine, 60-87 % compared to 32 %, respectively (Leow et al., 1992; Poyhia et al., 1992; Westerling et al., 1995).
Oxycodone and morphine are used to treat similar pain conditions. Th ere are however discrepancies in results of potency comparisons of the two drugs. When the two drugs were given intravenously (iv) in man, they were shown to be equipotent, that is, the same dose of morphine or oxycodone resulted in similar pain relief (Silvasti et al., 1998). After oral administration, a two-fold higher dose of controlled release morphine was needed compared to controlled release oxycodone to receive the same
O
MeO
N
OH
CH3
O
O
OH
N
OH
CH3
O
O
MeO
NH
OHO
(a) (b) (c)
13
PK, PD and BBB Transport of Oxycodone and Morphine
eff ect (Curtis et al., 1999). In contrast, morphine was 10 times more potent than oxycodone when given epidurally after abdominal surgery (Backlund et al., 1997). In rats, after subcutaneous and intraperitoneal administration, oxycodone was two and four times more potent than morphine, respectively (Poyhia and Kalso, 1992). Th e opposite was observed when the drugs were administered intrathecally, with morphine being 14 times more potent than oxycodone (Poyhia and Kalso, 1992).
Opioid pharmacologyTh e opioids are ligands for the opioid receptors. Th e opioid receptors belong to the guanosine triphosphate (GTP) binding regulatory proteins, known as G-proteins (Goodman and Gilman, 2001). Th e opioid receptors are usually divided into three major subgroups, the µ, κ and δ – subtype, and are located at both central sites as the brain and spinal cord, as well as in the periphery (Goodman and Gilman, 2001; DeHaven-Hudkins and Dolle, 2004). Th e analgesic eff ects of opioids arise from their ability to inhibit the ascending transmission of nociceptive information from the dorsal horn of the spinal cord and to activate pain control circuits that descend from the midbrain to the spinal cord (Goodman and Gilman, 2001). Binding of the ligand inhibits adenylate cyclase and thereby reduce the intracellular cAMP content. Opioids also promotes opening of K+ channels and suppresses opening of Ca2+ channels. Th ese changes both inhibit the neuronal excitability and transmitter release, and thus the opioids are inhibitory at the cellular level.
Both oxycodone and morphine are selective for the µ-opioid receptor subtype (Lalovic et al., 2006; Peckham and Traynor, 2006). At the receptor level, morphine is more potent than oxycodone in in vitro [35S]-GTP-γS binding assays, meaning that for a certain degree of receptor activation, a lower concentration of morphine compared to oxycodone would be needed (Th ompson et al., 2004; Lalovic et al., 2006; Peckham and Traynor, 2006). In addition, morphine is slightly more effi cacious than oxycodone in vitro, meaning that morphine can activate the receptor to a greater extent compared to oxycodone (Th ompson et al., 2004; Lalovic et al., 2006; Peckham and Traynor, 2006).
Th e central nervous systemTh e central nervous system (CNS) consists of the brain and the spinal cord. Th e brain is responsible for processing most sensory information and coordinating body function. Th e spinal cord is the connection central for signals between the brain and the rest of the body.
Th e brain and spinal cord are cushioned in cerebrospinal fl uid (CSF) that protects the CNS from outer damage. Th e CSF is secreted by choroid plexuses in the lateral, third and fourth ventricles (Davson and Segal, 1996). Th e neurons are surrounded by the interstitial fl uid (ISF), also known as the extracellular fl uid (ECF). Th e origin of the ISF is somewhat unclear, but it has recently been stated that the most likely source of mammalian brain ISF is from a combination of new fi ltration/secretion across the BBB together with some recycled CSF (Abbott, 2004). To maintain brain homeostasis and to regulate and limit the exchange of molecules between the blood

14
Emma Boström
and the neuronal tissue or its fl uid spaces, there are barriers present in the CNS. Th ey include the BBB, formed by the endothelial cells of the capillary wall between the blood and the ISF, and the blood-CSF barrier (BCSFB) consisting of the choroid plexus epithelium localized between the blood and the ventricular CSF and the arachnoid epithelium between the blood and the subarachnoid CSF (Abbott, 2004). Th e surface area of the BBB is larger than that of the BCSFB, making BBB likely to be most important for drug delivery to the brain after systemic drug administration.
Th e blood-brain barrierTh e function of the BBB is to maintain the microenvironment of the brain and to protect it from toxic molecules. On its passage from the blood to the brain, a drug molecule has to pass two membranes of the endothelial cell; the luminal membrane facing the blood and the abluminal membrane facing the brain (Fig. 3). Th e BBB is characterized by the tight junctions between the endothelial cells, making paracellular (between cells) passage of drugs very restricted. Lack of fenestrations and few pinocytotic vesicles further limit the transport across the BBB (Tamai and Tsuji, 2000). Th is means that only very small hydrophilic molecules can pass via the paracellular pathway (van Bree et al., 1988). All other molecules must pass the endothelial cell by the transcellular (across the cell) path, in order to reach the brain and exert their pharmacological eff ects. A summary of diff erent ways to cross the BBB is presented in Fig. 3, and is described in more detail below.
Figure 3. Mechanisms of blood-brain barrier transport include passive diff usion and carrier mediated transport. Passive diff usion occurs when the molecules are passing across the cell membrane without interaction with a transporter. Passive diff usion is a random movement of molecules with a net direction towards a lower concentration. In carrier mediated transport, a transporter is involved in the passage across the membrane. Th e carrier mediated transport can be divided into energy-independent facilitated diff usion and energy-dependent active transport. Carrier mediated transport can have the direction from blood to brain (infl ux transport) or from brain to blood (effl ux transport).
BRAIN
BLOOD
BRAIN
Tight junction
Endothelial
cells
PASSIVE
DIFFUSION
Transport protein
INFLUX
EFFLUX
EFFLUX
EFFLUX
Endothelial
cells
LUMINAL
MEMBRANE
ABLUMINAL
MEMBRANE
PARACELLULAR
TRANSPORT
15
PK, PD and BBB Transport of Oxycodone and Morphine
BBB transport processes
Passive diff usionTh e transport of a molecule across a cell membrane by passive diff usion is energy independent and can not be saturated. Th ere are three major determinants that infl uence the passive diff usion of a molecule, namely size, charge and lipophilicity. A large, hydrophilic and charged molecule will diff use at a lower rate than a small, hydrophobic and uncharged compound. Diff usion is a random movement of molecules, but has a net direction of movement towards lower concentrations, in order to reach equilibrium.
Carrier mediated transportCarrier mediated transport can be saturated and is substrate specifi c, which discriminates it from passive diff usion. When a substrate bind to a carrier, the resulting substrate/carrier complex undergoes a conformational change. Th is allows the substrate to traverse the membrane and to be released on the opposite side of the membrane. Depending on the direction of transport across the BBB, the transporters are either called infl ux or effl ux transporters. Infl ux transporters enhance the transport of drugs from blood into the brain, while effl ux transporters enhance the transport of drug from brain to blood or hinders drug to enter the brain tissue. Th e transport of a molecule across a membrane by carrier mediated transport can be independent of energy (facilitated diff usion) or energy dependent (active transport).
Facilitated diff usionAn example of facilitated diff usion is the uptake of glucose by the GLUT-1 transporter in blood-tissue barriers including BBB (Pessin and Bell, 1992). By facilitated diff usion, a molecule is exchanged from high concentration in the blood to low concentration in the tissue, which resembles passive diff usion. GLUT-1 have been proposed to be involved in the BBB transport of M6G (Bourasset et al., 2003).
Active transport across the BBBEnergy is needed to move a molecule across a membrane from low concentration to high concentration. For example, the intracellular composition of solutes diff ers from their concentration in the ISF. To maintain this “unequilibrium”, the presence of active transporters is necessary.
Active transport can be carried out by the use of adenosine triphosphate (ATP). Among others, these transporters include the Na/K-ATPase that maintain and generate the steady-state gradients of Na+ and K+ in the cells, and transporters belonging to the ATP-binding cassette family, the ABC transporters. Th e most well known ABC transporter is the effl ux transporter P-glycoprotein (P-gp) that is located in the luminal membrane of the BBB and limits the entry of many drugs into the brain. Several opioids have been reported to be substrates of P-gp, including morphine, methadone and loperamide (Letrent et al., 1998; Skarke et al., 2003;
16
Emma Boström
Wang et al., 2004).Th e presence of transporters in the BBB has implications for the PK and PD of
a drug (Hammarlund-Udenaes et al., 1997). For example, if a drug that is a P-gp substrate is co-administered with P-gp inhibitor, the brain concentrations of the drug will increase. If the drug has a target CNS eff ect, a higher eff ect than what could be anticipated without the P-gp inhibitor is achieved. However, blocking of P-gp may lead to unwanted central side-eff ects for drugs such as the second generation antihistamines (Polli et al., 2003).
PK considerations of BBB transportCollection of plasma samples is the most common and practical way to measure drug concentrations in the body. However, when investigating the BBB transport of drugs, information on unbound drug concentrations from both sides of the BBB is favorable, which the regular plasma samples do not provide. It is therefore of interest to measure the unbound drug concentrations in blood as well as in the brain ISF.
Studying the PK aspects of BBB transport, three aspects should be considered; rate of transport, extent of transport and binding of drug within the brain.
Rate of transportTh e rate of transport across the BBB is a measure of the permeability clearance across the BBB (µL/min·g brain). Th e parameters used to describe the rate of transport include the permeability surface area product (PSA) and the infl ux clearance (CLin or Kin). Th e infl ux clearance describes the net capacity of the BBB to transport a molecule into the brain, i.e. the combined impact of passive diff usion and possible infl ux and effl ux transport mechanisms. Th e rate of transport across the BBB from brain to blood can be described by the effl ux clearance CLout, which describes the combined impact of passive diff usion and possible effl ux and infl ux transport systems.
Extent of transportTh e extent of BBB transport can be described with the relationship of unbound drug concentrations in brain to that in blood, Kp,uu, which can be calculated according to the following equations:
(1)
(2)
ssbloodu
ssbrainuuup C
CK
,,
,,,
bloodu
brainuuup AUC
AUCK
,
,,

17
PK, PD and BBB Transport of Oxycodone and Morphine
(3)
Cu,brain,ss and Cu,blood,ss are the unbound steady-state concentrations of drug in brain and blood, respectively. AUCu,brain and AUCu,blood are the areas under the unbound concentration vs. time curves for brain and blood, respectively, while CLin and CLout are the unbound infl ux and effl ux clearances across the BBB, respectively.
Kp,uu can also be thought of as the net fl ux. Th e net fl ux is the sum of all transport processes at the BBB, including passive diff usion as well as carrier mediated transport by effl ux and infl ux transporters. If the unbound concentration in the brain at steady-state is below that of the blood, Kp,uu will be below one. Th is means that the net fl ux across the BBB is dominated by active effl ux transport or substantial infl uence of bulk fl ow or brain metabolism, clearing the substance from the brain tissue. A Kp,uu above one means that the net fl ux is dominated by active infl ux transport across the BBB, while a Kp,uu of unity means that the BBB transport takes place by passive diff usion, or that the infl ux and effl ux mechanisms have the same impact on the BBB transport.
Binding within the brainTh e binding within the brain can be described by the unbound volume of distribution in the brain, denoted Vu,brain, and is calculated as follows:
(4)
where Abrain is the total amount of drug per gram of brain at steady-state. Vblood is the volume of blood per gram of brain. Cu,brain,ss is the unbound brain ISF concentra-tion at steady-state. Cblood is the total concentration in blood which can be derived by multiplying the plasma concentration with the partitioning between blood and plasma (Cblood/Cplasma).
Methods to study BBB transportA range of in vitro and in vivo methods can be used to study the transport of drugs across the BBB including infl uence of transporters.
Cultured brain endothelial cell lines can be used to identify the specifi c transporters that act on a drug. However, many drugs are transported by more than one transporter which makes it diffi cult to draw conclusions on the contribution of each transporter in vivo. Also, an in vitro setting can never totally resemble the in vivo situation with all endogenous substances present, making in vivo experiments necessary at least for confi rmation of in vitro results.
In situ methods used to assess the rate of BBB transport include the brain uptake index method (Oldendorf, 1970), the brain effl ux index method (Kakee et al., 1996),
out
inuup CL
CLK ,
ssbrainu
bloodbloodbrainbrainu C
CVAV
,,,
18
Emma Boström
the in situ brain perfusion technique (Takasato Y. Rapoprt), and the in vivo methods iv injection technique (Ohno et al., 1979) and microdialysis (Ungerstedt, 1991; Elmquist and Sawchuk, 1997). To assess the extent of BBB transport, microdialysis could be used.
Animal models can be used to study the in vivo situation of BBB transport. Knock-out animals that lack the gene that codes for a certain transporter can be used. For example, the impact of P-gp on BBB transport of various drugs have been studied using the multi drug resistance knockout mice (Th ompson et al., 2000; Dagenais et al., 2001). Th is provides information on the specifi c transporter that is involved in the transport of a drug in vivo. However, there are still uncertainties whether the knock-out animals are exactly like the wild-type, except for the lack of transporter. It has been reported that the mRNA expression of the gene coding for breast cancer resistance protein (BCRP) is increased in mice lacking P-gp (Cisternino et al., 2004).
Another possibility to study the BBB transport properties of a drug is to co-administer a transporter inhibitor together with the drug. Th e main disadvantage with the use of an inhibitor is a possible lack of specifi city for the transporter studied. For example, the cyclosporine analogue PSC833 (Valspodar) was for a long time considered to be an inhibitor of P-gp only. However, also BCRP and multidrug resistant protein 2 (MRP2) are inhibited by PSC833 (Chen et al., 1999; Eisenblätter et al., 2003).
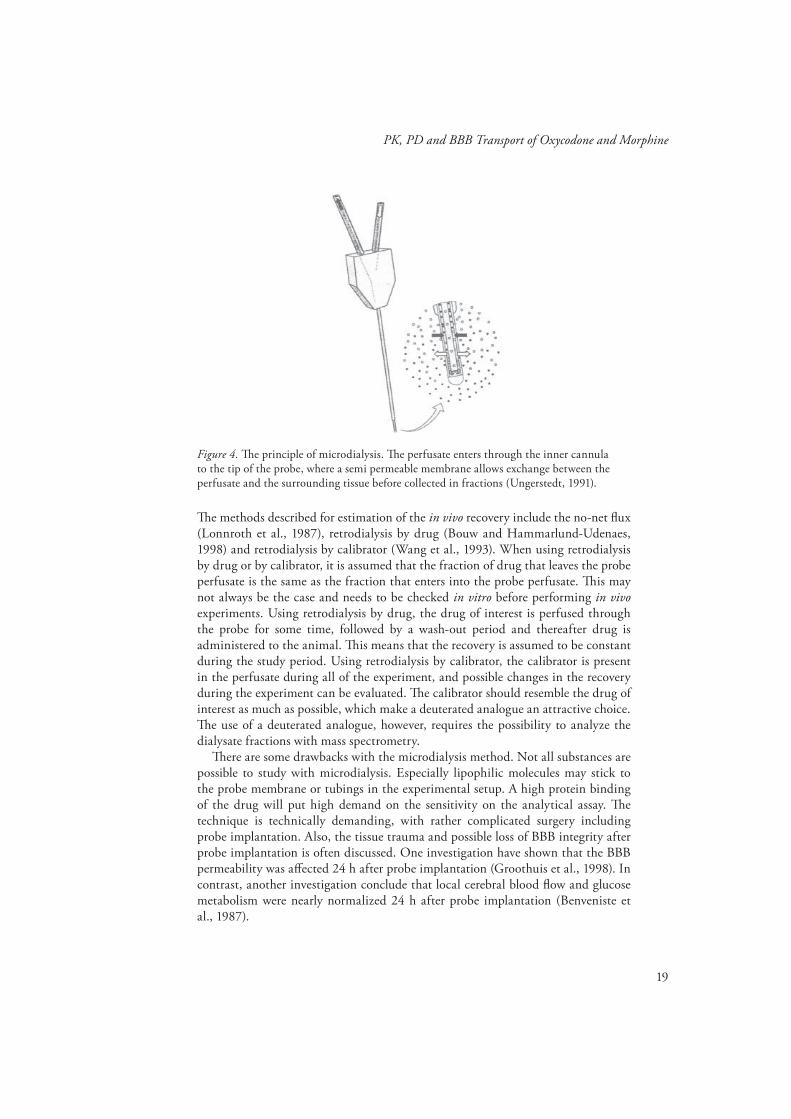
MicrodialysisOver the past couple of decades, microdialysis has been developed and recognized as a valuable tool in investigations of drug distribution to the CNS (de Lange et al., 1995; Hammarlund-Udenaes, 2000; Sawchuk and Elmquist, 2000; Deguchi, 2002). Th e main advantage of microdialysis is that it provides a possibility for obtaining unbound drug concentrations in several tissues or fl uids in one individual over time. Th us, when investigating the time course of BBB transport and PKPD of drugs that act at receptors facing brain ISF, microdialysis is a valuable tool.
Th e microdialysis probe is composed of a semi-permeable membrane that allows passage of solutes and molecules that are smaller than the cut-off value of the membrane. After implantation into the tissue or fl uid of interest, the probe is perfused by a solution that closely resembles the ISF, the perfusate. Th e fl uid leaving the probe, the dialysate, is collected in fractions. Due to the continuous fl ow of the perfusate, a concentration gradient along the microdialysis probe is created. Depending on the direction of the concentration gradient, molecules will either be delivered to, or recovered from, the ISF surrounding the probe. Th e fraction of the concentration that is recovered from the tissue is referred to as the relative recovery. Preferably, the recovery of each individual probe should be estimated in vivo. By using the in vivo recovery, a quantitative measure of the true unbound concentration in a tissue can be obtained.
19
PK, PD and BBB Transport of Oxycodone and Morphine
Figure 4. Th e principle of microdialysis. Th e perfusate enters through the inner cannula to the tip of the probe, where a semi permeable membrane allows exchange between the perfusate and the surrounding tissue before collected in fractions (Ungerstedt, 1991).
Th e methods described for estimation of the in vivo recovery include the no-net fl ux (Lonnroth et al., 1987), retrodialysis by drug (Bouw and Hammarlund-Udenaes, 1998) and retrodialysis by calibrator (Wang et al., 1993). When using retrodialysis by drug or by calibrator, it is assumed that the fraction of drug that leaves the probe perfusate is the same as the fraction that enters into the probe perfusate. Th is may not always be the case and needs to be checked in vitro before performing in vivo experiments. Using retrodialysis by drug, the drug of interest is perfused through the probe for some time, followed by a wash-out period and thereafter drug is administered to the animal. Th is means that the recovery is assumed to be constant during the study period. Using retrodialysis by calibrator, the calibrator is present in the perfusate during all of the experiment, and possible changes in the recovery during the experiment can be evaluated. Th e calibrator should resemble the drug of interest as much as possible, which make a deuterated analogue an attractive choice. Th e use of a deuterated analogue, however, requires the possibility to analyze the dialysate fractions with mass spectrometry.
Th ere are some drawbacks with the microdialysis method. Not all substances are possible to study with microdialysis. Especially lipophilic molecules may stick to the probe membrane or tubings in the experimental setup. A high protein binding of the drug will put high demand on the sensitivity on the analytical assay. Th e technique is technically demanding, with rather complicated surgery including probe implantation. Also, the tissue trauma and possible loss of BBB integrity after probe implantation is often discussed. One investigation have shown that the BBB permeability was aff ected 24 h after probe implantation (Groothuis et al., 1998). In contrast, another investigation conclude that local cerebral blood fl ow and glucose metabolism were nearly normalized 24 h after probe implantation (Benveniste et al., 1987).
20
Emma Boström
ModellingMathematical models can be used to describe how drug concentrations changes over time, or how drug response relates to drug concentrations or exposure. In the population modelling approach, all data is analysed simultaneously and therefore information from all individuals is shared.
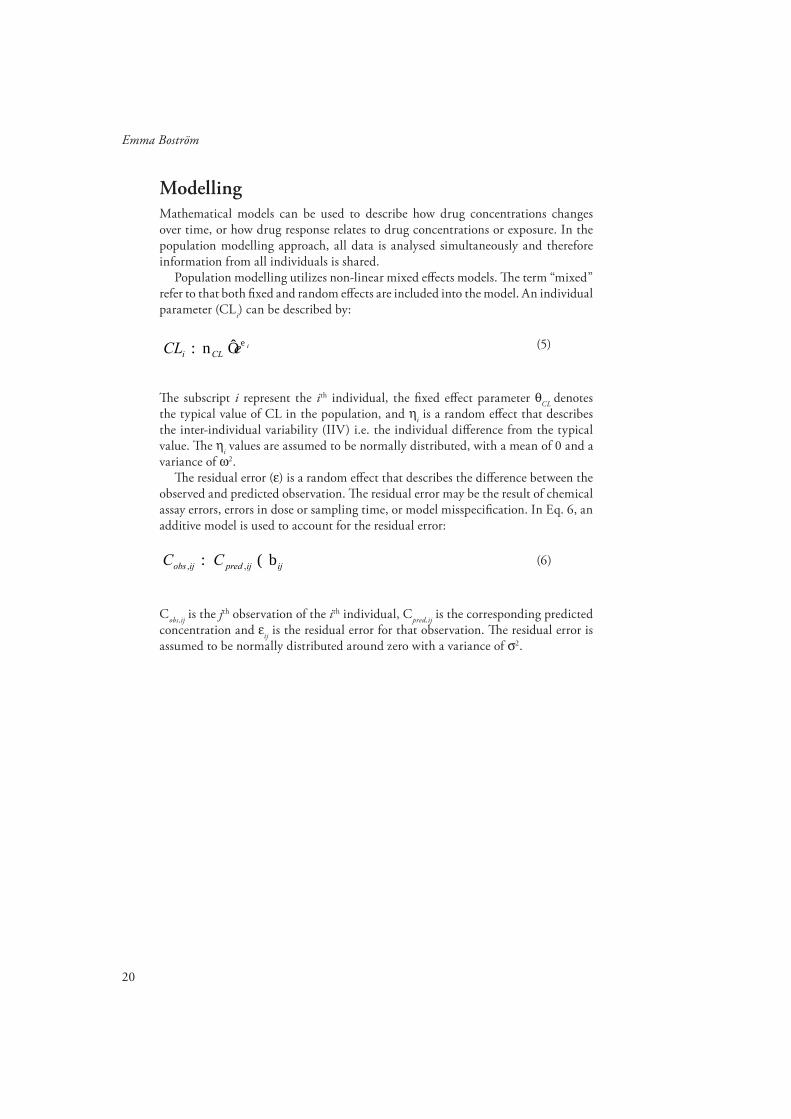
Population modelling utilizes non-linear mixed eff ects models. Th e term “mixed” refer to that both fi xed and random eff ects are included into the model. An individual parameter (CLi) can be described by:
(5)
Th e subscript i represent the ith individual, the fi xed eff ect parameter θCL denotes the typical value of CL in the population, and ηi is a random eff ect that describes the inter-individual variability (IIV) i.e. the individual diff erence from the typical value. Th e ηi values are assumed to be normally distributed, with a mean of 0 and a variance of ω2.
Th e residual error (ε) is a random eff ect that describes the diff erence between the observed and predicted observation. Th e residual error may be the result of chemical assay errors, errors in dose or sampling time, or model misspecifi cation. In Eq. 6, an additive model is used to account for the residual error:
(6)
Cobs,ij is the jth observation of the ith individual, Cpred,ij is the corresponding predicted concentration and εij is the residual error for that observation. Th e residual error is assumed to be normally distributed around zero with a variance of σ2.
ieCL CLi
ijijpredijobs CC ,,
21
PK, PD and BBB Transport of Oxycodone and Morphine
Aims of the thesis
Th e general aim of this thesis was to investigate the role of the BBB transport in the PK and PD of oxycodone in rats.
Th e specifi c aims were:
• to develop and validate a sensitive and specifi c analytical method for the quan-tifi cation of oxycodone and its metabolites oxymorphone and noroxycodone in microdialysates from brain and blood, rat plasma and rat brain tissue using LC/MS/MS
• to investigate whether oxycodone is a P-gp substrate or not by studying the impact of a P-gp inhibitor (PSC833) on the plasma PK of oxycodone, total brain tissue oxycodone concentrations and antinociception measured by the tail-fl ick method in the rat
• to investigate the BBB transport and unbound PK of oxycodone using microdi-alysis, including quantifi cation of the rate and extent of BBB transport
• to investigate the importance of BBB transport for the PKPD relationships of oxycodone and morphine by the use of nonlinear eff ects modelling

22
Emma Boström
Materials and Methods
AnimalsMale Sprague-Dawley rats (B&K, Sollentuna, Sweden) were used in the animal experiments. Th e animals were group housed at 22º C with a 12 hour light / dark cycle for at least fi ve days prior to surgery. Standard diet and water were available ad libitum. At the day of surgery, the animals were weighing 250-320 g. Th e studies were approved by the Animal Ethics Committee of Tierp District Court, Tierp, Sweden (C 246/1, C 247/1, C 176/4 and C 177/4).
Animal surgeryTh e rats in Paper II, III and IV were anaesthetized by inhalation of enfl uran (Efrane, Abbott Scandinavia AB, Kista, Sweden) or isofl uran (Isofl uran Baxter, Baxter Medical AB, Kista, Sweden). During the surgical procedure, the rat body temperature was maintained at 38°C by using a CMA/150 temperature controller (CMA, Stockholm, Sweden). A PE-50 cannula fused with silastic tubing was inserted into the left femoral vein for drug administration. A PE-50 cannula fused with PE-10 tubing was inserted into the femoral artery for blood sampling. In order to avoid clotting the catheters were fi lled with a heparinised saline solution (Heparin Leo, 100 IE/mL, Leo Pharma AB, Malmö, Sweden).
In addition, for the microdialysis animals in Paper III and IV, a CMA/20 blood probe (10 mm, CMA, Stockholm, Sweden) was inserted into the right jugular vein through a guide cannula and fi xed to the pectoralis muscle with two sutures. Th e anaesthetized rat was placed into a stereotaxic instrument (David Kopf Instruments, Tujunga, USA) for the implantation of the brain probe. A midsaggital incision was made to expose the skull, and the CMA/12 guide cannula was implanted into the striatum with the coordinates 2.7 mm lateral and 0.8 mm anterior to the bregma and 3.8 mm ventral to the surface of the brain. After insertion the guide cannula was anchored to the scull with a screw and dental cement (Dentalon Plus, Heraeus, Hanau, Germany). A CMA/12 probe (3 mm, CMA, Stockholm, Sweden) was inserted into the striatal guide. A piece of PE-50 tubing was looped subcutaneously on the back of the rat to the surface of the neck in order to let the perfusion solution adjust to body temperature before entering the brain probe.
For all animals, the ends of the cannulae and catheters were passed subcutaneously to a plastic cup placed on the posterior surface of the neck out of reach from the rat. Th e rats were placed in a CMA/120 system for freely moving animals (CMA, Stockholm, Sweden) with free access to water and food, and were allowed to recover

23
PK, PD and BBB Transport of Oxycodone and Morphine
for approximately 24 hours before the experiment. All experiments were performed at the same time of the day.
Experimental procedures
Study designsA summary of the drugs and doses studied are presented in Table 1. In Paper II, half of the animals (n = 8) were given the P-gp inhibitor PSC833 dissolved in triethylene glycol and ethanol, 40:10 (v/v). PSC833 was administered as a bolus dose, immediately followed by a constant rate infusion for the entire experiment. Th e other half of the animals (n = 8) received the vehicle without PSC833 in the same manner. One hour after the start of PSC833 or vehicle administration, a 60 min constant rate iv infusion of oxycodone was started. Eight blood samples were withdrawn pre-dose, during the infusion and up to 180 minutes after the start of the infusion from each animal. Tail-fl ick latency was recorded and at the end of the experiment, the animals were decapitated. Methadone has been shown to be a P-gp substrate and was used as a positive control in Paper II (Wang et al., 2004). Methadone was administered to two animals, one receiving PSC833 and the other the vehicle in the same manner as the animals receiving oxycodone.
Table 1. Summary of the drugs and doses investigated.
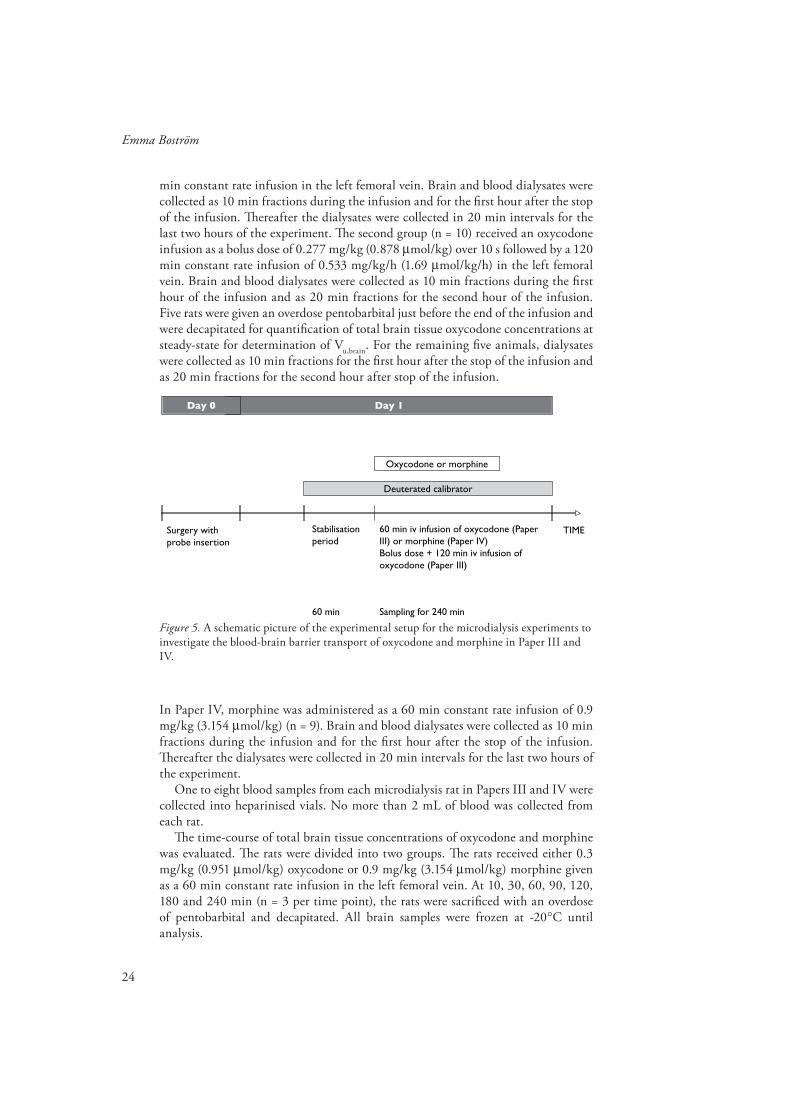
Th e experimental setup for the microdialysis experiments in Papers III and IV is presented in Fig. 5. Both microdialysis probes (blood and brain) were perfused with Ringer solution (147 mM NaCl, 2.7 mM KCl, 1.2 mM CaCl2 and 0.85 mM MgCl2). In Paper III, D3-oxycodone (45 ng/mL) was used as a calibrator and were dissolved in the Ringer solution and perfused through the probes for recovery esti-mation. In Paper IV, D3-morphine (105 ng/mL) was used as a calibrator, and in the control group, blank Ringer solution without calibrator was used to perfuse the microdialysis probes. Th e probes were perfused at a fl ow rate of 1 µl/min. Samples were collected in 15 min intervals during a 60 min stabilization period.
In Paper III, two infusion regimens of oxycodone were applied. Th e fi rst group of animals (n = 10) received 0.3 mg/kg (0.951 µmol/kg) oxycodone given as a 60
Paper Drug Dose Time of infusion
II oxycodone 0.3 mg/kg/h 60 min
oxycodone + PSC833 0.3 mg/kg/h + 2.3 mg/kg bolus and 1.06 mg/kg/h 60 min + 240 min
III oxycodonea 0.227 mg/kg bolus + 0.533mg/kg/h 120 min
oxycodonea 0.3 mg/kg/h 60 min
IV morphinea 0.9 mg/kg/h 60 min
oxycodoneb 0.3 mg/kg/h 60 minmorphineb 0.9 mg/kg/h 60 min
a Microdialysis experiment, b Total brain tissue experiment
24
Emma Boström
min constant rate infusion in the left femoral vein. Brain and blood dialysates were collected as 10 min fractions during the infusion and for the fi rst hour after the stop of the infusion. Th ereafter the dialysates were collected in 20 min intervals for the last two hours of the experiment. Th e second group (n = 10) received an oxycodone infusion as a bolus dose of 0.277 mg/kg (0.878 µmol/kg) over 10 s followed by a 120 min constant rate infusion of 0.533 mg/kg/h (1.69 µmol/kg/h) in the left femoral vein. Brain and blood dialysates were collected as 10 min fractions during the fi rst hour of the infusion and as 20 min fractions for the second hour of the infusion. Five rats were given an overdose pentobarbital just before the end of the infusion and were decapitated for quantifi cation of total brain tissue oxycodone concentrations at steady-state for determination of Vu,brain. For the remaining fi ve animals, dialysates were collected as 10 min fractions for the fi rst hour after the stop of the infusion and as 20 min fractions for the second hour after stop of the infusion.
Figure 5. A schematic picture of the experimental setup for the microdialysis experiments to investigate the blood-brain barrier transport of oxycodone and morphine in Paper III and IV.
In Paper IV, morphine was administered as a 60 min constant rate infusion of 0.9 mg/kg (3.154 µmol/kg) (n = 9). Brain and blood dialysates were collected as 10 min fractions during the infusion and for the fi rst hour after the stop of the infusion. Th ereafter the dialysates were collected in 20 min intervals for the last two hours of the experiment.
One to eight blood samples from each microdialysis rat in Papers III and IV were collected into heparinised vials. No more than 2 mL of blood was collected from each rat.
Th e time-course of total brain tissue concentrations of oxycodone and morphine was evaluated. Th e rats were divided into two groups. Th e rats received either 0.3 mg/kg (0.951 µmol/kg) oxycodone or 0.9 mg/kg (3.154 µmol/kg) morphine given as a 60 min constant rate infusion in the left femoral vein. At 10, 30, 60, 90, 120, 180 and 240 min (n = 3 per time point), the rats were sacrifi ced with an overdose of pentobarbital and decapitated. All brain samples were frozen at -20°C until analysis.
TIMESurgery withprobe insertion
Stabilisationperiod
Day 1Day 0
Deuterated calibrator
Oxycodone or morphine
60 min
60 min iv infusion of oxycodone (PaperIII) or morphine (Paper IV)Bolus dose + 120 min iv infusion ofoxycodone (Paper III)
Sampling for 240 min

25
PK, PD and BBB Transport of Oxycodone and Morphine
Sample treatmentAfter the end of each collection interval, microdialysate vials were capped and stored at -20°C. Th e blood samples were collected into heparinised vials and centrifuged at 10 000 rpm for 7 minutes. Th e plasma was transferred to clean vials and kept at -20°C until analysis. Th e brain tissues of the microdialysis animals in Paper III and IV were examined for any extensive bleeding. All brain tissues from Papers II-IV were frozen at -20°C until chemical assay.
Antinociceptive measurementsIn Paper II and IV, the antinociceptive eff ect of oxycodone and morphine was evaluated using the hot water tail-fl ick method. A mark was made 6 cm from the distal tip of each rat’s tail to ensure comparable exposure to heat. Th e tail was put into a water bath maintained at 50°C. Th e time from placing the tail into the water, until it was voluntarily moved was recorded as the tail-fl ick latency. A cut-off time of 15 s was applied to avoid tissue damage.
Microdialysis probe recoveryBlood and brain microdialysis probes were calibrated using a deuterated analogue of oxycodone (Paper III) and morphine (Paper IV). Th e calibrators were present in the perfusion fl uid during all of the experiment, making possible variations in the recovery during the experiment detectable. Th e recoveries of the drugs were calculated according to Eq. 7.
(7)
Cin is the concentration of the calibrator in the perfusate entering the probe, and Cout,i is the concentration of the calibrator in the ith dialysate fraction exiting the probe. Th e average recovery for each probe was estimated based on the recovery in each dialysate fraction.
Blood to plasma partitioningTh e partitioning between blood and plasma for oxycodone in rats was investigated in vitro. Fresh blood from rats was collected in heparinised vials and spiked with two concentrations of oxycodone (50 ng/mL and 500 ng/mL). Th e experiments were performed in duplicate. Th e vials were placed in a water bath maintained at 37°C and were gently tilted. Samples were taken from the vials between 0 and 60 min, followed by immediate centrifugation. After centrifugation the plasma layer was separated from the red blood cell (RBC) layer and both layers was immediately frozen at -20°C until analysis.
x
C
CC
ery
x
i in
ioutin
in vivo1
,
covRe

26
Emma Boström
Chemical assay
Oxycodone and metabolitesIn Paper I, selective and sensitive liquid chromatographic methods using tandem mass spectrometry detection (LC/MS/MS) were developed. Th e methods were able to quantify oxycodone, D3-oxycodone, noroxycodone and oxymorphone in Ringer (Method I), rat plasma (Methods II and III) and rat brain tissue (Method IV), respectively. Th e methods were used to analyze samples containing oxycodone and D3-oxycodone (Papers II-IV).
Th e LC/MS/MS system consisted of an LC-10AD pump (Shimadzu, Kyoto, Japan) and a Triathlon 900 auto sampler (Spark Holland, Th e Netherlands) equipped with a 100 µL loop and a Zorbax SB-CN column (4.6 x 150 mm, Agilent Technologies, Wilmington, DE, USA). Th e column was maintained at 50°C and a constant fl ow rate of 1.0 ml/min was employed. Th e fl ow was splitted allowing 0.2 ml/min to enter the MS (Quattro Ultima, Micromass Manchester, United Kingdom). Th e mobile phase consisted of 45% acetonitrile in 5 mM ammonium acetate. Th e MS was used in the positive electrospray mode. Th e transition modes for the drugs are summarized in Table 2. MS control and spectral processing were carried out using MassLynx software, version 4.0 (Micromass, Manchester, United Kingdom). Th e MS settings that gave the best resolution and highest sensitivity were selected and are presented in Table 3.
Table 2. Th e transition modes of the analytes in Paper I.
Table 3. Th e mass spectrometer settings that were used in the analytical method presented in Paper I.
Substance Transition mode Internal Standard
oxycodone m/z 316.1 m/z 297.9 D6-oxycodone
D3-oxycodone m/z 319.1 m/z 301 D6-oxycodone
oxymorphone m/z 302.2 m/z 284 D3-oxymorphone
noroxycodone m/z 302.2 m/z 284 D3-noroxycodone
D6-oxycodone m/z 322.15 m/z 304
D3-oxymorphone m/z 305.2 m/z 287
D3-noroxycodone m/z 305.2 m/z 287
Parameters
Desolvation temperature (°C) 400
Source temperature (°C) 120
Cone gas flow (L/h) 200
Desolvation gas flow (L/h) 800
Collision gas pressure (Torr)
Capillary voltage (kV) 1.2
Cone voltage (V) 30
3·10-3

27
PK, PD and BBB Transport of Oxycodone and Morphine
Standard and quality control sample preparationsIn Method I, oxycodone, D3-oxycodone, noroxycodone and oxymorphone were dissolved in blank Ringer solution and a standard curve in the range of 0.5-150 ng/mL for all compounds was prepared. Quality control (QC) samples of 1.88, 62.8 and 125.5 ng/mL were prepared.
For Methods II and III, blank rat plasma was spiked with oxycodone, noroxycodone and oxymorphone. Th e standard curve was prepared in the range of 0.5-250 ng/mL, and the concentrations of the QC samples were 1.45, 48.5 and 194 ng/mL.
For Method IV, the blank brain tissue sample was prepared by homogenization of drug-free brain tissue with a 5-fold volume (w/v) of 0.1 M perchloric acid. After centrifugation, the supernatant was used for further extraction. Th e calibration standards were prepared by spiking of oxycodone, noroxycodone and oxymorphone to drug-free brain tissues. Th e tissues were homogenized with a 5-fold volume of 0.1 M perchloric acid (w/v) subtracted by the volume of the added analytes. After centrifugation, the supernatant was used for further extraction. Th e standard curve range in the rat brain tissue was from 4-1000 ng/g brain for noroxycodone and oxymorphone and from 20-1000 ng/g brain for oxycodone. QCs were prepared at 25, 125 and 750 ng/g brain.
Standard and QC samples were stored at -20ºC until analysis. Working solutions of the internal standards (ISs) (D6-oxycodone, D3-noroxycodone and D3-oxymorphone) were prepared in water for Methods I, III and IV, and in acetonitrile for Method II.
Sample preparationIn Method I, Ringer samples were analyzed for oxycodone, D3-oxycodone, noroxycodone and oxymorphone. Th e samples were diluted with an equal volume of water spiked with the ISs at concentrations of 40 ng/mL, vortexed for 5 s where after 16 µl was injected onto the column.
In Method II, rat plasma samples were analyzed for oxycodone and oxymorphone. Fifty µl of plasma was precipitated with 100 µl acetonitrile spiked with the ISs at a concentration of 30 ng/mL and vortexed for 5 s. After centrifugation at 10 000 rpm for 5 min, 30 µl of the supernatant was injected onto the column.
In Method III, rat plasma samples were analyzed for oxycodone, noroxycodone and oxymorphone. One hundred µl rat plasma were purifi ed using a slightly modifi ed previously reported solid phase extraction (SPE) method (Joel et al., 1988). After evaporation of the eluate, the residue was dissolved in the mobile phase and 30 µl were injected onto the LC/MS/MS system.
In Method IV, the brain tissues were homogenized with a 5-fold volume of 0.1 M perchloric acid. After centrifugation, 100 µl of the supernatant was purifi ed using the same SPE method as in Method III.
In Paper III, the red blood cells (RBCs) were prepared according to a previously described method (Dumez et al., 2005). Th e RBCs were diluted with four times its volume with distilled water. After 5 min, the solution was vortexed and thereafter centrifuged at 10 000 g to precipitate the cell debris. Four hundred µl of the solution was conducted to the same SPE procedure as for the brain homogenate in Method IV.
28
Emma Boström
ValidationFor each method in Paper I, the accuracy and intra-day precision was determined in one validation run. Th is run included a standard curve, QC samples (n=6) from each concentration and six replicates of the lower limit of quantifi cation (LLOQ) samples. Th e inter-day precision was determined by analyzing six QC samples of each concentration interspersed with unknown study samples at three separate occasions. Th e precision was determined by calculation the standard deviation as a percentage of the average (coeffi cient of variation, CV). Th e accuracy was determined as the percentage of the added concentration. Th e LLOQ was determined as the lowest concentration that could be analysed with a CV<20 % and an accuracy of 80-120 %.
MorphineIn Paper IV, the samples containing morphine and D3-morphine were analyzed according to a previously described method, with some modifi cations (Bengtsson et al., 2005). D3-morphine was used as the microdialysis calibrator in the microdialysis experiments or as the IS in the analysis of the plasma and brain tissue samples. Th e LC/MS/MS system consisted of two LC-10AD pumps (Shimadzu, Kyoto, Japan) and a Triathlon 900 auto sampler (Spark Holland, Th e Netherlands) equipped with a 100 µL loop. A HyPurity C18 guard column, 10 x 3 mm, 3 µm particle size (Th ermo Hypersil-Keystone, PA, USA) was used for purifi cation. In the plasma and brain tissue methods, an in-line fi lter, A-431, 0.5 µm (Upchurch Scientifi c, WA, USA), was placed before the guard column. A ZIC HILIC column, 50 x 4.6 mm, 5 µm particle size (SeQuant AB, Umeå, Sweden) was utilized for the analytical separation. Both pumps were set to a fl ow of 0.5 mL/min. One pump was used for purifi cation with 0.02 % trifl uoroacetic acid (TFA) and the other was used for analytical separation with 70 % ACN in 5 mM ammonium acetate. Th e transition modes were m/z 286 152 for morphine and m/z 289 152 for D3-morphine. MS control and spectral processing were carried out using MassLynx software, version 4.0 (Micromass, Manchester, United Kingdom).
No sample pretreatment was needed for the microdialysis samples, and a volume of 5 µL was directly injected onto the column-switching system. Fifty µL of plasma was precipitated with 100 µL acetonitrile containing IS (D3-morphine, 25 ng/mL), vortexed and centrifuged. Th ereafter 50 µL of the supernatant was evaporated under a stream of nitrogen at 45°C, and the residue was dissolved in 200 µL 0.02 % TFA by vortex mixing and ultra-sonication. Th e injection volume was 10 µL. Th e brain tissue samples were homogenized centrifuged and subject to SPE in the same manner as the oxycodone brain tissue samples. Th e residue was dissolved in 200 µL of the mobile phase and 10 µL was injected onto the column.

29
PK, PD and BBB Transport of Oxycodone and Morphine
Data analysis
Non compartmental analysisIn Paper II, the individual clearance (CL) and volume of distribution at steady state (Vss) were calculated according to Eq. 8 and 9, respectively.
(8)
(9)
AUC0-∞ is the area under the plasma concentration versus time curve from time zero until infi nity which is the sum of the area under the concentration versus time curve until the last observation (AUC0-t) and the residual area (AUCt-∞) Th e residual area was determined as the calculated concentration at the last time point (Ccalc) divided by the terminal rate constant (λ z). Ccalc and λ z were both obtained by log-linear regression of the three last points of the concentration versus time curve. AUMC0-∞ is the area under the fi rst moment versus time curve from time zero until infi n-ity, which is the sum of AUMC0-t and the residual area AUMCt-∞ . AUMCt-∞ was expressed as Ccalc·tlast/λz+Ccalc/λ z
2, where tlast is the time point of the last observation. k0 is the rate of the infusion and T is the duration of the infusion. In Papers II and IV, the terminal half-life (t½) was derived from ln2/ λz.
In Paper III, assessment of the partitioning between plasma and blood (Cblood/Cplasma) was calculated according to Eq. 10 (Tozer, 1981):
(10)
where Cblood, Cplasma and CRBC are the oxycodone concentration in blood, plasma and red blood cells, respectively. H is the hematocrit, estimated to 42% in the rat (Leon-ard and Ruben, 1986).
In Paper III, comparisons on the infl ux clearance across the BBB based on unbound concentrations to the cerebral blood fl ow were made and the blood clearance across the BBB (CLin,blood) was calculated using Eq. 11.
(11)
0AUC
DoseCL iv
0
02
0
00
2
)(
AUC
TkT
AUC
AUMCTkVss
plasma
RBC
plasma
blood
C
CHH
C
C1
plasma
blood
uinbloodin
C
C
fCLCL ,
CLin and fu are the fi nal parameter estimates of the PK model in Paper III, and Cblood/Cplasma is calculated from Eq. 10.
Th e partitioning of drug between brain and blood at steady-state was calculated as
30
Emma Boström
(12)
(13)
(14)
where Kp is the partition coeffi cient between total brain concentrations (Ctot,brain) and total plasma concentrations (Cplasma). Kp,u is the partition coeffi cient between total brain concentrations (Ctot,brain) and unbound blood concentrations (Cu) and Kp,uu is the partition coeffi cient between unbound drug in interstitial fl uid (ISF) and unbound drug in blood.
In Paper II, the total antinociceptive response of oxycodone was expressed as the area under the tail-fl ick latency versus time curve (AUEC).
StatisticsIn Paper II, the PK parameters are presented as geometric means with confi dence intervals (CIs). Plasma concentrations versus time curves are presented as geometric means and standard deviations (SDs). Th e CIs and SDs were derived from log-transformed data. Th e PK parameters of the study groups were compared using Wilcoxon’s rank sum test (S-plus 6.1 for Windows, Insightful Corp., Seattle, WA) based on non-transformed data.
In Paper II; total brain tissue concentrations and ratios of total brain tissue/plasma concentrations are presented as means and SDs. Th e groups were compared using an unpaired two-sided t-test (S-plus 6.1 for Windows, Insightful Corp., Seattle, WA). In Paper III, Kp, Kp,u and Kp,uu are presented as mean with SDs.
Th e tail-fl ick latencies are presented as means and SDs (Paper II and IV). In Paper II, the tail-fl ick latencies of the two study groups were compared using a two-sided, unpaired t-test (S-plus 6.1 for Windows, Insightful Corp., Seattle, WA). In Paper IV, the baseline latencies before and during the stabilization period were compared with a t-test (Microsoft Offi ce Excel 2003, Microsoft Corp.) with pair-wise comparisons to exclude any infl uence of the calibrators on the tail-fl ick latency.
In all statistical evaluations of the non-compartmental analysis, a p-value of less than 5 % was needed for statistical signifi cance.
ModellingTh e PK of oxycodone (Paper III) and morphine (Paper IV) and the PKPD of both drugs (Paper IV) were analyzed by nonlinear mixed eff ects modelling in NONMEM, version VIβ (GloboMax LLC, Hanover; MD, USA). Using this approach, the fi xed eff ects that characterize the typical animal, and the random eff ects that characterize the inter-animal variability and residual variability could be estimated simultaneously. Th e fi rst-order conditional estimation method with interaction
plasma
braintotp C
CK ,
u
braintotup C
CK ,
,
u
brainISFuuup C
CK ,
,

31
PK, PD and BBB Transport of Oxycodone and Morphine
(FOCE INTER) was used throughout the modelling procedure. To distinguish between two nested models a drop in the OFV of 6.63 was required. Th is value (χ2 distributed) corresponds approximately to p < 0.01 for one parameter diff erence. Th e need for inter-animal variability was investigated in all model parameters.
An exponential variance model was used to describe the inter-animal variability according to:
(15)
where Pi and Ppop are the parameter in the ith animal and the typical animal, respec-tively. ηi is the inter-animal variability, assumed to be normally distributed around zero and with a variance ω2 to distinguish the ith animal’s parameter from the popu-lation mean. Additive, proportional and slope-intercept error models were consid-ered for the residual variability.
Th e PK models of oxycodone (Paper III) and morphine (Paper IV) were based on the integrated blood-brain PK model for morphine with some modifi cations (Tunblad et al., 2004). For each drug, the blood probe recovery and blood dialysate data were combined and a sub-model was developed. Th ereafter the total plasma concentration data was included and after that also the brain probe recovery data and the brain dialysate concentrations. One- and multi compartmental PK models were considered for both systemic and brain PK. Models allowing for a distribution delay between the arterial and venous parts of the central compartment were considered.
Th e BBB transport was parameterized in terms of CLin and Kp,uu. For morphine, the earlier reported value of Vu,brain of 1.7 ml/g brain was employed (Tunblad et al., 2003). For oxycodone, Vu,brain was calculated from the animals decapitated at steady-state in the bolus + constant rate regimen (n = 5) in Paper III according to Eq. 5 and 10. Th e volume of blood in the rat brain was fi xed to 14 µL/g brain (Bickel et al., 1996). Th e values of Vu,brain for oxycodone and morphine were fi xed in each PK model.
In Paper IV, the tail-fl ick latency was correlated to the unbound brain concentrations. Initially, separate PKPD models of oxycodone and morphine were developed and thereafter a joint PKPD model of both drugs was employed. By this manner, the model could be used as a statistical tool to evaluate if there were any diff erences in the PD parameters between the drugs. Direct eff ect, indirect eff ect and link models were evaluated. Linear, power and Emax models were considered to describe the data, and a power model according to Eq. 16 best described the data for both drugs.
(16)
Eff ect is the tail-fl ick latency in seconds, Baseline is the tail-fl ick latency in the absence of drug and Slope is the slope of the concentration-eff ect relationship. C is the unbound concentration in brain of the drug and γ is a shape factor for the con-centration-eff ect relationship.
iePP popi
CSlopeBaselineEffect

32
Emma Boström
Results and discussion
Chemical assay of oxycodone and metabolites (Paper I)Th e analytical methods for analysis of oxycodone, oxymorphone and noroxycodone in Ringer, rat plasma and rat brain tissue were sensitive and reproducible. Th e linear dynamic range for Method I (Ringer) was 0.5-150 ng/mL, for Methods II and III (rat plasma) 0.5-250 ng/mL and for Method IV (rat brain tissue) 4-1000 ng/g brain tissue. Typical chromatograms are presented in Fig. 6.
Th e LLOQ of oxycodone, noroxycodone and oxymorphone in the described Methods I - III was 0.5 ng/mL. For all compounds and matrices, the CV and accuracy for this concentration was below 12 % and ±10 %, respectively. Th e LLOQ for Method IV was 20 ng/g tissue for oxycodone with a CV of 4 % and an accuracy of less than ±1 %. Th e LLOQ for noroxycodone and oxymorphone was 4 ng/g brain tissue, with a CV of less than 6 % and an accuracy of ±3 %.
For all analytes, concentrations and matrices described, the intra-day precision and accuracy were <11.3 % and <±14.9 %, respectively and the inter-day precision was <14.9 % and inter-day accuracy was <±6.5 %.
Infl uence of PSC833 on the PK and PD of oxycodone (Paper II)
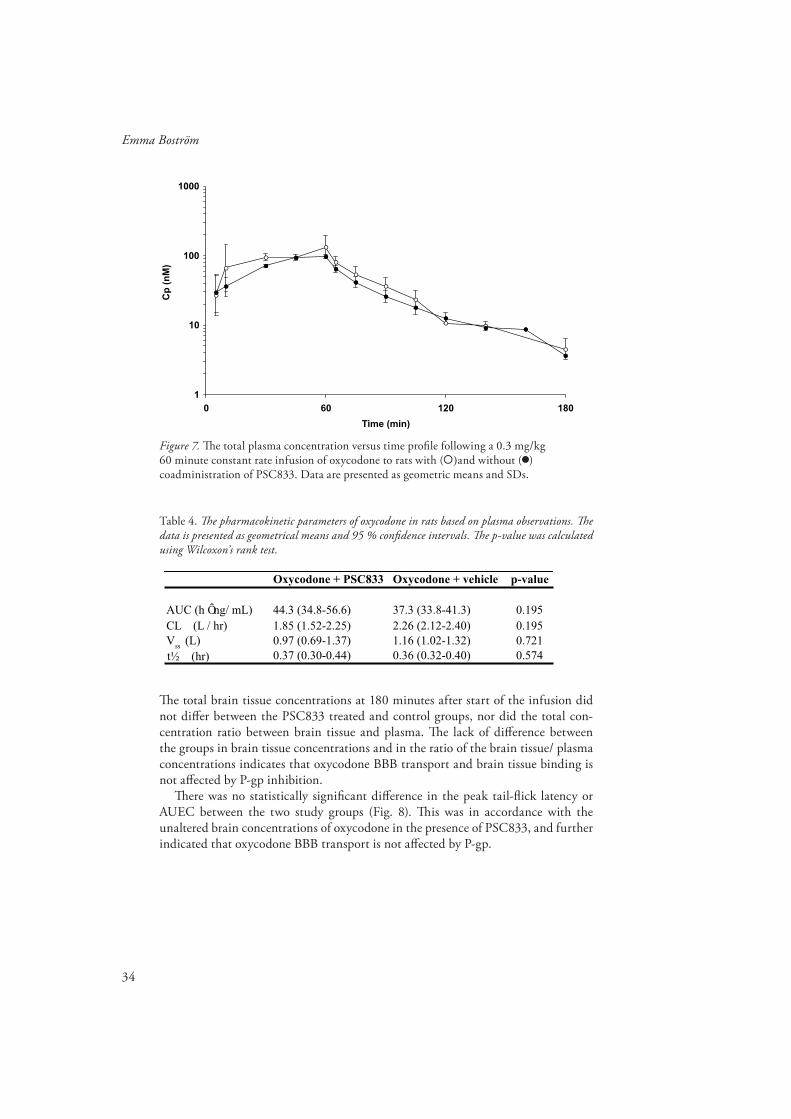
Th e plasma PK and PD measured as tail-fl ick latency after oxycodone administra-tion in the presence or absence of the P-gp inhibitor PSC833 was analyzed with a non-compartmental approach. Th e plasma concentration-time profi les of the two groups are shown in Fig. 7. Th ere were no statistically signifi cant diff erences between the two groups in AUC0-∞ , CL, Vss or t½ (Table 4), showing that oxycodone systemic pharmacokinetics is unaff ected by P-gp inhibition.

33
PK, PD and BBB Transport of Oxycodone and Morphine
Figure 6. Typical chromatograms of (a) Ringer spiked with 20 ng/mL oxycodone (3), noroxycodone (5), oxymorphone (7), D3-oxycodone (2) and the internal standards D6-oxycodone (1), D3-noroxycodone(4) and D3-oxymorphone (6), (b) rat plasma using Method III spiked with 100 ng/mL oxycodone (2), noroxycodone (4), oxymorphone (6) and the internal standards D6-oxycodone (1), D3-noroxycodone (3) and D3-oxymorphone(5), (c) rat brain tissue spiked with 100 ng/g brain tissue of oxycodone (2), noroxycodone (4), oxymorphone (6) and the internal standards D6-oxycodone (1), D3-noroxycodone (3) and D3-oxymorphone (5).
1
6
7
5
4
3
2
1
2
3
4
5
6
1
2
3
4
5
6
a)
b)
c)
34
Emma Boström
Figure 7. Th e total plasma concentration versus time profi le following a 0.3 mg/kg 60 minute constant rate infusion of oxycodone to rats with ( )and without ( ) coadministration of PSC833. Data are presented as geometric means and SDs.
Table 4. Th e pharmacokinetic parameters of oxycodone in rats based on plasma observations. Th e data is presented as geometrical means and 95 % confi dence intervals. Th e p-value was calculated using Wilcoxon’s rank test.
1
10
100
1000
0 60 120 180
Time (min)
Cp
(n
M)
Oxycodone + PSC833 Oxycodone + vehicle p-value
AUC (h ng/ mL) 44.3 (34.8-56.6) 37.3 (33.8-41.3) 0.195CL (L / hr) 1.85 (1.52-2.25) 2.26 (2.12-2.40) 0.195V
ss (L) 0.97 (0.69-1.37) 1.16 (1.02-1.32) 0.721
0.37 (0.30-0.44) 0.36 (0.32-0.40) 0.574t½ (hr)
Th e total brain tissue concentrations at 180 minutes after start of the infusion did not diff er between the PSC833 treated and control groups, nor did the total con-centration ratio between brain tissue and plasma. Th e lack of diff erence between the groups in brain tissue concentrations and in the ratio of the brain tissue/ plasma concentrations indicates that oxycodone BBB transport and brain tissue binding is not aff ected by P-gp inhibition.
Th ere was no statistically signifi cant diff erence in the peak tail-fl ick latency or AUEC between the two study groups (Fig. 8). Th is was in accordance with the unaltered brain concentrations of oxycodone in the presence of PSC833, and further indicated that oxycodone BBB transport is not aff ected by P-gp.

35
PK, PD and BBB Transport of Oxycodone and Morphine
Figure 8. Th e tail-fl ick latency versus time profi le after a 0.3 mg/kg 60 minute constant rate intravenous infusion of oxycodone with ( ) and without ( ) co-treatment with PSC833. Data are presented as means and SDs.
One of the challenges when studying the BBB transport of drugs in vivo using trans-porter inhibitors is the lack of specifi city of the blocker to act at only one transporter. PSC833 is a cyclosporine analogue that have been extensively used to study the infl uence of P-gp in the BBB transport of diverse types of drugs such as M6G, digoxin and paclitaxel (Mayer et al., 1997; Fellner et al., 2002; Lotsch et al., 2002). However, PSC833 have also shown to be a moderate inhibitor of MRP2 and BCRP (Chen et al., 1999; Eisenblätter et al., 2003).
Th e tail-fl ick latency of the rat that received methadone and vehicle decreased rapidly after the stop of the infusion, while the rat that received methadone and PSC833 co-treatment had the maximally allowable 15 s tail fl ick latency for 60 min after the end of the infusion. Also, the same dose of PSC833 that was administered in Paper II resulted in a three-fold increase of brain concentrations of colchicine in rats (Desrayaud et al., 1997). Combined, it is clear that the dose of PSC833 administered in Paper II should be high enough to inhibit the BBB transport of oxycodone. Th e results of Paper II indicate that oxycodone is not a P-gp substrate in rats. Th is may have clinical implications as oxycodone may not interact with co-administered P-gp substrates at the BBB as opioids known to be P-gp substrates, i.e. methadone and fentanyl (Th ompson et al., 2000; Wang et al., 2004).
Oxycodone and morphine PK (Paper III and IV)Th e PK of oxycodone and morphine, including the BBB transport parameters CLin and Kp,uu, was estimated using population nonlinear mixed eff ects modelling in NONMEM.
0
2
4
6
8
10
12
14
0 60 120 180
Time (min)
Ta
il-f
lic
k l
ate
nc
y (
s)

36
Emma Boström
A two-compartment model which allowed for a delay between the venous and arterial compartments best described the PK for oxycodone in blood and plasma, while a one-compartment model was suffi cient to describe the PK in the brain (Fig. 9 a). For morphine, a two-compartment model with a joint central compartment was applied to describe the PK of morphine in blood and plasma and a two-compartment model was needed to accurately describe the brain PK (Fig. 9 b). A summary of the PK parameters of oxycodone and morphine is shown in Table 5. Th e oxycodone data supported inter animal variability in blood and brain recovery, CL, Vc and fu, while the morphine data supported inter animal variability in blood and brain recovery, Vc, inter-compartmental clearance (Q) and fu.
PERIPHERALCONC
CENTRALARTERIAL
CONC
DOSEBBB
PLASMA
BLOODDIALYSATE
CONC
BRAINDIALYSATE
CONC
CLout
RECBLOOD
fu
k10
BRAIN
CONC
Q
RECBRAIN
CENTRALVENOUSCONC
CLin
QAV
CENTRALCONC
DOSE BBBPLASMA
CLout
RECBLOOD
fu
k10
PERIPHERALCONC
CENTRAL
BRAIN
CONC
Q
RECBRAIN
Qbr
CLin
PERIPHERAL
BRAIN
CONC
BLOODDIALYSATE
CONC
BRAINDIALYSATE
CONC
Figure 9. A schematic view of the fi nal oxycodone (a) and morphine (b) PK models presented in Paper III and IV. Th e circles represent the observed data and the dashed arrows show the corrections that were made within the model to obtain the unbound drug concentrations in brain and blood. Th in arrows represent mass transport. Th e central compartment was a single compartment in the morphine model, but divided into an arterial and a venous part in the oxycodone model. For morphine, two compartments were needed to describe the unbound concentrations in the brain, while for oxycodone, a single brain compartment was suffi cient to describe the data. conc = unbound concentration.
a)
b)
37
PK, PD and BBB Transport of Oxycodone and Morphine
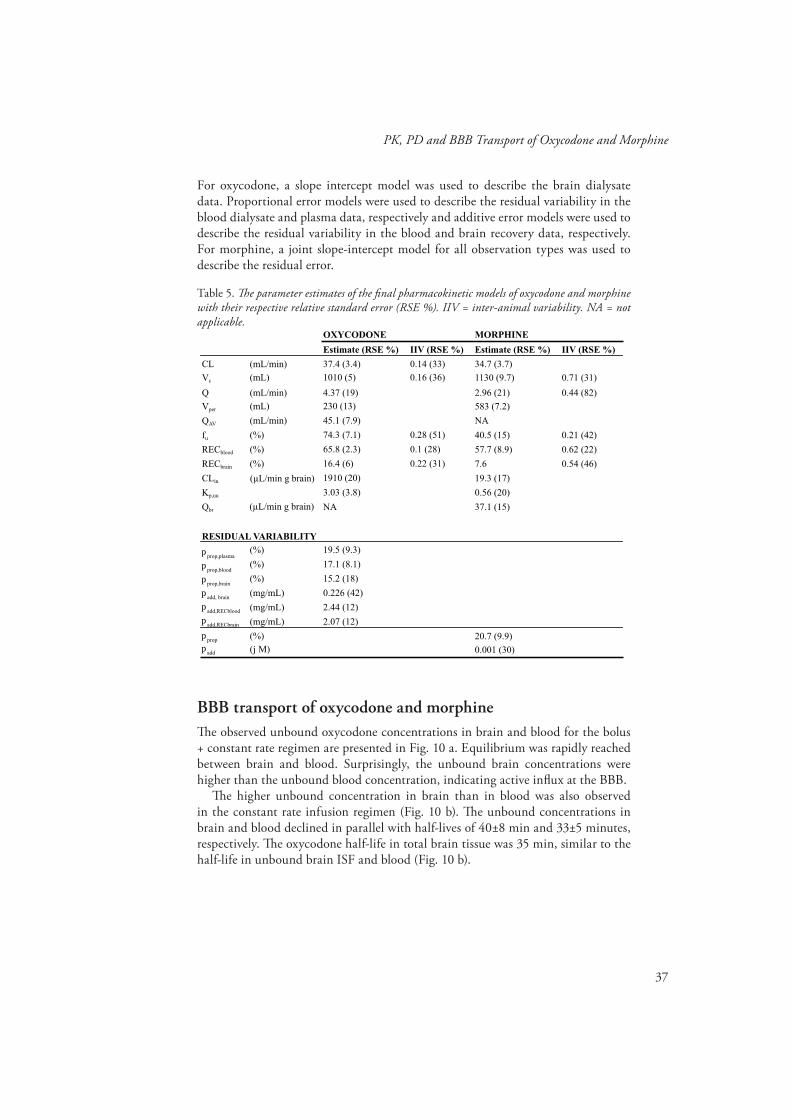
For oxycodone, a slope intercept model was used to describe the brain dialysate data. Proportional error models were used to describe the residual variability in the blood dialysate and plasma data, respectively and additive error models were used to describe the residual variability in the blood and brain recovery data, respectively. For morphine, a joint slope-intercept model for all observation types was used to describe the residual error.
Table 5. Th e parameter estimates of the fi nal pharmacokinetic models of oxycodone and morphine with their respective relative standard error (RSE %). IIV = inter-animal variability. NA = not applicable.
BBB transport of oxycodone and morphineTh e observed unbound oxycodone concentrations in brain and blood for the bolus + constant rate regimen are presented in Fig. 10 a. Equilibrium was rapidly reached between brain and blood. Surprisingly, the unbound brain concentrations were higher than the unbound blood concentration, indicating active infl ux at the BBB.
Th e higher unbound concentration in brain than in blood was also observed in the constant rate infusion regimen (Fig. 10 b). Th e unbound concentrations in brain and blood declined in parallel with half-lives of 40±8 min and 33±5 minutes, respectively. Th e oxycodone half-life in total brain tissue was 35 min, similar to the half-life in unbound brain ISF and blood (Fig. 10 b).
Estimate (RSE %) IIV (RSE %) Estimate (RSE %) IIV (RSE %)
CL (mL/min) 37.4 (3.4) 0.14 (33) 34.7 (3.7)
Vc (mL) 1010 (5) 0.16 (36) 1130 (9.7) 0.71 (31)
Q (mL/min) 4.37 (19) 2.96 (21) 0.44 (82)
Vper (mL) 230 (13) 583 (7.2)
QAV (mL/min) 45.1 (7.9) NA
fu (%) 74.3 (7.1) 0.28 (51) 40.5 (15) 0.21 (42)
RECblood (%) 65.8 (2.3) 0.1 (28) 57.7 (8.9) 0.62 (22)
RECbrain (%) 16.4 (6) 0.22 (31) 7.6 0.54 (46)
CLin 1910 (20) 19.3 (17)
Kp,uu 3.03 (3.8) 0.56 (20)
Qbr NA 37.1 (15)
prop,plasma(%) 19.5 (9.3)
prop,blood(%) 17.1 (8.1)
prop,brain(%) 15.2 (18)
add, brain(mg/mL) 0.226 (42)
add,RECblood (mg/mL) 2.44 (12)
add,RECbrain (mg/mL) 2.07 (12)
prop (%) 20.7 (9.9)
add ( M) 0.001 (30)
MORPHINEOXYCODONE
RESIDUAL VARIABILITY
( L/min g brain)
( L/min g brain)
38
Emma Boström
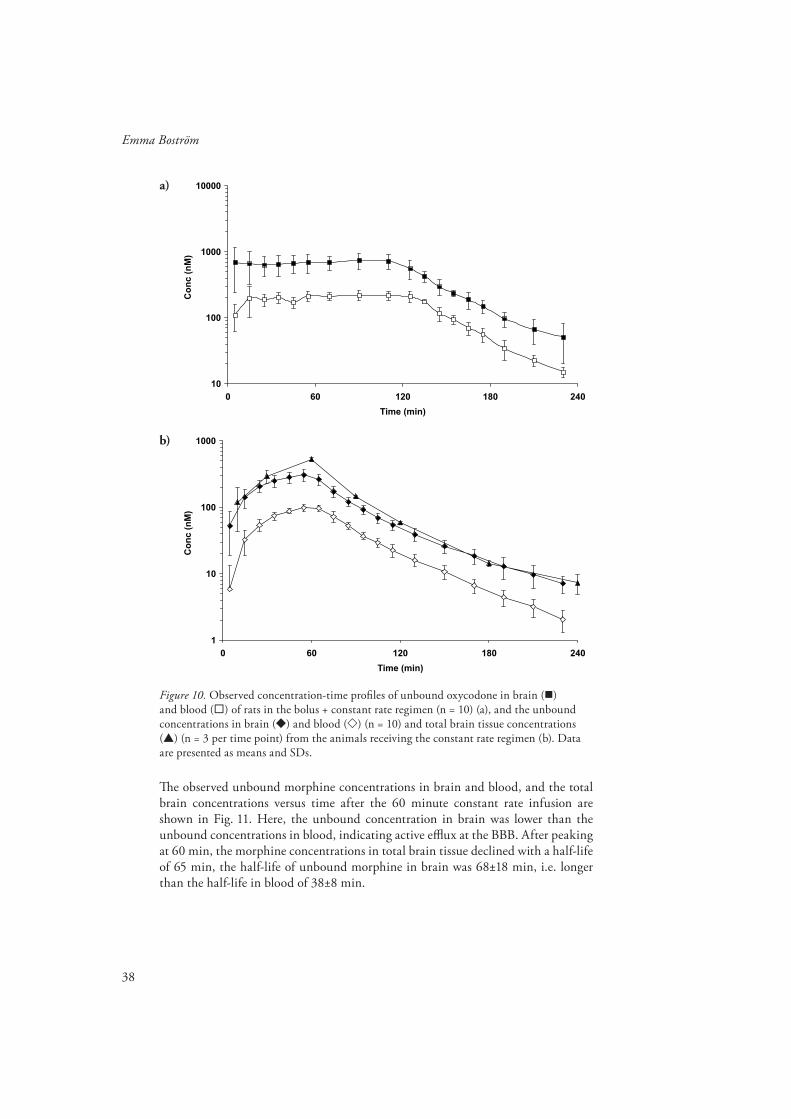
Figure 10. Observed concentration-time profi les of unbound oxycodone in brain ( ) and blood ( ) of rats in the bolus + constant rate regimen (n = 10) (a), and the unbound concentrations in brain ( ) and blood ( ) (n = 10) and total brain tissue concentrations ( ) (n = 3 per time point) from the animals receiving the constant rate regimen (b). Data are presented as means and SDs.
Th e observed unbound morphine concentrations in brain and blood, and the total brain concentrations versus time after the 60 minute constant rate infusion are shown in Fig. 11. Here, the unbound concentration in brain was lower than the unbound concentrations in blood, indicating active effl ux at the BBB. After peaking at 60 min, the morphine concentrations in total brain tissue declined with a half-life of 65 min, the half-life of unbound morphine in brain was 68±18 min, i.e. longer than the half-life in blood of 38±8 min.
10
100
1000
10000
0 60 120 180 240
Time (min)
Co
nc
(n
M)
1
10
100
1000
0 60 120 180 240
Time (min)
Co
nc
(n
M)
a)
b)
39
PK, PD and BBB Transport of Oxycodone and Morphine
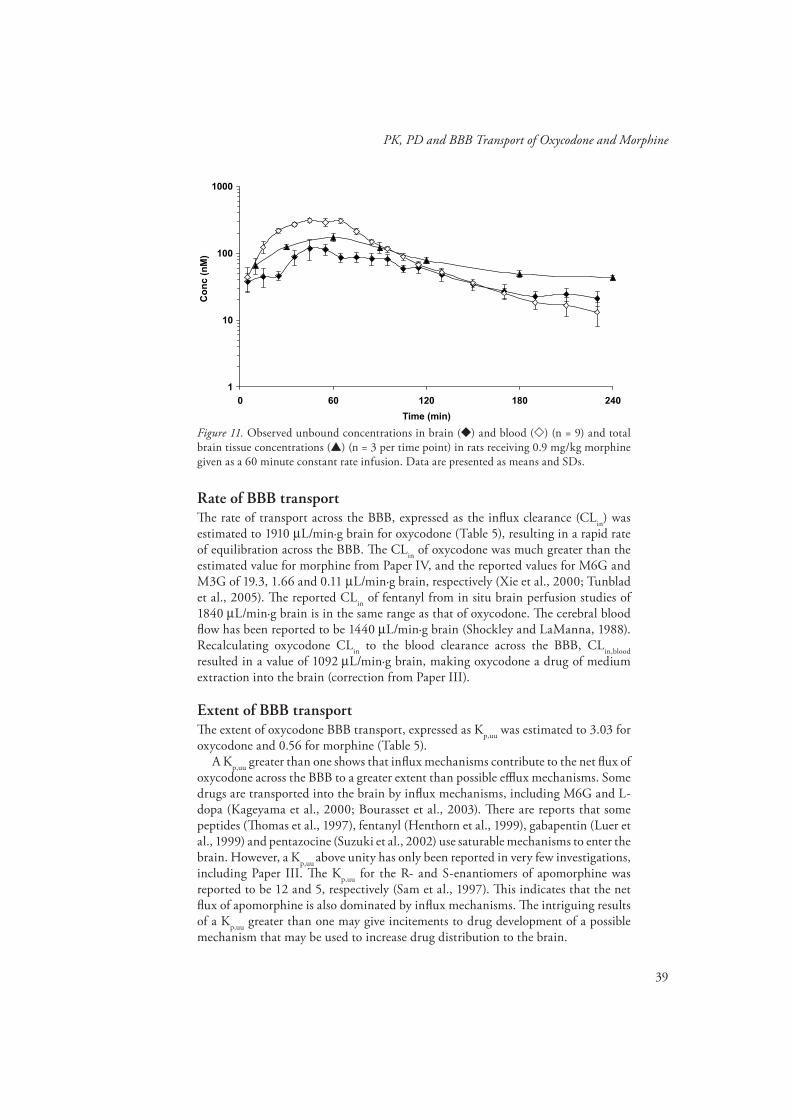
Figure 11. Observed unbound concentrations in brain ( ) and blood ( ) (n = 9) and total brain tissue concentrations ( ) (n = 3 per time point) in rats receiving 0.9 mg/kg morphine given as a 60 minute constant rate infusion. Data are presented as means and SDs.
Rate of BBB transportTh e rate of transport across the BBB, expressed as the infl ux clearance (CLin) was estimated to 1910 µL/min·g brain for oxycodone (Table 5), resulting in a rapid rate of equilibration across the BBB. Th e CLin of oxycodone was much greater than the estimated value for morphine from Paper IV, and the reported values for M6G and M3G of 19.3, 1.66 and 0.11 µL/min·g brain, respectively (Xie et al., 2000; Tunblad et al., 2005). Th e reported CLin of fentanyl from in situ brain perfusion studies of 1840 µL/min·g brain is in the same range as that of oxycodone. Th e cerebral blood fl ow has been reported to be 1440 µL/min·g brain (Shockley and LaManna, 1988). Recalculating oxycodone CLin to the blood clearance across the BBB, CLin,blood resulted in a value of 1092 µL/min·g brain, making oxycodone a drug of medium extraction into the brain (correction from Paper III).
Extent of BBB transportTh e extent of oxycodone BBB transport, expressed as Kp,uu was estimated to 3.03 for oxycodone and 0.56 for morphine (Table 5).
A Kp,uu greater than one shows that infl ux mechanisms contribute to the net fl ux of oxycodone across the BBB to a greater extent than possible effl ux mechanisms. Some drugs are transported into the brain by infl ux mechanisms, including M6G and L-dopa (Kageyama et al., 2000; Bourasset et al., 2003). Th ere are reports that some peptides (Th omas et al., 1997), fentanyl (Henthorn et al., 1999), gabapentin (Luer et al., 1999) and pentazocine (Suzuki et al., 2002) use saturable mechanisms to enter the brain. However, a Kp,uu above unity has only been reported in very few investigations, including Paper III. Th e Kp,uu for the R- and S-enantiomers of apomorphine was reported to be 12 and 5, respectively (Sam et al., 1997). Th is indicates that the net fl ux of apomorphine is also dominated by infl ux mechanisms. Th e intriguing results of a Kp,uu greater than one may give incitements to drug development of a possible mechanism that may be used to increase drug distribution to the brain.
1
10
100
1000
0 60 120 180 240
Time (min)
Co
nc
(n
M)

40
Emma Boström
Morphine had a Kp,uu of less than one, which make effl ux transporters contribute to the net fl ux to a greater extent than possible infl ux mechanisms. Indeed, morphine has shown to be a substrate for P-gp and probenecid sensitive effl ux transporters at the BBB (Letrent et al., 1999; Zong and Pollack, 2000; Tunblad et al., 2003).
Binding within the brainTh e oxycodone binding within the brain, expressed as Vu,brain, was in Paper III calculated to 2.20 mL/g brain tissue. Th is was larger than the reported value of the brain interstitial space of 0.15 mL/g brain tissue (Goodman et al., 1973), which shows that oxycodone is distributed intracellularly and/or binds to tissue components.
PKPD of oxycodone and morphine (Paper IV)Using PKPD modelling the unbound brain concentrations were correlated to the tail-fl ick pharmacological response in vivo in order to evaluate if there were any diff erences in the PD parameters between the drugs. Th e fi nal PK parameters from the respective PK model of each drug were fi xed and used as an input function in the PKPD modelling. Firstly, each drug was modelled separately and fi nally a joint PKPD model for oxycodone and morphine was developed.
In the separate modelling as well as in the joint PKPD model, neither of the drugs showed a delay between the unbound brain concentration and eff ect, making a direct eff ect model adequate to describe the concentration-eff ect relationship.
For both oxycodone and morphine, a power model according to Eq. 16 resulted in the best fi t. Th e Slope and γ parameters were signifi cantly diff erent between the two drugs, but there was no diff erence in the Baseline parameter. Th e model supported joint inter-animal variability on Baseline and Slope. Inter-animal variability on γ was supported for oxycodone but not for morphine. Th e residual error was best described by a joint proportional error model for both drugs. Th e results from the best fi t of the joint PKPD model are shown in Table 6.
Th e relationships for observed eff ect versus model predicted unbound brain and blood concentrations of oxycodone and morphine showed an interesting fi nding. A higher unbound oxycodone than morphine concentration in brain ISF was needed to exert an eff ect, while in blood, a higher unbound concentration of morphine was needed compared to oxycodone (Fig. 12 a and b). Th at is, if unbound brain ISF data had not been available, the concentration acting at the receptor would not be known, and the conclusion that oxycodone was more potent than morphine would have been drawn.
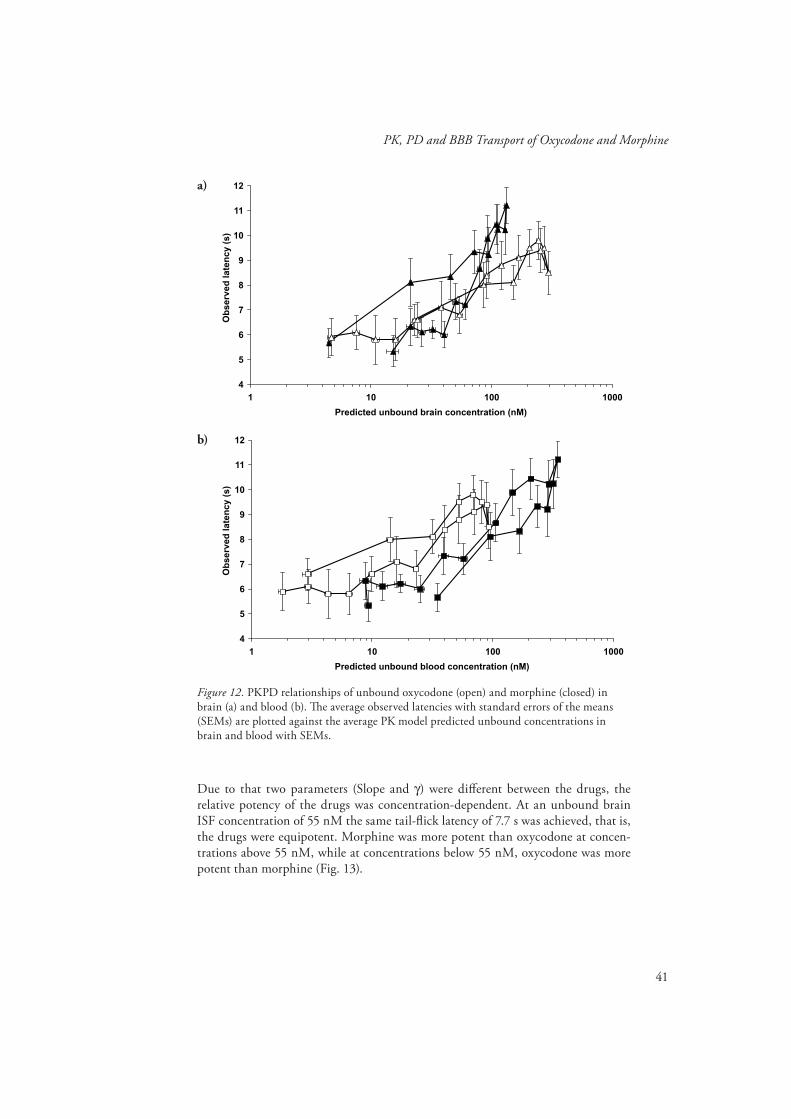
41
PK, PD and BBB Transport of Oxycodone and Morphine
4
5
6
7
8
9
10
11
12
1 10 100 1000
Predicted unbound brain concentration (nM)
Ob
se
rve
d l
ate
nc
y (
s)
4
5
6
7
8
9
10
11
12
1 10 100 1000
Predicted unbound blood concentration (nM)
Ob
se
rve
d l
ate
nc
y (
s)
Figure 12. PKPD relationships of unbound oxycodone (open) and morphine (closed) in brain (a) and blood (b). Th e average observed latencies with standard errors of the means (SEMs) are plotted against the average PK model predicted unbound concentrations in brain and blood with SEMs.
Due to that two parameters (Slope and γ) were diff erent between the drugs, the relative potency of the drugs was concentration-dependent. At an unbound brain ISF concentration of 55 nM the same tail-fl ick latency of 7.7 s was achieved, that is, the drugs were equipotent. Morphine was more potent than oxycodone at concen-trations above 55 nM, while at concentrations below 55 nM, oxycodone was more potent than morphine (Fig. 13).
a)
b)

42
Emma Boström
Figure 13. Th e simulated unbound concentration in brain ISF from tail-fl ick latencies ranging between baseline and cut-off (5 - 15 s) based on the individual parameter estimates from the PKPD model of oxycodone (solid line) and morphine (thin dashed line) and the typical individual for oxycodone (heavy solid line) and morphine (heavy dashed line).
0
3
6
9
12
15
1 10 100 1000 10000
Unbound brain concentration (nM)
Pre
dic
ted
ta
il-f
lic
k l
ate
nc
y (
s)
Table 6. Th e parameter estimates of the fi nal joint PKPD model of oxycodone and morphine with relative standard errors (RSE %). A power function according to Eff ect = Baseline + Slope ⋅ Cγ best described the data, where Eff ect is the tail-fl ick latency in seconds, Baseline is the tail-fl ick latency in absence of drug, C is the unbound brain ISF concentration, Slope is the slope factor of the PKPD relationship and γ is a shape factor, determining the shape of the curve. 0xy = oxycodone, Mor = morphine.
Parameter Drug Estimate (RSE %)
Baseline (s) Oxy + Mor 4.95 (5.3)
Slope Oxy 8 (12)
Slope Mor 27.9 (18)
Oxy 0.371 (21)
Mor 0.801 (9.4)
Oxy + Mor 0.243 (22)
Oxy + Mor 0.200 (63)
Oxy 0.528 (96)
(%) Oxy + Mor 18.5 (4.6)
Inter-animal variability
Residual variability
(s/ M)
(s/ M)
Baseline
Slope
prop

43
PK, PD and BBB Transport of Oxycodone and Morphine
In rat thalamus and cells transfected with µ-opioid receptors, 3-8 fold greater con-centrations of oxycodone was needed for the same agonist mediated stimulation of [35S]GTPγS binding as compared to morphine (Th ompson et al., 2004; Lalovic et al., 2006; Peckham and Traynor, 2006). From these in vitro results, it would be expected that a 3-8 fold higher concentrations of oxycodone at the receptor would be needed to elicit the same G-protein activation as for morphine.
With this background it may be surprising that a higher dose of morphine was needed to elicit the same tail-fl ick latency as oxycodone in Paper IV. Th is is partly due to the higher unbound fraction of oxycodone as compared to morphine (74.3 % compared to 40.5 %, Paper III and IV), making a smaller fraction of morphine available for BBB transport. Also, based on the diff erences in Kp,uu (3 and 0.56, respectively), the diff erence in the extent of BBB transport of unbound drug was approximately 6. Th erefore, at a certain unbound blood concentration, a 6-fold higher brain ISF concentration of oxycodone will be observed compared to morphine. Th e unbound brain ISF concentration should be more closely related to the eff ect than the blood concentration as the µ-opioid receptors are located at the cell surface facing the ISF (Goodman and Gilman, 2001). By correlating the eff ects to the unbound concentrations in the brain ISF rather than the blood concentrations, a PKPD relationship that better describes the interaction with the receptor is obtained.
44
Emma Boström
Conclusions
Characterization of the PK of a drug demands sensitive and selective analytical methods for determination of drug content in the collected samples. Methods for quantifi cation of oxycodone, noroxycodone and oxymorphone and their deuterated analogues using LC/MS/MS in Ringer solution, rat plasma and rat brain tissue samples were developed and validated.
P-gp is known to restrict the entry of various drugs into the BBB, including opioids. Co-administration of the P-gp inhibitor PSC833 did not infl uence the systemic PK of oxycodone, nor did it infl uence the total brain tissue concentrations or the ratios of total brain tissue to plasma concentrations of oxycodone in rats. Th ese results, in combination with the unaltered tail-fl ick latency when co-treated with PSC833, indicate that oxycodone is not a P-gp substrate in the rat. Th is may have clinical implications, as oxycodone is less likely to interact at the BBB with concomitantly administered P-gp substrates as other opioids.
Using microdialysis, the rate and extent of oxycodone transport across the BBB was assessed. Th e CLin across the BBB was found to be very rapid. Th e Kp,uu of oxycodone was found to be 3, meaning that the unbound brain ISF concentrations was 3-fold higher than the unbound blood concentrations. A Kp,uu above one indicates that active infl ux processes are involved in the BBB transport of oxycodone. Knowledge on this transport process would give new incitements to drug development on how to increase delivery of drugs to the brain.
Th e PKPD of oxycodone and morphine was investigated. A direct eff ect model and a power function best described the data. Th e potency diff erence between the drugs was concentration dependent, with an infl iction point of 55 nM, above which morphine was more potent, and below oxycodone was more potent. Oxycodone had a 6-fold higher Kp,uu compared to morphine, which resulted in higher unbound brain ISF concentrations of oxycodone as compared to morphine based on the same unbound concentrations in blood.
45
PK, PD and BBB Transport of Oxycodone and Morphine
Acknowledgements
Th is work was performed at the Department of Pharmaceutical Biosciences, Division of Pharmacokinetics and Drug Th erapy, Uppsala University, Uppsala, Sweden.
I wish to express my sincere gratitude to everyone who has contributed to this thesis, and then especially:
My supervisors, Professor Margareta Hammarlund-Udenaes for sharing your scien-tifi c knowledge, for support and encouragement, and for always being positive and enthusiastic about my work. I also want to thank you for your understanding con-cerning the “family puzzle”, and your advice on how to combine parenthood and work. My co-supervisor, Associate Professor Ulrika Simonsson, for all your bright ideas on statistics and modelling, and for always having the time when I need it. I greatly appreciate your support and engagement in my work, and for your under-standing and advice on all sorts of things. I am grateful that I have had the oppor-tunity to work with you both!
My co-author, Britt Jansson, for your enthusiasm and interesting discussions about the analytical world as well as the real one. You are one of the most quality conscious researchers I have met!
Jessica, for your skilful technical assistance, for always putting up with “just one more thing” and all the early mornings. Th is thesis would probably not be fi nished at all without your expertise. Many, many thanks!
Dr. Anubha, for being a great friend and for all our discussions concerning research and also the important things. Dr. Karin, for introducing me to the fi eld of BBB and microdialysis. Jörgen for your friendship, for sharing your ideas and knowledge and always having time for discussions. You bring laughs to the division and time with you is never boring. Markus and Stina for your sharp ideas and interesting discus-sions. I have really enjoyed the experiences we all had together during travels as well as sharing the everyday life of being a PhD-student!
My master students Malin Jönsson and Helén Merkell for all the good work.
Marina, Marianne, Birgit and Kjell for all practical help at the division. Karin for making teaching so much easier.
Magnus Jansson for all your help and patience when putting the thesis together and

46
Emma Boström
making it look the way it looks.
My former room-mate Anders for your friendship and all the good times we had (and have!) together. You always have the right words whenever I need it. My present room-mate, Angelica, for being such a positive and easygoing person and for always taking the time to explain NONMEM enigmas in an understandable manner.
Mia and Bettan, for your endless patience explaining things to me. You always have ideas on how to solve problems, and have kept med going when things have been rough.
All present and former colleagues at the division, for Christmas parties, fun lunches, go’fi ka raster, doktorand dagar, exciting travels and good meetings and seminars. You all create the best place to work in the world!
Th e Swedish Academy of Pharmaceutical Sciences for giving me to opportunity to attend valuable courses and conferences.
Jag vill också tacka min familj och mina vänner och då särskilt:
Maria, Ann-Marie, Emma och Ulrika med familjer, för att ni gör jobbet så mycket roligare och vardagen så mycket festligare. Det är extremt lyxigt att ha er så nära varje dag!
Flogsta-fl ickorna, Lotta och Tove för allt bus under åren - ni gör livet mycket glam-migare och roligare!
Hasse, Lena, Anders och Olof – för er stora omtanke, alla sånger och all musik, sköna dagar på Rådom och för att ni tar så väl hand om Arvid!
Oskar och Frida, mina småsyskon, för att vi tar så väl hand om varandra, för stöd och uppmuntran och för att vi har så mycket roligt ihop!
Christina och Bengt, mina föräldrar. Tack för att ni alltid har trott på mig och det jag gör, och alltid sagt att jag kan bli vad jag vill. Ni betyder oerhört mycket för mig!
Arvid, min trollunge, för att du är solstrålen i mitt liv.
Fredrik, mitt livs kärlek. Du är mitt stöd, du gör mig glad och lycklig varenda dag. Du är bäst!
Emma

47
PK, PD and BBB Transport of Oxycodone and Morphine
References
Abbott NJ (2004) Evidence for bulk fl ow of brain interstitial fl uid: signifi cance for physiology and pathology. Neurochem Int 45:545-552.
Backlund M, Lindgren L, Kajimoto Y and Rosenberg PH (1997) Comparison of epidural morphine and oxycodone for pain after abdominal surgery. J Clin Anesth 9:30-35.
Bengtsson J, Jansson B and Hammarlund-Udenaes M (2005) On-line desalting and determination of morphine, morphine-3-glucuronide and morphine-6-glucuronide in microdialysis and plasma samples using column switching and liquid chromatography/tandem mass spectrometry. Rapid Commun Mass Spectrom 19:2116-2122.
Benveniste H, Drejer J, Schousboe A and Diemer NH (1987) Regional cerebral glucose phosphorylation and blood fl ow after insertion of a microdialysis fi ber through the dorsal hippocampus in the rat. J Neurochem 49:729-734.
Bickel U, Schumacher OP, Kang YS and Voigt K (1996) Poor permeability of morphine 3-glucuronide and morphine 6-glucuronide through the blood-brain barrier in the rat. J Pharmacol Exp Th er 278:107-113.
Bourasset F, Cisternino S, Temsamani J and Scherrmann JM (2003) Evidence for an active transport of morphine-6-beta-d-glucuronide but not P-glycoprotein-mediated at the blood-brain barrier. J Neurochem 86:1564-1567.
Bouw MR and Hammarlund-Udenaes M (1998) Methodological aspects of the use of a calibrator in in vivo microdialysis-further development of the retrodialysis method. Pharm Res 15:1673-1679.
Chen ZS, Kawabe T, Ono M, Aoki S, Sumizawa T, Furukawa T, Uchiumi T, Wada M, Kuwano M and Akiyama SI (1999) Eff ect of multidrug resistance-reversing agents on transporting activity of human canalicular multispecifi c organic anion transporter. Mol Pharmacol 56:1219-1228.
Cisternino S, Mercier C, Bourasset F, Roux F and Scherrmann JM (2004) Expression, up-regulation, and transport activity of the multidrug-resistance protein Abcg2 at the mouse blood-brain barrier. Cancer Res 64:3296-3301.
Curtis GB, Johnson GH, Clark P, Taylor R, Brown J, O’Callaghan R, Shi M and Lacouture PG (1999) Relative potency of controlled-release oxycodone and controlled-release morphine in a postoperative pain model. Eur J Clin Pharmacol 55:425-429.
Dagenais C, Zong J, Ducharme J and Pollack GM (2001) Eff ect of mdr1a P-glycoprotein gene disruption, gender, and substrate concentration on brain uptake of selected compounds. Pharm Res 18:957-963.
Davson H and Segal MB (1996) Physiology of the CSF and blood-brain barriers. CRC Press, Inc., Boca Raton.
de Lange EC, Hesselink MB, Danhof M, de Boer AG and Breimer DD (1995) Th e use of intracerebral microdialysis to determine changes in blood- brain barrier transport characteristics. Pharm Res 12:129-133.
Deguchi Y (2002) Application of in vivo brain microdialysis to the study of blood-brain barrier transport of drugs. Drug Metab Pharmacokinet 17:395-407.

48
Emma Boström
DeHaven-Hudkins DL and Dolle RE (2004) Peripherally restricted opioid agonists as novel analgesic agents. Curr Pharm Des 10:743-757.
Desrayaud S, Guntz P, Scherrmann JM and Lemaire M (1997) Eff ect of the P-glycoprotein inhibitor, SDZ PSC 833, on the blood and brain pharmacokinetics of colchicine. Life Sci 61:153-163.
Dumez H, Guetens G, De Boeck G, Highley MS, de Bruijn EA, van Oosterom AT and Maes RA (2005) In vitro partition of irinotecan (CPT-11) in human volunteer blood: the infl uence of concentration, gender and smoking. Anticancer Drugs 16:893-895.
Eisenblätter T, Huwel S and Galla HJ (2003) Characterisation of the brain multidrug resistance protein (BMDP/ABCG2/BCRP) expressed at the blood-brain barrier. Brain Res 971:221-231.
Elmquist WF and Sawchuk RJ (1997) Application of microdialysis in pharmacokinetic studies. Pharm Res 14:267-288.
Fellner S, Bauer B, Miller DS, Schaff rik M, Fankhanel M, Spruss T, Bernhardt G, Graeff C, Farber L, Gschaidmeier H, Buschauer A and Fricker G (2002) Transport of paclitaxel (Taxol) across the blood-brain barrier in vitro and in vivo. J Clin Invest 110:1309-1318.
Gardmark M, Karlsson MO, Jonsson F and Hammarlund-Udenaes M (1998) Morphine-3-glucuronide has a minor eff ect on morphine antinociception. Pharmacodynamic modeling. J Pharm Sci 87:813-820.
Goodman and Gilman (2001) Goodman & Gilman s Th e pharmacological basis of therapeutics. Th e McGraw-Hill Companies, Inc.
Goodman FR, Weiss GB and Alderdice MT (1973) On the measurement of extracellular space in slices prepared from diff erent rat brain areas. Neuropharmacology 12:867-873.
Groothuis DR, Ward S, Schlageter KE, Itskovich AC, Schwerin SC, Allen CV, Dills C and Levy RM (1998) Changes in blood-brain barrier permeability associated with insertion of brain cannulas and microdialysis probes. Brain Res 803:218-230.
Hammarlund-Udenaes M (2000) Th e use of microdialysis in CNS drug delivery studies. Pharmacokinetic perspectives and results with analgesics and antiepileptics. Adv Drug Deliv Rev 45:283-294.
Hammarlund-Udenaes M, Paalzow LK and de Lange EC (1997) Drug equilibration across the blood-brain barrier--pharmacokinetic considerations based on the microdialysis method. Pharm Res 14:128-134.
Henthorn TK, Liu Y, Mahapatro M and Ng KY (1999) Active transport of fentanyl by the blood-brain barrier. J Pharmacol Exp Th er 289:1084-1089.
Joel SP, Osborne RJ and Slevin ML (1988) An improved method for the simultaneous determination of morphine and its principal glucuronide metabolites. J Chromatogr 430:394-399.
Kageyama T, Nakamura M, Matsuo A, Yamasaki Y, Takakura Y, Hashida M, Kanai Y, Naito M, Tsuruo T, Minato N and Shimohama S (2000) Th e 4F2hc/LAT1 complex transports L-DOPA across the blood-brain barrier. Brain Res 879:115-121.
Kakee A, Terasaki T and Sugiyama Y (1996) Brain effl ux index as a novel method of analyzing effl ux transport at the blood-brain barrier. J Pharmacol Exp Th er 277:1550-1559.
Lalovic B, Kharasch E, Hoff er C, Risler L, Liu-Chen LY and Shen DD (2006) Pharmacokinetics and pharmacodynamics of oral oxycodone in healthy human subjects: role of circulating active metabolites. Clin Pharmacol Th er 79:461-479.
Leonard R and Ruben Z (1986) Hematology reference values for peripheral blood of laboratory rats. Lab Anim Sci 36:277-281.

49
PK, PD and BBB Transport of Oxycodone and Morphine
Leow KP, Smith MT, Williams B and Cramond T (1992) Single-dose and steady-state pharmacokinetics and pharmacodynamics of oxycodone in patients with cancer. Clin Pharmacol Th er 52:487-495.
Leow KP, Wright AW, Cramond T and Smith MT (1993) Determination of the serum protein binding of oxycodone and morphine using ultrafi ltration. Th er Drug Monit 15:440-447.
Letrent SP, Pollack GM, Brouwer KR and Brouwer KL (1998) Eff ect of GF120918, a potent P-glycoprotein inhibitor, on morphine pharmacokinetics and pharmacodynamics in the rat. Pharm Res 15:599-605.
Letrent SP, Pollack GM, Brouwer KR and Brouwer KL (1999) Eff ects of a potent and specifi c P-glycoprotein inhibitor on the blood-brain barrier distribution and antinociceptive eff ect of morphine in the rat. Drug Metab Dispos 27:827-834.
Lonnroth P, Jansson PA and Smith U (1987) A microdialysis method allowing characterization of intercellular water space in humans. Am J Physiol 253:E228-231.
Lotsch J, Schmidt R, Vetter G, Schmidt H, Niederberger E, Geisslinger G and Tegeder I (2002) Increased CNS uptake and enhanced antinociception of morphine-6-glucuronide in rats after inhibition of P-glycoprotein. J Neurochem 83:241-248.
Luer MS, Hamani C, Dujovny M, Gidal B, Cwik M, Deyo K and Fischer JH (1999) Saturable transport of gabapentin at the blood-brain barrier. Neurol Res 21:559-562.
MacPherson RD (2002) New directions in pain management. Drugs Today (Barc) 38:135-145.
Mayer U, Wagenaar E, Dorobek B, Beijnen JH, Borst P and Schinkel AH (1997) Full blockade of intestinal P-glycoprotein and extensive inhibition of blood-brain barrier P-glycoprotein by oral treatment of mice with PSC833. J Clin Invest 100:2430-2436.
Murthy BR, Pollack GM and Brouwer KL (2002) Contribution of morphine-6-glucuronide to antinociception following intravenous administration of morphine to healthy volunteers. J Clin Pharmacol 42:569-576.
Oguri K, Hanioka N and Yoshimura H (1990) Species diff erences in metabolism of codeine: urinary excretion of codeine glucuronide, morphine-3-glucuronide and morphine-6-glucuronide in mice, rats, guinea pigs and rabbits. Xenobiotica 20:683-688.
Ohno K, Pettigrew KD and Rapoport SI (1979) Local cerebral blood fl ow in the conscious rat as measured with 14C- antipyrine, 14C-iodoantipyrine and 3H-nicotine. Stroke 10:62-67.
Oldendorf WH (1970) Measurement of brain uptake of radiolabeled substances using a tritiated water internal standard. Brain Res 24:372-376.
Peckham EM and Traynor JR (2006) Comparison of the antinociceptive response to morphine and morphine-like compounds in male and female sprague-dawley rats. J Pharmacol Exp Th er 316:1195-1201.
Pessin JE and Bell GI (1992) Mammalian facilitative glucose transporter family: structure and molecular regulation. Annu Rev Physiol 54:911-930.
Polli JW, Baughman TM, Humphreys JE, Jordan KH, Mote AL, Salisbury JA, Tippin TK and Serabjit-Singh CJ (2003) P-glycoprotein infl uences the brain concentrations of cetirizine (Zyrtec), a second-generation non-sedating antihistamine. J Pharm Sci 92:2082-2089.
Poyhia R and Kalso EA (1992) Antinociceptive eff ects and central nervous system depression caused by oxycodone and morphine in rats. Pharmacol Toxicol 70:125-130.
50
Emma Boström
Poyhia R, Seppala T, Olkkola KT and Kalso E (1992) Th e pharmacokinetics and metabolism of oxycodone after intramuscular and oral administration to healthy subjects. Br J Clin Pharmacol 33:617-621.
Sam E, Sarre S, Michotte Y and Verbeke N (1997) Distribution of apomorphine enantiomers in plasma, brain tissue and striatal extracellular fl uid. Eur J Pharmacol 329:9-15.
Sawchuk RJ and Elmquist WF (2000) Microdialysis in the study of drug transporters in the CNS. Adv Drug Deliv Rev 45:295-307.
Shockley RP and LaManna JC (1988) Determination of rat cerebral cortical blood volume changes by capillary mean transit time analysis during hypoxia, hypercapnia and hyperventilation. Brain Res 454:170-178.
Silvasti M, Rosenberg P, Seppala T, Svartling N and Pitkanen M (1998) Comparison of analgesic effi cacy of oxycodone and morphine in postoperative intravenous patient-controlled analgesia. Acta Anaesthesiol Scand 42:576-580.
Skarke C, Jarrar M, Schmidt H, Kauert G, Langer M, Geisslinger G and Lotsch J (2003) Eff ects of ABCB1 (multidrug resistance transporter) gene mutations on disposition and central nervous eff ects of loperamide in healthy volunteers. Pharmacogenetics 13:651-660.
Suzuki T, Oshimi M, Tomono K, Hanano M and Watanabe J (2002) Investigation of transport mechanism of pentazocine across the blood-brain barrier using the in situ rat brain perfusion technique. J Pharm Sci 91:2346-2353.
Takasato Y. Rapoprt S An in situ brain perfuion technique to study cerebrovascular transport in the rat.
Tamai I and Tsuji A (2000) Transporter-mediated permeation of drugs across the blood-brain barrier. J Pharm Sci 89:1371-1388.
Th omas SA, Abbruscato TJ, Hruby VJ and Davis TP (1997) Th e entry of [D-penicillamine2,5]enkephalin into the central nervous system: saturation kinetics and specifi city. J Pharmacol Exp Th er 280:1235-1240.
Th ompson CM, Wojno H, Greiner E, May EL, Rice KC and Selley DE (2004) Activation of G-proteins by morphine and codeine congeners: insights to the relevance of O- and N-demethylated metabolites at mu- and delta-opioid receptors. J Pharmacol Exp Th er 308:547-554.
Th ompson SJ, Koszdin K and Bernards CM (2000) Opiate-induced analgesia is increased and prolonged in mice lacking P-glycoprotein. Anesthesiology 92:1392-1399.
Tozer TN (1981) Concepts basic to pharmacokinetics. Pharmacol Th er 12:109-131.Tunblad K, Hammarlund-Udenaes M and Jonsson EN (2004) An integrated model for the
analysis of pharmacokinetic data from microdialysis experiments. Pharm Res 21:1698-1707.
Tunblad K, Hammarlund-Udenaes M and Jonsson EN (2005) Infl uence of probenecid on the delivery of morphine-6-glucuronide to the brain. Eur J Pharm Sci 24:49-57.
Tunblad K, Jonsson EN and Hammarlund-Udenaes M (2003) Morphine blood-brain barrier transport is infl uenced by probenecid co-administration. Pharm Res 20:618-623.
Ungerstedt U (1991) Microdialysis--principles and applications for studies in animals and man. J Intern Med 230:365-373.
van Bree JB, de Boer AG, Danhof M, Ginsel LA and Breimer DD (1988) Characterization of an “in vitro” blood-brain barrier: eff ects of molecular size and lipophilicity on cerebrovascular endothelial transport rates of drugs. J Pharmacol Exp Th er 247:1233-1239.
51
PK, PD and BBB Transport of Oxycodone and Morphine
Wang JS, Ruan Y, Taylor RM, Donovan JL, Markowitz JS and DeVane CL (2004) Brain penetration of methadone (R)- and (S)-enantiomers is greatly increased by P-glycoprotein defi ciency in the blood-brain barrier of Abcb1a gene knockout mice. Psychopharmacology (Berl) 173:132-138.
Wang Y, Wong SL and Sawchuk RJ (1993) Microdialysis calibration using retrodialysis and zero-net fl ux: application to a study of the distribution of zidovudine to rabbit cerebrospinal fl uid and thalamus. Pharm Res 10:1411-1419.
Westerling D, Persson C and Hoglund P (1995) Plasma concentrations of morphine, morphine-3-glucuronide, and morphine- 6-glucuronide after intravenous and oral administration to healthy volunteers: relationship to nonanalgesic actions. Th er Drug Monit 17:287-301.
Xie R, Bouw MR and Hammarlund-Udenaes M (2000) Modelling of the blood-brain barrier transport of morphine-3- glucuronide studied using microdialysis in the rat: involvement of probenecid-sensitive transport. Br J Pharmacol 131:1784-1792.
Yeh SY, Gorodetzky CW and Krebs HA (1977) Isolation and identifi cation of morphine 3- and 6-glucuronides, morphine 3,6-diglucuronide, morphine 3-ethereal sulfate, normorphine, and normorphine 6-glucuronide as morphine metabolites in humans. J Pharm Sci 66:1288-1293.
Zong J and Pollack GM (2000) Morphine antinociception is enhanced in mdr1a gene-defi cient mice. Pharm Res 17:749-753.

Acta Universitatis UpsaliensisDigital Comprehensive Summaries of Uppsala Dissertationsfrom the Faculty of Pharmacy 50
Editor: The Dean of the Faculty of Pharmacy
A doctoral dissertation from the Faculty of Pharmacy, UppsalaUniversity, is usually a summary of a number of papers. A fewcopies of the complete dissertation are kept at major Swedishresearch libraries, while the summary alone is distributedinternationally through the series Digital ComprehensiveSummaries of Uppsala Dissertations from the Faculty ofPharmacy. (Prior to January, 2005, the series was publishedunder the title “Comprehensive Summaries of UppsalaDissertations from the Faculty of Pharmacy”.)
Distribution: publications.uu.seurn:nbn:se:uu:diva-7772
ACTAUNIVERSITATISUPSALIENSISUPPSALA2007