phase 1: desktop hydrogeological investigation
TRANSCRIPT

Phase 1: Desktop
Hydrogeological Investigation
Stanley Road Landfill
Prepared for Bunbury-Harvey Regional Council
March 2015
Project Number TE14027

TE14027 Stanley Rd_desktop hydrogeological investigation.0a March 2015 | Page ii
Phase 1: Desktop Hydrogeological Investigation
Stanley Road Landfill
Prepared for Bunbury-Harvey Regional Council
Talis Consultants Pty Ltd
8/663 Newcastle St
Leederville WA 6007
Ph: 1300 251 070
www.talisconsultants.com.au
ABN: 85 967 691 321
DOCUMENT CONTROL
Version File Ref Author Reviewer
0a TE14027 Desktop hydrogeological investigation. Version 1
Joanna Skiba Ronan Cullen
Copyright of this document or any part of this document remains with Talis Consultants Pty Ltd and
cannot be used, transferred or reproduced in any manner or form without prior written consent from
Talis Consultants Pty Ltd.

TE14027 Stanley Rd_desktop hydrogeological investigation.0a March 2015 | Page iii
Phase 1: Desktop Hydrogeological Investigation
Stanley Road Landfill
Prepared for Bunbury-Harvey Regional Council
Executive Summary Talis Consultants Pty Ltd (Talis) was engaged by Bunbury-Harvey Regional Council (BHRC) to
conduct a Phase 1 Desktop Hydrogeological Investigation for the Stanley Road Landfill
located at 51 Stanley Road, Wellesley, Western Australia (the Site) located approximately 14
km north-east of Bunbury.
The purpose of this work was due to the Department of Environment Regulation’s (DER)
proposed licence amendment which states “The Licensee shall undertake sufficient
groundwater investigations to determine the extent and severity of groundwater impacts
from landfilling undertaken at the premises (past, present and future). A detailed site
investigation report shall be provided to the CEO. The DSI shall include a detailed source-
pathway-receptor conceptual site model and risk assessment.”
A landfill licensing requirement is in place which requires groundwater monitoring to be
conducted on a periodical basis (both quarterly and annually) for various analytes across a
network of 10 paired groundwater wells at the Site. Groundwater sampling and reporting
has been conducted by GHD since 2005. In order to understand groundwater chemistry at
the Site, Talis reviewed groundwater monitoring reports for a period between January 2011
and October 2014.
The Site is located within Kemerton Industrial area with surrounding landuses including
Kemerton Industrial area buffer zone to the north, vegetation/pastoral land to the east, sand
extraction and Class I landfill to the south and a sand mine to the west. While a detailed site
history assessment was not completed, it was identified that the site historically operated as a
sand mine, with landfilling commencing in 1990. The landfill cell is unlined with no
engineered leachate management system. Groundwater monitoring results indicate that
contaminants have been leaching into groundwater beneath the site.
The closest sensitive receptors to the Site include the Brunswick River located approximately
500 m south of the southern site boundary, Wellesley River approximately 860 m east from the
eastern site boundary and residential properties located approximately 800 m west from the
site.
It was identified that two aquifers are located at the site, comprising a ‘shallow’ and ‘deep’
aquifer. Groundwater flow within the shallow aquifer was generally towards the north-
west/north and south within the deeper aquifer (towards the Brunswick River). While it was
considered that the two aquifers were separated by an intact low permeability clay
aquiclude. The aquiclude barrier is recognised to prevent migration of contamination
between the two aquifers, however over a long period of time, there is potential for
migration between the shallow and deep aquifer, however some stripping of contaminants
generally occurs within the acuiclude via cation exchange.
Licensing requirements varied across the years, which have resulted in data gaps in certain
analytes over the monitoring periods. It was reported that polyaromcatic hydrocarbons,
organochlorine pesticides, organophosphate pesticides, polychlorobiphenyls and nitate
were below adopted assessment criteria at each well during each sampling round.
Elevated concentrations of toluene, total recoverable hydrocarbons C10-C36, and metals
comprising aluminium, chromium, copper, iron, manganese, nickel, and zinc exceeded

TE14027 Stanley Rd_desktop hydrogeological investigation.0a March 2015 | Page iv
Phase 1: Desktop Hydrogeological Investigation
Stanley Road Landfill
Prepared for Bunbury-Harvey Regional Council
adopted assessment criteria periodically over the monitoring rounds. In addition, while
exceedances were identified, exceedances were not reported at each well during each
sampling round. It needs to be noted that concentrations of contaminants of concern were
highly variable with little or no consistency across the site over the monitoring rounds. Based
on experience, Talis generally sees trends in relation to contamination arising from landfills
which is not evident at the Site.
Based on elevated concentrations of ammonia, ammonical nitrogen and total nitrogen, it
was evident that groundwater beneath the Site was impacted by landfill leachate. While
the Site may be contributing to elevated concentrations, given groundwater within the
shallow aquifer is flowing in a north-westerly/northerly direction, the Class I landfill located
directly to the south of the Site may be contributing to groundwater impacts. This is
assumption is based on exceedances in adopted assessment criteria for some potential
contaminants of concern (PCOCs) at the shallow wells GQ1 and GQ6 located within the
south-western portion of the Site and are considered to be up-hydraulic gradient of the
landfill Site. BHRC proposes to install a best practice environmental management (BPEM)
standard capping layer as part of the closure and rehabilitation of the current landfill. This
engineered capping system will dramatically reduce the generation of leachate through the
minimisation of rainfall seepage into the waste mass. The inclusion of the low permeability
capping layer (either geosynthetic clay liner) will in theory reduce the leachate from
entering groundwater. It is considered that the source of contamination will be reduced
over time which will result in impacts to groundwater to be significantly reduced and the risk
to sensitive receptors similarly decreases.
While the desktop hydrogeological investigation has explored groundwater conditions at the
site for a period of four years, better definition of the groundwater profiles and potential
sources of contamination are needed to be identified to wholly understand what the
hydrogeology at the site.

TE14027 Stanley Rd_desktop hydrogeological investigation.0a March 2015 | Page v
Phase 1: Desktop Hydrogeological Investigation
Stanley Road Landfill
Prepared for Bunbury-Harvey Regional Council
Table of contents Executive Summary ............................................................................................................................. iii
1 Introduction .................................................................................................................................... 1
1.1 Background ................................................................................................................................ 1
1.1.1 Location .................................................................................................................................. 1
1.1.2 Surrounding landuse ............................................................................................................. 1
1.1.3 Historical land use .................................................................................................................. 2
1.1.4 Landfill design......................................................................................................................... 2
1.1.5 Licence .................................................................................................................................... 2
1.1.6 Licence Improvement Requirement ................................................................................. 2
1.1.7 Purpose of this work .............................................................................................................. 3
1.2 Historical Reports Reviewed .................................................................................................... 3
2 Climate, Topography, Geology and Hydrogeology ................................................................. 5
2.1 Climate ........................................................................................................................................ 5
2.2 Topography ................................................................................................................................ 5
2.3 Geology....................................................................................................................................... 6
2.3.1 Regional .................................................................................................................................. 6
2.3.2 Local ........................................................................................................................................ 6
2.4 Hydrology and Hydrogeology ................................................................................................ 8
2.4.1 Surface water ......................................................................................................................... 8
2.4.2 Groundwater .......................................................................................................................... 8
2.4.3 Groundwater flow direction ................................................................................................ 9
2.4.4 WIR bore search .................................................................................................................. 10
2.4.5 Beneficial uses of groundwater ........................................................................................ 10
3 Previous Groundwater Monitoring Data ................................................................................... 11
3.1 Assessment Criteria .................................................................................................................. 11
3.2 Groundwater depth fluctuations ......................................................................................... 11

TE14027 Stanley Rd_desktop hydrogeological investigation.0a March 2015 | Page vi
Phase 1: Desktop Hydrogeological Investigation
Stanley Road Landfill
Prepared for Bunbury-Harvey Regional Council
3.3 Groundwater flow direction .................................................................................................. 12
3.3.1 General Field Observation ................................................................................................ 13
3.4 Laboratory Results ................................................................................................................... 14
3.4.1 Metals .................................................................................................................................... 14
3.4.2 BTEX ........................................................................................................................................ 25
3.4.3 PAH ......................................................................................................................................... 29
3.4.4 TRH .......................................................................................................................................... 30
3.4.5 Nutrients ................................................................................................................................. 31
3.4.6 Major Cations ....................................................................................................................... 36
3.4.7 Major Anions ......................................................................................................................... 39
3.4.8 Pesticides .............................................................................................................................. 42
3.4.9 Polychlorinated Biphenyls .................................................................................................. 42
3.4.10 Physical Parameters ........................................................................................................ 42
4 Summary of Key Findings ........................................................................................................... 46
4.1 Metals......................................................................................................................................... 46
4.2 Hydrocarbons ........................................................................................................................... 48
4.3 Nutrients ..................................................................................................................................... 48
4.4 Major Anions ............................................................................................................................. 49
4.5 Major Cations ........................................................................................................................... 50
4.6 Pesticides and PCBs ................................................................................................................ 50
4.7 GQ7 and GQ8 .......................................................................................................................... 50
5 Conceptual Site Model ............................................................................................................... 52
5.1 Contamination Sources.......................................................................................................... 52
5.1.1 Primary sources of contamination ................................................................................... 52
5.1.2 Secondary sources of contamination ............................................................................. 52
5.2 Potential Contaminants of Concern ................................................................................... 52
5.2.1 Exceedances ....................................................................................................................... 53
5.3 Transportation Mechanisms ................................................................................................... 55
5.4 Exposure Pathways .................................................................................................................. 55

TE14027 Stanley Rd_desktop hydrogeological investigation.0a March 2015 | Page vii
Phase 1: Desktop Hydrogeological Investigation
Stanley Road Landfill
Prepared for Bunbury-Harvey Regional Council
5.5 Receptors .................................................................................................................................. 55
5.6 Exposure Pathways and Risk Assessment ............................................................................ 55
6 Landfill Capping ........................................................................................................................... 59
7 Conclusions .................................................................................................................................. 61
8 Recommendations ...................................................................................................................... 65
Tables Table 1-1: Prescribed Premises Categories
Table 1-2: Groundwater Monitoring Requirements
Table 2-1: Groundwater monitoring well IDs
Table 3-1: Water Quality field observations – Deep Wells
Table 3-2: Water Quality field observations – Shallow Wells
Table 4-1: Metal Exceedances
Table 4-2: Nutrient exceedances
Table 5-1: PCoCs
Table 5-2: Exceedances in groundwater – October 2014
Table 5-3 Risk Assessment – groundwater
Table 6-1 Risk Assessment – groundwater: post closure
Figures Figure 1: Locality Plan
Figure 2: Surrounding landuse
Figure 3: Groundwater well locations
Figure 4: Conceptual Site Model

TE14027 Stanley Rd_desktop hydrogeological investigation.0a March 2015 | Page viii
Phase 1: Desktop Hydrogeological Investigation
Stanley Road Landfill
Prepared for Bunbury-Harvey Regional Council
Charts Chart 1 Climate
Chart 2 Standing water levels
Chart 3 Aluminium Concentrations
Chart 4 Arsenic concentrations
Chart 5 Cadmium concentrations
Chart 6 Chromium concentrations
Chart 7 Copper concentrations
Chart 8 Iron concentrations
Chart 9 Lead concentrations
Chart 10 Manganese concentrations
Chart 11 Mercury concentrations
Chart 12 Nickel concentrations
Chart 13 Selenium concentrations
Chart 14 Zinc concentrations
Chart 15 Benzene concentrations
Chart 16 Toluene concentrations
Chart 17 Ethylbenzene concentrations
Chart 18 Xylenes concentrations
Chart 19 Naphthalene concentrations
Chart 20 BaP concentrations
Chart 21 TRH C10-C36 concentrations
Chart 22 Ammonia concentrations
Chart 23 Ammonia-Nitrogen concentrations
Chart 24 Total Nitrogen concentrations
Chart 25 Nitrate concentrations
Chart 26 Phosphorus concentrations
Chart 27 COD concentrations

TE14027 Stanley Rd_desktop hydrogeological investigation.0a March 2015 | Page ix
Phase 1: Desktop Hydrogeological Investigation
Stanley Road Landfill
Prepared for Bunbury-Harvey Regional Council
Chart 28 Calcium concentrations
Chart 29 Magnesium concentrations
Chart 30 Sodium concentrations
Chart 31 Potassium concentrations
Chart 32 Chloride concentrations
Chart 33 Sulphate concentrations
Chart 34 Hardness/Alkalinity concentrations
Chart 35 pH concentrations
Chart 36 Conductivity concentrations
Chart 37 TDS concentrations
Chart 38 TOC concentrations
Diagrams Diagram 1 Bore logs
Appendices Appendix A: Groundwater Contour Plans

TE14027 Stanley Rd_desktop hydrogeological investigation.0a Month YYYY | Page 1
Phase 1: Desktop Hydrogeological Investigation
Stanley Road Landfill
Prepared for Bunbury-Harvey Regional Council
1 Introduction
Talis Consultants Pty Ltd (Talis) was engaged by Bunbury-Harvey Regional Council (BHRC) to
conduct a Phase 1 Desktop Hydrogeological Investigation for the Stanley Road Landfill
located at 51 Stanley Road, Wellesley Western Australia (WA) (the Site), located
approximately 14 km north-east of Bunbury.
A landfill licensing requirement is in place which requires groundwater monitoring to be
conducted on a periodical basis (both quarterly and annually) for various analytes. The
sampling and reporting has been conducted by GHD since 2005. As reported in the
reviewed GHD reports, impacts have been identified in the groundwater which are
considered to be associated with landfilling activities. As such, the Department of
Environment Regulation (DER) has requested additional environmental investigations be
completed to identify the extent of groundwater contamination, as specified within the
proposed DER licence amendment.
The amendment to the current licence condition IR5 states that ”The Licensee shall
undertake sufficient groundwater investigations to determine the extent and severity of
groundwater impacts from landfilling undertaken at the premises (past, present and future).
A detailed site investigation report shall be provided to the CEO. The DSI shall include a
detailed source-pathway[-receptor conceptual site model and risk assessment.”
To address the DER’s IR5 licence amendment, Talis has proposed a staged approach to the
investigation. This Phase 1 report will help understand groundwater chemistry at the Site
including trends and potential seasonal fluctuations in concentrations, a desktop review of
existing hydrogeological data/reports has been conducted including risk assessment. This
review will guide further work required by the DER and will be presented in a Phase 2
Hydrogeological Investigation.
1.1 Background
1.1.1 Location
BHRC operate the Stanley Road Landfill which is located in Wellesley approximately 14 km
north-east of Bunbury, to the west of Forrest Highway. The site itself is located within
Kemerton Industrial Park bushland buffer zone (see Figure 1).
1.1.2 Surrounding landuse
Adjacent land uses to the site include:
North – Kemerton Industrial area buffer zone (bushland including a wetland);
East – Vegetated land/pastoral land;
South – Sand extraction and Class I landfill operated by JW Cross & Sons; and
West – Sand extraction
The closest sensitive receptors to the site include the Brunswick River located approximately
500 m south of the southern site boundary, Wellesley River approximately 860 m east from the
Site boundary and residential properties located approximately 800 m west from the Site.

TE14027 Stanley Rd_desktop hydrogeological investigation.0a Month YYYY | Page 2
Phase 1: Desktop Hydrogeological Investigation
Stanley Road Landfill
Prepared for Bunbury-Harvey Regional Council
1.1.3 Historical land use
A detailed site history was not completed as part of the investigation, however it was
identified that the site historically operated as a sand mine, with landfilling commencing in
1990.
1.1.4 Landfill design
The landfill cells are old and were established prior to the adoption of modern landfill
engineering guidelines. Therefore, the current landfill cells are unlined with no engineered
leachate management system. Groundwater monitoring results indicate that contaminants
have been leaching into groundwater beneath the Site.
1.1.5 Licence
Stanley Road Landfill is licensed under Part V of the Environmental Protection Act 1986 (EP
Act) Licence Number L7067/1997/14 as Prescribed Premises under EP Act 1987 categories 62
and 64 as detailed in Table 1-1 below.
Table 1-1: Prescribed Premises Categories
Category
number
Category description Category
production
or design capacity
Approved
Premises
production or
design capacity
62 Solid waste depot: premises on which waste is stored, or sorted, pending final disposal or re-use.
500 tonnes or more per year
10,000 tonnes per annual period
64 Class II or III putrescible landfill site: Premises on which waste (as determined by reference to the waste type set out in the document entitled “Landfill Waste Classification and Waste Definitions 1996” published by the Chief Executive Officer and as amended from time to time) is accepted for burial.
20 tonnes or more per year
50,000 tonnes per annual period
Reference: DER Licence dated 8 December 2014
1.1.6 Licence Improvement Requirement
Given that groundwater contamination was previously identified during one or more
groundwater monitoring events, the Licence requirement IR 5 states that “The Licensee shall
undertake sufficient groundwater investigations to determine the extent and severity of
groundwater impacts from landfilling undertaken at the premises (past, present and future).
A detailed site investigation report shall be provided to the CEO. The DSI shall include a
detailed source-pathway-receptor conceptual site model and risk assessment”.
This report has been prepared to understand historical and current groundwater conditions
at the Site, source-pathway-receptor risk assessment and identify data gaps which will guide
future works at the Site. The BHRC has submitted a Licence Amendment to revise IR5
condition to reflect the proposed future works which are outlined within this report.

TE14027 Stanley Rd_desktop hydrogeological investigation.0a Month YYYY | Page 3
Phase 1: Desktop Hydrogeological Investigation
Stanley Road Landfill
Prepared for Bunbury-Harvey Regional Council
1.1.6.1 Groundwater monitoring regime
In addition to the abovementioned IR5 requirement of the Licence, groundwater monitoring
of certain analytes are required on a quarterly and annual basis; these comprise:
Table 1-2: Groundwater Monitoring Requirements
Quarterly Annually
Chemical oxygen demand (COD) Phenols
Nitrate-nitrogen Polyaromatic hydrocarbons (PAH)
Ammonia-nitrogen Organochlorine pesticides (OCP)
Total nitrogen Organophosphate pesticides (OPP)
Total phosphorus; Polychlorinated biphenyls (PCB)
Total dissolved solids (TDS) Atrazine
Total organic carbon (TOC) Benzene, toluene, ethylbenzene, xylenes (BTEX)
Major anions and cations – calcium, magnesium, potassium, sodium, chloride, bicarbonate and sulphate
Total petroleum hydrocarbons (TPH)
Heavy metals – aluminium, arsenic, cadmium, chromium, copper, iron (total), lead, manganese, mercury, nickel, selenium and zinc
Trichlorethylene/Perchloroethylene
In addition to the above analyses, in field measurement of standing water levels (SWLs),
electrical conductivity (EC), pH and dissolved oxygen (DO) are required.
GHD Pty Ltd (GHD) has been conducting both quarterly and annual monitoring events
including the reporting, as per the Licence requirement since 2005.
1.1.7 Purpose of this work
In relation to the Licence requirements specified above, Talis has prepared this report which
evaluates the available groundwater data comprising groundwater monitoring events over
the last four years (between 2011 and 2014 inclusive). Based on the current information, this
report aims to identify trends in groundwater flow and contamination, present the findings
utilising a conceptual site model identifying source-pathway-receptors for the identified
contamination. In addition, Talis has reviewed the implications of the proposed capping
works at the landfill sites to minimise the impacts to groundwater. The findings from this report
will therefore guide the requirements for a Phase 2 Hydrogeological Investigation.
1.2 Historical Reports Reviewed
Groundwater monitoring has been carried out at the Site for a number of years. As part of
this Phase 1 Desktop Hydrogeological Investigation, Talis has reviewed the following reports:
Groundwater Assessment, Stanley Road Waste Management Facility (ASK, 2013).
Stanley Road Waste Disposal Site – Lot 45 Stanley Road, Wellesley WA, Prescribed
Licence No.L7067/1997/13, Quarterly Groundwater Monitoring Event Report –
October 2014 (GHD, 2014a);

TE14027 Stanley Rd_desktop hydrogeological investigation.0a Month YYYY | Page 4
Phase 1: Desktop Hydrogeological Investigation
Stanley Road Landfill
Prepared for Bunbury-Harvey Regional Council
Stanley Road Waste Disposal Site – Lot 45 Stanley Road, Wellesley WA, Prescribed
Licence No. L7067/1997/13, Quarterly Groundwater Monitoring Event Report – July
2014 (GHD, 2014b);
Stanley Road Waste Disposal Site – Lot 45 Stanley Road, Wellesley WA, Prescribed
Licence No. L706/1997/13, Quarterly Groundwater Monitoring Event Report – April
2014; (GHD, 2014c);
Stanley Road Waste Disposal Site – Lot 45 Stanley Road, Wellesley WA, Prescribed
Licence No. L7067/1997/13, Quarterly Groundwater Monitoring Event Report –
January 2014; (GHD, 2014d);
Stanley Road Waste Disposal Site – Lot 45 Stanley Road, Wellesley WA, Prescribed
Licence No. L7067/1997/12 (October 2013) (GHD, 2013a);
Stanley Road Waste Disposal Site – Lot 45 Stanley Road, Wellesley WA, Prescribed
Licence No. L7067/1997/12, Quarterly Groundwater Monitoring Event Report – July
2013 (GHD, 2013b);
Stanley Road Waste Disposal Site – Lot 45 Stanley Road, Wellesley WA, Prescribed
Licence No. L7067/1997/12, Quarterly Groundwater Monitoring Event Report – April
2013 (GHD, 2013c);
Stanley Road Waste Disposal Site – Lot 45 Stanley Road, Wellesley WA, Prescribed
Licence No. L7067/1997/12 (January 2014)(GHD, 2013d);
Stanley Road Waste Disposal Site – Lot 45 Stanley Road, Wellesley WA, Prescribed
Licence No. L7067/1997/12, Quarterly Groundwater Monitoring Event Report –
January 2013 (GHD, 2013d);
Stanley Road Waste Disposal Site – Lot 45 Stanley Road, Wellesley WA, Prescribed
Licence No. L7067/1997/12, Quarterly Groundwater Monitoring Event – October 2012
(GHD, December 2012) (GHD, 2012a);
Stanley Road Waste Disposal Site – Lot 45 Stanley Road, Wellesley WA, Prescribed
Licence No. L7067/1997/12, Quarterly Groundwater Monitoring Event – July 2012
(GHD, September 2012) (GHD, 2012b);
Report for Stanley Road Landfill Facility Quarterly Groundwater Monitoring, April 2012
Results (GHD, June 2012) (GHD, 2012c);
Report for Stanley Road Landfill Facility, January 2012 Groundwater Monitoring Results
(GHD, January 2012) (GHD, 2012d);
Report for Stanley Road Landfill Facility, October 2011 Groundwater Monitoring
Results (GHD, October 2011) (GHD, 2011a);
Report for Stanley Road Landfill, Groundwater Monitoring (GHD, July 2011) (GHD,
2011b);
Report for Stanley Road Landfill, Quarterly Groundwater Monitoring Results (GHD, April
2011) (GHD, 2011c); and
Report for Stanley Road Landfill, Quarterly Groundwater Monitoring Results (GHD,
January 2011) (GHD, 2011d).
The findings are further discussed in detail in Section 3.

TE14027 Stanley Rd_desktop hydrogeological investigation.0a Month YYYY | Page 5
Phase 1: Desktop Hydrogeological Investigation
Stanley Road Landfill
Prepared for Bunbury-Harvey Regional Council
2 Climate, Topography, Geology and Hydrogeology
2.1 Climate
The Site is located within a region that experiences a Mediterranean climate, with warm dry
summers and cool wet winters. Chart 1 below shows the mean monthly rainfall and mean
maximum temperatures reported by the Bureau of Meteorology (BoM) on their website. The
mean rainfall data is for the period 1995-2015 and the mean maximum temperature is for the
period 1995-2014.
Chart 1 Climate
Reference: BOM website, temperature collected 1995-2014 and rainfall collected 1995-2015
2.2 Topography
Landgate is the Statutory Authority that maintains the States’ official register of land
ownership and survey information. Utilising topographical contour geospatial data sourced
from Landgate it was observed that the Site sloped down from north-western corner to the
centre of the Site then back up towards the south. The north-western corner and south-
western portion of the Site sit at 20 mAHD, with the remainder of the Site sitting at 15 mAHD
with several spot heights at 12 mAHD and 20 mAHD observed within the eastern portion of
the Site.
To the south, north-west and north-east of the main landfill mass there are a number of lined
lagoons which from the topography appear to be linked to the shallow aquifer. They are
likely to influence the distribution of groundwater profiles in the immediate area of the landfill.
It was observed that the topography adjacent to the Site was similar to that of the Site. The
areas surrounding the Site (in each direction) sit at 15 mAHD and 20 mAHD within the vicinity
of the south-western portion of the Site. Several spot heights were observed to the south of
the Site ranging between 14 mAHD and 20 mAHD, whilst the area to the north majority is
0
20
40
60
80
100
120
140
160
180
200
JAN FEB MAR APR MAY JUN JUL AUG SEP OCT NOV DEC
Degrees Calcius Rainfall (mm)
Climate
Mean maximum temperature degrees Calcius Mean rainfall (mm)

TE14027 Stanley Rd_desktop hydrogeological investigation.0a Month YYYY | Page 6
Phase 1: Desktop Hydrogeological Investigation
Stanley Road Landfill
Prepared for Bunbury-Harvey Regional Council
recorded at approximately 15 mAHD with spot heights further north indicating a drop in
elevation to 10 mAHD and 14 mAHD.
Prior to landfilling and excavation activities, the natural topography of the Site was lowest
within the northern portion of the site (less than 15 mAHD), sloping up gently towards the
centre of the site (15 mAHD) and continuing to increase within the southern portion of the
site, not exceeding 20 mAHD (ASK, 2013). The natural topography decreases in a south-
easterly direction, towards the Brunswick and Wellesley River (ASK, 2013).
2.3 Geology
2.3.1 Regional
A review of the Department of Mines and Petroleum (DMP) Geological Map Series Collie
Sheet SI 50 – 6 with a scale of 1:250,000 (Wilde, SA &Walker IW, 1983) showed the geology at
the Site to comprise:
Qpa – Guildford Formation: alluvium (clay, loam, sand, gravel) variably lateritized and
podolized;
Qpb – Bassendean Sand: quartz sand (fixed dunes); and
Qts – Tamala Limestone: predominantly quartz sand.
2.3.2 Local
Driller’s logs were reviewed for groundwater well numbers GQ7-GQ10 provided in GHD 2014b
report. It was identified that the geology at the Site to be consistent with the regional
geology as per DMP 1:250,000 map, which comprised alternating layers of sand and clays,
with sand underlain by coffee rock within 4.5 m of the surface. The confining layer of clay
between the shallow and deep aquifers varied between locations, as shown in Diagram
1below.

TE14027 Stanley Rd_desktop hydrogeological investigation.0a Month YYYY | Page 7
Phase 1: Desktop Hydrogeological Investigation
Stanley Road Landfill
Prepared for Bunbury-Harvey Regional Council
Diagram 1 Bore logs
The shallow groundwater wells GQ7S, GQ8S and GQ9S were installed to 14 m, and GQ10S
was installed to 12 m. Deep groundwater wells GQ7D-GQ10D were installed to 24 m.
Based on the drillers logs provided in GHD 2014b, the confining layer between the shallow
and deep aquifer at location GQ7 was between 9.5 m and 10.5 m. It appears that the
shallow well (GQ7S) was installed to too deep, targeting both the shallow and deep aquifers.
Metres

TE14027 Stanley Rd_desktop hydrogeological investigation.0a Month YYYY | Page 8
Phase 1: Desktop Hydrogeological Investigation
Stanley Road Landfill
Prepared for Bunbury-Harvey Regional Council
2.4 Hydrology and Hydrogeology
2.4.1 Surface water
The nearest surface water body/sensitive receptor is the Brunswick River is located
approximately 500 m south from the south-eastern portion of the Site. Brunswick River is
located to the south and adjoins the Wellesley River to the south-east/east of the Site (as
shown in Figure 2). The rivers flow from an easterly direction discharge into the Indian Ocean
via an estuary, located approximately 9 km south-west of the Site.
2.4.2 Groundwater
A review of the Department of Water (DoW) Bunbury and South West Coastal groundwater
areas subarea reference sheets, Plan for the South West groundwater area allocation plan
(DoW, 2009) identified that the Superficial formation within the vicinity of the Site consists of
Tamala Limestone, Guildford formation and Bassendean Sands. The Superficial Aquifer is
said to consist predominantly of clays and sands to the east and limestone to the west,
ranging between 20-40 m deep across the aquifer. This is consistent with the
hydrogeological investigation conducted by GHD (2008), which identified that the
hydrogeology in the area comprised an unconfined aquifer and a series of confined aquifers
which were resultant of alternating sand and clay layers which make up the superficial
formations at the Site. It is considered that the aquifer may be hydraulically connected
within the underlying Leederville Aquifer (DoW, 2009).
The hydrogeological regime of the superficial formations are influenced by topography,
drainage and surface geology “giving rise to the potential for groundwater mounding to
occur in areas of higher ground (AGC Woodward-Clyde 1993), such as the Mialla
Groundwater Mound (located east of Binningup) and between the Old Coast Road and the
Wellesley River (Hammon 1989)” which is located approximately 10 km north of the Site
(DoW, 2007).
The superficial aquifer is recharged though rainfall events, however large amounts of
infiltration into the aquifer is lost due to evapotranspiration from wetlands and areas where
the watertable is shallow. It’s been estimated by Aquaterra and ATA Environmental (2002)
that recharge into the aquifer ranges between 5-40% of the annual rainfall (DoW, 2007).
Resultant from the annual rainfall events, seasonal variations in the watertable are
approximately 1-2 m which is closely correlated (DoW, 2007). This is evident in groundwater
gauging at the Site. With an assumption that mean annual rainfall is 800 mm, with 40%
infiltration (320 mm) with porosity of 0.2, groundwater fluctuations would result in
approximately 1.6 m, which is consistent with DoW (2007) data.
DoW (2009) recognises that groundwater in the area moves from Mialla mound from a west,
south west and east towards the Wellesley River, and forms part of the Myalup flow system.
Groundwater within the vicinity of the Site discharges locally to watercourses such as the
Wellesley River, wetlands and swamps. Total dissolved solids (TDS) concentrations to the west
of Wellesley River is generally fresh to marginal ranging between 250 and 1,500 mg/L and
generally brackish with TDS concentrations greater than 1,500 mg/L to the east (DoW, 2007).
Based on groundwater gauging data collected by GHD between January 2011 and
October 2014, the reduced level (RL) standing water levels (SWLs) within the shallow aquifer

TE14027 Stanley Rd_desktop hydrogeological investigation.0a Month YYYY | Page 9
Phase 1: Desktop Hydrogeological Investigation
Stanley Road Landfill
Prepared for Bunbury-Harvey Regional Council
fluctuated between 9.030 m and 14.749 m Australian Height Datum (AHD) and between
3.810 m and 12.335 m AHD within the deep aquifer.
2.4.2.1 Groundwater monitoring wells
A network of 20 groundwater monitoring wells are currently located at the Site. The
groundwater wells are distributed in pairs comprising one shallow and on deep groundwater
well at 10 locations across the Site (see Figure 3). Prior to January 2014, the network
comprised of six pairs only and were ascribed different identifications (groundwater well IDs),
for consistency, GHD had re-named the network of groundwater wells and these are listed
below in Table 2-1.
Table 2-1: Groundwater monitoring well IDs
Previous well ID
Current well ID1
Shallow Aquifer (S)
Deep Aquifer (D)
Northings2 Eastings2 TOC (AHD)2
GQ1 SWS-R SWD 50383645 6320980 13.85
GQ2 1S 1D 50383948 6320967 15.23
GQ3 SES-R SED 50384122 6320978 17.33
GQ4 2S 2D 50384921 6321431 17.56
GQ5 ES ED 50385004 6321720 17.43
GQ6 WS-R WD 50383645 6320980 20.97
GQ7 NA/Installed 31/01/14 - - -
GQ8 NA/Installed 31/01/14 - - -
GQ9 NA/Installed 31/01/14 - - -
GQ10 NA/Installed 31/01/14 - - -
1deep wells are denoted with a ‘D’ at the end and shallow wells with an ’S’ at the end. 2data obtained from ASK (2013) report (survey done using hand held GPS) – not accurate, ‘R’
replacement wells installed in 2010 - wells not surveyed
2.4.3 Groundwater flow direction
The general groundwater flow direction in the area is in a westerly direction from the Darling
Scarp, with the exception of eastern half of the Mialla Groundwater Mound where
groundwater flows in an easterly direction towards the Wellesley River (DoW, 2007).
Talis has prepared groundwater contour plans based on groundwater gauging data
collected by GHD between 2011 and 2014. Groundwater contour plans were produced for
both the shallow and deep aquifers. It was assumed that the locations of the groundwater
wells provided in the figures within the GHD reports (2011-2014) and the top of casing (TOC)
reported for GQ1-GQ6 was correct. No survey data was provided for wells GQ7-GQ10 and
were therefore left out of the contour plans.
2.4.3.1 Shallow aquifer
The groundwater contour plans for gauging data collected between 2011 and 2014 showed
the general groundwater flow direction within the shallow aquifer to be flowing in a westerly
direction within the south western portion of the Site and north, north-west within the
remainder of the Site, see Appendix A. It is considered that the localised groundwater flow

TE14027 Stanley Rd_desktop hydrogeological investigation.0a Month YYYY | Page 10
Phase 1: Desktop Hydrogeological Investigation
Stanley Road Landfill
Prepared for Bunbury-Harvey Regional Council
direction to the west may be due to groundwater use via production bore which is located
to the west of the Site.
2.4.3.2 Deep aquifer
The general groundwater flow direction within the deep aquifer was generally in a southerly
direction. Groundwater flow within the south-western corner of the Site appeared to be
flowing in a south-easterly direction, with steep groundwater contours between wells GQ1D
and GQ6D (see Appendix A). The groundwater flow within this aquifer is towards the
Brunswick River. The significant drop in groundwater level within the south-western portion of
the Site, from GQ6 to GQ1 was considered to be associated with the use of groundwater via
production bore located within the vicinity of these wells, affecting groundwater levels.
2.4.4 WIR bore search
The DoW Water Information Reporting (WIR) bore search was conducted on 23 January 2015
which showed a total 19 registered bores are located within 1 km radius of the Site, of which
one is located within the south western portion of the Site (near the gate house). A review of
ASK’s Groundwater Assessment, Stanley Road Waste Management Facility report (ASK, 2013)
identified that three of the 19 identified bores were production bores. The production bores
were located at the Site to the west (Catalano Pty Ltd), one to the south at the Class I landfill
(JW Cross & Sons) and one located directly on Site within the vicinity of the gate house.
Based on the outcomes of the WIR bore search, the majority of the registered bores were
located to the west of the Site. No additional information in relation to these groundwater
bores was provided within the search.
2.4.5 Beneficial uses of groundwater
Where groundwater quality is assessed, the most appropriate assessment levels depend on
the beneficial uses of groundwater itself as well as the discharge location. The DER
Assessment and management of contaminated sites (December, 2014) guidelines are
consistent with the National Environmental Protection Measure (NEPM) 2013, with
environmental values of water relevant to assessment of Site contamination in WA including:
Groundwater dependent ecosystems;
Aquatic ecosystems (fresh, marine and estuarine waters);
Drinking water (e.g. direct consumption but also applicable to bathing, filling
swimming pools, food preparation or cooking);
Non-potable use of water (e.g. irrigation of gardens or parks and reserves, washing
cars and clothes, flushing toilets);
Recreational use (e.g. water sports, swimming);
Agricultural use (e.g. stock water and commercial irrigation); and/or
Industrial use (e.g. process water).
Based on Talis’ current understanding of the Site and surrounding land uses in the area, the
following Site specific beneficial uses of groundwater have been considered:
Drinking water (private domestic groundwater bores located within 1 km of the Site);
Non-potable use (private domestic groundwater bores located within 1 km of the
Site);
Agricultural use (agricultural users of Brunswick River for irrigation); and
Industrial use (production bores located at and within the vicinity of 1 km of the Site).

TE14027 Stanley Rd_desktop hydrogeological investigation.0a Month YYYY | Page 11
Phase 1: Desktop Hydrogeological Investigation
Stanley Road Landfill
Prepared for Bunbury-Harvey Regional Council
3 Previous Groundwater Monitoring Data
As previously specified in Section 1.2, quarterly groundwater monitoring reports compiled by
GHD were reviewed for the period January 2011 to October 2014, this section describes
trends and fluctuations in groundwater concentrations of potential contaminants of concern
(PCoCs) over this period.
3.1 Assessment Criteria
Whilst the groundwater results within the GHD reports were compared to relevant assessment
criteria existing at the time of writing, the DER had since updated the relevant guidelines and
assessment criteria. Talis has therefore compared groundwater data obtained from these
GHD reports to the most recent groundwater assessment criteria as specified within the
current DER (2014) guidelines which are based on the updated NEPM 2013 guidelines and
derived from a number of sources, these include:
DER 2014 Fresh Water, derived from Australia and New Zealand Environment
Conservation Council (ANZECC) & Agriculture Resource Management Council of
Australia and New Zealand (ARMCANZ) 2000 Fresh Water;
o This assessment criteria was adopted due to the Site being located within a
fresh-water system rather than marine water, within the vicinity of fresh water
rivers (Brunswick and Wellesley).
DER 2014 Drinking Water, derived from Australian Drinking Water Guidelines (ADWG)
2000 Drinking Water Health Value;
o This assessment criteria was adopted due to a number of registered
groundwater bores being located within the vicinity (<1 km) of the Site, which
may potentially be used as a source of drinking water.
DER 2014 Non-Potable Groundwater Use, derived from Department of Health (DoH)
2014 Non-Potable Groundwater Use (NPUG); and
o This assessment criteria was adopted due to a number of groundwater bores
being located within the vicinity (<1km) of the Site, which may be utilised for
non-potable sources i.e. watering gardens, filling swimming pools, washing
cars.
DER 2014 Long-term Irrigation water, derived from ANZECC & ARMCANZ (2000) Long-
term Irrigation Water.
o This assessment criteria was adopted due to several production bores located
within the vicinity (<1 km) of the Site, which may be used for industrial
irrigation; and given that surface water abstraction from the Brunswick River
for irrigation purposes also occurs (Beckwirth Environmental, 2006). To be more
conservative, Talis has adopted Long-term Irrigation water criteria.
Groundwater data trends.
3.2 Groundwater depth fluctuations
Groundwater within both the shallow and deep aquifers was considered to be generally
consistent over the gauging period. Groundwater levels dropped significantly within the
shallow well GQ5S (ES) and rose at GQ4S 2S in October 2012. During the same period

TE14027 Stanley Rd_desktop hydrogeological investigation.0a Month YYYY | Page 12
Phase 1: Desktop Hydrogeological Investigation
Stanley Road Landfill
Prepared for Bunbury-Harvey Regional Council
(October 2012) groundwater levels rose significantly at GQ5D (ED). In general groundwater
levels were lower in April and higher in October see Chart 2 below.
Chart 2 Standing water levels
3.3 Groundwater flow direction
Groundwater contour plans prepared using limited survey data showed the general
groundwater flow within the shallow aquifer to be in a westerly direction within the south
western portion of the Site and north, north-west within the remainder of the Site, Appendix
A. It is considered that the localised groundwater flow direction to the west may be due to
groundwater use via production bore which is located to the west of the Site.
The general groundwater flow direction within the deep aquifer was generally in a southerly
direction. Groundwater flow within the south-western corner of the Site appeared to be
flowing in a south-easterly direction, with steep groundwater contours between wells GQ1
0
2
4
6
8
10
12
14Ja
n-1
1
Ap
r-1
1
Jul-
11
Oct
-11
Jan
-12
Ap
r-1
2
Jul-
12
Oct
-12
Jan
-13
Ap
r-1
3
Jul-
13
Oct
-13
Jan
-14
Ap
r-1
4
Jul-
14
Oct
-14
m below TOC
Standing Water Levels - Shallow Wells
1S/GQ2S
2S/GQ4S
WS-R/GQ6S
ES/GQ5S
SES-R/GQ3S
GQ7S
GQ8S
GQ9S
GQ10S
0
2
4
6
8
10
12
14
16
18
Jan
-11
Ap
r-1
1
Jul-
11
Oct
-11
Jan
-12
Ap
r-1
2
Jul-
12
Oct
-12
Jan
-13
Ap
r-1
3
Jul-
13
Oct
-13
Jan
-14
Ap
r-1
4
Jul-
14
Oct
-14
m below TOC
Standing Water Levels - Deep Wells
1D/GQ2D
2D/GQ4D
WD/GQ6D
ED/GQ5D
SWD/GQ1D
GQ7D
GQ8D
GQ9D
GQ10D

TE14027 Stanley Rd_desktop hydrogeological investigation.0a Month YYYY | Page 13
Phase 1: Desktop Hydrogeological Investigation
Stanley Road Landfill
Prepared for Bunbury-Harvey Regional Council
and GQ6 (Appendix A). The groundwater flow within this aquifer is towards the Brunswick
River. The significant drop in groundwater level within the south-western portion of the Site,
from GQ6 to GQ1 may be associated with the use of groundwater via a production bore
located within the vicinity of these wells, affecting groundwater levels.
From the topographic survey there appears to be depressions in the terrain which during the
wetter periods appear to flood. However, from a cursory examination of the groundwater
data this ponding is likely to be closely associated with a rise in groundwater. As such these
depressions would act like sumps attracting the groundwater towards them. In doing so they
could significantly influence the groundwater profile.
3.3.1 General Field Observation
Table 3-1 and Table 3-2 below identifies general water quality field observations recorded by
GHD during groundwater sampling conducted between April 2013 and October 2014 (no
observations were recorded in prior reports reviewed).
Table 3-1: Water Quality field observations – Deep Wells
Date GQ1/
SWD
GQ2
/1D
GQ3/
SED
GQ4/
2D
GQ5/
ED
GQ6/
WD
GQ7 GQ8 GQ9 GQ10
Apr 13 NA O NA O O H - - - -
Jul 13 H NA NA O O H - - - -
Oct 13 SH O NA SO NA O - - - -
Jan 14 H SO O NA SO H - - - -
Apr 14 H NA O NA O H O O NA O
Jul 14 O O O O O O O O O O
Oct 14 O/H NA O NA SO O/H O O O NA
Note: SO – slight organic O – organic NA – no odour H – hydrocarbon odour - well not existing
O – highly organic O/H – organic/hydrocarbon
Table 3-2: Water Quality field observations – Shallow Wells
Date GQ1/
SWS-R
GQ2
/1S
GQ3/
SES-R
GQ4/
2S
GQ5/
ES
GQ6/
WS-R
GQ7 GQ8 GQ9 GQ10
Apr 13 O O O O O H - - - -
Jul 13 NA NA NA O O H - - - -
Oct 13 SH O SO O O O - - - -
Jan 14 NA O O O SO H - - - -
Apr 14 O O O O SO O O O O O
Jul 14 O O O O O O O O O O
Oct 14 SO NA SO O NA O O O NA O
Note: SO – slight organic O – organic NA – no odour H – hydrocarbon odour - well not existing
O – highly organic O/H – organic/hydrocarbon
As per Table 3-1 and Table 3-2, water quality field observations showed:
Predominantly organic odours were noted within the shallow wells, and a mixture of
hydrocarbon and organic odours within the deep wells;

TE14027 Stanley Rd_desktop hydrogeological investigation.0a Month YYYY | Page 14
Phase 1: Desktop Hydrogeological Investigation
Stanley Road Landfill
Prepared for Bunbury-Harvey Regional Council
During the various sampling rounds, hydrocarbon odours were only observed at wells
GQ6 (shallow), GQ1 (deep) and GQ6 (shallow and deep); and
During the last round of sampling no odours were observed at both shallow and deep
wells GQ2, shallow well GQ5 and GQ9 and deep wells GQ4 and GQ10.
Based on the above water quality field observations, it appears that groundwater at all
locations has potentially been impacted by leachate resultant from decomposition of
organic material resulting in the observed organic odours and leaching of hydrocarbons at
GW1 and GQ6 (both shallow and deep) resulting in observed hydrocarbon odours. Given
groundwater flow within the shallow aquifer has been established to generally be in a north,
north-westerly direction, there is potential that the Class I landfill located directly south of the
site may contribute to groundwater contamination identified at the Site.
3.4 Laboratory Results
Laboratory analysis results for sampling rounds completed between January 2011 and
October 2014 are summaries below.
3.4.1 Metals
3.4.1.1 Aluminium
There were no laboratory analysis conducted for Aluminium concentrations prior to January
2014, as shown in Chart 3 below. Concentrations were below Long-term Irrigation (5 mg/L)
criteria at all well locations during each sampling round. Concentrations at GW3S (SES),
GQ4S (2S), GQ5S (ES) and GQ9S exceeded Drinking Water (Aesthetic Value 0.2 mg/L) and
NPUG (0.2 mg/L) during each sampling round. In addition, with the exception of GQ1D,
GQ2D, GQ4D, GQ6S, GQ6D, GQ9D all wells exceeded Fresh Waters (0.055 mg/L) at least
three or more sampling rounds. Exceedances identified during the last round of sampling
(October 2014) were identified at GQ1S (SWS), GQ2S (1S), GQ3S (SES), GQ3D (SED), GQ4S
(2S), GQ5S (ES), GQ7S, GQ7D, GQ8S, GQ8D, GQ9S, GQ10S and GQ10D.

TE14027 Stanley Rd_desktop hydrogeological investigation.0a Month YYYY | Page 15
Phase 1: Desktop Hydrogeological Investigation
Stanley Road Landfill
Prepared for Bunbury-Harvey Regional Council
Chart 3 Aluminium Concentrations
3.4.1.2 Arsenic
Concentrations were below adopted assessment criteria at all locations with the exception
GQ6D (WD) which exceeded Drinking Water criteria in July 2011 and exceeded NPUG (0.1
mg/L) in October 2012, as shown in Chart 4. No exceedances were identified during the last
round of sampling (October 2014).
0
1
2
3
4
5
6
Jan-14 Feb-14 Mar-14 Apr-14 May-14 Jun-14 Jul-14 Aug-14 Sep-14 Oct-14
mg/L Aluminium SWS-R/GQ1S
SWD/GQ1D
1S/GQ2S
1D/GQ2D
SES/GQ3S
SED/GQ3D
2S/GQ4S
2D/GQ4D
ES/GQ5S
ED/GQ5D
WS-R/GQ6S
WD/GQ6D
GQ7S
GQ7D
GQ8S
GQ8D
GQ9S
GQ9D
GQ10S
GQ10D
NPUG
Drinking Health Value
Fresh Water
LT irrigation

TE14027 Stanley Rd_desktop hydrogeological investigation.0a Month YYYY | Page 16
Phase 1: Desktop Hydrogeological Investigation
Stanley Road Landfill
Prepared for Bunbury-Harvey Regional Council
Chart 4 Arsenic concentrations
3.4.1.3 Cadmium
For cadmium, Chart 5 shows concentrations were below adopted assessment criteria and
below laboratory detection limits at all well locations with the exception of GQ6D (WD) in
October 2012 which exceeded Fresh Water criteria (0.0002mg/L). No exceedances were
identified during the last round of sampling (October 2014).
Chart 5 Cadmium concentrations
0
0.02
0.04
0.06
0.08
0.1
0.12Ja
n-1
1
Ap
r-1
1
Jul-
11
Oct
-11
Jan
-12
Ap
r-1
2
Jul-
12
Oct
-12
Jan
-13
Ap
r-1
3
Jul-
13
Oct
-13
Jan
-14
Ap
r-1
4
Jul-
14
Oct
-14
mg/L
Arsenic SWS-R/GQ1S
SWD/GQ1D
1S/GQ2S
1D/GQ2D
SES/GQ3S
SED/GQ3D
2S/GQ4S
2D/GQ4D
ES/GQ5S
ED/GQ5D
WS-R/GQ6S
WD/GQ6D
GQ7S
GQ7D
GQ8S
GQ8D
GQ9S
GQ9D
GQ10S
GQ10D
NPUG
LT irrigation
0
0.005
0.01
0.015
0.02
0.025
Jan
-11
Ap
r-1
1
Jul-
11
Oct
-11
Jan
-12
Ap
r-1
2
Jul-
12
Oct
-12
Jan
-13
Ap
r-1
3
Jul-
13
Oct
-13
Jan
-14
Ap
r-1
4
Jul-
14
Oct
-14
mg/L
Cadmium SWS-R/GQ1S
SWD/GQ1D
1S/GQ2S
1D/GQ2D
SES/GQ3S
SED/GQ3D
2S/GQ4S
2D/GQ4D
ES/GQ5S
ED/GQ5D
WS-R/GQ6S
WD/GQ6D
GQ7S
GQ7D
GQ8S
GQ8D
GQ9S
GQ9D
GQ10S
GQ10D
NPUG
Drinking Health Value
Fresh Water
LT irrigation

TE14027 Stanley Rd_desktop hydrogeological investigation.0a Month YYYY | Page 17
Phase 1: Desktop Hydrogeological Investigation
Stanley Road Landfill
Prepared for Bunbury-Harvey Regional Council
3.4.1.4 Chromium
See Chart 6 below. Concentrations of chromium were below adopted assessment criteria at
all well locations during each sampling round as shown in Chart 6 below. Concentrations
identified at each well location fluctuated slightly with lowest concentrations generally
observed during May and October sampling rounds. No exceedances were identified
during the last round of sampling (October 2014).
Chart 6 Chromium concentrations
3.4.1.5 Copper
Concentrations fluctuated over the monitoring period and were below NPUG (20 mg/L) and
Drinking Water (2 mg/L) criteria at all well locations. Exceedences in Fresh Water criteria
(0.0014 mg/L) were recorded at all well locations during at least one sampling round with the
exception of GQ7S, GQ7D, GQ8S, GQ9D, GQ10S, GQ10D. Highest concentrations were
recorded at GQ6D (WD) in October 2012 followed by GQ4D (2D) in July 2013 as shown in
Chart 7 below.
With the exception of April and July 2013 sampling rounds, concentrations at GQ2S (1S),
GQ2D (1D), GQ4D (2D), GQ5D (ED) and GQ1S (SWD) were below all adopted assessment
criteria. No exceedances were identified during the last round of sampling (October 2014).
0
0.02
0.04
0.06
0.08
0.1
0.12
Jan
-11
Ap
r-1
1
Jul-
11
Oct
-11
Jan
-12
Ap
r-1
2
Jul-
12
Oct
-12
Jan
-13
Ap
r-1
3
Jul-
13
Oct
-13
Jan
-14
Ap
r-1
4
Jul-
14
Oct
-14
mg/L
Chromium SWS-R/GQ1S
SWD/GQ1D
1S/GQ2S
1D/GQ2D
SES/GQ3S
SED/GQ3D
2S/GQ4S
2D/GQ4D
ES/GQ5S
ED/GQ5D
WS-R/GQ6S
WD/GQ6D
GQ7S
GQ7D
GQ8S
GQ8D
GQ9S
GQ9D
GQ10S
GQ10D
LT irrigation

TE14027 Stanley Rd_desktop hydrogeological investigation.0a Month YYYY | Page 18
Phase 1: Desktop Hydrogeological Investigation
Stanley Road Landfill
Prepared for Bunbury-Harvey Regional Council
Chart 7 Copper concentrations
3.4.1.6 Iron
Groundwater was not analysed for iron between July 2012 and October 2013, resulting in a
data gap. Concentrations at each well location exceeded Fresh Water (0.3 mg/L), Drinking
Water (Aesthetic Value 0.3 mg/L), NPUG (0.3 mg/L) and Long-term Irrigation (0.2 mg/L)
assessment criteria during every sampling event. Concentrations have fluctuated up and
down during the rounds, whilst fluctuations have been reported a general trend at wells
GQ6D (WD), GQ6S (WS-R), GQ1D (SWD), GQ2D (1D) show increase in concentrations, and
decrease in concentrations at the other well locations, as shown in Chart 8 below.
0
0.2
0.4
0.6
0.8
1
1.2
1.4
1.6
1.8
2
Jan
-11
Ap
r-1
1
Jul-
11
Oct
-11
Jan
-12
Ap
r-1
2
Jul-
12
Oct
-12
Jan
-13
Ap
r-1
3
Jul-
13
Oct
-13
Jan
-14
Ap
r-1
4
Jul-
14
Oct
-14
mg/L
Copper SWS-R/GQ1S
SWD/GQ1D
1S/GQ2S
1D/GQ2D
SES/GQ3S
SED/GQ3D
2S/GQ4S
2D/GQ4D
ES/GQ5S
ED/GQ5D
WS-R/GQ6S
WD/GQ6D
GQ7S
GQ7D
GQ8S
GQ8D
GQ9S
GQ9D
GQ10S
GQ10D
Drinking Health Value
Fresh Water
LT irrigation

TE14027 Stanley Rd_desktop hydrogeological investigation.0a Month YYYY | Page 19
Phase 1: Desktop Hydrogeological Investigation
Stanley Road Landfill
Prepared for Bunbury-Harvey Regional Council
Chart 8 Iron concentrations
3.4.1.7 Lead
As shown in Chart 9 below, concentrations were below Drinking Water (0.01 mg/L), NPUG
(0.1 mg/L), Long-term Irrigation (2 mg/L) and Fresh Water (0.0034 mg/L) assessment criteria at
all well locations during every sampling event with the exception of GQ1D (SWD) in January
2012, GQ6S (WS-R) in April 2012 and GQ6D (WD) in October 2012 which exceeded Fresh
Water criteria.
Concentrations at GQ4S (2S), GQ6D (WD), GQ5S (ES), GQ3S (SES-R), GQ1S (SWS-R) and
GQ10S fluctuated up and down with highest concentrations at GQ5S (ES) occurring in April
and no particular correlation between month and concentrations observed at the other
wells. Concentrations at the other wells not mentioned previously were consistent with no
fluctuations in concentrations, with reported concentrations below laboratory detection
limits.
0
10
20
30
40
50
60
70
80
90
100Ja
n-1
1
Ap
r-1
1
Jul-
11
Oct
-11
Jan
-12
Ap
r-1
2
Jul-
12
Oct
-12
Jan
-13
Ap
r-1
3
Jul-
13
Oct
-13
Jan
-14
Ap
r-1
4
Jul-
14
Oct
-14
mg/L
Iron SWS-R/GQ1S
SWD/GQ1D
1S/GQ2S
1D/GQ2D
SES/GQ3S
SED/GQ3D
2S/GQ4S
2D/GQ4D
ES/GQ5S
ED/GQ5D
WS-R/GQ6S
WD/GQ6D
GQ7S
GQ7D
GQ8S
GQ8D
GQ9S
GQ9D
GQ10S
GQ10D
NPUG
Drinking Aesthetic Value
Fresh Water
LT irrigation

TE14027 Stanley Rd_desktop hydrogeological investigation.0a Month YYYY | Page 20
Phase 1: Desktop Hydrogeological Investigation
Stanley Road Landfill
Prepared for Bunbury-Harvey Regional Council
Chart 9 Lead concentrations
3.4.1.8 Manganese
Concentrations were below NPUG (5 mg/L) and Fresh Water (1.9 mg/L) criteria at all wells
during all sample rounds. Concentrations at all wells were also below Long-term Irrigation (0.2
mg/L) and Drinking Water (0.5 mg/L) criteria with the exceptions of GQ4D (2D), GW4S (2S)
(during April 2011) and GQ6S (WS-R) which has fluctuated up and down since January 2011,
falling below Long-term Irrigation criteria during sampling rounds conducted in July 2011 and
January 2012, as shown in Chart 10 below.
Concentrations were generally stable over the sampling rounds with the exceptions of GQ4D
(2D) and GQ6S (WS-R) which fluctuated, with the concentrations generally greatest at
GQ4D, with lowest concentrations GQ3S (SES-R). Exceedances identified during the last
round of sampling (October 2014) were recorded at GQ6S (WS-R) and GQ4D (2D) which
exceeded Long-term Irrigation criteria.
0
0.02
0.04
0.06
0.08
0.1
0.12Ja
n-1
1
Ap
r-1
1
Jul-
11
Oct
-11
Jan
-12
Ap
r-1
2
Jul-
12
Oct
-12
Jan
-13
Ap
r-1
3
Jul-
13
Oct
-13
Jan
-14
Ap
r-1
4
Jul-
14
Oct
-14
mg/L
Lead SWS-R/GQ1S
SWD/GQ1D
1S/GQ2S
1D/GQ2D
SES/GQ3S
SED/GQ3D
2S/GQ4S
2D/GQ4D
ES/GQ5S
ED/GQ5D
WS-R/GQ6S
WD/GQ6D
GQ7S
GQ7D
GQ8S
GQ8D
GQ9S
GQ9D
GQ10S
GQ10D
NPUG
Drinking Health Value
Fresh Water

TE14027 Stanley Rd_desktop hydrogeological investigation.0a Month YYYY | Page 21
Phase 1: Desktop Hydrogeological Investigation
Stanley Road Landfill
Prepared for Bunbury-Harvey Regional Council
Chart 10 Manganese concentrations
3.4.1.9 Mercury
Sampling rounds prior to January 2014 were not analysed for mercury. As shown in Chart 11
concentrations of mercury were below adopted assessment criteria and below laboratory
detection limits at all sample locations during each sample round. No exceedances were
identified during the last round of sampling (October 2014).
0
1
2
3
4
5
6
Jan
-11
Ap
r-1
1
Jul-
11
Oct
-11
Jan
-12
Ap
r-1
2
Jul-
12
Oct
-12
Jan
-13
Ap
r-1
3
Jul-
13
Oct
-13
Jan
-14
Ap
r-1
4
Jul-
14
Oct
-14
mg/L
Manganese SWS-R/GQ1S
SWD/GQ1D
1S/GQ2S
1D/GQ2D
SES/GQ3S
SED/GQ3D
2S/GQ4S
2D/GQ4D
ES/GQ5S
ED/GQ5D
WS-R/GQ6S
WD/GQ6D
GQ7S
GQ7D
GQ8S
GQ8D
GQ9S
GQ9D
GQ10S
GQ10D
NPUG
Drinking Health Value
Fresh Water
LT irrigation

TE14027 Stanley Rd_desktop hydrogeological investigation.0a Month YYYY | Page 22
Phase 1: Desktop Hydrogeological Investigation
Stanley Road Landfill
Prepared for Bunbury-Harvey Regional Council
Chart 11 Mercury concentrations
3.4.1.10 Nickel
Concentrations were below all adopted assessment criteria at all well locations with the
exception of GQ6D (WD) which exceeded Drinking Water (0.02 mg/L) and Fresh Waters
(0.011 mg/L) criteria in July 2011, and GQ7S which exceeded Fresh Waters criteria in January
2014. Concentrations have relatively stayed stable, fluctuating between <0.001 and 0.006
mg/L with a general increase in concentrations at GQ6D (WD) and GQ6S (WS-R) over the
monitoring period as shown below in Chart 12. No exceedances were identified during the
last round of sampling (October 2014).
0
0.005
0.01
0.015
0.02Ja
n-1
1
Ap
r-1
1
Jul-
11
Oct
-11
Jan
-12
Ap
r-1
2
Jul-
12
Oct
-12
Jan
-13
Ap
r-1
3
Jul-
13
Oct
-13
Jan
-14
Ap
r-1
4
Jul-
14
Oct
-14
mg/L
Mercury SWS-R/GQ1S
SWD/GQ1D
1S/GQ2S
1D/GQ2D
SES/GQ3S
SED/GQ3D
2S/GQ4S
2D/GQ4D
ES/GQ5S
ED/GQ5D
WS-R/GQ6S
WD/GQ6D
GQ7S
GQ7D
GQ8S
GQ8D
GQ9S
GQ9D
GQ10S
GQ10D
NPUG
Drinking Health Value
Fresh Water
LT irrigation

TE14027 Stanley Rd_desktop hydrogeological investigation.0a Month YYYY | Page 23
Phase 1: Desktop Hydrogeological Investigation
Stanley Road Landfill
Prepared for Bunbury-Harvey Regional Council
Chart 12 Nickel concentrations
3.4.1.11 Selenium
No laboratory analysis was conducted for Selenium concentrations in groundwater prior to
January 2014. Concentrations recorded in 2014 were below Fresh Water (0.005 mg/L),
Drinking Water (0.1 mg/L), NPUG (0.1 mg/L) and Long-term Irrigation (0.2 mg/L) during each
sampling round at each well location, with majority of reporting concentrations below
laboratory detection limits. No apparent trend was observed in concentration fluctuations
as shown below in Chart 13. Concentrations were below assessment criteria during the last
round of sampling conducted (October 2014).
0
0.05
0.1
0.15
0.2
0.25Ja
n-1
1
Ap
r-1
1
Jul-
11
Oct
-11
Jan
-12
Ap
r-1
2
Jul-
12
Oct
-12
Jan
-13
Ap
r-1
3
Jul-
13
Oct
-13
Jan
-14
Ap
r-1
4
Jul-
14
Oct
-14
mg/L
Nickel SWS-R/GQ1S
SWD/GQ1D
1S/GQ2S
1D/GQ2D
SES/GQ3S
SED/GQ3D
2S/GQ4S
2D/GQ4D
ES/GQ5S
ED/GQ5D
WS-R/GQ6S
WD/GQ6D
GQ7S
GQ7D
GQ8S
GQ8D
GQ9S
GQ9D
GQ10S
GQ10D
NPUG
Drinking Health Value
Fresh Water
LT irrigation

TE14027 Stanley Rd_desktop hydrogeological investigation.0a Month YYYY | Page 24
Phase 1: Desktop Hydrogeological Investigation
Stanley Road Landfill
Prepared for Bunbury-Harvey Regional Council
Chart 13 Selenium concentrations
3.4.1.12 Zinc
As shown in Chart 14, concentrations were below adopted assessment criteria at all well
locations for Drinking Water (3 mg/L), NPUG (3 mg/L) and Long-term Irrigation (2 mg/L).
Concentrations exceeded Fresh Water guidelines (0.008 mg/L) at all well locations at least
one occasion. Concentrations at all well locations fluctuated up and down over the
sampling rounds, with a general minor decrease in concentrations since January 2014, with
highest concentrations recorded at GQ4S (2S) in July 2013. No exceedances were identified
during the last round of sampling (October 2014).
0
0.02
0.04
0.06
0.08
0.1
0.12
Jan-14 Apr-14 Jul-14 Oct-14
mg/L
Selenium SWS-R/GQ1S
SWD/GQ1D
1S/GQ2S
1D/GQ2D
SES/GQ3S
SED/GQ3D
2S/GQ4S
2D/GQ4D
ES/GQ5S
ED/GQ5D
WS-R/GQ6S
WD/GQ6D
GQ7S
GQ7D
GQ8S
GQ8D
GQ9S
GQ9D
GQ10S
GQ10D
NPUG
Drinking Health Value
Fresh Water
LT irrigation

TE14027 Stanley Rd_desktop hydrogeological investigation.0a Month YYYY | Page 25
Phase 1: Desktop Hydrogeological Investigation
Stanley Road Landfill
Prepared for Bunbury-Harvey Regional Council
Chart 14 Zinc concentrations
3.4.2 BTEX
3.4.2.1 Benzene
Concentrations were below Fresh Water (0.95 mg/L) and NPUG (0.01 mg/L) assessment
criteria at all wells. Concentrations were below Drinking Water (0.001 mg/L) criteria and
below laboratory detection limits at all wells with the exception of GQ6D (WD) and GQ6S
(WS-R) during each sampling round and GW8D and GQ8D during October 2014 (first
sampling round where benzene was analysed) as shown below in Chart 15. Concentrations
at GQ6S and GQ6D showed an increasing trend in concentrations.
0
0.5
1
1.5
2
2.5
3
Jan
-11
Ap
r-1
1
Jul-
11
Oct
-11
Jan
-12
Ap
r-1
2
Jul-
12
Oct
-12
Jan
-13
Ap
r-1
3
Jul-
13
Oct
-13
Jan
-14
Ap
r-1
4
Jul-
14
Oct
-14
mg/L
Zinc SWS-R/GQ1S
SWD/GQ1D
1S/GQ2S
1D/GQ2D
SES/GQ3S
SED/GQ3D
2S/GQ4S
2D/GQ4D
ES/GQ5S
ED/GQ5D
WS-R/GQ6S
WD/GQ6D
GQ7S
GQ7D
GQ8S
GQ8D
GQ9S
GQ9D
GQ10S
GQ10D
NPUG
Fresh Water
LT irrigation

TE14027 Stanley Rd_desktop hydrogeological investigation.0a Month YYYY | Page 26
Phase 1: Desktop Hydrogeological Investigation
Stanley Road Landfill
Prepared for Bunbury-Harvey Regional Council
Chart 15 Benzene concentrations
3.4.2.2 Toluene
Concentrations were generally stable over the sampling rounds at all well locations, with
highest concentrations observed at GQ8D and GQ8S in October 2014. Concentrations were
below Drinking Water (0.8 mg/L) criteria at all well locations. Concentrations were also
below NPUG (0.025 mg/L) at all well locations during each sampling round with the
exception GQ8S and GW8D which exceeded the criteria in October 2014 (first sampling
round where toluene was analysed), as shown in Chart 16 below.
0
0.002
0.004
0.006
0.008
0.01
0.012
Jan-11 Jan-12 Jan-13 Jan-14
mg/L
Benzene GQ1D/SWD
GQ1S/SWS
GQ2D/1D
GQ2S/1S
GQ3D/SED
GQ3S/SES
GQ4D/2D
GQ4S/2S
GQ5D/ED
GQ5S/ES
GQ6D/WD
GQ6S/WSR
GQ7D
GQ7S
GQ8D
GQ8S
GQ9D
GQ9S
GQ10D
GQ10S
NPUG
Drinking Health Value

TE14027 Stanley Rd_desktop hydrogeological investigation.0a Month YYYY | Page 27
Phase 1: Desktop Hydrogeological Investigation
Stanley Road Landfill
Prepared for Bunbury-Harvey Regional Council
Chart 16 Toluene concentrations
3.4.2.3 Ethylbenzene
As shown in Chart 17 Concentrations were below Drinking Water (0.3 mg/L) and NPUG (0.003
mg/L) at all well locations during each sampling round. Concentrations were below
laboratory detection limits during each round with the exception of GQ6S (WS-R) in October
2012 where detectable concentrations were reported. No exceedances were identified
during the last round of sampling (October 2014).
0
0.1
0.2
0.3
0.4
0.5
0.6
0.7
0.8
0.9
Jan-11 Jan-12 Jan-13 Jan-14
mg/L
Toluene GQ1D/SWD
GQ1S/SWS
GQ2D/1D
GQ2S/1S
GQ3D/SED
GQ3S/SES
GQ4D/2D
GQ4S/2S
GQ5D/ED
GQ5S/ES
GQ6D/WD
GQ6S/WSR
GQ7D
GQ7S
GQ8D
GQ8S
GQ9D
GQ9S
GQ10D
GQ10S
NPUG
Drinking Health Value

TE14027 Stanley Rd_desktop hydrogeological investigation.0a Month YYYY | Page 28
Phase 1: Desktop Hydrogeological Investigation
Stanley Road Landfill
Prepared for Bunbury-Harvey Regional Council
Chart 17 Ethylbenzene concentrations
3.4.2.4 Xylenes
As shown below in Chart 18, concentrations were below Fresh Water (0.55 mg/L), Drinking
Water (0.6 mg/L) and NPUG (0.02 mg/L) assessment criteria and below laboratory reporting
limits at all well locations during each sampling round. No exceedances were identified
during the last round of sampling (October 2014).
Chart 18 Xylenes concentrations
0
0.05
0.1
0.15
0.2
0.25
0.3
Jan-11 Jan-12 Jan-13 Jan-14
Ethylbenzene GQ1D/SWD
GQ1S/SWS
GQ2D/1D
GQ2S/1S
GQ3D/SED
GQ3S/SES
GQ4D/2D
GQ4S/2S
GQ5D/ED
GQ5S/ES
GQ6D/WD
GQ6S/WSR
GQ7D
GQ7S
GQ8D
GQ8S
GQ9D
GQ9S
GQ10D
GQ10S
NPUG
Drinking Health Value
0
0.1
0.2
0.3
0.4
0.5
0.6
0.7
Jan-11 Jan-12 Jan-13 Jan-14
mg/L
Xylenes Total GQ1D
GQ1S
GQ2D
GQ2S
GQ3D
GQ3S
GQ4D
GQ4S
GQ5D
GQ5S
GQ6D
GQ6S
GQ7D
GQ7S
GQ8D
GQ8S
GQ9D
GQ9S
GQ10D
GQ10S
NPUG
Drinking Health Value
Fresh Water

TE14027 Stanley Rd_desktop hydrogeological investigation.0a Month YYYY | Page 29
Phase 1: Desktop Hydrogeological Investigation
Stanley Road Landfill
Prepared for Bunbury-Harvey Regional Council
3.4.3 PAH
3.4.3.1 Naphthalene
Concentrations were below Fresh Water (0.016 mg/L) assessment criteria at all well locations
during each sampling round. As shown below in Chart 19, detectable concentrations were
identified in GQ1D (SWD), GQ6D (WSD), GQ6S (WS-R), GQ7D, GQ7S, GQ8D, GQ8S, GQ9D
and GQ9S, which were generally increasing in concentrations with time. No exceedances
were identified during the last round of sampling (October 2014).
Chart 19 Naphthalene concentrations
3.4.3.2 BaP
Concentrations were below Drinking Water (0.00001 mg/L) and NPUG (0.0001 mg/L)
assessment criteria and below laboratory reporting limits at all well locations during each
sampling round, as shown in Chart 20 below. No exceedances were identified during the
last round of sampling (October 2014).
0
0.002
0.004
0.006
0.008
0.01
0.012
0.014
0.016
0.018
Jan-11 Jan-12 Jan-13 Jan-14
Naphthalene GQ1D
GQ1S
GQ2D
GQ2S
GQ3D
GQ3S
GQ4D
GQ4S
GQ5D
GQ5S
GQ6D
GQ6S
GQ7D
GQ7S
GQ8D
GQ8S
GQ9D
GQ9S
GQ10D
GQ10S
Fresh Water

TE14027 Stanley Rd_desktop hydrogeological investigation.0a Month YYYY | Page 30
Phase 1: Desktop Hydrogeological Investigation
Stanley Road Landfill
Prepared for Bunbury-Harvey Regional Council
Chart 20 BaP concentrations
3.4.4 TRH
3.4.4.1 TRH C10-C36
Concentrations at GQ6S (WS-R) and GQ6D (WD) exceeded Dutch Intervention Value for
Mineral Oil (VROM) adopted assessment criteria during each sampling event.
Concentrations generally decreased between 2011 and 2012, spiked between 2012 and
2013 and decreased between 2013 and 2014 sampling rounds, as shown in Chart 21 below.
During the last round of sampling (October 2014) exceedances were recorded at GQ2S,
GQ5D, GQ6S, GW6D, GQ7D, GW7S, GQ8D and GW8S.
0
0.00002
0.00004
0.00006
0.00008
0.0001
0.00012
Jan-11 Jan-12 Jan-13 Jan-14
BaP GQ1D
GQ1S
GQ2D
GQ2S
GQ3D
GQ3S
GQ4D
GQ4S
GQ5D
GQ5S
GQ6D
GQ6S
GQ7D
GQ7S
GQ8D
GQ8S
GQ9D
GQ9S
GQ10D
GQ10S
NPUG
Drinking Health Value

TE14027 Stanley Rd_desktop hydrogeological investigation.0a Month YYYY | Page 31
Phase 1: Desktop Hydrogeological Investigation
Stanley Road Landfill
Prepared for Bunbury-Harvey Regional Council
Chart 21 TRH C10-C36 concentrations
3.4.5 Nutrients
3.4.5.1 Ammonia
Laboratory analysis was conducted for ammonia between July 2013 and October 2014 with
some data gaps at several wells. Concentrations were generally stable at most of the well
locations, with concentrations below 26 mg/L. Concentrations outliers occurred at GQ6S
(WS-R) which showed high concentrations 46-260 mg/L with a general increase in
concentrations. Wells GQ8s and GQ8D were only analysed for ammonia on two occasions
which showed highest concentrations over 220 mg/L as shown in Chart 22 below.
Concentrations at GQ2D, GQ5S and GQ10S were below NPUG (0.5 mg/L) during each
sampling round. Concentrations at the remainder of the wells exceeded the criteria during
at least one round of sampling. During the last round of sampling (October 2014)
exceedances were identified at GQ2S, GQ3D, GQ4D, GQ6S, GQ6D, GQ7S, GQ7D, GQ8S,
GQ8D, GQ9D and GQ10D.
0
1
2
3
4
5
6
7
8
9
Jan-11 Jan-12 Jan-13 Jan-14
mg/L
TRH C10-C36 GQ1D
GQ1S
GQ2D
GQ2S
GQ3D
GQ3S
GQ4D
GQ4S
GQ5D
GQ5S
GQ6D
GQ6S
GQ7D
GQ7S
GQ8D
GQ8S
GQ9D
GQ9S
GQ10D
GQ10S
Dutch intervation
Dutch Intervention Value

TE14027 Stanley Rd_desktop hydrogeological investigation.0a Month YYYY | Page 32
Phase 1: Desktop Hydrogeological Investigation
Stanley Road Landfill
Prepared for Bunbury-Harvey Regional Council
Chart 22 Ammonia concentrations
3.4.5.2 Ammonia-Nitrogen
As shown in Chart 23 below, concentrations at all well locations exceeded NPUG (0.5 mg/L)
during at least one sampling round. Minor fluctuations with concentrations generally <1
mg/L were observed at majority of the wells. Concentrations at GQ6D (WD) and GQ2S (1S)
showed greater fluctuations with highest concentrations observed in at GQ6D (WD) in
October and with lowest concentrations occurring at GQ2D (1D) at this time with the highest
observed in the April sampling rounds. Concentrations as can be seen below, fluctuated
significantly up and down with a general increase in concentrations at GQ6S (WS-R),
peaking in July 2014. GQ8S and GQ8D were sampled from April 2014 showing an increase in
concentrations.
During the last round of sampling (October 2014) exceedances were identified at GQ1D,
GQ2S (1S), GQ3D (SED), GQ4D (2D), GQ5D (ED), GQ6S (WSR), GQ6D (WD), GQ7S, GQ7D,
GQ8S, GQ8D, GQ9D and GQ10D.
0
50
100
150
200
250
Jul-13 Oct-13 Jan-14 Apr-14 Jul-14 Oct-14
mg/L
Ammonia SWS-R/GQ1S
SWD/GQ1D
1S/GQ2S
1D/GQ2D
SES/GQ3S
SED/GQ3D
2S/GQ4S
2D/GQ4D
ES/GQ5S
ED/GQ5D
WS-R/GQ6S
WD/GQ6D
GQ7S
GQ7D
GQ8S
GQ8D
GQ9S
GQ9D
GQ10S
GQ10D

TE14027 Stanley Rd_desktop hydrogeological investigation.0a Month YYYY | Page 33
Phase 1: Desktop Hydrogeological Investigation
Stanley Road Landfill
Prepared for Bunbury-Harvey Regional Council
Chart 23 Ammonia-Nitrogen concentrations
3.4.5.3 Total Nitrogen
As shown in Chart 24 below, concentrations exceeded Fresh Water (2 mg/L) adopted
assessment criteria at all wells during at least one sampling round. Concentrations were
highest at GQ6S (WS-R) during each sampling round with highest recorded concentrations in
October 2011 with highest concentrations occurring in October sampling rounds. In addition
GQ8S and GQ8D were significantly higher that the remainder of the wells. Concentrations at
the remainder of the wells were generally less than 25 mg/L, with a spike in concentrations
occurring in January 2013. Exceedances identified during the last round of sampling
(October 2014) were identified at all well locations with the exception of GQ10S.
0
20
40
60
80
100
120
140
160
180
200Ja
n-1
1
Ap
r-1
1
Jul-
11
Oct
-11
Jan
-12
Ap
r-1
2
Jul-
12
Oct
-12
Jan
-13
Ap
r-1
3
Jul-
13
Oct
-13
Jan
-14
Ap
r-1
4
Jul-
14
Oct
-14
mg/L
Ammonia-Nitrogen SWS-R/GQ1S
SWD/GQ1D
1S/GQ2S
1D/GQ2D
SES/GQ3S
SED/GQ3D
2S/GQ4S
2D/GQ4D
ES/GQ5S
ED/GQ5D
WS-R/GQ6S
WD/GQ6D
GQ7S
GQ7D
GQ8S
GQ8D
GQ9S
GQ9D
GQ10S
GQ10D
Fresh Water

TE14027 Stanley Rd_desktop hydrogeological investigation.0a Month YYYY | Page 34
Phase 1: Desktop Hydrogeological Investigation
Stanley Road Landfill
Prepared for Bunbury-Harvey Regional Council
Chart 24 Total Nitrogen concentrations
3.4.5.4 Nitrate
Concentrations were below Drinking Water (50 mg/L) and NPUG (500 mg/L) assessment
criteria at all locations during each sampling round. A data gap was observed during
January 2014 sampling round. Concentrations at all well locations were generally below 10
mg/L with the exception of GQ2S (1S) during January 2014 and October 2014 sampling
round, with highest concentrations observed in October 2014, as shown in Chart 25 below.
No exceedances were identified during the last round of sampling (October 2014).
0
100
200
300
400
500
600Ja
n-1
1
Ap
r-1
1
Jul-
11
Oct
-11
Jan
-12
Ap
r-1
2
Jul-
12
Oct
-12
Jan
-13
Ap
r-1
3
Jul-
13
Oct
-13
Jan
-14
Ap
r-1
4
Jul-
14
Oct
-14
mg/L
Total Nitrogen SWS-R/GQ1S
SWD/GQ1D
1S/GQ2S
1D/GQ2D
SES/GQ3S
SED/GQ3D
2S/GQ4S
2D/GQ4D
ES/GQ5S
ED/GQ5D
WS-R/GQ6S
WD/GQ6D
GQ7S
GQ7D
GQ8S
GQ8D
GQ9S
GQ9D
GQ10S
GQ10D
Fresh Water

TE14027 Stanley Rd_desktop hydrogeological investigation.0a Month YYYY | Page 35
Phase 1: Desktop Hydrogeological Investigation
Stanley Road Landfill
Prepared for Bunbury-Harvey Regional Council
Chart 25 Nitrate concentrations
3.4.5.5 Phosphorus
Concentrations exceeded Fresh Water (0.2 mg/L) criteria at wells GQ4S (2S), GQ2S (1S),
GQ3S (SES) and GQ8D. General trend shows fluctuations in concentrations over time, with
concentrations peaking in January 2014, as shown in Chart 26 below. No exceedances were
identified during the last round of sampling (October 2014)
Chart 26 Phosphorus concentrations
0
100
200
300
400
500
600
Jan-13 Apr-13 Jul-13 Oct-13 Jan-14 Apr-14 Jul-14 Oct-14
mg/L
Nitrate SWS-R/GQ1S
SWD/GQ1D
1S/GQ2S
1D/GQ2D
SES/GQ3S
SED/GQ3D
2S/GQ4S
2D/GQ4D
ES/GQ5S
ED/GQ5D
WS-R/GQ6S
WD/GQ6D
GQ7S
GQ7D
GQ8S
GQ8D
GQ9S
GQ9D
GQ10S
GQ10D
NPUG
Drinking Water
0
0.2
0.4
0.6
0.8
1
1.2
1.4
1.6
Jan
-11
Ap
r-1
1
Jul-
11
Oct
-11
Jan
-12
Ap
r-1
2
Jul-
12
Oct
-12
Jan
-13
Ap
r-1
3
Jul-
13
Oct
-13
Jan
-14
Ap
r-1
4
Jul-
14
Oct
-14
mg/L
Total Phosphorus SWS-R/GQ1S
SWD/GQ1D
1S/GQ2S
1D/GQ2D
SES/GQ3S
SED/GQ3D
2S/GQ4S
2D/GQ4D
ES/GQ5S
ED/GQ5D
WS-R/GQ6S
WD/GQ6D
GQ7S
GQ7D
GQ8S
GQ8D
GQ9S
GQ9D
GQ10S
GQ10D
Fresh Water

TE14027 Stanley Rd_desktop hydrogeological investigation.0a Month YYYY | Page 36
Phase 1: Desktop Hydrogeological Investigation
Stanley Road Landfill
Prepared for Bunbury-Harvey Regional Council
3.4.5.6 COD
COD was not monitored prior to January 2014. Concentrations varied between the wells,
with majority of the wells having concentrations below 200 mg/L with generally stable
concentrations. Highest concentrations and fluctuations observed were at GQ3S (SES) and
GQ6S (WS-R), GQ5D, GQ6D, GQ8S and GQ8D, as shown in Chart 27 below No criteria for
COD is available within the DER (2014) guidelines.
Chart 27 COD concentrations
3.4.6 Major Cations
3.4.6.1 Calcium
Calcium was not monitored prior to January 2014. Concentrations were relatively stable at
the wells over the sampling rounds. Generally the highest concentrations were identified at
GQ6S (WS-R) as shown in Chart 28 below. No criteria for calcium is available within the DER
(2014) guidelines.
0
100
200
300
400
500
600
Jan-14 Apr-14 Jul-14 Oct-14
mg/L
COD SWS-R/GQ1S
SWD/GQ1D
1S/GQ2S
1D/GQ2D
SES/GQ3S
SED/GQ3D
2S/GQ4S
2D/GQ4D
ES/GQ5S
ED/GQ5D
WS-R/GQ6S
WD/GQ6D
GQ7S
GQ7D
GQ8S
GQ8D
GQ9S
GQ9D
GQ10S
GQ10D

TE14027 Stanley Rd_desktop hydrogeological investigation.0a Month YYYY | Page 37
Phase 1: Desktop Hydrogeological Investigation
Stanley Road Landfill
Prepared for Bunbury-Harvey Regional Council
Chart 28 Calcium concentrations
3.4.6.2 Magnesium
Magnesium was not monitored prior to January 2014. Concentrations were relatively stable
at most of the wells. Concentrations were generally constant over the sampling rounds, with
the exception of GQ3S (SES) which showed a large decrease between July 2014 and
October 2014. Generally the highest concentrations were identified at GW3S (SES), GW6S
(WS-R) and GQ6D (WD), as shown in Chart 29 below. No criteria for magnesium is available
within the DER (2014) guidelines.
0
20
40
60
80
100
120
140
160
180
200
Jan-14 Apr-14 Jul-14 Oct-14
mg/L
Calcium SWS-R/GQ1S
SWD/GQ1D
1S/GQ2S
1D/GQ2D
SES/GQ3S
SED/GQ3D
2S/GQ4S
2D/GQ4D
ES/GQ5S
ED/GQ5D
WS-R/GQ6S
WD/GQ6D
GQ7S
GQ7D
GQ8S
GQ8D
GQ9S
GQ9D
GQ10S
GQ10D

TE14027 Stanley Rd_desktop hydrogeological investigation.0a Month YYYY | Page 38
Phase 1: Desktop Hydrogeological Investigation
Stanley Road Landfill
Prepared for Bunbury-Harvey Regional Council
Chart 29 Magnesium concentrations
3.4.6.3 Sodium
Sodium was not monitored prior to January 2014. Concentrations were relatively stable at all
wells with the exception of GW3S (SES) which showed a significant decrease between April
2014 and October 2014, as shown in Chart 30 below. No criteria for sodium is available within
the DER (2014) guidelines.
Chart 30 Sodium concentrations
0
50
100
150
200
250
300
Jan-14 Apr-14 Jul-14 Oct-14
mg/L
Magnesium SWS-R/GQ1S
SWD/GQ1D
1S/GQ2S
1D/GQ2D
SES/GQ3S
SED/GQ3D
2S/GQ4S
2D/GQ4D
ES/GQ5S
ED/GQ5D
WS-R/GQ6S
WD/GQ6D
GQ7S
GQ7D
GQ8S
GQ8D
GQ9S
GQ9D
GQ10S
GQ10D
0
200
400
600
800
1000
1200
1400
1600
Jan-14 Apr-14 Jul-14 Oct-14
mg/L
Sodium SWS-R/GQ1S
SWD/GQ1D
1S/GQ2S
1D/GQ2D
SES/GQ3S
SED/GQ3D
2S/GQ4S
2D/GQ4D
ES/GQ5S
ED/GQ5D
WS-R/GQ6S
WD/GQ6D
GQ7S
GQ7D
GQ8S
GQ8D
GQ9S
GQ9D
GQ10S
GQ10D

TE14027 Stanley Rd_desktop hydrogeological investigation.0a Month YYYY | Page 39
Phase 1: Desktop Hydrogeological Investigation
Stanley Road Landfill
Prepared for Bunbury-Harvey Regional Council
3.4.6.4 Potassium
As shown in Chart 31, potassium concentrations were generally stable over the monitoring
period at all wells with the exception of GQ6S (WS-R) with large fluctuations with a general
increase in concentrations over time and GQ3S (SES) which fluctuate up and down over the
monitoring period, with highest concentrations recorded in April and lowest concentrations
in October months. Concentrations at GQ6S (WS-R) and GQ7S peaked in July 2014. There
are no criteria for potassium within DER (2014) guidelines.
Chart 31 Potassium concentrations
3.4.7 Major Anions
3.4.7.1 Chloride
Concentrations exceeded Drinking Water (Aesthetic 250 mg/L) NPUG (250 mg/L) adopted
assessment criteria at all wells during one or more sampling rounds with the exception of
GQ4S, GQ5S, GQ9S, GQ10S and GQ10D. Concentrations were highest at GQ3S (SES) with
major fluctuations observed, with highest concentrations in April and lowest in October
sampling rounds as shown in Chart 32 below. The remainder of the wells showed generally
stable concentrations. During the last round of sampling (October 2014) exceedances were
identified at GQ1D (SWD), GQ2S (1S), GQ2D (1D), GQ3S (SES), GQ5D (ED), GQ6S (WS-R),
GQ6D (WD), GQ7S, GQ7D, GQ8S, and GQ8D.
0
20
40
60
80
100
120
140
160
180
Jan
-11
Ap
r-1
1
Jul-
11
Oct
-11
Jan
-12
Ap
r-1
2
Jul-
12
Oct
-12
Jan
-13
Ap
r-1
3
Jul-
13
Oct
-13
Jan
-14
Ap
r-1
4
Jul-
14
Oct
-14
mg/L
Potassium SWS-R/GQ1S
SWD/GQ1D
1S/GQ2S
1D/GQ2D
SES/GQ3S
SED/GQ3D
2S/GQ4S
2D/GQ4D
ES/GQ5S
ED/GQ5D
WS-R/GQ6S
WD/GQ6D
GQ7S
GQ7D
GQ8S
GQ8D
GQ9S
GQ9D
GQ10S
GQ10D

TE14027 Stanley Rd_desktop hydrogeological investigation.0a Month YYYY | Page 40
Phase 1: Desktop Hydrogeological Investigation
Stanley Road Landfill
Prepared for Bunbury-Harvey Regional Council
Chart 32 Chloride concentrations
3.4.7.2 Sulphate
Laboratory analysis was conducted between January 2011-April 2012 and January 2014-
October 2014, with a data gap from April 2012 to January 2014. As shown Chart 33 below,
concentrations were below NPUG (1,000 mg/L) at each well location during each sampling
round, and below Drinking Water (Health Value, 500 mg/L) at each well location during each
sampling round with the exception of GQ2S (1S) in April 2014 and October 2014.
Concentrations at GQ1S (1S) and GQ2D (1D) exceeded Drinking Water (Aesthetic Value, 250
mg/L) during one or more sampling rounds. No particular trend was evident over the
monitoring period. Concentrations at GQ2S (1S) slightly exceeded Drinking Water (Health
and Aesthetic Value) during the last round of sampling (October 2014).
0
500
1,000
1,500
2,000
2,500
3,000
3,500
4,000Ja
n-1
1
Ap
r-1
1
Jul-
11
Oct
-11
Jan
-12
Ap
r-1
2
Jul-
12
Oct
-12
Jan
-13
Ap
r-1
3
Jul-
13
Oct
-13
Jan
-14
Ap
r-1
4
Jul-
14
Oct
-14
mg/L
Chloride SWS-R/GQ1S
SWD/GQ1D
1S/GQ2S
1D/GQ2D
SES/GQ3S
SED/GQ3D
2S/GQ4S
2D/GQ4D
ES/GQ5S
ED/GQ5D
WS-R/GQ6S
WD/GQ6D
GQ7S
GQ7D
GQ8S
GQ8D
GQ9S
GQ9D
GQ10S
GQ10D
NPUG

TE14027 Stanley Rd_desktop hydrogeological investigation.0a Month YYYY | Page 41
Phase 1: Desktop Hydrogeological Investigation
Stanley Road Landfill
Prepared for Bunbury-Harvey Regional Council
Chart 33 Sulphate concentrations
3.4.7.3 Alkalinity
Alkalinity/hardness was not monitored prior to January 2014. As shown in Chart 34 below,
concentrations at GQ1D, GQ2S, GQ6S, GQ6D, GQ7S, GQ8S and GQ8D exceeded Drinking
Water (Aesthetic, 200 mg/L) during one or more rounds. Concentrations were generally
stable with the exception of GQ6S (WS-R) GQ8S and GQ8D which showed fluctuations over
the limited monitoring period. Concentrations at GQ1D (SWD), GQ2S (1S), GQ6S (WS-R),
GQ6D (WD), GQ8S and GQ8D, exceeded the adopted assessment criteria during the last
sampling round (October 2014).
0
200
400
600
800
1,000
1,200Ja
n-1
1
Ap
r-1
1
Jul-
11
Oct
-11
Jan
-12
Ap
r-1
2
Jul-
12
Oct
-12
Jan
-13
Ap
r-1
3
Jul-
13
Oct
-13
Jan
-14
Ap
r-1
4
Jul-
14
Oct
-14
mg/L
Sulphate SWS-R/GQ1S
SWD/GQ1D
1S/GQ2S
1D/GQ2D
SES/GQ3S
SED/GQ3D
2S/GQ4S
2D/GQ4D
ES/GQ5S
ED/GQ5D
WS-R/GQ6S
WD/GQ6D
GQ7S
GQ7D
GQ8S
GQ8D
GQ9S
GQ9D
GQ10S
GQ10D
NPUG
Drinking Water Health Value
Drinking Water Aesthetic

TE14027 Stanley Rd_desktop hydrogeological investigation.0a Month YYYY | Page 42
Phase 1: Desktop Hydrogeological Investigation
Stanley Road Landfill
Prepared for Bunbury-Harvey Regional Council
Chart 34 Hardness/Alkalinity concentrations
3.4.8 Pesticides
Laboratory analysis for organochlorine and organophosphate pesticides was conducted
annually during the October sampling round. Concentrations at each well location during
each sampling round were below adopted assessment criteria and below laboratory
detection limits.
3.4.9 Polychlorinated Biphenyls
Laboratory analysis for PCBs was conducted annually during the October sampling round.
Concentrations at each well location during each sampling round were below adopted
assessment criteria and below laboratory detection limits.
3.4.10 Physical Parameters
3.4.10.1 pH
The DER pH range for Drinking Water and Fresh Water is between 6.5-8.5. The pH at all the
wells during each sampling round did not exceed the upper limit of this range, however was
below the lower 6.5 limit at all wells with the exception of GQ7S, GQ9S and GQ10S during
one or more sampling rounds as shown in Chart 35 below. During the last sampling round
(October 2014), pH at the following wells were below the lower limit GQ1S (SWS), GQ2D (1D),
GQ3S (SES), GQ4S (2S), GQ5S (ES), GQ5D (ED),GQ7D, GQ9S and GQ10D.
The pH was considered to be stable with a general trend showing a slight increase over time.
With the exception of GQ1D (SWD) where pH fell in July 2011 no major fluctuations have
been observed. Groundwater was considered to be generally slightly acidic to neutral.
0
500
1000
1500
2000
2500
Jan-14 Apr-14 Jul-14 Oct-14
Alkalinity/Hardness SWS-R/GQ1S
SWD/GQ1D
1S/GQ2S
1D/GQ2D
SES/GQ3S
SED/GQ3D
2S/GQ4S
2D/GQ4D
ES/GQ5S
ED/GQ5D
WS-R/GQ6S
WD/GQ6D
GQ7S
GQ7D
GQ8S
GQ8D
GQ9S
GQ9D
GQ10S
GQ10D
Fresh Water

TE14027 Stanley Rd_desktop hydrogeological investigation.0a Month YYYY | Page 43
Phase 1: Desktop Hydrogeological Investigation
Stanley Road Landfill
Prepared for Bunbury-Harvey Regional Council
Chart 35 pH concentrations
3.4.10.2 Conductivity
As shown in Chart 36 below, conductivity was generally stable over time at each of the wells
with the exception of GQ3S (SES) and GQ6S (WS-R) which showed large fluctuations.
Seasonal fluctuations were observed at GQ3S (SES), with highest conductivity occurring in
April and lowest in October sampling months, and highest at GQ6 (WS-R) recorded in
October and lowest in April sampling months.
Chart 36 Conductivity concentrations
0
1
2
3
4
5
6
7
8
9
Jan
-11
Ap
r-1
1
Jul-
11
Oct
-11
Jan
-12
Ap
r-1
2
Jul-
12
Oct
-12
Jan
-13
Ap
r-1
3
Jul-
13
Oct
-13
Jan
-14
Ap
r-1
4
Jul-
14
Oct
-14
pH SWS-R/GQ1S
SWD/GQ1D
1S/GQ2S
1D/GQ2D
SES/GQ3S
SED/GQ3D
2S/GQ4S
2D/GQ4D
ES/GQ5S
ED/GQ5D
WS-R/GQ6S
WD/GQ6D
GQ7S
GQ7D
GQ8S
GQ8D
GQ9S
GQ9D
GQ10S
GQ10D
pH Fresh Water upper limit
pH Fresh Water lower limit
pH LT irrigation lower limit
pH LT irrigation upper limit
0
2000
4000
6000
8000
10000
12000
Jan
-11
Ap
r-1
1
Jul-
11
Oct
-11
Jan
-12
Ap
r-1
2
Jul-
12
Oct
-12
Jan
-13
Ap
r-1
3
Jul-
13
Oct
-13
Jan
-14
Ap
r-1
4
Jul-
14
Oct
-14
Conductivity SWS-R/GQ1S
SWD/GQ1D
1S/GQ2S
1D/GQ2D
SES/GQ3S
SED/GQ3D
2S/GQ4S
2D/GQ4D
ES/GQ5S
ED/GQ5D
WS-R/GQ6S
WD/GQ6D
GQ7S
GQ7D
GQ8S
GQ8D
GQ9S
GQ9D
GQ10S
GQ10D

TE14027 Stanley Rd_desktop hydrogeological investigation.0a Month YYYY | Page 44
Phase 1: Desktop Hydrogeological Investigation
Stanley Road Landfill
Prepared for Bunbury-Harvey Regional Council
3.4.10.3 TDS
As per the conductivity observations, concentrations were generally consistent over time at
each of the wells with the exception of GQ3S (SES) and GQ6S (WS-R) which showed large
fluctuations. Seasonal fluctuations were observed at GQ3S (SES), with highest TDS
concentrations occurring in April and lowest in October sampling months, with highest
concentrations at GQ6 (WS-R) recorded in October and lowest in April sampling months, as
shown in Chart 37 below.
Chart 37 TDS concentrations
3.4.10.4 TOC
Laboratory analysis was conducted for TOC between January 2011 and April 2012 and
January 2014 and October 2014. Concentrations within the shallow wells fluctuated up and
down over the monitoring period with a general increase in concentrations. As shown below
in Chart 38, concentrations within the deep wells was generally steady with no major
fluctuations with the exception of GQ5D (ED) in July 2014. There is currently no assessment
criteria for TOC provided in DER 2014 guidelines.
0
1000
2000
3000
4000
5000
6000
7000
Jan
-11
Ap
r-1
1
Jul-
11
Oct
-11
Jan
-12
Ap
r-1
2
Jul-
12
Oct
-12
Jan
-13
Ap
r-1
3
Jul-
13
Oct
-13
Jan
-14
Ap
r-1
4
Jul-
14
Oct
-14
mg/L
TDS SWS-R/GQ1S
SWD/GQ1D
1S/GQ2S
1D/GQ2D
SES/GQ3S
SED/GQ3D
2S/GQ4S
2D/GQ4D
ES/GQ5S
ED/GQ5D
WS-R/GQ6S
WD/GQ6D
GQ7S
GQ7D
GQ8S
GQ8D
GQ9S
GQ9D
GQ10S
GQ10D

TE14027 Stanley Rd_desktop hydrogeological investigation.0a Month YYYY | Page 45
Phase 1: Desktop Hydrogeological Investigation
Stanley Road Landfill
Prepared for Bunbury-Harvey Regional Council
Chart 38 TOC concentrations
0
20
40
60
80
100
120
140
160
180Ja
n-1
1
Ap
r-1
1
Jul-
11
Oct
-11
Jan
-12
Ap
r-1
2
Jul-
12
Oct
-12
Jan
-13
Ap
r-1
3
Jul-
13
Oct
-13
Jan
-14
Ap
r-1
4
Jul-
14
Oct
-14
mg/L
TOC SWS-R/GQ1S
SWD/GQ1D
1S/GQ2S
1D/GQ2D
SES/GQ3S
SED/GQ3D
2S/GQ4S
2D/GQ4D
ES/GQ5S
ED/GQ5D
WS-R/GQ6S
WD/GQ6D
GQ7S
GQ7D
GQ8S
GQ8D
GQ9S
GQ9D
GQ10S
GQ10D
TE14027 Stanley Rd_desktop hydrogeological investigation.0a Month YYYY | Page 46
Phase 1: Desktop Hydrogeological Investigation
Stanley Road Landfill
Prepared for Bunbury-Harvey Regional Council
4 Summary of Key Findings
The licensing requirements for the groundwater analysis schedule varied over the course of
the monitoring period (2011-2014), which has resulted in several data gaps for certain
analytes. However, based on available data, trends and the lack of trends have been
established. The sections below summarises the key findings associated with water quality at
the Site.
It needs to be noted that concentrations of contaminants of concern were highly variable
with little or no consistency across the Site over the monitoring rounds with the exception of
GQ7 and GQ8 which is discussed below. While groundwater flows in opposing directions
within the shallow and deep aquifer, this indicates that the aquiclude is considered to be
complete. However, contrary to this as shown in charts provided in Section 3, given
concentrations within deeper aquifer at some locations showed greater concentrations than
those recorded within the shallow aquifer, it is understood that the aquiclude may potentially
have been breached resultant of groundwater well installation and historical
excavation/sand mining activities.
4.1 Metals
Concentrations of arsenic, cadmium, chromium, lead, mercury, nickel, selenium and zinc
were below adopted assessment criteria during the last sampling round (October 2014).
Additionally, concentrations were below adopted assessment criteria over the monitoring
assessment criteria with the exception of:
Arsenic, cadmium and lead at GQ6D (WD) in October 2012;
Chromium at GQ1D (SWD) in January 2012;
Lead at GQ4D (2D) and GQ4S (2S) in April 2011 and GQ6S (WS-R) in April 2012; and
Nickel at GQ6D (WD) in July 2011 and GQ7S in January 2014.
Concentrations of aluminium exceeded adopted assessment criteria at majority of the wells
over the sampling period with exceedances identified at GQ1S (SWS), GQ2S (1S), GQ3S
(SES), GQ3D (SED), GQ4S (2S), GQ5S (ES), GQ7S, GQ7D, GQ8S, GQ8D, GQ9S, GQ10S and
GQ10D.
Zinc concentrations fluctuated across the sampling rounds exceeding Fresh Water criteria at
each well during at least one sampling round. Concentrations during the last round at each
well location were however below all adopted assessment criteria.
Concentrations of iron exceeded all adopted assessment criteria at each well during each
sampling round.
To summarise Table 4-1 shows the number of times each metal has been subject to
laboratory analysis over the last four years, the number of times each was in exceedance of
at least one assessment criteria and the relevant percentage concentrations of each
analyte were in exceedance of an assessment criteria.

TE14027 Stanley Rd_desktop hydrogeological investigation.0a Month YYYY | Page 47
Phase 1: Desktop Hydrogeological Investigation
Stanley Road Landfill
Prepared for Bunbury-Harvey Regional Council
Table 4-1: Metal Exceedances
Al As Cd Cr Cu Fe Pb Mn Ni Se Zn Hg
# times
analysed
4 16 16 16 16 10 16 16 16 4 16 4
GQ1S 4
(100%)
0 0 0 11
(69%)
10
(100%)
0 0 0 0 10
(63%)
0
GQ1D 0 0 0 0 1
(6%)
10
(100%)
1
(6%)
0 0 0 9
(56%)
0
GQ2S 3 (75%) 0 0 0 1
(6%)
10
(100%)
0 0 0 0 10
(63%)
0
GQ2D 0 0 0 0 1
(6%)
10
(100%)
0 0 0 0 10
(63%)
0
GQ3S 4
(100%)
0 0 0 7
(44%)
10
(100%)
0 0 0 0 11
(69%)
0
GQ3D 3 (75%) 0 0 0 2
(13%)
10
(100%)
0 0 0 0 10
(63%)
0
GQ4S 4
(100%)
0 0 0 2
(13%)
10
(100%)
0 1
(6%)
0 0 12
(75%)
0
GQ4D 0 0 0 0 3
(13%)
10
(100%)
0 1
(6%)
0 0 8
(50%)
0
GQ5S 4
(100%)
0 0 0 11
(69%)
10
(100%)
0 0 0 0 10
(63%)
0
GQ5D 1 (25%) 0 0 0 2
(13%)
10
(100%)
0 0 0 0 9
(56%)
0
GQ6S 0 0 0 0 1
(6%)
10
(100%)
1
(6%)
1
(6%)
0 0 5
(31%)
0
GQ6D 0 2
(12%)
1
(6%)
0 16
(100%)
10
(100%)
1
(6%)
0 1
(6%)
0 10
(63%)
0
# times
analysed
3 3 3 3 3 3 3 3 3 3 3 3
GQ7S 3 (75%) 0 0 0 0 3
(100%)
0 0 1
(6%)
0 0 0
GQ7D 3 (75%) 0 0 0 0 3
(100%)
0 0 0 0 0 0
GQ8S 3 (75%) 0 0 0 0 3
(100%)
0 0 0 0 0 0
GQ8D 3 (75%) 0 0 0 1 3
(100%)
0 0 0 0 0 0
GQ9S 3 (75%) 0 0 0 2 3
(100%)
0 0 0 0 0 0
GQ9D 0 0 0 0 0 3
(100%)
0 0 0 0 0 0
GQ10S 2 (50%) 0 0 0 0 3
(100%)
0 0 0 0 0 0
GQ10D 3 (75%) 0 0 0 0 3
(100%)
0 0 0 0 0 0

TE14027 Stanley Rd_desktop hydrogeological investigation.0a Month YYYY | Page 48
Phase 1: Desktop Hydrogeological Investigation
Stanley Road Landfill
Prepared for Bunbury-Harvey Regional Council
4.2 Hydrocarbons
Hydrocarbon exceedances identified during the sampling rounds comprised:
Benzene at GQ6D (WD), GQ6S (WS-R), GQ8D and GQ8S which exceeded Drinking
water criteria during each annual sampling round (October 2011-October 2014);
Toluene at GQ8D and GQ8S which exceeded NPUG in October 2014; and
TRH C10-C36 at each well during one or more rounds with the exception of GQ3S
(SES) and GQ5S (ES) which exceeded Dutch Intervention Value for Mineral Oil.
In general, trends observed showed increases in concentrations where exceedances were
observed with the remainder of the wells showing stable concentrations. Toluene
concentrations were stable across the sampling rounds, with exceedances observed during
the last round of sampling at GQ8D and GQ8S which was the first time these wells were
analysed for toluene. Concentrations of TRH C10-C36 also generally increased over time,
with concentrations peaking in October 2013, with a decrease in concentration during
October 2014 sampling round. Exceedances during the last sampling round (October 2014)
were identified at GQ2S (1S), GQ5D (ED), GQ6D (WD), GQ6S (WS-R), GQ8S and GQ8D.
Concentrations of all other hydrocarbons analysed and not mentioned above comprising
TRH, BTEX and PAH were below adopted assessment criteria.
4.3 Nutrients
Ammonia concentrations were generally stable across the monitoring period, with
exceedances in NPUG adopted assessment criteria at majority of the wells. During the last
sampling round (October 2014) exceedances were identified at GQ2S (1S), GQ3D (SED),
GQ4D (2D), GQ6S (WS-R), GQ6D (WD), GQ7S, GQ7D, GQ8S, GQ8D, GQ9D and GQ10D.
Ammonia Nitrogen concentrations exceeded NPUG criteria during the last sampling round
(October 2014) at GQ1D (SWD), GQ2S (1S), GQ3D (SED), GQ4D (2D), GQ5D (ED), GQ6S (WS-
R), GQ 6D, GQ 7S, GQ 7D, GQ 8S, GQ 8D, GQ 9D and GQ10D.
Concentrations of nitrate were below adopted assessment criteria during each sampling
round.
Trends showed concentrations of total nitrogen to be greatest at GQ6S over the monitoring
period. Total nitrogen exceeded adopted Fresh Water (Health Value) assessment criteria at
all wells during the last sampling round (October 2014).
Phosphorus concentrations showed a general decrease in concentrations over time, with
concentrations peaking in April 2014 sampling round. Exceedances in Long-term Irrigation
assessment criteria during the last sampling round (October 2014) were identified at GQ1S,
GQ4D, GQ5S GQ8S and GQ8D.
To summaries, Table 4-2 shows the number of times each nutrient has been subject to
laboratory analysis over the last four years, the number of times each was in exceedance of
at least one assessment criteria and the relevant percentage concentrations of each
analyte were in exceedance of an assessment criteria.

TE14027 Stanley Rd_desktop hydrogeological investigation.0a Month YYYY | Page 49
Phase 1: Desktop Hydrogeological Investigation
Stanley Road Landfill
Prepared for Bunbury-Harvey Regional Council
Table 4-2: Nutrient exceedances
Ammonia Ammonia- Nitrogen
Total Nitrogen
Nitrate Phosphorus
# times analysed 4 16 16 5 14
GQ1S 3 (75%) 13 (81%) 5 (31%) 0 0
GQ1D 4 (100%) 16 (100%) 16 (100%) 0 0
GQ2S 4 (100%) 16 (100%) 16 100%) 0 0
# times analysed 4 16 15 5 14
GQ2D 0 0 7 (47%) 0 0
GQ3S 1 (25%) 6 (38%) 15 (100%) 5
# times analysed 3 16 15 5 14
GQ3D 3 (100%) 7 (44%) 15 (100%) 0 0
GQ4S 1 (33%) 8 (50%) 15 (100%) 0 1 (7%)
# times analysed 5 16 15 5 14
GQ4D 4 (80%) 12 (75%) 15 (100%) 0 0
# times analysed 4 16 15 5 14
GQ5S 0 2 (13%) 15 (100%) 0 10 (71%)
# times analysed 5 16 15 5 14
GQ5D 4 (80%) 15 (94%) 15 (100%) 0 0
# times analysed 4 16 15 5 14
GQ6S 4 (100%) 15 (94%) 15 (100%) 0 0
# times analysed 2 16 15 5 14
GQ6D 2 (100%) 16 (100%) 15 (100%) 0 0
# times analysed 2 3 2 5 3
GQ7S 2 (100%) 3 (100%) 2 (100%) 0 0
GQ7D 2 (100%) 3 (100%) 2 (100%) 0 0
GQ8S 2 (100%) 3 (100%) 2 (100%) 0 0
GQ8D 2 (100%) 3 (100%) 2 (100%) 0 1 (33%)
# times analysed 3 3 2 5 3
GQ9S 2 (67%) 1 (33%) 2 (100%) 0 1 (33%)
GQ9D 3 (100%) 3 (100%) 2 (100%) 0 0
# times analysed 2 3 2 5 3
GQ10S 0 0 1 (50%) 0 0
GQ10D 2 (100%) 3 (100%) 2 (100%) 0 0
4.4 Major Anions
Major anions analysed comprised chloride, sulphate and alkalinity.
Chloride concentrations were generally stable across the sampling rounds, with major
seasonal fluctuations observed at GQ3S. Chloride exceedances of adopted assessment
criteria comprising Drinking Water (Aesthetic) and NPUG during the last sampling round

TE14027 Stanley Rd_desktop hydrogeological investigation.0a Month YYYY | Page 50
Phase 1: Desktop Hydrogeological Investigation
Stanley Road Landfill
Prepared for Bunbury-Harvey Regional Council
(October 2014) were identified at GQ1D, GQ2S, GQ2D, GQ3S, GQ5D, GQ6S, GQ6D, GQ7S,
GQ7D, GQ8S, and GQ8D.
No general trend could be established for sulphate concentrations given a large data gap
from April 2012 to January 2014. Concentrations however were below adopted assessment
criteria comprising NPUG and Drinking Water (Health Value) during each sampling round at
each well with the exception of GQ2S which exceeded Drinking Water (Health Value) in April
2014 and October 2014.
In relation to alkalinity/hardness, this was not monitored prior to 2014. Analysis results for 2014
showed some exceedances over the monitoring period with concentrations to be in
exceedance of Drinking Water (Aesthetic Value) at GQ1D, GQ2S, GQ6S, GQ6D, GQ8S and
GQ8D during the last sampling round (October 2014).
4.5 Major Cations
Major cations analysed comprised calcium, magnesium, sodium and potassium. No current
DER assessment criteria are available for cations. Major cations with the exception of
potassium were not analysed prior to January 2014.
Concentrations of calcium, magnesium and sodium stayed relatively stable over the with the
exception of GW3S (SES) which showed a significant decrease in sodium concentrations
between April 2014 and October 2014.
Potassium concentrations were generally stable at majority of the wells with large fluctuations
observed at GQ6S (WS-R) and GQ3S (SES). Highest concentrations of potassium at GQ6S
(WS-R) were observed in October with lowest in April and the opposite.
4.6 Pesticides and PCBs
No exceedances of OCPs, OPPs or PCBs were identified at any of the well locations during
the annual sampling rounds conducted in October of each year. In addition, concentrations
were below laboratory detection limits. It is therefore in considered that there is no risk to
human or ecological health relation to pesticide and PCB concentrations.
4.7 GQ7 and GQ8
As previously stated in Section 2.3.2, it appears that the shallow groundwater well GQ7S was
installed too deep, which targets groundwater within both the shallow and deep aquifers.
This is further supported by very similar groundwater chemistry reported at GQ7S and GQ7D,
whereas there appears to be no connectivity between the shallow and deep aquifer at all
other well locations with the exception of GQ8.
The groundwater chemistry reported at both GQ8S and GQ8D was very similar. Based on
the drillers logs (GHD, 2014b), it appears that the shallow groundwater well GQ8S was
installed correctly with sufficient separation distance between the shallow and the deep
aquifer. Following discussions with BHRC, it was identified that GQ8 had been installed too
deep, targeting both shallow and deep aquifer (as at GQ7).
Rectification measures are required to ensure that any potential pathways from the
breaches aquiclude at the two groundwater well locations (GQ7 and GQ8) are eradicated.

TE14027 Stanley Rd_desktop hydrogeological investigation.0a Month YYYY | Page 51
Phase 1: Desktop Hydrogeological Investigation
Stanley Road Landfill
Prepared for Bunbury-Harvey Regional Council
BHRC advised that this issue at GQ8 has since been rectified. The next round of quarterly
groundwater monitoring will confirm whether this has been successful or not.

TE14027 Stanley Rd_desktop hydrogeological investigation.0a Month YYYY | Page 52
Phase 1: Desktop Hydrogeological Investigation
Stanley Road Landfill
Prepared for Bunbury-Harvey Regional Council
5 Conceptual Site Model
A conceptual site model (CSM) has been developed to assess the Site with consideration to
source-pathway-receptor model for the current landuses. This CSM has been developed
using exceedances identified during the last round (October 2014) of groundwater sampling.
A copy of the CSM for the investigation area is shown in Figure 4 and is specific to the
location of the current investigation/monitoring.
5.1 Contamination Sources
The Site has been operating as a Class II landfill since 1990, a potentially contaminating
landuse as specified in DERs Assessment and management of contaminated sites (DER,
2014).
The potential sources of contamination at the Site are associated with the landfill material
itself, in particular given that the landfill cell is not lined, there is high potential for leachate to
migrate into soils beneath the waste mass and further into groundwater. There is potential for
naturally occurring high concentrations of analytes in groundwater, in addition, there is
potential for offsite sources (including the Class I landfill located directly south of the Site) to
be impacting the groundwater at the Site.
5.1.1 Primary sources of contamination
The primary sources of contamination at the Site are considered to be the landfill waste.
5.1.2 Secondary sources of contamination
Impacted soils from waste material are considered to be secondary sources of
contamination. The impacted soils have potential to leach into groundwater causing
elevated concentrations of analytes resulting in contamination.
5.2 Potential Contaminants of Concern
Given the groundwater monitoring requirements of the current Licence, the following are
considered Potential Contaminants of Concern (PCoCs):

TE14027 Stanley Rd_desktop hydrogeological investigation.0a Month YYYY | Page 53
Phase 1: Desktop Hydrogeological Investigation
Stanley Road Landfill
Prepared for Bunbury-Harvey Regional Council
Table 5-1: PCoCs
Monitored Quarterly Monitored Annually
Chemical oxygen demand (COD) Phenols
Nitrate-nitrogen Polyaromatic hydrocarbons (PAH)
Ammonia-nitrogen Organochlorine pesticides (OCP)
Total nitrogen Organophosphate pesticides (OPP)
Total phosphorus; Polychlorinated biphenyls (PCB)
Total dissolved solids (TDS) Atrazine
Total organic carbon (TOC) Benzene, toluene, ethylbenzene, xylenes (BTEX)
Major anions and cations – calcium, magnesium, potassium, sodium, chloride, bicarbonate and sulphate
Total petroleum hydrocarbons (TPH)
Heavy metals – aluminium, arsenic, cadmium, chromium, copper, iron (total), lead, manganese, mercury, nickel, selenium and zinc
Trichlorethylene/Perchloroethylene
Whilst groundwater monitoring of the abovementioned PCoCs is a Licence requirement,
based on the laboratory analysis results obtained from the last round of groundwater
sampling (October 2014), the following PCoCs were identified to be in exceedance of
adopted assessment criteria at one or more groundwater well locations:
pH;
Ammonia;
Nitrogen (total);
Phosphorous;
Metals comprising: aluminium, iron, manganese and zinc;
Toluene; and
TRH C10-C36.
These were considered during the preparation of the CSM.
5.2.1 Exceedances
Exceedances in the following PCoCs for the adopted assessment criteria as shown below in
Table 5-2 were identified during the last round of groundwater monitoring conducted by
GHD in October 2014:
Table 5-2: Exceedances in groundwater – October 2014
Analyte Fresh Water NPUG Long Term
Irrigation
pH Criteria 6.5-8.5 NA NA
Wells
Shallow GQ1S, GQ3S, GW4S, GQ5S and GQ9S
Deep GQ2D, GQ3D, GQ5D, GQ7D, and GQ10D
Ammonia Criteria 0.9 mg/L NA NA

TE14027 Stanley Rd_desktop hydrogeological investigation.0a Month YYYY | Page 54
Phase 1: Desktop Hydrogeological Investigation
Stanley Road Landfill
Prepared for Bunbury-Harvey Regional Council
Analyte Fresh Water NPUG Long Term
Irrigation
Wells
Shallow GQ2S, GQ6S, GQ7S, GQ8S
Deep GQ1D, GQ5D, GQ6D, GQ7D, GQ8D
Nitrogen (total)
Criteria 0.9 mg/L NA 0.5 mg/L
Wells
GQ2S, GQ6S, GQ7S, GQ8S
GQ2S, GQ6S, GQ8S
GQ1D, GQ6D, GQ8D GQ1D, GQ6D, GQ8D
Phosphorus Criteria NA NA 0.05 mg/L
Wells Shallow GQ1S, GQ8S
Deep GQ4D, GQ8D
Aluminium Criteria 0.055 mg/L NA NA
Wells
Shallow GQ1S, GQ2S, GQ3S, GQ4S, GQ5S, GQ7S, GQ8S, GQ9S, GQ10S
Deep GQ7D, GQ10D
Iron Criteria 3 mg/L 0.3 mg/L 0.2 mg/L
Wells
Shallow GQ1S, GQ2S, GW3S, GQ6S, GQ9S
GQ1S, GQ2S GQ3S, GQ4S GQ6S, GQ7S
GQ8S, GQ9S GQ10S
GQ1S-GQ10S
Deep GQ1D, GQ2D, GW3D, GW4D, GQ5D, GQ6D,
GQ7D, GQ9D
GQ1D-GQ10D GQD-GQ10D
Manganese Criteria NA NA 0.2 mg/L
Wells
Shallow NA
Deep GQ4D, GQ6D GQ9D
Zinc Criteria 0.008 mg/L NA NA
Wells
Shallow GQ1S
Deep NA
Toluene Criteria NA 0.025 mg/L NA
Wells Shallow GQ8S
Deep GQ8D
TRH C10-C36 Criteria 0.6 mg/L (Dutch
Intervention Value) NA NA
Wells
Shallow GQ2S, GQ6S, GQ7S
Deep GQ5D, GQ6D, GQ7D, GQ8D
NA: no exceedance, blacked out boxes

TE14027 Stanley Rd_desktop hydrogeological investigation.0a Month YYYY | Page 55
Phase 1: Desktop Hydrogeological Investigation
Stanley Road Landfill
Prepared for Bunbury-Harvey Regional Council
5.3 Transportation Mechanisms
The following transportation mechanisms of PCoCs have been identified:
Waste becoming wet and truning into leachate;
Leaching from impacted soil into groundwater; and
Transportation down-hydraulic gradient in groundwater.
5.4 Exposure Pathways
The following are considered the likely primary pathways for migration of PCoC:
Dermal contact;
Ingestion;
Inhalation; and
Ecologically sensitive environment.
5.5 Receptors
Given the current industrial landuse of the site and surrounding industrial landuses, the
following human and ecological receptors have been identified:
Onsite:
o Site workers ; and
o Conservation Category Wetland.
Offsite:
o Down-gradient site occupiers/workers (landfill to the south and sand mine to
the west);
o Residential properties to the west; and
o Brunswick and Wellesley Rivers located to the south and east of the site.
5.6 Exposure Pathways and Risk Assessment
The table below identifies receptor-exposure-pathways associated with groundwater
contamination located at the Site.
Table 5-3 Risk Assessment – groundwater
Receptor Exposure Pathway
Pathway
(Complete/
Partially complete/
Incomplete)
Reasoning Risk
Onsite - Workers
Dermal contact of groundwater
Complete One production bore is located at the Site. Groundwater from the production bore located at the site is abstracted for dust suppression only. Groundwater from the network of groundwater wells located across the Site is only abstracted for environmental monitoring/testing purposes. It is therefore considered that the pathway between workers and
Low
Onsite - Workers
Ingestion of groundwater
Complete

TE14027 Stanley Rd_desktop hydrogeological investigation.0a Month YYYY | Page 56
Phase 1: Desktop Hydrogeological Investigation
Stanley Road Landfill
Prepared for Bunbury-Harvey Regional Council
Receptor Exposure
Pathway
Pathway
(Complete/
Partially complete/
Incomplete)
Reasoning Risk
groundwater is complete where workers may be exposed to groundwater via accidental ingestion or dermal contact during water spraying for dust suppression or sampling. However, given that groundwater abstraction is not continuously occurring (i.e. consistent prolonged exposure on a daily basis) it is therefore considered that the risk to human health associated with elevated concentrations of metals and hydrocarbons is low.
Onsite – Ecological receptors; wetland
Groundwater flow to the north/north-west within the shallow aquifer
Partially Complete
A conservation category wetland (ASK, 2013) present within the northern portion of the Site may be potentially exposed to impacted groundwater from the shallow aquifer flowing within a north/north-westerly direction. Majority of the wetland is located to the north-east of the landfilling areas (approximately 200 m buffer around the wetland exists), therefore based on general groundwater flow direction; the wetland is located cross gradient. It is therefore considered that the pathway is partially complete, with low potential of adverse effects from the landfill. Therefore the risk to ecological health of the wetland Is considered to be low.
Low
Offsite – workers and occupiers, west of the site
Dermal contact with groundwater
Complete Adjacent site to the west (Sand mine) and south each have a registered production bore. It is assumed that groundwater use at each of the sites is not used for potable purposes but for non-potable use such as dust suppression. There is potential for accidental ingestion and dermal contact of impacted groundwater during spraying. It is therefore considered that the pathway is complete; however offsite well GQ10 (located west of the site), with the exception of iron, identified not exceedances. Therefore risk to offsite workers (human health)
Low
Offsite – workers and occupiers, west of the site
Ingestion of groundwater
Complete

TE14027 Stanley Rd_desktop hydrogeological investigation.0a Month YYYY | Page 57
Phase 1: Desktop Hydrogeological Investigation
Stanley Road Landfill
Prepared for Bunbury-Harvey Regional Council
Receptor Exposure
Pathway
Pathway
(Complete/
Partially complete/
Incomplete)
Reasoning Risk
associated with nutrient, metal and hydrocarbon exceedances identified at the site to be low.
Offsite – workers and occupiers south of the site
Dermal contact of groundwater
Complete Adjacent site to the south of the Site (Class I landfill) has a registered production bore. It is assumed that groundwater use at the Site is not used for potable purposes but for non-potable use such as dust suppression. There is potential for accidental ingestion and dermal contact of impacted groundwater during spraying. It is therefore considered that the pathway is complete. Given that general groundwater flow direction within the deep aquifer is south-east there is potential for contamination identified in groundwater to migrate offsite therefore there is potential risk to offsite workers (human health) associated with nutrient, metal and hydrocarbon exceedances, in particular given that exact use and exposure times are unknown. Further investigations would be required to establish whether contamination is migrating offsite.
Medium
Offsite – workers and occupiers south of the site
Ingestion of groundwater
Complete
Offsite – residential properties
Dermal contact of groundwater
Incomplete It was identified that 17 registered domestic groundwater bores are located within 1 km of the site, majority of which are located with the west of the Site. Given groundwater flow within the shallow aquifer is to the west, there is potential for identified contamination/exceedances to migrate offsite towards the residential properties. No delineation groundwater bores have been installed to identify the extent of contamination. However given the distance (nearest property located approximately 800 m from the site), there is a low potential for contamination associated with the Site to impact these registered groundwater bores. It is therefore considered that the pathway is incomplete and the
Low
Offsite – residential properties
Dermal contact or ingestion of groundwater
Incomplete
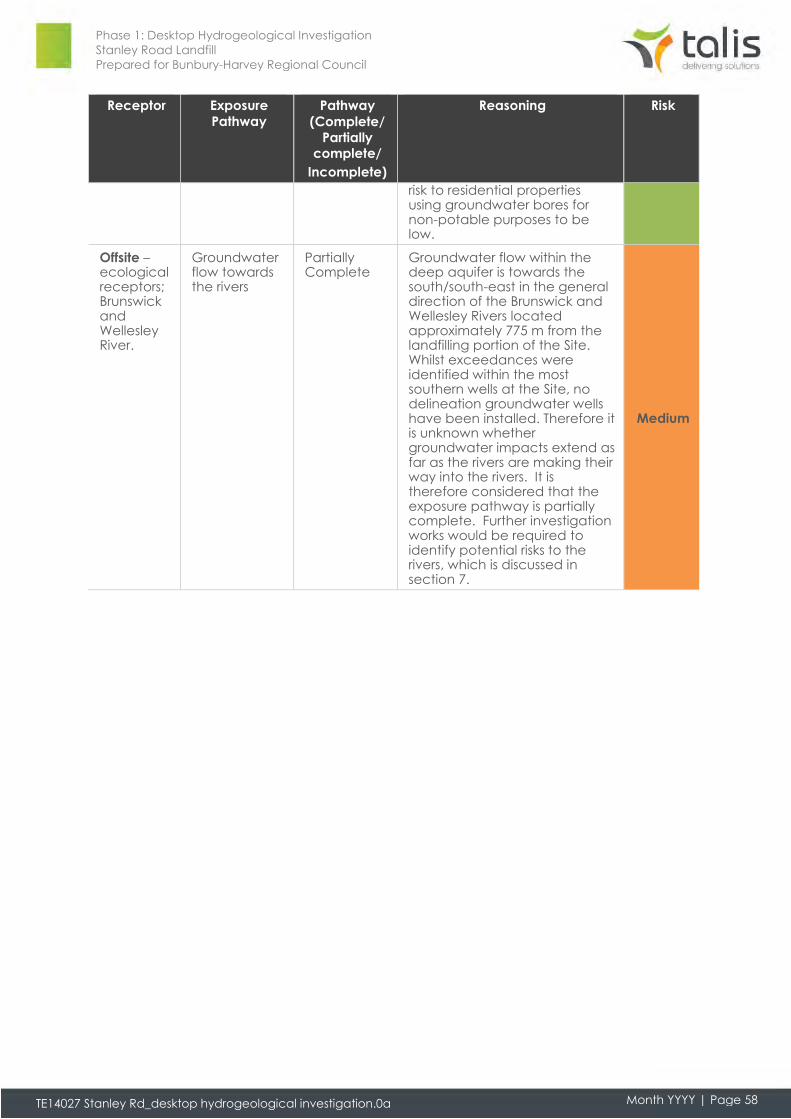
TE14027 Stanley Rd_desktop hydrogeological investigation.0a Month YYYY | Page 58
Phase 1: Desktop Hydrogeological Investigation
Stanley Road Landfill
Prepared for Bunbury-Harvey Regional Council
Receptor Exposure
Pathway
Pathway
(Complete/
Partially complete/
Incomplete)
Reasoning Risk
risk to residential properties using groundwater bores for non-potable purposes to be low.
Offsite – ecological receptors; Brunswick and Wellesley River.
Groundwater flow towards the rivers
Partially Complete
Groundwater flow within the deep aquifer is towards the south/south-east in the general direction of the Brunswick and Wellesley Rivers located approximately 775 m from the landfilling portion of the Site. Whilst exceedances were identified within the most southern wells at the Site, no delineation groundwater wells have been installed. Therefore it is unknown whether groundwater impacts extend as far as the rivers are making their way into the rivers. It is therefore considered that the exposure pathway is partially complete. Further investigation works would be required to identify potential risks to the rivers, which is discussed in section 7.
Medium

TE14027 Stanley Rd_desktop hydrogeological investigation.0a Month YYYY | Page 59
Phase 1: Desktop Hydrogeological Investigation
Stanley Road Landfill
Prepared for Bunbury-Harvey Regional Council
6 Landfill Capping
The current landfill cell is running out of currently available airspace. Talis is currently
preparing a landfill Closure Plan for the Site with the installation of geosynthetic clay liner to
cover the waste masses and eliminate stormwater infiltration of the waste material in
accordance with Best Practice Environmental Management (BPEM) – Siting, design and
rehabilitation of closed landfill sites (EPA Vic, 2014). It is proposed that the capping works will
be phased with a commencement date of late 2015.
Given that the current landfill cell is unlined, leachate generated as a result of water (e.g.
rainfall, stormwater runoff, chemicals, oils, sullage etc.) coming into contact with
decomposing waste has seeped into the porous soils beneath the waste mass, which has
further resulted in adverse impacts to groundwater. As identified in Section 3, laboratory
analysis results showed elevated concentrations of hydrocarbons, nutrients, metals and ions
which exceeded DER (2014) adopted assessment criteria, with varying concentrations and
distributions of contaminants of concern across the Site.
Through the capping and closure design, this will minimise ongoing impacts to groundwater.
Where the landfill is no longer receiving additional waste and the landfill is capped of in
accordance with the BEPM (EPA Vic, 2014) guidelines, groundwater conditions over time are
anticipated to improve. With improved groundwater conditions at the Site, and assuming
that groundwater contamination at the Site is solely related to onsite use (i.e. not attributed
to the Class I landfill located to the south), the risk to users as identified in section 5.6 will
decrease. A comparison between current risk (as identified in section 5.6) and anticipated
risk following capping and closure is shown in Table 6-1 below.

TE14027 Stanley Rd_desktop hydrogeological investigation.0a Month YYYY | Page 60
Phase 1: Desktop Hydrogeological Investigation
Stanley Road Landfill
Prepared for Bunbury-Harvey Regional Council
Table 6-1 Risk Assessment – groundwater: post closure
Receptor Exposure Pathway Pathway
(Complete/
Partially complete/
Incomplete)
Current Risk as per CSM
Future Risk
with landfill
cell capped and closed
Onsite - Workers
Dermal contact or ingestion of groundwater
Complete Low Low
Onsite – Ecological receptors; wetland
Groundwater flow to the north/north-west within the shallow aquifer
Partially Complete
Low Low
Offsite – workers and occupiers, west of the site
Dermal contact or ingestion of groundwater
Complete Low
Low
Offsite – workers and occupiers south of the site
Dermal contact or ingestion of groundwater
Complete
Medium Low
Offsite – residential properties
Dermal contact or ingestion of groundwater
Incomplete Low Low
Offsite – ecological receptors; Brunswick and Wellesley River.
Groundwater flow towards the rivers
Partially Complete
Medium Low
As shown in Table 6-1 above, of particular interest is the offsite risk to workers and occupiers
south of the site and ecological receptors (Brunswick River and Wellesley River) where the risk
is reduced from medium to low following the capping and closure of the landfill cell. The risk
will be reduced with an engineered capping system, the potential for leachate generation
(via rain infiltration through the waste mass) will be reduced hence impacts to groundwater
will be reduced. It is anticipated that over time, elevated concentrations of analytes in
groundwater will reduce further reducing risk to sensitive receptors.
In order to understand the anticipated reduction in concentrations following the capping of
the landfill, Talis proposes to conduct a Phase 2 Hydrogeological Investigation. The Talis
proposes to incorporate LandSim (United Kingdoms (UK) EA approved landfill assessment
program) modelling to be undertaken as part of the Phase 2 Hydrogeological Investigation.
This model tracks leachate production, chemistry, migration and leakages through both
engineered and non-engineered structures, followed by the migration of leachate through
the unsaturated zones to assess the total impacts on the groundwater aquifer.

TE14027 Stanley Rd_desktop hydrogeological investigation.0a Month YYYY | Page 61
Phase 1: Desktop Hydrogeological Investigation
Stanley Road Landfill
Prepared for Bunbury-Harvey Regional Council
7 Conclusions
Based on the desktop investigation conducted, Talis has drawn the following conclusions:
Groundwater flow within the shallow aquifer is generally towards the north-west/north
and south within the deeper aquifer.
The groundwater profiles (as shown in Appendix A) confirm that there appears to be
distinct separation of the shallow and deep aquifers.
If this was not the case then the groundwater profiles would coincide with one
another;
The separation of the aquifers is considered to be associated with an intact low
permeability clay aquiclude between them. Whilst this aquiclude barrier would
inhibit migration of contamination between the two aquifers, it is still possible for
migration between the shallow and deep aquifer, however it would take a
comparatively long time to manifest itself. The presence of the clay layer would in
any case strip out some of the contamination in the leachate passing through it
via cation exchange;
Groundwater profiles prepared were predicted by the limited available monitoring
data as there is datum time sequence for the monitoring wells. It is however important
to note that the various lagoons that are located to the south, north-west and north-
east of the main landfill area (which were previously unlined) significantly influenced
the pattern of the groundwater contours as they act as sumps which will attract the
groundwater towards them. Given that this has not been monitored to the same
degree as the wells and consequently the data has not been incorporated into the
plans contained in Appendix A.
In summary, the contamination can be summarised as follows:
Groundwater is considered to be impacted by landfill leachate to some degree
with elevated concentrations of nutrients, ions and, with organic and
hydrocarbon odours observed by GHD staff across the wells monitored between
January 2011 and October 2014;
Indicated by pH values, groundwater was considered to be slightly acidic to
neutral;
The most impacted well identified appeared to be GQ6S, which generally on
average had greatest concentrations of nutrients, metals, TRH C10-C36, physical
parameters, anions and cations;
BTEX showed concentrations to be below adopted assessment criteria at all wells
with the exception of toluene which exceeded NPUG at GQ8S and GQ8D in
October 2014;
Concentrations of TRH exceeded Dutch Intervention Value for Mineral Oil at
GQ2S (1S), GQ5D (ED), GQ6S (WSR), GQ6D (WD), GQ7D, GQ7S, GQ8S and GQ8D
in October 2014;
PAH, OCP, OPP, PCB and nitrate were below adopted assessment criteria at
each well during each sampling round;
Metals comprising: arsenic, cadmium, chromium, lead, manganese, mercury,
selenium and zinc were below adopted assessment criteria at all well locations
during the last round of sampling (October 2014). Of these metals, some
exceedances were identified during previous sampling rounds, with most frequent
and diverse metal exceedances occurring at GQ6D and GQ6S;

TE14027 Stanley Rd_desktop hydrogeological investigation.0a Month YYYY | Page 62
Phase 1: Desktop Hydrogeological Investigation
Stanley Road Landfill
Prepared for Bunbury-Harvey Regional Council
Concentrations of iron exceeded all adopted assessment criteria comprising
NPUG, Fresh Water (Aesthetic Value) and Long-term Irrigation at every well during
each sampling round;
It is considered that a potential breach in the aquiclude may have occurred
between the shallow and deep aquifer at GQ8 given the significantly similar
groundwater chemistry reported at this location.
The significantly similar groundwater chemistry reported at GQ7S and GQ7D may be
associated with the shallow well GQ7S being installed too deep, where it is targeting
both the shallow and deep aquifer.
Tables 6.1 and 6.2 present a summary of the percentage exceedances for one or
more of the criteria. It was identified that:
Typical indicators of leachate include ammonia, ammoniacal nitrogen and total
nitrogen, which showed elevated concentrations in the majority of the wells; and
Only some of the metals exceed the adopted guidelines whereas in leachate
derived from municipal waste sources the majority of these determinants are
usually present;
If separation between two aquifers is existent, it can be assumed that the deeper
aquifer would be less impacted than the shallow aquifer. However, this is not
consistently evident across all monitoring wells;
This is demonstrated for ammonia, ammoniacal nitrogen and total nitrogen in
wells GQ1, GQ3, GQ4, GQ5, GQ6, GQ9 and GQ10 where the deeper aquifer has
been exhibiting a greater number of exceedances than the shallow one. It would
be assumed that unless there is an external source of contamination the number
of exceedances for the shallow aquifer would not be less than for the deeper
one. This concentrations do not reflect the same distribution. Of particular interest
is that for GQ7D and GQ8D the deep aquifer is theoretically up-hydraulic
gradient of the ‘source’ and therefore should not be so greatly impacted,
however both the shallow and deeper aquifers the results all exceed the adopted
guidelines.
One conclusion that could be drawn is that the separating aquiclude may not be
totally complete and to some extent there is some cross contamination. This is
supported by:
Chemistry at two locations in the shallow and deep wells at GQ7 and GQ8
being very similar, whereas the remainder of the wells show completely
different chemistry between the shallow and deep well;
Review of drillers logs for GQ7S which identified the well was installed past the
aquiclude, partially into the deeper aquifer;
Liaison with BHRC advising GQ8S was also installed too deep as well
breaching the aquiclude between the shallow and deep aquifer, which has
since been rectified;
GQ7S will need to be decommissioned and replaced with a new shallower well;
and
Further investigation is required to identify potential offsite impacts and how they
affect the background chemistry of the groundwater. There is some strong
evidence to suggest that there are offsite contaminative sources such as up-
hydraulic gradient contamination of the aquifers, the presence of an offsite
“inert” landfill and the greater impacts on the deeper aquifer.
BHRC proposes to install a BPEM standard capping layer as part of the closure and
rehabilitation of the current extent of the landfill.

TE14027 Stanley Rd_desktop hydrogeological investigation.0a Month YYYY | Page 63
Phase 1: Desktop Hydrogeological Investigation
Stanley Road Landfill
Prepared for Bunbury-Harvey Regional Council
This engineered capping system will dramatically reduce the generation of
leachate through the minimisation of rainfall seepage into the waste mass. The
inclusion of the low permeability capping layer (geosynthetic clay liner) will in
theory reduce the leachate from entering groundwater;
The magnitude of the improvement will be dependent on the mass flow of
leachate entering groundwater. This requires an understanding of the rainfall,
permeability of the capping layer and hydrogeological structure of the area; and
It is considered that the source of contamination will be reduced over time which
will result in impacts to groundwater to be significantly reduced.
It is important to note that external sources of contamination could potentially be the
dominant contributor to long term impacts on to groundwater at the Site.
Nonetheless, the inclusion of the capping layer will significantly improve the quality of
the groundwater regime.
To fully understand the scale of improvement and the timeframe over which the
improvement will occur will require a more in-depth computer analysis. This will require
additional monitoring wells to be installed to gather greater spatial information and
the relevant hydrogeological parameters which will be included into a Phase 2
Hydrogeological Investigation:
Additional monitoring wells (Figure 5) would be installed to infill gaps in the existing
spatial array. They will comprise:
Two pair wells (GQ11 and GQ12) will be installed to the south-east of the Site
to establish groundwater depression in the upper aquifer as it nears the
Brunswick River. It will also be used to identify potential offsite movement of
contaminants of concern;
Two pair wells (GQ13 and GQ14) will be installed to the north of the waste
mass to determine groundwater profile and decay in chemistry;
One well pair (GQ15) will be installed to the north-east of the waste mass
within the topographic depression at the Site and betweeGQ4 and GQ5;
Three well pairs (GQ16, GQ17 and GQ18) to be installed further north, offsite
beyond the extremity of the proposed new landfill cells (Regional Landfill) to
determine the groundwater profile; and
One well (GQ19) will be installed within the waste mass to identify whether
potential leachate mounding is occurring.
During the drilling of the boreholes a number of hydrogeological properties will be
determined to inform the computer analysis. This data has not been obtained
from the previous installations. Which comprise:
Geological structure;
Descriptions of the soil;
Permeability of the aquifers (i.e. Insitu testing);
Samples from further laboratory testing;
Extending the programme of water quality testing to new wells;
Collation of the all the environmental data;
Develop a computer model using either LandSim;
Create a source term by the back analysis of the monitoring data and once
completed the existing hydrogeological model will be prepared;
Undertake simulations to reflect the presence of the restoration profile and the
low permeability cap which will predict the improvements to the groundwater
regime and the likely timeframe over which the improvements will take place;
and

TE14027 Stanley Rd_desktop hydrogeological investigation.0a Month YYYY | Page 64
Phase 1: Desktop Hydrogeological Investigation
Stanley Road Landfill
Prepared for Bunbury-Harvey Regional Council
Prepare a hydrogeological report summarising the findings of the study.

TE14027 Stanley Rd_desktop hydrogeological investigation.0a Month YYYY | Page 65
Phase 1: Desktop Hydrogeological Investigation
Stanley Road Landfill
Prepared for Bunbury-Harvey Regional Council
8 Recommendations
Arising from the Phase 1 Desktop Hydrogeological Investigation, Talis recommends the
following source of actions to further understand the current and future hydrogeological
conditions at the Site:
1. Talis recommends the survey of all groundwater wells (top of casing) to AHD to be
able to complete groundwater contour plans comprising all groundwater wells;
2. Once the collation of the additional data has been obtained then a numerical Phase
2 Hydrogeological Investigation should be made to ascertain the scale of
groundwater improvement that would arise due to the installation of the low
permeability capping layer and over what period this is likely to be achieved. The
Phase 2 Hydrogeological Investigation is recommended to include:
Installation of additional groundwater monitoring wells as shown in Figure x.
During the drilling of the boreholes, determine a number of hydrogeological
properties including:
Geological structure;
Soil descriptions;
Falling head test
Geotechnical laboratory testing
Extending the programme of water quality testing to new wells;
Develop a computer model using either LandSim (UK’s EA approved landfill
assessment programme) or MODFLOW;
Create a source term by the back analysis of the monitoring data and once
completed the existing hydrogeological model will be prepared;
Undertake simulations to reflect the presence of the restoration profile and the
low permeability cap which will predict the improvements to the groundwater
regime and the likely timeframe over which the improvements will take place;
3. The continuation of regular monitoring of all the existing groundwater monitoring
including the newly installed wells;

TE14027 Stanley Rd_desktop hydrogeological investigation.0a | Version: 0a February 2015 | Page 66
Phase 1: Desktop Hydrogeological Investigation
Stanley Road Landfill
Prepared for Bunbury-Harvey Regional Council
References ASK, Groundwater Assessment, Stanley Road Waste Management Facility (ASK, 2013).
Department of Environment Regulation (DER), Assessment and Management of
contaminated sites, DER 2014
Department of Water (DoW), Kemerton Groundwater Subareas Water Management Plan,
(DoW, 2007).
DoW, Bunbury and South West Coastal groundwater areas subarea reference sheets, Plan for
the South West groundwater area allocation plan (DoW, 2009).
DoW, Water Information Reporting database
http://wir.water.wa.gov.au/SitePages/SiteExplorer.aspx website accessed on 23 January
2015.
GHD, Stanley Road Waste Disposal Site – Lot 45 Stanley Road, Wellesley WA, Prescribed
Licence No.L7067/1997/13, Quarterly Groundwater Monitoring Event Report – October 2014
(GHD, 2014a).
GHD, Stanley Road Waste Disposal Site – Lot 45 Stanley Road, Wellesley WA, Prescribed
Licence No. L7067/1997/13, Quarterly Groundwater Monitoring Event Report – July 2014
(GHD, 2014b).
GHD, Stanley Road Waste Disposal Site – Lot 45 Stanley Road, Wellesley WA, Prescribed
Licence No. L706/1997/13, Quarterly Groundwater Monitoring Event Report – April 2014 (GHD,
2014c).
GHD, Stanley Road Waste Disposal Site – Lot 45 Stanley Road, Wellesley WA, Prescribed
Licence No. L7067/1997/13, Quarterly Groundwater Monitoring Event Report – January 2014
(GHD, 2014d).
GHD, Stanley Road Waste Disposal Site – Lot 45 Stanley Road, Wellesley WA, Prescribed
Licence No. L7067/1997/12 (GHD, 2013a).
GHD, Stanley Road Waste Disposal Site – Lot 45 Stanley Road, Wellesley WA, Prescribed
Licence No. L7067/1997/12, Quarterly Groundwater Monitoring Event Report – July 2013
(GHD, 2013b).
GHD, Stanley Road Waste Disposal Site – Lot 45 Stanley Road, Wellesley WA, Prescribed
Licence No. L7067/1997/12, Quarterly Groundwater Monitoring Event Report – April 2013
(GHD, 2013c).
GHD, Stanley Road Waste Disposal Site – Lot 45 Stanley Road, Wellesley WA, Prescribed
Licence No. L7067/1997/12 (GHD, 2013d).
GHD, Stanley Road Waste Disposal Site – Lot 45 Stanley Road, Wellesley WA, Prescribed
Licence No. L7067/1997/12, Quarterly Groundwater Monitoring Event Report – January 2013
(GHD, 2013d).

TE14027 Stanley Rd_desktop hydrogeological investigation.0a | Version: 0a February 2015 | Page 67
Phase 1: Desktop Hydrogeological Investigation
Stanley Road Landfill
Prepared for Bunbury-Harvey Regional Council
GHD, Stanley Road Waste Disposal Site – Lot 45 Stanley Road, Wellesley WA, Prescribed
Licence No. L7067/1997/12, Quarterly Groundwater Monitoring Event – October 2012 (GHD,
December 2012) (GHD, 2012a).
GHD, Stanley Road Waste Disposal Site – Lot 45 Stanley Road, Wellesley WA, Prescribed
Licence No. L7067/1997/12, Quarterly Groundwater Monitoring Event – July 2012 (GHD,
September 2012) (GHD, 2012b).
GHD, Report for Stanley Road Landfill Facility Quarterly Groundwater Monitoring, April 2012
Results (GHD, June 2012) (GHD, 2012c).
GHD, Report for Stanley Road Landfill Facility, January 2012 Groundwater Monitoring Results
(GHD, January 2012) (GHD, 2012d).
GHD, Report for Stanley Road Landfill Facility, October 2011 Groundwater Monitoring Results
(GHD, October 2011) (GHD, 2011a).
GHD, Report for Stanley Road Landfill, Groundwater Monitoring (GHD, July 2011) (GHD,
2011b).
GHD, Report for Stanley Road Landfill, Quarterly Groundwater Monitoring Results (GHD, April
2011) (GHD, 2011c).
GHD, Report for Stanley Road Landfill, Quarterly Groundwater Monitoring Results (GHD,
January 2011) (GHD, 2011d).
GHD, Report for Stanley Road Landfill, Hydrogeological Assessment (GHD, 2008).

TE14027 Stanley Rd_desktop hydrogeological investigation.0a | Version: 0a February 2015 | Page 68
Phase 1: Desktop Hydrogeological Investigation
Stanley Road Landfill
Prepared for Bunbury-Harvey Regional Council
Figures Figure 1: Locality Plan
Figure 2: Surrounding landuse
Figure 3: Groundwater well locations
Figure 4: Conceptual Site Model
Figure 5: Proposed New Groundwater well locations

OLDCOAST RD MARRIOTT RD
AUSTRALINDBYPA
376,000
376,000
378,000
378,000
380,000
380,000
382,000
382,000
384,000
384,000
386,000
386,000
388,000
388,000
390,000
390,000
392,000
392,000
6,316
,000
6,316
,000
6,318
,000
6,318
,000
6,320
,000
6,320
,000
6,322
,000
6,322
,000
6,324
,000
6,324
,000
6,326
,000
6,326
,000
6,328
,000
6,328
,000
Bunbury
Docu
ment
Path:
\\SER
VER\
Talis
\SEC
TIONS
\Env
ironm
ent\P
rojec
ts\TE
2014
\TE14
027 -
Stan
ley R
d Lan
dfill -
Bunb
ury\G
IS\M
aps\T
E140
27_0
01_S
ite_L
ocali
ty.mx
d
0 100Kilometres
LEGEND
SITE LOCALITYStanley Road Landfill -
Desktop HydrogeologicalInvestigation
0 500 1,000 1,500 2,000250Meters
Coordinate System: GDA 1994 MGA Zone 50Projection: Transverse Mercator, Datum: GDA 1994, Units: Meter
Figure 01
Rev ADate:Scale @ A3:
Revision:06/03/2015
TE14027
J SkibaJ BotterillReviewed:
Checked:Prepared: R Cullen1:50,000
Project No:
Site BoundaryRoad network (MRWA)
Access RoadLocal DistributorRegional DistributorDistributor BPrimary Distributor
¤

Kemerton industrial areabuffer zone (bushalndincluding a wetland)
Vegetated land/pastoralland
Sand extraction and Class I landfill operatedby JW Cross & Sons
Sand Mine
Nearest Residential Area
drain
BRUNSWICK RIVER
WELLESLEY RIVER
BRUNSWICK RIVER
382,500
382,500
383,000
383,000
383,500
383,500
384,000
384,000
384,500
384,500
385,000
385,000
385,500
385,5006,320
,000
6,320
,000
6,320
,500
6,320
,500
6,321
,000
6,321
,000
6,321
,500
6,321
,500
6,322
,000
6,322
,000
6,322
,500
6,322
,500
Bunbury
Docu
ment
Path:
\\SER
VER\
Talis
\SEC
TIONS
\Env
ironm
ent\P
rojec
ts\TE
2014
\TE14
027 -
Stan
ley R
d Lan
dfill -
Bunb
ury\G
IS\M
aps\T
E140
27_0
02_S
urrou
nding
_LU.
mxd
0 100Kilometres
LEGEND
ADJACENT LAND USESStanley Road Landfill -
Desktop HydrogeologicalInvestigation
0 100 200 300 40050Meters
Coordinate System: GDA 1994 MGA Zone 50Projection: Transverse Mercator, Datum: GDA 1994, Units: Meter
Figure 02
Rev ADate:Scale @ A3:
Revision:06/03/2015
TE14027
J SkibaJ BotterillReviewed:
Checked:Prepared: R Cullen1:10,000
Project No:
Site BoundaryConservation CategoryWetland
Mapped Stream (Bureauof Meteorology)
Major SegmentMinor Segment
¤

!
! ! !
!
!
!!
!
!
GQ6(WSR/WD)
GQ1(SWS/SWD) GQ2
(1S/1D)GQ3
(SES/SED)
GQ4(2S/2D)
GQ5(ES/ED)
GQ7GQ8
GQ9
GQ10
383,000
383,000
383,500
383,500
384,000
384,000
384,500
384,500
385,000
385,000
6,320
,500
6,320
,500
6,321
,000
6,321
,000
6,321
,500
6,321
,500
6,322
,000
6,322
,000
Bunbury
Docu
ment
Path:
\\SER
VER\
Talis
\SEC
TIONS
\Env
ironm
ent\P
rojec
ts\TE
2014
\TE14
027 -
Stan
ley R
d Lan
dfill -
Bunb
ury\G
IS\M
aps\T
E140
27_0
03_G
WBo
res.m
xd
0 100Kilometres
LEGEND
GROUNDWATER WELL LOCATIONS
Stanley Road Landfill - Desktop Hydrogeological
Investigation0 100 200 30050
MetersCoordinate System: GDA 1994 MGA Zone 50
Projection: Transverse Mercator, Datum: GDA 1994, Units: Meter
Figure 03
Rev ADate:Scale @ A3:
Revision:06/03/2015
TE14027
J SkibaJ BotterillReviewed:
Checked:Prepared: R Cullen1:7,500
Project No:
Site Boundary
!Groundwater BoreLocations
¤

SITE
BOUNDARY
SITE
BOUNDARY
EXISTING
LANDFILL
GQ10 GQ6 GQ1 GQ2 GQ8 GQ7 GQ3 GQ9 GQ4 GQ5
GROUNDWATER FLOW
DIRECTION (TRANSPORTATION
MEDIUM)
TRH C10-C36
IRON
AMMONIA
TOTAL NITROGEN
ZINC
TOLUENE
MANGANESE
ALUMINIUMALUMINIUM
CHLORIDE
ALUMINIUM
GROUNDWATER LEVEL
GROUNDWATER LEVELCLAY LAYER
EXPOSURE PATHWAYS
LEACHATE
IMPACTED SOILS
GROUNDWATER FLOW
DIRECTION
(TRANSPORTATION MEDIUM)
GROUNDWATER FLOW
DIRECTION
(TRANSPORTATION
MEDIUM)
TRH C10-C36
TRH C10-C36 TRH C10-C36
SULPHATE
CHLORIDE
SOURCE
IRON
NOTES
1. This drawing is the property of Talis Consultants Pty Ltd. It is a confidential document and must not be copied, used, or its contents divulged without prior written consent.
2. All levels refer to Australian Height Datum.
3. DO NOT SCALE, use figured dimensions only, if in doubt please contact Talis Consultants.
No. Date App.Amendment / IssueDrw
n.Chk
.
Project: Title:Drawn by:
Checked by:
Approved by:
Scale:
Date:
Job No:
File No:
Drg. No: Rev:
Stanley Road Waste Disposal
Facility
Desktop Hydrogeological
Investigation
Conceptual Site Model
2 A
AU
JS
AM
NTS
18/02/15
TE14027
TE14027DG001
8/663 Newcastle Street, Leederville WA 6007
PO Box 454, Leederville WA 6903
T: 1300 251 070
ASSET MANAGEMENT
ENVIRONMENTAL SERVICES
SPATIAL INTELLIGENCE
WASTE MANAGEMENT
w w w . t a l i s c o n s u l t a n t s . c o m . au
Client:
Bunbury - Harvey Regional
CouncilA 18/02/15 AMIssue for ReportA
UJS
N

!
! ! !
!
!
!!
!
!
!
!
!
!
!
!
!!
GQ6(WSR/WD)
GQ1(SWS/SWD) GQ2
(1S/1D)GQ3
(SES/SED)
GQ4(2S/2D)
GQ5(ES/ED)
GQ7GQ8
GQ9
GQ10
GQ11
GQ12
GQ13
GQ14
GQ15
GQ16
GQ17GQ18
383,000
383,000
383,500
383,500
384,000
384,000
384,500
384,500
385,000
385,000
385,500
385,500
6,320
,500
6,320
,500
6,321
,000
6,321
,000
6,321
,500
6,321
,500
6,322
,000
6,322
,000
6,322
,500
6,322
,500
Bunbury
Docu
ment
Path:
\\SER
VER\
Talis
\SEC
TIONS
\Was
te\PR
OJEC
TS\TW
2013
\TW13
002 -
Esp
eranc
e Sitin
g Stud
y\GIS\
Maps
\Priv
ate La
nd\TE
1402
7_00
5_Pr
opos
ed_G
WBo
res.m
xd
0 100Kilometres
LEGEND
PROPOSED GROUNDWATER WELL LOCATIONS
Stanley Road Landfill - Desktop Hydrogeological
Investigation0 100 200 30050
MetersCoordinate System: GDA 1994 MGA Zone 50
Projection: Transverse Mercator, Datum: GDA 1994, Units: Meter
Figure 05
Rev ADate:Scale @ A3:
Revision:06/03/2015
TE14027
J SkibaJ BotterillReviewed:
Checked:Prepared: R Cullen1:8,500
Project No:
Site Boundary
!Groundwater BoreLocations
!ProposedGroundwater Bores
¤

TE14027 Stanley Rd_desktop hydrogeological investigation.0a | Version: 0a February 2015 | Page 87
Phase 1: Desktop Hydrogeological Investigation
Stanley Road Landfill
Prepared for Bunbury-Harvey Regional Council
Appendix A: Groundwater
Contour Plans

11.4 11.8
12.2
12.6
12.6
383400 383600 383800 384000 384200 384400 384600 384800 385000 385200
6320800
6321000
6321200
6321400
6321600
6321800
6322000
GQ1 GQ2 GQ3
GQ4
GQ5
GQ6
Groundwater Contour Plan -Shallow WellsOctober 2014
GQ1 = WSGQ2 = SWSGQ3 = 1SGQ4 = SESGQ5 = 2SGQ6 = ES
Bunbury-Harvey Regional CouncilHydrogeological Investigation TE14027
Talis
Page 1 of 1

1010.5 11
1111.5
11.512
12
12.5
383400 383600 383800 384000 384200 384400 384600 384800 385000 385200
6320800
6321000
6321200
6321400
6321600
6321800
6322000
GQ1 GQ2 GQ3
GQ4
GQ5
GQ6
Groundwater Contour Plan - Deep WellsOctober 2014
GQ1 = WDGQ2 = SWDGQ3 = 1DGQ4 = SEDGQ5 = 2DGQ6 = ED
Bunbury-Harvey Regional CouncilHydrogeological Investigation TE14027
Talis
Page 1 of 1
Groundwater contoursTopographical contours

11 11.4
11.8
11.8
12.2
12.2
383400 383600 383800 384000 384200 384400 384600 384800 385000 385200
6320800
6321000
6321200
6321400
6321600
6321800
6322000
GQ1 GQ2 GQ3
GQ4
GQ5
GQ6
Groundwater Contour Plan -Shallow WellsJuly 2014
GQ1 = WSGQ2 = SWSGQ3 = 1SGQ4 = SESGQ5 = 2SGQ6 = ES
Bunbury-Harvey Regional CouncilHydrogeological Investigation TE14027
Talis
Page 1 of 1

1010.5 11
11 11.5
11.512
12
12.5
383400 383600 383800 384000 384200 384400 384600 384800 385000 385200
6320800
6321000
6321200
6321400
6321600
6321800
6322000
GQ1 GQ2 GQ3
GQ4
GQ5
GQ6
Groundwater Contour Plan - Deep WellsJuly 2014
GQ1 = WDGQ2 = SWDGQ3 = 1DGQ4 = SEDGQ5 = 2DGQ6 = ED
Bunbury-Harvey Regional CouncilHydrogeological Investigation TE14027
Talis
Page 1 of 1
Groundwater contoursTopographical contours

10.6 11 11.4
11.4
11.8
11.8
12.2
12.6
383400 383600 383800 384000 384200 384400 384600 384800 385000 385200
6320800
6321000
6321200
6321400
6321600
6321800
6322000
GQ1 GQ2 GQ3
GQ4
GQ5
GQ6
Groundwater Contour Plan -Shallow WellsApril 2014
GQ1 = WSGQ2 = SWSGQ3 = 1SGQ4 = SESGQ5 = 2SGQ6 = ES
Bunbury-Harvey Regional CouncilHydrogeological Investigation TE14027
Talis
Page 1 of 1

1111.5 1212
13
13
13.5
383400 383600 383800 384000 384200 384400 384600 384800 385000 385200
6320800
6321000
6321200
6321400
6321600
6321800
6322000
GQ1 GQ2 GQ3
GQ4
GQ5
GQ6
Groundwater Contour Plan - Deep WellsApril 2014
GQ1 = WDGQ2 = SWDGQ3 = 1DGQ4 = SEDGQ5 = 2DGQ6 = ED
Bunbury-Harvey Regional CouncilHydrogeological Investigation TE14027
Talis
Page 1 of 1

10.610.8 11 11
.211
.411
.611
.8
11.8
12
12
12.2
12.2
383400 383600 383800 384000 384200 384400 384600 384800 385000 385200
6320800
6321000
6321200
6321400
6321600
6321800
6322000
GQ1 GQ2 GQ3
GQ4
GQ5
GQ6
Groundwater Contour Plan -Shallow WellsJanuary 2014
GQ1 = WSGQ2 = SWSGQ3 = 1SGQ4 = SESGQ5 = 2SGQ6 = ES
Bunbury-Harvey Regional CouncilHydrogeological Investigation TE14027
Talis
Page 1 of 1

1111.5 12
12
12.5
12.5
13
13
13.5
383400 383600 383800 384000 384200 384400 384600 384800 385000 385200
6320800
6321000
6321200
6321400
6321600
6321800
6322000
GQ1 GQ2 GQ3
GQ4
GQ5
GQ6
Groundwater Contour Plan - Deep WellsJanuary 2014
GQ1 = WDGQ2 = SWDGQ3 = 1DGQ4 = SEDGQ5 = 2DGQ6 = ED
Bunbury-Harvey Regional CouncilHydrogeological Investigation TE14027
Talis
Page 1 of 1
Groundwater contoursTopographical contours

77.5 8
8.5
99.5 10
10.5
10.5
11
11
11.5
11.512
12
383400 383600 383800 384000 384200 384400 384600 384800 385000 385200
6320800
6321000
6321200
6321400
6321600
6321800
6322000
GQ1 GQ2 GQ3
GQ4
GQ5
GQ6
Groundwater Contour Plan - Deep WellsOctober 2013
GQ1 = WDGQ2 = SWDGQ3 = 1DGQ4 = SEDGQ5 = 2DGQ6 = ED
Bunbury-Harvey Regional CouncilHydrogeological Investigation TE14027
Talis
Page 1 of 1

GQ1 GQ2 GQ3
GQ4
GQ5
GQ6
10.8
11.211.6 12 12
.4
12.4
12.8
12.8
13.2
13.6
383400 383600 383800 384000 384200 384400 384600 384800 385000 385200
6320800
6321000
6321200
6321400
6321600
6321800
6322000
Groundwater Contour Plan - Shallow WellsOctober 2013
GQ1 = WS-RGQ2 = SW-RGQ3 = 1SGQ4 = SES-RGQ5 = 2SGQ6 = ES
Bunbury-Harvey Regional CouncilHydrogeological Investigation TE14027
Talis
Page 1 of 1

10.5 1111.5
11.5 12
12
12.5
12.513
383400 383600 383800 384000 384200 384400 384600 384800 385000 385200
6320800
6321000
6321200
6321400
6321600
6321800
6322000
GQ1 GQ2 GQ3
GQ4
GQ5
GQ6
Groundwater Contour Plan - Deep WellsJuly 2013
GQ1 = WDGQ2 = SWDGQ3 = 1DGQ4 = SEDGQ5 = 2DGQ6 = ED
Bunbury-Harvey Regional CouncilHydrogeological Investigation TE14027
Talis
Page 1 of 1

9.8 10 10.2
10.4
10.6
10.8
11
11
11.2
383400 383600 383800 384000 384200 384400 384600 384800 385000 385200
6320800
6321000
6321200
6321400
6321600
6321800
6322000
GQ1 GQ2 GQ3
GQ4
GQ5
GQ6
Groundwater Contour Plan - Deep WellsApril 2013
GQ1 = WDGQ2 = SWDGQ3 = 1DGQ4 = SEDGQ5 = 2DGQ6 = ED
Bunbury-Harvey Regional CouncilHydrogeological Investigation TE14027
Talis
Page 1 of 1

GQ1 GQ2 GQ3
GQ4
GQ5
GQ6
9.8 10 10.2
10.4
10.6
10.8
11
11
11.2
383400 383600 383800 384000 384200 384400 384600 384800 385000 385200
6320800
6321000
6321200
6321400
6321600
6321800
6322000
Groundwater Contour Plan - Shallow WellsApril 2013
GQ1 = WS-RGQ2 = SW-RGQ3 = 1SGQ4 = SES-RGQ5 = 2SGQ6 = ES
Bunbury-Harvey Regional CouncilHydrogeological Investigation TE14027
Talis
Page 1 of 1

11 12
12 1313
1414 15
16
383400 383600 383800 384000 384200 384400 384600 384800 385000 385200
6320800
6321000
6321200
6321400
6321600
6321800
6322000
GQ1 GQ2 GQ3
GQ4
GQ5
GQ6
Groundwater Contour Plan - Deep WellsJanuary 2013
GQ1 = WDGQ2 = SWDGQ3 = 1DGQ4 = SEDGQ5 = 2DGQ6 = ED
Bunbury-Harvey Regional CouncilHydrogeological Investigation TE14027
Talis
Page 1 of 1

GQ1 GQ2 GQ3
GQ4
GQ5
GQ6
10.6 11 11.4
11.8
11.8
12.2
12.6
383400 383600 383800 384000 384200 384400 384600 384800 385000 385200
6320800
6321000
6321200
6321400
6321600
6321800
6322000
Groundwater Contour Plan - Shallow WellsJanuary 2013
GQ1 = WS-RGQ2 = SW-RGQ3 = 1SGQ4 = SES-RGQ5 = 2SGQ6 = ES
Bunbury-Harvey Regional CouncilHydrogeological Investigation TE14027
Talis
Page 1 of 1

9.51010.5
10.5
11
11.5
12
383400 383600 383800 384000 384200 384400 384600 384800 385000 385200
6320800
6321000
6321200
6321400
6321600
6321800
6322000
GQ1 GQ2 GQ3
GQ4
GQ5
GQ6
Groundwater Contour Plan - Deep WellsOctober 2012
GQ1 = WDGQ2 = SWDGQ3 = 1DGQ4 = SEDGQ5 = 2DGQ6 = ED
Bunbury-Harvey Regional CouncilHydrogeological Investigation TE14027
Talis
Page 1 of 1

GQ1 GQ2 GQ3
GQ4
GQ5
GQ6
9.510 10
.5
10.5
11
11
11.5
11.5
12
12
12.513 13.5
383400 383600 383800 384000 384200 384400 384600 384800 385000
6320800
6321000
6321200
6321400
6321600
6321800
6322000
Groundwater Contour Plan - Shallow WellsOctober 2012
GQ1 = WS-RGQ2 = SW-RGQ3 = 1SGQ4 = SES-RGQ5 = 2SGQ6 = ES
Bunbury-Harvey Regional CouncilHydrogeological Investigation TE14027
Talis
Page 1 of 1

1111.5 12
12 12.5
12.513
383400 383600 383800 384000 384200 384400 384600 384800 385000 385200
6320800
6321000
6321200
6321400
6321600
6321800
6322000
GQ1 GQ2 GQ3
GQ4
GQ5
GQ6
Groundwater Contour Plan - Deep WellsJuly 2012
GQ1 = WDGQ2 = SWDGQ3 = 1DGQ4 = SEDGQ5 = 2DGQ6 = ED
Bunbury-Harvey Regional CouncilHydrogeological Investigation TE14027
Talis
Page 1 of 1

GQ1 GQ2 GQ3
GQ4
GQ5
GQ6
1010.410.8 11
.211
.6
11.6
12
12
12.4
12.8
383400 383600 383800 384000 384200 384400 384600 384800 385000
6320800
6321000
6321200
6321400
6321600
6321800
6322000
Groundwater Contour Plan - Shallow WellsJuly 2012
GQ1 = WS-RGQ2 = SW-RGQ3 = 1SGQ4 = SES-RGQ5 = 2SGQ6 = ES
Bunbury-Harvey Regional CouncilHydrogeological Investigation TE14027
Talis
Page 1 of 1

1111.5 1212 12.5
12.5
13
13
13.5
383400 383600 383800 384000 384200 384400 384600 384800 385000 385200
6320800
6321000
6321200
6321400
6321600
6321800
6322000
GQ1 GQ2 GQ3
GQ4
GQ5
GQ6
Groundwater Contour Plan - Deep WellsApril 2012
GQ1 = WDGQ2 = SWDGQ3 = 1DGQ4 = SEDGQ5 = 2DGQ6 = ED
Bunbury-Harvey Regional CouncilHydrogeological Investigation TE14027
Talis
Page 1 of 1

GQ1 GQ2 GQ3
GQ4
GQ5
GQ6
10.210.6 11 11
.4
11.4
11.8
11.8
12.2
12.6
383400 383600 383800 384000 384200 384400 384600 384800 385000
6320800
6321000
6321200
6321400
6321600
6321800
6322000
Groundwater Contour Plan - Shallow WellsApril 2012
GQ1 = WS-RGQ2 = SW-RGQ3 = 1SGQ4 = SES-RGQ5 = 2SGQ6 = ES
Bunbury-Harvey Regional CouncilHydrogeological Investigation TE14027
Talis
Page 1 of 1

1111.5 12
1212.5
12.5
13
13
13.5
383400 383600 383800 384000 384200 384400 384600 384800 385000 385200
6320800
6321000
6321200
6321400
6321600
6321800
6322000
GQ1 GQ2 GQ3
GQ4
GQ5
GQ6
Groundwater Contour Plan - Deep WellsJanuary 2012
GQ1 = WDGQ2 = SWDGQ3 = 1DGQ4 = SEDGQ5 = 2DGQ6 = ED
Bunbury-Harvey Regional CouncilHydrogeological Investigation TE14027
Talis
Page 1 of 1

GQ1 GQ2 GQ3
GQ4
GQ5
GQ6
10.410.610.8 11 11
.211
.411
.6
11.6
11.8
11.8
12
12
12.2
12.2
12.4
12.6
12.813
383400 383600 383800 384000 384200 384400 384600 384800 385000
6320800
6321000
6321200
6321400
6321600
6321800
6322000
Groundwater Contour Plan - Shallow WellsJanuary 2012
GQ1 = WS-RGQ2 = SW-RGQ3 = 1SGQ4 = SES-RGQ5 = 2SGQ6 = ES
Bunbury-Harvey Regional CouncilHydrogeological Investigation TE14027
Talis
Page 1 of 1

10.5 1111.5
11.512
1212.513
383400 383600 383800 384000 384200 384400 384600 384800 385000 385200
6320800
6321000
6321200
6321400
6321600
6321800
6322000
GQ1 GQ2 GQ3
GQ4
GQ5
GQ6
Groundwater Contour Plan - Deep WellsOctober 2011
GQ1 = WDGQ2 = SWDGQ3 = 1DGQ4 = SEDGQ5 = 2DGQ6 = ED
Bunbury-Harvey Regional CouncilHydrogeological Investigation TE14027
Talis
Page 1 of 1

GQ1 GQ2 GQ3
GQ4
GQ5
GQ6
10.811.2 11
.612
12
12.4
12.4
12.8 12.8
13.213.6
383400 383600 383800 384000 384200 384400 384600 384800 385000
6320800
6321000
6321200
6321400
6321600
6321800
6322000
Groundwater Contour Plan - Shallow WellsOctober 2011
GQ1 = WS-RGQ2 = SW-RGQ3 = 1SGQ4 = SES-RGQ5 = 2SGQ6 = ES
Bunbury-Harvey Regional CouncilHydrogeological Investigation TE14027
Talis
Page 1 of 1

10.5 1111.5 12
12 12.5
12.513
383400 383600 383800 384000 384200 384400 384600 384800 385000 385200
6320800
6321000
6321200
6321400
6321600
6321800
6322000
GQ1 GQ2 GQ3
GQ4
GQ5
GQ6
Groundwater Contour Plan - Deep WellsJuly 2011
GQ1 = WDGQ2 = SWDGQ3 = 1DGQ4 = SEDGQ5 = 2DGQ6 = ED
Bunbury-Harvey Regional CouncilHydrogeological Investigation TE14027
Talis
Page 1 of 1

GQ1 GQ2 GQ3
GQ4
GQ5
GQ6
10.4
10.8
11.2
11.2
11.6
11.6
12
12
12.4
12.8
383400 383600 383800 384000 384200 384400 384600 384800 385000
6320800
6321000
6321200
6321400
6321600
6321800
6322000
Groundwater Contour Plan - Shallow WellsJuly 2011
GQ1 = WS-RGQ2 = SW-RGQ3 = 1SGQ4 = SES-RGQ5 = 2SGQ6 = ES
Bunbury-Harvey Regional CouncilHydrogeological Investigation TE14027
Talis
Page 1 of 1

11.5 1212.5
12.513
13
13.5
13.514
383400 383600 383800 384000 384200 384400 384600 384800 385000 385200
6320800
6321000
6321200
6321400
6321600
6321800
6322000
GQ1 GQ2 GQ3
GQ4
GQ5
GQ6
Groundwater Contour Plan - Deep WellsApril 2011
GQ1 = WDGQ2 = SWDGQ3 = 1DGQ4 = SEDGQ5 = 2DGQ6 = ED
Bunbury-Harvey Regional CouncilHydrogeological Investigation TE14027
Talis
Page 1 of 1

GQ1 GQ2 GQ3
GQ4
GQ5
GQ6
9.8
10.2 10.6
11
11
11.4
11.4
11.8
12.2
383400 383600 383800 384000 384200 384400 384600 384800 385000
6320800
6321000
6321200
6321400
6321600
6321800
6322000
Groundwater Contour Plan - Shallow WellsApril 2011
GQ1 = WS-RGQ2 = SW-RGQ3 = 1SGQ4 = SES-RGQ5 = 2SGQ6 = ES
Bunbury-Harvey Regional CouncilHydrogeological Investigation TE14027
Talis
Page 1 of 1

13
13
1111.5 1212 12.5
12.5
13
1313
.5
383400 383600 383800 384000 384200 384400 384600 384800 385000 385200
6320800
6321000
6321200
6321400
6321600
6321800
6322000
GQ1 GQ2 GQ3
GQ4
GQ5
GQ6
Groundwater Contour Plan - Deep WellsJanuary 2011
GQ1 = WDGQ2 = SWDGQ3 = 1DGQ4 = SEDGQ5 = 2DGQ6 = ED
Bunbury-Harvey Regional CouncilHydrogeological Investigation TE14027
Talis
Page 1 of 1

GQ1 GQ2 GQ3
GQ4
GQ5
GQ6
10.110.410.7 11 11
.3
11.3
11.6
11.6
11.9 11.9
12.2
12.5
383400 383600 383800 384000 384200 384400 384600 384800 385000
6320800
6321000
6321200
6321400
6321600
6321800
6322000
Groundwater Contour Plan - Shallow WellsJanuary 2011
GQ1 = WS-RGQ2 = SW-RGQ3 = 1SGQ4 = SES-RGQ5 = 2SGQ6 = ES
Bunbury-Harvey Regional CouncilHydrogeological Investigation TE14027
Talis
Page 1 of 1