phase 2 study of selinexor in patients with mds refractory ... · phase 2 study of selinexor in...
TRANSCRIPT
Phase 2 Study of Selinexor in Patients with MDS Refractory to Hypomethylating
Agents: Interim Report
Klimek V, Coleman M, Alvarez K, Sen F, Pichardo J, Kashyap T, Klebanov B.
(MSKCC 14-005; NCT02228525)
Virginia Klimek, MD May 6, 2017 MDS 2017
Valencia, Spain
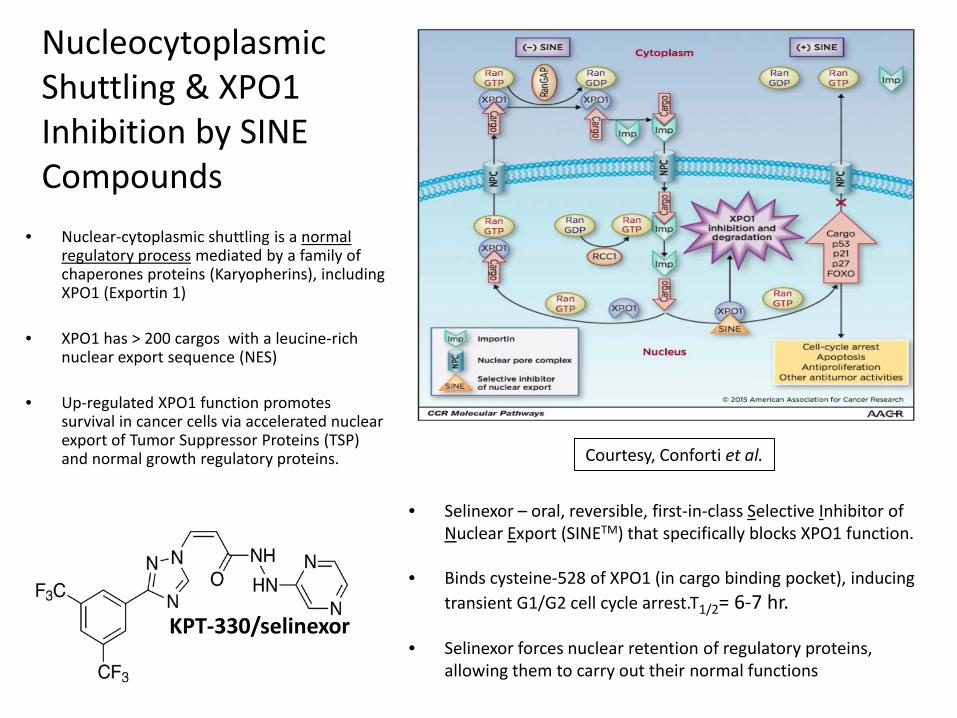
• Nuclear-cytoplasmic shuttling is a normal regulatory process mediated by a family of chaperones proteins (Karyopherins), including XPO1 (Exportin 1)
• XPO1 has > 200 cargos with a leucine-rich
nuclear export sequence (NES) • Up-regulated XPO1 function promotes
survival in cancer cells via accelerated nuclear export of Tumor Suppressor Proteins (TSP) and normal growth regulatory proteins.
Nucleocytoplasmic Shuttling & XPO1 Inhibition by SINE Compounds
• Selinexor – oral, reversible, first-in-class Selective Inhibitor of Nuclear Export (SINETM) that specifically blocks XPO1 function.
• Binds cysteine-528 of XPO1 (in cargo binding pocket), inducing
transient G1/G2 cell cycle arrest.T1/2= 6-7 hr.
• Selinexor forces nuclear retention of regulatory proteins, allowing them to carry out their normal functions
KPT-330/selinexor
Courtesy, Conforti et al.
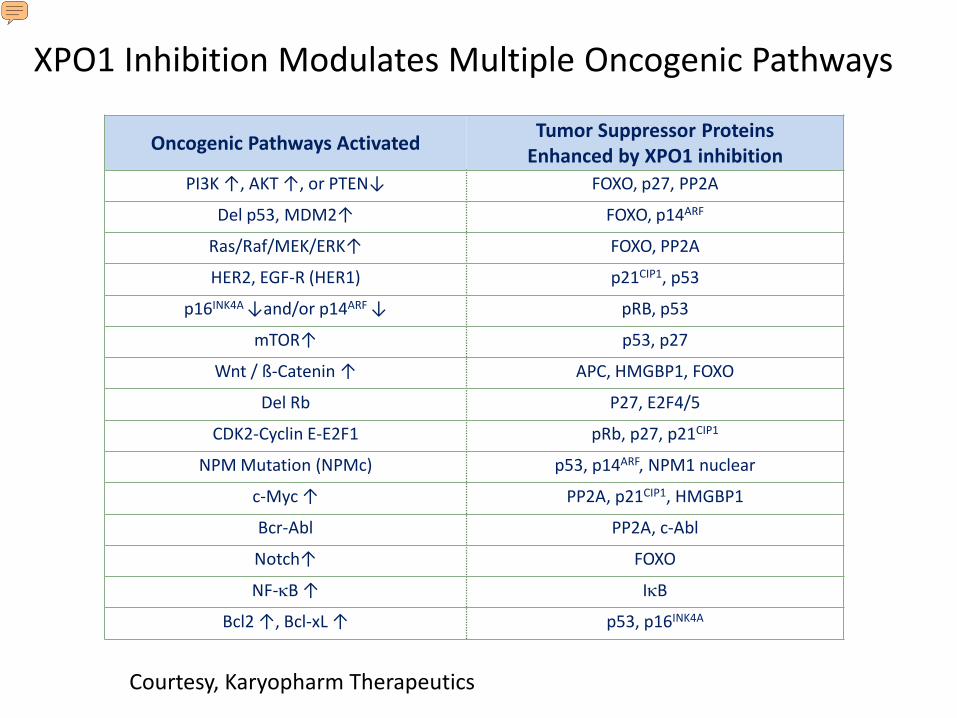
Oncogenic Pathways Activated Tumor Suppressor Proteins Enhanced by XPO1 inhibition
PI3K ↑, AKT ↑, or PTEN↓ FOXO, p27, PP2A
Del p53, MDM2↑ FOXO, p14ARF
Ras/Raf/MEK/ERK↑ FOXO, PP2A
HER2, EGF-R (HER1) p21CIP1, p53
p16INK4A ↓and/or p14ARF ↓ pRB, p53
mTOR↑ p53, p27
Wnt / ß-Catenin ↑ APC, HMGBP1, FOXO
Del Rb P27, E2F4/5
CDK2-Cyclin E-E2F1 pRb, p27, p21CIP1
NPM Mutation (NPMc) p53, p14ARF, NPM1 nuclear
c-Myc ↑ PP2A, p21CIP1, HMGBP1
Bcr-Abl PP2A, c-Abl
Notch↑ FOXO
NF-κB ↑ IκB
Bcl2 ↑, Bcl-xL ↑ p53, p16INK4A
XPO1 Inhibition Modulates Multiple Oncogenic Pathways
Courtesy, Karyopharm Therapeutics

XPO1 over-expression is seen in MDS and AML and is associated with poorer survival in AML
XPO1 expression in MDS Bone marrow mononuclear cells
Courtesy, Dr. G. Schwartz
Courtesy, Dr. Kojima (Kojima, et al. 2013)
XPO1 over-expression is associated with poorer survival in AML

Cell Line KPT330 IC50 (μM) Cell Line KPT330 IC50 (μM)
EOL1 0.010 F36P 0.380 SIGM5 0.020 BDCM 0.435 CMK 0.030 TF-1 0.438
CMK115 0.073 HEL9217 0.440 MV-4-11 0.073 NB4 0.445 OCIM1 0.080 HL-60 0.530 GDM1 0.140 AML-193 0.540 PL21 0.160 KASUMI1 0.540
OCIAML2 0.180 P31FUJ 0.588 MOLM13 0.188 SKM1 0.660
MO7e 0.200 HEL 0.820 MOLM16 0.210 THP-1 0.820 OCIAML5 0.230 CMK86 0.910
KG1 0.240 NOMO-1 1.003 OCIAML3 0.270 KO52 2.053
ME1 0.343 KASUMI6 3.170 UT7 0.365 PBMC >10
Selinexor Activity in AML Cell Lines Potent, broad cytotoxicity in cancer cells with minimal effect on normal cells (PBMC)
Courtesy, Karyopharm Therapeutics

MDS Study Rationale • Standard treatment options are limited after HMA:
AML induction therapy (if appropriate) Allo SCT (if age, medical condition, and disease status allow)
Supportive care • Survival is short following HMA failure:
IPSS Int-2/High Risk/RAEBt - 5-6 months 1
IPSS Low/Int-1 Risk – 16-17 months 2,3
• New treatments are needed for pts who progress on HMA
1Prebet T, et.al., J Clin Oncol. 2011; 29(24):3322-7 2Prebet T, et.al., Haematologica 2013; 98(2): e18-e19 3Jabbour EJ, et.al., Cancer 2015; 121(6): 876-82

Study Design
Allowable selinexor dose reductions on 3-week schedule: 40 mg twice weekly for 2 weeks 80 mg once weekly for 2 weeks
Phase 2, single arm, two-stage design. 25% RR is promising. Accrual goal=20 Primary Objective: ORR (CR+mCR+PR+HI)1 in HMA-refractory MDS Secondary Objectives: Response duration, Survival, Tolerability of chronic therapy, Pharmacodynamics (PDn) Study procedures: Serial response assessments Continuous toxicity monitoring Serial PB/BM collection for PDn Treatment allowed indefinitely, barring POD or excessive toxicity
1Cheson, BD, et.al., Blood, 2006;108, 419–425.
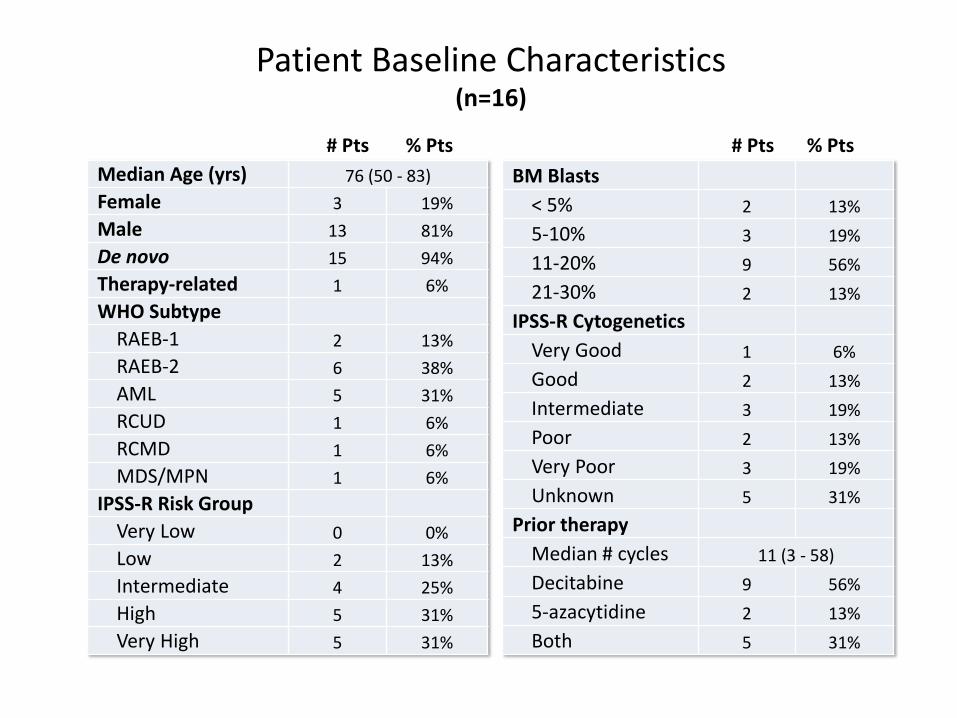
Patient Baseline Characteristics (n=16)
# Pts % Pts # Pts % Pts Median Age (yrs) 76 (50 - 83) Female 3 19% Male 13 81% De novo 15 94% Therapy-related 1 6% WHO Subtype
RAEB-1 2 13% RAEB-2 6 38% AML 5 31% RCUD 1 6% RCMD 1 6% MDS/MPN 1 6%
IPSS-R Risk Group Very Low 0 0% Low 2 13% Intermediate 4 25% High 5 31% Very High 5 31%
BM Blasts
< 5% 2 13% 5-10% 3 19% 11-20% 9 56% 21-30% 2 13%
IPSS-R Cytogenetics Very Good 1 6% Good 2 13% Intermediate 3 19% Poor 2 13% Very Poor 3 19% Unknown 5 31%
Prior therapy Median # cycles 11 (3 - 58) Decitabine 9 56% 5-azacytidine 2 13% Both 5 31%

ID#
Time to Best Resp
(days)
Time on Study (days)
IPSS-R Risk
Category IPSS-R Cyto
WHO Subtype
TP53
FLT3
RUN
X1
NPM
1
TET2
ASXL
1
SF3B
1
CBL
mCR 8 21 52 ≥ Int Unk RAEB-1
21 126 300
(ongoing) Int Very Good RAEB-2
12 70 70 Very High Poor RAEB-2
1 28 72 High Good RAEB-2
SD 19 20 133 ≥ Int Unk RCMD
15 21 90 Very High Very Poor RAEB-2
2 28 28 ≥ High Unk AML (20%)
18 42 62 Very High Very Poor RAEB-2
20 21 217 High Intermediate AML (25%)
7 20 259 High Good MDS/MPN
PD 22 n/a 28 Very High Poor AML (20%)
3 n/a 21 High Intermediate AML (20%)
9 n/a 28 Very High Very Poor RCUD
• Selinexor induced mCRs in 4/13 (30%) evaluable patients • Two pts (#7, #20) with SD had improved BM blast % and/or CBC values
Responses and Associated Disease-Related Parameters (Evaluable for response, n=13)

Pt #7
WBC
(K/m
cL)
Abs M
ono
(K/m
cL)
Plat
elet
s (K
/mcL
)
Pt #20
Effects on CBC parameters/BM blast % in patients with SD
Plat
elet
s (K
/mcL
)
ANC
(K/m
cL)
MDS/MPN (12 cycles selinexor)
AML/RAEB-t (25% blasts; 10 cycles selinexor)
0
10
20
30
40
50
60
70
SCR C1 C2 C3 C4 C5 C6 C7 C8 C9 C10 EOT
0
0.5
1
1.5
2
2.5
SCR C1 C2 C3 C4 C5 C6 C7 C8 C9 C10C11C12 EOT0
50
100
150
200
250
300
350
SCR C1 C2 C3 C4 C5 C6 C7 C8 C9 C10C11C12 EOT
Blas
ts (%
)
0%
5%
10%
15%
20%
25%
30%
SCR C1 C2 C4 C8 EOT0
0.5
1
1.5
2
2.5
3
3.5
4
4.5
SCR C1 C2 C3 C4 C5 C6 C7 C8 C9 C10 EOT
0
10
20
30
40
50
60
SCR C1 C2 C3 C4 C5 C6 C7 C8 C9 C10C11C12 EOT
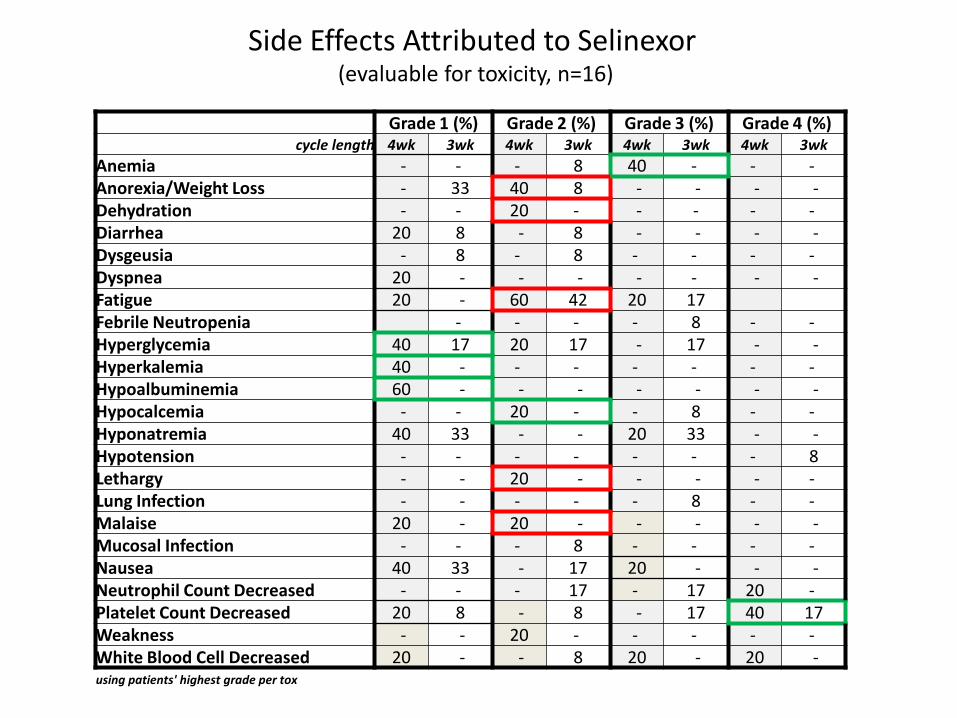
Side Effects Attributed to Selinexor (evaluable for toxicity, n=16)
Grade 1 (%) Grade 2 (%) Grade 3 (%) Grade 4 (%) cycle length 4wk 3wk 4wk 3wk 4wk 3wk 4wk 3wk
Anemia - - - 8 40 - - - Anorexia/Weight Loss - 33 40 8 - - - - Dehydration - - 20 - - - - - Diarrhea 20 8 - 8 - - - - Dysgeusia - 8 - 8 - - - - Dyspnea 20 - - - - - - - Fatigue 20 - 60 42 20 17 Febrile Neutropenia - - - - 8 - - Hyperglycemia 40 17 20 17 - 17 - - Hyperkalemia 40 - - - - - - - Hypoalbuminemia 60 - - - - - - - Hypocalcemia - - 20 - - 8 - - Hyponatremia 40 33 - - 20 33 - - Hypotension - - - - - - - 8 Lethargy - - 20 - - - - - Lung Infection - - - - - 8 - - Malaise 20 - 20 - - - - - Mucosal Infection - - - 8 - - - - Nausea 40 33 - 17 20 - - - Neutrophil Count Decreased - - - 17 - 17 20 - Platelet Count Decreased 20 8 - 8 - 17 40 17 Weakness - - 20 - - - - - White Blood Cell Decreased 20 - - 8 20 - 20 - using patients' highest grade per tox
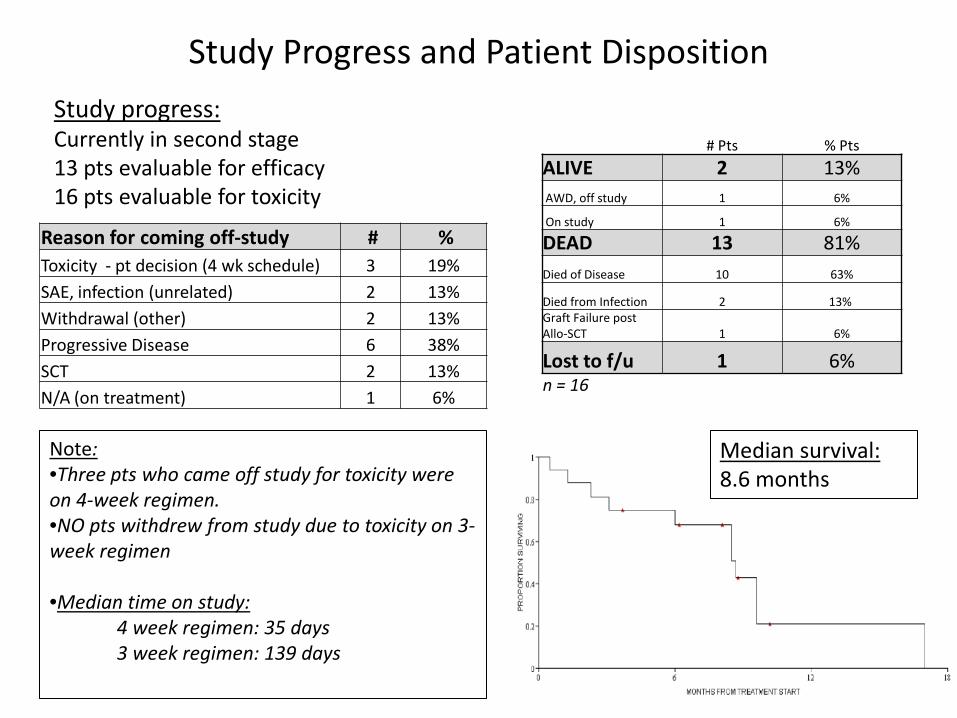
Study Progress and Patient Disposition
Reason for coming off-study # % Toxicity - pt decision (4 wk schedule) 3 19% SAE, infection (unrelated) 2 13% Withdrawal (other) 2 13% Progressive Disease 6 38% SCT 2 13% N/A (on treatment) 1 6%
Study progress: Currently in second stage 13 pts evaluable for efficacy 16 pts evaluable for toxicity
Note: •Three pts who came off study for toxicity were on 4-week regimen. •NO pts withdrew from study due to toxicity on 3-week regimen •Median time on study: 4 week regimen: 35 days 3 week regimen: 139 days
Median survival: 8.6 months
# Pts % Pts ALIVE 2 13% AWD, off study 1 6%
On study 1 6%
DEAD 13 81% Died of Disease 10 63%
Died from Infection 2 13% Graft Failure post Allo-SCT 1 6%
Lost to f/u 1 6% n = 16
Pharmacodynamic studies
Selinexor preclinical data: • Selinexor modulates Wnt/β-catenin signaling (TCF1, LEF1,
and Frzd3) and proteins in the p53 pathway (c-myc and FOXP3)
• Inhibits NF-κB transcriptional activity Initial planned pharmacodynamic assessments: • In MDS pts, can we see modulation of Wnt signaling, p53
and NF-κB activity as seen in other diseases? • BM immunohistochemical (IHC) stains to assess nuclear
localization of p53, β-catenin and p65 • Assess mechanism of selinexor: XPO1, p53, p21, PARP,
and caspase levels

Conclusions • Primary efficacy endpoint was achieved with RR 30% (4 mCRs;
total evaluable n=13) • Dose reduction and 1 week treatment break improved chronic
tolerability. Median time on study increased by 100 days • Interim median survival 8.6 months in this higher-risk cohort
(vs. expected 5-6 months) • XPO1 induction in all patients demonstrates selinexor target
engagement and confirms XPO1 mRNA as a selinexor PD biomarker
Future directions
• Complete study enrollment (end of 2017) • Complete correlative data analysis
– Serial PDn studies to assess modulation of NF-κB, WNT, and p53 signaling
– Mechanistic assays

Thank You ! • Morgan Coleman, MPH • Kelsey Alvarez, BSN, RN • Filiz Sen, MD • MSKCC Leukemia Service • MSKCC patients and their
families