phase 3 geophysical studies in the wadi bidah district ... · phase 3 geophysical studies in the...
TRANSCRIPT

PHASE 3 GEOPHYSICAL STUDIES IN THE WADI BIDAH DISTRICT,
KINGDOM OF SAUDI ARABIA
by
Vincent J. Flanigan, Hamdy Sadek,
and Charles W. Smith
U.S. Geological Survey Open-File Report 82-597
This report is preliminary and has not been reviewed for conformity with U.S. Geological Survey editorial standards.
Report prepared for theMinistry of Petroleum and Mineral Resources
Deputy Ministry for Mineral Resources Jiddah, Kingdom of Saudi Arabia
1402 AH 1982 AD

CONTENTS
ABSTRACT.............................................INTRODUCTION.........................................DETAILED GEOPHYSICAL STUDIES.........................
Rabathan area....................................Jabal Mohr.......................................
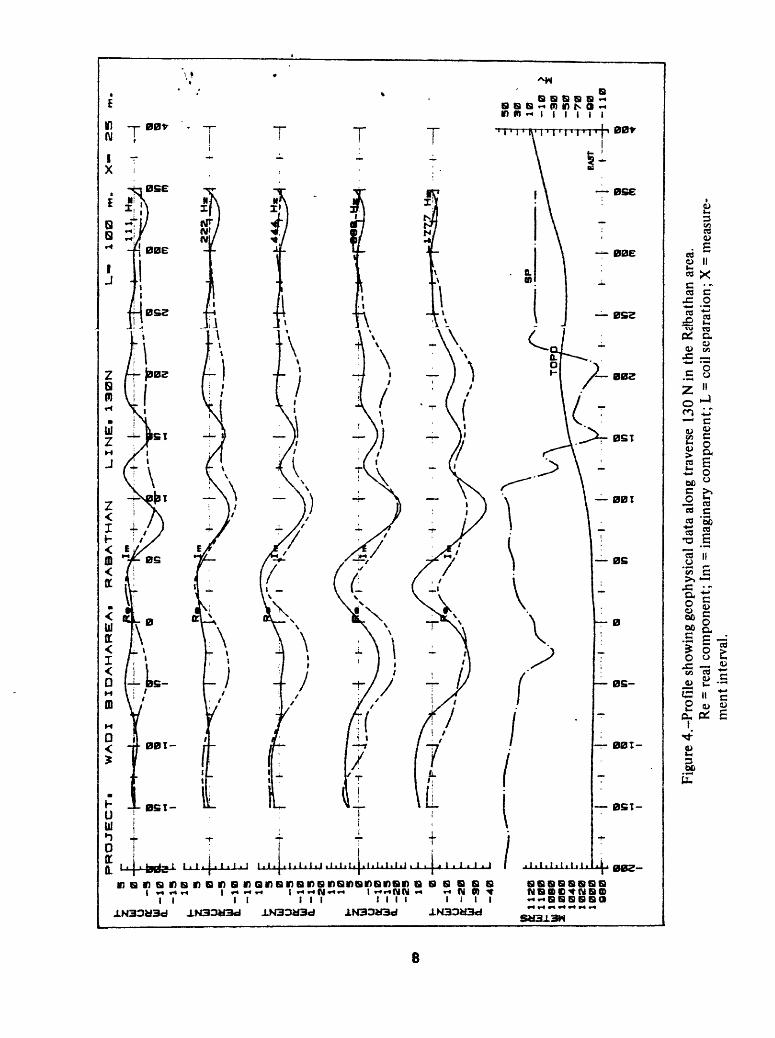
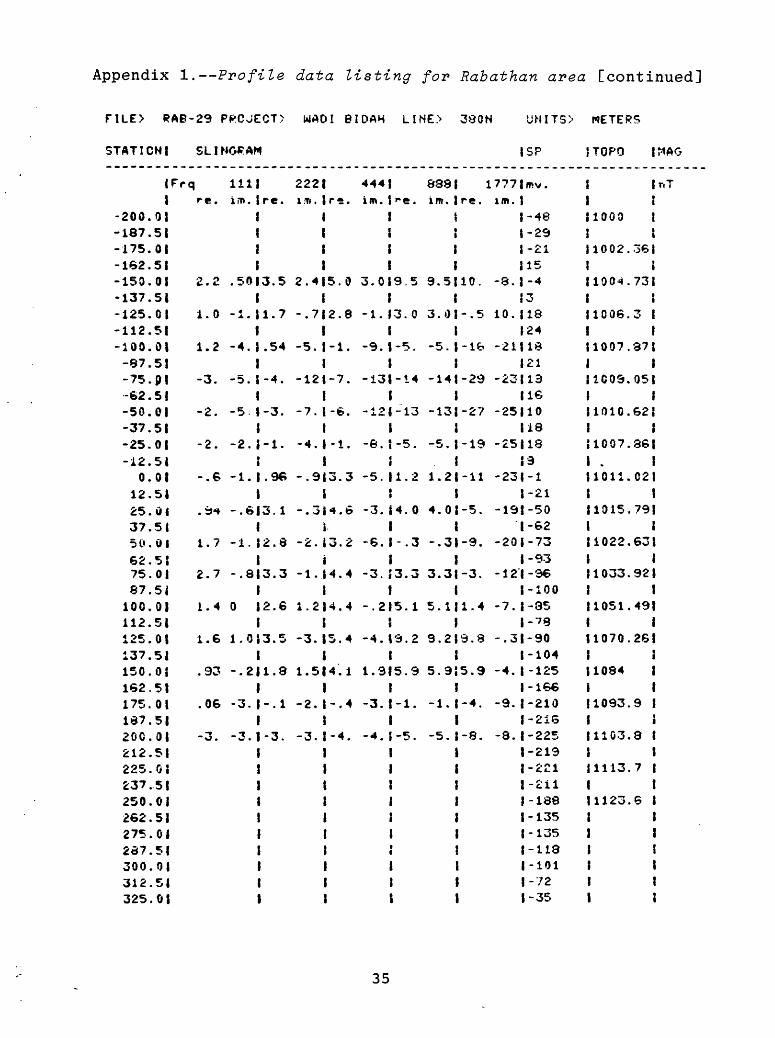
RECONNAISSANCE GEOPHYSICAL SURVEY....................CONCLUSIONS AND RECOMMENDATIONS......................REFERENCES CITED.....................................APPENDIX 1. Profile data listing for Rabathan area..,
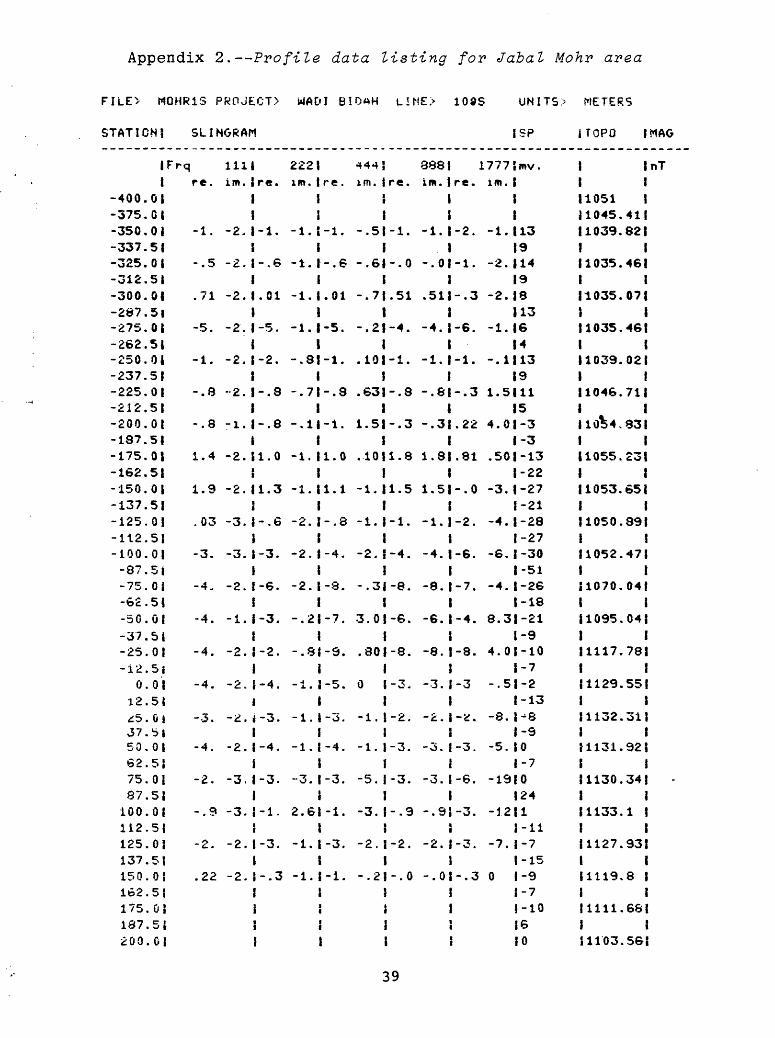
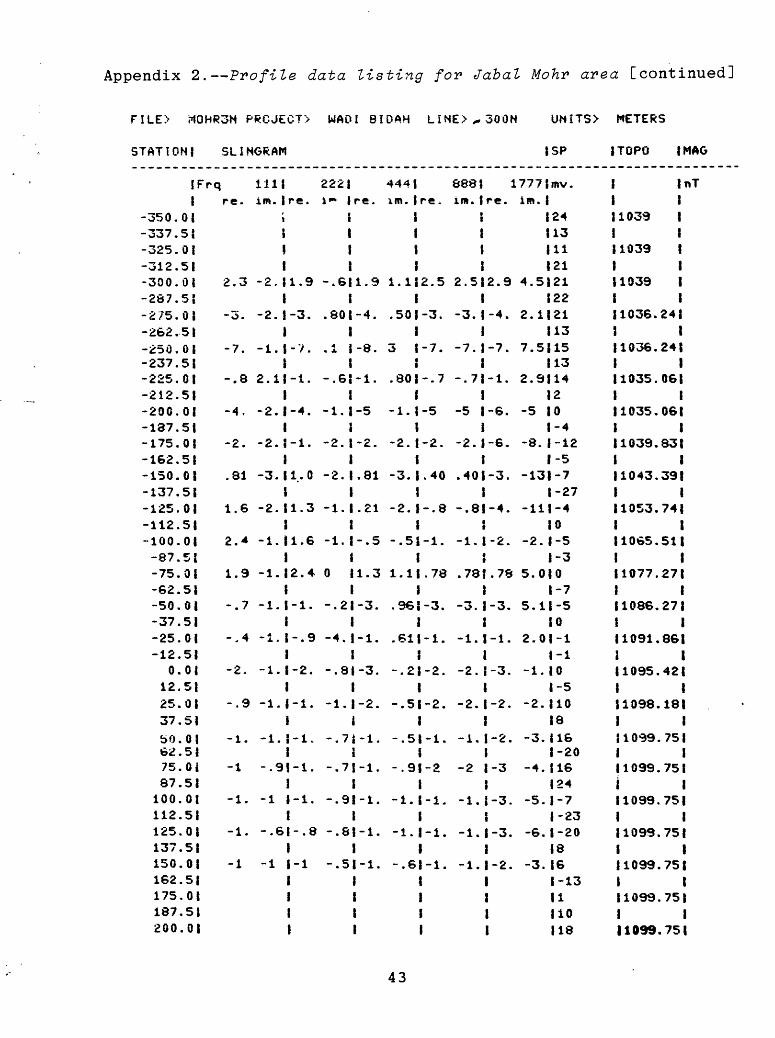
2. Profile data listing for Jabal Mohr area
1255
223030313239
ILLUSTRATIONS
Figure 1. Index map of the western part of the Kingdom of Saudi Arabia showing the location of the Wadi Bidah district....... 3
2. Map of the Wadi Bidah district showingthe location of the phase 3 geophysical studies................................... 4
3. Map of Rabathan area showing the location of AEM anomaly, detailed geophysical traverses, phase 3 drill holes, areas of SP anomaly, and axes of EM conductors................................ 7
4-9. Profiles showing:
4. Geophysical data along traverse130 N in the Rabathan area......... 8
5. Geophysical data from part oftraverse 130 N with simplified drill-hole log of RAB-3............ 9
6. Geophysical data along traverse550 N in the Rabathan area......... 10
7. Geophysical data from part oftraverse 550 N with simplified drill-hole log of RAB-2............ 11
8. Geophysical data along traverse750 N in the Rabathan area......... 13
9. Geophysical data from part oftraverse 750 N with simplified drill-hole log of RAB-1............ 14

Page
Figure 10. Map showing the location of detailedgeophysical traverses and diamond drillholes in the central part of theRabathan area............................ 15
11-20. Profiles showing:
11. Geophysical data along traverse360 N in the Rabathan area......... 17
12. Geophysical data along traverse370 N in the Rabathan area......... 18
13. Geophysical data along traverse380 N in the Rabathan area......... 19
14. Geophysical data along traverse390 N in the Rabathan area......... 20
15. Geophysical data along traverse100 S at the Jabal Mohr prospect... 23
16. Geophysical data along traverse00 S at the Jabal Mohr prospect.... 24
17. Geophysical data along traverse100 N at the Jabal Mohr prospect... 25
18. Geophysical data along traverse200 N at the Jabal Mohr prospect... 26
19. Geophysical data along traverse300 N at the Jabal Mohr prospect... 27
20. Geophysical data along traverse400 N at the Jabal Mohr prospect... 28
21. Map showing location of geophysical tra verses and schematic geology at the Jabal Mohr prospect...................... 29

PHASE 3 GEOPHYSICAL STUDIES IN THE WADI BIDAH DISTRICT,
KINGDOM OF SAUDI ARABIA
by
Vincent J. Flanigani/, Hamdy Sadek, and Charles W. Smith
ABSTRACT
Detailed geophysical measurements have been made in the Rabathan area, Wadi Bidah district, Kingdom of Saudi Arabia, at the site of diamond drill holes RAB-1, -2, and -3; these measurements suggest that the causative source for the anoma lous EM (electromagnetic) and SP (self-potential) responses is probably highly conductive zones of Precambrian siliceous- carbonaceous rocks. Although many of the zones are no more than a few meters wide, they commonly contain 50 to 80 per cent carbonaceous material and locally abundant pyrite. In places, several thin layers of highly concentrated carbona ceous material interlayered with chert form a multiple con ductive zone that is seen in the geophysical data as complex anomaly patterns. In the geologic environment of Wadi Bidah, massive sulfide-bearing zones cannot be distinguished from siliceous-carbonaceous zones on the basis of the EM-SP res ponses. In North America in similar environments, complex resistivity methods used in experimental research have suc cessfully discriminated between sulfide and carbonaceous con ductors. Tests of such methods in the Wadi Bidah district are recommended.
Geologic, geochemical, and geophysical data at the Jabal Mohr prospect suggest the possibility of mineralized rocks at depth over a possible strike length of 400 m.
i/U.S. Geological Survey, Denver, Colorado

INTRODUCTION
The Wadi Bidah district is located about 350 km by road southeast of Jiddah (fig. 1) and is in a belt of Precambrian metavolcanic and metasedimentary rocks approximately 15 km wide and 80 km long. This report presents the results of the 1980 phase 3 geophysical studies, which are part of an inte grated study aimed at evaluating the resource potential of the district. The work on which this report was based was performed in accordance with a cooperative agreement between the U.S. Geological Survey (USGS) and the Saudi Arabian Ministry of Petroleum and Mineral Resources.
Prior to the beginning of this district-wide study by the USGS in 1977, considerable progress had been made in defining the geologic environment and the estimated ore reserves of a dozen or more prospects in the district. In a summary report on studies made prior to 1976, Kiilsgaard and others (1978) concluded that continued exploration in the district might increase the total known tonnage of potential ore reserves. However, they concluded that the expected new reserves pro bably would not be substantially larger or higher grade than those already known to exist in several of the most promising ore deposits in the district.
Geologists from the Riofinex Geological Mission arrived at essentially the same conclusion on the basis of a study made in the northern part of the Wadi Bidah district in 1978 (Riofinex Geological Mission, 1979).
The Wadi Bidah district was one of the target areas selected for an airborne electromagnetic (AEM) survey made in the Kingdom in 1977. A preliminary assessment *of the AEM survey by Wynn and Blank (1979) indicated that more than 50 discrete electromagnetic (EM) conductors were recognized in the district.
An integrated geophysical, geologic, and geochemical ground followup study to the 1977 AEM survey began in 1978 (phase 1). EM and SP (self-potential) methods were used to verify on the ground the location of the AEM conductors. Reconnaissance geologic and geochemical sampling in the areas of anomalous AEM response established a priority list of target areas for further study. Work conducted during 1979 (phase 2) included extensive ground EM-SP surveys in six of the target areas (fig. 2): Rabathan (B-29), B-13, B-25 and -26, B-24, B-35, and the Wadi al Khadra prospect. Geologic, geochemical, and geophysical studies in these six areas re sulted in recommendations for additional detailed studies of them, in an attempt to better understand the geologic sources of the anomalous EM-SP responses (Flanigan and others, 1982). In addition, Smith and Waters (1979, unpub. data) proposed a drilling program to test at depth the source of geophysical

16
Figure 1 .-Index map of the western part of the Kingdom of Saudi Arabia showing the location of the Wadi Bidah district. ,

41° 13' . 2<f33' * ToAtTaif
4I°SO'E
20° 15'
2(fOO'N
Sha'ab al Tare(v
Airstrip/
JabalMohrl*!
Area of figure 21
y >; 9-i.x-, /.[B-25/B-26/ / :' '
ilajimah gossait^ '^1 ' B-13
B-42
Rabathan area 8^29
ahathan 4 prospect
B-41
Marawa
^v/'-X^ B-44 B' 45 ToAJBahah
0 5kmi i i i i i
Figure 2.-Map of the Wadi Bidah district showing the locution of the phase 3 geophysical studies. A

and geochemical anomalies in the Rabathan (B-29) and the Bilajimah gossan (B-25 and 26) areas.
Phase 3 studies conducted during the 1979-1980 field season included geologic mapping, geochemical sampling, and additional geophysical studies. This report presents the results of detailed geophysical studies in the Rabathan area (AEM anomaly B-29), at AEM anomaly B-13, and at a heretofore unstudied prospect named Jabal Mohr, located several kilo meters south of the Sha'ab al Tare prospect (fig. 2). Other work conducted during phase 3 studies, not included in this report, included reconnaissance geophysical traverses in several areas in the southern part of the district. In addition, induced-polarization measurements were made of the Bilajimah gossan (B-25 and 26) and Wadi al Khadra areas.
DETAILED GEOPHYSICAL STUDIES
Rabathan area
The Rabathan area is in the east-central part of the Wadi Bidah district and includes the Rabathan 4 copper deposit, one of the most promising in the district (fig. 2). The 1977 AEM survey showed the Rabathan area to be part of an EM conductive zone that is 23 km long (B-29 and B-13) (Wynn and Blank, 1979). The length and width of the AEM anomaly suggest the causative source is most likely associated with geologic formations or structures. Gossan outcrop patterns, surface copper contents, reconnaissance mapping, and diamond drilling all indicate that the geologic environment is favor able for the occurrence of sulfide mineral deposits. It was felt that if several low-tonnage, low-grade deposits could be found at shallow depth in the area, they might be mined economically in the future if the price and demand for copper should increase significantly.
During phase 2 studies in the Rabathan area, ground slingram EM traverses were made at 200-m intervals, with a 200-m coil separation and a 50-m measurement interval. These traverses delineated a major conductor and several minor con ductors that trend north through the area. SP measurements made at 50-m intervals along the same EM traverse indicated a broad anomaly with discrete areas of high values superimposed upon it (Flanigan and others, 1982). In order to better un derstand the geophysical and geological spatial relation ships, slingram measurements were made in the phase 3 study with a smaller coil separation and measurement interval. By decreasing the coil separation (L) from 200 m to 100 m and the measurement interval (X) from 50 m to 25 m, we found the resolution better and the amplitude response satisfactory, although it was lower than phase 2 measurements. The SP measurement interval was reduced to 12.5 m.
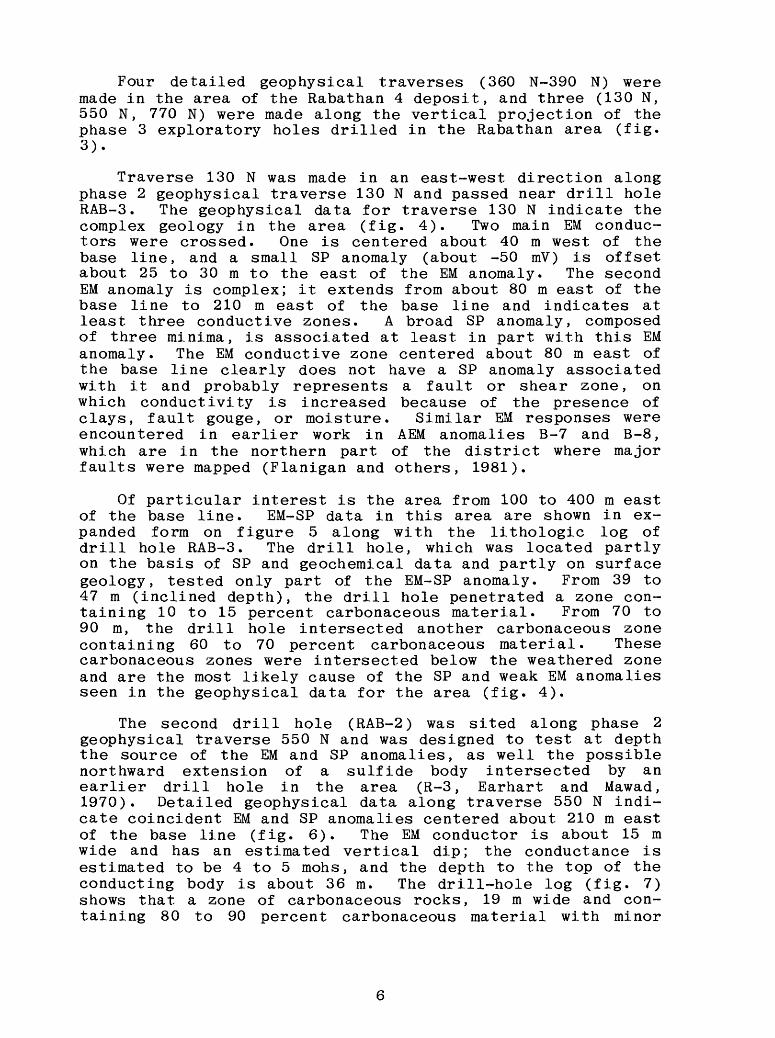
Four detailed geophysical traverses (360 N-390 N) were made in the area of the Rabathan 4 deposit, and three (130 N, 550 N, 770 N) were made along the vertical projection of the phase 3 exploratory holes drilled in the Rabathan area (fig. 3).
Traverse 130 N was made in an east-west direction along phase 2 geophysical traverse 130 N and passed near drill hole RAB-3. The geophysical data for traverse 130 N indicate the complex geology in the area (fig. 4). Two main EM conduc tors were crossed. One is centered about 40 m west of the base line, and a small SP anomaly (about -50 mV) is offset about 25 to 30 m to the east of the EM anomaly. The second EM anomaly is complex; it extends from about 80 m east of the base line to 210 m east of the base line and indicates at least three conductive zones. A broad SP anomaly, composed of three minima, is associated at least in part with this EM anomaly. The EM conductive zone centered about 80 m east of the base line clearly does not have a SP anomaly associated with it and probably represents a fault or shear zone, on which conductivity is increased because of the presence of clays, fault gouge, or moisture. Similar EM responses were encountered in earlier work in AEM anomalies B-7 and B-8, which are in the northern part of the district where major faults were mapped (Flanigan and others, 1981).
Of particular interest is the area from 100 to 400 m east of the base line. EM-SP data in this area are shown in ex panded form on figure 5 along with the lithologic log of drill hole RAB-3. The drill hole, which was located partly on the basis of SP and geochemical data and partly on surface geology, tested only part of the EM-SP anomaly. From 39 to 47 m (inclined depth), the drill hole penetrated a zone con taining 10 to 15 percent carbonaceous material. From 70 to 90 m, the drill hole intersected another carbonaceous zone containing 60 to 70 percent carbonaceous material. These carbonaceous zones were intersected below the weathered zone and are the most likely cause of the SP and weak EM anomalies seen in the geophysical data for the area (fig. 4).
The second drill hole (RAB-2) was sited along phase 2 geophysical traverse 550 N and was designed to test at depth the source of the EM and SP anomalies, as well the possible northward extension of a sulfide body intersected by an earlier drill hole in the area (R-3, Earhart and Mawad, 1970). Detailed geophysical data along traverse 550 N indi cate coincident EM and SP anomalies centered about 210 m east of the base line (fig. 6). The EM conductor is about 15 m wide and has an estimated vertical dip; the conductance is estimated to be 4 to 5 mohs, and the depth to the top of the conducting body is about 36 m. The drill-hole log (fig. 7) shows that a zone of carbonaceous rocks, 19 m wide and con taining 80 to 90 percent carbonaceous material with minor
6

850)-
810h
1 AEM anomalyB-29 (Rabathan area)
EXPLANATION
Location of detailed geophysical traverse
Location of phase 3 diamond drill hole, showing azimuth
Areas of SP anomaly of less than -200mV
Axis of EM anomaly, hachured where anomaly is more than a few hundred meters wide
Northern end of phase 2 ground survey
600 200 0 2OO 600 10OO 1400m East
Figure 3 -Map of the Rabathan area showing the location of AEM anomaly, detailed geophys ical traverses, phase 3 drill holes (RAB-1, -2, and -3), areas of SP anomaly of less than -200 mV, and axis of EM conductors.
7
PR
OJE
CT
iWADI BIDAHAREAi RABATHAN
.lit
!
CO
Figu
re 4
.~Pr
ofile
sho
win
g ge
ophy
sica
l dat
a al
ong
trav
erse
130
N in
the
Rdb
atha
n ar
ea.
Re
- re
al c
ompo
nent
; Im
= im
agin
ary
com
pone
nt;
L =
coil
sepa
ratio
n; X
= m
easu
re
men
t in
terv
al.

PROJECT.
WADI BIDAHAREA. RABATHAN
L.IN
E.
13
G9
NU
100
m.
X
25
VO
Mot
tly e
*rbo
n*e«
out.
with
illk
»ou
i pin
lng
iD
otom
ttl
(9
Sch
m. e
*rbo
n*e<
ou>-
<fllc
«ou>
a?
EAST
Figu
re 5
.-Pr
ofile
sho
win
g ge
ophy
sica
l dat
a fr
om p
art
of tr
aver
se 1
30 N
with
sim
plif
ied
drill
ho
le l
og o
f R
AB
-3.
Re
= re
al c
ompo
nent
; Im
= i
mag
inar
y co
mpo
nent
; L
= co
il se
para
tion;
X =
mea
sure
men
t in
terv
al.

AR
EA
g W
AD
I B
IDA
HL
.OC
AT
I O
N.
RA
BA
TH
AN
L_
I N
Ei
5S
0N
L
_
100
m.
I
Figu
re 6
.-Pr
ofile
sho
win
g ge
ophy
sica
l da
ta a
long
tra
vers
e 55
0 N
in t
he R
abat
han
area
. R
e =
real
com
pone
nt;
Im =
im
agin
ary
com
pone
nt; L
- c
oil s
epar
atio
n;
X =
mea
sure
men
t int
erva
l.

PROJECTi
WADI BIDAHAREAi RABATHAN
L. I NEi 5S0N
L_
1X 25 m.
1100
-
Cw
bo
n«c
«O<
H 1
80
-90
(M
rctn
t),
wit
h c
her
t y K
ytr
t m
ino
r p
yrl
tf
tth c
arbo
nK«o
ui
pcri
lngi
. m
inor
pyr
ltt
EAST
-25
L-
Figu
re 7
.~Pr
ofile
sho
win
g ge
ophy
sica
l da
ta f
rom
par
t of
trav
erse
550
N w
ith s
impl
ifie
d dr
ill
hole
log
of
RA
B-2
. R
e =
real
com
pone
nt;
Im =
im
agin
ary
com
pone
nt;
L =
coil
sepa
rati
on;
X =
mea
sure
men
t in
terv
al.

pyrite^was intersected from 99 to 126 m (inclined depth). It seems, likely "that these rocks are the source of the EM anomaly.'
Drill hole RAB-1 was sited along traverse line 750 N. Phase 3 data along this traverse show a complex EM anomaly (two or more conductors) 600 to 800 m east of the base line (fig. 8). No reliable estimates of the parameters of the individual conductors can be made because of the interaction of multiple responses. The centers of three EM conductors are estimated to lie 635, 700, and 750 m east of the base line. A broad SP anomaly, which has an amplitude of almost -320 mV, covers approximately the same interval as the EM anomaly. SP data from known carbonaceous environments indi cate much higher SP responses (>-300 mV) than miglit be expected over a sulfide body with limited depth and strike length (FJjuii&an &ud -others, 1931)^ £&e iaagnitis£« of tfes -8? anomaly on traverse 750 N almost certainly precludes such a sulfide body as the source; the most likely source is several carbonaceous units. Drill hole RAB-1 apparently intersected the conductive zone at 635 m east within the oxidized zone (fig. 9); therefore, a clear determination of the causative source could not be made. At greater depth, between 89 and 112 m, the drill hole intersected a zone of banded siliceous tuff 16 m wide that contains 20 to 30 percent carbonaceous material; this zone is probably the source of the EM anomaly located about 700 m east of the base line. The drill hole ended before reaching the source of the EM anomaly located 750 m east of the base line.
The phase 3 drill holes in the Rabathan area were located primarily to test geologic and geochemical indications of possible sulfide-bearing zones and obtained negative results; however, they did intersect carbonaceous zones that are believed to be the cause of the coincident EM and SP geophysical 'anomalies. The drilling did not test any EM anomalies that have no associated SP anomaly; these are interpreted to be caused by shear or fault zones. It seems reasonable to assume that most of the coincident EM and SP anomalies in the Rabathan area are caused by carbonaceous units that have undergone regional metamorphism. However, some sulfide deposits in the Rabathan area presumably do have some geophysical expression, although this expression is probably masked by the higher amplitude anomalies produced by the carbonaceous units.
In order to test this possibility, four detailed EM-SP traverses were made across the Rabathan 4 deposit. The loca tions of the four traverses (360 N-390 N) are shown on figure 10. Also shown are the locations of the diamond drill holes in the area and vertical projections to the surface of the major massive sulfide intercepts in the drill holes. The dip
12

AR
EA
i W
AD
I B
IDA
HL
.OC
AT
I O
Ni
RA
BA
TH
AN
Figu
re 8
.-Pr
ofile
sho
win
g ge
ophy
sica
l da
ta a
long
trav
erse
750
N in
the
Rab
atha
n ar
ea.
Re
= re
al c
ompo
nent
; Im
= i
mag
inar
y co
mpo
nent
; L -
coi
l sep
arat
ion;
X =
mea
sure
m
ent
inte
rval
.

PROJECTi WADI BIDAH
AREAi RABATHAN
L_ I NEi "7S0N
L_~ 100
n. X 25 m.
SNfa
KNH
tuff
, Mn
M.
Mtt
t 20
JO iw
nan
t
Slll
no
ut
Iff.
wM
t ew
tw
EAST
__
1
Figu
re 9
.-P
rofi
le s
how
ing
geop
hysi
cal d
ata
from
par
t of
trav
erse
750
N w
ith s
impl
ifie
d dr
ill
hole
log
of R
AB
-1.

41*24'08*
20°23'22'
-200390 N H-
380 N
370 N
-N-
-100
41'24'aO'
o RB-14, -35°
100 200 300 I
RB-12,-50"
RB-Il,-55°
RfrlO, -25° RB-9, -45°
Rabathan 4 prospect
-200360 N
-100 100 200 300
----""*
360
RB-9, -45°
EXPLANATION
Geophysical traverse line
Vertical projection of mineralized intercepts in diamond drill holes
Diamond drill-hole location and azimuth
or"
RB-13,-450
SO 100 150m
Figure 1 O.-Map showing the location of detailed geophysical traverses and diamond drill holes in the central part of the Rabathan area. Also shown are the vertical projections of the mineralized intercepts in diamond drill holes R-4, RB-9, RB-10, and RB-11.
15

of the Rabathan 4 deposit, as determined by previous drill intercepts, is nearly vertical (Earhart and Mawad, 1970, Kiilsgaard and others, 1978).
The EM data shown on profile 360 N (fig. 11) indicate two major conductive zones. One extends from about station -75 (75 m west of the base line) to about station 75 (75 m east of the base line), and the other begins at about station 160 and extends beyond the end of the profile at station 250. The more westerly conductive zone probably reflects the EM response of at least three conductors within the zone. The conductive area is covered with an unknown thickness of alluvium and talus derived from the slopes to the east and south. Results from diamond drill hole RB-13, located about 20 m south of station 100, indicate that the near-surface material consists of alluvial debris and carbonaceous schist. The SP data along traverse 360 N (fig. 11) show three zones of anomalous SP response: one begins at station -150 and extends beyond the western end of the traverse; the second, a complex anomaly consisting of at least two zones, extends from station 50 to station 150; and the third extends from station 180 to east of station 300. The third zone is also a complex anomaly consisting of several discrete zones of res ponse and is seen most clearly on traverse 370 N (fig. 12).
The EM data from traverse 370 N are particularly inter esting in the interval between stations 150 and 250. In this area, the data show two discrete conductors, one at station 160 and the other at station 210. The EM response at station 160 is seen only at the three lower frequencies (111, 222, and 444 Hz) and is masked at the two higher frequencies by the response to the conductor at station 210. The EM res ponse centered at station 160 fits quite nicely with the location of the Rabathan 4 deposit, which, therefore, may be the cause at depth for the EM response.
With the exception of the anomaly just discussed on traverse 370 N, the detailed geophysical data from profiles 370 N, 380 N, and 390 N (figs. 12-14) show the same general EM-SP patterns. From a comparison of the position of the massive sulfide body (fig. 10) and the position of the second complex SP response on profile 370 N (fig. 12), it seems likely that part of the complex SP response results from the sulfide deposit that is known to be present from drill-hole data; however, by use of the geophysical data alone, it would be impossible to identify the location of the massive sulfide body.
Detailed work in the Rabathan area has shown that it is essential to interpret geophysical data in conjunction with geologic and geochemical data. In the geologic environment of Wadi Bidah, where carbonaceous rocks are pervasive, any EM-SP response associated with a sulfide body is probably
16

AR
EA
i W
AD
I B
IDA
H
l_O
CA
T I
ON
i R
AB
AT
HA
N
l_ I
NE
Ii 360N
L
_
1 0
IZI
m.
X
25
H
Figu
re 1
1.-P
rofi
le s
how
ing
geop
hysi
cal
data
alo
ng tr
aver
se 3
60 N
in
the
Rab
atha
n ar
ea.
Re
= re
al c
ompo
nent
; Irn
= i
mag
inar
y co
mpo
nent
; L
= co
il se
para
tion
; X
= m
easu
rem
ent
inte
rval
.

00
AR
EA
pW
AD
I B
IDA
H
L.O
C A
T I O
Np
R
AB
AT
HA
N
l_ I N
Ep
3
-7IZ
IN
l_-
1 E
JE)
m
-+-
__
] -_
\ I
"-5s
: --
i-^£lv
d--
ffi 1200
f- 1100
til SB
1080
1040
1000
Figu
re 1
2.-P
rofi
le s
how
ing
geop
hysi
cal
data
alo
ng t
rave
rse
370
N i
n th
e R
abat
han
area
. R
e =
real
com
pone
nt;
Im =
im
agin
ary
com
pone
nt;
L =
coil
sepa
rati
on;
X =
mea
sure
men
t in
terv
al.

AR
EA
iWA
DI
BID
AH
VD
L.O
CA
T lO
IMi
RA
BA
TH
AN
L_
I N
Ei
3S
C3
N
L_
- 11
2313
BAST
Figu
re 1
3.-P
rofi
le s
how
ing
geop
hysi
cal
data
alo
ng tr
aver
se 3
80 N
in t
he R
abat
han
area
. R
e =
real
com
pone
nt; I
m =
im
agin
ary
com
pone
nt; L
= c
oil s
epar
atio
n;
X =
mea
sure
men
t in
terv
al.

N)
O
AREAi WADI BIDAH
LOCATION. RABATHAN
L. I NEi 3Q0N
L_ 100 m
Figu
re 1
4.-P
rofi
le s
how
ing
geop
hysi
cal
data
alo
ng tr
aver
se 3
90 N
in t
he R
abat
han
Re
= re
al c
ompo
nent
; Im
= im
agin
ary
com
pone
nt;
L =
coil
sepa
ratio
n;
X =
mea
sure
men
t in
terv
al.
area
.

part of a complex response caused primarily by the carbona ceous rocks. A high-amplitude SP anomaly (>-200 mV) and a coincident EM anomaly probably are the geophysical response of a highly conductive carbonaceous rock unit. However, small SP peaks within a complex anomaly pattern could be caused by a sulfide body and might be revealed by close examination of geophysical data in geologically and geochemi- cally favorable areas.
In order to ascertain the nature of the surface outcrops in the area of the small SP peaks discussed above, a study was made of profile 440 N in the B-13 area, where phase 2 geophysical data revealed several discrete SP anomalies comprising a broad, complex high-amplitude anomaly. Close examination of the surface rocks in the vicinity of one of the smaller SP peaks showed a lenticular zone of cherty rocks several meters wide and about 40 m long. The cherty zone is interpreted to be the weathered residual of an interlayered siliciceous-carbonaceous unit in the area. Heretofore, the authors had not associated these cherty outcrops with the carbonaceous rocks because they contain no carbonaceous material where they crop out.
In the Wadi Bidah district the carbonaceous environment renders geophysical data from EM, SP, or DC (direct-current) methods ambiguous in the search for massive sulfide deposits, and only experience and indirect associations, such as those mentioned earlier, will be of use in the interpretation of the geophysical data. The integration of geological and geo- chemical data in the interpretation of geophysical data is essential for successful exploration. Inasmuch as all of the various data sources have their limitations, it seems likely that some deposits will go undetected.
In the past decade or so, induced polarization (IP) has become the leading geophysical ground-prospecting method used in the discovery of many new mineral deposits in Precambrian areas of North America (Sumner, 1976). However, the IP method is beset with the same problem as EM-SP methods used in the Wadi Bidah followup work, that is, the inability to distinguish between sulfide-mineralized zones, graphitic schists, and other geologic conductors. Recently, consider able research using multifrequency IP or complex-resistivity methods has indicated that the spectral IP responses of mas sive sulfide bodies can be distinguished from the spectral IP responses of graphitic sources (Pelton and others, 1978). It would be extremely useful to carry out a complex-resistivity experiment in the Wadi Bidah district to ascertain the use fulness of the method in this environment. A time-domain EM method might also be tested at the same time; it should yield useful information, particularly if the sulfide deposit is somewhat more conductive than the carbonaceous rocks associated with it.
21

Jabal Mohr
EM-SP measurements were made in a 500-m by 500-m area known as Jabal Mohr, located about 2 km south-southeast of the Sha'ab al Tare prospect on the western side of Wadi Bidah (fig. 2). The rocks in the area include metavolcanic schist, basalt, and tuff (Riofinex Geological Mission, 1979). The main hematitic and goethitic gossan crops out over an area that is 4 to 5 m wide and 30 to 40 m long; minor gossan zones crop out for several hundred meters north and south of the main gossan.
The EM and SP data for the six traverses (figs. 15-20) show a much weaker response than those in the Rabathan area. Maximum SP response is only -50 mV, as compared to more than -300 mV in the Rabathan area. This lower SP response is encouraging, inasmuch as the source of the large SP anomalies in the Rabathan area is most certainly the carbonaceous rocks. Carbonaceous rocks were not identified in the Jabal Mohr area nor have they been in previous work at Sha'ab al Tare, which is in a similar sequence of volcanic rocks (Earhart and Mawad, 1970; Kiilsgaard and others, 1978).
The locations of the geophysical traverses, the areas of gossan outcrop, and the nearby geology are shown in figure 21. The locations of the primary EM and SP anomalies are also shown for comparison with the geology. SP anomalies and gossan outcrops are nearly coincident on traverses 00 S, 100 N, and 200 N. On traverses 100 S and 300 N, the SP anomaly lies 20 to 50 m east of the gossan outcrop. The EM data contain some apparent field-position errors, which are a result of the very rough topography. These errors are more apparent in the inphase (real) component and have little effect on the out-of-phase (imaginary) component. Based on the interpretation of conductor position from the imaginary component only, the EM conductor lies from 10 to 50 m east of the gossan outcrop on traverses 100 S to 100 N. It is nearly coincident with the gossan outcrop on traverses 200 N and 300 N. This divergence of anomaly position could easily be explained if the EM conductor dips to the east on traverses 100 S to 100 N and is nearly vertical on traverses 200 N and 300 N, The EM response is weak, which suggests a poor conduc tor, and the shoulders of the EM response are poorly develop ed, so a reliable estimation of the dip of the conductor cannot be made. No EM or SP anomalies appear on traverse 400 N (fig. 20), a fact that suggests that the conductive zone does not continue to the north beyond traverse 400 N. Conductors may possibly extend south of traverse 100 S, beyond the southern end of this survey. The geophysical data suggest the possibility that sulfide-bearing rocks extend at least 400 m along strike. The width and grade of any mineralized body would probably be similar to those at the
22

ro
10 5
15
10
w K 1
08
0£
10
B0
UJ 1
04
0X
1020
10
00
Q8
00
80
AR
EA
i W
AD
I B
IDA
HL
OC
AT
ION
! JA
BA
L.
MO
HR
L. I
NE
i 1
X-
25
-H
\
X'
-4- s in
^^/
SP
k
35
25 15
5 -""5
-15
-25
-35
-45
-55
4B
5
Figu
re 1
5.-P
rofi
le s
how
ing
geop
hysi
cal
data
alo
ng tr
aver
se 1
00 S
at
the
JaA
al M
ohr
pros
pect
. R
e =
real
com
pone
nt;
Im =
im
agin
ary
com
pone
n-t;
L =
coil
sepa
ratio
n;
X -
mea
sure
men
t in
terv
al.

AR
EA
«W
AD
I B
IDA
HL
OC
AT
ION
S J
AB
AL
. M
OH
R L
_ I
NE
t 0
0L
_-
1G
90
m.
X-
2S
ro
Figu
re 1
6.-P
rofi
le s
how
ing
geop
hysi
cal
data
alo
ng t
rave
rse
00 a
t th
e Ja
bal
Moh
r pr
ospe
ct.
Re
= re
al c
ompo
nent
; Im
= i
mag
inar
y co
mpo
nent
; L
= co
il se
para
tion
; X
= m
easu
rem
ent
inte
rval
.

ro 01
1 'i
u 0
AR
EA
.WA
DI
BID
AH
L
.OC
AT
I O
N.
J" A
B A
L.
MO
HR
L.IN
E.
1 C
ZSta
N
I 1|
+ui
-70
P-1
5
ui U
-5 -
g -! t
Q. -1
5
H
10 5
u -s
p
0. -1
5
t
10
f-
5 0
4
U
f g
~
10
L
-20
U
L_
1
2)2
) m
.
I 1
1 1,
H
x
i
.^k t
53
^fe
d
X-
25
v
Figu
re 1
7.-P
rofi
le s
how
ing
geop
hysi
cal
data
alo
ng tr
aver
se 1
00 N
at
the
.faba
l M
ohr
pros
pect
. R
e =
real
com
pone
nt;
Im =
im
agin
ary
com
pone
nt;
L =
coil
sepa
ratio
n;
X =
mea
sure
men
t in
terv
al.

AR
EA
iWA
DI
BID
AH
LO
CA
TIO
N!
.JA
BA
L.
MO
HR
l_
I N
Ei
SE
JE
JN
JL
-
10
0
m.
X«-
10
^,
h ^
Figu
re 1
8.-P
rofi
le s
how
ing
geop
hysi
cal d
ata
alon
g tr
aver
se 2
00 N
at
the
J^lb
al M
ohr
pros
pect
. R
e =
real
com
pone
nt;
Im =
imag
inar
y co
mpo
nent
; L -
coi
l se
para
tion;
TL
;s m
AO
CI
1 m
am
an
t
«M
^A
firo
lX
= m
easu
rem
ent i
nter
val.

N)
AR
EA
i W
AD
I B
IDA
H
l_O
CA
TIO
Nt
.JA
BA
L.
MO
HR
L
. I.N
E* 3IZ
ieN
l_
1
00
m
. X
I 17
77 H
«i .
10
53
^1
03
5
X
Figu
re 1
9.-P
rofi
le s
how
ing
geop
hysi
cal
data
alo
ng t
rave
rse
300
N a
t th
e Jd
bal
Moh
r pr
ospe
ct.
Re
= re
al c
ompo
nent
; Im
= i
mag
inar
y co
mpo
nent
; L
= co
il se
para
tion;
X
= m
easu
rem
ent
inte
rval
.

AREAi WADI BIDAH
LOCATION^ JABAL.
L_
INE
i -4
C3I
ZJN
L
_-
1 0
B3
m
. X
-
2S
ro
oo
Figu
re 2
0.-P
rofi
le s
how
ing
geop
hysi
cal
data
alo
ng tr
aver
se .4
00 N
at t
he J
abal
Moh
r pr
ospe
ct.
Re
= re
al c
ompo
nent
; Im
= im
agin
ary
com
pone
nt; L
= c
oil s
epar
atio
n;
X =
mea
sure
men
t in
terv
al.

41°23 1 18" 20»32 f4S' 41023*42'
20-32M3'
Qalba
qctt
mpt
EXPLANATION
AlluviumBasaltQuartz crystal tuffGray tuffMafic pumice tuffGossanSP anomaly locationEM anomaly locationContact, dashed where uncertain
- Fault Wadi________________
so 100 150m
Geologic base by C.W. Smith, \JS. Geological Survey Saudi Arabian Mission, I960.
Figure 21 .-Map showing location of geophysical traverses and schematic geology at the Jabal Mohr prospect. Also shown are the locations of the main EM-SP anomalies.
29

Sha'ab ml Tare prospect to the north. One or two drill holes would be necessary to confi*rm these surmises.
RECONNAISSANCE GEOPHYSICAL SURVEY
In further ground followup of the 1977 AEM survey of the district, AEM anomalies not previously studied were located on the ground and a brief geologic examination was made of the area of each. These AEM anomalies are in the southern part of the Wadi Bidah district, south, west, and northwest of the USGS field camp at Al Bahah (fig. 2). Anomalies B-37, B-38, and B-41 received no further geophysical study, either because the most probable cause of the electromagnetic res ponse is the carbonaceous rocks visible at the surface or because no surface indications of anomalous mineralized rocks were seen. In the areas of AEM anomalies B-42, B-44, and B-45, located west of the village of Marawa, evidence of ancient mining, gossan outcrops, and other surface indica tions enhance the potential for mineralized rocks at depth. Reconnaissance EM and SP traverses were made over the principal parts of those areas in an attempt to locate tjie anomalous zones on the ground. Geologic mapping and geochem- ical sampling were also carried out. The results of these studies will be the subject of a separate report (Sadek and Flanigan, unpublished data).
CONCLUSIONS AND RECOMMENDATIONS
Detailed geophysical data and diamond drill-core logs indicate that carbonaceous rocks are the most probable source of the EM and SP anomalies in both the Rabathan area and area B-13 to the north. The Rabathan 4 deposit has a geophysical expression, but the mineralized rocks are so intimately asso ciated with carbonaceous rocks that it is impossible to separate the larger response of the carbonaceous material from that of the massive sulfide deposit. Complex-resistivity measurements might be successful in discriminating between various types of geologic conductors in this carbonaceous environment, and an experimental test of the method at the Rabathan 4 deposit would be worthwhile.
Geologic and geophysical data from the Jabal Mohr pros pect indicate the possibility of a massive sulfide body at depth that extends some 400 m in strike length. The geo physical anomalies coinciding with the gossan outcrop along geophysical traverse 200 N could be tested at depth by a single drill hole.
30

REFERENCES CITED
Earhart, R. L. , and Mawad, M. M. , 1970, Geology and mineral evaluation of the Wadi Bidah district, Southern Hijaz quadrangle, Kingdom of Saudi Arabia: U.S. Geological Survey Open-File Report (IR)SA-119, 100 p.
Flanigan, V. J., Wynn, J. C., Worl, R. G., and Smith, C. W., 1982, Preliminary report on geophysical ground follow-up of the 1977 airborne survey in the Wadi Bidah district, Kingdom of Saudi Arabia: U.S. Geological Survey Open-file Report 82-202, 54 p.
Kiilsgaard, T. H. , Greenwood, W. R. , Puffett, W. P., Naqvi, Mohammed, Roberts, R. J. , Worl, R. G., Merghelani, Habib, Flanigan, V. J., and Gazzaz, A, R. , 1978, Mineral explor ation in the Wadi Bidah district, 1971-1976, Kingdom of Saudi Arabia: U.S. Geological Survey Open-File Report 78-771, 89 p.
Pelton, W. H., Ward, S. H. , Hallof, P. G., Sill, W. R. , and Nelson, P. H. , 1978, Mineral discrimination and removal of inductive coupling with multifrequency IP: Geophys ics, v. 43, p. 588-609.
Riofinex Geological Mission, 1979, An assessment of the mineral potential of part of the Wadi Bidah district: Riofinex Geological Mission (Saudi Arabia) Report RF-1979-1, 48 p.
Sumner, J. S. , 1976, Principles of induced polarization for geophysical exploration: Amsterdam, Elsevier, 278 p.
Wynn, J. C., and Blank, H. R., 1979, A preliminary assessment of the 1977 INPUT survey on the Arabian Shield, Kingdom of Saudi Arabia, with guides for interpretation and ground follow-up: U.S. Geological Survey Open-File Report 79-1508, 32 p.
31

Appendix 1. Profile data listing for Rabathan area
FILE> RAB-13 PROJECT> WADI 8IDAH «L1NE> 130N JMITS> METERS
STATION| SL1NGKHM ISP JTOPO {MAO
-200.-187.-175.-162.-150.-137.-125.-112.-100.-87.-75.-62.-50.-37.
-2:5.-12.
0.12.25.37.50.62.75.87.
100.112.125.137.150.162.175.187.200.212.225.i37 .250.262.275.287.300.312.325.337.350.
IFrq1
0!5!015!015!Oi5101510!510!510!5!0!5!015!015!015!0!5!0!510!5j0!510!51015!015!015!01510!5!0!
re.
-.4
.41
-1.
.53
3.4
1.6
.76
1.5
.73
-11
-3.
3.5
-6,
1.4
2.9
.79
1.5
-.5
-.0
-5.
1.3
111im.
1Ire.
1iIi
-.31.3
0111.3{
.201 .24
_ <
-5.
-4.
!1.83112.3111.4J
-.413.1
3.1114,5{
1.013.5
-5.
-8.
-5.
-4.
-4.
-4.
-3.
-2.
-2.
-2.
-2.
-2.
11-5.
11-6.
111. 21i-6.
{1.93112.211.38111.211-.6
11-.3
11-3.
111.3
375,01 »400. 0! j
2221im. | re.
1II1
2 (2.3!
2.813.7i
2.0(2.71
-1. 1-1.
1-7. l-.T^
!-7. |-2.
1-2. !3.2
16.518.6
12.416.4
t-5. 1-7.
1-101-11
1-5. 1-.4
1-5. 1-7.
I-4. l-.l
1-5. !.71
1-4. 1-.2
i-2. 11.0
1-1.1-.4
{-.!!-. 3
1-.11-3.
1-1. 11.3
ii
444|iff*. Ire.
111i
4.515.5
15.017.5
14.016.7
1-2. !£. 6
1-111-7.
1-131-10
{-6. |-1.
16.0112.
{-.417.1
J-101-13
I-151-21
r-6.1-2.
1-8. 1-10
1-7.1-1.
1-101-2.
1-5. 1-1.
1-2. 11.4
1-.7!. 6
I1.31.91
!.491-2.
!-.712.1
t{
888! 1777!mv.im.
5.5
7.5
6. /
2.6
-7.
-10
-1.
12.
7.1
-13
-21
_ n
-10
^ 4-
-2.
-1.
1.4
.6
.91
-2.
2.1
re.
9
12.
10.
.13
-22
-24
-11
13.
-.8
-25
-35
-12
-20
-9.
-15
-8.
-.9
.4
1.3
-2.
.74
im. 1,'43
146143147
3.8151150
2.0150145
-4. 140136
-13133J27
-18 J2517
-231-31!-6
-1911119
-3. 131135
-14135143
-21139142
-23147143
-151-381-15
-221-1011-71
-211-681-77
-281-961-92
-171010
-7. 1010
-4. 1010
2.41010
.4910to
-3. JO|i
11110001110001J10001110001
InT1!{!!!i
.39!i
1998.82 11 11997.641!1 11996,4621i 11996.069!1 11995.284!1 11999.243!111COO111004111012i
11026111044!1 1 055!11063!11059111052111052!11059111077
11109211107J1121
!.42!
!.38!
!.34»
i.69!
1.851
\.67!
!.36!
1.4 I
i.14!
i.14!
1 4 1
!.561
!.35!.13!.92!
32

Appendix 1. Profile data listing for Rabathan area [continued]
C'ILE> RAB-23 PROJECT>
SLI NORAM
BIDAH- LINE> 360H UHITS> METERS
ITQPO !MAGJSP
IFrq! re.
-200.01-187.51-175.01-162.5!-150.0! -,2-137.5!-125.0! -1.-112.51-100.0! -.6-87.5!-75.0! -.6-62.5!-50.0! -.9-37.5!-25.0! -i. -12.5!
0.0! -.812.5!25,0! .4737.5!50.0! -.662.5!75.01 1.587.5!100:0! 1.5112.51125.0! -1. 137.5!150101 -2.162.5!17?-. 0{ -i.187 . 5 !200.0! 6.1212. 5!225.0! 5.2237.5!250.0! 13.262.5!275.0!300. Oi
111! 222!im, i re. ii».
1t!I
-.61-.0 -.4
1-.51-1. 0
i-.4J-. 6 0
}-1. J-.6 -.7
I-1. I-.9 -1.
i_ « i . <a -i± « \ ft : J * *
-1. 1-.8 -2.
!«-.7J. 67 -1.
|-1. I-.4 -2.
i
-1. |1.7 -2.1
-.611.9 -1.(
-1.1-1. -1.
»-2.J-3. -1.
!-3.1-1. -3.
!-o. 15.0 -3.
(-2. !5.9 -2.
!-.9! 9.0 -. 1
!{1
444J
re . im.
.47 -.4
-1. -.1
-.0 0
-1. -2.
-1. -3.
-1. -4.
-1. -4.
.77 -4.
-.4 -5.
.43 -5.
1.5 -4.
-2. -2.
-5. -2.
-4. -4.
.24 -5.
-.4 -4.
3.4 -.6
888]re. im.
1.6 1.6
-1. -1.
.77 .77
-1. -1.
-2. -2.
-4. -4.
-4.* -4.
-1. -1.
-3. -3.
-3. -3.
-.6 -.6
^
-6. -6.
-8. -8.
-7. -7.
-4. -4.
1.62 .62
!
I777jmv.re. im. {
»-1051-104»-104{-99
.67 -7. J-99!-79
-1. -4.J-58!-45
.47 -4. J-39!-36
-6. -101-251-28
-8. -15!-24!-24
9 -15 1 -24. A *»j i t ~
I -26-10 -171-20
1-21-7. -15J-35
!-38-12 -17J-44
!-53-10 -16J-63
!-66-6. -111-57
!-29-7. -7.1-16
!-8-9. -7.1-12
!-6-15 -121-44
1-53-14 -151-63
1-66-11 -111-75
i-78-2. -5.!-72
J-64J-63
1
!nT!
1000 I!
1001.97!!
1003.94}!
1005.9 1»
1007.87!1
1010.23!I
1011.31!1
1013.381 I
1014.561!
1016.53!s
1018.89!I
1021.65!(
1024.41!1
1 A9O T7 I1 UcO . / f \
1035.61!!
1045.97!»
1061.83!)
1081.22!!
1106.22!I
1131.2211156.22!
33

Appendix 1. Profile data listing for Rabathan area [continued]
"ILE> SAB-23 PROJECT> WADI BIDAH -LINE? 370N
N! SLINGS: AM
UNITS> METERS
JSP ITOPO IMAG
IFrq1 re.
-200. OS-187.51
-175.01-162.51-150.0J -,2-137.51-125.01 2.2-\12.5I-100.01 1.2-87.51-75. 3! .3-62.51-50.01 -1.-37.51
-25.01 -.6-12.51
o.o; -.012.5125 . 0 J 2.137,5150.01 1.862.5175.01 4.637.51100.0) 4.9112.51125.01 5.0137.51150.01 -1.162.51175.01 .32187.51200.01 -7.212.5,'225.01 -1.237.51250.01 2.6262.51275.01287.51300.01
1111 2221 444|im. Ire. ii»». Ire. im.
I 1i i i ii 11 I
-1. I-.5 -.812.2 -2i 1
-2. 13 -2. 13.3 -4.i 1
-3.il -4.1.2 -8J 1
-3.1.3 -5.1-1. <3.1 i
-3.1-1, -4.J-2. -8.
1 I-2. I-.2 -2. 1.3 -5
1 1-1. 1.84 -2. 12.3 -5.
1 I.5013.8 .9115.8 -1.
1 I-1. |2.9 -1. 12.9 -5.
1 1-1. 15.8 -1. 14.1 -4.
! i-.6*6.4 -.414.3 -3.
1 1. 12J5.0 .8413.8 1.0
1 1-.21-1. 2.21.29 4.1
1 1-2. l-.l -1. 1.02 -1.
( i-2. J-8. -1. 1 -10 -1.
I 1-1.1-1. -1.1-4. -1.
1 1-.614.2 0 1-2. -.'3
1 11 11 11 i
388! 17771*»v,re. im. lr*. i». 1
I 1-741 1-891 1-701 1-70
3.3 3.3I-.7 -141-711 1-70
2.9 2.91-5 -191-631 1-57
-3 -3 t-13 -231-36
1 1-27-6 -6 1-18 -251-31
\ 1-25-5. -5. 1-17 -251-47
I 1-21-.8 -.81-7. -211-19
1 1-12-.0 -.01-10 -231-20
1 1-235.7 5.71-2. -161-35^
1 1-47.17 .171-8. -181-64
1 1-1001.2 1.21-5. -141-121
1 1-1301.8 1.81-7. -121-139
1 1-1294.4 4.4J2.6 -5. 1-102
1 1-1134.2 4.217.1 2.21-145
1 1-172.53 .531-1. -9. 1-186
1 1-279-11 -111-13 -4. j-277
1 1-269-6. -6. 1-12 -4. J-258
1 1-177-8. -8. 1-15 -6. 1-134
1 1-1091 1-1081 1-941 1-95
InT1
1000 11
1000 I1
1000 11
1000 11
1000 |1
1000 |1
1COO 11
1000 11
1001.5711
1005.9411
1013.2 11
1025.9411
1044.1 |1
1059.9711
1065.9711
1070.7411
1075.5111
1089.2511
1126.0411
1 162.8211
11199.611
34
Appendix 1. Profile data listing for Rabathan area [continued]
FILE> RAB-29 PROJECT) WAOI BIOAH LINE> 380N JNITS> METERS
STATION| SLI NORAH 1SP JTOPO 1MAG
-200.-187.-175.-162.-150.-137.-125.-112.-100.-87.-75.-62.-50.-37.-25.-12.
0.12.25.37.50.62.75.87.100.112.125.137.150.162.175.187.200.212.225.237.250.262.275.287.300.312.325.
IFrqI re.
0151015!01 2.25101 1.0510| 1.251PI -3.5101 -2.510| -2.5101 -.651Of . SH5101 1.75!01 2.75i01 1.4510! 1.6510 ! .935!01 .065101 -3.510!510151015101510)
1111im. Ire.
1II1
.5013.51
-1.U.71
-4. 1.54I
-5. 1-4.
1-5 1-3.
1-2.1-1.
1-1. 1.96
1-.613. 1
|-1. 12.8
1-.813.3
10 12.6
11.013.5
1-.211.8
1-3. l-.l
1-3.1-3.
1111t11111
2221i ii» . Ire.
t111
2.415.01
-.712.81
-5. 1-1.
1-121-7.
1-7. 1-6.
1-4.1-1.
1-.913.3
1-.31*1.6
i
-2. {3.2i
-1. 14.41
1.214.41
-3. 15.41
1.514.11
-2. 1-.4
1-3. 1-4.
111111i111
444J
im. 1 » «.1111
3.019,51
-1. 13.01
-9.1-5.
1-131-14
1-121-13
1-e. s-5.
<
-5. 11.2
-3. 14.01
-6. 1-.3
1-3. ,'3.3
1-.215.1
1-4. 19.2
11.315.9
1-3.1-1.
1-4. J-5.
J11111i
118
8881im. 2 re.
1i
11
9.5110.1
3 . ») 1 - . 51
-5. l-ifc1
-141-29
1-131-27
1-5, J-19
11.21-11
14.01-5.
1-.31-9.
13.31-3.
15.111.4
19.219.8
15.955.9
1-1. 1-4.
1-5. 1-8.
1111111I11
I777jmv.im. |
1-481-291-21
115-8. 1-4
1310. 118
124-21118
121-23113
116-25110
118-25118
19-231-1
1-21-191-50
1-62-201-73
1-93-121-36
1-100-7. 1-35
1-^8-.31-90
1-104-4. 1-125
1-166-9. 1-210
1-216-8. 1-225
1-2191-2C11-2111-1881-1351-1351-1181-1011-721-35
1000
1002.
1004.
1006.
1007.
1C03.
1010.
1007.
%
1011.
1015,
1022.
1033.
1051.
1070.
1084
1093.
1103.
1113.
1123.
!r,Ti
I5
361!
7311
3 1t
8711
0511
621i
8611
0211
791i
6311
921t
49»1
261111
9 1i
8 11
7 11
6 1i1J11i
35

Appendix 1. Profile data listing for Rabathan area [continued]
FILE) RAB-29 PPCJECT.> WADI 8JDAH LINO 390N UNITS> METERS
'AT I ON} SLINGRAM JSP J TOPO I MAG
IFr
} -200.0? -187.51 -175.0} -162.5} -150.01 -137.51 -125.0} -112.51 -100.0} -87.5} -75.0} -62.5} -50.0}-37.5}-25.0} -12.5}
0.0}12.5}25.0}37.5}50. OJ62.5175.0}87.51
100. Oi112.5}125. 0}137. 5 {150.0}162.5}175.0}187.5}200.0}212.5}225.0}237.5}250.0}262.5}275.0}287.5}300.0}
q 111} re. im, 1 re.
J i i
1.4 .5013.1 i
-1. -1 J-.4
i -.4 -4 |-i.
i
-2. -6.} -4.
1-.6 -6. }-2.
-1. -4.J-1.
1.96 -1.12.2
i2.4 -l. [3.5
S2.4 -.814. 1
!1.2 -.9}2.8
}1.9 1.0J3.6
i3.1 2.317.0
'
1.7 1.013.3j
3.2 -2. }3.1i
-3. -5.1-5.
I}1J
111i
222! ii>. } re.
! t I
i 3. 5} 6.0
! .30}. 94
1 -4. }-2.
! -7. 1-7.
1 -9. 1-6.
1-4.J-1.
i-1. 13.5
1-1. 15.0
1-1. 15.4
1-.713.9
!3.116.2
}6.017.5
i3.3S5.6
1-2.13.3
1-7. 1-7.
1}1!iiI}
444J im. } re.
1 i
5.5111. i
0 12.9 !
-8 1-6
1 -121-12
1 -131-13
1 8i _<i. i -*» .
!-3. 13.0
1-4. J3.9
!-4. J3.8
f-3. }3.0
}-3. 18.9
19.1113.
i5.0110,
i-3. 12.8
1-11!-12
,'
!}i!i}1
888} 1 i m . 5 r e .
11
111. 115.
1 2.911.8
! -6 1-15
1 -121-26
1 -131-28
i-<i - 1 C,
3.0}-5.1
3.91-4.1
3.81-5.1
3.01-4.{
8.9J8.6i
13. 118.i
10. 112.1
2.8J-2.1
-121-24
11!!}111
.7 7 7 1 mv . im. 1
1-8 1-3
12 112
-.4122 }27
-7. 133
-19112 18
-2214 13
-251210
-24}-l }-l
-18101-25
-191-631-87
-171-911-86
-141-55}-49
-.61-491-46
12. 1-611-63
-1. 1-711-86
-12J-104
}-!3i-20}-115
1-117i-1281-1341-123}-1621-1821-861-71
1 111000111003. 1 11006. 1 11007.
11007.
11009.
11009.
11011. 111014.111019.{11013.111021.111013.f11017.I11018.111017.111014.1!1012.
111009.11}J
InT 1 i t
161 1
321 1
891 1
891
071 1
8511
«!"***T«J 1
1
5911
76}1
34!i
47}1
78}1
74}i
91}j
74}i
97!1
21}f
45}}}Sj
36
Appendix 1. Profile data listing for Rabafhan area [continued]
FILE> RAB55 PROJECT> WADi BIDAH 550H UNITS> METERS
STATION! 5LINORAM 1SP STOPO JMAG
-100-87-75-62-50-37-25-12
012253750627587100112125137150162175187200212225237250262275287300312325337350362375387400412425437450462475487500
IFrq1
.01
.51
.0!
.51
.01
.5!
.0!
.51
.01
.5!
.01
.5!
.01
.5!
.01
.5!
.01
.51
.01
.51
.0!
.51
.01
.5!
.01
.5!
.01
.51
.0!
.5!
.01
.51
.01
.5!
.01
.5!
.0!
.51
.0!
.51
.0!
.5!
.01
.5!
.01
.51
.0!
.5!
.0!
re.
-3.
-1.
-1.
.74
18.
-2.
4.2
-1.
-1.
.75
.59
-.3
-1.
1.8
5.5
.28
.80
.24
-1.
-.8
o .
11irn
-7
-5
2.
2.
13
2.
-.
-.
-1
-3
4
-4
-2
-.
-.
1.
1,
-1
4.
_^
-5
11. Ire.
IIII
. 1-5.1
.1-3.1
91-1.1
313.11
.112.1
51-1.1
414.41
41-1.1
.1-1.1
. 1-.31
.1.08f
.I-.31
.1-1.1
912.91
116.1I
211.81
012.51
.1.84!
01-2.1
. 1-3.I
.1-5.i
111
2221im. Ire.
1111
-101-11
1-7.1-7.
I-2. 1-3.
12.814.8
113. 15.4
12.61-1.
12.312.4
12. 01-. 3
1-.21-2.
1-4.1-1.
1-5. 1-2.
1-4. |-1.
1-2. 1-.9
1.7614.0
!2.718.4
14.8J4.9
14.315.5
11.022.6
1-3.1-2.
1-9. 1-7.
1-6. 1-8.
!111
4441
im. Ire,f111
-161-19
1-101-12
«-3. 1-3.
15.619.3
I10. (4.0
15.714.2
I5.2110.
I4.412.8
11.01-1.
1-5.1-4.
1-101-7.
1-7.1-4.
1-3.1-1.
1.9816.7
\5 0113.
!7.4110.
t
7.319.71
2.014.21
-4. 1-3.
!-131-13
1-9. 1-11
1111
8881im. Ire.
1111
-191-36
1-121-25
1-3. 1-8.
19.3110.
14.011.6
14.216.1
110. 113.
I2 814.8
I-1. 1-1.
1-4. 1-11
1-7. 1-20
1-4. 1-13
1-1. 1-4.
16.719.0
113. 116.
110. 115.
19.7114.
14.214.2
1-3. 1-8.
1-131-26
i-111-27
\I11
1777!mv,im. 1
164173182',66
-26150150
-17150134
-7. 117(30
.94144141
2.9139131
6.01191-2
6,21-231-48
6.81-731-89
2.01-1171-168
-121-196
1-241-211-305
1-306-181-268
1-215-131-158
1-104-4.1-75
1-63
2.41-511-40
6.61-301-31
7.31-321-30
-3. 1-281-36
-111-441-43
-221-431-25
-181-171-111-61-310
1000
1000.
1001.
1006.
1017.
1031.
1047.
1058.
1065.
1073.
1080.
1088.
1093.
1091.
1087.
1076.
1065.
1057.
1051.
1050.
1051.
1054.
1058.
1062.
1066.
InT111
7911
5711
7511
1 11
8911
2111
0311
2911
41!1
6811
8 1i
9811
6111
251!
9 11
6111
0511
87!1
3 11
48!t
64!1
59!!
55!1
51!
37

Appendix 1. Profile data listing for Rabathan area [continued]
F!LE> RAB75 PPOJECT>
STATION! SL I NCR AM
!Frq lllj { re. im. { re.
400.0! ! 412.5! 1 425.0! ! 437 . 5 ! 1 450.0! 1.7 -2. 11.3 462.5! ! 475. 0{ -.1 -1. {.13487. 5 {500. 0{512.5!525.0!537.5!550.01562.51575.0!587 . 5 !600.02612.5!625.01637.5!650.0}662 . 5 }675.0!687.5!700.0!712.5!725.0!737.5!750 . 0 1762.5!775.0!787.5!800.0!812.5!825.0!837 . 5 {850.0!862.5!875.0!887.5!900.01
!-2. -i.l-2.
i-1. -.4J-. 7
!- . 5 . 30 i . 39
{-1. -.!!-. 8
i-.9 -1. {-.4
1-2. 3.6J-3.
{-2. -4. {-3.
{-2. -2. !-2.
1-2. -2.1-2.
{-.9 -3. 1-.7
i-1. -2.1-1.
{-3. -2.1-2.
{1.5 1.011.5
!-2. -.51-1.
{3.0 -.815.0
J!{J
WAD I BIDAH «LIHF.> 750N
222! im. { re.
!! {
-.811. 7i
- . 4 ! . 83{
0 1-1.{
1.68.48J
2.512.3{
1.41.70{
-1..J-.2
!-4. 1-6.
!-6. !-7.
i-2. !-3.
i-2. !-3.
{-3. {-3.
i-4. J-4.
{-1. i-4.
i1.91.87
{.781-2.
{.40,'3.0
ii{{
444} im. {re.
!
. 30 { . 83 i
.6012.5{
l.ii.81;
3.712.9{
5. 115.6i
1.713.2{
-3-.1-.G
i-8. !-9.
i-lOf-11
j-3. 1-4.
i-4. J-4.
!-7. 1-6.
{-7. {-9.
I-3. {-6.
i2.61.21
11.31 1-2.
{. 35 ! 1 . 6
ii
{
|
UNITS>
388} 1777 Jmv. in». i re. im. 1
i 10 1 \2 \ 13: 10
.8313.2 -2. 1-2 1 1-9
2.512.7 -3. J-14i
. 81 1 1 . 6{
£.915.3{
5.617.6{
3.2J3.0{
-.0!-5.
{-9. 1-21
1-111-24
1-4. {-9.
{-4. J-ll
!-6. J-17
i-9. 1-17
1-6. {-11
{.211-1.
i-2. {-2.
11.6J-.3
{1i{
1-27
-3. f -41{-58
4.51-74{-93
6.1 {-135{-229
4.81-224{-239
-8. 1-2661-297
-191-295
1-300-221-316
1-291-101-278
1-257^-15J-257'
S-239-151-218
{-210-141-210
1-191-121-138
! - 1 13-.11-99
{-85
1.61-781-72
1.71-62{-58{-48{-40{-35
METERS
JTOFC 1MAG
1 InT
11000 1 i ! 1995.2311 1 ! 1990.462! 1 1 1991.641 {; i1995.139!! i
1999.159!1 i11004.34!1 111008.7 1\ 111012.66!! !{1017.43?i i
11022.6 {{ ;11029.44!\ \11038.44!i :11051.181i i11066.5 !i :11084.07J1 111105.43! i i11126.11!! 111 149. 58{! i{1173.061j 111196.54!
38
Appendix 2. Profile data listing for Jabal Mohr area
FILE> MQHR1S PROJECT>
STATION! 5L INGRAM
-400.-375.-350.-337.-325.-312.-300.-287.-275.-262.-250.-237.-225.-212.-200.-187.-175.-162.-150.-137.-125.-112.-100.-87.-75.-62.-50.-37.-25.-12.
0.12.^5.37.50,62.75.87.100.112.125.137.150.162.175.187.200.
IFrqi
010101510151015|0151ot5101510151015101510151015!0151015i015i0151Oi51Oi510151015101510!5{0151Oi
re.
-1.
-.5
.71
-5.
-1.
-.8
-.8
1.4
1.9
.03
-3.
-4.
-4.
-4.
-4.
- 3.
-4.
-2.
-.9
-2.
.22
111im.
-2,
-2.
-2.
-2.
-2.
- 2.
-1.
-2.
-2.
-3.
-3.
-2.
-1.
-2.
-2.
-2.
-2.
-3.
-3.
-2.
-2.
re.
-1.
-,6
.01
-5.
-2.
-.8
-.8
1.0
1.3
-.6
-3.
-6.
-3.
-2.
-4.
-3.
-4.
-3.
-1.
-3.
-.3
WAD I BIO^H UN£> 10»S UNITS>
1SP
2221im. 1 re .
1i
-l.l-l.
i-1. \-.B
1-1. 1.01
1-1. 1-5.
1-.81-1.
1-.71-. 8
1-.11-1.
1-1. 11.0
1-1. 11.1
1-2. 1-.8
i-2. 1-4.
1-2. 1-8.
1-.21-7.
I-.81-9.
1-1. 1-5.
i-1. 1-3.
i-1. 1-4.
i-3. 1-3.
12.61-1.
1-1. 1-3.
i-1. 1-1.
i
11i
444}
im. 1 re.1i
-.51-1.
1-.61-. 0
1-.71.51
1-.21-4.
1.101-1.
1.631 -.8
11.5I-.3
1.1011.8
J-1. 11.5
1-1.1-1.
1-2. |-4.
1-.31-8.
I3.01-6.
1.801-8.
10 J-3.
1-i. 1-2.
1-1. 1-3.
I-5. 1-3.
1-3. J-.9
1-2. 1-2.
i-.21-.0
I11i
3881im. 1 re.
i1
-1. 1-2.
|-.01-1.
1.51J-. 3
1-4.1-6.
1-1. 1-1.
i-.81-. 3
1-.31.22
11.81.81
11.5I-.0
i-1.1-2.
1-4. 1-6.
1-8.1-7.
1-6.1-4.
i-8. 1-8.
i-3. J-3
1-2. !-*.
1-3. 1-3.
1-3. 1-6.
1-.91-3.
1-2. 1-3.
1-.01-. 3
11i1
1777!mv.im. i
1I
-1.11319
-2.11419
-2. 18113
-1.1614
-.111319
1.511115
4.01-31-3
.501-13
-3.
-4.
-6,
-4.
8.3
4.0
-.5
-8.
-5.
-22-27-21-28-27-30-51-26-18-21-9-10-7-2-13-8-9
0-7
-1910124
-1211-11
-7. -7-15
0 -9-7-10
1610
METERS
JTOPO IMAG
111105111045,11039.111035.111035.111035.111039.111046.i11054.111055.111053.111050.111052.111070,111095.111117.111129.i11132.i11131.i11130.111133.1$1127.i11119.i11111.111103.
InT11
411821
1461
1071
1461
1021
1711
1931
1231
1651
1391
1471
1041
i041
1781
1551
1311
1921
1341
11 1
i931
18 i
1681
1561
39

Appendix 2. . PROJECT>
STATION! SLINGRflM
! 1
-400.0!-375.01-350.0!-325.0! -300.0! -275.0! -250.0! -225.0! -200.01 -175.0! -150.01 -125,0! -100.0! -75.01 -50.0! -25.0!
0.0( 25.0! 50.0! 75.0!
100.0! 125.0! 150.0! 175.01200.0(
-------_ lor Fr<l 111! 2221 ~~ ------ * ;-. ...... :::L. r;pe *~
i i ire. tin. | i'li* 1 i 1 ~3 - -2.1-4. -i ,_ 4 ' 1 |-« -«..-,. -t1 : .i : 9 :; -«. - . -3 ., 5
-6. -2.1-6. -j.j.g 3 2- -^.1-3. -3., 75 -° -2- M.I -t.M ; -i ; 7; ; 7 -'- 7 - -*.i-a M -2.1-., -!.!_* *' 4 -J "-7I3.S -4.u - 1 -l.J-1. -.i . J !'" -»"I.11 -.91-4 3 ' e --8I3.6 i.8,3 1: f'* 1; 1 - -1-l-e. 2.31-3 « -1.11.0 - « 4! 3:= f'« 5 -"'7.8 7.61-7 -3. -3.,-,. -i*:^;f "-6 1.811.0 -.3,-n -« -»-l-S. -4., - 7 .* ! ' ''-I-*. -1.1-23 -.6- -7.1-8. -e.,.^ .^'- 7 - - 7 -l-9- -9.1-6-2- -5.1-3. -6. -4 - U "s 1 "'-* -35I-11 -;5 -3.1-t. - 7 .,.2 ."|-5 - -S-l-22 -«|- le-f- -4.1-3. -6. -3.' -u.' 7 - 'I-'-28 -"61-19 -1- -1.1-2. -4., - 2 "' « -« !-» -421-29
";' :*:,':S '",'lf ° " ̂ 7 ^"" :"'--32° «-3.,-.1-2.7l :° ;370 ! 13481 - 8H -°- 8«'-'-1- -3.1-2. - 2 . _;' J- - 3" * !-!. -12I-13 -f. -3. .-3. -2. .3 ; .f ';» 'I- -4. -«|-£8-* -« ;-» -. -3. ,fi|.,3: .1; -: ;-;-
i ; 1-121-5
U*ITS> METERS
ITOPO
I1106211049.26!11036.52111032.16!J1037.751H049.51I11062.251J1074.5 !11090.92!11106.24!11116.14!11124.26!11127.02!11129.38!11133.34!11136.5 I11137.68111138.47!11138.07!11136.5 |11134.14!11130.18!11124.18111118,17!11112.17!
40

Appendix 2. Profile data listing for Jabal Mohr area [continued]
FILE> MOI-
STATION!
4RiN PROJECT>
SL I HOP AM
IFrq 111!i
-400.0!-375.0!-350.01-337.5!-325.0!-312.51-300.0!-237.5!-275.0!-262.5!-250.01-237.51-225.0!-2J2.5!-200.0!-187.5!-175.0!-1S2.5I-150.0!- 137 . 5 I-125.0!-112.51-10G.O?-87.5!-75.0!-62.5!-5C.01-37.51-25.0!- 12.51
0.0112.5!25.0137.5!50.0!62.5!75.0!87.5!100.01112.5!125.01137.5!150.01162.5!175.0!1S7.5!200.0!
re. i fr« . } r e .11
2.3 -1. 13.1i
-.2 -.81-.!
12.1 -.312.3
18.1 -1.17.0
16.7 -1. {7.3
1£ . 5 -1.12.5
!3.8 -2. 53.8
1.53 -1. l-.l
13.9 -2. 13.3
11.2 -2.1.9.1
!-1. -2.1-1.
11.6 -3. |1.1
16.9 -2. Jl.O
5-14 1.01-14
1-2. -2.1-3.
1-3. -1.1-3.
1-2. -v.1-3.
i-3. -2.1-3.
1-2. -2.1-2.
1-2. -2.1-3.
1-1. -1.1-2.
11{1
WADI GIDAH LINE.V-100N uHITS> METERS
iSP 1TOPO 1MAG
222! 444!im . 1 re. im. Ire.
i i
i 1-.812.5 -.412.3
1 i-.41-. 4 -.5!-. 3
1 1-.512.4 -.412.4
i i-.416.2 -.215.3
1 1-.316.7 .1116.1
i 1-.311.2 .551.93
1 1-.512.9 .3311.5
1 1-1. 1-.5 -1. 1-.8
i !-1. 13.3 -1. 13.7
1 !-2. 1.51 -3. 1.51
1 1-1.1-2. -1.1 -.8
i i-2. 11.1 -3. 11.1
1 1-1. 1-2. -1. 1-2.
i i-.21-14 1.01-13
1 1-1.1-3. -1.1-3.
1 i.301-2. 2.813.3
1 1-1. 1-3.. -i. 1-2.
i i-2.1-4. -3.1-2.
i 1-2.1-3. -2.1-2.
1 5-1.1-3. -1.1-2.
i 1-.41-1. 1.21-.8
i 11 11 12 i
888! 1777Jmv.im. 1 re.
1i
2.311.11
-.31-1.
12.411.9
15.312.5
!6.114.8
1. 93 i - . 1
11.511.0
1-.81-1.
!3.712.0
1.511-2.
1-.81.07
i1.11-2.
1-2. 1-3.
1-131-14
I-3. 1-3.
i3.311.2
i-2. -1-2.
1-2. 1-4.
1 2. 1-3.
1-2. 1-3.
1- . 8 ! - . 7
111I
im. {i1
-1. 1-65-4
-2. j-31-6
-.21-6
10-1.1-1
1-8
.111-91-26
1.11-211-23
-2. 1-361-20
-2. 1-221-23
-6. 1-171-20
-14J-165-31
-111-335-29
-151-225-23
-5. 1-231-27
2.21-131-16
-5. 16111
8 . 5 1 1 7120
-5. Ill119
-1111456
-9. 1-61-8
-6. 1-81-2
-4. 131-11
101210
1 InT1 111047 111039.74!11032.47!1 t11033.65!1 111038.8311 111049.65!! !11062.89!1 111073.7 11 t1 1 085 . 95 !1 !11091.54!\ \11089.18!1 !11088.78!1 111090.751i 111100.65!1 111121.33!1 t11122.51!1 iS1123.93!1 !11132.09!1 f11132.48!1 1
. 11132.09!1 !11130.91!1 1J1128.54!1 111124.18!1 !11119.82!1 111115.46!
41

Appendix 2. Profile data listing for Jabal Mohr area [continued]
FILE> MGHR2H PROJECT> MAOI BIDAH LINO 200N ONITS> METERS
STATION! SLINGRAM S SP JTOPO {MAG
-350.-337.-325.-312.-300.-287.-275.-262.-250.-237.-225.-212.-200.-187.-175.-162.-150.-137.-125.-112.-100.-87.-75.-62.-50.-37.-25.-12.
0.12.25.37.50.62.75.87.100.112.125.137.150.162.175.187.200.
iFrq! re.
0!5!0!51Oi 1.75!01 -1.5!0| 1.25!0! -2.5!01 -2.510! -8.5101 -5.5!01 -6.51Of -2.5101 -.85101 -4.510! -1.510! -2.5!0! -2.5!0! -4.5!0! -4.5!0! -3.5!0! -.85!0! -.65!0!5!01
111im.
-2.
-2.
-2.
-2.
-2.
-3.
-3.
-3.
-2.
-1.
-1.
-2.
-1.
-2.
-3.
-3.
-3.
-3.
-2.
222!re.
.90
-1.
.75
-2.
-2,
-9.
-7.
-7.
-3.
-1.
-3.
-1.
-2.
-3.
-5.
-4.
-3.
-1.
-.9
im
-1
-1
-.
-.
-1
-3
-3
. ire.1!i!
.1.90i
. 1-1.1
51-7.i
9i-2.1
.1-3.1
.1-12i
.1-8.1
-3. !-8.
-2
0
-.
1.i-3.
13I-.8
11-3.
131-1.
1.411-3.
-.1
5!-3.11 _C
2.i
7!-4.!
-2.J-3.
1.
-.
!91-1.
16!-. 8
!!!i
444!im. !re .
!iii
-i. i!
-.7!
1-.11
!0 !
i-2. i
I-4. I
1
1.3
-.3
1.2
-1.
-2.
-13
-4. 1-9,
!-3.1-8.
1-3.1
11.11
11.4|
1l.Oi
1
-3.
.70
-1.
.54
2.31-2.1
.601I
-1. II
-3. 1i
-3. »!
-1. !!
l.Oii!!{
-1.
-4.
-4.
-3.
-.4
-i.
888!im. } re.
1Ji!
1.31-.5!
-.3!-2.
I1.21.54
!-1.1-2.
!-2. 1-4.
1-131-17
i-9. i-12
1-8. 1-6.
I-3. 1-5.
I.7012.5
1-1.I-.3
1.5411.8
1-2.I-.0
'I-1.I-.5
1-4.1-5.
1-4. i-6.
1-3. 1-5.
1-.41-1.
1
1777!mv.im. !
!7131617
-4. 10SO
-3. 1311
-.7J11-7
-.2S-101-14
-5. !-19!-28
-14J-46!-50
-131-51!-40
-121-311-47
-121-251-29
.931-211-12
2.91-81-8
1.61-171-4
6.81-11-9
.601-31-6
-7.1-41-12
-121-191-15
-11121-9
-5.1-319
-i. 1.39 3.815!1!1
15101617
!!11060J11065.iJ1070.111079.!11087.!S1093.i11103.i11114.111123.111133.111138.I11144.111154.111162.111167.111170.I11172.111172.111172.f11170.111166.111161.111157.
inT!I!
18!i
35!i
3 !i
92!{
93!1
37!i
19!1
64!!
08!r
67!1
67|1
121I
241(
8311
9911
56!1
5611
561!
6 II
23!!
87!1
51!
42
Appendix 2. Profile data listing for Jabal Mohr area [continued]
FILE> P10HR3N PRCJECT> WAOI 8IDAH LINE>^300N
STATION! SLINGRAM
UNITS> METERS
JSP ITOPO IMAO
!Frq1 re.
-350.01-337.51-325.01-312.51-300.01 2.3-287.51-2 75. OS -3.-262.51-250.01 -7.-237.51-225.01 -.8-212.51-200.01 -4.-187.51-175.01 -2.-162.51-150.01 .81-137.51-125.01 1.6-112.51-100.01 2.-*-87.51-75.01 1.9-62.51-50.01 -.7-37.51-25.01 --4-12.51
0.01 -2.12.5125.01 -.937.51bO.Ol -1.62.5175. Oi -187.51100.01 -1.112.51125.01 -1.137.51150.01 -1162.51175.01187.51200.01
111im.
-2.
-2.
-1.
2.1
-2.
-2.
-3.
-2.
-1.
-1.
-1.
-1.
-1.
-1.
-1.
-.9
-1
-.6
-1
2221 4441 8881re. i** Ire. im.lre* im.
1 11 11 11 1
1.9 -.611.9 1.112.5 2.51 1
-3. .801-4. .501-3. -3.1 1
-7. .1 1-8. 3 1-7. -7.1 1
-1. -.61-1. .801-. 7 -.71 (
-4. -1.1-5 -l.J-5 -5
1 1-1. -2.1-2. -2.1-2. -2.
1 11.0 -2. 1.81 -3. 1.40 .40
1 11.3 -1. 1.21 -2. I-.8 -.8
1 11.6 -1. 1-.5 -.51-1. -1.
1 12. 40 11. 3 1.11. 78. 78
1 1-1. -.21-3. .961-3. -3.
1 1-.9 -4. 1-1. .611-1. -1.
1 2-2. -.81-3. -.21-2. -2.
1 1-1. -1.1-2. -.51-2. -2.
2 1-1. -.71-1. -.51-1. -1.
i 1-1. -.71-1. -.91-2 -2
1 1-1. -.91-1. -1.1-1. -1.
1 1-.8 -.81-1. -1.1-1. -1.
1 1-1 -.51-1. -.61-1. -1.
1 11 11 11 1
17771mv.re. im. 1
124113111121
2.9 4.5121122
-4. 2.1121113
-7. 7.5115113
-1. 2.911412
-6. -5 (01-4
-6. -8.1-121-5
-3. -131-71-27
-4. -111-4
(0-2. -2.1-5
1-3
.78 5.0101-7
-3, 5.11-510
-1. 2.01-11-1
-3. -1.101-5
-2. -2.11018
-2. -3.2161-20
-3 -4.116124
-3. -5.1-71-23
-3. -6.1-20
28-2. -3. 16
1-13
11110118
1 InT1 12 1 039 I1 111039 11 111039 I1 121036.2411 111036.2412 1(1035.0611 111035.0611 111039.8311 111043.3912 111053.7411 111065.511I 121077.2712 211086.271\ 111091.8611 111095.4211 111098.1812 111099.7511 111099.751i i11099.7511 111099.7511 121099.751\ \11099.7511 111099.751
43

Appendix 2. Profile data listing for Jabal Mohr area [continued]
FILE> MOHR4M PRQJECT>
STATION! 5L INGRAM
iFrq 111$
-350.-337 .-325.-312.-300.-287.-275.-262.-250.-237.-225.-212.-200,-187.-175.-162.-150.-137.-125.-112.-100.-87.-75.-62.-50.-37.-25.-12.
0.12.25.37.50.62.75.87.
100.112.125.137.150.162.175.187.200.
10!510!5!Ot510!SIOi51Ot5,'
0151Of51015!01510}51015!015!0!510!51015!0!51Oi510151015101510!5101
re. im. Ire.11i1
.05 .101-.0!
1.1 .1011.21
.05 0 1.151
2.6 0 13,31
1.9 0 J2.01
9.6 .10J9.71
4.0 .1014.41
-.5 -.11-. 4
1.50 0 11.7
113. -1.111.
119. -3.114.
17.6 -2. 17.0
13.3 -1. 11.4
J.10 -.7j2.8
1-1. -.71-1.
1-1. -1.1-1.
1-1. -1.1-1.
I-2. -2.1-2.
1-1. -1.1-2.
1111
WAD1 BIDAH i_!N£> 400N
i
2221im. I re.
i
1tf
- . 1 1 . 361
0 j.351
0 1-.41
.1013.91
0 11.31
-.315.71
.1012.91
.201-. 01
-.81-.!
1-3. 18.3
1-4. 111.
1-2. 15.6
1-.31.80
10 S-.O
1-.51-2.
1.601-1.
i-1. 1-2.
f-1. 1-2.
1-1.1-3.
1111
444!im. 1 re.
1',i
}- . 7 f - . 4
!-1. l-.l
j0 1.15
11.8S ,68
1-.711.0
1-2. 15.0
1-.711.7
1-.41.05
1-.31-. 4
1-.318.1
10 110.
10 15.1
Z.311.70
1.301.10
I-.61-2.
1-1. 1-1.
J-2. 1-2.
1-2. 1-3.
1-1. 1-3.
i1I1
UNITS> METERS
SP ITOPO IMAG
8881 17771mv.im. I re.
1»t
1-.4!-. 5
}-.11-, 4
1.151.05
1.68J.17
11.01.59
15.014.4
11 . 7 ! - . 0
!. 05 ', - . 5
1-.41-1.
18.117.2
110. 18.o
15.114.9
1.701.49
[.101.50
I-2. 1-2.
f-1. 1-3.
J-2. 1-5.
1-3. 1-5.
1-3. 1-4.
1«
J1
im. 1
11i
J-1. 1
1.401
!2.9!
1-.71
1
-7-13-18-22-19-23-11-16-18-8-22-12
-1. 1-39
1-1. i
1-3. 1
i-2, 1
i-2.1
i-1. 1
1.23!
11.9!
i1,8!
!2.0!
!-3. 1
1-6. 1
t-121
1-111
1-7. 1
J111
-27-33-21-30-34-29-28-36-30-29-26-26-29-24-18-11-31-33-34-27-32-26-27-34-19-7-11-41-3-23
13-8
I111007111006i*
11005111008111007111002i1100611996.11990.fJ991.1S994.111006111021
110311110371110411110431',1044
1J10451110451110451
InT111
.21!!
.43!1
.59!L
.8 {i
.2111
.58!1
678!1
259 {1
045!1
6031>
.85!1
.64!!
.5311
.54!1
.09!1
.06!!
.24!!
.0311
.42!!
.81!
11046.2 1111046
1.6 !
44