phase changes - · pdf filephase changes red arrows – endothermic processes (require...
TRANSCRIPT

1
CHE 131
Phases and Phase Diagrams
Chapter 11: pp. 488-492.pp. 494-507.
Prof. S. Wong
Phase ChangesRed arrows – endothermic processes (require heat)
Blue arrows – exothermicprocesses (require cooling)

2
Solids- ordered- tightly packed- Epot > Ekin
Liquids- disordered- tightly packed- Epot > Ekin
Gases- disordered- separated- Epot < Ekin
Water
Boiling Liquids
Temperature at which the equilibriumvapor pressure equalsthe atmospheric pressure is designated as the boiling pointof the liquid.
At 1 atm, normal boiling point.

3
Properties of Liquids
boiling point
• the temperature at which the vapor pressure of a liquid equals the applied pressure
normal boiling point• the temperature at which the vapor
pressure of the liquid is equal to one atmospheric pressure
Properties of Liquids
liquid-vapor equilibrium• both liquid and vapor of the liquid present
in the same container user stable conditions
vapor pressure • The pressure exerted by a vapor in
equilibrium with its solid or liquid phase.
4
Properties of Liquids
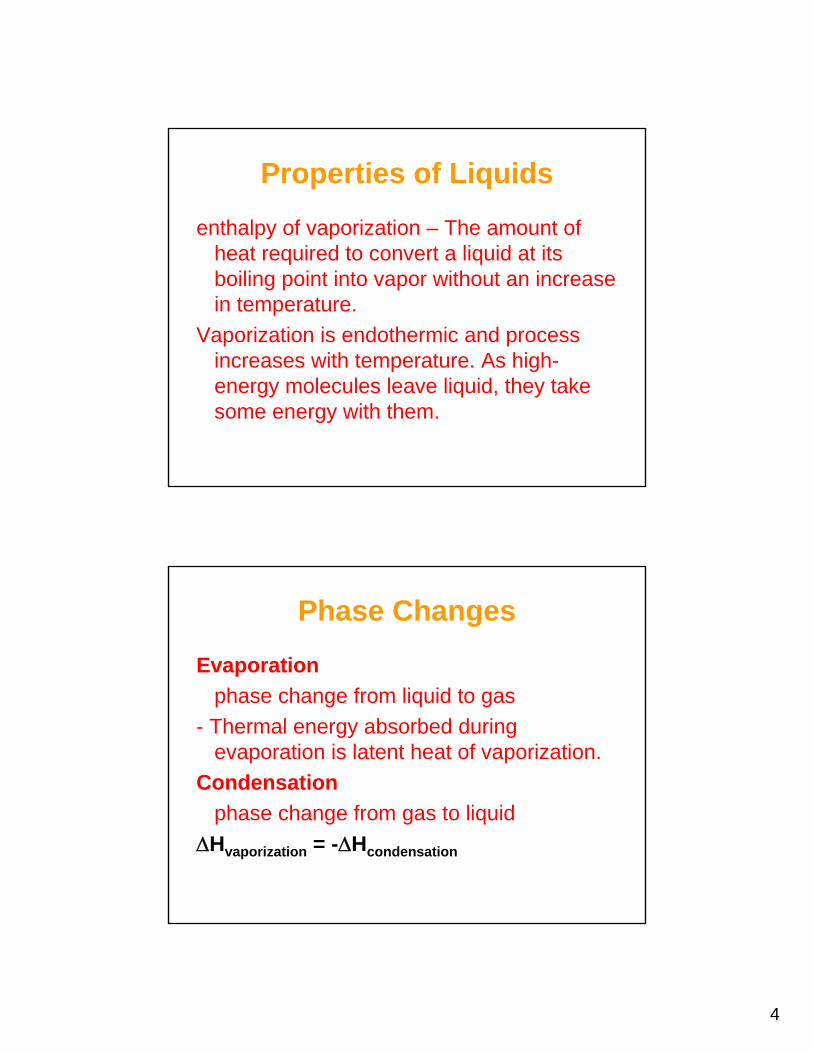
enthalpy of vaporization – The amount of heat required to convert a liquid at its boiling point into vapor without an increase in temperature.
Vaporization is endothermic and process increases with temperature. As high-energy molecules leave liquid, they take some energy with them.
Phase Changes
Evaporationphase change from liquid to gas
- Thermal energy absorbed during evaporation is latent heat of vaporization.
Condensationphase change from gas to liquid
ΔHvaporization = -ΔHcondensation

5
Molar Enthalpies of Vaporization
Phase Changes
Meltingphase change from solid to liquid
Freezingphase change from liquid to solid
melting point (freezing point)temperature at which a liquid converts into the solid state

6
Phase ChangesMelting and Freezing
enthalpy of fusion – heat absorbed by the substance in changing solid into a liquid without raising its temperature.
Freezing is always an exothermic process.Melting points and heats of fusion increase with
increasing number of electrons (and molar mass) as London forces become stronger. Ionic compounds have highest melting points.
Molar Enthalpies of Fusion

7
Fig. 11-10, p.497
Melting of Naphthalene
Table 11-3, p.498
8
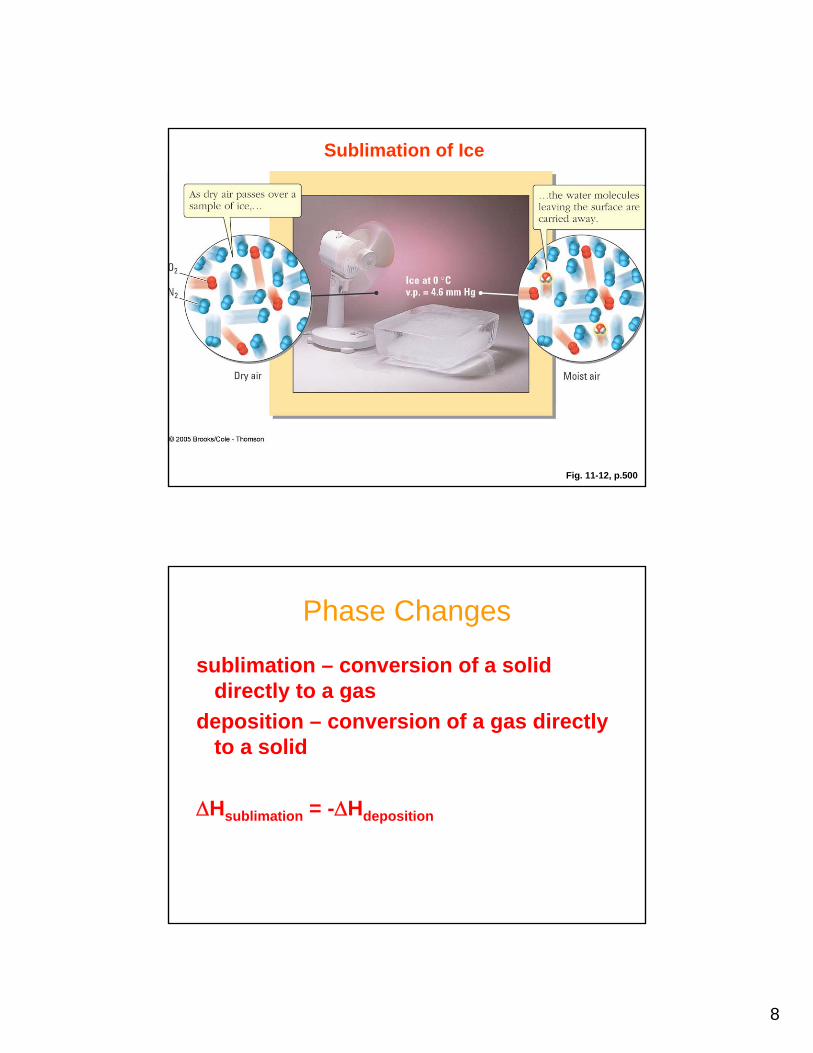
Fig. 11-12, p.500
Sublimation of Ice
Phase Changes
sublimation – conversion of a solid directly to a gas
deposition – conversion of a gas directly to a solid
ΔHsublimation = -ΔHdeposition
9
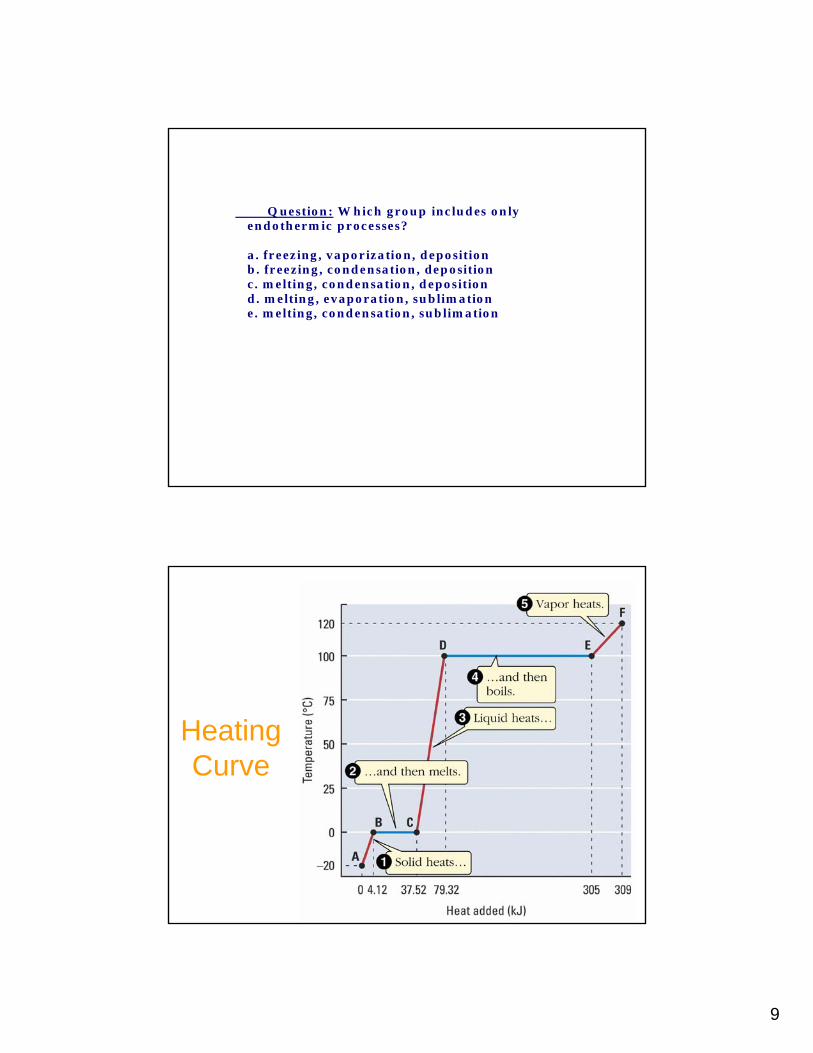
Q uestio n : W h ich g ro u p inc lu d es o n lyen d o th erm ic p rocesses?
a . freez ing , va po r iza tio n , d epo sitio nb . freezin g , co n d en sa tio n , dep o sitio nc . m e ltin g , co n d en sa tio n , d epo sitio nd . m e ltin g , eva po ra tio n , su b lim a tio ne . m e ltin g , co n d en sa tio n , su b lim a tio n
Heating Curve
10
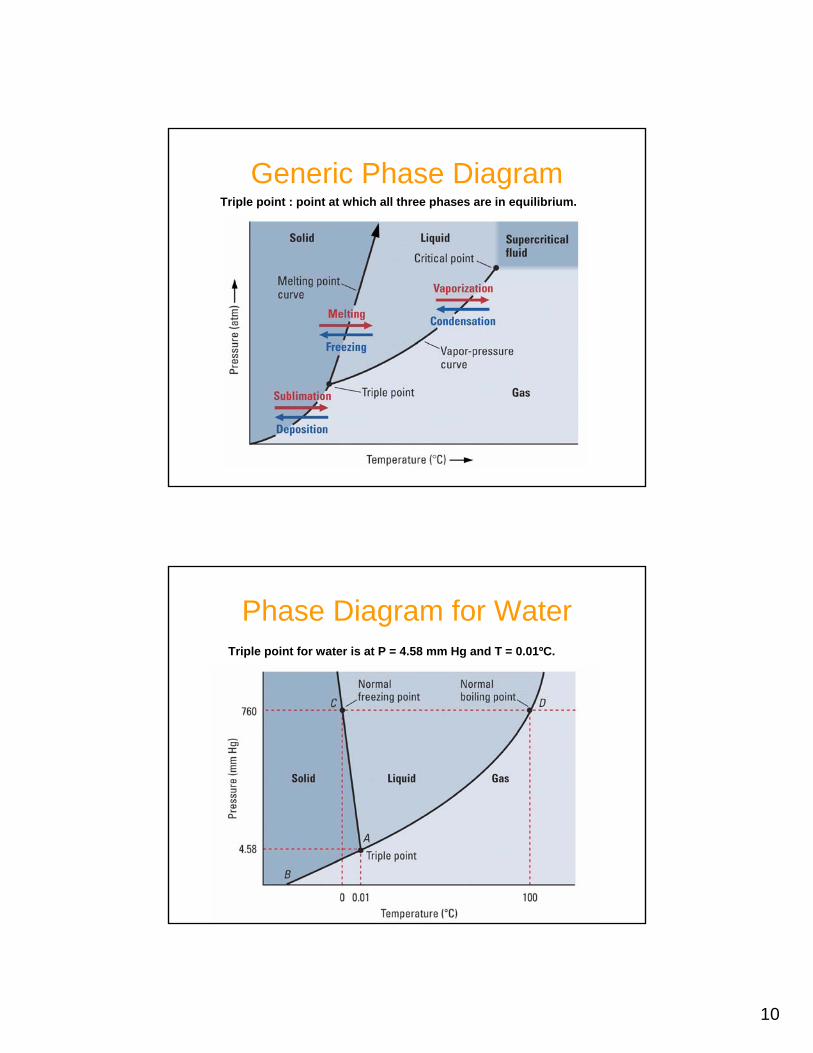
Generic Phase DiagramTriple point : point at which all three phases are in equilibrium.
Phase Diagram for WaterTriple point for water is at P = 4.58 mm Hg and T = 0.01ºC.

11
Unusual Properties of Water
p.506
12
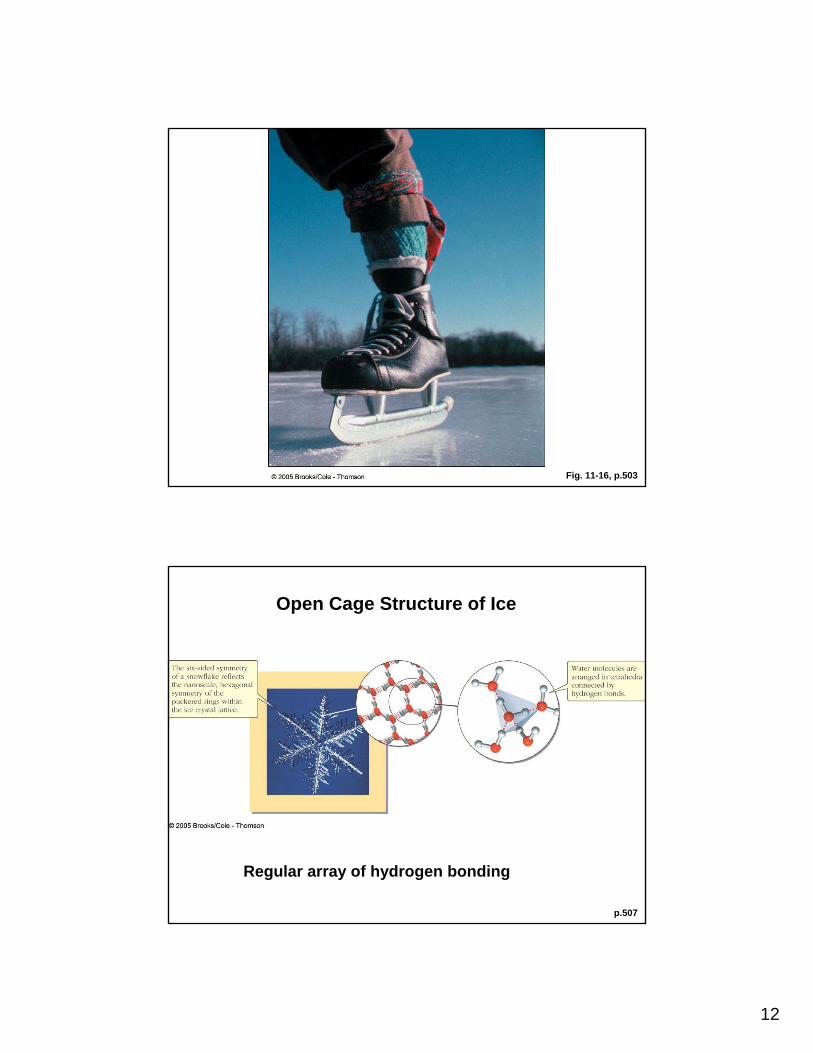
Fig. 11-16, p.503
p.507
Open Cage Structure of Ice
Regular array of hydrogen bonding
13
•9 forms of ice are known, each with a different structure.•None is stable below 2000 atm. Ice III is illustrated.
D
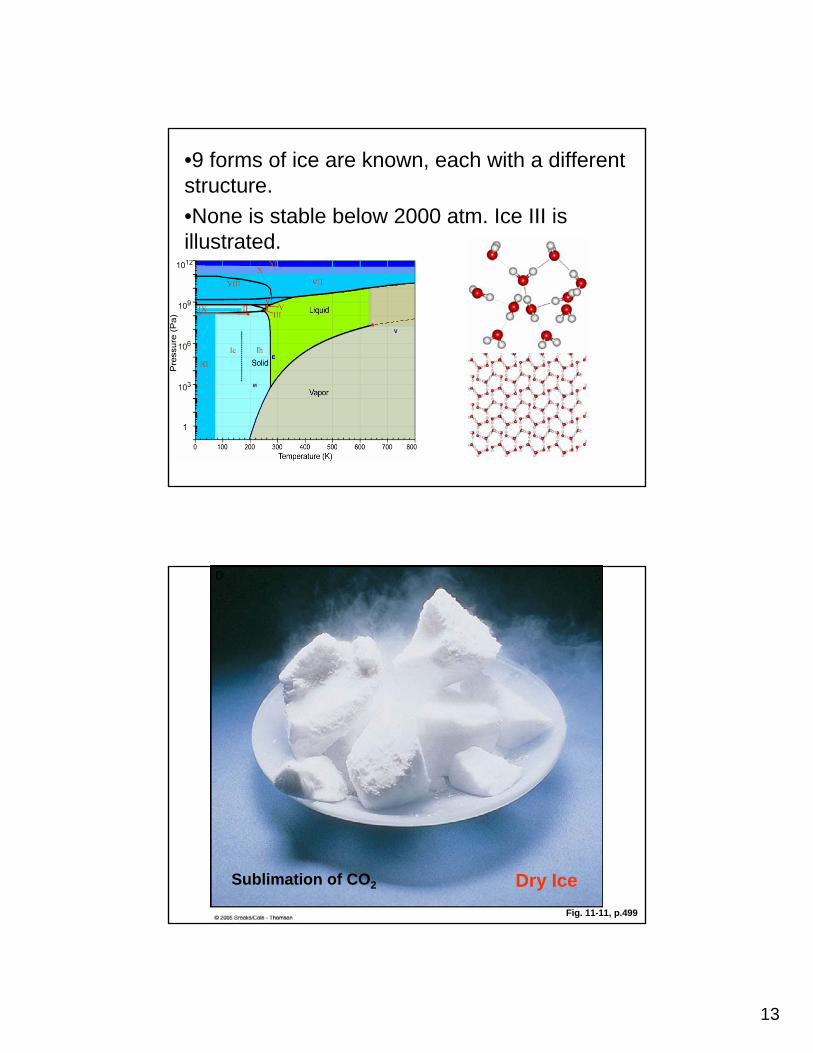
Fig. 11-11, p.499
Dry IceSublimation of CO2

14
Phase Diagram for Carbon Dioxide
Critical Point
critical temperature - the temperature above which there is no distinction between the gas and liquid states
critical pressure - the pressure above which there is no distinction between the gas and liquid states

15
Where is:
a. critical point.b. triple point.c. absolute freezing point.d. normal freezing point.e. normal boiling point.