phase i report residential new construction (single family · pdf filernc market effects...
TRANSCRIPT
Phase I Report Residential New Construction (Single Family Home)
Market Effects Study FINAL
Study ID: CPU0030.08
Prepared by
KEMA (formerly RLW Analytics) Nexus Market Research, Inc.
Summit Blue Consulting Itron, Inc.
The Cadmus Group, Inc.
For the California Public Utilities Commission
Energy Division
May 21, 2009

RNC Market Effects Study: Phase I Draft Report
Abstract
This report presents the results of Phase I of the market effects evaluation of the 2006-2008 Residential New Construction (Single Family Home) programs. The report was commissioned as a result of a CPUC decision to explore the ability to credibly quantify and credit “non-participant spillover” market effects in three areas, including residential new construction (RNC) programs. (The other two areas were CFLs, and high-bay lighting). The study has three primary objectives: (1) Understand the market effects of California’s utility energy efficiency programs on construction practices for new single-family homes; (2) quantify the energy savings caused by the above market effects occurring in the years 2006-2008, with special attention to non-participant spillover; and (3) support the CPUC’s strategic planning efforts by clarifying whether energy savings from non-participant spillover can be quantified with sufficient reliability to be treated as a resource. Phase I of the study was designed to assess the historical context of RNC design and construction practices in California; to determine—qualitatively—the extent to which market effects attributable to the 2006-2008 IOU programs have occurred; and to analyze the cumulative impact of the 1998-2005 IOU programs on the 2005 code change.
There are five key findings from this study: (1) There is discernible evidence of non-participant spillover from the 2006-2008 IOU RNC programs, primarily from training of builders and other market actors, which helped bring about improved code compliance, increased above-code practices, and market readiness for a code upgrade. (2) Demand-side effects, such as increasing home buyer awareness and increasing consumer demand/willingness to pay for efficient homes, largely did not occur, owing at least in part to low volume of IOU program participation. (3) The IOU programs' primary focus on the supply side reflects an orientation toward resource acquisition, although some program elements are intended to address market transformation. While this study makes it clear that there are some market effects resulting from the IOU programs, the program elements stimulating them are not systematically aimed at transforming the market. (4) This study focused on the 2006-2008 IOU programs, and there had been no market effects research since 2000, allowing little opportunity to provide feedback to program planners. (5) Phase I has provided qualitative evidence of increases in the efficiency of the RNC market—beyond the direct effects of the IOUs’ 2006-2008 programs—that may reasonably be attributed to those programs.
RNC Market Effects Study: Phase I Draft Report
Contents
Acknowledgements ........................................................................................................................ i
List of Acronyms........................................................................................................................... ii
E. Executive Summary ...............................................................................................................v E.1. Research Activities and Data Sources .......................................................................... vii E.2. Key Findings and Recommendations ..............................................................................x E.3. Findings.......................................................................................................................... xi
E.3.1 Program Participation and New Construction Activity ............................................. xi E.3.2 Efficiency in the Residential New Construction Market .......................................... xii E.3.3 Outcomes and Linkages to the IOU Programs ........................................................ xiii E.3.4 Improved Code Compliance .................................................................................... xvi E.3.5 Increased Above-Code Practices ........................................................................... xviii E.3.6 Market Readiness for a Code Upgrade .................................................................... xix E.3.7 Demand-Side Effects .................................................................................................xx E.3.8 Supply-Side Effects ................................................................................................ xxii E.3.9 Alternative Explanations for Observed Market Changes ...................................... xxiii
E.4. Recommendations...................................................................................................... xxiv
1. Introduction............................................................................................................................1 1.1. Study Phases ....................................................................................................................2 1.2. Organization of the Report...............................................................................................5
2. The IOUs’ Residential New Construction Programs in the Context of the California Market ..................................................................................................................6
2.1. Market Theory and Logic ................................................................................................6 2.1.1. Requirements ...............................................................................................................6 2.1.2. Voluntary Criteria ........................................................................................................9 2.1.3. Branding.....................................................................................................................12 2.1.4. Incentives ...................................................................................................................13 2.1.5. Design ........................................................................................................................13 2.1.6. Materials and Equipment ...........................................................................................15 2.1.7. Construction...............................................................................................................15 2.1.8. Enforcement ...............................................................................................................16 2.1.9. Ratings and Inspections .............................................................................................17 2.1.10. Transaction.................................................................................................................17 2.1.11. Purchase .....................................................................................................................17 2.1.12. Outside Forces ...........................................................................................................18
2.2. Program Theory and Logic ............................................................................................18 2.3. Indicators of Expected Outcomes and Links to the IOU Programs...............................24 2.4. Alternative Explanations for Market Changes...............................................................30
3. Historical Trends .................................................................................................................31 3.1. Historical Trends in RNC Efficiency Practices in California........................................31
3.1.1. Overview....................................................................................................................32
RNC Market Effects Study: Phase I Draft Report
3.1.2. Newly Built Single-Family Homes over Time ..........................................................32 3.1.3. On-Site Sample Frames .............................................................................................34 3.1.4. Reference Basis for Evaluating Energy Efficiency Building Characteristics
and Practices ..............................................................................................................38 3.1.5. Changing Building Practices in the Residential Sector .............................................43
3.2. Historical Trends in Incremental Costs of Efficiency Measures ...................................72
4. Analysis of Expected Outcomes..........................................................................................74 4.1. Introduction....................................................................................................................74 4.2. Homes Built through Other Voluntary Efficiency Programs ........................................78 4.3. Costs of Increased Efficiency ........................................................................................80 4.4. Modeling of Efficiency ..................................................................................................82 4.5. Adoption of New Technologies and Practices...............................................................84 4.6. Builder Knowledge ........................................................................................................85 4.7. Verification of Above-Code Practices ...........................................................................87 4.8. Builder Marketing..........................................................................................................88 4.9. Home Buyer Awareness ................................................................................................90 4.10. Home Buyer Demand and Willingness to Pay ..............................................................92 4.11. Code Compliance...........................................................................................................94 4.12. Above-Code Practices....................................................................................................96 4.13. Code Upgrades.............................................................................................................101 4.14. Energy Use, Demand, and Emissions ..........................................................................105
5. Analysis of Market Effects Related to Code Changes ....................................................106 5.1. Direct Impact of Past RNC Programs on Natural Market Adoption ...........................107 5.2. Indirect Market Effects ................................................................................................110 5.3. Influence of Past IOU RNC Programs on Code Adoption ..........................................110
5.3.1. Effects of Prior Programs.........................................................................................111 5.3.2. Methodology ............................................................................................................112 5.3.3. Status and Next Steps...............................................................................................113
6. The Importance of Networks ............................................................................................114 6.1. Builders ........................................................................................................................114 6.2. HVAC Contractors.......................................................................................................117 6.3. Title 24 Consultants .....................................................................................................118 6.4. HERS Raters ................................................................................................................119 6.5. Home Buyers ...............................................................................................................120
7. Conclusions.........................................................................................................................122 7.1. Summary of Findings for Individual Outcomes and Links .........................................122 7.2. Attributing Market Changes to the IOU Programs ......................................................136 7.3. Alternative Explanations for Observed Market Changes ............................................138 7.4. Recommendations........................................................................................................139
8. Glossary ..........................................................................................................................142
9. References ..........................................................................................................................145
RNC Market Effects Study: Phase I Draft Report
Appendix A Questionnaires and Interview Guides...........................................................A1 A.1 Builder Interview Guide ...............................................................................................A1 A.2 Title 24 Consultants Interview Guide .........................................................................A31 A.3 HERS Rater Interview Guide......................................................................................A48 A.4 HVAC Contractor Interview Guide ............................................................................A61 A.5 HVAC Distributor Interview Guide............................................................................A86 A.6 Lighting Fixture and Control Distributor Interview Guide.......................................A100 A.7 Insulation Distributor Interview Guide.....................................................................A112 A.8 Window Distributor Interview Guide .......................................................................A127 A.9 Program Manager of Other Voluntary Efficiency Programs Interview Guide.........A139 A.10 Building Code Official Interview Guide...................................................................A143 A.11 New Home Buyer Questionnaire ..............................................................................A146
Appendix B Historic Trends in Awareness and Attitudes ...............................................B1 B.1 Builders .........................................................................................................................B1
B.1.1 Overview...................................................................................................................B1 B.1.2 Awareness of the IOUs’ RNC Programs and the Influence of Programs on
Energy-Efficient Building Practices .........................................................................B1 B.1.3 Influence of Title 24 Standards.................................................................................B5 B.1.4 Market actors influence on builder choice of energy efficiency levels ....................B5
B.2 Other Market Actors .....................................................................................................B6 B.2.1 Overview...................................................................................................................B6 B.2.2 Market Position and Influence on Decision Making ................................................B7 B.2.3 Awareness .................................................................................................................B8 B.2.4 Market Barriers .......................................................................................................B10 B.2.5 Attitudes and Perceptions .......................................................................................B11 B.2.6 Business Practices ...................................................................................................B13 B.2.7 Sources of Information ...........................................................................................B14
B.3 Home Buyers ..............................................................................................................B15 B.3.1 Overview.................................................................................................................B15 B.3.2 Awareness ...............................................................................................................B15 B.3.3 Attitudes ..................................................................................................................B20 B.3.4 Decision Making Process........................................................................................B22 B.3.5 Sources of Information for Home buyers ...............................................................B24 B.3.6 Summary .................................................................................................................B24
Appendix C Additional Analysis for Chapter 4.................................................................C1 C.1 Introduction...................................................................................................................C1 C.2 Homes Built through Other Voluntary Efficiency Programs .......................................C7 C.3 Costs of Increased Efficiency .....................................................................................C18 C.4 Modeling of Efficiency ...............................................................................................C31 C.5 Adoption of New Technologies and Practices............................................................C40 C.6 Builder Knowledge .....................................................................................................C42 C.7 Verification of Above-Code Practices ........................................................................C50 C.8 Builder Marketing.......................................................................................................C51 C.9 Home Buyer Awareness .............................................................................................C61
RNC Market Effects Study: Phase I Draft Report
C.10 Home Buyer Demand and Willingness to Pay ...........................................................C74 C.11 Code Compliance........................................................................................................C80 C.12 Above-Code Practices.................................................................................................C93 C.13 Code Upgrades..........................................................................................................C139
RNC Market Effects Study: Phase I Draft Report
Tables Table E-1: Summary of Residential New Construction Market Effects Study—Phase I.............. ix Table E-2: Key Findings and Recommendations ........................................................................... x Table 1.1-1: Summary of Residential New Construction Market Effects Study—Phase I ............ 3 Table 1.1-2: Summary of Residential New Construction Market Effects Study—Phase II........... 4 Table 2.3-1: Logic Model of Expected Outcomes, Links, Indicators, and Sources for
Measurement............................................................................................................ 25 Table 3.1-1: California Single-Family Home Construction and Participation in IOU RNC
Programs .................................................................................................................. 34 Table 3.1-2: Completed On-Site Surveys of Single Family Homes by Study Year.................... 37 Table 3.1-3: Prescriptive Package D Requirements by CEC Climate Zone................................ 41 Table 3.1-4: Prescriptive Package D Requirements by CEC Climate Zone Cont. ...................... 42 Table 3.1-5: Square Footage and Number of Stories of Single Family Homes .......................... 44 Table 3.1-6: Percent Glazing of Single Familly Homes .............................................................. 45 Table 3.1-7: Distribution of Window Types – Detached Single Family Homes......................... 45 Table 3.1-8: Default Window Thermal Performance Values ...................................................... 47 Table 3.1-9: Average Window U-Values in Single Family Homes ............................................ 47 Table 3.1-10: Central Gas Space Heating System Efficiency in Single Family Homes ............. 49 Table 3.1-11: Percentages of Gas Space Heating System Efficiency in Single Family
Homes ...................................................................................................................... 50 Table 3.1-12: Average SEER in Single Family Homes............................................................... 52 Table 3.1-13: Central Air Conditioner Efficiency in Single Family Homes ............................... 53 Table 3.1-14: Multiple HVAC Systems in Single Family Homes............................................... 55 Table 3.1-15: Thermostat Types in Single Family Homes .......................................................... 57 Table 3.1-16: Natural Gas Storage and Instantaneous Water Heaters in Single Family
Homes ...................................................................................................................... 58 Table 3.1-17: Multiple Water Heating Systems in Single Family Homes .................................. 60 Table 3.1-18: Gas-Storage Water Heater Efficiency in Single Family Homes ........................... 61 Table 3.1-19: Ceiling Insulation in Single Family Homes .......................................................... 62 Table 3.1-20: Wall Insulation in Single Family Homes .............................................................. 64 Table 3.1-21: Radiant Barriers in Single Family Homes............................................................. 65 Table 3.1-22: Average Percent Duct Leakage in Single Family Homes ..................................... 66 Table 3.1-23: Average Compliance Margins of Single Family Homes....................................... 68 Table 3.1-24: Compliance of Single Family Homes with Title 24 Standards ............................. 69 Table 3.2-1: Incremental Measure Costs ..................................................................................... 73 Table 4.1-1: Data Collection Efforts Contributing to Analysis of Expected Outcomes............... 76 Table 5.1-1: Estimated Market for Hardwired Luminaires ........................................................ 108 Table 5.1-2: Hardwired Luminaires Incented by Utility Programs ............................................ 108 Table 6.1-1: Primary Sources of Information on New Energy-efficient Technologies and
Building Practices .................................................................................................. 114 Table 6.1-2: Settings or Locales Where Non-participant Builders Have Discussed
Energy-efficient Building Practices and Technologies with Participant Builders.................................................................................................................. 115
Table 6.1-3: Influence of Other Offices in the Company or Participating Builders on Adoption of Above-Code Practices and Technologies in Non-Program Homes .................................................................................................................... 116
RNC Market Effects Study: Phase I Draft Report
Table 6.2-1: Primary Sources of Information on New Energy-efficient Technologies and Building Practices .................................................................................................. 117
Table 6.3-1: Discussing Energy-efficient Building Practices and Technologies with Other Title 24 Consultants ............................................................................................... 118
Table 6.4-1: Discussing Energy-efficient Building Practices and Technologies with Other HERS Raters .......................................................................................................... 119
Table 6.5-1: People Emphasizing Energy Efficiency to the Home Buyer by Climate Region.................................................................................................................... 120
Table 6.5-2: Someone Emphasized Energy Efficiency to the Home Buyer over Time ............. 121 Table 6.5-3: Persons from Whom Home Buyers Sought Information on IOU Programs
when Making Plans for Building or Buying Home ............................................... 121 Table 7.1-1: Summary of Attribution by Outcome and Linkage to IOU Programs ................... 123 Table B.1-1: Awareness and Practices Relating to Codes and Standards ....................................B3 Table B.2-1: Self Reported Awareness of Other Market Actors* ................................................B9 Table B.2-2: Market Actor Program Awareness Levels.............................................................B10 Table B.2-3: Market Actor Program Participation .....................................................................B13 Table B.3-1: Self Reported Consumer Awareness of Efficiency Standards ..............................B16 Table B.3-2: Self-Reported Consumer Awareness of Efficiency Levels ...................................B17 Table B.3-3: Consumer Awareness of Energy Efficiency Programs and Standards..................B18 Table B.3-4: Aided Awareness of Utility RNC Programs..........................................................B19 Table B.3-5: Awareness of Energy Efficiency Features.............................................................B20 Table B.3- 6: Home Buyer Awareness of Energy Efficiency Criteria .......................................B20 Table C.1-1: Awareness of and Participation in IOU Residential New Construction
Programs before 2006 and from 2006 to 2008 ........................................................C2 Table C.1-2: Distribution of Builders Interviewed, by Number of Non-Program Homes ...........C2 Table C.1-3: Awareness of and Participation in IOU Residential New Construction
Programs before 2006 and from 2006 to 2008 ........................................................C3 Table C.1-4: Distribution of HVAC Contractors Interviewed, by Number .................................C3 Table C.1-5: Awareness of and Participation in IOU Residential New Construction
Programs before 2006 and from 2006 to 2008 ........................................................C4 Table C.1-6: Distribution of Title 24 Consultants Interviewed, by Number ................................C4 Table C.1-7: Awareness of and Participation in IOU Residential New Construction
Programs before 2006 and from 2006 to 2008 ........................................................C5 Table C.1-8: Distribution of HERS Raters Interviewed, by Number of Non-Program
Homes ......................................................................................................................C6 Table C.2-1: Effect of IOU Programs on Efficiency Criteria Used in Other Programs ...............C8 Table C.2-2: Effect of IOU Programs on Participation in Other Programs..................................C9 Table C.2-3: Awareness of and Participation in RNC Programs Encouraging Energy
Efficiency...............................................................................................................C10 Table C.2- 4: Awareness of and Participation in RNC Programs Encouraging Energy
Efficiency...............................................................................................................C12 Table C.2- 5: Awareness of and Participation in RNC Programs Encouraging Energy
Efficiency...............................................................................................................C14 Table C.2- 6: Awareness of and Participation in RNC Programs Encouraging Energy
Efficiency...............................................................................................................C16 Table C.3-1: Incremental Cost to Exceed Title 24 by 10 Percent ..............................................C18
RNC Market Effects Study: Phase I Draft Report
Table C.3-2: Change in Incremental Cost over the Last Five Years for Efficiency Improvements that Exceed Title 24.......................................................................C19
Table C.3-3: Reasons for Changes in Incremental Cost over the Last Five Years for Efficiency Improvements that Exceed Title 24 .....................................................C20
Table C.3-4: Incremental Cost to Improve from 13 SEER, Three Ton Central Air Conditioner (CAC) to 16 SEER, Three Ton CAC.................................................C21
Table C.3-5: Incremental Cost to Improve from 80 AFUE, 80,000 BTU Gas Furnace to 95 AFUE Unit........................................................................................................C21
Table C.3-6: Factors Influencing Increase in HVAC Equipment Price Differences..................C22 Table C.3-7: Incremental Cost to Improve from 0.60 U-Factor Window to 0.35 U-Factor
Window..................................................................................................................C22 Table C.3-8: Incremental Cost to Improve from 0.65 SHGC Window to 0.40 SHGC
Window..................................................................................................................C23 Table C.3-9: Factors Influencing Decrease in Window Price Differences.................................C23 Table C.3-10: Factors Influencing Decrease in Price Difference of Windows with More
Efficient U-Factor and SHGC Ratings, 2006 to 2008 ...........................................C24 Table C.3-11: Incremental Cost to Improve from R-30 to R-38 of Most Commonly
Distributed Ceiling Insulation................................................................................C25 Table C.3-12: Factors Influencing Decrease in Price Difference, 2006 to 2008........................C26 Table C.3-13: Incremental Cost to Change from an Interior Screw-Based Fixture to a Pin-
Based CFL Fixture.................................................................................................C26 Table C.3-14: Incremental Cost to Change from an Exterior Screw-Based Fixture to a
Pin-Based CFL Fixture ..........................................................................................C27 Table C.3-15: Incremental Cost to Add an Occupancy Sensor to an Interior Screw-based
Fixture....................................................................................................................C27 Table C.3-16: Incremental Cost to Add Photocontrols and Motion Sensors to an Exterior
Screw-based Fixture ..............................................................................................C28 Table C.3-17: Factors Influencing Decrease in Lighting Fixtures and Controls Price
Difference ..............................................................................................................C29 Table C.3-18: Factors Influencing Decrease in Price Difference of the Cost to Change
from a Screw-based Fixture to a Pin-based CFL Fixture, 2006 to 2008 ...............C30 Table C.4-1: Percentage of Non-Program Homes Consulted on from 2006 to 2008 for
which Title 24 Consultant Recommended Using Above-Code Practices and Technologies..........................................................................................................C32
Table C.4-2: Influence of IOU Programs on Recommendations of Above-Code Practices and Technologies in Non-Program Homes............................................................C33
Table C.4-3: Ways Program Influenced Recommendations of Above-Code Measures in Non-Program Homes .............................................................................................C34
Table C.4-4: Outside Conditions that Would Influence Consultants' Recommendation of Above-Code Practices and Measures ....................................................................C35
Table C.4-5: Reasons for Not Recommending Above-Code Building Practices and Technologies in Non-Program Homes ..................................................................C35
Table C.4-6: Amount of Help that “Program Plan Check” Feedback Provides in Modeling and Building above-code.......................................................................C36
Table C.4-7: Amount of Help that “Program Plan Check” Provides .........................................C37 Table C.4-8: Amount of Help that “Program Plan Check” Provides .........................................C37

RNC Market Effects Study: Phase I Draft Report
Table C.4-9: Attendance of IOU-Sponsored Trainings and Types of Energy-efficient Technologies or Practices Typically Recommended as a Result ..........................C38
Table C.4-10: Training Sessions Pertaining to Energy-Efficiency Sponsored by Other Organizations .........................................................................................................C39
Table C.5-1: Influence of IOU R&D and CASE Study Programs on Energy-Efficient Building Practices or Technologies .......................................................................C40
Table C.5-2: Influence of IOU R&D and CASE Study Programs on Recommendations of Energy-Efficient Building Practices or Technologies ...........................................C41
Table C.6-1: Awareness of Energy-efficient Equipment and Building Practices ......................C42 Table C.6-2: Primary Sources of Information on New Energy-efficient Technologies and
Building Practices ..................................................................................................C43 Table C.6-3: Awareness of Energy-efficient Equipment and Building Practices ......................C44 Table C.6-4: Primary Sources of Information on New Energy-efficient Technologies and
Building Practices ..................................................................................................C45 Table C.6-5: Attendance of IOU-Sponsored Trainings and Types of Energy-efficient
Technologies or Practices Typically Used as a Result ..........................................C46 Table C.6-6: Types of Subcontractors Who Have Changed Their Building or Installation
Practices as a Result of Working on Program Homes ...........................................C47 Table C.6-7: Features of the Program that Were the Main Reasons the Subcontractors
Changed Their Building or Installation Practices..................................................C47 Table C.6-8: Attendance of Trainings and Types of Energy-efficient Technologies or
Practices Typically Used as a Result .....................................................................C48 Table C.6-9: Training Sessions Pertaining to Energy-Efficiency...............................................C49 Table C.8-1: Marketing Energy Efficiency and Energy-Efficient Features to Buyers of
New Homes............................................................................................................C51 Table C.8-2: Marketing Energy Efficiency of Non-Program Homes.........................................C52 Table C.8-3: Differences in Advertising or Marketing of Program Homes and Non-
Program Homes .....................................................................................................C52 Table C.8-4: Amount of Demand from Home Buyers for Energy-Saving Features ..................C53 Table C.8-5: Change in Home Buyer Demand for Energy-Saving Features over the Last
Five Years ..............................................................................................................C54 Table C.8-6: Why Home Buyer Demand for Energy-Saving Features Has Increased over
the Last Five Years ................................................................................................C55 Table C.8-7: Factors in Increase in Home Buyer Demand for Energy-Saving Features
over the Last Five Years ........................................................................................C56 Table C.8-8: Home Buyers Inquiries about Homes that Are More Energy-efficient than
State Building Code ...............................................................................................C57 Table C.8-9: Amount Home Buyers Associate Energy Saving Features with Home
Quality and Comfort ..............................................................................................C58 Table C.8-10: Increase in Cost to Build a Home that Exceeds Title 24 by 10% w/o
Incentives and Amount Typical Buyer Willing to Pay..........................................C59 Table C.8-11: Willingness of Home Buyers to Pay for Additional Costs Associated with
Energy-Efficient Measures that Exceed Title 24...................................................C60 Table C.9-1: Comparative Efficiency of New Homes in Area by Climate Region....................C61 Table C.9-2: Comparative Efficiency of New Homes in Area by IOU......................................C61 Table C.9-3: Perceived Efficiency of New Homes in Area by Climate Region.........................C62

RNC Market Effects Study: Phase I Draft Report
Table C.9-4: Perceived Efficiency of New Homes in Area by Utility .......................................C62 Table C.9-5: Perceived Energy Efficiency Respondent’s New Home by Climate Region ........C63 Table C.9-6: Perceived Energy Efficiency Respondent’s New Home by IOU ..........................C63 Table C.9-7: What Would Make a Home More Energy-efficient ..............................................C64 Table C.9-8: People Emphasizing Energy Efficiency to the Home Buyer by Climate
Region....................................................................................................................C65 Table C.9-9: People Emphasizing Energy Efficiency to the Home Buyer by IOU....................C66 Table C.9-10: Someone Emphasized Energy Efficiency to the Home Buyer over Time...........C66 Table C.9-11: Awareness of IOU Programs by Climate Region................................................C67 Table C.9-12: Awareness of IOU Programs by IOU..................................................................C67 Table C.9-13: Unaided and Aided Awareness of IOU Programs...............................................C68 Table C.9-14: Unaided and Aided Awareness of IOU Programs over Time .............................C69 Table C.9-15: Mentions of IOU Programs to Home Buyers when Making Plans for
Buying or Building Home .....................................................................................C70 Table C.9-16: Mentions of IOU Programs to Home Buyers when Making Plans for
Buying or Building Home by IOU ........................................................................C70 Table C.9-17: Person(s) Mentioning IOU Programs to Home Buyers when Making Plans
for Buying or Building Home by IOU...................................................................C71 Table C.9-18: Information Mentioned about Homes Built through IOU Programs by
Utility .....................................................................................................................C72 Table C.9-19: Home Buyers’ Familiarity w/ IOU Programs Prior to Viewing or Seeing
Plans for New Home..............................................................................................C73 Table C.9-20: Home Buyers’ Familiarity w/ IOU Programs Prior to Viewing or Seeing
Plans for New Home..............................................................................................C73 Table C.10-1: Home Buyers Seeking Information on IOU Programs when Making Plans
for Building or Buying Home................................................................................C74 Table C.10-2: Home Buyers Seeking Information on IOU Programs when Making Plans
for Building or Buying Home by IOU...................................................................C74 Table C.10-3: Persons from Whom Home Buyers Sought Information on IOU Programs
When Making Plans for Building or Buying Home ..............................................C75 Table C.10-4: Importance of Energy Efficiency in Home Selection by Climate Region...........C75 Table C.10-5: Importance of Energy Efficiency in Home Selection by IOU.............................C76 Table C.10-6: Importance of Energy Efficiency in Home Selection over Time ........................C76 Table C.10-7: Home Buyers’ Attitudes toward Energy-Efficient Features in New Homes.......C77 Table C.10-8: Importance of IOU Program Sponsorship in Decision to Build or Purchase
Home by IOU.........................................................................................................C78 Table C.10-9: Importance of IOU Program Sponsorship in Decision to Build or Purchase
Home by Climate Region ......................................................................................C79 Table C.10-10: Home Buyers Seeking Information on IOU Programs when Making Plans
for Building or Buying Home by IOU...................................................................C79 Table C.11-1: Change in Rates of Compliance with Title 24 from 2006 to 2008......................C80 Table C.11-2: Reasons for Increased Rates of Compliance with Title 24 from 2006
to2008 ....................................................................................................................C81 Table C.11-3: Change in Rates of Compliance with Title 24 from 2006 to 2008......................C82 Table C.11-4: Reasons for Increased Rates of Compliance with Title 24 from 2006 to
2008 .......................................................................................................................C82
RNC Market Effects Study: Phase I Draft Report
Table C.11-5: IOU and Other Training Programs Have Helped to Improve Code Compliance ............................................................................................................C83
Table C.11-6: IOU and Other Training Programs Have Helped Improve Code Compliance ............................................................................................................C83
Table C.11-7: IOU and Other Training Programs Have Helped to Improve Code Compliance ............................................................................................................C84
Table C.11-8: IOU and Other Training Programs Have Helped to Improve Code Compliance ............................................................................................................C84
Table C.11-9: IOU and Other Training Programs Have Helped to Improve Code Compliance ............................................................................................................C85
Table C.11-10: Quality Insulation Installation (QII) for Non-Program Homes, 2006 to 2008 .......................................................................................................................C86
Table C.11-11: Reasons for Rating Influence of IOU RNC Programs on Use of QII in Non-Program Homes .............................................................................................C87
Table C.11-12: Decision Maker for Time Dependent Valuation (TDV) Requirements ............C88 Table C.11-13: Most Common Way TDV Requirements are Met.............................................C89 Table C.11-14: Awareness of and Decision Maker for Time Dependent Valuation (TDV)
Requirements .........................................................................................................C90 Table C.11-15: Methods Commonly Used to Typically Comply with Title 24 .........................C90 Table C.11-16: Methods Commonly Used with Builders to Comply with Title 24...................C91 Table C.11-17: Ways Consultants Work With Builders on Title 24 Compliance......................C91 Table C.11-18: Frequency with Which Consultants Know Whether Builders Have
Followed Advice on Compliance with Title 24.....................................................C92 Table C.11-19: Frequency with Which HERS Raters Know About the Energy Efficiency
Technologies and Practices Used by Builders.......................................................C92 Table C.12-1: Efficiency Levels of Selected Building Measures, 1995 to 2005 Standards.......C93 Table C.12-2: Percentage of Non-Program Homes Using Above-Code Practices and
Technologies, 2006 to 2008...................................................................................C95 Table C.12-3: Percentage of Non-Program Homes Used Above-Code Practices and
Technologies, 2006 to 2008...................................................................................C96 Table C.12-4: Percentage of Non-Program Homes Used Above-Code Practices and
Technologies, 2006 to 2008...................................................................................C97 Table C.12-5: Percentage of Non-Program Homes Consulted on from 2006 to 2008 for
which Builder Actually Used Above-Code Practices and Technologies ..............C98 Table C.12-6: Percentage of Non-Program Homes Rated by HERS Rater that Used
Above-Code Practices and Technologies, 2006 to 2008 .......................................C99 Table C.12-7: Reasons Whether or Not a Particular Non-Program Home Would Be
Designed to Exceed Title 24................................................................................C100 Table C.12-8: Influence of Title 24 Consultants on Design and Construction of Home to
Exceed Title 24 ....................................................................................................C101 Table C.12-9: HVAC Contractors Work with Builders Who Specify Above-Code HVAC
Equipment or Installation Practices .....................................................................C101 Table C.12-10: Why HVAC Contractor Uses Above-Code Measures in Non-Program
Homes ..................................................................................................................C102 Table C.12-11: Efficiency levels of Selected Building Measures ............................................C104

RNC Market Effects Study: Phase I Draft Report
Table C.12-12: SEER-Ratings of Central Air Conditioning Systems Installed in New Homes ..................................................................................................................C105
Table C.12-13: AFUE Ratings of Furnaces Installed in New Homes ......................................C106 Table C.12-14: Efficiency Levels of HVAC Equipment Sold in the Single Family New
Construction Market ............................................................................................C107 Table C.12-15: Percentage of Homes HVAC Contractors Installed Above-Code Duct
Insulation .............................................................................................................C107 Table C.12-16: Percentage of Homes HVAC Contractors Conducted Duct Tests...................C107 Table C.12-17: U-Factors of Windows Sold in the Single Family New Construction
Market..................................................................................................................C108 Table C.12-18: SHGC Ratings of Windows Sold in the Single Family New Construction
Market..................................................................................................................C108 Table C.12-19: Windows Exceeding Title 24 Requirements for U-Factor and SHGC
Ratings in the Single Family New Construction Market.....................................C108 Table C.12-20: R-Values of Insulation Sold in the Single Family New Construction
Market..................................................................................................................C109 Table C.12-21: Insulation Exceeding Minimum U-value of Title 24 in the Single Family
New Construction Market ...................................................................................C109 Table C.12-22: Factors Influencing Shifts in the Percent of Insulation Used Better than
Minimum U-Value of Title 24.............................................................................C110 Table C.12-23: Insulation Properly Installed in the Single Family New Construction
Market..................................................................................................................C110 Table C.12-24: Factors Influencing Shifts in the Percent of Insulation Properly Installed......C111 Table C.12-25: Factors Influencing Increase in Market Share of Insulation Exceeding
Title 24 and Increase in Market Share of Insulation Meeting QII Standards, 2006 to 2008 ........................................................................................................C111
Table C.12-26: Types of Interior Lighting Sold in the Single Family New Construction Market..................................................................................................................C112
Table C.12-27: Factors Influencing Shifts in the Types of Interior Lighting Sold...................C112 Table C.12-28: Types of Exterior Lighting Sold in the Single Family New Construction
Market..................................................................................................................C113 Table C.12-29: Factors Influencing Shifts in the Types of Exterior Lighting Sold .................C113 Table C.12-30: Factors Influencing Increase in Market Share of Pin Based CFL Fixtures,
2006 to 2008 ........................................................................................................C114 Table C.12-31: Lighting Fixtures with Sensor Controls Sold in the Single Family New
Construction Market ............................................................................................C114 Table C.12-32: Factors Influencing Increase in Percentage of Lighting Fixtures with
Sensor Controls Sold ...........................................................................................C115 Table C.12-33: Change in Number of Non-Program Homes Consulted on or Rated from
2006 to 2008 Exceeding Title 24.........................................................................C116 Table C.12-34: Change in Number of Non-Program Homes Consulted on from 2006 to
2008 Exceeding Title 24 .....................................................................................C117 Table C.12- 35: Reasons for Increase in Number of Non-Program Homes Consulted on
from 2006 to 2008 Exceeding Title 24 ................................................................C117 Table C.12-36: Change in Number of Non-Program Homes Consulted on from 2006 to
2008 Exceeding Title 24 ......................................................................................C118
RNC Market Effects Study: Phase I Draft Report
Table C.12-37: Reasons for Changes in Number of Non-Program Homes Consulted on from 2006 to 2008 Exceeding Title 24 ................................................................C119
Table C.12-38: Recommending Above-Code Practices and Non-Program Homes that Exceeded Title 24 , ..............................................................................................C120
Table C.12-39: Percentage of Non-Program Homes Consulted that Exceeded Title 24..........C120 Table C.12-40: Influence of the IOU RNC Program on the Adoption of or
Recommendation of Above-Code Practices and Technologies, 2006 to 2008....C121 Table C.12-41: Influence of IOU Programs on Adoption of Above-Code Practices and
Technologies in Non-Program Homes ................................................................C122 Table C.12-42: Influence of IOU Programs on Adoption of Above-Code Practices and
Technologies in Non-Program Homes ................................................................C122 Table C.12-43: Influence of IOU Programs on Use of Above-Code Practices and
Technologies in Non-Program Homes ................................................................C123 Table C.12-44: Ways Program Influenced Use of Above-Code Measures in Non-Program
Homes ..................................................................................................................C124 Table C.12-45: Ways Program Influenced the Use of Above-Code Measures in Non-
Program Homes ...................................................................................................C124 Table C.12-46: Influence of Other Offices in the Company or Participating Builders on
Adoption of Above-Code Practices and Technologies in Non-Program Homes ..................................................................................................................C125
Table C.12-47: Intention to Continue Using or Recommending Above-Code Practices and Technologies in Absence of Programs..........................................................C127
Table C.12-48: Intention to Continue Above-Code Practices and Technologies in Absence of Programs ...........................................................................................C128
Table C.12-49: Why Builders Intend to Continue to Use of Above-Code Measures in Non-Program Homes without the Program .........................................................C129
Table C.12-50: Likelihood of Continuing to Recommend Above-Code Practices and Technologies in Absence of Programs ................................................................C130
Table C.12-51: Likelihood that Builder Would Continue Using Above-Code Practices and Technologies in Absence of Programs..........................................................C131
Table C.12-52: Influence of the IOU RNC Program on Building Non-program Homes to Program Standards and Intention to Continue Building Non-program Homes to Program Standards...........................................................................................C132
Table C.12-53: Building Non-program Homes to Program Standards.....................................C133 Table C.12-54: Installing HVAC Systems into Non-program Homes to Program
Standards..............................................................................................................C133 Table C.12-55: Consulting on Non-program Homes that Met Program Standards..................C134 Table C.12-56: Rating Non-program Homes that Met Program Standards..............................C134 Table C.12-57: HVAC Contractors Work with Builders Who Have Built Program Homes ...C135 Table C.12-58: Program Standards that Non-program Homes Met that Were Built to
Program Standards...............................................................................................C135 Table C.12-59: Influence of Various Factors on Choice of Energy Efficiency Levels in
Non-Program Homes ...........................................................................................C136 Table C.12-60: Influence of Various Factors on Choice of Energy Efficiency Levels in
Non-Program Homes ...........................................................................................C137
RNC Market Effects Study: Phase I Draft Report
Table C.12-61: Outside Conditions that Influence Builders’ Continued Use of Above-Code Practices and Measures ..............................................................................C137
Table C.13-1: Market Readiness for Code Upgrade.................................................................C139 Table C.13-2: Market Readiness for Code Upgrade.................................................................C140 Table C.13-3: Market Readiness for Code Upgrade.................................................................C141 Table C.13-4: Market Readiness for Code Upgrade.................................................................C142 Table C.13-5: Market Readiness for Code Upgrade.................................................................C143 Table C.13-6: IOU Program Contribution to Market Readiness for Code Upgrade ................C143 Table C.13-7: IOU Program Contribution to Market Readiness for Code Upgrade ................C143 Table C.13-8: IOU Program Contribution to Market Readiness for Code Upgrade ................C144 Table C.13-9: IOU Program Contribution to Market Readiness for Code Upgrade ................C144 Table C.13-10: IOU Program Contribution to Market Readiness for Code Upgrade ..............C144
Figures Figure E-1: Outcomes and Links to the IOU Programs............................................................... xvi Figure 2.1-1: The California Residential New Construction Market ............................................. 8 Figure 2.2-1: Utility-Run/CPUC-Approved RNC Programs and Associated Outcomes ............. 20 Figure 2.2-2: Utility Programs in Relation to the Residential New Construction Market ........... 22 Figure 3.1-1: Single Family Homes Built in California since 1998 ............................................ 33 Figure 3.1-2: CEC Climate Zones ............................................................................................... 35 Figure 3.1-3: CEC Climate Zones by Heating Degree Days and Cooling Degree Days............. 36 Figure 3.1-4: Percentage of Single-Family Homes with Double-Paned Vinyl, Low-E
Windows .................................................................................................................. 46 Figure 3.1-5: Average Window U-Values in Single Family Homes ........................................... 48 Figure 3.1-6: Average AFUE for Central Gas Space Heating in Single-Family Homes ............ 49 Figure 3.1-7: AFUE Distribution in Single Family Homes – Average Statewide....................... 51 Figure 3.1-8: Average SEER in Single Family Homes ............................................................... 52 Figure 3.1-9: SEER Distribution in Single Family Homes – Average Statewide ....................... 54 Figure 3.1-10: Multiple HVAC Systems in Single Family Homes – Statewide Average........... 56 Figure 3.1-11: Percentage of Digital Thermostats in Single Family Homes............................... 57 Figure 3.1-12: Percentage of Instantaneous Water Heaters (Gas and Electric) in Single
Family Homes.......................................................................................................... 59 Figure 3.1-13: Single Family Homes with More than One Water Heating Unit ......................... 60 Figure 3.1-14: Average Percentage above Standard in Single Family Homes............................ 61 Figure 3.1-15: Average Ceiling Insulation R-Value in Single Family Homes............................ 63 Figure 3.1-16: Percentage of Single Family Homes with Radiant Barriers ................................ 65 Figure 3.1-17: Average Compliance Margins of Single Family Homes by Region.................... 68 Figure 3.1-18: Distribution of Compliance of Single Family Homes – Statewide...................... 70 Figure 4.2-1: Linkages to Other Voluntary Efficiency Programs................................................. 78 Figure 4.3-1: Linkages to Decreased Incremental Costs .............................................................. 80 Figure 4.4-1: Linkages to More Efficient Design......................................................................... 82 Figure 4.5-1: Linkages to Adoption of New Technologies and Practices .................................... 84 Figure 4.6-1: Linkages to Increased Builder Knowledge ............................................................. 85 Figure 4.7-1: Linkages to Verification of Above-Code Practices ................................................ 87 Figure 4.8-1: Linkages to Increased Builder Marketing............................................................... 88 Figure 4.9-1: Linkages to Increased Home Buyer Awareness ..................................................... 90 Figure 4.10-1: Linkages to Increased Demand and Willingness to Pay ....................................... 92 Figure 4.11-1: Linkages to Improved Compliance ....................................................................... 94 Figure 4.12-1: Linkages to Increased Above-Code Practices....................................................... 96 Figure 4.13-1: Linkages to Market Readiness for Code Upgrade .............................................. 101 Figure 4.13-2: Linkages to Code Upgrades ................................................................................ 103 Figure 4.14-1: Linkages to Reduced Energy Use, Demand, and Emissions .............................. 105 Figure 7.2-1 Outcomes and Links to the IOU Programs ............................................................ 137 Figure B.2-1: Perceived Importance of Marketability of Features of New Homes - Title
24 Consultants........................................................................................................B12 Figure B.3- 1: Market Actor Perception of Consumer Demand.................................................B21 Figure B.3-2: Likelihood to Purchase/Rent Home without ENERGY STAR Rating ................B23
RNC Market Effects Study: Phase I Draft Report
i
Acknowledgements
The Residential New Construction Market Effects Team would like to thank a number of additional parties for their input and assistance in preparing the report, including Stephen Meyers, Ed Vine and Ralph Prahl of the California Institute for Energy and Environment, Ayat Osman of the California Public Utilities Commission, and Ken Keating of the Master Evaluation Contractor Team.

RNC Market Effects Study: Phase I Draft Report
ii
List of Acronyms
ACCA: Air Conditioning Contractors Association
AFUE: Annual Fuel Utilization Efficiency
AHP: Analytical Hierarchy Procedure
AMBAG: Association of Monterey Bay Area Governments
ASHRAE: American Society of Heating, Refrigeration and Air Conditioning Engineers
BIG: Build it Green
BPI: Building Performance Institute
BTU: British Thermal Unit
C&S: Codes and Standards
CABEC: California Association of Building Energy Consultants
CAC: Central Air Conditioner
CALHERS: California Association of HERS Raters
CASE: Codes and Standards Enhancement (CASE) Initiative Project
CATI: Computer-Assisted Telephone Interviewing
CBIA: California Building Industries Association
CBPCA: California Building Performance Contractors Association
CEC: California Energy Commission
CEE: Consortium for Energy Efficiency
CEQA: California Environmental Quality Act
CESNHP: California ENERGY STAR New Homes Program
CFL: Compact Fluorescent Lamp
CFM: Cubic Feet per Minute
CHEERS: California Home Energy Efficiency Rating Service
CIEE: California Institute for Energy and Environment
CIRB: Construction Industry Research Board
CPUC: California Public Utilities Commission
CZ: Climate Zone
RNC Market Effects Study: Phase I Draft Report
iii
DEER: Database for Energy Efficient Resources
DOE: Department of Energy
DSM: Demand Side Management
EEM: Energy Efficient Mortgage
EER: Energy Efficiency Ratio
EF: Energy Factor
EFL: Environments for Living
EM&V: Evaluation, Monitoring and Valuation
EPA: Environmental Protection Agency
HERS: Home Energy Rating System
HVAC: Heating, Ventilating, and Air Conditioning
IECC: International Energy Conservation Code
IHACI: Institute of Heating and Air Conditioning Industries
IMC: Incremental Measure Cost
IOU: Investor Owned Utility
LADWP: Los Angeles Department of Water and Power
LBNL: Lawrence Berkeley National Laboratory
LEED: Leadership in Energy and Environmental Design
MECT: Master Evaluation Contractor Team
M&V: Monitoring and Verification
NBI: New Buildings Institute
NC/CS Evaluation: New Construction/Codes and Standards Evaluation
NOMAD: Naturally Occurring Market Adoption
NREL: National Renewable Energy Laboratory
PG&E / PGE: Pacific Gas and Electric
QII: Quality Insulation Installation
R&D: Research and Development
RESNET: Residential Energy Services Network
RNC: Residential New Construction
SC: Shading Coefficient

RNC Market Effects Study: Phase I Draft Report
iv
SCE: Southern California Edison
SCG: Southern California Gas
SDG&E / SDGE: San Diego Gas & Electric
SEER: Seasonal Energy Efficiency Ratio
SFH: Single Family Home(s)
SHGC: Solar Heat Gain Coefficient
SMUD: Sacramento Municipal Utility District
TDV: Time Dependent Valuation
TXV: Thermostatic Expansion Valve
UL: Underwriters Laboratory
USGBC: United States Green Building Council
ZEH: Zero Net Energy Homes
RNC Market Effects Study: Phase I Draft Report
v
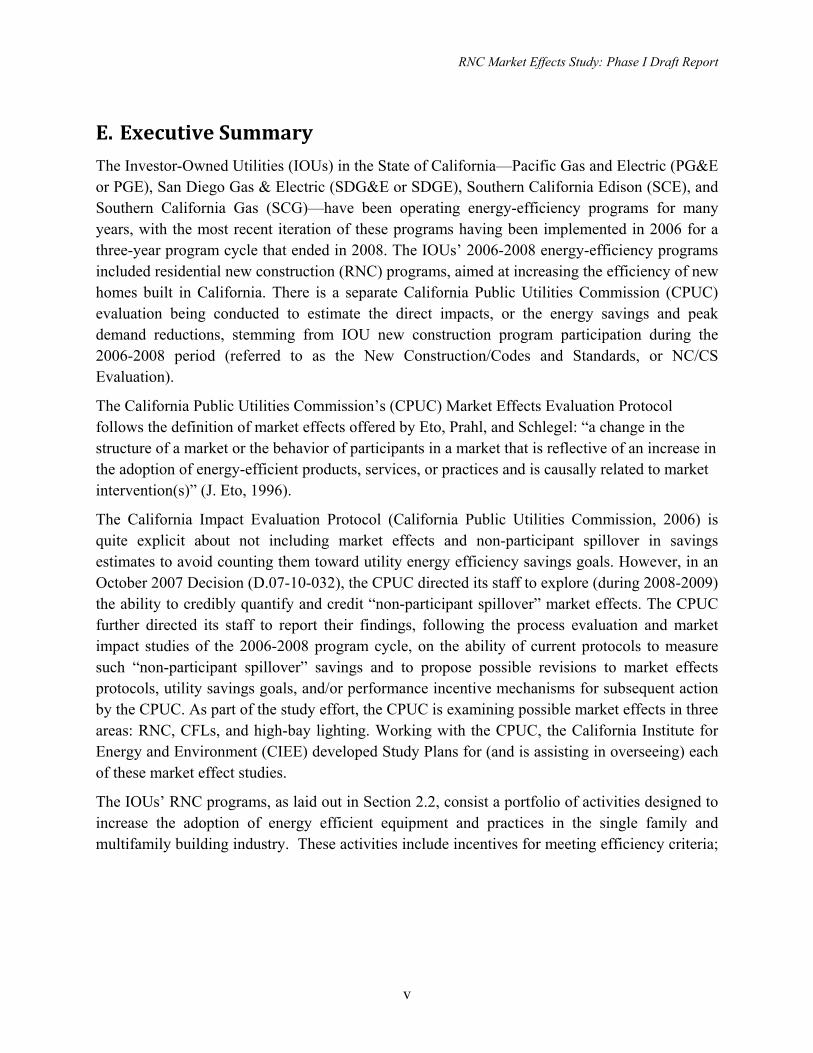
E. Executive Summary The Investor-Owned Utilities (IOUs) in the State of California—Pacific Gas and Electric (PG&E or PGE), San Diego Gas & Electric (SDG&E or SDGE), Southern California Edison (SCE), and Southern California Gas (SCG)—have been operating energy-efficiency programs for many years, with the most recent iteration of these programs having been implemented in 2006 for a three-year program cycle that ended in 2008. The IOUs’ 2006-2008 energy-efficiency programs included residential new construction (RNC) programs, aimed at increasing the efficiency of new homes built in California. There is a separate California Public Utilities Commission (CPUC) evaluation being conducted to estimate the direct impacts, or the energy savings and peak demand reductions, stemming from IOU new construction program participation during the 2006-2008 period (referred to as the New Construction/Codes and Standards, or NC/CS Evaluation).
The California Public Utilities Commission’s (CPUC) Market Effects Evaluation Protocol follows the definition of market effects offered by Eto, Prahl, and Schlegel: “a change in the structure of a market or the behavior of participants in a market that is reflective of an increase in the adoption of energy-efficient products, services, or practices and is causally related to market intervention(s)” (J. Eto, 1996).
The California Impact Evaluation Protocol (California Public Utilities Commission, 2006) is quite explicit about not including market effects and non-participant spillover in savings estimates to avoid counting them toward utility energy efficiency savings goals. However, in an October 2007 Decision (D.07-10-032), the CPUC directed its staff to explore (during 2008-2009) the ability to credibly quantify and credit “non-participant spillover” market effects. The CPUC further directed its staff to report their findings, following the process evaluation and market impact studies of the 2006-2008 program cycle, on the ability of current protocols to measure such “non-participant spillover” savings and to propose possible revisions to market effects protocols, utility savings goals, and/or performance incentive mechanisms for subsequent action by the CPUC. As part of the study effort, the CPUC is examining possible market effects in three areas: RNC, CFLs, and high-bay lighting. Working with the CPUC, the California Institute for Energy and Environment (CIEE) developed Study Plans for (and is assisting in overseeing) each of these market effect studies.
The IOUs’ RNC programs, as laid out in Section 2.2, consist a portfolio of activities designed to increase the adoption of energy efficient equipment and practices in the single family and multifamily building industry. These activities include incentives for meeting efficiency criteria;
RNC Market Effects Study: Phase I Draft Report
vi
Program Plan Check;1 Research & Development on new technologies and practices; The Codes and Standards Enhancement (CASE) Initiative Project to address energy-efficiency opportunities through development of new and updated appliance (Title 20) and building (Title 24) standards; training of builders and other market actors in new technologies and practices; training (by PG&E only) for building code officials on how to inspect homes for purposes of code enforcement; requirements for HERS ratings to verify proper installation and specified equipment are required for a home to achieve program-specified efficiency levels; and advertising and outreach to increase consumer awareness of efficiency and associated benefits. The programs provide support to encourage high-performance building design that exceeds the 2005 Title 24 energy efficiency requirements by 15% or more, while also aiming to increase the adoption and installation of individual high efficiency measures, such as efficient heating, cooling, lighting, and appliances in residential new construction.
For the Residential New Construction (Single Family Home) Market Effects Study, CIEE and the CPUC chose the New Construction/Codes and Standards Impact Evaluation Team to investigate the effects of California’s 2006-2008 RNC programs on the efficiency of new single-family homes sold in the California market. The study has three primary objectives:
1. Understand the market effects of California’s utility energy efficiency programs on construction practices for new single-family homes.
2. Quantify the energy savings caused by the above market effects occurring in the years 2006-2008, with special attention to non-participant spillover.
3. Support the CPUC’s strategic planning efforts by clarifying whether energy savings from non-participant spillover can be quantified with sufficient reliability to be treated as a resource.
The first work product of this team was a scoping study, to define and understand the California new construction market, develop a market theory, specify a program theory and how it relates to the market, assess data availability for the market effects study, develop a methodology for data collection, and recommend an analysis approach. The Scoping Study outlined a plan for conducting the research in two phases.
Phase I, reported in this document, was designed to assess the historical context of RNC design and construction practices in California; to determine—qualitatively—the extent to which market effects attributable to the 2006-2008 IOU programs have occurred; and to analyze the cumulative
1 Program Plan Check is a process in which IOU staff reviews participating builders’ plans and Title 24 compliance documentation to ensure accurate modeling. If significant modeling errors are discovered, Program Plan Check staff utilize CEC-approved Title 24 compliance software to correctly model the home. The revised model and revised compliance margins are then provided to the builder and energy consultant. This feedback mechanism is intended to both ensure that applications meet program requirements and to educate energy consultants on proper modeling techniques.
RNC Market Effects Study: Phase I Draft Report
vii
impact of the 1998-2005 IOU programs on the 2005 code change. Phase I addresses Objective 1 of the overall market effects study: to understand the market effects of California’s utility energy efficiency programs on construction practices for new single-family homes. Phase I was limited to addressing Objective 1 because of the uncertainty as to whether any market effects would be identified; the team, CIEE, and CPUC thought that determining whether market effects existed logically preceded quantifying them (Objectives 2 and 3).
E.1. Research Activities and Data Sources
The primary research activities conducted in Phase I were an analysis of historical trends, an analysis of expected outcomes, and an analysis of the effects of IOU programs on changes in the efficiency requirements of the Title 24 code. Table E-1 below summarizes the research activities carried out in Phase I.
The purpose of the analysis of historical trends was to reconstruct the historical trends concerning energy efficiency in the RNC market (single-family homes) in California. There were two main subtasks:
• Identifying trends in RNC efficiency practices in California. This involved reporting the use of energy-efficiency measures and practices in single family homes built under the 1995, 1998, 2001, and 2005 standards, including square footage, number of stories, basic equipment saturations, average SEER, average AFUE, types of water heaters, average energy factor of gas-storage water heaters, wall and ceiling insulation, presence of radiant barriers, and average duct leakage. It also included an overview of the number of single-family homes permitted in California between 1998 and 2008 (including homes built through the IOU RNC programs). The information is based on IOU program data tracking, previous IOU and CPUC reports, and other secondary sources, as well as an analysis of the characteristics of new homes from on-site visits conducted in 2008 and 2009 for the CPUC’s Residential New Construction Impact Evaluation.
• Identifying trends in incremental costs of efficiency measures, based on IOU estimates from 2003 through 2008.

RNC Market Effects Study: Phase I Draft Report
viii
The analysis of expected outcomes began with program theory, first attempting to determine if each outcome posited by the program theory had in fact occurred, and, if so, then attempting to determine whether the outcome could be linked to IOU program activities, based on the preponderance of evidence.2 The analysis of expected outcomes relied on the findings from the analysis of market evolution, and additional primary data collected from October of 2008 through January of 2009. The market actors interviewed were those identified in the scoping study as having the greatest influence on and knowledge about efficiency levels in residential construction. The primary data collection efforts contributing to the analysis of expected outcomes were as follows:
• 976 computer-assisted telephone interviewing (CATI) interviews with buyers of new non-program single-family homes in the IOU territories
• 267 on-site visits to non-program homes, recruited through home buyer interviews,
• 32 CATI interviews with builders of non-program homes
• 9 CATI interviews with HVAC contractors
• 45 CATI interviews with Title 24 consultants
• 29 CATI interviews with Home Energy Rating System (HERS) raters
• 17 telephone interviews with window distributors
• 6 telephone interviews with HVAC distributors
• 16 telephone interviews with lighting fixture and control distributors
• 8 in-depth interviews with managers of other voluntary programs aimed at increasing the efficiency of residential new construction in California
• 14 in-depth interviews with building code officials/inspectors
• Web-based estimates of naturally occurring market adoption (NOMAD) trends by 10 residential building experts, with re-estimation of indirect effects of prior IOU programs on NOMAD by 6 experts
2 A preponderance-of-evidence approach involves drawing a conclusion that a fact or occurrence is more probable than not based on weighing all available evidence.
RNC Market Effects Study: Phase I Draft Report
ix
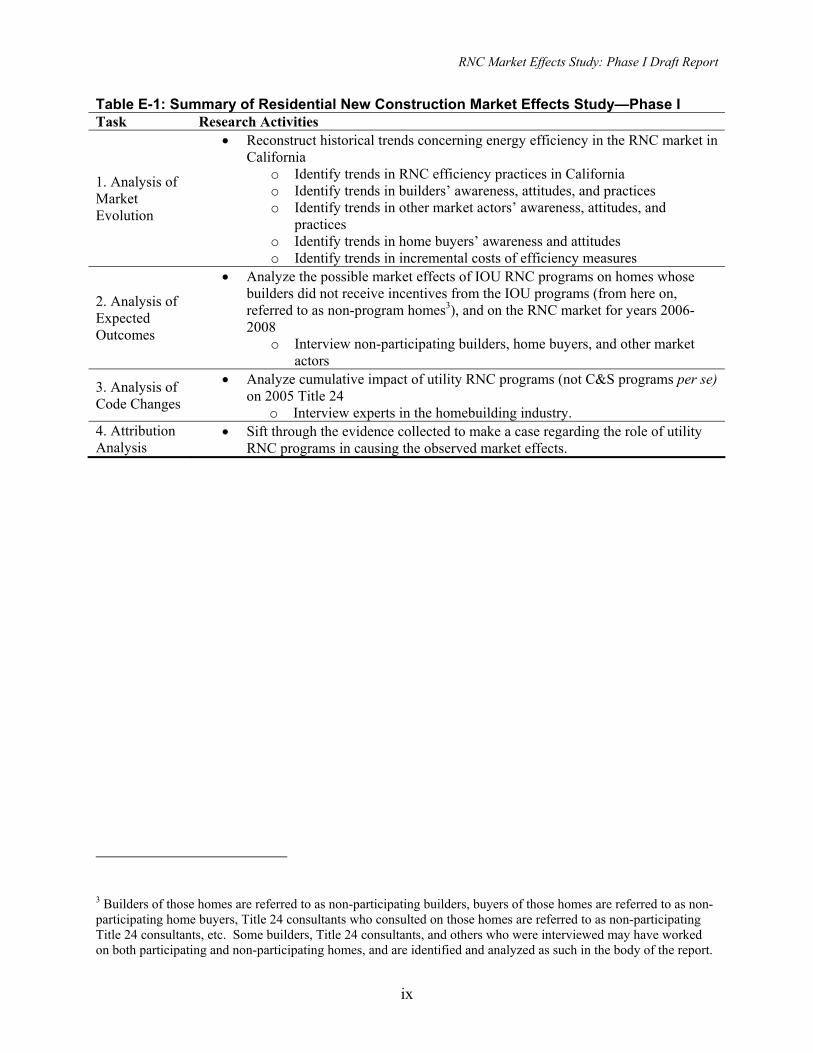
Table E-1: Summary of Residential New Construction Market Effects Study—Phase I Task Research Activities
1. Analysis of Market Evolution
• Reconstruct historical trends concerning energy efficiency in the RNC market in California
o Identify trends in RNC efficiency practices in California o Identify trends in builders’ awareness, attitudes, and practices o Identify trends in other market actors’ awareness, attitudes, and
practices o Identify trends in home buyers’ awareness and attitudes o Identify trends in incremental costs of efficiency measures
2. Analysis of Expected Outcomes
• Analyze the possible market effects of IOU RNC programs on homes whose builders did not receive incentives from the IOU programs (from here on, referred to as non-program homes3), and on the RNC market for years 2006-2008
o Interview non-participating builders, home buyers, and other market actors
3. Analysis of Code Changes
• Analyze cumulative impact of utility RNC programs (not C&S programs per se) on 2005 Title 24
o Interview experts in the homebuilding industry. 4. Attribution Analysis
• Sift through the evidence collected to make a case regarding the role of utility RNC programs in causing the observed market effects.
3 Builders of those homes are referred to as non-participating builders, buyers of those homes are referred to as non-participating home buyers, Title 24 consultants who consulted on those homes are referred to as non-participating Title 24 consultants, etc. Some builders, Title 24 consultants, and others who were interviewed may have worked on both participating and non-participating homes, and are identified and analyzed as such in the body of the report.
RNC Market Effects Study: Phase I Draft Report
x
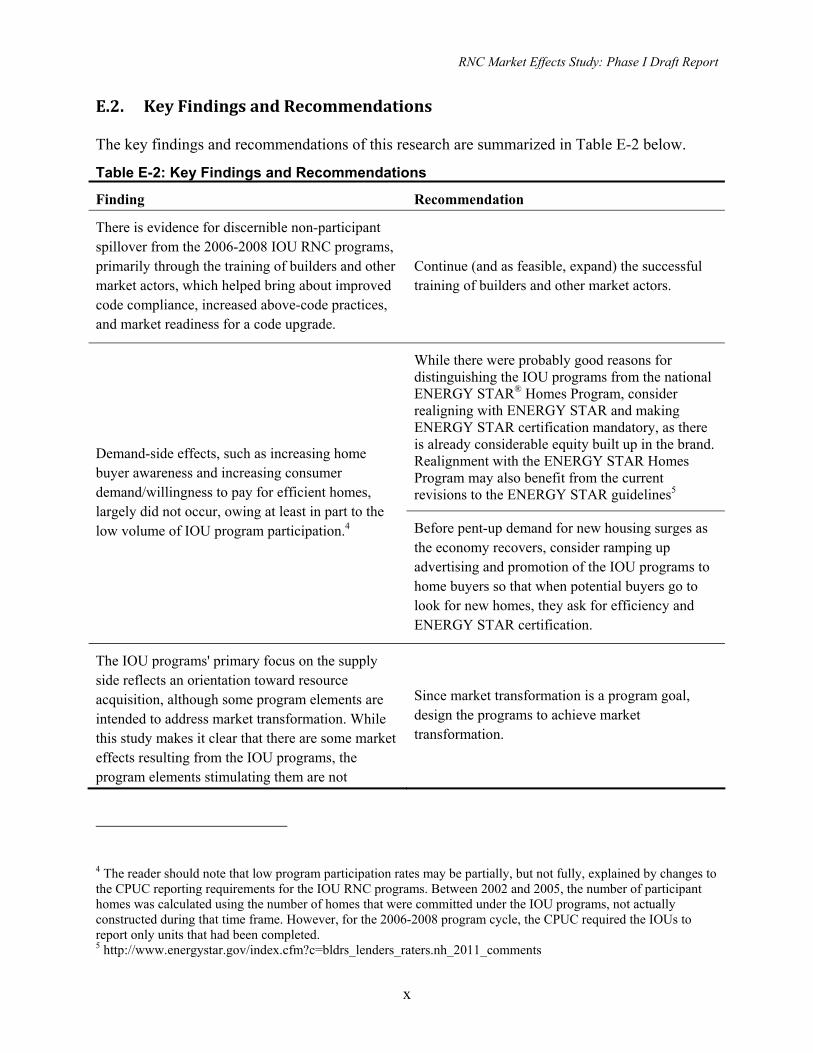
E.2. Key Findings and Recommendations
The key findings and recommendations of this research are summarized in Table E-2 below.
Table E-2: Key Findings and Recommendations
Finding Recommendation
There is evidence for discernible non-participant spillover from the 2006-2008 IOU RNC programs, primarily through the training of builders and other market actors, which helped bring about improved code compliance, increased above-code practices, and market readiness for a code upgrade.
Continue (and as feasible, expand) the successful training of builders and other market actors.
While there were probably good reasons for distinguishing the IOU programs from the national ENERGY STAR® Homes Program, consider realigning with ENERGY STAR and making ENERGY STAR certification mandatory, as there is already considerable equity built up in the brand. Realignment with the ENERGY STAR Homes Program may also benefit from the current revisions to the ENERGY STAR guidelines5
Demand-side effects, such as increasing home buyer awareness and increasing consumer demand/willingness to pay for efficient homes, largely did not occur, owing at least in part to the low volume of IOU program participation.4 Before pent-up demand for new housing surges as
the economy recovers, consider ramping up advertising and promotion of the IOU programs to home buyers so that when potential buyers go to look for new homes, they ask for efficiency and ENERGY STAR certification.
The IOU programs' primary focus on the supply side reflects an orientation toward resource acquisition, although some program elements are intended to address market transformation. While this study makes it clear that there are some market effects resulting from the IOU programs, the program elements stimulating them are not
Since market transformation is a program goal, design the programs to achieve market transformation.
4 The reader should note that low program participation rates may be partially, but not fully, explained by changes to the CPUC reporting requirements for the IOU RNC programs. Between 2002 and 2005, the number of participant homes was calculated using the number of homes that were committed under the IOU programs, not actually constructed during that time frame. However, for the 2006-2008 program cycle, the CPUC required the IOUs to report only units that had been completed. 5 http://www.energystar.gov/index.cfm?c=bldrs_lenders_raters.nh_2011_comments

RNC Market Effects Study: Phase I Draft Report
xi
systematically aimed at transforming the market.
This study focused on the 2006-2008 IOU programs, and there had been no market effects research since 2000.
Market effects research needs to occur on a regular basis since market transformation is a program goal; otherwise, program planners cannot know if the goal is being achieved.
Phase I has provided qualitative evidence of increases in the efficiency of the RNC market—beyond the direct effects of the IOUs’ 2006-2008 programs—that may reasonably be attributed to those programs.
Proceed with the Phase II research in order to quantify the energy savings caused by these market effects, and help to determine whether they can be quantified with sufficient reliability to be treated as a resource.
E.3. Findings
E.3.1 Program Participation and New Construction Activity
A major backdrop to the RNC market effects evaluation is the low level of participation in the IOU RNC programs during 2006 to 2008—the period of interest for this study. There were 5,592 new homes whose builders received incentives through the IOU programs in that period, compared to 36,920 from 2003 to 2005. The decrease was partly due to a rules change: as of the 2006-2008 program cycle, IOUs could no longer claim commitments, but only completed homes, so many of the homes claimed as commitments in 2005 were likely completed in 2006. The introduction of a new code in 2005, because it was more difficult to meet, also likely reduced program participation, as did disassociation from the national ENERGY STAR Homes Program—effectively creating a new program. By 2008, homes built through the IOU programs made up 12.1% of all new homes built in the IOU territories, compared to just 0.4% in 2006—but meanwhile, the total market shrank, from 106,479 homes in 2006 to 32,664 in 2008. The low levels of program participation mean that program influence on relatively modest numbers of non-program homes could translate into fairly high levels of spillover. Hence the figure of 5,592 program homes built from 2006 to 2008 should be borne in mind in later discussions of the numbers of non-program homes whose efficiency levels were influenced by the IOU programs.
RNC Market Effects Study: Phase I Draft Report
xii
E.3.2 Efficiency in the Residential New Construction Market
Another important backdrop to the RNC market effects study is the increasing efficiency of all new single-family homes built in California, spurred at least in part by upgrades to the building code in 1995, 1998, 2001, and 2005. Some of the key trends are as follows:
• Glazing
− The glazing area6 in new homes fell from 17% in homes built under the 1995 standards to 14% in homes built under the 2005 standards
− The percentage of glass that was two-paned vinyl and low-e increased from 5% in homes built under the 1995 standards to 86% in homes built under the 2005 standards
• Space heating
− The average AFUE7 for furnaces increased from 80% in homes built under the 1995 standards to 83% in homes built under the 2005 standards
− The percentage of 90%+ AFUE furnaces increased from 2% in homes built under the 1995 standards to 16% in homes built under the 2005 standards
• Space cooling
− The average central air conditioner SEER8 level increased from 10.5 SEER in homes built under the 1995 standards to 13.4 SEER in homes built under the 2005 standards; 13 SEER became the federal minimum standard in January of 2006
− The percentage of central air conditioners with SEER levels greater than 13 increased from 0% in homes built under the 1995 standards to 47% in homes built under the 2005 standards
• Water heating
− The percentage of instantaneous water heaters9 increased from 0% of water heaters in homes built under the 1995 standards to 25% in homes built under the 2005 standards
6 Glazing area equals window area divided by exterior wall area. 7 Annual Fuel Utilization Efficiency. The AFUE number represents how efficiently a furnace converts fuel to energy. The higher the AFUE percentage, the more energy-efficient the furnace, with a maximum possible AFUE of 100%. The U.S. government’s established minimum AFUE rating for a furnace is 78 percent. 8 Seasonal Energy Efficiency Ratio. This is the ratio of the cooling output divided by the power consumption. It is the Btu of cooling output during a central air conditioner’s (or heat pump’s) normal annual usage divided by the total electric energy input in watt hours during the same period. This is a measure of the cooling performance. The federal minimum for central air conditioners and heat pumps is 13 SEER. 9 Instantaneous or tankless water heaters heat water directly without the use of a storage tank and are more efficient than most conventional storage water heaters.
RNC Market Effects Study: Phase I Draft Report
xiii
• Ceiling insulation
− The average R-value10 of ceiling insulation increased from 29.1 in homes built under the 1995 standards to 33.4 in homes built under the 2005 standards
• Radiant barriers
− The percentage of homes with radiant barriers11 increased from 2% of homes built under the 1995 standards to 13% of homes built under the 2005 standards
• Duct leakage
− The average duct leakage12 decreased from 13.5% in homes built under the 1995 standards to 11.3% of homes built under the 2005 standards
• Code compliance
− The compliance margin (relative to Prescriptive Package D design) went from an average of 4.8% above code in homes built under the 1995 standards, to 6.2% in homes built under the 1998 standards, to 3.8% in homes built under the 2001 standards. (Results are not yet available for homes built under the 2005 standards.13) Of course, standards became progressively more stringent during this time.
− The percentage of non-compliant homes went from 15.7% of homes built under the 1995 standards, to 14.4% of homes built under the 1998 standards, to 27.0% of homes built under the 2001 standards. (Results are not yet available for homes built under the 2005 standards.) Again, standards became progressively more stringent during this time.
E.3.3 Outcomes and Linkages to the IOU Programs
A diagram of the logic of the IOU programs, based on interviews with IOU program staff and industry experts conducted during the Scoping Study (and modified during the course of Phase I), appears in Figure E-1. This diagram also summarizes the findings of the analysis of outcomes that were expected according to program theory, showing outcomes that appear to have occurred as green ovals, those that appear not to have occurred as red ovals, and those that have not been measured well enough to draw conclusions as gray ovals. Figure E-1 also shows linkages from
10 R-value indicates insulation's resistance to heat flow; the higher the R-value, the greater the insulating effectiveness. 11 Radiant barriers are materials installed in buildings to reduce summer heat gain and winter heat loss in order to help lower heating and cooling costs. The barriers consist of a highly reflective material that reflects radiant heat rather than absorbing it. They don't, however, reduce heat conduction like thermal insulation materials 12 Duct leakage is measured as a percentage of supply air flow in an HVAC system and refers to the loss of conditioned air from a duct system due to cracks and gaps in the duct system 13 Compliance margins are relative to Title 24 building code Package D (set of prescriptive measures) and measure the difference in the energy use of a home compared to Package D in Title 24
RNC Market Effects Study: Phase I Draft Report
xiv
program efforts to expected outcomes, or from one outcome to another, that appear to reflect program influence (green arrows), those that appear not to reflect program influence (red arrows), and those that have not been measured well enough to allow such an assessment (gray arrows); thicker arrows reflect greater expected influence. The conclusions drawn from this analysis are largely qualitative. The intent is to examine the available data, and make inferences based on the preponderance of evidence.
In interpreting the evidence as to whether an outcome occurred or whether the IOU programs had an influence, we used the guidelines described below. In this interpretation we gave primacy to the responses of Title 24 consultants because of their focus on efficiency (differing from builders, for example, for whom efficiency is only one of many concerns).14
Strong evidence: Market actors in more than one group accounting for substantial numbers of non-program homes (i.e., >15%)—with primacy given to Title 24 consultants—said an outcome had occurred (outcomes) or that the IOU programs had a strong influence (linkages). No major contradictory evidence from other groups. In the case of home buyers, statistically significant and substantively important increases over time in indicators related to efficiency in general (outcomes), or substantial numbers (i.e., >30%) tied their knowledge or positive attitudes specifically to the IOUs (linkages).
Moderate evidence: Either 1) One market actor group accounting for substantial numbers of non-program homes (i.e., >15%) with primacy given to Title 24 consultants—said an outcome had occurred (outcomes) or that the IOU programs had a strong influence (linkages). No major contradictory evidence from other groups. OR: 2) Market actors in more than one group accounting for moderate numbers of non-program homes (i.e., 5%-15%)—with primacy given to Title 24 consultants—said an outcome had occurred (outcomes) or that the IOU programs had a strong influence (linkages). No major contradictory evidence from other groups. In the case of home buyers, statistically significant but not substantively important increases over time in indicators related to efficiency in general (outcomes), or moderate numbers (i.e., 20%-30%) tied their knowledge or positive attitudes specifically to the IOUs (linkages).
Weak evidence: Market actor groups generally accounting for <5% of non-program homes said an outcome had occurred (outcomes) or that the IOU programs had a strong influence (linkages). In the case of home buyers, no statistically significant increases over time in indicators related to efficiency in general (outcomes), or small numbers (i.e., <20%) tied their knowledge or positive attitudes specifically to the IOUs (linkages).
14 Title 24 Consultants provide calculations and documentation that a home is compliant with Title 24 (the California Energy Efficiency Standards for Residential and Nonresidential Buildings) as well as provide recommendations to improve the energy efficiency of homes. Because of their focus on energy efficiency and Title 24, we place more weight on the responses of Title 24 Consultants than on those of other market actors.
RNC Market Effects Study: Phase I Draft Report
xv
Insufficient data: Not enough evidence of change or lack of change to say an outcome occurred, or not enough evidence of linkage or lack of linkage of programs activities to outcomes to say whether or not the IOU programs had an influence.
In this study we have focused on non-participant spillover, or the indirect effects of the 2006-2008 IOU programs on the efficiency of non-program single-family homes built during the same period. The IOU programs can also have direct effects through participating homes, but those effects are addressed by the NC/CS Evaluation.
Figure E-1 illustrates the three ways in which all IOU programs—not just the RNC programs, but any program affecting the residential new construction market—can lead to the ultimate goal of reduced energy use, demand, and emissions: 1) by improving compliance with existing code, 2) by facilitating construction that is more efficient than required by the current code, and 3) by contributing to code upgrades. Ultimately, program activities are aimed at achieving savings in one of these three ways. This summary begins by addressing these three key outcomes, and in so doing focuses on IOU program elements that appear to have had effects on the market. Many key program elements, however, did not lead to observable market effects, as illustrated in Figure E-1; a discussion of these less effective program elements comes later.
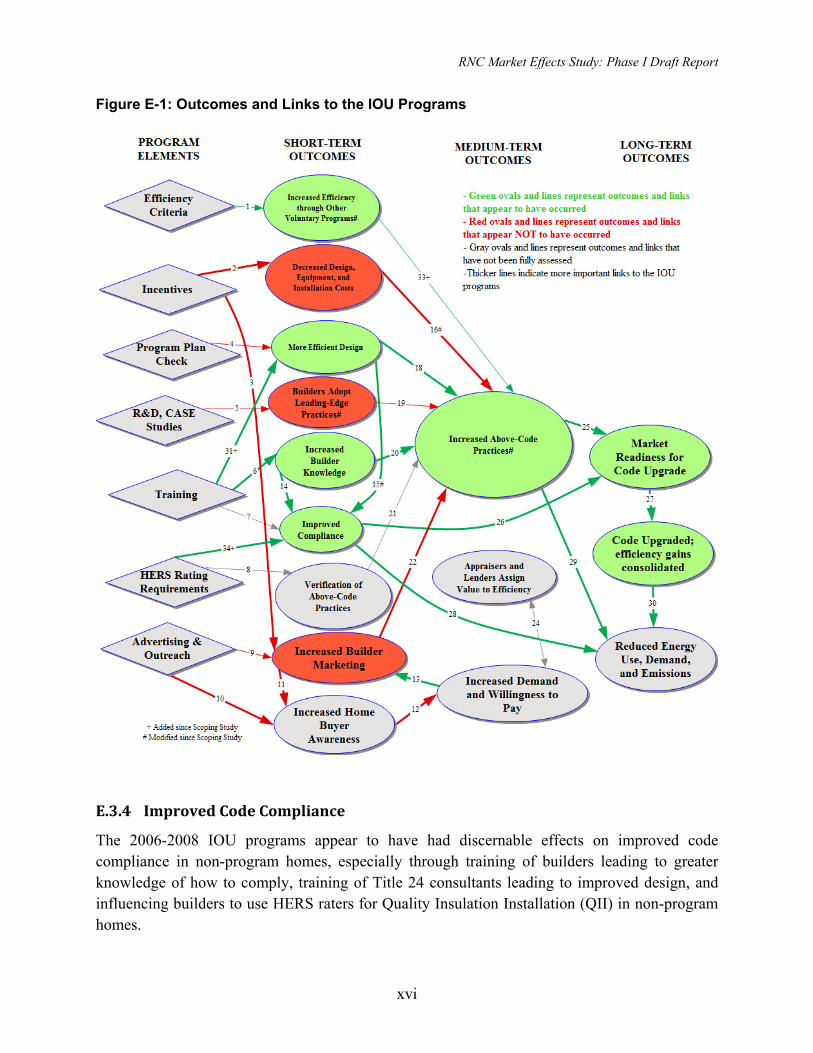
RNC Market Effects Study: Phase I Draft Report
xvi
Figure E-1: Outcomes and Links to the IOU Programs
E.3.4 Improved Code Compliance
The 2006-2008 IOU programs appear to have had discernable effects on improved code compliance in non-program homes, especially through training of builders leading to greater knowledge of how to comply, training of Title 24 consultants leading to improved design, and influencing builders to use HERS raters for Quality Insulation Installation (QII) in non-program homes.

RNC Market Effects Study: Phase I Draft Report
xvii
• Expected outcome: Improved code compliance. Strong evidence that outcome has occurred. Twenty-five out of 45 Title 24 consultants, representing 55% of non-program homes,15 and 20 out of 29 HERS raters, representing 82% of non-program homes,16 said that rates of compliance with Title 24 had increased from 2006 to 2008.
− Link 6 (IOU program training leads to increased builder knowledge). Strong linkage of outcome to IOU programs. Sixteen of 32 builders, responsible for 25% of non-program homes,17 said they had attended IOU-sponsored trainings in the 2006-2008 period, and 11 builders said they had adopted some energy-efficient building practices or technologies because of the training. Eight of 32 builders, responsible for 17% of non-program homes, rated the training as having a great deal of influence on their adoption of the more energy-efficient building practices or technologies during the 2006-2008 period.
− Link 14 (Increased builder knowledge leads to improved code compliance): Strong linkage of outcome to IOU programs. Thirteen Title 24 consultants, responsible for 25% of non-program homes, said that IOU training had helped to improve code compliance during the 2006-2008 period, while five Title 24 consultants, responsible for 35% of non-program homes, said that other (non-IOU) training had helped to improve code compliance. Fifteen HERS raters, responsible for 92% of non-program homes, said that IOU training had helped to improve code compliance, while 11 HERS raters responsible for 86% of non-program homes said that other (non-IOU) training had helped to improve code compliance. Five of 14 building code officials and inspectors agreed that IOU programs had helped improve compliance, and four of 14 building code officials/inspectors agreed that non-IOU programs had helped improve code compliance. Nine builders, responsible for 26% of non-program homes, said that IOU training had helped to improve code compliance, while five builders, responsible for 11% of non-program homes, said that other (non-IOU) training had helped to improve code compliance.
− Link 31+ (IOU training of Title 24 consultants leads to more efficient design) and Link 15 (More efficient design leads to improved code compliance). Strong linkage of
15 That is, 55% of the non-program homes consulted on by the 45 Title 24 consultants interviewed for the study; according to Title 24 consultants’ self-reports, they were responsible for 106,809 non-program homes in the 2006-2008 period, or about 50% of all non-program homes in California. Non-program homes refer to those whose builders did not receive incentives from the IOUs in the 2006-2008 period. 16 That is, 82% of the non-program homes rated by the 29 HERS raters interviewed for the study; according to HERS raters’ self-reports, they were responsible for 20,111 non-program homes in the 2006-2008 period, or about 10% of all non-program homes in California. 17 That is, 17% of non-program homes accounted for by the 32 builders interviewed for the study; according to builders’ self-reports, they were responsible for 31,561 non-program homes in the 2006-2008 period, or about 15% of all non-program homes in California.

RNC Market Effects Study: Phase I Draft Report
xviii
outcome to IOU programs. Twenty-three out of 45 Title 24 consultants said IOU training had had a strong influence on their recommendations of energy-efficient building practices and technologies for 42% of non-program homes built in the 2006-2008 period.
− Link 34+ (HERS rating requirements for QII leads to improved code compliance). Strong linkage of outcome to IOU programs. Twenty out of 29 HERS raters, responsible for 99% of non-program homes, verified Quality Insulation Installations (QII) to earn energy credits for Title 24 compliance during the 2006-2008 period, and four HERS raters, responsible for 19% of non-program homes, said that the IOU RNC programs had a strong influence on the use of QII in non-program homes during the 2006-2008 period.
E.3.5 Increased AboveCode Practices
The 2006-2008 IOU programs appear to have had observable effects on increased above-code practices, primarily through Title 24 consultants’ contributions to more efficient designs, which in turn came in part through IOU program training, and through builders’ increased knowledge about above-code practices—again, partly through IOU program training.
• Expected Outcome: Increased above-code practices. Strong evidence that the outcome has occurred. Based on onsite visits to newly constructed non-program homes, the efficiency levels of several building measures, such as high-SEER central air conditioners and high-AFUE furnaces, appear to have increased during the 2006-2008 period relative to the pre-2006 period. Title 24 consultants estimated that 24% of non-program homes built during the 2006-2008 period exceeded Title 24 requirements. Eleven of 45 Title 24 consultants estimated that 10% of the non-program homes met program standards—that is, were at least 15% more efficient than Title 24 requirements, not simply above code. Seven out of 45 Title 24 consultants and 12 of 29 HERS raters reported that the number of non-program homes that exceeded Title 24 requirements had increased between 2006 and 2008 (23% of non-program homes for Title 24 consultants and 7% for HERS raters).
− Link 18 (More efficient design leads to increased above-code practices). Strong linkage of outcome to IOU programs. The IOU programs in general influenced 17 out of 45 Title 24 consultants accounting for 30% of non-program homes to recommend above-code practices and technologies for most of those homes, including duct testing (19% of all non-program homes), duct sealing (18%), water-heating equipment (11%), and high-SEER AC or heat pump (9%). (See above for Link 31+ and Link 6.)
− Link 20 (Increased builder knowledge leads to increased above-code practices). Strong linkage of outcome to IOU programs. Builders responsible for 22% of non-program homes reported that knowledge gained through utility programs was an important or very important factor in their choice of energy efficiency levels in non-program homes, and eight of 32 builders said the IOU training had a great deal of
RNC Market Effects Study: Phase I Draft Report
xix
influence on their use of above-code practices and technologies in 17% of non-program homes. Five of 29 HERS raters and 14 of 45 Title 24 consultants reported that IOU programs influenced builders to use above-code measures in non-program homes through training and education. Eleven of 32 builders said they employed subcontractors who had worked on program homes and had changed their building or installation practices as a result. In addition, 30 out of 32 builders identified subcontractors as a primary source of information. Nine of 32 builders reported that IOU RNC programs were a primary source of information about new energy-efficient technologies and building practices and eight builders reported that utility training was a primary source of information. Although only one HVAC contractor reported that the adoption of new technologies or practices was directly due to IOU-sponsored trainings, five of nine HVAC contractors reported that the most common source of information on new energy-efficient technologies and building practices was the IOU RNC programs. (See also Link 6 above.)
E.3.6 Market Readiness for a Code Upgrade
The 2006-2008 IOU programs also appear to have had observable effects—both direct and indirect—on market readiness for a future code upgrade (occurring in 2008 and again in 2011), with the indirect effects coming primarily from contributions to improved code compliance and increased above-code practices through builder and Title 24 consultant training, and through promoting the use of HERS raters. In addition, providing a possible indication of the 2006-2008 IOU programs on future code upgrades, the 2003-2005 IOU programs also had a direct effect on the 2005 code upgrade by creating a market for hard-wired CFL fixtures, which became part of the 2005 code.
• Expected outcome: Market readiness for code upgrade. Moderate evidence that outcome has occurred. Ten of 45 Title 24 consultants, representing only 5% of non-program homes, said there was adequate knowledge and availability of energy-efficient technologies and practices such that most builders could comply with the proposed 2008 code upgrade within a reasonable time—and the responses from Title 24 consultants may be the most important. However, eleven of 29 HERS raters, representing 66% of non-program homes, said this was the case, as did nineteen of 32 builders, representing 79% of non-program homes. The builder responses are telling, in that they may reflect a willingness to embrace another code upgrade, or at least resignation to the fact that it will happen.
− Link 26 (Improved compliance leads to market readiness for a code upgrade). Moderate linkage of outcome to IOU programs. Twenty of 32 builders, representing 22% of non-program homes, agreed that the low end of the market could comply with the proposed 2008 code upgrade within a reasonable time. Twelve of 45 Title 24 consultants, representing 30% of non-program homes said the same thing, as did 12 of 29 HERS raters representing 69% of non-program homes, four of nine HVAC
RNC Market Effects Study: Phase I Draft Report
xx
contractors representing 82% of non-program homes,18 and four of 14 building code officials/inspectors.
− Link 25 (Increased above-code practices lead to market readiness for a code upgrade). Moderate linkage of outcome to IOU programs. (See Outcome.)
− Link 27 (Market readiness for a code upgrade leads to a code upgrade). Moderate linkage of outcome to IOU programs. While analysis of the effect of the pre-2006 IOU RNC programs on changes in the 2005 Title 24 requirements is backward looking, and while the analysis is not yet finished, it does provide a preliminary indication of the possible effects of the 2006-2008 IOU RNC programs on code upgrades going forward. The IOU lighting programs in effect prior to 2006 created the market for high-efficacy lighting in residential new construction during the time they operated. Since there was no indication that the market adoption of high-efficiency lighting resulting from these programs would have continued after these programs ended without the Title 24 change, it appears that the IOU programs helped prepare the market and make it practicable to include hardwired CFL fixtures in 2005 Title 24 requirements.
E.3.7 DemandSide Effects
In general, the 2006-2008 IOU program spillover effects that were dependent on program volume largely did not occur. These include demand-side effects, such as increasing home buyer awareness and increasing consumer demand/willingness to pay for efficient homes. This is to be expected given the low volume of homes going through the IOU programs in the 2006-2008 period—only 5,592 out of 206,788 homes built in the IOU territories.
• Expected outcome: Increased home buyer awareness. Insufficient data to determine whether the outcome has occurred. Only 26% of non-participating new home buyers interviewed in 2008 said that some homes are more energy-efficient than others, compared to 70% who said so in 2000. However, 47% in 2008 compared to 34% in 2000 said that new homes in their area and price range could be more efficient, suggesting these home buyers recognize that some homes can be more energy-efficient than others. Most non-participating new home buyers surveyed in 2008 said their home was about as efficient as other new homes.
− Link 10 (IOU program advertising and outreach leads to increased home buyer awareness). Weak linkage of outcome to IOU programs. Only 3% of non-participating new home buyers interviewed in 2008 said they had heard about
18 That is, 82% non-program homes accounted for by the nine HVAC contractors interviewed for the study; according to HVAC contractors’ self-reports, they were responsible for 52,997 non-program homes in the 2006-2008 period, or about 25% of all non-program homes in California.
RNC Market Effects Study: Phase I Draft Report
xxi
efficiency from their utility during the home-buying process, although the proportion of new home buyers who had heard about the importance of efficiency from someone increased from 21% in 2000 to 27% in 2008. About one-half of non-participating homeowners (49%) said they were aware of the programs sponsored by governments or IOUs that encouraged energy-efficient features in new homes, and 10% said someone mentioned the program when they were buying or building their home. Aided awareness of the ENERGY STAR Homes program was 48% in 2008, while aided awareness of the IOU programs was 19%; the greater recognition of the national program name suggests that home buyer awareness of the IOU programs may at least partially carry over from the pre-2006 programs, when the IOUs used the ENERGY STAR name.
− Link 11 (Increased builder marketing leads to increased home buyer awareness): Weak linkage of outcome to IOU programs. Only four percent of non-participating new home buyers said that builders, developers, or realtors emphasized energy efficiency during the buying process. However, of those who said someone mentioned IOU programs (10% of all non-participating new home buyers), about one-half heard about it through the builder or sales agent.
• Expected outcome: Increased demand and willingness to pay. Insufficient data to determine whether the outcome has occurred. Two-thirds (68%) of non-participating new home buyers said energy efficiency was important (7 to 10 on a 0-to-10 scale) in their selection of a new home. One-third (32%) rated it very important (9 or 10 on a 0-to-10 scale). Three-fourths (76%) of non-participating new home buyers expressed strong agreement (7 to 10 on a 0-to-10 scale) with the statement that they were willing to invest in home features that would reduce their monthly energy bills, and about one-half (54%) disagreed (0 to 3 on a 0-to-10 scale) that energy-efficient features in a new home cost more than they are worth. While these are positive numbers, we have no measures of increasing demand over time, and no indications of home buyers actually paying more for more efficient homes when given a choice.
− Link 12 (Increased home buyer awareness leads to increased demand and willingness to pay). Weak linkage of outcome to IOU programs. Only 10% of non-participating new home buyers sought information on the IOU programs during the buying process, about equally through utility representatives, the Internet, and the builder. The small number of IOU program homes completed in 2006 and 2007 is evidence of limited home buyer demand generated by the 2006-2008 IOU programs; insofar as there was demand generated by the IOU programs, it may have been through the pre-
RNC Market Effects Study: Phase I Draft Report
xxii
2006 programs, and it is possible but unconfirmed that this translated into sales of efficient homes certified by other programs.19
E.3.8 SupplySide Effects
The reduced IOU program volume in the 2006-2008 period also largely negated opportunities for some supply-side effects, such as reduced incremental costs for efficient construction, since the volume of efficient measures incentivized through the programs simply was not large enough to induce economies of scale.
• Expected outcome: Decreased design, equipment, and installation costs. Weak evidence that the outcome has occurred. Incremental costs for some efficient measures went up, others went down, and others stayed the same. Meanwhile, the code became more stringent and the cost for meeting it, not unexpectedly, went up.
− Link 2 (IOU program incentives lead to decreased incremental costs): Weak linkage of outcome to IOU programs. None of the 32 builders interviewed attributed decreases in incremental costs to the IOU programs. However, IOU program incentives for program homes do decrease the costs of building those (relatively few) homes, if not for the market as a whole. Distributors tended not to attribute price declines to the IOU programs, but rather to wider availability and use of the higher efficiency equipment or materials and manufacturers cutting prices due to the economic downturn.
The supply-side effects of IOU programs on non-program homes that do appear to have occurred were primarily through IOU training (see above). The IOU programs exist in a California market in which building codes—already some of the most stringent in the U.S.—are ratcheted up every three or four years. IOU training helps builders and other market actors prepare for the upgrades and comply after the fact. Hence, the IOU programs appear to be an important element that helps the code upgrade cycle keep happening.
19 Other programs include the national ENERGY STAR Homes Program, the state Solar Initiative, and residential new construction programs run by municipal utilities.
RNC Market Effects Study: Phase I Draft Report
xxiii
E.3.9 Alternative Explanations for Observed Market Changes
Other factors, outside the IOU programs, could explain observed market changes—but not necessarily to the exclusion of the IOU programs or each other. Some alternative explanations and related findings are as follows:
Alternative 1: Other programs that are already available in the marketplace could be driving increased efficiency independently of the IOU programs and could have led to the observed market changes.
The IOU programs coexist in the market with many other programs aimed at increasing the efficiency of new homes. While managers of these other programs give the IOU programs some credit for their efficiency criteria and participation in their 2006-2008 programs (Link 1), it is likely that these other programs also contributed to the success of the IOU programs—especially since the volume of these other programs in 2006 to 2008 was so much greater than that of the IOU programs (about 46,000 homes compared to 5,592, respectively, not counting overlap—although some of these programs count committed homes, whereas the IOU programs count only completed homes). The earlier versions of the IOU programs, when volume was much greater, could have had effects on 2006-2008 participation in the other programs, but the focus here is on market effects from the 2006-2008 IOU programs. Overall, Alternative 1 does not explain observed market changes; while non-IOU RNC programs affected the market, it does not appear that they did so independently of the IOU programs.
Alternative 2: Outside forces such as gasoline prices, housing market cycles, and global warming could be driving demand for efficiency and could have led to the observed market changes, independently of the IOU programs and other voluntary programs.
Buyers of non-program homes in California value efficiency and express willingness to pay for it, and the importance they assign to efficiency may have increased over the past few years (Link 12—see above). It is possible that demand could have been partially driven by previous versions of the IOU RNC programs, or by other IOU efforts, such as the Flex Your Power public awareness campaign (which is the focus of a separate impact evaluation). More importantly, there were powerful external forces at work affecting all aspects of the 2006-2008 housing market, including efficiency. There was near universal agreement among market actors interviewed for the Scoping Study that one effect of the building boom was to minimize unit efficiency (beyond code requirements) because nearly any home could sell and buyers had to take what they could get; however, in the housing downturn, there was widespread agreement that builders have used increased efficiency as a way to differentiate, hold on to market share, and minimize price reductions, and buyers could hold out for homes with the features they wanted. Many industry experts interviewed for the scoping study also said that higher gasoline prices were a major driver for increased efficiency—not just for cars, but for efficiency in general—because their high visibility increased awareness; higher gasoline prices could have affected the 2008 market in particular. Finally, while the evidence is not strong, the issue of climate change could have affected demand for efficiency, at least for a minority of buyers of

RNC Market Effects Study: Phase I Draft Report
xxiv
non-program homes. Overall, demand for efficiency appears to have been more driven by outside forces (confirming Alternative Explanation 2) than by the 2006-2008 IOU programs, as very few buyers sought out IOU program homes.
Alternative 3: The market could be developing at a “natural” rate and the observed market changes could have happened in the absence of the IOU programs and other voluntary programs; this is highly interrelated with Alternative 2, but could include forces within the market as well as outside the market that led to a “natural” rate of change.
The 2006-2008 IOU programs appear to have had little effect on home buyer demand for efficiency. However, on the supply side, market actors actually have to be able to deliver the efficiency, and the 2006-2008 IOU programs appear to have played an important role in the construction industry’s gearing up to do so; the IOU programs, then, appear to have helped accelerate the natural rate of adoption of efficiency, at least on the supply side, and Alternative 3 does not appear to explain market changes.
E.4. Recommendations
Four recommendations for IOU program design emerge from the findings of this study.
First, continue (and as feasible, expand) the successful training of builders and other market actors. Second, while there were probably good reasons for distinguishing the IOU programs from the national ENERGY STAR Homes Program, consider realigning with ENERGY STAR and making ENERGY STAR certification mandatory, as there is already considerable equity built up in the brand. Realignment with the ENERGY STAR Homes Program may also benefit from the current revisions to the ENERGY STAR guidelines due to take effect in 2011.20 Third, before pent-up demand for new housing surges as the economy recovers, consider ramping up advertising and promotion of the IOU programs so that when potential buyers go to look for new homes, they ask for efficiency and ENERGY STAR certification. Many builders will build more efficiently if they perceive it as a customer need; otherwise, demand for housing in general might allow any level of efficiency to sell—as was apparently the case in the most recent boom. Participation in the IOU programs could perhaps be increased with renewed effort on channeling consumer demand for efficiency, thus leveraging the outside forces such as gasoline prices, housing market cycles, and global warming that are already driving demand for efficiency.
The fourth recommendation for IOU program design is as follows: since market transformation is a program goal, design the programs to achieve market transformation. The IOU programs’ focus on the supply side reflects an orientation toward resource acquisition, with an apparent expectation that market transformation will automatically follow—“build it and they will buy.”
20 http://www.energystar.gov/index.cfm?c=bldrs_lenders_raters.nh_2011_comments

RNC Market Effects Study: Phase I Draft Report
xxv
While this study makes it clear that there are some market effects resulting from the IOU programs, the program elements stimulating them are not systematically aimed at transforming the market. When the market rebounds, in order to avoid lost opportunities, it will be important for the IOU programs already to have prepared the marketing and building network, reconnect with ENERGY STAR, and apply lessons learned about Zero Net Energy residential new construction learned at the Sacramento Municipal Utility District (SMUD).
This is related to a recommendation for market effects research: it needs to occur on a regular basis since market transformation is a program goal; otherwise, program planners cannot know if the goal is being achieved. This study focused on the 2006-2008 IOU programs, and there had been no market effects research since 2000, giving little opportunity to provide feedback to program planners.
This study marks the completion of Phase I of the Residential New Construction Market Effects Study. Phase I has been largely qualitative, aiming to establish whether or not there is substantial evidence of increases in the efficiency of the RNC market—beyond the direct effects of the IOU programs—that may reasonably be attributed to those programs. If such market effects were identified, the plan was to conduct Phase II in order to quantify those market effects and thus help address the CPUC’s October 2007 Decision (D.07-10-032) directing its staff to explore the ability to credibly quantify and credit “non-participant spillover” market effects. We believe there is sufficient qualitative evidence of market effects to justify such an effort, and therefore recommend continuing with Phase II.21 Furthermore, much of the data required for Phase II have already been collected during Phase I, or are being collected as part of the Residential New Construction Impact Evaluation, and we believe that quantification of market effects is practicable with these data as a starting point. Determining whether developing estimates of non-participant spillover is practical, and knowing what those levels are, could prove valuable if new construction rebounds and program participation increases in the coming years.
21 Phase II will attempt to incorporate the findings of several recent and upcoming lighting studies that may include data on market effects, in particular to avoid any double counting of market effects.