phase-out 2020 - shaping policy for development · pdf filephase-out 2020: monitoring...
TRANSCRIPT

Phase-out 2020Monitoring Europe’s fossil fuel subsidiesIpek Gençsü, Maeve McLynn, Matthias Runkel, Markus
Trilling, Laurie van der Burg, Leah Worrall, Shelagh Whitley,
and Florian ZerzawySeptember 2017

2 Report
Report partners
Cover photo: Oil refinery in Nordrhein-Westfalen, Germany – Ralf Vetterle (CC0 creative commons license).
ODI is the UK’s leading independent think tank on international development and humanitarian issues. Climate Action Network (CAN) Europe is Europe’s largest coalition working on climate and energy issues.
Readers are encouraged to reproduce material for their own publications, as long as they are not being sold commercially. As copyright holders, ODI and CAN Europe request due acknowledgement and a copy of the publication. For online use, we ask readers to link to the original resource on the ODI website. The views presented in this paper are those of the author(s) and do not necessarily represent the views of ODI or our partners.
© Overseas Development Institute and CAN Europe 2017. This work is licensed under a Creative Commons Attribution-NonCommercial Licence (CC BY-NC 4.0).
Overseas Development Institute 203 Blackfriars Road London SE1 8NJTel +44 (0)20 7922 0300 Fax +44 (0)20 7922 [email protected]
CAN EuropeRue d’Edimbourg 26 1050 Brussels, BelgiumTel: +32 (0) 28944670 [email protected]

Phase-out 2020: monitoring Europe’s fossil fuel subsidies 3
AcknowledgementsThe authors are grateful for support and advice on the report from: Dave Jones of Sandbag UK, Colin Roche of Friends of the Earth Europe, Andrew Scott and Sejal Patel of the Overseas Development Institute, Helena Wright of E3G, and Andrew Murphy of Transport & Environment, and Alex Doukas of Oil Change International.
The authors would like to thank the co-authors of the EU brief: Xavier Sol of Counter Balance, Anna Roggenbuck and Pippa Gallop of CEE Bankwatch Network, Antoine Simon and Colin Roche of Friends of the Earth Europe, Klaus Röhrig of Climate Action Network Europe.
The authors would also like to especially thank Assia Elgouacem, Federico de Luca and Ron Steenblik of the Organisation for Economic Co-operation and Development for cross-checking fiscal support included in this report against their own extensive data set, and Alex Doukas of Oil Change International for providing support with collation of public finance data throughout.
The authors are also grateful for support and advice on the country briefs and the EU brief from: Jiri Jerabek of Greenpeace Czech Republic, Barbora Urbanova of the Centre for Transport and Energy, Guillaume Sainteny of GS Conseil, Lucy Kitson of the Global Subsidies Initiative of the International Institute for Sustainable Development, Caroline Brun, Meike Fink and Lorelei Limousin of Réseau Action Climat (RAC) France, Swantje Fiedler of Green Budget Germany, Lea Köder of the German Federal Environment Agency, Alex Doukas and Greg Muttitt of Oil Change International, Csaba Vaszkó of WWF Hungary, András Lukács of the Clean Air Action Group, Gabriele Nanni and Katiuscia Eroe of Legambiente, Wiert Wiertsema and Niels Hazekamp of BothEnds, Sem Oxenaar of the Dutch Research Institute for Transitions, Kuba Gogolewski of NGO Fundacja, Tatiana Nuno and Sara Pizzinato of Greenpeace Spain, Ignasi Puig-Ventosa of Environmental Innovation that Serves Society, Dave Jones of Sandbag UK, Stuart McWilliam of Global Witness, Dave Powell of the New Economics Foundation, Rolf Linhal and Gunnar Lind of Greenpeace Sweden, and Anders Friström of the Swedish Society for Nature Conservation, Helena Wright of E3G, and Sebastien Godinot of WWF Europe.
The authors are grateful for communications support from Nicolas Derobert and Martin O’Brien of CAN Europe, and Chris Little, James Rush, Sean Willmott and Charlie Zanijcek of the Overseas Development Institute, and to Sophy Kershaw for editorial support.
The authors gratefully acknowledge the financial support of Hewlett Foundation and Oak Foundation (ODI) and KR Foundation (CAN Europe) that made this report possible.

4 Report
Contents
Acknowledgements 3
Executive summary 7
1. Introduction 9
1.1. Europe’s pledges to end fossil fuel subsidies 9
1.2. European systems for accountability in phasing out fossil fuel subsidies 10
2. Europe’s energy transition and the potential impact of fossil fuel subsidies 11
2.1. Coal phase-out 11
2.2. Falling oil and gas exploration and production 12
2.3. Tranformation of the power and transport sectors 13
3. Methodology 17
3.1. Defining subsidies 17
3.2. Subsidy types by activity 18
3.3. Subsidy types by instruments 18
4. Findings 22
4.1. Transparency 22
4.2. Findings, by instrument 22
4.3. Findings, by activity 23
5. Conclusions and high-level recommendations 31
References 33
Annex 1: List of briefs 38
Annex 2: Restrictions on coal finance by European public finance institutions (bilateral and multilateral) 39
Annex 3: Additional information on research methodology 41
Annex 4: Europe’s fossil fuel subsidies by activity and instrument 43
Annex 5: List of SOEs and public finance institutions reviewed 44

Phase-out 2020: monitoring Europe’s fossil fuel subsidies 5
Boxes
Box 1: Coal phase-out commitments across Europe 12
Box 2: EU subsidies for gas infrastructure: are they needed? 14
Box 3: Additional government support to fossil fuels through European Central Bank (ECB) bond purchases 21
Box 4: Support for transition of workers and communities 25
Box 5: Net costs to the UK government of fiscal support in the UK North Sea 26
Box 6: Fossil fuel subsidies provided in the name of Europe’s energy transition 28
Box 7: Is there potential for Europe to end fossil fuel subsidies by 2020? 32
Figures
Figure 1: Emissions from developed reserves at global level, compared to carbon budgets 12
Figure 2: Changes in drilling activity in selected key regions (July 2014-December 2016) 13
Figure 3: The changing landscape of power systems 15
Figure 4: Stages and sectors of fossil fuel production and consumption 19
Tables
Table 1: Examples of the subsidies provided to the production and consumption of fossil fuels 20
Table 2: Subsidies to fossil fuel production and consumption (see also Annex 4) by instrument (million Euros, 2014-16
average) 23
Table 3: Annual fiscal support for fossil fuel production and consumption, by country and at EU level (million Euros, 2014-
16 average) 24
Table 4: Annual public finance for fossil fuel production and consumption (domestic and within Europe), by country and at
EU level (million Euros, 2014-16 average) 24
Table 5: Annual international public finance for fossil fuel production and consumption (support provided outside the EU),
by country and at EU level (million Euros, 2014-16 average) 24
Table 6: Annual state-owned enterprise investment in fossil fuel production and consumption, by country and at EU level
(million Euros, 2014-16 average)* 24
Table 7: Europe’s subsidies to coal mining (million Euros, 2014-16 average) 25

6 Report
Table 8: Transition support for workers and communities, and towards decommissioning and rehabilitation (million Euros,
2014-2160) 26
Table 9: Europe’s subsidies to oil and gas production (million Euros, 2014-16 average) 27
Table 10: Europe’s subsidies to fossil fuel-fired electricity production (million Euros, 2014-16 average) 28
Table 11: Fiscal support provided in the name of the energy transition* 28
Table 12: Fiscal support to consumption of fossil fuels in the transport sector (million Euros, 2014-16 average) 29
Table 13: Fiscal support to consumption of fossil fuels in industry and business (million Euros, 2014-16 average) 29
Table 13: Fiscal support to consumption of fossil fuels in industry and business (million Euros, 2014-16 average) 30
Table 16: Fiscal support to consumption of fossil fuels in agriculture (million Euros, 2014-16 average) 30
Table A1: Restrictions on coal finance by European public finance institutions (multilateral) 39
Table A2: Restrictions on coal finance by European public finance institutions (bilateral) 40
Table A3: Categorization of subsidies in data sheets for presenting report findings 42
Table A4: Europe’s* fossil fuel subsidies by activity and instrument (Euro millions, annual average 2014-2016) 43
Table A5: List of state-owned enterprises (SOEs) and public finance institutions reviewed (government ownership 50% or
more) 44

Phase-out 2020: monitoring Europe’s fossil fuel subsidies 7
Executive summary
1 These 11 countries represent 83% of Europe’s energy-related greenhouse gas (GHG) emissions.
Under the Paris Agreement, European governments and the European Union (EU) are committed to a low-carbon transition, with a goal of net zero emissions by the second half of this century, while making ‘finance flows consistent’ with that pathway. If European governments are to achieve this, they must phase out their support to the production and consumption of fossil fuels.
Shifting government support away from fossil fuel production and consumption is also an important means of achieving Europe’s wider economic, social and environmental objectives. These include unlocking government resources for public goods, such as education, as part of wider fiscal reform; levelling the playing field for clean energy and energy savings; and improving public health by reducing air and water pollution.
Rhetorically at least, European governments have promised to end their support to fossil fuels. The EU and all its Member States have committed to phasing out environmentally harmful subsidies, including those to fossil fuels, by 2020. European governments have made parallel pledges to end inefficient fossil fuel subsidies under the G7 and the G20.
European governments are not on track to meet 2020 subsidies pledgeUnfortunately, European countries and EU bodies are failing to match these bold commitments, which risks undermining their decarbonisation efforts. In spite of their high-level pledges, they have no common definition for subsidy estimation, nor clear plans or timelines for phasing out these subsidies. Beyond a voluntary mechanism under the European Semester, there is no comprehensive EU-level system to monitor subsidies and hold the EU and its Member States to account for failing to address them. With only a few exceptions, European governments have done very limited reporting of their fossil fuel subsidies.
Where information was available, our research shows that governments across the region are falling behind in meeting their 2020 phase-out commitment, by continuing to provide subsidies to fossil fuels. For the period between 2014 to 2016, we identified 997 fossil fuel subsidies, provided through fiscal support, public finance, and investment by state-owned enterprises (SOEs). Of these subsidies, however, 153 (15%) could not be quantified. In
total, 11 European countries1 and the EU provided at least €112 billion in subsidies per year between 2014 and 2016 towards the production and consumption of fossil fuels. €4 billion of these subsidies came from the EU itself.
The transport sector benefited from the highest level of subsidies identified, directed towards the use of fossil fuels. Governments provided the transport sector with at least €49 billion per year in direct spending, tax breaks, and income and price support – almost half (44%) of the support for fossil fuels identified in this study. Much of this support takes the form of subsidies to diesel consumption €21 billion (43%), which has high costs for both health and the environment. Based on available data, after the transport sector, industry and business receive the most subsidies. These subsidies were estimated at nearly €15 billion per year, all through fiscal support, including tax breaks for energy-intensive industries.
Our research also found that the EU and those European governments reviewed together provided almost €7.3 billion per year in public finance to oil and gas production in Europe and overseas. This is in addition to fiscal support (€3.3 billion) and SOE investment (€2.7 billion). Germany, Italy, the UK and the EU provided the highest levels of public finance to oil and gas production.
Subsidies to fossil fuel production put Paris commitments at riskTo meet global climate objectives, which aim to avoid dangerous climate change, three quarters of known fossil fuel reserves must be left in the ground. However, European governments continue to subsidise exploration for fossil fuels, which puts Europe at serious risk of missing the goals of the Paris Agreement.
The EU budget’s research and innovation programme, Horizon2020, gave €12 million per year for shale gas-related exploration activities; and France and the UK together provided €253 million per year in public finance to fossil fuel exploration. If France continues this support it would undermine the government’s 2017 announcement that it will stop granting new licenses for oil and gas exploration.
As part of the wider support provided to oil and gas production outlined above, our research found that the key EU investment and development banks, the

8 Report
European Investment Bank (EIB) and the European Bank for Reconstruction and Development (EBRD), together provided over €2.4 billion of public finance for gas infrastructure projects inside and outside the EU. This is despite mounting evidence that demand for gas in Europe is falling, in part due to success in meeting the EU’s own energy efficiency targets.
European governments have also specifically committed to phase out subsidies to hard coal mining by 2018. However, our research revealed that at least €3.3 billion per year was provided annually in fiscal support to coal mining across the countries and institutions reviewed (including for the transition away from coal – see below). And despite pledges to end public finance to coal overseas as part of wider climate commitments, we found that €389 million was provided for coal mining internationally (including from EBRD) between 2014 and 2016. Italy, Poland and Germany provided most of this international support for coal production. European governments and the EU also continue to provide international public finance to fossil fuel production, including €1.7 billion to fossil fuel based power production overseas.
Fossil fuel subsidies may be stalling Europe’s energy transition Many European governments have committed to phasing out coal-fired power in the medium term, yet between 2014 and 2016, coal-fired power benefited from at least €2.2 billion per year in fiscal support. State-owned utility companies provided €5.7 billion in support to wider fossil fuel-based power generation, most prominently in Poland, as well as in the Czech Republic, France, Greece, Hungary and Sweden. As far as we are aware, there are no programmes in Europe to support the transition of SOEs away from fossil fuels.
Our research also found that fiscal support to fossil fuels worth €4.3 billion per year have the stated aim of facilitating the energy transition. This includes support to fossil fuels through capacity mechanisms,2 support for co-firing of biomass with coal, and the EU Emissions Trading Scheme (ETS).
How can Europe ensure a ‘just transition’ for workers, communities and vulnerable groups?
In moving away from fossil fuels, including coal, Europe recognises the vital need to ensure support for workers and communities. Of the fiscal support to coal mining identified, three-quarters – around €2.6 billion per year – are nominally to facilitate the transition away from
2 Capacity mechanism: administrative measure to ensure the achievement of the desired level of security of supply by remunerating generators for the availability of resources (European Parliamentary Research Service, 2017).
coal. This includes €313 million to support workers and communities, and €314 million for the rehabilitation and decommissioning of mining sites (with the clear majority being unspecified transition support). While this support is crucial, the burden should not fall only on governments; businesses in the sector should also take responsibility for the costs of transition.
European governments have committed to ‘provide targeted support for the poorest’ as part of their repeated G20 pledge to phase out fossil fuel subsidies. Based on available data, our research found that households received at least €6.6 billion per year, with most of that fiscal support being provided in the UK (€4.7 billion) and Italy (€1.7 billion), through tax breaks. Data was unavailable for many of the measures supporting households. Of the total number of measures identified, only half (54%) were targeted at a segment of the population (i.e. the poor and vulnerable, large families, and workers employed in specific sectors). When measures are not targeted, they can prove regressive, for example benefiting most the middle class who use more electricity and fuel.
As this study shows, governments in Europe and the EU continue to subsidise a reliance on oil, gas and coal, fuelling dangerous climate change with taxpayers’ money both at home and abroad. Despite broad agreement that fossil fuel subsidies are a problem, and a select group of European countries undertaking reform, these subsidies have proven politically difficult to eliminate. European governments must be held accountable for the fossil fuel subsidies highlighted in this report, and must seize the opportunity to end support to the fossil fuel industry once and for all.
We recommend that Europe should take the following key steps:
1. lead the G7 and the G20 by meeting its commitment to phase out fossil fuel subsidies by 2020.
2. increase transparency, with a publicly disclosed, consistent annual reporting scheme at national and European level, covering all support to fossil fuels.
3. work across EU policies to ensure that comprehensive planning, monitoring and reporting mechanisms on the fossil fuel subsidy phase-out, are integrated into Member States’ national energy and climate plans.
4. ensure international institutions funded by European governments eliminate existing subsidies for fossil fuels, and monitor reforms so that no new subsidies are established.
5. ensure that mechanisms with the stated aim of assisting the energy transition do not support fossil fuel production and consumption.
6. target any remaining subsidies to ensure a ‘just transition’ for workers and communities, and that those to households support the most vulnerable groups.

Phase-out 2020: monitoring Europe’s fossil fuel subsidies 9
1. Introduction
3 Stranded assets, in the context of greenhouse gas (GHG) emissions: fuel energy and generation resources that, at some time prior to the end of their economic life (as assumed at the investment decision point), are no longer able to earn an economic return (i.e. meet the company’s internal rate of return), as a result of changes in the market and regulatory environment associated with the transition to a low-carbon economy (Carbon Tracker Initiative (CTI), 2014).
4 Carbon lock-in: once certain carbon-intensive development pathways are chosen and capital-intensive investments are made, fossil fuel dependence and the carbon emissions that come with it can become ‘locked in’, making a transition to lower-carbon development pathways difficult and increasing the risk of exceeding climate limits (Erickson, 2015).
With the Paris Agreement on climate change coming into force in 2016, European governments not only reaffirmed their commitment to limit the increase in global average temperature to well below 2°C, they also agreed to pursue efforts to limit global temperature rise to an even more ambitious 1.5°C target (United Nations Framework Convention on Climate Change (UNFCCC), 2015). To support these objectives, they made parallel commitments to achieve zero net emissions in the second half of this century, and to make ‘finance flows consistent with a pathway towards low greenhouse gas emissions and climate-resilient development’ (UNFCCC, 2015).
If countries are to meet these commitments, at least three quarters of the existing proven reserves of oil, gas and coal will need to be left in the ground, and a shift to low-carbon energy is urgent (Intergovernmental Panel on Climate Change (IPCC), 2014).
However, Europe is already falling behind in its decarbonisation efforts by continuing to provide subsidies (including fiscal support, public finance, and state-owned enterprise (SOE) investment) to fossil fuels.
The world will not be able to avoid dangerous climate change if countries continue to rely on and support the use of fossil fuels to meet their energy needs. Governments must facilitate a shift in investment towards clean alternatives if we are to avoid stranded assets3 and carbon lock-in4 that commit us to the most dangerous levels of climate change.
Shifting government support away from fossil fuel production and consumption is also an important means to achieve other economic, social, and environmental benefits. These include unlocking government resources that could be used for public goods (such as education); creating a more level playing field for clean energy; supporting public health by reducing air pollution; and aligning carbon price signals.
Despite making various commitments, European governments have failed to develop systems that hold them to account for ending subsidies to coal, oil and gas.
1.1. Europe’s pledges to end fossil fuel subsidies Prior to the Paris Agreement, European countries had already made many commitments to end fossil fuel subsidies.
The European Commission has repeatedly called upon Member States to phase out environmentally harmful subsidies by 2020, including those for fossil fuels, and has made a commitment to remove subsidies to hard coal mining by 2018 (European Council, 2010, European Commission, 2011). The EU State of the Energy Union states explicitly that ‘technologies and resources which are being phased out or might not be sustainable in the long term should not be supported through public money’ (European Commission, 2017a).
At the international level, the EU has:
• committed to phasing out inefficient fossil fuel subsidies by 2025 through the G7 (G7, 2017)
• reiterated its commitment to phase out inefficient fossil fuel subsidies every year since 2009, as part of the G20 (G20, 2017)
• agreed to monitor developments on these commitments in future reports on the State of the Energy Union (European Commission, 2017a).
All EU countries have also committed to the Sustainable Development Goals (SDGs), which highlight ‘rationalising’ fossil fuel subsidies as a means of implementing Goal 12 to ‘ensure sustainable production and consumption patterns’ (United Nations (UN), 2015).
The objective of phasing out fossil fuel subsidies is referenced in the text of the EU-Singapore Free-Trade Agreement (awaiting final approval) which states that: ‘Parties recognise the need to ensure that, when developing public support systems for fossils fuels, proper account is taken of the need to reduce greenhouse gas emissions and to limit distortions of trade as much as possible… the Parties share the goal of progressively reducing subsidies for fossil fuels’ (European Commission, 2015, see Chapter 13, ‘Trade and sustainable development’).

10 Report
In mid-2017 the EU High-Level Expert Group on Sustainable Finance released its first report, outlining concrete steps to create a financial system that supports sustainable investments. This included a recommendation that: ‘reform of fossil fuel subsidies should be a priority’; the Multiannual Financial Framework (MFF) should give consideration to ‘explicitly excluding fossil fuels and other unsustainable projects’; and the EIB and national promotional banks should ‘ensure that investments no longer support or de-risk unsustainable investments such as fossil fuels’ (European Commission, 2017b).
In terms of subsidies through public finance institutions (such as development banks and export credit agencies), in 2013 both EIB and EBRD announced significant restrictions on international finance for coal (Doukas et al., 2017). Recently a number of European governments also announced some partial restrictions on international public finance to coal and export credits for coal-fired power projects (Doukas et al., 2017). In 2015, 29 Organisation for Economic Co-operation and Development (OECD) export credit agencies entered into an agreement to restrict financing for coal-fired power plants, which came into force in January 2017 (Doukas et al., 2017). A summary of these restrictions on coal finance at European public finance institutions (including development finance institutions and export credit agencies) is provided in Annex 2.
1.2. European systems for accountability in phasing out fossil fuel subsidies Under the Europe 2020 Strategy launched in 2010, EU Member States committed to begin developing plans for phasing out fossil fuel subsidies by 2020, with progress on implementing these plans to be monitored under the European Semester.5 However, in 2015 the decision was taken to remove the focus on energy and fossil fuel subsidies from the European Semester (Sartor et al., 2015).
Although no new system for governing the phase-out of fossil fuel subsidies has been agreed since then, the European legislators are negotiating a regulation on the Governance of the Energy Union. Various proposals by the European Commission and the European Parliament foresee monitoring and reporting on the phase-out of fossil fuel subsidies in the National Climate and Energy Planning regime (European Parliament, 2017). It is expected that agreement on this regulation will be reached in spring 2018 (Climate Action Network Europe and E3G, no date).
The EC has been sporadic in estimating and reporting on fossil fuel subsidies, with its last report released in
5 The European Semester provides a framework for the coordination of economic policies across the EU, allowing countries to discuss their economic and budget plans and monitor progress at specific times throughout the year.
6 The countries covered in this report are the Czech Republic. France, Germany, Greece, Hungary, Italy, the Netherlands, Poland, Spain, Sweden and the United Kingdom. Emissions data is from CAIT Climate Data Tracker, based on CO2 emissions in 2013 (WRI, 2015)
2014 (that includes data up to 2012) and with no plans to update this information (Alberici et al., 2014).
While European countries and public finance institutions have all made pledges to shift away from supporting high-carbon investments, no restrictions have been put in place to limit investment in fossil fuel production by European SOEs both at home and abroad. Nor have any accountability measures been introduced to monitor the extent of such investments.
This lack of accountability for meeting commitments comes despite a recent Commission Report on Energy prices and costs, which emphasises that ‘fossil-fuels [sic] subsidies are particularly problematic, as they disadvantage clean energy and hamper the transition to a low-carbon economy’, and that ‘the recent relative fall in energy prices should make it easier for governments to remove tax exemptions and other energy demand subsidies’ (European Commission, 2016).
Despite significant commitments by European governments, not only has there been limited action, but also no mechanisms have been put in place by the EU, nor its institutions, nor its Member States, for defining and documenting the full extent of fossil fuel subsidies, and therefore holding themselves to account in achieving those pledges.
To that end, the Overseas Development Institute (ODI), CAN Europe and Green Budget Germany have sought to identify and estimate the value of ongoing government support to oil, gas and coal across 11 European countries (which together account for 83% of Europe’s greenhouse gas (GHG) emissions)6 and by the EU budget, its financial instruments and policies, the EIB and the EBRD.
Chapter 2 examines the status of Europe’s energy transition, and the role that fossil fuel subsidies may be playing in acting as barriers to this transition. Chapter 3 sets out the methodology used in this report to identify and estimate fossil fuel subsidies as well as raising issues of data transparency. Chapter 4 outlines key findings in terms of levels of transparency in subsidy reporting. It also explores findings by instrument (fiscal support, public finance and SOE investment), by activity (coal mining, oil and gas production, electricity, transport, industry and business, agriculture, and households). The chapter also highlights key issues such as new support measures to fossil fuel exploration, subsidies to fossil fuels in the name of the energy transition, Europe’s support for fossil fuels overseas, and the balance of support going to workers, communities and vulnerable groups. Finally, Chapter 5 sets out conclusions and recommendations.

Phase-out 2020: monitoring Europe’s fossil fuel subsidies 11
2. Europe’s energy transition and the potential impact of fossil fuel subsidies
7 There have been critiques of the IEA 450 Scenario, used for this analysis, as it is based on a weak goal of a two-in-three chance of staying below 2°C (for more details see Oil Change International, 2016a).
Driven by decarbonisation objectives and policies, as well as a sharp reduction in the cost of clean technologies, countries across Europe and other regions around the world are going through a significant energy transition. This chapter describes this encouraging process in several key areas: phasing out coal; falling oil and gas production; dramatic increases in the share of renewables; and the electrification of cars. It also highlights where, despite this progress, governments continue to provide subsidies to the consumption of fossil fuels, and how they may act as barriers to or delay each of these transitions.
2.1. Coal phase-outThe International Energy Agency (IEA) estimates that to keep global temperature rise well below 2°C7, coal-fired power plant emissions in Europe must fall by 80% to 2030 and more than halve globally (IEA, 2016). Moreover, Climate Analytics has estimated that a full coal phase-out by 2030 will be the cheapest way for Europe to meet the 1.5°C target, and that Europe should replace this capacity with renewables and energy efficiency measures (Rocha et al., 2017). Germany and Poland have the most work to do on this coal phase-out, as they are jointly responsible for 51% of installed coal capacity and 54% of coal emissions in Europe (Rocha et al., 2017).
A coal phase-out is not only vital in terms of the climate, but also for helping to improve air quality in Europe. Air pollution is the single largest environmental cause of premature death in the urban parts of the continent. Emissions from coal plants are partly responsible for this, with around 23,000 early deaths every year due to respiratory illnesses caused by coal burning (Jones et al., 2016). In February of 2017, the European Commission
ruled that 23 EU countries have been breaking air quality laws, through emissions from vehicles, power plants, smelting and refuse burning (Crisp, 2017).
There has been some progress. Driven by decarbonisation objectives and policies, as well as a sharp reduction in the cost of renewable energy technologies, electricity markets across Europe and other regions around the world are going through significant transformation (van der Burg and Whitley, 2016). A recent study has found that 92 gigawatts (GW) of coal plant capacity was halted in the EU between 2010 and 2016, with only 25 GW implemented over the same period (Shearer et al., 2017).
This trend should be further supported by the stricter emissions limits that the European Commission has recently put in place, and which will have to be met by 2021. These limits will apply to all coal-fired power stations (amongst other emitters) and may lead to coal plant closures (Euractiv, 2017a; European Environmental Bureau (EEB, 2017; European Commission, 2017c). More importantly, several governments have already achieved a full coal phase-out, or have committed to end coal-fired power between 2023 and 2030 (see Box 1). The power sector is also responding. In 2015, Italy’s largest utility, Enel, has recently pledged to close three of its coal plants by 2020 and gradually to end investments in coal, to become carbon neutral by 2050 (Enel, 2015; Greenpeace, 2015).
Despite these steps in the right direction, subsidies to coal mining and coal-fired power continue to be provided across Europe. And while support to coal mining has declined in recent years, new subsidies to coal-fired power risk extending the life of assets (e.g. power plants, coal mines etc.). This is exemplified in the case of two coal-fired power plants in Spain, which the Chief Executive of the

12 Report
utility company Endesa has said are likely to close when indigenous coal mining subsidies expire in 2018 (in line with EU rules) unless the government intervenes (Endesa, 2017).
8 The authors note that ‘with just 18% of the world’s population, industrialized countries have accounted for over 60% of emissions to date, and possess far greater financial resources to address the climate problem. Most early closures should therefore take place in industrialized countries, beginning with (but not limited to) coal’ (OCI, 2016c).
2.2. Falling oil and gas exploration and productionRecent analysis has estimated that the reserves in oil and gas fields currently in operation, even without coal, would take the world beyond 1.5°C – the threshold of temperature rise at which the worst impacts of climate change can be avoided (Oil Change International (OCI), 2016c) (see Figure 1). Based on these findings, to meet climate commitments no new fossil fuel extraction or transportation infrastructure should be built, and some early closure of existing operations will be required.8
These findings run counter to the narrative of some European governments and institutions, that new natural-gas investments are needed for it to be a `bridging fuel’ in the low-carbon European energy transition (Stern, 2017; Energy Visions, 2015). Given current policies, and the required low-carbon technology paths that should evolve in Europe, there may be less than a 15-year window before carbon reduction commitments dictate a rapid and unstoppable decline in the use of natural gas (Stern, 2017; McGlade et al. 2016).
Several drivers are already leading to a decline in both investments and resulting oil and gas production, both in Europe and globally (see Figure 2, overleaf). This fall in investment is due to forecasts of sustained low oil and gas prices, driven by growth of the US shale-gas industry; failure of the Organization of the Petroleum Exporting Countries (OPEC) to cut production; weakening global demand – particularly in Asia; and the Paris Agreement on climate change (Reuters, 2017; International Association
Box 1: Coal phase-out commitments across Europe
Many countries and regions in Europe have already ended the use of coal-fired power, including Belgium, Cyprus, Luxembourg, Malta, Scotland and the Baltic countries.
In addition, a number have already announced their intention to phase out coal in the electricity sector in future decades:
• France – by no later than 2023 • the UK and Ireland – by 2025, with Austria and
Denmark also likely to end coal use by around 2025
• Sweden – within the next decade • Finland and Portugal – by 2030.
Also, despite not including any deadline for coal phase-out, the German Climate Action Plan 2050 does comprise a target that comes close to halving emissions from the power sector between 2014 and 2030.
Sources: DeSmogBlog, 2016; Rocha et al., 2017; Madson, 2017; Littlecott, 2017
1200
1000
800
600
400
200
0
Carbon budgetCoal
Oil, proven
Land use CementOil, probable Gas, proven Gas, probable
1.5 ˚c2 ˚cDeveloped reserves
1.5 ˚c limit
2 ˚c limit
Gt C
02
Source: Oil Change International, 2016b
Figure 1: Emissions from developed reserves at global level, compared to carbon budgets

Phase-out 2020: monitoring Europe’s fossil fuel subsidies 13
of Oil and Gas Producers (IOGP), 2016). Listed upstream oil and gas producers face particular challenges due to the limited availability of low-cost fossil fuel reserves, competition from SOEs, and the improvements in vehicle efficiency and changing transport modes that are reducing demand for transport fuels (see Section 2.3), which are already stranding assets in the industry (IRENA, 2017). High-cost areas such as those in Europe have been particularly affected by these changes, as over 50% of the EU’s natural gas continues to be sourced from countries within Europe (IOGP, 2016).
A move away from oil and gas production both within Europe and beyond may be further influenced by the emergence of bans to exploration and specific activities in several countries and regions. The government of Costa Rica extended its ban on oil and gas exploration and extraction through 2021, and the Macron government in France has announced it will stop granting new licenses for oil and gas exploration (Tico Times, 2014; France24, 2017). France has also banned fracking, alongside Germany, Ireland, Bulgaria, Scotland and Wales (in the UK), and a number of US states and Canadian provinces (Wikipedia, 2017; Irish Times, 2017). Development finance institutions including the Asian Development Bank (ADB) and the African Development Bank (AfDB) have restrictions on finance for oil and gas exploration activities. These restrictions are motivated by non-climate risk factors, including financial risk, and the status of oil and gas as international commodities that do not require concessional finance (Doukas et al., 2017).
Nonetheless, European governments and EU institutions continue to support oil and gas production both at home and abroad. In Europe, significant investments in new gas
pipelines and liquefied natural gas (LNG) ports have been initiated, planned and proposed, under the auspices of security of supply (Climate Action Tracker, 2017). These proposals come even though the overall utilisation rate of existing LNG ports is close to 25%, with many ports remaining unused (Climate Action Tracker, 2017).
Recent analysis has shown that in many cases it is subsidies that keep investment in oil and gas exploration and production afloat despite increasingly adverse market conditions. Examples include projects in Alaska and the Russian Arctic that would not have gone ahead without tax breaks (Gerasimchuk et al., 2017). Recent analysis also shows that nearly half the US oil and gas yet to come into production would not be commercially viable without fossil fuel subsidies at US$50 a barrel (Erickson et al., 2017). In Europe the UK’s North Sea provides one of the primary examples of the role of fossil fuel subsidies in pushing forward investments that would otherwise be unviable – with significant costs to government budgets. Gas infrastructure (pipelines and storage) also receives significant financial support from EU financing sources, such as the current EU’s long-term budget, the Multiannual Financial Framework 2014-2020, the EIB or the European Fund for Strategic Investments (EFSI) managed by the EIB (see Box 2, overleaf).
2.3. Tranformation of the power and transport sectors Electricity markets across Europe, as in other regions around the world, are going through significant transformation, which is affecting other sectors such as industry and transport. This includes a rapid increase
-70
-60
-50
-40
-30
-20
-10
0
10
20
30
40
Abu
Dhab
i
Saud
i Ara
bia
Kuw
ait
OmanQata
r
Asia
Pac
ific
Euro
pe
Afric
a
Latin
Am
eric
a
North
Am
eric
a
Chan
ge in
dril
ling
activ
ity (%
)
Figure 2: Changes in drilling activity in selected key regions (July 2014-December 2016)
Source: IEA, 2017
14 Report
in the share of renewable, often decentralised electricity production, driven by decarbonisation9 objectives and policies and a sharp reduction in the cost of renewable energy technologies (van der Burg and Whitley, 2016). Another factor that is contributing to the shifting landscape of electricity markets is the availability of innovative, low-carbon solutions to balance demand and supply (Figure 3, overleaf, provides an illustration of the changing landscape of power systems).
In 2015, renewables accounted for 29%10 of electricity production across the EU, up from 13% in 1990, with large variations between EU Member States (Eurostat, n.d.). Between 2005 and 2015, wind power generation more than quadrupled and solar electricity generation grew by a factor of 37 (Eurostat, n.d.). Variable renewable energy sources already make up a significant share of
9 For the EU to achieve its target of an 80%-95% reduction in GHG emissions by 2050, the power sector will need to reach full decarbonisation, with deep reductions also needed in heating and cooling (Hewicker et al., 2011; European Commission, 2011; Euractiv, 2017b).
10 While hydropower still accounts for the largest share of renewable electricity production, its share has declined sharply from 94% in 1990 to 38% in 2015 – a fall linked to the rapid growth in biomass and in variable wind and solar power (Eurostat, 2015b).
11 Driven by economic slowdown, mild weather and improvements in energy efficiency, demand for electricity in Europe dropped 3.3% between 2008 and 2013 (Gray et al., 2015). Forecasts for future electricity demand in the EU vary substantially. ENTSO-E forecasts electricity demand to increase by 0.8% annually between 2016 and 2025, based on the highest electricity demand forecasts of the different system operators (ENTSO-E, 2015). Carbon Tracker Initiative forecasts electricity demand to continue to decline by 0.3% from 2014 to 2030 (Gray et al., 2015).
electricity production in some countries. In Spain, for example, renewables met 66% of electricity demand in 2015 (Eurostat, n.d.).
Alongside, and linked to, the rise in renewables, a significant share of gas- and coal-fired power generation capacity has been retired in several European countries (IRENA, 2017). This has been driven by four key factors across the region (van der Burg and Whitley, 2016):
• success in support for renewable electricity production technologies and a fall in their costs
• a widespread drop in electricity demand11
• a significant number of coal- and gas-fired power plants in the region reaching the end of their operational lives
• environmental policies leading to the phase-out of high-emitting plants.
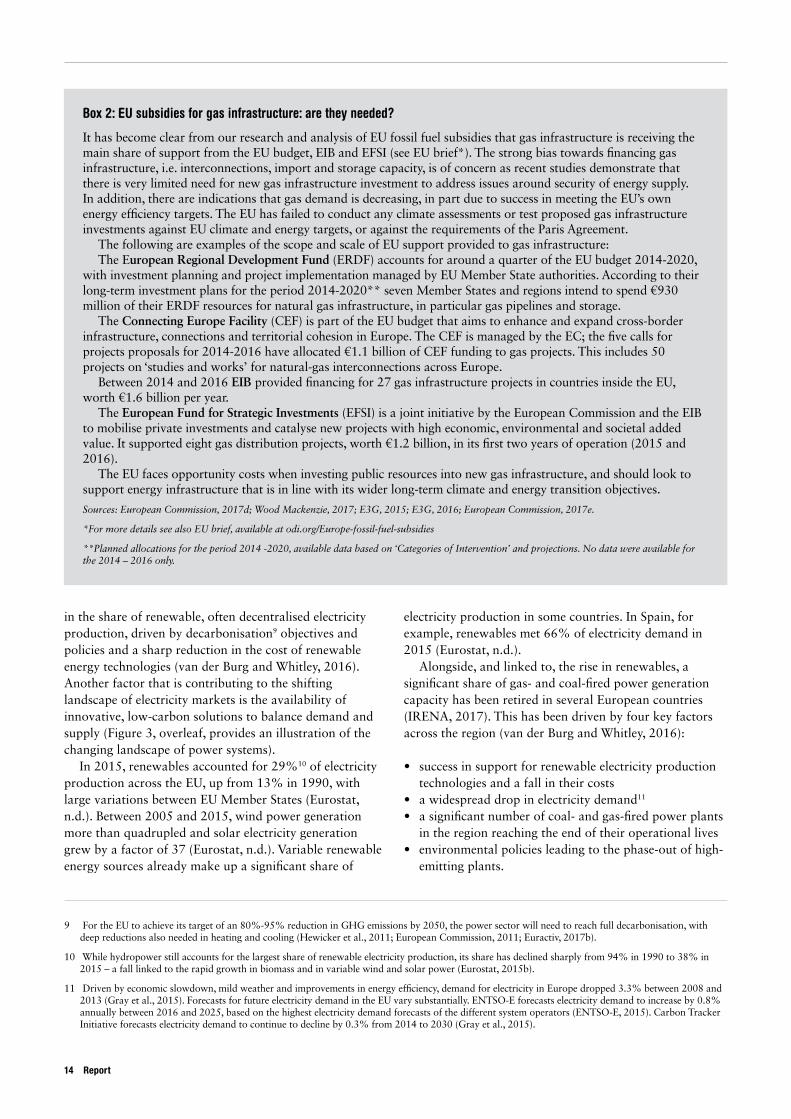
Box 2: EU subsidies for gas infrastructure: are they needed?
It has become clear from our research and analysis of EU fossil fuel subsidies that gas infrastructure is receiving the main share of support from the EU budget, EIB and EFSI (see EU brief*). The strong bias towards financing gas infrastructure, i.e. interconnections, import and storage capacity, is of concern as recent studies demonstrate that there is very limited need for new gas infrastructure investment to address issues around security of energy supply. In addition, there are indications that gas demand is decreasing, in part due to success in meeting the EU’s own energy efficiency targets. The EU has failed to conduct any climate assessments or test proposed gas infrastructure investments against EU climate and energy targets, or against the requirements of the Paris Agreement.
The following are examples of the scope and scale of EU support provided to gas infrastructure:The European Regional Development Fund (ERDF) accounts for around a quarter of the EU budget 2014-2020,
with investment planning and project implementation managed by EU Member State authorities. According to their long-term investment plans for the period 2014-2020** seven Member States and regions intend to spend €930 million of their ERDF resources for natural gas infrastructure, in particular gas pipelines and storage.
The Connecting Europe Facility (CEF) is part of the EU budget that aims to enhance and expand cross-border infrastructure, connections and territorial cohesion in Europe. The CEF is managed by the EC; the five calls for projects proposals for 2014-2016 have allocated €1.1 billion of CEF funding to gas projects. This includes 50 projects on ‘studies and works’ for natural-gas interconnections across Europe.
Between 2014 and 2016 EIB provided financing for 27 gas infrastructure projects in countries inside the EU, worth €1.6 billion per year.
The European Fund for Strategic Investments (EFSI) is a joint initiative by the European Commission and the EIB to mobilise private investments and catalyse new projects with high economic, environmental and societal added value. It supported eight gas distribution projects, worth €1.2 billion, in its first two years of operation (2015 and 2016).
The EU faces opportunity costs when investing public resources into new gas infrastructure, and should look to support energy infrastructure that is in line with its wider long-term climate and energy transition objectives.
Sources: European Commission, 2017d; Wood Mackenzie, 2017; E3G, 2015; E3G, 2016; European Commission, 2017e.
*For more details see also EU brief, available at odi.org/Europe-fossil-fuel-subsidies
**Planned allocations for the period 2014 -2020, available data based on ‘Categories of Intervention’ and projections. No data were available for the 2014 – 2016 only.

Phase-out 2020: monitoring Europe’s fossil fuel subsidies 15
TRADITIONAL POWER SYSTEM
GENERATIONTRANSMISSION
DISTRIBUTION
DISTRIBUTIONAUTOMATION
DEVICES
Power Station Power Transformer Transmission substation
Distributionsubstation
Storage
RESIDENTIALCONSUMERS
COMMERCIAL AND INDUSTRIAL BUSINESS
CONSUMERS
FUTURE POWER SYSTEM
GENERATIONTRANSMISSION
DISTRIBUTION
RESIDENTIALCONSUMERS
COMMERCIAL AND INDUSTRIAL BUSINESS
CONSUMERS
Power Station Power Transformer Transmission substation
StorageStorage
Solar PV power plant
Solar PV power plant
Solar PVpower plant
DISTRIBUTIONAUTOMATION
DEVICES
Wind power plant
Wind power plant
Distributionsubstation
Figure 3: The changing landscape of power systems
Source: van der Burg and Whitley, 2016

16 Report
These changing conditions are already altering utility business models in Europe. Since 2011, power companies have written down12 over US$130 billion of assets, reflecting unprofitable market conditions for thermal generation, which accounted for around half the total losses (IEA, 2017). In response, Germany’s large power generators E.ON and RWE announced in 2016 that they would split off their conventional power production from their businesses focused on renewables13 (Chazan, 2016).
At the same time, electrification of road transport will be necessary to meet decarbonisation objectives (European Commission Directorate-General for Economic and Financial Affairs (ECFIN), 2015). In 2016, for the first time, it was confirmed that transport is the biggest source of GHG emissions in Europe (Transport and Environment, 2016). In Europe, a deep transformation of the automotive sector is being prompted primarily by concerns about emissions of harmful gases and particulate matter from road transport, with the recent diesel scandal involving car companies cheating on emissions testing elevating the issue significantly. This has led to calls for stricter regulations and greater government incentives for cleaner alternatives, including electric vehicles (IEA, 2017). In July 2017, both France and the UK announced plans to ban new petrol and diesel cars and vans from 2040. This follows on from India and Norway setting even more ambitious targets (2030 and 2025 respectively). In addition, at least 10 other countries have electric car sales targets in place, including Austria, China, Denmark, Germany, Ireland, Japan, Korea, the Netherlands, Portugal and Spain (CNN, 2017). However, these targets are being undermined by ongoing subsidies to diesel and other fossil fuel use in cars.
Analysis by UBS has estimated that the cost of owning an electric car will draw level with that of a traditional combustion engine vehicle as early as next year in Europe (Financial Times, 2017). These developments will have impacts beyond car manufacturing, including for
12 A write-down is a reduction of the recognized value of something. In accounting, this is a recognition of the reduced value of an asset.
13 Both RWE and E.ON have divided themselves in two, creating the entities Innogy and Uniper respectively. RWE and Uniper have the old gas- and coal-fired power stations, while Eon and Innogy hold the clean, green businesses such as infrastructure and renewables (Chazan, 2016).
14 Capacity mechanism: A mechanism that rewards market participants for available capacity, on top of revenues generated by selling electricity in the wholesale market. These payments are meant to ensure security of supply by incentivising sufficient investment in new capacity or preventing the retirement of existing capacity (van der Burg and Whitley, 2016)
power infrastructure (e.g. charging, intelligent sensors and computation) (IRENA, 2017). World investment in publicly available fast electric vehicle (EV) chargers grew an impressive seven-fold in 2016, with EV chargers further supporting much-needed increases in the flexibility and digital management of electricity supply and demand (IEA, 2017).
Despite these important early signs of transition to fossil-free energy systems, European governments have often used the energy transition as a justification for extending and introducing new fossil fuel subsidies. For example, a number of measures with a stated objective of supporting the transition to lower-carbon sources of power are in fact facilitating the use of coal. This includes subsidies provided via capacity mechanisms,14 support to biomass power, and EU ETS (Whitley et al., 2017) (see Box 6 in Chapter 4).
In the transport sector, some diesel subsidies were established with the stated aim of cutting CO2 emissions in most countries across the EU as well as other parts of the world (European Commission, 2017f). For example, in 2001, the UK government cut fuel duty on diesel vehicles as a deliberate attempt to encourage people to switch (Guardian, 2017). Similarly, in Italy the tax rate applied to diesel is 23% lower than the rate for petrol (Italian Ministry of Environment, 2016).
Whether intentionally or not, these subsidies are now paying polluters, slowing the energy transition, and providing a lifeline to high-carbon assets. Support to coal, oil and gas by European governments and institutions continues, even though the phasing out of these subsidies is widely agreed to be critical for the energy transition, and to ensure financial and economic sustainability, fight air pollution and achieve climate targets. Tracking these subsidies to support their phase-out presents an opportunity for Europe to demonstrate leadership both at home and abroad.

Phase-out 2020: monitoring Europe’s fossil fuel subsidies 17
3. Methodology
15 Subsidies found for peat were classified as ‘multiple or unclear’ as they were not one of the three main fossil fuel types examined in this report.
16 These countries (the Czech Republic, France, Germany, Greece, Hungary, Italy, the Netherland, Poland, Spain, Sweden, and the United Kingdom) together make up 83% of Europe’s GHG emissions.
17 The EU does not have a definition for fossil fuel subsidies, but defines state aid (or subsidies) as ‘an advantage in any form whatsoever conferred on a selective basis to undertakings by national public authorities’ (European Commission, 2016).
This report reviews subsidies for the production and consumption of coal, oil and gas,15 and associated infrastructure (see Figure 2) by 11 European countries16
and key European institutions, provided between 2014 and 2016. The report summarises findings from 11 parallel country briefs and an EU brief, all with accompanying data sheets that list all the identified support.
Our aim is to outline opportunities for regular tracking of fossil fuel subsidies by European governments and the EU, to support increased transparency and accountability so that the EU and its Member States can meet their subsidy phase-out commitments.
This chapter outlines the definitions used to identify subsidies. It also highlights some of the difficulties in finding publicly available and comparable information on fossil fuel subsidies, and explains the approaches used in our analysis to address these challenges. In order for European governments to be held to account for phasing out fossil fuel subsidies, more transparent and comparable information is urgently required.
All the support from EU institutions and European governments in this report was estimated using an inventory approach. This bottom-up method is highly detailed and reveals potentials for reform and policy change, because it focuses on individual policies and instruments. It captures the value of government programmes and investments benefiting a sector, whether these benefits end up with consumers (as lower prices), producers (through higher revenues) or resource owners (through higher rents). This approach is usually employed to estimate the costs of specific policies and support measures, and can serve as a basis for policy evaluation.
3.1. Defining subsidiesAlthough European governments have made various commitments to eliminate fossil fuel subsidies, they have not set a definition for these subsidies. Individual countries and international organisations use different definitions17 and include different types of subsidies in their current estimates (International Institute for Sustainable Development (IISD), n.d.; Bast et al., 2015). For example:
‘The UK defines fossil fuel subsidies as government action that lowers the pre-tax price to consumers to below international market levels’ – a definition which excludes the subsidies directed towards fossil fuel production (UK Department of Energy and Climate Change (DECC), 2015).
There is, however, an internationally agreed definition of subsidies. In its Agreement on Subsidies and Countervailing Measures (ASCM), the World Trade Organization (WTO) defines a subsidy as ‘any financial contribution by a government, or agent of a government, that is recipient-specific and confers a benefit on its recipients in comparison to other market participants’ (WTO, 1994).
This definition includes:
• direct transfer of funds (e.g. grants, loans and equity infusion), and potential direct transfers of funds or liabilities (e.g. loan guarantees)
• government revenue that is otherwise due, foregone or not collected (e.g. fiscal incentives such as tax credits)
• government provision of goods or services other than general infrastructure, or purchase of goods, below market-value
• income or price support.This report uses this definition, which has been accepted
by the 153 member states of the WTO, as the basis for identifying subsidies to the production and consumption of coal, oil and gas, and associated infrastructure.
Based on the categories under the WTO definition of subsidies, this report divides subsidies towards fossil fuels into three categories (see also Section 3.3 below):
• ‘fiscal support’, such as direct spending by government agencies, tax breaks, and income or price support
• ‘public finance’, including support from domestic, bilateral, EU and multilateral international agencies through the provision of grants, loans, equity and guarantees
• ‘investment by SOEs’, both domestically and within the EU, and internationally (outside the EU).

18 Report
This report provides ‘fiscal support’ estimates separately from the data collected for ‘public finance’ and ‘SOE investment’ because understanding the share of these that constitutes a subsidy (including comparisons with other market participants and market values) requires information that is not publicly available.
Despite these data gaps, it is critical to track government support through public finance and SOE investment. This is because governments exert significant control over these channels of support for fossil fuel production and consumption, and have the potential to set different objectives for public finance and SOE investment as part of the wider energy transition.
The limited transparency and the difficulty in accessing comparable information create significant barriers to estimating fossil fuel subsidies. The following section lays out the specific challenges in identifying and quantifying fossil fuel subsidies, and the methods used in this report to overcome them.
For information on the timeframes covered in our analysis, currency conversions used and other technical considerations in collecting and recording the data, see Annex 3.
3.2. Subsidy types by activityThis report reviews subsidies to fossil fuel production and consumption (including subsidies to infrastructure).
For this report the stages of fossil fuel production include: exploration, access and appraisal; development, extraction and preparation; transition support (for workers and communities); and decommissioning and rehabilitation.
The report also reviews subsidies to different types of fossil fuel infrastructure to support energy generation and fossil fuel production and distribution, including power plants; pipelines and storage; grid; and heating.
The main sectors identified where support is provided for consumption of fossil fuels are: transport; industry and business (including companies and other commercial enterprises); households; and agriculture.
Figure 4 (overleaf) outlines the stages and sectors of fossil fuel production and consumption, and Table 1 (overleaf) gives examples of subsidies provided in each. For further information on how subsidies have been classified by activity for the report’s analysis, see Annex 3.
3.2.1. Activities excluded from subsidy totalsThis report has limited coverage of the following stages of fossil fuel production and sectors of fossil fuel consumption. These activities are discussed in the country briefs, but not included in the country data sheets or subsidy totals.
• Transport infrastructure. In this analysis, we have not included subsidies to transport infrastructure including
rail, road, ports (shipping), and airports (aviation), as this infrastructure can also be used for non-fossil fuel-powered transport (e.g. electric vehicles and trains), and may support a wider range of activities (such as commercial businesses operating at airports).
• Distribution of fossil fuel-based electricity. This often takes place through grid systems that are also distributing non-fossil fuel-based electricity (nuclear, wind, solar etc.). Where information on the share of fossil fuels in the grid was available, we did pro-rata calculations (based on the share of fossil fuels in the country’s electricity) to include this support. However, where this information was unavailable, we left the entire subsidy measure out of the data, so as not to be overestimating the support received by fossil fuels.
• Plant construction, operation and distribution for petrochemicals. This use of fossil fuels has a much smaller impact than burning them to provide energy services, therefore coverage of these activities is limited.
3.3. Subsidy types by instrumentsAs outlined above this report reviews three types of fossil fuel subsidies: fiscal support, public finance and SOE investment.
3.3.1. Fiscal support (including sub-national fiscal support)Fiscal support is provided by national and sub-national governments, and through the EU’s budget. Fiscal support is divided into three categories in this report: budget expenditure (e.g. direct spending on R&D for fossil fuel exploration), tax exemptions (e.g. tax breaks for diesel use in transport), and price and income support (e.g. provision of electricity at a lower price for specific groups or sectors, such as households or industry). Fiscal support provided at the sub-national or state level is also covered in this report. However, such information is difficult to access, and therefore it is likely that our findings are not fully comprehensive regarding sub-national information.
Sources of information In most cases, the value assigned for fiscal support is reported by the government sources (such as budgets, Ministry of Finance reports, or regular inventories), in the OECD Inventory of Support Measures for Fossil Fuels 2015 and the Companion to the inventory (OECD, 2015), or by an independent research institution (such as local or international think tanks).
Country comparisonIt can be challenging to draw a direct comparison of fiscal support values between countries. As the OECD emphasises in its Companion to the Inventory of Support Measures for Fossil Fuels, a significant proportion of fiscal support takes the form of tax expenditures that

Phase-out 2020: monitoring Europe’s fossil fuel subsidies 19
are calculated using a country’s benchmark tax regime. Because this can vary widely by country, tax expenditure estimates are not readily comparable across countries (OECD, 2015). Higher reported tax expenditures for some countries may reflect higher levels of taxation or greater transparency in reporting, rather than a higher level of support (ibid.). Nevertheless, an examination of the variation across the fiscal support provided can still offer a useful overview of the extent to which different countries prioritise fossil fuel production and consumption, and of where this information might be used for comparisons with support provided to other parts of the energy sector and other sectors across the economy.
3.3.2. Public financeThis report reviews public finance support for fossil fuels: where governments provide support for, and take on liability for, fossil fuel production via financial institutions they own outright or in which they hold a majority stake (50% or more). These include institutions such as bilateral development banks, export credit agencies and majority state-owned banks, which provide public finance in the form of grants, loans, equity, insurance and guarantees both domestically and internationally. Investments by public finance institutions are backed by the government, through direct investment using public funds and through creditworthiness. The resulting high credit ratings of these publicly owned financial institutions can reduce the risk to parallel private investors. This leverage effect is the fundamental rationale for public investment in several sectors (i.e. to act or invest in areas where the private sector is reluctant to do so). A list of all the public finance institutions identified in the analysis for this report can be found in Annex 5.
Sources of information This report includes data on support provided by public finance to specific fossil fuel projects, from information made publicly available by majority government-owned financial institutions, OCI’s ‘Shift the Subsidies’ database, public finance institutions, the Infrastructure Journal (IJ) Global database (IJ Global, 2015; OCI, 2017), and other public sources of information (such as news articles from reliable sources). The data on public finance to fossil fuels is presented in two parts: public finance provided by a given government both domestically and in other European countries; and public finance provided internationally (outside of Europe).
3.3.3. Investment by State-owned Enterprises (SOEs)A number of the European countries covered in this report support fossil fuel production through one or more SOEs, where the government is a majority stakeholder (50% or more). The wide variety of ways in which SOEs function can have a range of impacts on government budgets, with a number of SOEs depending on budget transfers to remain in operation (International Monetary Fund (IMF), 2013; Sdralevich et al., 2014). Moreover, majority government ownership of SOEs provides a degree of effective control and government involvement in decision-making and financing. While this will vary by country and institution, the impact is nonetheless significant (Bast et al., 2015). Sub-national SOEs were not included in this analysis, due to challenges in accessing data for most countries, and in order to be consistent across the analysis. A list of all the state-owned enterprises identified in the analysis for this report can be found in Annex 5.
Development, extraction and preparation
Access, explorationand appraisal
Development, extraction and preparation
Coal Decommissioning and transition
Decommissioning and transition
Access, explorationand appraisal
Construction andoperation of plant
Construction andoperation of plant
Production
ProductionOil and gas
Consumption
Consumption
Business andIndustry Households
Transport(excluding
infrastructure)Business and
Industry Households Agriculture
Distribution toconsumers
Distribution toconsumers
Figure 4: Stages and sectors of fossil fuel production and consumption
Source: Authors’ elaboration.

20 Report
Production
Coal mining
Budget support for research, development and demonstration (RD&D) for exploration technologies and processes, and for field development
Budget support and SOE investment on mine development activities
Price support (i.e. direct payments to producers, linked to the market price of fossil fuels)
Government-provided insurance and indemnification for risks and damages such as pollution
Early retirement payments for coal miners through government budgets
Government assumption of liabilities or spending on mine decommissioning
Oil and gas production
Concessional loans to exploration companies, including for exploration equipment, from national and multilateral development banks
Tax deductions for the field development phase
Fiscal support (including budget support and tax breaks) and SOE investment on field development activities
Government-regulated price of feedstock (oil, gas and coal) for refining and processing
Tax and royalty exemptions linked to amount of fuel produced
Government, multilateral development banks or EU budget spending on oil and gas pipelines, interconnectivity and storage infrastructure
Government loans to fossil-fuel extracting companies to cover liabilities of field decommissioning
Early retirement payments for oil and gas through government budgets
Electricity
Grants and tax breaks for the construction of plants for heat and electricity generation and refineries
Relief on property taxes and charges for land, water use and pollution for processing facilities and power plants
Government-regulated price of feedstock (oil, gas and coal) for electricity and heat generation
Investment by SOEs in plant operation and modernisation (domestically and internationally)
Capacity payments to fossil fuel-fired power plants
Fiscal support (including budget support and tax breaks) or SOE investment in grid infrastructure for fossil fuel-powered electricity
Consumption
Transport (excluding infrastructure)
Energy tax relief for public transportation
Tax breaks for diesel or other fuel sources
Company car tax breaks
Tax breaks for airlines
Energy tax exemption for fuels used in aviation
Energy tax exemption for shipping
Energy tax exemption for fuels used in internal waterway transportation
Business and industry
Energy tax relief for energy-intensive processes
Tax relief for specific processes
Energy tax relief for LPG and natural gas used in engines
Households
Energy tax breaks for household heating and electricity
Budget support for new gas boilers
Direct aid to poor families (e.g. coal)
AgricultureEnergy tax breaks for agriculture
Rebates on diesel fuel tax in agriculture, horticulture, farming and inland fisheries.
Table 1: Examples of the subsidies provided to the production and consumption of fossil fuels
Source: Authors

Phase-out 2020: monitoring Europe’s fossil fuel subsidies 21
Sources of information Data was collected from SOE annual reports and government documents (where available), and other public sources such as news articles from reliable sources. In some of the countries covered in this report, publicly available information on how much government support is provided towards SOEs, is very limited. This limited transparency and the vertically integrated structure of many SOEs makes it challenging to identify the specific sub-component of SOE investment that constitutes a subsidy. As a result, this report provides data on total investment by SOEs in fossil fuels, recorded on a yearly basis (where this information is made available by the company).
3.3.4. Instruments excluded from this analysisIn certain cases government support to fossil fuels comes in the form of monetary policy, rather than the fiscal instruments outlined above under fiscal support. Further analysis and greater data availability would be required to determine the scale of support from the following
instruments, and therefore they have not been included in this analysis.
Bond purchases of the European Central Bank (ECB) and other central banks at national level: bond puchases, as part of wider quantitative easing programmes, often benefit fossil fuel companies, because the artificial demand created by the central banks, among other things, raises asset prices and lowers the companies’ cost of borrowing. Such support is not covered in this analysis but its significance is discussed further in Box 3.
Payouts in investor-state disputes: the risk of stranded assets from fossil fuel infrastructure can result in large financial claims, and associated legal costs, by their investors. For example, in 2016, a UK fossil fuel company sued the government of Italy for compensation after the latter banned offshore drilling in view of earthquake-associated risks (The Times, 2017). While such costs have not been included in this analysis, they must also be monitored and declared by governments as part of a full inventory of support measures provided to the fossil fuel industry.
Box 3: Additional government support to fossil fuels through European Central Bank (ECB) bond purchases
Our definition of subsidies does not cover ECB bond purchases, therefore it is not included in our analysis. It is worth noting, however, that European governments are also supporting fossil fuels through ECB bond purchases as part of wider quantitative easing programmes.
ECB is the central bank of the 19 EU Member States that have adopted the Euro. Its main task is to maintain price stability in the Euro area and so preserve the purchasing power of the single currency.
In June 2016 the ECB, as part of its ‘quantitative easing’ programme, began buying corporate bonds to provide money to corporations. Under this Corporate Sector Purchase Programme (CSPP), by June 2017 ECB had bought 950 corporate bonds from around 200 issuer groups, worth €92 billion. Among the corporations ECB invested in are oil and gas majors Shell, Total, Eni and Repsol. ECB has also used CSPP to invest in other high-carbon stocks such as oil trader Glencore and car manufacturer Volkswagen.
Recent analysis by the Corporate Europe Observatory shows that car manufacturers, oil and gas companies, energy companies and motorways account for 107 of the 271 different bonds bought between December 2016 and June 2017.
The ECB does not disclose how much money has been invested in each corporation. Corporations benefiting from the programme can use the revenue from bond sales for several purposes, for
example to pay shareholder dividend, to buy back shares, or to invest in new fossil fuel exploration or production. The ECB argues that ‘to ensure the effectiveness of its monetary policy while maintaining a level playing field
for all market participants and avoiding undue market distortions, there is no positive or negative discrimination in the CSPP-eligible bond universe based on environmental or social criteria’.
However, key experts have highlighted that these bond purchases stand counter to Europe’s climate commitments, and 41 Members of the European Parliament, from all political groups, have demanded transparency about selection criteria and the disclosure of the sums ECB has spent so far on the bonds of individual corporations.
Sources: ECB, 2017; Corporate Europe Observatory, 2017, 2016; The Guardian, 2016; Financial Times, 2017b, 2017c

22 Report
4. Findings
The following section outlines key findings on levels of transparency in fossil fuel subsidy reporting. It also provides a summary of findings on EU level and European government support to fossil fuels by instrument (fiscal support, public finance and SOE investment) and by activity (coal mining, oil and gas production, electricity production, transport, industry and business, households, and agriculture). This section also highlights key issues including: how public finance is propping up fossil fuel exploration; where fiscal support is provided to fossil fuels in the name of the energy transition; Europe’s public finance for fossil fuels overseas; and the balance of support going to workers, communities and vulnerable groups.
4.1. TransparencyOverall, our analysis of subsidy reporting demonstrates significant differences between European countries in terms of their reporting on fossil fuel subsidies. Only one country reviewed, Germany, regularly reports on its subsidies. This takes place under the biannual Subventionsbericht der Bundesregierung (Subsidy Report of the Federal Government). It is supplemented by a regular report by the German Environment Agency (UBA), focusing explicitely on environmentally harmful subsidies and using a different methodology.
A few other countries have recently published inventories of government support, including fossil fuel subsidies. At the end of 2016, Italy launched its first inventory of environmentally harmful subsidies, including to fossil fuels – the Catalogo dei Sussidi Ambientali (Dannosi e Favorevoli). In January 2017, the French Ministry of Environment, Energy and the Sea published a report on environmental taxation, which includes includes energy, transport, pollution and resource taxation measures (French Ministry of Environment, Energy and Sea, 2017). On 1 June 2017, the Swedish environmental protection agency, Naturvårdsverket, published a report on Subsidies with potential environmental damage (only available in Swedish), as a follow-up to a first report published in 2004 (Naturvårdsverket, 2017). In sharp contrast, the UK government explicitly denies that it provides any subsidies to fossil fuels, based on its specific interpretation of subsidies (UK Parliament, 2017a; UK Parliament, 2017b), although UK’s fossil fuel subsidies have been documented by international institutions including OECD and IMF.
Unfortunately, none of these inventories cover investments by public finance institutions, nor by SOEs.
There is also significant variance in the accessibility of information through government ministries, public finance institutions and majority SOEs. Our analysis often found evidence of support going to fossil fuel projects and investments in annual reports, but no data on the amount of the support was available. Similarly, the OECD database includes a number of subsidy measures for which data is unavailable, especially for recent years. As a result, the subsidy estimates provided in this report are likely to be underestimates of the actual level of support provided by the European governments covered.
Across the full analysis (997 fossil fuel subsidies), 27% (or 123 out of the 452) of fiscal support instruments identified could not be quantified. Similarly, around 25% (or 18 out of the 72) of SOE investments identified could not be quantified. Conversely, data was available for 97% of public finance investments identified.
For many subsidies it was not possible to determine what specific activity they were supporting, either because information was unclear, or because support was provided to multiple activities or multiple fossil fuels. This was particularly challenging for fossil fuel production, where €1.1 billion in fiscal support, €2.6 billion in public finance (domestic, EU, and international), and €2.6 billion in SOE investment could not be classified in terms of the stage of production supported (see Annex 4). This was less of a challenge for fossil fuel consumption, but there was still €1.6 billion in fiscal support that could not be classified in terms of the sector of consumption supported (see Annex 4).
4.2. Findings, by instrument The 11 countries and the EU-level financing bodies covered in this study together provided over €112 billion in fossil fuel subsidies per year between 2014 and 2016 through fiscal support, public finance and SOE investments (see Table 2 and Annex 4). €4 billion of these subsidies came from the EU itself.
The vast majority of European support for fossil fuel production and consumption (€89 billion per year) was through fiscal support, in the form of tax exemptions, budgetary expenditure, and price or income support. In addition to fiscal support, these same governments and the EU together provide €12 billion in public finance (domestic, EU, and international), most of which is finance for fossil fuel production activities outside the EU (see Annex 5 for a list of public finance institutions reviewed).

Phase-out 2020: monitoring Europe’s fossil fuel subsidies 23
Another €12 billion in support to fossil fuels came through SOE investments (see Annex 5 for a list of SOEs reviewed). The low level of support through public finance and SOE investment highlights the potential for European governments to phase out swiftly these forms of support to fossil fuel production and consumption.
The majority of the €89 billion per year identified in fiscal support (tax exemptions, budget expenditure, and price or income support) is directed toward support for fossil fuel consumption (almost €75 billion), with the highest level of fiscal support coming from France, Germany, Italy, and the United Kingdom (see Table 3). The level of fiscal support obviously correlates with the size of the economy, but it can also be an indicator of the level of transparency.
In terms of public finance, about a third of this financing (€3.4 billion) goes to coal, oil and gas, and fossil-fuel based electricity production domestically and in the EU, while more than two thirds (€8.6 billion) is international finance (see Tables 4 and 5). Of the support provided within Europe, most public finance is coming from the EU (EIB and EBRD). In terms of public finance provided overseas to production of oil, gas, and coal, the majority is coming from the EU, along with Germany, Italy, the Netherlands, the United Kingdom. Recent analysis has revealed that the UK provides more than twice as much support for fossil fuels as for renewables through its international finance (CAFOD, 2017).
We find that the 11 European countries reviewed also provided an additional €852 million per year in public finance for fossil fuels through multi-lateral and regional development banks (African Development Bank,
18 Calculated based on voting shares (%) of each country reviewed in this analysis in each of these multi-lateral and regional development banks, and the share of fossil fuel finance per institution.
19 In 2010 the Council of the EU took the decision (Council Decision 2010/787/EC) to allow the continuation of state aid, but only on the condition that the mines receiving state aid are closed by December 2018. Aid to cover operational losses can be provided and must be based on an agreed closure plan. This implies that operational aid to uncompetitive coal mines will be phased out by 2018. Aid to cover 'exceptional costs', to mitigate social costs such as early retirement schemes or for site rehabilitation, must be phased out by 2027.
Asian Development Bank, Inter-American Development Bank, and the World Bank Group).18 However, as this information was only available for the period in between 2013 and 2015, we have not included it in the cross-cutting analysis (by instrument and activity) for this report (OCI, 2017).
Of the support to oil, gas and coal provided through majority SOEs (€12 billion), most is coming from Poland, Greece, the Netherlands and France, with the clear majority dedicated to fossil fuel production (see Table 6)
4.3. Findings, by activity
4.3.1. Coal miningEuropean support to coal mining identified in our research is predominantly provided through fiscal support (€3.3 billion per year), with limited support coming through international public finance (€389 million per year), and SOE investment (€434 million per year) (see Table 7 and Annex 4). Of the fiscal support, the highest levels are in Germany and Spain (subsidies could not be quantified in several countries, including France and Italy).
Despite the 2010 EU council decision to phase out support to hard coal mines by 2018,19 all the countries reviewed are still providing some support to coal mining, either through fiscal support, public finance or SOE investment. Only the Netherlands and the EU appearing to have phased out all support within Europe. With the EU providing only €1.5 million of support through international public finance. In many cases support in the period reviewed (2014-2016) is small in scale, which highlights the significant potential for a full phase-out.
The limited amount of SOE investments identified could also linked reflection of the gaps in transparency, as our analysis identified several state-owned coal companies in operation in Poland, for instance, with limited information available about the scale of their activities.
The EU has not set a timeline for ending SOE or public finance support to coal mining, nor for support to coal by many public finance institutions (both domestically and internationally).
It notable that the majority (between 75-99%) of fiscal support provided to coal mining in Czech Republic, Germany and Spain, was directed towards transition for workers and communities, and the decommissioning and rehabilitation of mining sites (see Table 8 and Box 4 for further discussion on support for a ‘just transition’ for workers and communities). These findings raise questions
Production Consumption TOTAL
Fiscal support
13,559 75,016 88,574
Public finance 11,969 23 11,992
Domestic + EU 3,382 23 3,405
International 8,587 0 8,578
SOE investment 11,402 362 11,764
Table 2: Subsidies to fossil fuel production and consumption (see also Annex 4) by instrument (million Euros, 2014-16 average)
Sources: See data sheet available at odi.org/Europe-fossil-fuel-subsidies

24 Report
about the balance of responsibility between governments
Fiscal support
Production Consumption TOTAL
Czech Republic 209 164 373
France 426 10,393 10,819
Germany 4,422 28,898 33,320
Greece 327 1,184 1,510
Hungary 127 109 236
Italy 4,245 12,360 16,604
Netherlands 669 3,752 4,422
Poland 397 157 555
Spain 943 768 1,711
Sweden 32 1,417 1,449
UK 1,247 15,812 17,059
EU 515 0 515
TOTAL 13,559 75,016 88,574
Table 3: Annual fiscal support for fossil fuel production and consumption, by country and at EU level (million Euros, 2014-16 average)
Sources: See country briefs and data sheets available at odi.org/
Europe-fossil-fuel-subsidies
Public finance, domestic and within Europe
Production Consumption TOTAL
Czech Republic 0 0 0
France 0 0 0
Germany 160 0 160
Greece n/a 0 n/a
Hungary n/a n/a n/a
Italy 151 0 151
Netherlands 0 0 0
Poland 20 0 20
Spain 2 0 2
Sweden n/a n/a n/a
UK 644 0 644
EU 2,405 23 2,428
TOTAL 3,382 23 3,405
Table 4: Annual public finance for fossil fuel production and consumption (domestic and within Europe), by country and at EU level (million Euros, 2014-16 average)
Sources: See country briefs and data sheets available at odi.org/
Europe-fossil-fuel-subsidies
Note: See Annex 5 for list of public finance institutions included in
this analysis
Public finance, international
Production Consumption TOTAL
Czech Republic 152 0 152
France 310 0 310
Germany 2,257 0 2,257
Greece 0 0 0
Hungary n/a n/a n/a
Italy 1,115 0 1,115
Netherlands 2,218 0 2,218
Poland 139 0 139
Spain 54 0 54
Sweden n/a n/a n/a
UK 1,283 0 1,283
EU 1,059 0 1,059
TOTAL 8,587 0 8,587
Table 5: Annual international public finance for fossil fuel production and consumption (support provided outside the EU), by country and at EU level (million Euros, 2014-16 average)
Sources: See country briefs and data sheets available at odi.org/
Europe-fossil-fuel-subsidies
State-owned enterprise investment
Production Consumption TOTAL
Czech Republic 648 0 648
France 1,063 0 1,063
Germany 0 0 0
Greece 3,606 362 3,968
Hungary 139 0 139
Italy 0 0 0
Netherlands 946 0 946
Poland 4,462 0 4,462
Spain 0 0 0
Sweden 539 0 539
United Kingdom 0 0 0
EU 0 0 0
TOTAL 11,402 362 11,764
Table 6: Annual state-owned enterprise investment in fossil fuel production and consumption, by country and at EU level (million Euros, 2014-16 average)*
Sources: See country briefs and data sheets available at odi.org/
Europe-fossil-fuel-subsidies
Note: See Annex 5 for list of state-owned enterprises included in this
analysis
* The majority of SOE investment is domestic, however in the case of
France we identified SOE investment overseas by EDF, worth €196
million per year between 2014 and 2016.

Phase-out 2020: monitoring Europe’s fossil fuel subsidies 25
and companies in the closure of coal mines, and the extent to which companies should set aside resources to cover these costs.
4.3.2. Oil and gas productionSupport to oil and gas production from European governments and EU institutions between 2014 and 2016 was provided evenly through all types of instruments, including public finance to activities in Europe and overseas, fiscal support, and SOE investment (see Table 9 and Annex 4).
Just under half (€3.1 billion per year) of the public finance identified went to projects domestically and within the EU, while just over half (€4.2 billion per year) supported projects outside of the EU. The countries providing the highest levels of international public finance identified were Germany, Italy and the UK, as well as the EU.
EU bodies and financial instruments provided most public finance for oil and gas production, with institutions in Italy and Germany providing significant levels of public finance. EIB provided nearly two-thirds of EU public finance, almost entirely for gas projects (see Box 2 in Chapter 1).
As part of the wider support provided to oil and gas production outlined above, our research found that the key EU investment and development banks, the European Investment Bank (EIB) and the European Bank for Reconstruction and Development (EBRD), together provided over €2.4 billion of public finance for gas infrastructure projects inside and outside the EU. This is despite mounting evidence that demand for gas in Europe
Coal mining Fiscal support Public finance (domestic + EU)
Public finance (international)
SOE investment
Czech Republic 87 0 n/a 0
France n/a 0 0 20
Germany 2,690 0 47 0
Greece 0 0 0 116
Hungary 29 n/a n/a 4
Italy n/a 0 0 0
Netherlands 0 0 192 0
Poland 15 5 0 295
Spain 473 0 139 0
Sweden 0 n/a n/a 0
UK 34 18 10 0
EU 0 0 2 0
TOTAL 3,328 23 389 434
Table 7: Europe’s subsidies to coal mining (million Euros, 2014-16 average)
Sources: See country briefs and data sheets available at odi.org/Europe-fossil-fuel-subsidies
Box 4: Support for transition of workers and communities
Almost 80% of fiscal support to coal mining (€2.6 billion per year) support the transition away from coal. Of this, €313 million supports workers, and €314 million the decommissioning and rehabilitation of mining sites. The majority (€2 billion) is provided in the form of unspecified transition support, where it is unclear which proportion of the funds is dedicated to communities and workers, and which to the decommissioning and rehabilitation of mine sites.
Ensuring support for workers and communities as part of the wider transition away from fossil fuels (including coal mining) is recognised as a critical component of the wider European energy transition. To that end, the European Parliament has voted to revise its Emission Trading Scheme (ETS) Directive, to create a ‘Just Transition’ fund. If passed by the European Council, this mechanism will allow some of the funds raised by the auction of emissions certificates to be used for ‘just transition’ measures. These include education and training, job-seeking support, business creation, and mitigating the impact of transition on physical and mental health.
Sources: IndustriALL Global Union, 2017

26 Report
is falling, in part due to success in meeting the EU’s own energy efficiency targets.
The UK and France, surprisingly, are examples of how European governments still provided public finance to fossil fuel exploration, both domestically and internationally – admittedly at a low level (€253 million per year) – despite mounting consensus that at least three quarters of the known fossil fuels reserves must be left in the ground to meet global climate goals.
In terms of fiscal support to oil and gas production across Europe (€3.3 billion per year), we find the Italian government provides a number of financial incentives, such as royalty-free thresholds for oil and gas extraction, amounting to €1.4 billion a year. The UK introduced significant tax breaks in 2015 and 2016 to encourage continued investments in oil and gas production, particularly in the North Sea (see Box 5).
In terms of fiscal support at the EU level, the Horizon 2020 project provided €12 million to four shale-gas research projects in 2015. Horizon 2020 is the EU Research and Innovation programme, with nearly €80 billion of funding available over seven years (2014-2020).
SOE investments were also a significant form of support to oil and gas production (€2.7 billion per year). The France, the Netherlands and Poland made the highest levels of SOE investment in oil and gas production, with all the finance from Dutch SOEs going towards gas production and infrastructure.
Fiscal support Support for workers Decommissioning and rehabilitation
Unspecified transition support
Czech Republic 1 6 80
France 0 0 0
Germany 283 258 1,504
Greece 0 0 0
Hungary 29 0 n/a
Italy 0 0 0
Netherlands 0 0 0
Poland n/a n/a n/a
Spain 0 15 397
Sweden 0 0 0
UK 0 34 0
EU 0 0 0
TOTAL 313 314 1,985
GRANT TOTAL 2,609
Table 8: Transition support for workers and communities, and towards decommissioning and rehabilitation (million Euros, 2014-2160)
Sources: See country briefs and data sheets available at odi.org/Europe-fossil-fuel-subsidies
Box 5: Net costs to the UK government of fiscal support in the UK North Sea
When fossil fuel prices are low, governments often feel political pressure to reduce taxes on fossil fuel production or to provide other subsidies to keep companies producing.
Following calls by Oil and Gas UK (the country’s industry body) for increased support, the British government cut the highest tax rate on North Sea oil production from 80% to 68% in 2015, and again to 40% in 2016.
The impact of these subsidies on the UK’s budget has been significant, with precipitous drops in domestic tax revenue, from £11 billion in 2011/12, to a low of only £35 million in 2015/16. In addition, several companies have now become net beneficiaries under the UK tax regime, with Shell receiving a net £123 million in 2015 from the UK government.
Sources: OCI, 2016c; BBC, 2016; International Transport Union Federation, 2016; Carbon Brief, 2016; see also UK country brief

Phase-out 2020: monitoring Europe’s fossil fuel subsidies 27
4.3.3. Electricity productionFossil fuel-based power generation benefited from significant levels of fiscal support (almost €5.8 billion per year between 2014 and 2016) (see Table 10 and Annex 4). According to the data we found, almost half of this was provided by the Italian government, and includes numerous tax credits and deductions to power plants, as well as large amounts of budget support to help cover costs.
Many European governments have committed to phasing out coal-fired power in the medium term, yet between 2014 and 2016, coal-fired power benefited from at least €2.2 billion per year in fiscal support.
It is notable that €4.3 billion in fiscal support is provided in the name of energy transition. This includes support through capacity mechanisms, for co-firing of coal with biomass, and to electricity production (and industry) through ETS (see Box 6 and Table 11). This support can lengthen the life of fossil fuel assets, and make alternatives less competitive.
High levels of support are also provided to fossil fuel-based power (€5.7 billion per year) through investments by state-owned electricity companies (see Table 10 and Annex 4). This includes support to electricity production, as well as distribution through grid systems. In turn, almost half of this was through investments by three major state-owned Polish utilities. The state-owned utility
20 As discussed in the methodology section, this analysis has not looked at subsidies going to infrastructure that supports fossil fuel-based transport (such as subsidies to roads, railways, airports and marine ports). While these are substantial in many countries, they also support non fossil-fuel based modes of transport, as well as other business activity. Information is often not available to determine the portion of the subsidy directly benefiting fossil fuels.
companies of France, the Czech Republic, Greece and Sweden have also made considerable investments in fossil fuel-based electricity. As far as we are aware, there are no programmes in Europe to support the transition of SOEs away from fossil fuels.
Public finance for fossil fuel-based power generation, domestically and within other European countries, was very limited, at €25 million, provided solely by the EU and Italy. Despite these very low levels of support within Europe, significant support to fossil fuel power is still provided internationally (€1.7 billion per year). Most of this international public finance comes from Germany and is mainly directed towards gas-fired power plants, with highest level of support going to Turkey and the Philippines.
4.3.4. TransportAll European support to fossil fuel consumption in the transport sector20 – €49 billion per year – is provided through fiscal support (budget expenditure, tax breaks, and price and income support). Our research identified no support for consumption of fossil fuels in the transport sector by public finance institutions (domestically, in the EU or internationally) or through SOE investment.
Germany provided 38% of the identified fiscal support to fossil fuel consumption in the transport sector – €19 billion. This is likely a reflection of Germany’s high level of
Oil and gas production Fiscal support Public finance (domestic + EU)
Public finance (international)
SOE investment
Czech Republic 0 0 0 0
France 356 0 258 401
Germany n/a 160 840 0
Greece 0 0 0 0
Hungary n/a n/a n/a 8
Italy 1,406 151 922 0
Netherlands 144 0 0 946
Poland 55 15 0 1,375
Spain n/a 0 50 0
Sweden 0 n/a n/a 0
UK 850 441 1,213 0
EU 515 2,311 896 n/a
TOTAL 3,326 3,079 4,178 2,730
Table 9: Europe’s subsidies to oil and gas production (million Euros, 2014-16 average)
Sources: See country briefs and data sheets available at odi.org/Europe-fossil-fuel-subsidies
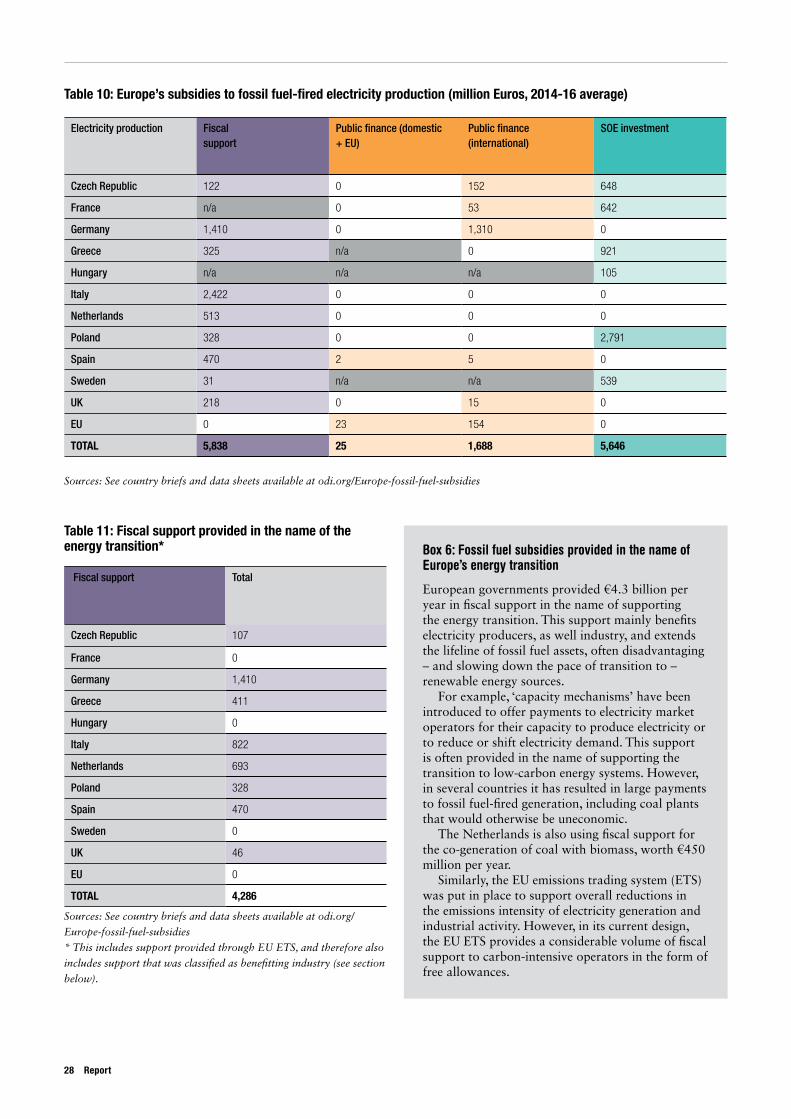
28 Report
Table 10: Europe’s subsidies to fossil fuel-fired electricity production (million Euros, 2014-16 average)
Electricity production Fiscal support
Public finance (domestic + EU)
Public finance (international)
SOE investment
Czech Republic 122 0 152 648
France n/a 0 53 642
Germany 1,410 0 1,310 0
Greece 325 n/a 0 921
Hungary n/a n/a n/a 105
Italy 2,422 0 0 0
Netherlands 513 0 0 0
Poland 328 0 0 2,791
Spain 470 2 5 0
Sweden 31 n/a n/a 539
UK 218 0 15 0
EU 0 23 154 0
TOTAL 5,838 25 1,688 5,646
Sources: See country briefs and data sheets available at odi.org/Europe-fossil-fuel-subsidies
Box 6: Fossil fuel subsidies provided in the name of Europe’s energy transition
European governments provided €4.3 billion per year in fiscal support in the name of supporting the energy transition. This support mainly benefits electricity producers, as well industry, and extends the lifeline of fossil fuel assets, often disadvantaging – and slowing down the pace of transition to – renewable energy sources.
For example, ‘capacity mechanisms’ have been introduced to offer payments to electricity market operators for their capacity to produce electricity or to reduce or shift electricity demand. This support is often provided in the name of supporting the transition to low-carbon energy systems. However, in several countries it has resulted in large payments to fossil fuel-fired generation, including coal plants that would otherwise be uneconomic.
The Netherlands is also using fiscal support for the co-generation of coal with biomass, worth €450 million per year.
Similarly, the EU emissions trading system (ETS) was put in place to support overall reductions in the emissions intensity of electricity generation and industrial activity. However, in its current design, the EU ETS provides a considerable volume of fiscal support to carbon-intensive operators in the form of free allowances.
Fiscal support Total
Czech Republic 107
France 0
Germany 1,410
Greece 411
Hungary 0
Italy 822
Netherlands 693
Poland 328
Spain 470
Sweden 0
UK 46
EU 0
TOTAL 4,286
Sources: See country briefs and data sheets available at odi.org/
Europe-fossil-fuel-subsidies
* This includes support provided through EU ETS, and therefore also
includes support that was classified as benefitting industry (see section
below).
Table 11: Fiscal support provided in the name of the energy transition*

Phase-out 2020: monitoring Europe’s fossil fuel subsidies 29
transparency in reporting on fossil fuel subsidies. The UK, Italy, and France provided the next highest shares of fiscal support towards transport, respectively. Very little support was identified in Hungary and Greece, and values for subsidies identified in Poland and the Czech Republic were not available (see Table 12). Tax exemptions on diesel, which were introduced to encourage its use over petrol, accounted for 43% of fiscal support to transport identified.
Aviation benefited from 29% of the total support for transport, including fuel tax breaks towards airlines. Passenger transport (mostly international) made up 12%, and company car allowances (provided in Germany) 6%. The tax breaks identified for petroleum and other fuels were 4% of the total support.
Transport subsidies that were targeted for public transport, and towards a specific use or group of people (e.g. for taxis, ambulances, armed forces and use in disability vehicles) made up only 1.4% of the total support provided.
4.3.5. Industry and businessAs with transport, all European government support to industry and business identified by our research (almost €15 billion) came in the form of fiscal support, through tax breaks for energy use, and price and income support for energy-intensive companies and processes.
21 Only the proportion of support benefiting fossil fuels was included in the data collected for this report.
Again, Germany provided the highest amount of fiscal support to industry and business identified, which is likely due to higher levels of transparency and higher energy prices, which increase the value of any tax exemptions (see Table 13). France and the UK also provided significant levels of fiscal support to industry and business, primarily in the form of tax exemptions to energy-intensive industries.
Industry across Europe benefits from additional support through allocation of free emission allowances as part of ETS (see Box 6).
4.3.6. HouseholdsAt the household level, most European support (€6.6 billion) is through fiscal support. Of this, the majority was provided by the UK (see Table 15), which charges a significantly reduced VAT rate on fuel and power consumption for households.21 Italy also provided significant fiscal support for consumption of fossil fuels at the household level. These were through measures such as a social energy tariff for low-income families, and VAT and excise duty exemptions for certain households.
Given the challenging economic circumstances for many families and individuals in Europe, especially the poorest, energy price relief on electricity and heating is an important form of social support. However, support that is targeted at poor households is relatively limited.
Transport Fiscal support
Czech Republic n/a
France 7,148
Germany 18,913
Greece 7
Hungary 16
Italy 8,746
Netherlands 3,526
Poland n/a
Spain 339
Sweden 1,053
UK 9,475
EU 0
TOTAL 49,222
Table 12: Fiscal support to consumption of fossil fuels in the transport sector (million Euros, 2014-16 average)
Sources: See country briefs and data sheets available at odi.org/
Europe-fossil-fuel-subsidies
Industry and business Fiscal support
Czech Republic 106
France 2,073
Germany 9,585
Greece 363
Hungary 7
Italy 728
Netherlands 127
Poland 157
Spain 0
Sweden 213
UK 1,617
EU 0
TOTAL 14,975
Table 13: Fiscal support to consumption of fossil fuels in industry and business (million Euros, 2014-16 average)
Sources: See country briefs and data sheets available at odi.org/
Europe-fossil-fuel-subsidies

30 Report
Per the information available, 14 out of 28 (or 50%) of the fiscal support instruments to households (identified across the EU and European governments reviewed) were not targeted by the government at specific segments of the population. For example, six measures were targeted at the poorest and vulnerable, as well as large families. Two measures were targeted at employees working in specific sectors, such as in the power sector or in coal mining, and six measures were targeted based on a mixed range of conditions.
4.3.7. Agriculture European support for the consumption of fossil fuels by agriculture (just over €2.5 billion) was mainly provided by fiscal support. No support was provided by public finance (domestically, in the EU or internationally) or by SOEs.
The highest volume of fiscal support identified was in Italy (see Table 16). Measures included a reduction on excise tax applied to diesel used in the agricultural sub-sectors of farming, horticulture, forestry and aquaculture, as well as VAT concessions to petroleum products for use in agriculture, forestry and inland fisheries.
Data was not available for fiscal support to agriculture identified in Poland, namely rebates on diesel fuel tax in farming (which are expected to be high).
Households Fiscal support
Czech Republic 11
France 96
Germany n/a
Greece 190
Hungary n/a
Italy 1,670
Netherlands 0
Poland n/a
Spain n/a
Sweden n/a
UK 4,674
EU 0
TOTAL 6,641
Table 13: Fiscal support to consumption of fossil fuels in industry and business (million Euros, 2014-16 average)
Sources: See country briefs and data sheets available at odi.org/
Europe-fossil-fuel-subsidies
Agriculture Fiscal support
Czech Republic 47
France 123
Germany 400
Greece 54
Hungary 87
Italy 1,203
Netherlands 100
Poland n/a
Spain 430
Sweden 120
UK 0
EU 0
TOTAL 2,564
Table 16: Fiscal support to consumption of fossil fuels in agriculture (million Euros, 2014-16 average)
Sources: See country briefs and data sheets available at odi.org/
Europe-fossil-fuel-subsidies

Phase-out 2020: monitoring Europe’s fossil fuel subsidies 31
5. Conclusions and high-level recommendations
While European governments have recognised rhetorically the urgent need to phase out fossil fuel subsidies, there is currently no mechanism for accountability against these commitments (see Chapter 1). Recognising the gap in information and governance, this report attempts to provide a picture of the range of European subsidies to fossil fuels, both at home and abroad.
Phasing out fossil fuel subsidies is a critical and necessary step to limit the impacts of climate change, reduce air pollution and facilitate the energy transition. Removing public support for fossil fuels would rebalance our energy markets, and ensure the industry operates on a level playing field with emerging renewable technologies, to provide the same energy services. Ending these subsidies will also allow countries to shift to energy systems of the future in good time, avoiding the risk of stranded assets and lock-in to high carbon technologies, while freeing up government resources for public goods such as health and education.
Our review of support to fossil fuels from 11 European governments and the EU budget, its financial instruments, the EIB and EBRD shows that these actors provided more than €112 billion per year on average between 2014 and 2016. The scale of this support is not consistent with agreed goals on the removal of fossil fuel subsidies or with agreed climate goals.
This report does not seek to make specific recommendations for how Europe can undertake a full phase-out of fossil fuel subsidies in line with its commitments (see Chapter 1). At the high level, however, this report recommends that European governments and the EU institutions should take the following actions.
1. Lead the G7 and the G20 in phasing out fossil fuel subsidies by no later than 2020, in line with Europe’s existing commitment to end environmentally harmful subsidies, and as called for by a wide range of actors from investors and insurers, to civil-society organisations, to the V20 vulnerable countries (ODI, 2017).
2. Increase transparency through a publicly disclosed, consistent annual reporting scheme at the national and European level, covering all support to fossil fuels, building on the work undertaken in the OECD
inventory and by previous studies of Europe’s fossil fuel subsidies (including this report). This should include increased transparency of reporting on investment in and finance for fossil fuels by SOEs and majority state-owned financial institutions. European governments could also undertake peer-reviews as part of the G20 process (as already initiated by Germany and Italy).
3. Work across EU policies, including through the EU Energy Union Governance framework for 2030, to ensure that comprehensive planning, monitoring and reporting mechanisms on the phase-out of fossil fuel subsidies are integrated into Member States’ national energy and climate plans.
4. Ensure international institutions funded by European governments (i.e. MDBs) eliminate existing public finance for fossil fuels, and monitor reforms so that no new support is established. This work should be supported by efforts within international institutions and processes, such as the G7, G20, the OECD, the UNFCCC and the Sustainable Development Goals.
5. Ensure that mechanisms with the stated aim of assisting the energy transition do not support fossil fuel production and consumption. This includes ending subsidies for fossil fuels under ETS, under new and existing capacity mechanisms, and through subsidies to biomass power generation.
6. Target any remaining subsidies to ensure a ‘just transition’ for workers and communities. Any support provided to households should target the most vulnerable groups during the energy transition.
As this report shows, governments in Europe and the EU institutions continue to subsidise and finance a reliance on oil, gas and coal, fuelling dangerous climate change with taxpayers’ money spent both at home and overseas. Despite broad agreement that fossil fuel subsidies are a problem, and early examples of a select group of European countries undertaking reform (see Box 7), these subsidies have proven politically difficult to eliminate. European governments must be held accountable for the fossil fuel subsidies highlighted in this report, and must seize the opportunity to end this support to the fossil fuel industry. Annex 3 – Additional information on research methodology

32 Report
Box 7: Is there potential for Europe to end fossil fuel subsidies by 2020?
With multiple governments across Europe committing to phasing out coal-fired power, banning fracking and exploration for oil and gas, and pledging to ending the sale of diesel and petrol vehicles, one would imagine the days of fossil fuels are numbered.
And with mounting consensus on the health, social and environmental costs of oil, gas and coal, it would seem an obvious first step for the EU to meet its own pledge to end fossil fuel subsidies by 2020.
So how are Europe’s governments and institutions doing in meeting this deadline? There are a few positive signs.
On transparency:
• Germany has shown significant leadership by regularly reporting on all subsidies, including those to fossil fuels, alongside parallel reporting on environmentally harmful subsidies (EHS). Italy following suit publishing a first inventory of EHS in 2016.
• Both Germany and Italy have also volunteered to participate in a peer review of their fossil fuel subsidies under the G20 process (to be published in 2017 and 2018).
On ending fiscal support:
• The EU has heavily reduced fiscal support to fossil fuels, with only €515 million provided per year for oil and gas production in the period reviewed in this study.
• Many countries are succeeding in phasing out support to coal mining, and a significant proportion of the remaining fiscal support to coal is focused on the transition away from coal. It notable that the majority (between 75-99%) of fiscal support provided to coal mining in Czech Republic, Germany and Spain, was directed towards transition for workers and communities, and the decommissioning and rehabilitation of mining sites.
• The Netherlands ended differentiated tax rates for diesel in 2013, and France has taken steps to shrink the taxation gap between diesel and petrol by 2021.
On ending public finance:
• Many European governments have committed to ending international public finance and export credits for coal-fired power and coal mining (see Annex 3).
On ending state-owned enterprise investment:
• Sweden’s majority state-owned energy company, Vattenfall, has drastically reduced its financing for coal-fired power in recent years, which has led to the company’s coal-fired power generation declining by more than half between 2014 and 2016.
European governments must now build on these achievements to demonstrate necessary leadership, moving swiftly to align incentives with the goals of the energy transition and to meet their commitments to a full phase-out of fossil fuel subsidies by 2020.
Sources: see individual country and EU briefs for more information, available at odi.org/Europe-fossil-fuel-subsidies

Phase-out 2020: monitoring Europe’s fossil fuel subsidies 33
ReferencesAlberici, S., Boeve, S., van Breevoort, P., Deng, Y., Förster, S., Gardiner, A., van Gastel, V., Grave, K., Groenenberg, H.,
de Jager, D., Klaassen, E., Pouwels, W., Smith, M., de Visser, E., Winkel, T. and Wouters, K. (2014) Subsidies and costs of EU energy: final report. Brussels: European Commission (https://ec.europa.eu/energy/sites/ener/files/documents/ECOFYS%202014%20Subsidies%20and%20costs%20of%20EU%20energy_11_Nov.pdf)
Bast, E., Godinot, S., Kretzmann, S. and Makhijani, S. (2015) Under the rug: how governments and international institutions are hiding billions in support to the coal industry. The Natural Resources Defense Council, Oil Change International, World Wide Fund for Nature. (http://priceofoil.org/2015/06/02/ruggovernments-international-institutions-hiding-billionssupport-coal-industry/)
BBC (2016) ‘North Sea tax receipts slump to £35m’. BBC News. (http://www.bbc.co.uk/news/uk-scotland-scotland-business-36111753)
CAFOD (2017). Chaos for climate goals as figures show government spent twice as much on fossil fuels as renewables. (https://cafod.org.uk/News/Press-centre/Press-releases/Fossil-fuel-v-renewables-spend).
Carbon Brief (2016) ‘UK taxpayers handed Shell $123m in 2015’. Carbon Brief. (https://www.carbonbrief.org/uk-taxpayers-handed-shell-usd123m-in-2015) AUTHOR: Evans, S.
Chazan, G. (2016) ‘Eon and RWE pursue radical restructurings’. London: Financial Times. (https://www.ft.com/content/316ce884-1cdc-11e6-a7bc-ee846770ec15)
Climate Action Network and E3G (no date) ‘Five things you should know about energy union governance’. Climate Action Network. (http://www.caneurope.org/docman/energy-union-governance/3056-five-things-you-should-know-about-energy-union-governance/file)
Climate Action Tracker (2017) ‘Foot off the gas: increased reliance on natural gas in the power sector risks an emission lock-in’, CAT decarbonisation series (June 2017).Climate Action Tracker. (http://climateactiontracker.org/assets/publications/briefing_papers/CAT-2017-06-16-DecarbonisationSeries-NaturalGas.pdf)
CNN (2017) ‘These countries want to ditch gas and diesel cars’. CNN. (http://money.cnn.com/2017/07/26/autos/countries-that-are-banning-gas-cars-for-electric/index.html) AUTHORS: Petroff, A.
Corporate Europe Observatory (2017) ‘European Central Bank has bought more climate-trashing bonds. Corporate Europe Observatory. (https://corporateeurope.org/economy-finance/2017/06/european-central-bank-has-bought-more-climate-trashing-bonds)
Corporate Europe Observatory (2016) ‘The ECB’s ‘quantitative easing’ funds multinationals and climate change’. Corporate Europe Observatory. (https://corporateeurope.org/economy-finance/2016/12/ecb-quantitative-easing-funds-multinationals-and-climate-change)
Crisp, J. (2017) ‘23 EU countries are breaking European air quality laws’. London: EurActiv (http://www.euractiv.com/section/sustainable-dev/news/23-eu-countries-are-breaking-european-air-quality-laws/)
CTI (Carbon Tracker Initiative) (2014) ‘Resources: Key Terms’. London: Carbon Tracker Initiative. (www.carbontracker.org/resources/)
DeSmogBlog (2016) ‘Europe Quits Coal’. Cleveland: Ecowatch (http://www.ecowatch.com/25-of-europe-quitscoal-1891078241.html)
DG ECFIN (2015) Energy Economic Developments: Investment perspectives in electricity markets. Brussels: European Commission Directorate-General for Economic and Financial Affairs. (http://ec.europa.eu/economy_finance/publications/eeip/pdf/ip003_en.pdf)
Doukas, A., DeAngelis, K., Ghio, N., Trout, K., Bast, E. (2017) Talk is cheap: How G20 governments are financing climate disaster. Oil Change International, Friends of the Earth U.S., the Sierra Club, and WWF European Policy Office. (http://priceofoil.org/content/uploads/2017/07/talk_is_cheap_G20_report_July2017.pdf)
E3G (2016) ‘More security, lower cost: A smarter approach to gas infrastructure in Europe’. E3G. (https://www.e3g.org/library/more-security-lower-cost-a-smarter-approach-to-gas-infrastructure-in-europe) AUTHORS: Dufour, M., Gaventa, J., Bergamschi, L.
E3G (2015) ‘Europe’s declining gas demand: trends and facts on European gas consumption. E3G. (https://www.e3g.org/docs/E3G_Trends_EU_Gas_Demand_June2015_Final_110615.pdf) AUTHORS: Jones, D., Dufour, M., Gaventa, J.
ECB (European Central Bank) (2017) ‘The ECB’s corporate sector purchase programme: its implementation and impact’, ECB Economic Bulletin (2017:4). ECB. (https://www.ecb.europa.eu/pub/pdf/other/ebbox201704_02.en.pdf?dc09631ae40e294a05a9237c9ba2046e0)
Endesa (2017) Ordinary General Meeting of Shareholders 2017. Endesa. (https://www.endesa.com/en/investors/a201611-shareholders-meetings.html)

34 Report
Enel (2015) Sustainability report 2015. Rome: Enel (http://sustainabilityreport2015.enel.com/en/responsible-management-business/environment/climate-strategy#start).
Energy Visions (2015) ‘Cañete: Gas is a bridge between coal and renewables. But in 2050 it’ll still be there.’ Brussels: Politico. (http://www.politico.eu/sponsored-content/canete-gas-is-a-bridge-between-coal-and-renewables-but-in-2050-itll-still-be-there/)
EPRS (European Parliamentary Research Service). (2017) ‘Capacity mechanisms for electricity’. European Union. AUTHOR: Erbach, G. (http://www.europarl.europa.eu/RegData/etudes/BRIE/2017/603949/EPRS_BRI(2017)603949_EN.pdf)
Erickson, P., Down, A., Lazarus, M., Koplow, D. (2017) ‘Effect of government subsidies for upstream oil infrastructure on U.S. oil production and global CO2 emissions’. Seattle: Stockholm Environment Institute (SEI). (https://www.sei-international.org/mediamanager/documents/Publications/Climate/SEI-WP-2017-02-US-oil-and-gas-production-subsidies.pdf)
Erickson, P. (2015) ‘Carbon lock-in from fossil fuel supply infrastructure’. Seattle, WA: SEI. (https://www.sei-international.org/mediamanager/documents/Publications/Climate/SEI-DB-2015-Carbon-lock-in-supply-side.pdf)
Euractiv. (2017a) ‘EU clears tighter controls on power plant air pollution. Euractiv. (https://www.euractiv.com/section/air-pollution/news/eu-clears-tighter-controls-on-power-plant-air-pollution/)
Euractiv (2017b) ‘EU will fail Paris climate challenge unless it tackles heating and cooling’. Euractiv. (http://www.euractiv.com/section/energy/news/eu-will-fail-paris-climate-challenge-unless-it-tackles-heating-and-cooling/) AUTHOR: Crisp, J.
European Commission (2017a) Second Report on the State of the Energy Union. Brussels: European Commission. (https://ec.europa.eu/commission/sites/beta-political/files/2nd-report-state-energy-union_en.pdf)
European Commission (2017b) Financing a sustainable European Economy. Brussels: European Commission. (https://ec.europa.eu/info/sites/info/files/170713-sustainable-finance-report_en.pdf)
European Commission (2017c) ‘Commission to review permits of Large Combustion Plants’. Brussels: European Commission. (http://ec.europa.eu/environment/pdf/31_07_2017_news_en.pdf)
European Commission (2017d) ‘Data for research’. Brussels: European Commission. (http://ec.europa.eu/regional_policy/cs/policy/evaluations/data-for-research/)
European Commission. (2017e) ‘Answer given by Mr Arias Cañete on behalf of the Commission’, Parliamentary questions (10 January 2017). Brussels: European Commission. (http://www.europarl.europa.eu/sides/getAllAnswers.do?reference=E-2016-007932&language=EN)
European Commission (2017f) ‘EXCISE DUTY TABLES: Part II Energy products and Electricity’. Brussels: European Commission. (https://ec.europa.eu/taxation_customs/sites/taxation/files/resources/documents/taxation/excise_duties/energy_products/rates/excise_duties-part_ii_energy_products_en.pdf)
European Commission (2016a) ‘Energy prices and costs in Europe’. Brussels: European Commission. (http://ec.europa.eu/energy/sites/ener/files/documents/com_2016_769.en_.pdf)
European Commission (2016b) ‘State aid control’. Brussels: European Commission. (http://ec.europa.eu/competition/state_aid/overview/index_en.html)
European Commission (2015) EU-Singapore Free Trade Agreement. Brussels: European Commission. (http://trade.ec.europa.eu/doclib/press/index.cfm?id=961)
European Commission. (2011) ‘A roadmap for moving to a competitive low carbon economy in 2050’, COM (2011) 112. Brussels: European Commission. (http://eur-lex.europa.eu/legal-content/EN/TXT/PDF/?uri=CELEX:52011DC0571&from=EN)
European Council (2010) Council Decision of 10 December 2010 on State aid to facilitate the closure of uncompetitive coal mines. (http://eur-lex.europa.eu/legal-content/EN/TXT/PDF/?uri=CELEX:32010D0787&from=EN)
European Environmental Bureau (EEB) (2017) ‘Cleaner air the winner after Germany fails to block new EU rules’. EEB. (http://eeb.org/cleaner-air-the-winner-after-germany-fails-to-block-new-eu-rules/) AUTHOR: Lazarus, A.
European Parliament (2017) Proposal for a regulation COM(2016)0759 - C8-0497/2016 – 2016/0375(COD). European Parliament Committee on the Environment, Public Health and Food Safety, Committee on Industry, Research and Energy. (http://energyblog.claudeturmes.lu/wp-content/uploads/sites/3/2017/02/COM20160759-Early-draft-Rivasi-Turmes.pdf)
Eurostat (n.d.) ‘Renewable Energy Statistics.’ Luxembourg: Eurostat. Latest data update : June 2017. (http://ec.europa.eu/eurostat/statistics-explained/index.php/Renewable_energy_statistics)
FT (Financial Times) (2017a) ‘Electric car costs forecast to hit parity with petrol vehicles. London: FT (https://www.ft.com/content/6e475f18-3c85-11e7-ac89-b01cc67cfeec)
FT (Financial Times) (2017b) ‘The argument to be a buyer of the Saudi Aramco IPO’ London: FT. (https://www.ft.com/content/d37c444a-6d66-11e7-b9c7-15af748b60d0)
Phase-out 2020: monitoring Europe’s fossil fuel subsidies 35
FT (Financial Times) (2017c) ‘Call for transparency on ECB corporate bond buying’ London: FT. (https://www.ft.com/content/7d1eea08-3be8-11e7-ac89-b01cc67cfeec)
France24 (2017) ‘France to ban oil and gas exploration’. Paris: France24. (http://www.france24.com/en/20170623-france-ban-oil-gas-exploration)
French Ministry of Environment, Energy and Sea (2017) ‘Fiscalité Environnementale: Un état des lieux’. French Ministry of Environment, Energy and Sea. (https://www.ecologique-solidaire.gouv.fr/sites/default/files/Th%C3%A9ma%20-%20Fiscalit%C3%A9%20environnementale%20-%20Un%20%C3%A9tat%20des%20lieux.pdf)
G7 (2017) ‘Chair’s Summary: G7 Rome Energy Ministerial Meeting’. April 9-10. Rome: G7. (http://www.g7italy.it/sites/default/files/documents/energy_chairs_summary.pdf)
G20 (2017) G20 Summit Declaration of the Heads of State and Government (https://www.g20.org/Content/EN/_Anlagen/G20/G20-leaders-declaration.html;jsessionid=697F8480955375395670F5A885AC6B18.s4t1?nn=2190012)
Gerasimchuk, I., Bassi, A., Ordonez, C., Doukas, A., Merrill, L,. Whitley, S. (2017) ‘Zombie Energy: Climate benefits of ending subsidies to fossil fuel production’. Winnipeg: The International Institute for Sustainable Development (IISD). (https://www.iisd.org/sites/default/files/publications/zombie-energy-climate-benefits-ending-subsidies-fossil-fuel-production.pdf)
Gray, M., Leaton, J., Schuwerk, R., Fulton, M., (2015) ‘Coal: Caught in the EU utility death spiral.’ London: Carbon Tracker Initiative. (http://www.carbontracker.org/wp-content/uploads/2015/06/CTI-EU-Utilities-Report-v6-080615.pdf)
Greenpeace (2015) ‘Italian energy giant Enel commits to coal investment phase-out’. Greenpeace Online (http://energydesk.greenpeace.org/2015/03/17/enel-commits-coal-investment-phase/).
The Guardian. (2017) ‘The death of diesel: has the one-time wonder fuel become the new asbestos?’ London: The Guardian. (https://www.theguardian.com/cities/2017/apr/13/death-of-diesel-wonder-fuel-new-asbestos) AUTHOR: Forrest, A.
The Guardian. (2016) ‘ECB’s quantitative easing programme investing billions in fossil fuels’. London: The Guardian. (https://www.theguardian.com/environment/2016/dec/09/ecbs-quantitative-easing-programme-investing-billions-in-fossil-fuels) AUTHOR: Nelsen, A.
Hewicker, C., Hogan, M., and Mogren, A. (2011) Power Perspectives 2030. On the road to a decarbonised power sector. A contributing study to roadmap 2050: a practical guide to a prosperous, low-carbon Europe. Brussels: European Climate Foundation.
IISD (International Institute for Sustainable Development) (n.d.) ‘Comparison of Fossil fuel Subsidy and Support Estimates’. Winnipeg: International Institute for Sustainable Development. (www.iisd.org/gsi/sites/default/files/ffs_methods_estimationcomparison.pdf)
IJ Global (2015) ‘Database’. London: IJ Global: Infrastructure Journal and Project Finance Magazine. (www.ijonline.com/data)
IMF (International Monetary Fund) (2013) ‘Energy Subsidy Reform: Lessons and Implications’. Washington D.C.: International Monetary Fund. (www.imf.org/external/np/pp/eng/2013/012813.pdf)
IOGP (International Association of Oil & Gas Producers). (2016) ‘Europe Exploration and Production Trends 2016. London: IOGP’. (http://www.iogp.org/wp-content/uploads/2017/03/IOGP-Europe-EP-Trends-2016-1.pdf)
IEA (International Energy Agency). (2017) ‘World Energy Investment 2017’. IEA. (http://www.iea.org/publications/wei2017/)
IEA (International Energy Agency. (2016) IEA 2016 World Energy Outlook. Paris: IEA (http://www.iea.org/bookshop/720-World_Energy_Outlook_2016)
IndustriALL Global Union. (2017) ‘European Parliament votes in favour of a Just Transition fund’. IndustriALL Global Union. (http://www.industriall-union.org/european-parliament-votes-in-favour-of-a-just-transition-fund)
IRENA (International Renewable Energy Agency). (2017) ‘Stranded Assets and Renewables: how the energy transition affects the value of energy reserves, buildings and capital stock’. Abu Dhabi: IRENA. (http://www.irena.org/DocumentDownloads/Publications/IRENA_REmap_Stranded_assets_and_renewables_2017.pdf)
International Transport Union Federation. (2016) ‘Offshore Oil, Offshore Tax: A Case Study of Chevron’s North Sea Oil Operations’. International Transport Union Federation. (http://www.chevrontax.info/reports-1/2016/6/24/offshore-oil-offshore-tax-a-case-study-of-chevrons-north-sea-oil-operations)
IPCC (Intergovernmental Panel on Climate Change) (2014). ‘Climate Change 2014 Synthesis Report’. Geneva: Intergovernmental Panel on Climate Change. (https://www.ipcc.ch/pdf/assessment-report/ar5/syr/SYR_AR5_FINAL_full_wcover.pdf)
Irish Times. (2017) ‘Ireland joins France, Germany and Bulgaria in banning fracking’. Dublin: The Irish Times. (https://www.irishtimes.com/news/politics/oireachtas/ireland-joins-france-germany-and-bulgaria-in-banning-fracking-1.3137095) AUTHOR: O’Halloran, M.

36 Report
Italian Ministry of Environment. (2016) ‘CATALOGO DEI SUSSIDI AMBIENTALMENTE FAVOREVOLI E DEI SUSSIDI AMBIENTALMENTE DANNOSI 2016’. Italian Ministry of Environment. (http://www.minambiente.it/sites/default/files/archivio/allegati/trasparenza_valutazione_merito/SVI/economia_ambientale/catalogo_sussidi_ambientali_-_def.pdf)
Jones, D., Huscher, J., Myllyvirta, L., Gierens, R., Flisowska, J., Gutmann, K., Urbaniak, D., and Azau, S. (2016) Europe’s Dark Cloud – how coal burning countries are making their neighbours sick. Brussels: CAN Europe; Brussels: European Environmental Bureau (EEB); Brussels: HEAL; Brussels/London: Sandbag; Gland: WWF (http://env-health.org/IMG/pdf/dark_cloud-full_report_final.pdf)
Littlecott, C. (2017) ‘Summary: The Coal Phase Out Transition - Italy’s Leadership Opportunity’. Washington D.C.: E3G (https://www.e3g.org/library/summary-the-coal-phase-out-transition-italys-leadership-opportunity)
Madson, D. (2017) ‘Finland is abandoning coal’. New Haven: Yale Climate Connections (http://www.yaleclimateconnections.org/2017/03/finland-is-abandoning-coal/)
McGlade, C., Pye, S., Watson, J., Bradshaw, M., and Ekins, P. (2016) ‘The future role of natural gas in the UK’ London: UKERC (UK Energy Research Centre). (http://www.ukerc.ac.uk/asset/9E5B1FD5-AB5D-4D36-AE83671E76E0E180)
Naturvårdsverket. (2017) ‘Potentiellt miljöskadliga subventioner 2’. Naturvårdsverket. (https://www.naturvardsverket.se/upload/miljoarbete-i-samhallet/miljoarbete-i-sverige/regeringsuppdrag/2017/redovisning-ru-pot-miljosk-subv.pdf)
OECD (2015) OECD Companion to the Inventory of Support Measures for Fossil Fuels 2015. Paris: OECD. (www.oecd.org/site/tadffss/)
OCI (2017) Shift the subsidies database. (http://priceofoil.org/shift-the-subsidies/) Oil Change International. (2016a) ‘Beyond450: Why the IEA’s “Climate Scenario” falls short’. Oil Change International
(OCI). (http://priceofoil.org/2016/04/06/beyond-450-why-the-iea-climate-scenario-falls-short/) AUTHOR: Muttitt, G.Oil Change International. (2016b) ‘The Sky’s Limit – Why the Paris climate goals require a managed decline of fossil
fuels production’. Washington D. C., Oil Change International. (http://priceofoil.org/content/uploads/2016/09/OCI_the_skys_limit_2016_FINAL_2.pdf)
Oil Change International. (2016c) ‘Budget 2016: exposing North Sea oil myths’, Oil Tax Facts. Washington D.C., Oil Change International. (http://priceofoil.org/content/uploads/2016/03/Oil-Tax-Facts.pdf)
Reuters. (2017) ‘Shell braces for ‘lower forever’ oil as profits soar’. London: Reuters. Rocha, M., Parra, P.Y., Sferra, F., Schaeffer, M., Roming, N., Ancygier, A., Ural, U. and, Hare, B. (2017). ‘A stress test
for coal in Europe under the Paris Agreement.’ New York: Climate Analytics. (http://climateanalytics.org/files/eu-coalstresstest-report-2017.pdf)
Sartor, O. and Spencer, T. (2015) ‘Fossil fuel subsidies and the new EU Climate and Energy Governance Mechanism’. Paris: Institute Sustainable Development and International Relations (IDDRI).
Sdralevich, C., Sab, R., Zouhar, Y. and Albertin, G. (2014) Subsidy Reform in the Middle East and North Africa. Recent Progress and Challenges Ahead. Washington, DC: International Monetary Fund. (www.imf.org/external/pubs/ft/dp/2014/1403mcd.pdf)
Shearer, C., Ghio, N., Myllyvirta, L., Yu, A., and Nace, T. (2017) Boom and Bust 2017: Tracking the Coal Plant Pipeline. CoalSwarm, Greenpeace USA, and Sierra Club. (http://endcoal.org/wp-content/uploads/2017/03/BoomBust2017-English-Final.pdf)
Stern, J. (2017) The Future of Gas in Decarbonising European Energy Markets: the need for a new approach. Oxford: The Oxford Institute for Energy Studies. (https://www.oxfordenergy.org/wpcms/wp-content/uploads/2017/01/The-Future-of-Gas-in-Decarbonising-European-Energy-Markets-the-need-for-a-new-approach-NG-116.pdf)
The Times. (2017) ‘Rockhopper sues Italy over oil field ban’. The Times. (https://www.thetimes.co.uk/article/explorer-seeks-redress-over-lost-oilfield-zjnptj5pw) AUTHOR: Godsen, E.
Tico Times. (2014) ‘Costa Rica extends ban on petroleum extraction’. San Jose: The Tico Times. (http://www.ticotimes.net/2014/07/28/costa-rica-extends-ban-on-petroleum-extraction) AUTHOR: Kane, C.
Transport and Environment. (2016) ‘Transport is now Europe’s biggest climate problem – EEA data’. Transport & Environment. (https://www.transportenvironment.org/press/transport-now-europe%E2%80%99s-biggest-climate-problem-eea-data)
Transport and Environment. (2015) ‘€27bn subsidy to diesel cars last year in lower fuel tax’. Transport & Environment. (https://www.transportenvironment.org/news/%E2%82%AC27bn-subsidy-diesel-cars-last-year-lower-fuel-tax)
UK DECC (Department of Energy and Climate Change) (2015) Freedom of Information Request: Our ref: FOI 2015/15308. London: Department of Energy & Climate Change. (https://www.gov.uk/government/uploads/system/uploads/attachment_data/file/455512/FOI_2015_15038_PUB.pdf)
UK Parliament (2017a) ‘Fossil Fuels: Tax Allowances: Written question - 63181’, 6 February 2017. ( http://www.parliament.uk/business/publications/written-questions-answers-statements/written-question/Commons/2017-02-06/63181/)

Phase-out 2020: monitoring Europe’s fossil fuel subsidies 37
UK Parliament (2017b) ‘Fossil Fuels: Subsidies:Written question - 63284’, 6 February 2017. (http://www.parliament.uk/business/publications/written-questions-answers-statements/written-question/Commons/2017-02-06/63284/)
UN (United Nations). (2015) ‘Sustainable development knowledge platform’. New York: UN (https://sustainabledevelopment.un.org/sdgs)
UNFCCC (United Nations Framework Convention on Climate Change). (2015) ‘Paris Agreement’. New York: UNFCCC. (http://unfccc.int/files/essential_background/convention/application/pdf/english_paris_agreement.pdf)
van der Burg, L., Whitley, S. (2016) ‘Rethinking power markets: capacity mechanisms and decarbonisation’. London: Overseas Development Institute. (https://www.odi.org/sites/odi.org.uk/files/resource-documents/10569.pdf)
Whitley, S., van der Burg, L., Worrall, L., Patel, S. (2017) ‘Cutting Europe’s lifelines to coal: Tracking subsidies in 10 countries’. ODI Policy Briefing. London: Overseas Development Institute. (https://www.odi.org/sites/odi.org.uk/files/resource-documents/11494.pdf)
Wikipedia. (2017) ‘Hydraulic fracturing by country’. Wikipedia. (https://en.wikipedia.org/wiki/Hydraulic_fracturing_by_country)
Wood Mackenzie. (2017) ‘European gas storage operators under pressure’. Wood Mackenzie. (https://www.woodmac.com/reports/gas-markets-european-gas-storage-operators-under-pressure-49576754)
World Resources Institute. (2015) ‘CAIT Climate Data Explorer’. Washington D.C.: World Resources Institute (http://cait.wri.org/historical).
WTO (World Trade Organization) (1994) Agreement on Subsidies and Countervailing Measures. (https://www.wto.org/english/docs_e/legal_e/24-scm.pdf)

38 Report
Annex 1: List of briefs
Czech Republic
European Union
France
Germany
Greece
Hungary
Italy
Netherlands
Poland
Spain
Sweden
United Kingdom

Phase-out 2020: monitoring Europe’s fossil fuel subsidies 39
European level (multilateral institutions)
Coal phase-out commitment?
Commitment date Summary of commitment Source name
European Investment Bank (EIB)
Yes - power plants 16th July 2014 Emissions performance standard - 550g/kWh maximum emissions intensity
Energy Lending Criteria, 2013
European Bank For Reconstruction And Development (EBRD)
Yes - power plants and mining
10th December 2013 Excluded except in rare cases EBRD Energy Sector Strategy (approved December 2013)
Table A1: Restrictions on coal finance by European public finance institutions (multilateral)
Source: Doukas et al., 2017
Annex 2: Restrictions on coal finance by European public finance institutions (bilateral and multilateral)

40 Report
Country level (bilateral institutions)
Commitment at national development agencies (NDAs) & banks?
Commitment at national/ domestic export credit agencies?
Export credit restriction in OECD?
Dates Notes Source
France Yes Yes Yes 01-Mar-13 Restrictions on export credits for coal plants without CCS and with no CO2 storage.
France's Speech at the Environmental Conference at Elysee
Germany Yes No Yes 22-Dec-14; 18-Nov-15
Restrictions on coal finance at bilateral institutions. KFW-Ipex bank restrictions still allow for coal plants below 500 MW and more than 500 MW if they meet a minimum efficiency standard.
Federal Government report on the financing of international coal-related projects for the Economic Committee of the Bundestag
Italy No No Yes 18-Nov-15 OECD statement
United Kingdom Yes No Yes 20-Nov-13; 18-Nov-15
Issued policy statement similar to US/ Nordic joint statement restricting coal finance overseas, but this did not apply to export credits
Statement
Czech Republic No No Yes 18-Nov-15 OECD statement
Greece No No Yes 18-Nov-15 OECD statement
Hungary No No Yes 18-Nov-15 OECD statement
Netherlands Netherlands’ Development Finance Company (FMO) has a policy statement, but no policy
No Yes 24-Mar-14; 18-Nov-15
US/Netherlands joint statement covers bilateral development finance institutions and MDB projects; FMO policy forbids any investment in thermal coal power or mining
Statement; FMO position statement (weaker than a policy) on mining and coal power
Poland No No Yes 18-Nov-15 OECD statement
Spain No No Yes 18-Nov-15 OECD statement
Sweden Yes Yes Yes 4-Sep-13; 18-Nov-15
Joint US/Nordic statement ended public finance for coal overseas except in rare circumstances.
OECD statement
Table A2: Restrictions on coal finance by European public finance institutions (bilateral)
Source: Doukas et al., 2017

Phase-out 2020: monitoring Europe’s fossil fuel subsidies 41
Annex 3: Additional information on research methodology
22 All conversions were made using the average annual rates, as provided by the Canadian Foreign Exchange website, available here: http://www.canadianforex.ca/forex-tools/historical-rate-tools/yearly-average-rates
This section builds on Chapter 3: Methodology above, and provides further information on timeframes, currency conversions, and other methodological considerations.
Timeframes: Subsidies’ annual numbers are based on averages of subsidy data from 2014, 2015 and 2016 (of whichever years are available). For data sets that only covered information up to 2014 (for example the OECD Inventory of Support Measures for Fossil Fuels 2015), data was carried forward for 2015 and 2016 assuming that the measure continued at the same rate (unless parallel sources confirmed the support had been discontinued). Where a measure was started in 2015 or 2016, the years before were assumed to be zero, and the average of the three years reflected this.
Financial years: As different countries have different financial years, data was presented for the year with which most of the months of the financial year overlapped. All countries, except the UK and Italy used calendar years as their fiscal year. The UK’s fiscal year is from April 1st – March 31st, and so the numbers were reported in the year where 9 months overlapped. Italy’s fiscal year is from 1st July – 30th June. Following OECD convention, data are allocated to the starting calendar year so that, for example, data covering the period July 2005 to June 2006 are allocated to 2005.
Currency conversions: Subsidies were often available – and recorded – in national currencies for each year, and then averaged to get an annual number (also in national currency). Where annual subsidy numbers were provided in currencies other than the national currency, they were converted and recorded in national currencies as well. 22 A Euro average was then provided for the countries with do not use the Euro.
Calculations: This report had the main aim of collating data from publicly-available sources. However, a number of calculations were made regarding electricity subsidies, and transport to ensure only the amount of support going to fossil fuels was included. All calculations made were indicated in the Notes column of the country and EU data sheets. Double counting (Public finance): We have taken steps to ensure that support provided through public finance is not double counted with fiscal support or state-owned enterprise investment. Where government budgets provide information on the use of public finance, this information is included in the fiscal support section and no public finance is counted. In addition, where public finance was provided to a domestic SOE, amounts were included where more information was available. Double counting (SOE investment): We have taken steps to ensure that production subsidies provided through SOE investment are not double counted with fiscal support and public investment. Where government budgets specify transfers to SOEs, this information is included in the fiscal support section and no SOE investment is counted. In contrast, where more detailed information is provided for SOE investment than government budget transfers to SOEs, then the SOE investment is counted, while the transfers are excluded from the fiscal support. A similar approach has also been taken to ensure no double counting between SOE investment and public finance provided to SOEs.
Classification by activity and sector: The table below demonstrates how detailed classifications were used within the data sheets to allocate subsidies to a narrower set of activities and sectors.

42 Report
Activity / sector (in country briefs and EU brief and summary report findings)
Targeted energy source (in data sheet)
Incidence (in data sheet) Stage / sector (in data sheet)
Production
Coal mining Coal ProductionInfrastructure (inc. distribution)
Development, extraction and preparation;Decommissioning and rehabilitation; Transition support (communities and workers)
Oil and gas production
Oil; gas; oil and gas ProductionInfrastructure (inc. distribution)
Exploration, access and appraisal; Development, extraction and preparation;Decommissioning and rehabilitation; Transition support (communities and workers)Pipelines and storage
Electricity production
Electricity (coal-based);Electricity (gas-based);Electricity (coal- and gas-based);Electricity (unspecified);
ProductionInfrastructure (inc. distribution)
Power plantsGrid
Consumption
Transport Oil; gas; oil and gas; Electricity; Multiple or unclear
Consumption Aviation; Maritime; Transport
Business and industry
Coal; oil; gas; oil and gas; Electricity;Multiple or unclear
Consumption Business and industry; Heating;
Household Coal; oil; gas; oil and gas; Electricity; Multiple or unclear
Consumption Infrastructure (inc. distribution)
Household; Heating
Agriculture Oil; gas; oil and gas; Multiple or unclear
Consumption Agriculture;
Table A3: Categorization of subsidies in data sheets for presenting report findings

Phase-out 2020: monitoring Europe’s fossil fuel subsidies 43
Annex 4: Europe’s fossil fuel subsidies by activity and instrument
Production Consumption TOTAL
Instrument/activity
Coal mining
Oil and gas
Electricity Multiple or unclear
Transport Industry and business
Household Agriculture Multiple or unclear
Fiscal support(Budget expenditure+ tax exemptions+ price and income support)
3,328 3,326 5,838 1,067 49,222 14,975 6,641 2,564 1,613 88,574
Public finance 411 7,257 1,714 2,587 0 0 23 0 0 11,992
Domestic + EU 23 3,079 25 255 0 0 23 0 0 3,405
International (outside the EU)
389 4,178 1,688 2,332 0 0 0 0 0 8,587
State-owned enterprise (SOE) investment
434 2,730 5,646 2,592 0 0 362 0 0 11,764
Table A4: Europe’s* fossil fuel subsidies by activity and instrument (Euro millions, annual average 2014-2016)
Note: For sources and data, see data sheet available at odi.org/Europe-fossil-fuel-subsidies
* Data refers to 11 countries (Czech Republic, France, Germany, Greece, Hungary, Italy, the Netherlands, Poland, Spain, Sweden and the United
Kingdom) and the European Union.

44 Report
Country Public finance institutionsincluded in analysis
State-owned enterprises included in analysis
Czech Republic Export Guarantee and Insurance Corporation (EGAP)Czech Export Bank (CEB)
MERO CRCEPRO a.s.CEPS a.s. CEZ Group
France Agence Francaise de Development (AfD)Compagnie Française d'Assurance pour le Commerce Extérieur (COFACE)PROPARCOA
Électricité de France (EDF)
Germany Deutsche Investitions- und Entwicklungsgesellschaft (DEG)Euler HermesB
KfWKfW-IPEX Bank
Not applicable
Greece Not available (loan guarantee to PPC) Public Power Corporation (PPC)
Hungary Not availableC MVM Group
Italy Cassa Depositi e Prestiti (CDP)Servizi Assicurativi del Commercio Estero (SACE)
Not applicable
Netherlands Financierings-Maatschappij voor Ontwikkelingslanden (FMO)ABN AMROD
Atradius Dutch State Business (ADSB)E
SNS Bank
Delta EnecoEnergie Beheer Nederland (EBN)Gas TerraGasunie
Poland Bank Gospodarstwa Krajowego (BGK)Korporacja Ubezpiecze n Kredytów Eksportowych (KUKE)
Energetyka Pozna nska S.A. (ENEA SA) Grupa Kapitałowa Energa (ENERGA)Grupa Lotos Polska Grupa Energetyczna (PGE)PSE-Operator SA Polskie Górnictwo Naftowe i Gazownictwo (PGNiG) Operator Gazoci agów Przesyłowych (GAZ-SYSTEM S.A.)
Spain Compañía Española de Seguros de Crédito a la Exportación (CESCE) Not applicable
Sweden Swedish National Export Credits Guarantee Board Exportkreditnämnden (EKN)
Vattenfall
UK Department for Business, Innovation and Skills (BIS)F
CDC Group plc (CDC)G
Department for International Development (DFID)Royal Bank of Scotland (RBS)H
UK Export Finance (UKEF)
Not applicable
EU European Bank for Reconstruction and Development (EBRD) European Investment Bank (EIB)I
Not applicable
Annex 5: List of SOEs and public finance institutions reviewedTable A5: List of state-owned enterprises (SOEs) and public finance institutions reviewed (government ownership 50% or more)

Phase-out 2020: monitoring Europe’s fossil fuel subsidies 45
A PROPARCO is a Development Financial Institution partly owned by French Development Agency (AFD) (64%) and private shareholders from the developed countries and developing nations.
B Although Euler Hermes is 63% owned by Allianz SE (a private German bank), decisions on matters of principle and the underwriting of large export transactions are made by an inter-ministerial committee comprising representatives of the German Federal Ministry of Economics and Technology, the Federal Ministry of Finance, the German Foreign Office and the Federal Ministry for Economic Cooperation and Development.
C Hungarian Development Bank Private Limited Company (MFB); Hungarian Export Credit Insurance Ltd (MEHIB) and Hungarian Export-Import Bank plc (EXIM) may provide finance for fossil fuels, however their reporting format (in non-searchable PDF) means that based on our available resources for this report we could not identify beneficiary sectors and projects for these institutions.
D ABN AMRO was re-established in its current form in 2009, following the acquisition and break-up of the original ABN AMRO by a banking consortium consisting of Royal Bank of Scotland Group, Santander Group and Fortis. Following the collapse of Fortis, who acquired the Dutch business, it was nationalized by the Dutch government along with Fortis Bank Nederland.
E Although Atradius N.V. is a private company wholly owned by Grupo Catalana Occidente, S.A. and Grupo Compañía Espanõla de Crédito y Caución, S.L. (as of December 30th, 2016). Its subsidiary Atradius Dutch State Business (ADSB) continues to report directly to the Dutch Ministry of Finance, which together with the Dutch Ministry of Foreign Affairs is responsible for implementing the Netherlands’ policies on ECAs.
F In July 2016, The Department for Business, Innovation and Skills (BIS) and the Department of Energy and Climate Change (DECC) were merged to form the Department for Business, Energy and Industrial Strategy (BEIS).
G CDC Group plc (formerly the Commonwealth Development Corporation, and before that, the Colonial Development Corporation) is a development finance institution owned by the UK government. The Department for International Development (DFID) is responsible for CDC
H The UK government holds a 73% stake in the Royal Bank of Scotland (RBS).I This analysis includes the European Fund for Strategic Investments (EFSI) which is jointly managed by the EIB Group and the European Commission.

ODI is the UK’s leading independent think tank on international development and humanitarian issues. Climate Action Network (CAN) Europe is Europe’s largest coalition working on climate and energy issues.
Readers are encouraged to reproduce material for their own publications, as long as they are not being sold commercially. As copyright holders, ODI and CAN Europe request due acknowledgement and a copy of the publication. For online use, we ask readers to link to the original resource on the ODI website. The views presented in this paper are those of the author(s) and do not necessarily represent the views of ODI or our partners.
© Overseas Development Institute and CAN Europe 2017. This work is licensed under a Creative Commons Attribution-NonCommercial Licence (CC BY-NC 4.0).
All ODI publications are available from www.odi.org
Cover photo: Oil refinery in Nordrhein-Westfalen, Germany – Ralf Vetterle (CC0 creative commons license).
Overseas Development Institute203 Blackfriars Road London SE1 8NJTel +44 (0) 20 7922 0300 Fax +44 (0) 20 7922 0399
Shaping policy for development odi.org | @ODIdev
CAN EuropeRue d’Edimbourg 26 1050 Brussels, BelgiumTel: +32 (0) 28944670