phase requirements, design and validation of phase
TRANSCRIPT
CEOS SAR 2010 – Zurich 25-27 August
Phase Requirements, design and validation of phase preserving processor for a spaceborne SAR
Michele Belotti, Davide D'Aria, Nuno Miranda,
Andrea Monti Guarnieri, Betlem Rosich, Silvia Scirpoli

OUTLINE
Defining a suitable focusing phase accuracy requirement for interferometric applications
Definition of the acquisition modes
Test definition
Test pertinence
2
CEOS SAR 2010 – Zurich 25-27 August
Test pertinence
ω-k CZT algorithm
Phase preserving test applied at CZT algorithm
Conclusion
3Phase requirements for interferometric application
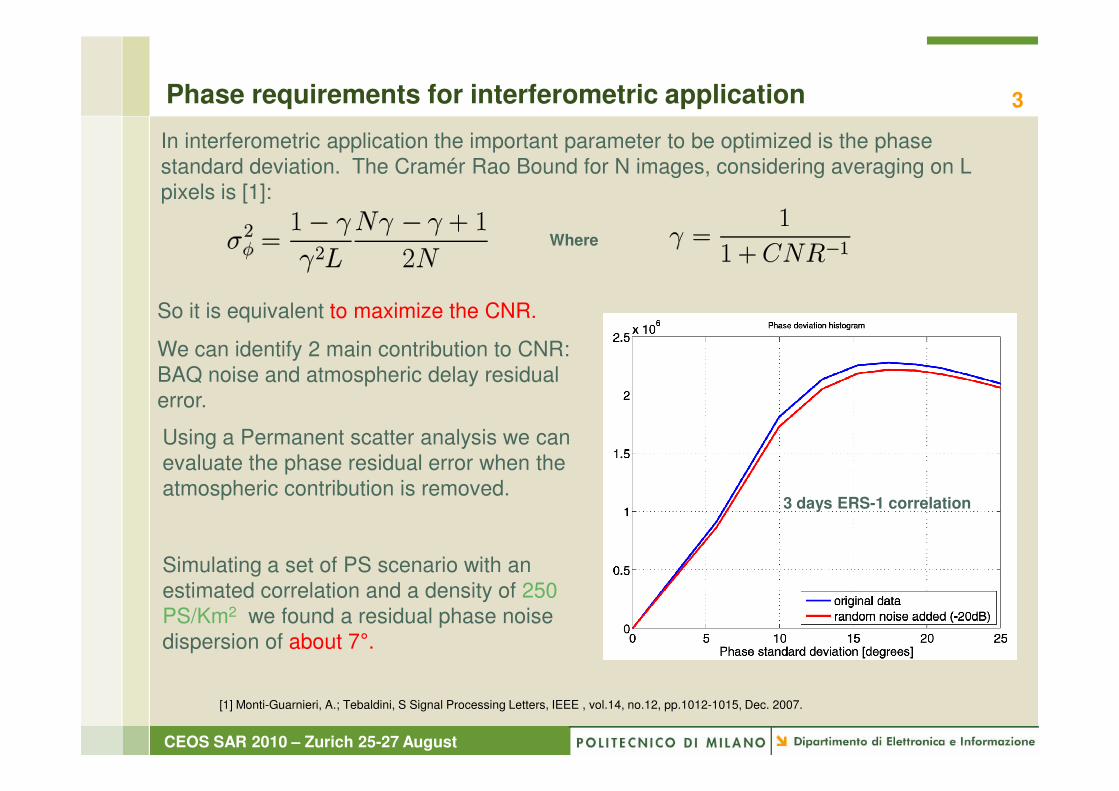
In interferometric application the important parameter to be optimized is the phase
standard deviation. The Cramér Rao Bound for N images, considering averaging on L
pixels is [1]:
Where
So it is equivalent to maximize the CNR.
We can identify 2 main contribution to CNR:
BAQ noise and atmospheric delay residual
error.
CEOS SAR 2010 – Zurich 25-27 August
Using a Permanent scatter analysis we can
evaluate the phase residual error when the
atmospheric contribution is removed.
Simulating a set of PS scenario with an
estimated correlation and a density of 250
PS/Km2 we found a residual phase noise
dispersion of about 7°.
3 days ERS-1 correlation
error.
[1] Monti-Guarnieri, A.; Tebaldini, S Signal Processing Letters, IEEE , vol.14, no.12, pp.1012-1015, Dec. 2007.
4
Definition of the focusing process phase accuracy requirement
The interferometric phase error introduced by the
focuser must be at least smaller than the expected
error introduced by residual APS
CEOS SAR 2010 – Zurich 25-27 August
error introduced by residual APS

5
To evaluate the performance of different focusing algorithm and to validate their efficacy and precision the definition of a series of phase
preserving test is necessary.
It’s also important to take into account the different nature of raw data to address suitable tests.
The future SAR mission introduce innovative acquisition geometries to
maximize target bandwidth and ground coverage.
CEOS SAR 2010 – Zurich 25-27 August
In this work we take into account four different class of acquisition:
STRIPMAP
SCANSAR
TOPSAR
SPOT

6STRIPMAP ACQUISITION GEOMETRY
Stripmap is the conventional full
resolution Synthetic Aperture Radar
mode. The antenna footprint moves at
the satellite speed along its orbit.
CEOS SAR 2010 – Zurich 25-27 August
•Continuous acquisition
•Single swath

7SCANSAR ACQUISITION GEOMETRY
Multi BURST Acquisition by switching the antenna
look angle.
Antenna is fixed in azimuth direction.
CEOS SAR 2010 – Zurich 25-27 August
This acquisition scheme allows for the coverage of a
ground scene that is N times wider than that of
conventional SAR modes with a proportional loss in
the azimuth resolution and in radiometric precision.

8TOPSAR ACQUISITION GEOMETRY
Multi Burst acquisition by changing
the antenna look angle.
Antenna is steered in azimuth
direction during the acquisition of
each burst from backward to forward
achieving a larger bandwidth for all
the ground points.
CEOS SAR 2010 – Zurich 25-27 August

9SPOT ACQUISITION GEOMETRY
Antenna is steered from forward to
backward during the acquisition, in
opposite direction to respect TOPSAR
acquisition.
CEOS SAR 2010 – Zurich 25-27 August
Continuous acquisition with selected area
with increased resolution

TEST DEFINITION
The new acquisition geometries cannot always be validate with the existing tests so it is necessary to define some extension and new test to perform phase quality check of the incoming data.
10
CEOS SAR 2010 – Zurich 25-27 August
We introduce two test classes:
Single image/ single burst test
Multi swath/ multi burst point target test
CEOS OFFSET
MODIFIED CEOS OFFSET
SIZE BLOCK
INTER BURST TEST
INTER SWATH TEST

11STANDARD CEOS OFFSET TEST
Process two SLCs from the same raw data set and with the same orbit, but offset by
l00 lines in azimuth and l00 sample in range. The interferogram formed from these
two properly coregistered SLCs should ideally have a constant phase of zero and
thus reveals processor induced artifacts.
Bamler, R. and Hartl, P., Inverse Problems, vol.14 1998 R1-R54.
CEOS SAR 2010 – Zurich 25-27 August
Pass/Fail criteria:
•Mean of interferogram phase ≤ 0.1°
•Standard deviation ≤ 5.5°
•No discontinuity at block boundaries.
Alessandro Ferretti, Andrea Monti-Guarnieri, Claudio Prati, Fabio Rocca, Didier Massonnet InSAR Principles: Guidelines for SAR Interferometry Processing and Interpretation 2007 European Space Agency

12Modified CEOS
The original CEOS as it is defined, is
applicable only to STRIPMAP data
In order to define an extended CEOS test suitable also for SCAN/TOPS/SPOT we have to introduce some changes to the original CEOS procedure:
1) Zeroing the undesired raw data echoes in the shifted data in order
CEOS SAR 2010 – Zurich 25-27 August
1) Zeroing the undesired raw data echoes in the shifted data in order to avoid spurious noise contribution in the final SLC data
2) Update the focuser Doppler centroid input in order to ‘simulate’ the different antenna steering induced by the cutting of the raw data

13UPDATE THE DC
FOR EXAMPLE FOR TOPSAR ACQUISITION IS NECESSARY TO ADJUST THE
STARTING DC DUE TO THE CHANGE IN THE STEERING LAW
CEOS SAR 2010 – Zurich 25-27 August

14MODIFIED CEOS OFFSET TEST
1. Zeroing M (100) lines in range and N
(100) in azimuth
2. Cut and zero padding the second
dataset
3. Process the first with original DC
4. Process the second dataset with
updated DC according to steering law
change
First dataset Second dataset
∅
∅
∅
∅
CEOS SAR 2010 – Zurich 25-27 August
change
5. Evaluate the mean and std for the
proper coregister interferogram
between the two SLC
AREA TO BE TESTEDPass/Fail criteria:
•Mean of interferogram phase ≤ 0.1°
•Standard deviation ≤ 5.5°
•No discontinuity at block boundaries.

15SIZE BLOCK TEST
Process two SLCs from the same raw data set and with the same orbit. One of SLCs
has scaled dimensions with respect to the other one: 30% of range samples, 30% of
azimuth lines. The interferogram formed from these two properly co-registered SLCs
should ideally have a constant phase of zero and thus reveals processor induced
artifacts.
CEOS SAR 2010 – Zurich 25-27 August
Pass/Fail criteria:
•Mean of interferogram phase ≤ 0.1°
•Standard deviation ≤ 5.5°
•No discontinuity at block boundaries.

16INTER-BURST POINT TARGET TEST
Process two SLCs from the same simulated raw data set, with the same orbit and
with a single point target. The SLCs will contain different parts of the point scatterer
Doppler history. The phase of the point target should ideally be the same in the two
images. Phase differences thus reveal processor induced artifacts.
CEOS SAR 2010 – Zurich 25-27 August
Pass/Fail criteria:
• Phase difference ≤ 5.5°.

17INTER-SWATH POINT TARGET TEST
Process two SLCs from the same simulated raw data set, with the same orbit and with
a single point target. The SLCs will contain different parts of the point scatterer
Doppler history. The phase of the point target should ideally be the same in the two
images. Phase differences thus reveal processor induced artifacts.
CEOS SAR 2010 – Zurich 25-27 August
Pass/Fail criteria:
• Phase difference ≤ 5.5°.

18TEST PERTINENCE FOR DIFFERENT ACQUISITION MODES
Stripmap ScanSAR TopSAR Spot
Intra burst/swath
Inter burst/swath
Intra burst/swath
Interburst/swath
CEOS
CEOS SAR 2010 – Zurich 25-27 August
Extended CEOS
Scaled Block
Inter burst PT test
Inter swath PT test

19TEST APPLICATION
We want now to apply this test to verify the phase preservation of a new implementation of omega-k algorithm.
This new implementation is based on a chirp Zeta transform to avoid the
CEOS SAR 2010 – Zurich 25-27 August
This new implementation is based on a chirp Zeta transform to avoid the 2D domain Stolt interpolation
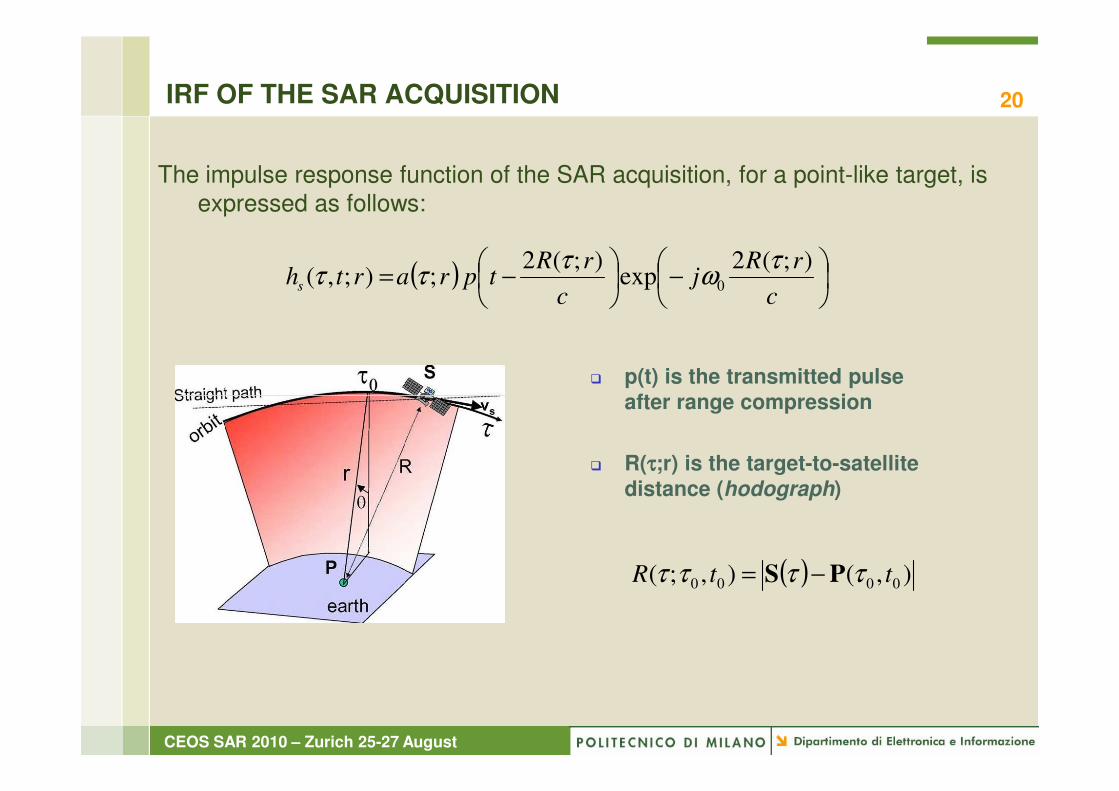
20IRF OF THE SAR ACQUISITION
The impulse response function of the SAR acquisition, for a point-like target, is
expressed as follows:
( )
−
−=
c
rRj
c
rRtprarths
);(2exp
);(2;);,( 0
τω
τττ
p(t) is the transmitted pulse
after range compression
CEOS SAR 2010 – Zurich 25-27 August
( ) ),(),;( 0000 ttR ττττ PS −=
after range compression
R(ττττ;r) is the target-to-satellite
distance (hodograph)

21OMEGA-K FOCUSING (I)
The ω−k approach provides an efficient implementation of the range-varying
convolution:
In the 2D frequency domain the convolution becomes:
);,();,(),( 00 rthrttdta ss −−∗∗−=∗
∧
τττ
);,()exp();,();,( ,rkHrjrkDrkA x
tx
ssxx ωωω Ω−=∧
CEOS SAR 2010 – Zurich 25-27 August
));,(exp();,();,();,( rkjrkHrkDrkA xrrefxrefxx ωψωωω =∧
Using MSP (Method of Stationary Phase) we can write the kernel as
));,(exp();,();,( rkjrkDrkA xxx ωψωω =∧
Phase ψ is split into a range variant and range invariant term:
Range independent Range dependent

22SPECTRAL SUPPORT OF DATA
The system filters the angular pulsation frequency in the interval:ω=ω0±2*π*B/2
Illumination pattern bounds antenna angular interval at:
ϕ=ϕ0±∆ϕ/2
CEOS SAR 2010 – Zurich 25-27 August

23FIRST ORDER STOLT APPROXIMATION
We use a first order approximation of frequency interpolation:
( ) vvrv kc
kkgc
uk 10
1
0
1
010
2)(
2)( ββ
α
α
α
αωωααω +=+−≈=+≈=
We can obtain kt stretching the ω axis modulated of –β0
CEOS SAR 2010 – Zurich 25-27 August
To implement first order frequency interpolation we use Chirp Z Transform in
the time-Doppler domain (t,kx)
We can obtain kt stretching the ω axis modulated of –β0
tk10 ββω =−

24ALGORITHM FLOWCHART (Azimuth compression)
Chirp Z Transform
Apply range invariant kernel
CEOS SAR 2010 – Zurich 25-27 August
Apply range invariant kernel
Residual phase correction

25TOPSAR FOCUSER ALGORITHM
Frequency domain unfolding & resampling
Azimuth compression block
RGCdata
(1 burst)
To process TOPSAR and SPOT data further step are needed
1) A preprocessor to unfold the frequency domain
CEOS SAR 2010 – Zurich 25-27 August
Time domain unfolding & resampling
SLC data
(1 burst)
2) Fine azimuth compression block
3) An azimuth 1D ‘unfolding’ processing block

26EXTENDED CEOS OFFSET TEST
Simulated uniform distributed scenario SENTINEL IW TOPSAR mode.
Symbol Meaning Value
λ Wavelength 0.055 m
f0 Carrier frequency 5.4 GHz
fs Range sampling frequency 64.35 MHz
W System bandwidth 54 MHz
La Antenna length 12 m
vs Platform mean velocity 7599 m/s
ϕ Max Squint Angle ±1.29°
RAW Data simulated with High DC 6 KHz
SLC Proper corregistered.
CEOS SAR 2010 – Zurich 25-27 August
ϕ Max Squint Angle ±1.29°
Rc Orbit local radius of curvature 7068 km
Focused DATA Raw data Spectrogram
Azimuth
Range
200 400 600 800 1000 1200 1400
200
400
600
800
1000
1200

2000
40001
2
3
27EXTENDED CEOS OFFSET TEST (II)
Mean = -0.0345[deg]
Std = 2.4681[deg]
3.5
4x 10
6 Angle distribution
INTERFEROGRAM ON COMMON REGION
CEOS SAR 2010 – Zurich 25-27 August
200 400 600 800 1000 1200
6000
8000
10000
12000
-3
-2
-1
0
1
-1.5 -1 -0.5 0 0.5 1 1.50
0.5
1
1.5
2
2.5
3
3.5
Angle [rad]

28BLOCK SIZE TEST
Azimuth
Range
∠ ( Dato1 * conj( Dato2 ) )
1000 2000 3000 4000 5000 6000 7000 8000 9000
100
200
300
400
500
600
700
800
900
1000
1000 2000 3000 4000 5000 6000 7000 8000 9000-0.05
0
0.05
Azimuth
Mean ∠
100 200 300 400 500 600 700 800 900 1000-0.05
0
0.05
Range
Mean ∠
Mean ∠
-0.05
-0.04
-0.03
-0.02
-0.01
0
0.01
0.02
0.03
0.04
0.05
CEOS SAR 2010 – Zurich 25-27 August
Azimuth
Range
∠ ( F(Dato1) * conj( F(Dato2) ) )
1000 2000 3000 4000 5000 6000 7000 8000 9000
100
200
300
400
500
600
700
800
900
1000-0.05
-0.04
-0.03
-0.02
-0.01
0
0.01
0.02
0.03
0.04
0.05
1000 2000 3000 4000 5000 6000 7000 8000 9000-0.05
0
0.05
Azimuth
Mean ∠
100 200 300 400 500 600 700 800 900 1000-0.05
0
0.05
Range
Mean ∠
Mean = -0.00032177[deg]
Std = 1.7804[deg]

29INTER BURST TEST
TOPSARBurst 1
TOPSARBurst 2
PT
40
45
50
55
60
65
70
75
80
85
90
Focused target
Worst case at the burst edge
phase difference: < 4 [deg]
CEOS SAR 2010 – Zurich 25-27 August
45 50 55 60 65 70 75 80 85
20 40 60 80 100 120
20
40
60
80
100
120
20 40 60 80 100 120
20
40
60
80
100
120
Point target 1° burst Point target 2° burst
phase difference: < 4 [deg]

30CONCLUSION
We discuss the phase requirements accuracy for a focuser processor
We have presented new test and extension of existing ones to
evaluate phase performance of focusing algorithm and validate
efficiency and precision.
The applicability of this new tests to the existing acquisition
geometries is discussed.
CEOS SAR 2010 – Zurich 25-27 August
We propose a new implementation of the ωωωω-k focusing algorithm
The phase preservation has been verified for this algorithm.

31OMEGA-K FOCUSING (I)
The ω−k approach provides an efficient implementation of the range-varying
convolution:
In the 2D frequency domain the convolution becomes:
);,();,(),( 00 rthrttdta ss −−∗∗−=∗
∧
τττ
);,()exp();,();,( ,rkHrjrkDrkA x
tx
ssxx ωωω Ω−=∧
CEOS SAR 2010 – Zurich 25-27 August
– with
);,()exp();,();,( rkHrjrkDrkA xssxx ωωω Ω−=
( )c
02 ωω +=Ω
We need to estimate the 2D IRF spectrum Hsx,t (kx,ω;r):
( ) ( )( )rxRjrxHt
s ;exp;, Ω=ω
( ) ( )( ) ( )∫ −Ω= dxxjkrxRjrkH xx
tx
s exp;exp;,, ω

32OMEGA-K FOCUSING (2)
Using MSP (Method of Stationary Phase):
where
( ) ( )( )( )fxfx
tx
s xkrxRjrkH −Ω≈ ;exp;,, ω
Ω=⇒=−
∂
∂Ω
=
xx
xx
kk
x
rxR
f
ξ0);(
We obtain:
CEOS SAR 2010 – Zurich 25-27 August
( )( )( )));,(exp();,(
;exp)exp();,();,(
rkjrkD
xkrxRjrjrkDrkA
xx
fxfsxx
ωψω
ωω
=
−ΩΩ−=∧
Phase ψ is split into a range variant and range invariant term:
));,(exp());,(exp());,(exp( refxrefxrx rkjrkjrkj ωψωψωψ ⋅=
Range dependent Range independent

33OMEGA-K FOCUSING (3)
Focusing becomes
));,(exp();,();,();,( rkjrkHrkDrkA xrrefxrefxx ωψωωω =∧
For each wave number kx it is assumed that there is separable decomposition:
);();();,( xxxr krvkurk ωωψ =
CEOS SAR 2010 – Zurich 25-27 August
));();(exp();,();,();,( xxrefxrefxx krvkjurkHrkDrkA ωωωω =∧
We make a change of variable r - v and transform along stretched range
with
( )( )vxxrefxvx kkgkHkDkkA ,),(),(),( −∗=∧
ωδωω
)(),( vv kguk == ωω

34CHIRP Z TRANSFORM
k
k AWz−=
22and
πφπθ jjeWWeAA ==
With CZT we can compute the Z
transform on a more general contour of the form:
with:
CEOS SAR 2010 – Zurich 25-27 August
By A we can control frequency shift (-β0)
By W we can perform frequency stretch (β1) selecting an appropriate frequency
interval: (fs * β1)
00 2
0
2
0 andπφπθ jj
eWWeAA ==
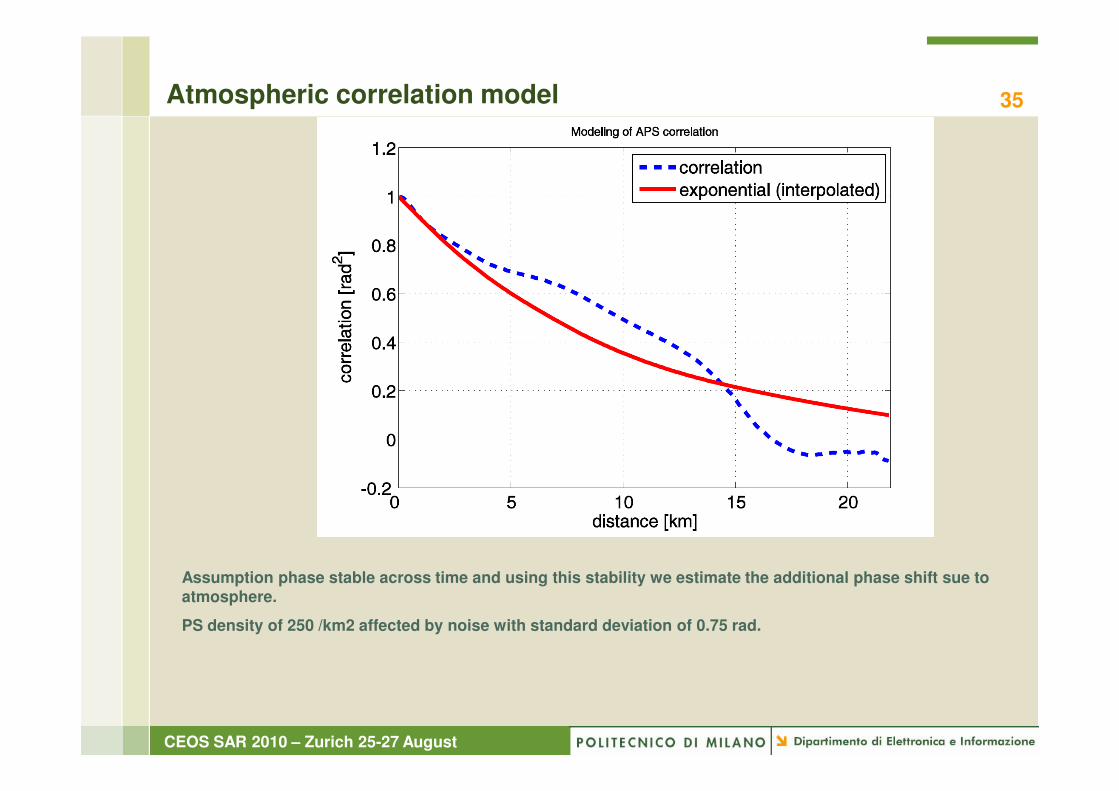
35Atmospheric correlation model
CEOS SAR 2010 – Zurich 25-27 August
Assumption phase stable across time and using this stability we estimate the additional phase shift sue to atmosphere.
PS density of 250 /km2 affected by noise with standard deviation of 0.75 rad.
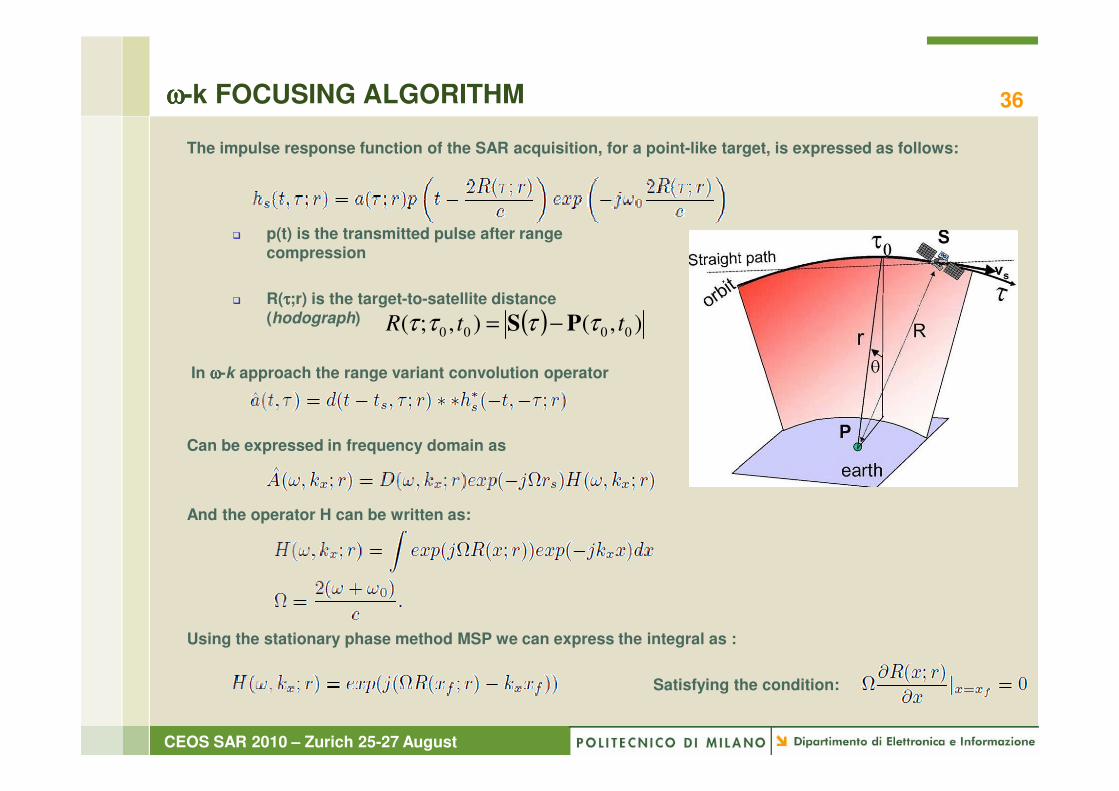
36ωωωω-k FOCUSING ALGORITHM
The impulse response function of the SAR acquisition, for a point-like target, is expressed as follows:
In ωωωω-k approach the range variant convolution operator
p(t) is the transmitted pulse after range compression
R(ττττ;r) is the target-to-satellite distance (hodograph) ( ) ),(),;( 0000 ttR ττττ PS −=
CEOS SAR 2010 – Zurich 25-27 August
Can be expressed in frequency domain as
And the operator H can be written as:
Using the stationary phase method MSP we can express the integral as :
Satisfying the condition:

37Algorithm implementation (I)
The hodograph can be fitted with a 4 grade polynomial curve
And also its slope can be expressed as a polynomial form
HODOGRAPH DETERMINATION
CEOS SAR 2010 – Zurich 25-27 August
This series can be inverted to determine the stationary point
And the focusing operator phase can be so expressed as
FOCUSING OPERATOR PHASE

38Algorithm implementation (II)
The focus kernel can be expressed as:
Range independent
Range dependent
CEOS SAR 2010 – Zurich 25-27 August
Range dependent
The range dependant term can be treated with a Chirp Z transform, if we apply the following approximation :
The transform coefficient can be directly obtained:

39MODIFIED CEOS OFFSET TEST
Consider two SLCs from the same raw data set and with the same orbit, but offset by
100 lines in azimuth and 100 samples in range.
Process the first SLCs after resetting to zero the first 100 lines in azimuth;
process the second image after resetting the last 100 lines and updating the processor
initial Doppler centroid according to the cut steering law.
The interferogram formed from these two properly coregistered SLCs should ideally
have a constant phase of zero and thus reveals processor induced artifacts.
CEOS SAR 2010 – Zurich 25-27 August
Pass/Fail criteria:
•Mean of interferogram phase ≤ 0.1°
•Standard deviation ≤ 5.5°
•No discontinuity at block boundaries.