phd thesis ssklet ver 7 - osti.gov
TRANSCRIPT
Snorre Sklet
Safety Barriers on Oil and Gas PlatformsMeans to Prevent Hydrocarbon Releases
Doctoral thesisfor the degree of doktor ingenior
Trondheim, December 2005
Norwegian University of Science and TechnologyFaculty of Engineering Science and Technology Department of Production and Quality Engineering
0NTNUInnovation and Creativity
NTNUNorwegian University of Science and Technology
Doctoral thesisfor the degree of doktor ingenior
Faculty of Engineering Science and Technology Department of Production and Quality Engineering
©Snorre Sklet
ISBN 82-471-7742-0 (printed ver.)ISBN 82-471-7741 -2 (electronic ver.)ISSN 1503-8181
Doctoral Theses at NTNU, 2006:3
Printed by Tapir Uttrykk
Safety Barriers on Oil and Gas Platforms
Means to Prevent Hydrocarbon Releases
Doctoral Thesis
by
Snorre Sklet
Department of Production and Quality Engineering,The Norwegian University of Science and Technology (NTNU)


Thesis - Summary
Summary
The main objective of the PhD project has been to develop concepts and methods that can be used to define, illustrate, analyse, and improve safety barriers in the operational phase of offshore oil and gas production platforms.
The main contributions of this thesis are;
► Clarification of the term safety barrier with respect to definitions, classification, and relevant attributes for analysis of barrier performance
► Development and discussion of a representative set of hydrocarbon release scenarios
► Development and testing of a new method, BORA-Release, for qualitative and quantitative risk analysis of hydrocarbon releases
Safety barriers are defined as physical and/or non-physical means planned to prevent, control, or mitigate undesired events or accidents. The means may range from a single technical unit or human actions, to a complex socio-technical system. It is useful to distinguish between barrier functions and barrier systems. Barrier functions describe the purpose of safety barriers or what the safety barriers shall do in order to prevent, control, or mitigate undesired events or accidents. Barrier systems describe how a barrier function is realized or executed. If the barrier system is functioning, the barrier function is performed. If a barrier function is performed successfully, it should have a direct and significant effect on the occurrence and/or consequences of an undesired event or accident.
It is recommended to address the following attributes to characterize the performance of safety barriers; a) functionality/effectiveness, b) reliability/ availability, c) response time, d) robustness, and e) triggering event or condition. For some types of barriers, not all the attributes are relevant or necessary in order to describe the barrier performance.
The presented hydrocarbon release scenarios include initiating events, barrier functions introduced to prevent hydrocarbon releases, and barrier systems realizing the barrier functions. Both technical and human/operational safety barriers are considered. The initiating events are divided into five main categories; (1) human

Thesis - Summary
and operational errors, (2) technical failures, (3) process upsets, (4) external events, and (5) latent failures from design.
The development of the hydrocarbon release scenarios has generated new knowledge about causal factors of hydrocarbon releases and safety barriers introduced to prevent the releases. Collectively, the release scenarios cover the most frequent initiating events and the most important safety barriers introduced to prevent hydrocarbon releases.
BORA-Release is a new method for qualitative and quantitative risk analysis of the hydrocarbon release frequency on oil and gas platforms. BORA-Release combines use of barrier block diagrams/event trees, fault trees, and risk influence diagrams in order to analyse the risk of hydrocarbon release from a set of hydrocarbon release scenarios.
Use of BORA-Release makes it possible to analyse the effect on the hydrocarbon release frequency of safety barriers introduced to prevent hydrocarbon releases. Further, BORA-Release may be used to analyse the effect on the barrier performance of platform specific conditions of technical, human, operational, and organisational risk influencing factors. Thus, BORA-Release may improve today’s quantitative risk analyses on two weak points; i) analysis of causal factors of the initiating event hydrocarbon release (loss of containment), and ii) analysis of the effect on the risk of human and organisational factors.
The main focus of this thesis is safety barriers introduced to prevent hydrocarbon releases on offshore oil and gas production platforms. Thus, the results are primarily useful for the oil and gas industry in their effort to control and reduce the risk of hydrocarbon releases. The Norwegian oil and gas industry can use the results in their work to fulfil the requirements to safety barriers and risk analyses from the Petroleum Safety Authority. However, the concepts and methods may also be applied in other industries (e.g., the process industry) and application areas (e.g., the transport sector) in their effort to reduce the risk.
iv
Thesis - Preface
Preface
This thesis documents the work carried out during my PhD study at the Norwegian University of Science and Technology (NTNU), Department of Production and Quality Engineering. The research is carried out from 2001 to 2005.
The PhD study is financed by a scholarship from Vesta Forsikring and I am grateful for their financial support.
I appreciate and acknowledge the support from my supervisor during the work with the thesis, Professor Marvin Rausand at Department of Production and Quality Engineering, NTNU.
Finally, thanks to all the people I have collaborated with during the PhD study; colleagues at SINTEF (Stein Hauge, Helge Langseth, Trygve Steiro, and Knut 0ien) and NTNU (Eirik Albrechtsen and Kjell Corneliussen), the BORA project team (Jan Erik Vinnem, UiS, Terje Aven, UiS, and Jorunn Seljelid, Safetec), people from oil companies and the authority (Rune Botnevik, Statoil, John Monsen, Hydro, Kjell Sandve, ConocoPhillips, and Odd Tjelta, PSA), and all other people who have participated in the research projects I have worked on during the PhD study.
Trondheim, December 2005
Snorre Sklet
v

Thesis - Table of contents
Table of contents
Summary................................................................................................................... iii
Preface ......................................................................................................................v
Table of contents...................................................................................................... vii
PART I MAIN REPORT............................................................................................ 1
1 Introduction..................................................................................................3
1.1 Background..................................................................................................31.2 Objectives ....................................................................................................51.3 Delimitations................................................................................................51.4 Structure of the report..................................................................................6
2 Research approach and principles................................................................9
2.1 Scientific approach.......................................................................................92.2 Research principles......................................................................................92.3 Concepts..................................................................................................... 11
3 Main results................................................................................................ 13
3.1 The concept of safety barriers.................................................................... 133.2 Classification of safety barriers.................................................................. 143.3 Performance of safety barriers...................................................................153.4 Hydrocarbon release scenarios...................................................................173.5 BORA-Release........................................................................................... 183.6 Results from the case study........................................................................193.7 Safety barriers and methods for accident investigation............................ 213.8 Standardized procedures for Work Permits.............................................. 23
4 Conclusions, discussion, and further research.......................................... 25
5 Acronyms...................................................................................................31
6 References..................................................................................................33
vii
Thesis - Table of contents
PART II
Paper 1
Paper 2
Paper 3
Paper 4
Paper 5
Paper 6
Paper 7
Paper 8
PAPERS
Safety barriers; definition, classification and performance
Hydrocarbon releases on oil and gas production platforms; Release scenarios and safety barriers
Barrier and operational risk analysis of hydrocarbon releases (BORA- Release); Part I Method description
Barrier and operational risk analysis of hydrocarbon releases (BORA- Release); Part II Results from a case study
Comparison of some selected methods for accident investigation
Qualitative Analysis of Human, Technical and Operational Barrier Elements during Well Interventions
Standardised procedures for Work Permits and Safe Job Analysis on the Norwegian Continental Shelf
Challenges related to surveillance of safety functions
viii

Thesis - Part I Main Report
PART I MAIN REPORT

Thesis - Part I Main Report
1 Introduction
1.1 Background
In the regulations concerning health, environment, and safety within the petroleum activities on the Norwegian Continental Shelf (NCS) issued in 2001 [1], the Petroleum Safety Authority Norway (PSA) focuses on risk-informed principles and safety barriers as important means to reduce the risk of accidents. This focus is also prevailing in international regulations as the Seveso II directive [2] and the Machinery directive [3], and in international standards [4-6].
No common definition of safety barriers has been found in the literature, even though different aspects of the concept have been discussed in the literature [7-18], required in legislations and standards, and applied in practice for several decades. Different terms with similar meanings (e.g., barrier, defence, protection layer, safety critical element, and safety function) have been used in various industries, sectors, and countries. The two theorems of communication developed by Kaplan [19]; (1) 50 % of the problems in the world result from people using the same words with different meanings, and (2) the other 50 % comes from people using different words with the same meaning, support the need for clarifying the terms in order to avoid misconceptions in communication about risk and safety barriers.
Although PSA has developed requirements to safety barriers, they have not given a clear definition of the concept. Discussions have emerged on what is a safety barrier within the Norwegian offshore industry, and different views exist. A clarification of several terms as safety barrier, barrier function, barrier system, and barrier performance will make it easier for the Norwegian offshore industry to fulfil the requirements from PSA as regards safety barriers. Clear definitions will also make it easier for PSA to manage their regulations.
This topic is also of interest due to the extended perspective on safety barriers that has evolved the later years as described by Hollnagel [10], who writes; “whereas the barriers used to defend a medieval castle mostly were of a physical nature, the modern principle of defence-in-depth combines different types of barriers - from protection against the release of radioactive materials to event reporting and safety policies”.
3

Thesis - Part I Main Report
In-depth investigations of major accidents, like the process accidents at Longford [20] and Piper Alpha [21], the loss of the space shuttles Challenger [22] and Colombia [23], the high-speed craft Sleipner accident [24], the railway accidents at Ladbroke Grove [25] and Asta [26], and several major accidents in Norway the last 20 years [27], show that both technical, human, operational, as well as organisational factors influence the accident sequences. In spite of these findings, the main focus in quantitative risk analyses (QRA) is on technical safety systems and one of the weaknesses of current QRA is the “missing link” between the models applied in the analyses and human, operational, and organisational factors [28, 29]. This topic is addressed in several research projects [30-40]. However, different approaches have been applied in the various projects, and so far, no approach has been commonly applied for practical purposes.
Traditional QRA of offshore oil and gas production platforms focus on consequence reducing barriers, and Kafka [41] states that the main interest is to estimate the consequences of the assumed initiating event, the harm to humans and environment, and to assess their frequencies. Normally, a system analysis of all the causes that may trigger such an initiating event will not be carried out. Further, Kafka [41] claims that the identification of the most effective safety measures to avoid initiating events is very limited.
The new regulations from PSA have initiated several projects within the Norwegian oil and gas industry focusing on safety barriers and quantitative risk analysis, for example, a working group within the industry initiative Together for Safety [42] discussing the term safety barrier, a research project focusing on development of a method for barrier and operational risk analysis (the BORA project) [43], and projects initiated by PSA [44].
Based on the needs grown out of the problem areas discussed in this background section, the following problems are addressed as part of this thesis:
• What is meant by a safety barrier?• How can safety barriers be classified?• Which kinds of attributes are necessary in order to describe and analyse the
performance of safety barriers?• How are safety barriers treated in risk analysis and accident investigations?• How can we analyse the causal factors to the initiating event “Hydrocarbon
release” in existing QRA?
4
Thesis - Part I Main Report
• What types of safety barriers influence the hydrocarbon release frequency on offshore platforms?
• What kinds of risk influencing factors (RIFs) affect the performance of these safety barriers?
• How can we analyse the effect on the hydrocarbon release frequency of the safety barriers and the risk influence factors?
1.2 Objectives
The main objective of the PhD project has been to develop concepts and methods that can be used to define, illustrate, analyse, and improve safety barriers in the operational phase of offshore oil and gas production platforms.
Based on this main objective, the following objectives are developed for this thesis;
• To provide definitions of the term safety barrier and related terms• To develop a framework for categorization of safety barriers• To identify, define, and describe attributes necessary to analyse the
performance of safety barriers• To develop a method for analysis of the hydrocarbon release frequency on
oil and gas platforms that can be used to analyse the effect of safety barriers introduced to prevent hydrocarbon releases
• To develop a framework for identification of risk influencing factors affecting the performance of these safety barriers
• To identify safety barriers introduced to prevent hydrocarbon releases on offshore oil and gas platforms
• To carry out a case study to test and verify the method.
1.3 Delimitations
The main focus of this thesis is the use of the barrier concept within industrial safety, and especially prevention of the realization of hazards that may lead to major accidents. Thus, occupational accidents have not been explicitly discussed.
The work is limited to the accident type process accident (hydrocarbon releases, fire and explosion) that is one of the main contributors to the total risk of major
5
Thesis - Part I Main Report
accidents on oil and gas producing platforms. The work focuses on scenarios that may lead to hydrocarbon releases and safety barriers introduced to prevent such releases. Thus, consequence reducing barriers are not treated. Some results are also presented from a study of barriers preventing release of hydrocarbons during wireline operations.
The aim of the work has been to ensure the safety during the operational phase of the life cycle of offshore oil and gas production platforms with special emphasis on operational safety barriers introduced to prevent hydrocarbon release. Consequently, discussions about barriers introduced to prevent latent failures from the design or construction phase are not covered in the thesis.
Another delimitation is that the work concentrates on safety issues, implying that security issues as “intended actions” are not within the scope of the thesis.
1.4 Structure of the report
The present thesis is written for scientists, safety professionals, managers, and other people with knowledge about risk and risk analyses. In addition, some knowledge about the offshore oil and gas industry is beneficial.
The thesis comprises two main parts; Part I Main report, and Part II Papers.
Part I Main report comprises a brief presentation of the work, the main results, a discussion, and proposals for further research. The main report is a synthesis of the research papers and does not include all results or the detailed discussions of the results, but references are made to the research papers. The first chapter of the main report describes the background and the objectives of the thesis and presents some delimitations. Chapter two describes the research methodology and discusses the scientific framework for the thesis. The main results are presented in chapter three, while the results are discussed in chapter four.
Part II consists of research papers already published in international journals or conferences and research papers accepted or submitted for publication in international journals:
6
Thesis - Part I Main Report
Paper 1Sklet, S., Safety barriers; definition, classification and performance. Journal of Loss Prevention in the Process Industries (article in press, available online 20 January2006).
Paper 2Sklet, S., Hydrocarbon releases on oil and gas production platforms; Release scenarios and safety barriers. Journal of Loss Prevention in the Process Industries (article in press, available online 18 January 2006).
Paper 3Aven, T., Sklet, S., and Vinnem, J.E., Barrier and operational risk analysis of hydrocarbon releases (BORA-Release); Part I Method description. Journal of Hazardous Materials (submitted for publication 2 December 2005).
Paper 4Sklet, S., Vinnem, J.E., and Aven, T., Barrier and operational risk analysis of hydrocarbon releases (BORA-Release); Part II Results from a case study. Journal of Hazardous Materials (submitted for publication 2 December 2005).
Paper 5Sklet, S., Comparison of some selected methods for accident investigation. Journal of Hazardous Materials (2004), 111, 1 - 3, 29-37.
Paper 6Sklet S., Steiro T., & Tjelta O., Qualitative Analysis of Human, Technical and Operational Barrier Elements during Well Interventions. ESREL 2005, Tri City, Poland.
Paper 7Botnevik, R., Berge, O., and Sklet, S., Standardised procedures for Work Permits and Safe Job Analysis on the Norwegian Continental Shelf. SPE Paper Number 86629, Society of Petroleum Engineers, 2004.
Paper#Corneliussen, K., and Sklet, S., Challenges related to surveillance of safety functions. ESREL 2003, Maastricht.
In addition, several papers not included in this thesis have been published during the PhD-study:
7

Thesis - Part I Main Report
Sklet, S., Aven, T., Hauge, S., & Vinnem, J.E., Incorporating human and organizational factors in risk analysis for offshore installations. ESREL 2005, Tri City, Poland.
Sklet, S., Storulykker i Norge de siste 20 arene. Kap. 7 i Fra flis i fingeren til ragnarok. Tapir Akademisk Forlag, Trondheim, 2004.
Hovden, J., Sklet, S. og Tinmannsvik, R.K., I etterpaklokskapens klarsyn: Gransking og luring av ulykker. Kap. 8 i Fra flis i fingeren til ragnarok. Tapir Akademisk Forlag, Trondheim, 2004.
Sklet, S., and Hauge, S., Reflections on the Concept of safety Barriers. PS AM 7 - ESREL 2004, Berlin.
Sklet, S., Onnettomuustutkinnan menetelmia. TUKES-julkaisu 6/2004, Turvatekniikan Keskus, Helsinki.
Sklet, S., Methods for accident investigation. ROSS (NTNU) 200208, Report (75 pages), Trondheim.
8

Thesis - Part I Main Report
2 Research approach and principles
2.1 Scientific approach
This thesis deals with analysis of risk in a socio-technical system like an offshore oil and gas production platform. The risk in this system is influenced by human, technical, and organizational risk influencing factors. Thus, I have chosen to be pragmatic with respect to scientific approach, and include elements from both natural science and social science dealing with human, technical, and organizational risk influencing factors in my research.
The main type of research in this thesis is development of concepts and methods meant for practical applications. The purpose of the work has not been to develop new theoretical models, but rather to systematize and apply existing knowledge within new application areas. Some empirical work is carried out, primarily in the form of case studies in order to test the concepts and methods developed during the work.
2.2 Research principles
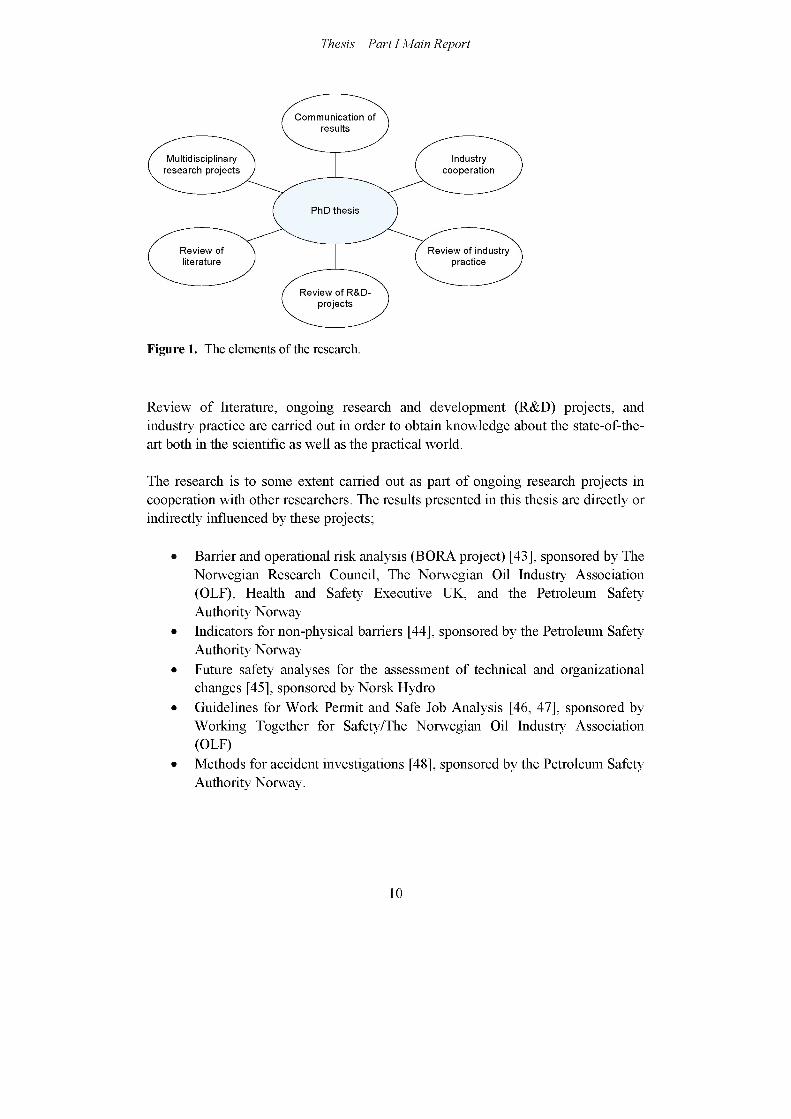
The research resulting in this thesis is not performed in a vacuum, but in cooperation with other researchers and people from the industry and the authorities. The elements of the research are illustrated in Figure 1.
9
Thesis - Part I Main Report
Communication of results
Multidisciplinary research projects
Industrycooperation
PhD thesis
Review of literature
Review of industry practice
Review of R&D- projects
Figure 1. The elements of the research.
Review of literature, ongoing research and development (R&D) projects, and industry practice are carried out in order to obtain knowledge about the state-of-the- art both in the scientific as well as the practical world.
The research is to some extent carried out as part of ongoing research projects in cooperation with other researchers. The results presented in this thesis are directly or indirectly influenced by these projects;
• Barrier and operational risk analysis (BORA project) [43], sponsored by The Norwegian Research Council, The Norwegian Oil Industry Association (OLF), Health and Safety Executive UK, and the Petroleum Safety Authority Norway
• Indicators for non-physical barriers [44], sponsored by the Petroleum Safety Authority Norway
• Future safety analyses for the assessment of technical and organizational changes [45], sponsored by Norsk Hydro
• Guidelines for Work Permit and Safe Job Analysis [46, 47], sponsored by Working Together for Safety/The Norwegian Oil Industry Association (OLF)
• Methods for accident investigations [48], sponsored by the Petroleum Safety Authority Norway.
10
Thesis - Part I Main Report
Another important principle is the cooperation with personnel from the industry. This cooperation is ensured through involvement of industry personnel in the research projects and accomplishment of a case study as part of the BORA project.
Finally, the results from the research are communicated to the academia and the industry at regular intervals. The results are communicated both orally at conferences, seminars, workshops, and project meeting, and written in papers, project memos, and reports. The purpose of the communication of the research results is two-sided; two spread the results, and to receive comments from the outside world.
These principles have contributed to evaluation and quality assurance of the research at regular intervals since the input from the “outside world” has influenced the research work and thus influenced the results presented in this PhD thesis.
2.3 Concepts
Use of risk-informed principles necessitates an understanding of the word risk. Many definitions of the word exists in the literature, and several views exist, illustrated by the following history [19]; “One of the first initiatives from the Society for Risk Analysis was to establish a committee to define the word risk. The committee laboured for 4 years and than gave up, saying in its final report, that maybe it is better not to define risk and let each author define it in his own way, emphasizing that each should explain clearly what way that is”.
A definition of risk adopted from Kaplan [49] is applied in this thesis. Kaplan states that the question “What is the risk?” is really three questions; “What can happen?”, “How likely is that to happen?”, and “What are the consequences?”. Risk may then be expressed as a (complete) set of triplets (Si, Li, Xi), where Si denotes scenario i, Li denotes the likelihood, and Xi the consequences.
Hydrocarbon release is defined as gas or oil leaks (including condensate) from the process flow, well flow, or flexible risers with a release rate greater than 0.1 kg/s. Smaller leaks are called minor releases or diffuse discharges.
11


Thesis - Part I Main Report
3 Main results
The following subsections comprise a summary of the main results from the research. Detailed information about the results is presented in the research papers in part II of the thesis.
3.1 The concept of safety barriers
No common terminology of the concept of safety barriers exist neither in the literature nor in practice. Based on the synthesis of some common features of the term, the following definitions of the terms safety barrier, barrier function, and barrier system are proposed as basis for further discussion and analysis of safety barriers (see Paper 1 for more information).
► Safety barriers are physical and/or non-physical means planned to prevent, control or mitigate undesired events or accidents.
The means may range from a single technical unit or human actions, to a complex socio-technical system. Planned implies that at least one of the purposes of the means is to reduce the risk. In line with ISO: 13702 [6], prevention means reduction of the likelihood of a hazardous event, control means limiting the extent and/or duration of a hazardous event to prevent escalation, while mitigation means reduction of the effects of a hazardous event. Undesired events may, for example, be technical failures, human errors, external events, or a combination of these occurrences that may realize potential hazards, while accidents are undesired and unplanned events that lead to loss of human lives, personal injuries, environmental damage, and/or material damage.
► A barrier function is a function planned to prevent, control, or mitigate undesired events or accidents.
Barrier functions describe the purpose of safety barriers or what the safety barriers shall do in order to prevent, control, or mitigate undesired events or accidents. If a barrier function is performed successfully, it should have a direct and significant effect on the occurrence and/or consequences of an undesired event or accident. A
13
Thesis - Part I Main Report
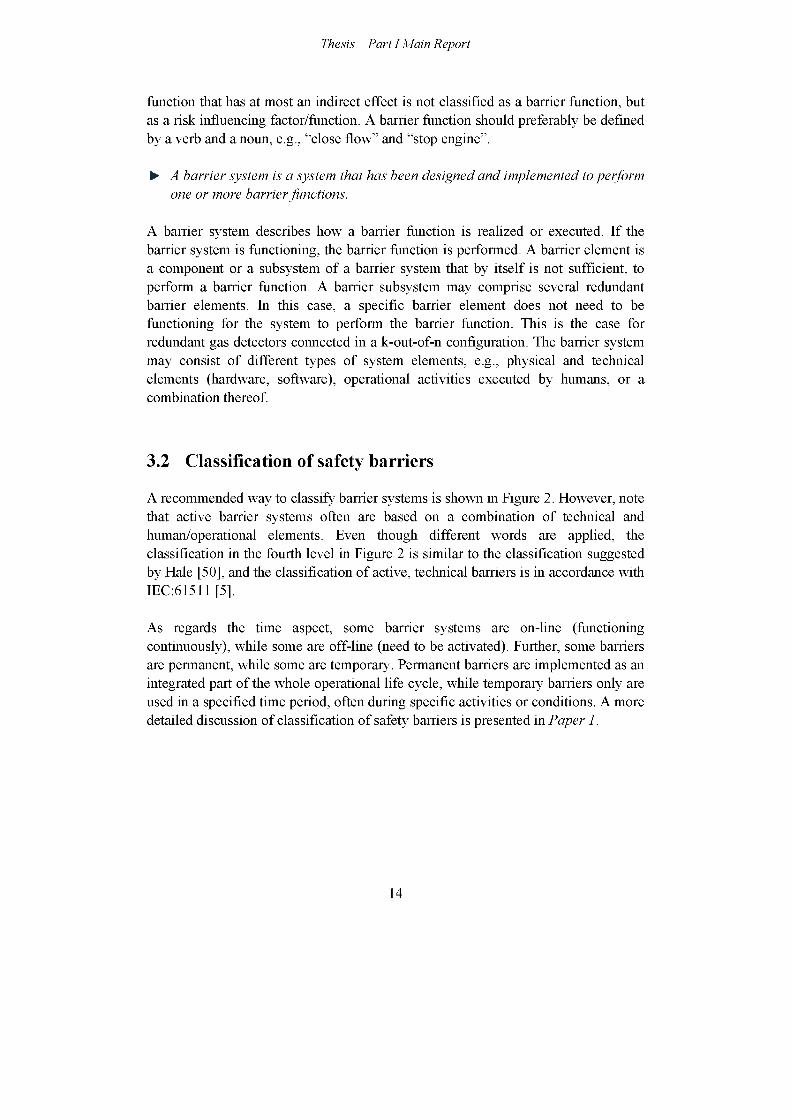
function that has at most an indirect effect is not classified as a barrier function, but as a risk influencing factor/function. A barrier function should preferably be defined by a verb and a noun, e.g., “close flow"’ and “stop engine'’.
► A barrier system is a system that has been designed and implemented to perform one or more barrier functions.
A barrier system describes how a barrier function is realized or executed. If the barrier system is functioning, the barrier function is performed. A barrier element is a component or a subsystem of a barrier system that by itself is not sufficient, to perform a barrier function. A barrier subsystem may comprise several redundant barrier elements. In this case, a specific barrier element does not need to be functioning for the system to perform the barrier function. This is the case for redundant gas detectors connected in a k-out-of-n configuration. The barrier system may consist of different types of system elements, e.g., physical and technical elements (hardware, software), operational activities executed by humans, or a combination thereof.
3.2 Classification of safety barriers
A recommended way to classify barrier systems is shown in Figure 2. However, note that active barrier systems often are based on a combination of technical and human/operational elements. Even though different words are applied, the classification in the fourth level in Figure 2 is similar to the classification suggested by Hale [50], and the classification of active, technical barriers is in accordance with IEC:61511 [5],
As regards the time aspect, some barrier systems are on-line (functioning continuously), while some are off-line (need to be activated). Further, some barriers are permanent, while some are temporary. Permanent barriers are implemented as an integrated part of the whole operational life cycle, while temporary barriers only are used in a specified time period, often during specific activities or conditions. A more detailed discussion of classification of safety barriers is presented in Paper 1.
14

Thesis - Part I Main Report
What to do
Realized by:
Other technology safety-related system
Human/operationalPhysical
External risk reduction facilites
Human/operational
Safety Instrumented System (SIS)
Technical
Barrier function
Barrier system
Passive Active
Figure 2. Classification of safety barriers.
3.3 Performance of safety barriers
Based on experience from several projects and a synthesis of the reviewed literature, it is recommended to address the following attributes to characterize the performance of safety barriers; a) functionality/effectiveness, b) reliability/ availability, c) response time, d) robustness, and e) triggering event or condition. Paper 1 presents more information. For some types of barriers, not all the attributes are relevant or necessary in order to describe the barrier performance.
► The barrier functionality/effectiveness is the ability to perform a specified function under given technical environmental and operational conditions.
The barrier functionality deals with the effect the barrier has on the event or accident sequence. The specified function should be stated as a functional requirement (deterministic requirement). A functional requirement is a specification of the performance criteria related to a function [51]. The “possible"’ degree of fulfilment may be expressed in a probabilistic way as the probability of successful execution of the specified function or the percentage of successful execution. For example, if the function is to pump water, a functional requirement may be that the output of water must be between 100 and 110 litres per minute. The actual functionality of a barrier may be less than the specified functionality due to design constraints, degradation, operational conditions, etc. The functionality of safety barriers corresponds to the
15
Thesis - Part I Main Report
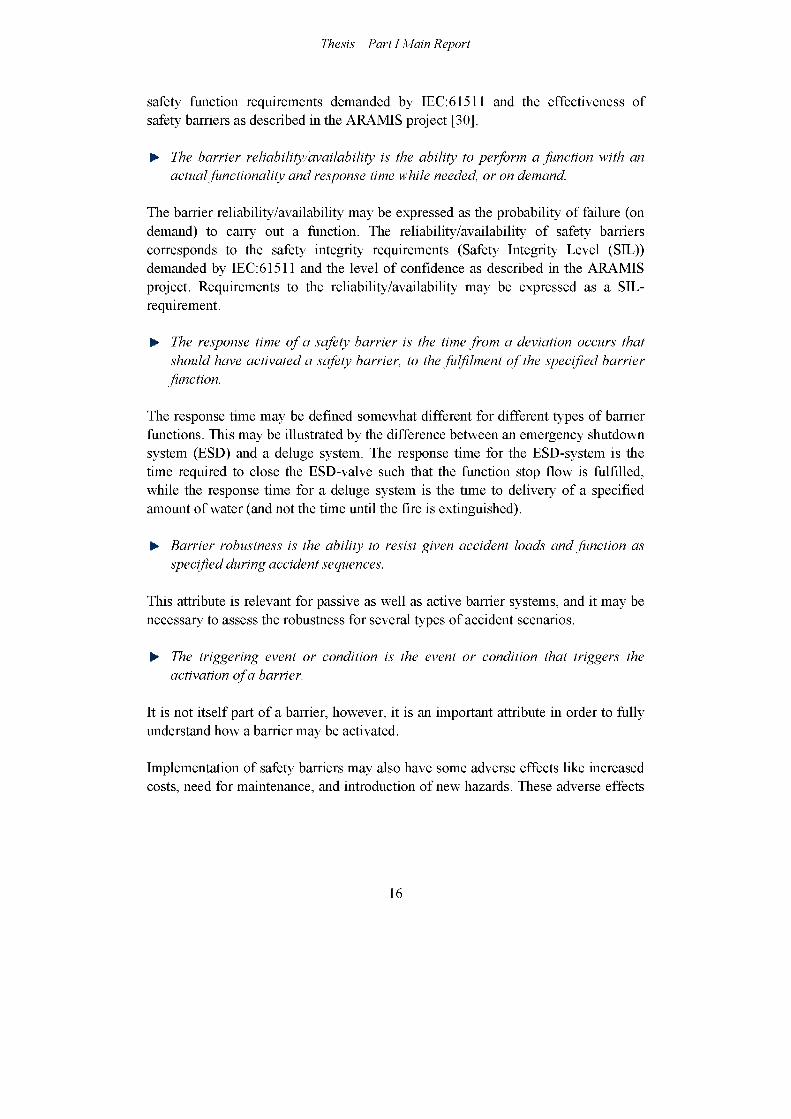
safety function requirements demanded by IEC:61511 and the effectiveness of safety barriers as described in the ARAMIS project [30].
► The barrier reliability/availability is the ability to perform a fimction with an actual functionality and response time while needed, or on demand.
The barrier reliability/availability may be expressed as the probability of failure (on demand) to carry out a function. The reliability/availability of safety barriers corresponds to the safety integrity requirements (Safety Integrity Level (SIL)) demanded by IEC:61511 and the level of confidence as described in the ARAMIS project. Requirements to the reliability/availability may be expressed as a SIL- requirement.
► The response time of a safety barrier is the time from a deviation occurs that shotdd have activated a safety barrier, to the fulfilment of the specified barrier function.
The response time may be defined somewhat different for different types of barrier functions. This may be illustrated by the difference between an emergency shutdown system (BSD) and a deluge system. The response time for the ESD-system is the time required to close the ESD-valve such that the function stop flow is fulfilled, while the response time for a deluge system is the time to delivery of a specified amount of water (and not the time until the fire is extinguished).
► Barrier robustness is the ability to resist given accident loads and function as specified during accident sequences.
This attribute is relevant for passive as well as active barrier systems, and it may be necessary to assess the robustness for several types of accident scenarios.
► The triggering event or condition is the event or condition that triggers the activation of a barrier.
It is not itself part of a barrier, however, it is an important attribute in order to fully understand how a barrier may be activated.
Implementation of safety barriers may also have some adverse effects like increased costs, need for maintenance, and introduction of new hazards. These adverse effects
16
Thesis - Part I Main Report
are not discussed any further in this thesis, but should be addressed as part of a total analysis of the barriers.
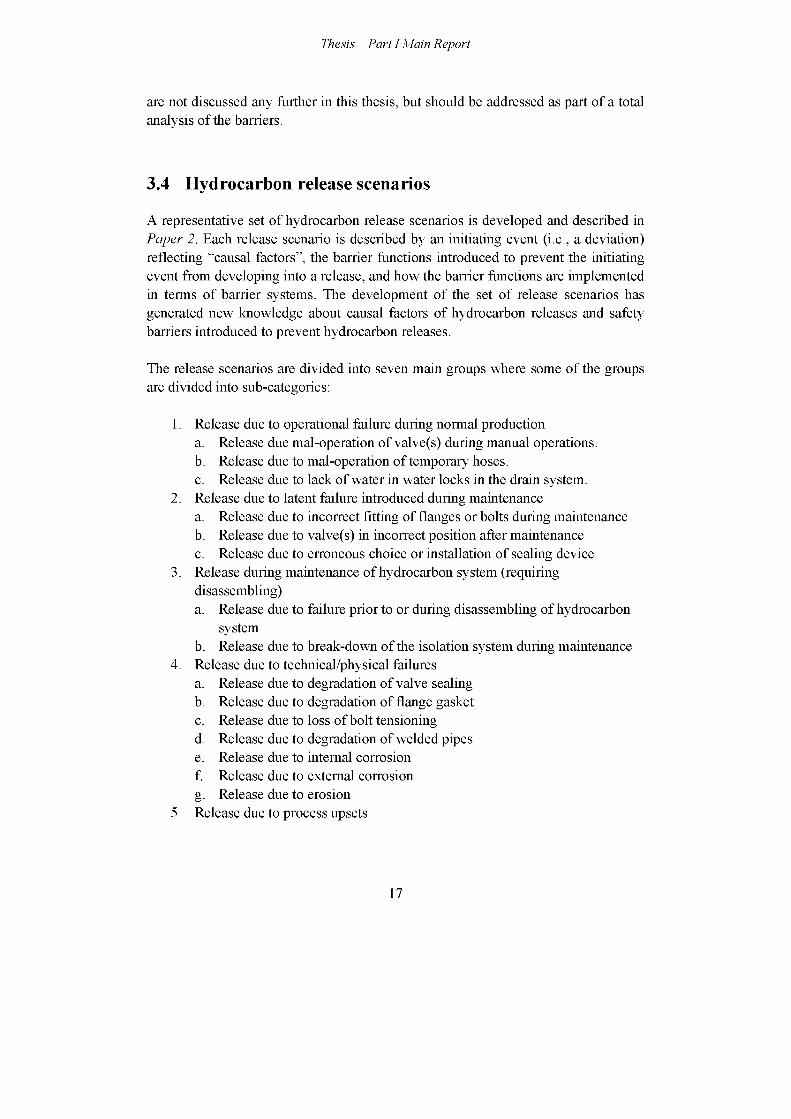
3.4 Hydrocarbon release scenarios
A representative set of hydrocarbon release scenarios is developed and described in Paper 2. Each release scenario is described by an initiating event (i.e., a deviation) reflecting “causal factors”, the barrier functions introduced to prevent the initiating event from developing into a release, and how the barrier functions are implemented in terms of barrier systems. The development of the set of release scenarios has generated new knowledge about causal factors of hydrocarbon releases and safety barriers introduced to prevent hydrocarbon releases.
The release scenarios are divided into seven main groups where some of the groups are divided into sub-categories:
1. Release due to operational failure during normal productiona. Release due mal-operation of valve(s) during manual operations.b. Release due to mal-operation of temporary hoses.c. Release due to lack of water in water locks in the drain system.
2. Release due to latent failure introduced during maintenancea. Release due to incorrect fitting of flanges or bolts during maintenanceb. Release due to valve(s) in incorrect position after maintenancec. Release due to erroneous choice or installation of sealing device
3. Release during maintenance of hydrocarbon system (requiring disassembling)a. Release due to failure prior to or during disassembling of hydrocarbon
systemb. Release due to break-down of the isolation system during maintenance
4. Release due to technical/physical failuresa. Release due to degradation of valve sealingb. Release due to degradation of flange gasketc. Release due to loss of bolt tensioningd. Release due to degradation of welded pipese. Release due to internal corrosionf. Release due to external corrosiong. Release due to erosion
5. Release due to process upsets
17

Thesis - Part I Main Report
a. Release due to overpressureb. Release due to overflow/overfilling
6. Release due to external eventsa. Falling objectsb. Bumping/collision. However, these are analysed together in one
scenario.7. Release due to design related failures
Design related failures are latent failures introduced during the design phase that cause release during normal production. This scenario is not treated any further in the thesis. Nevertheless, barriers preventing failures in the design process and barriers aimed to detect design related failures prior to start-up of production are very important in order to minimize the risk.
A detailed description of the scenarios is presented in Paper 2 and comprises a description of initiating events and safety barriers introduced to prevent hydrocarbon releases. The event sequence in each scenario is illustrated by a barrier block diagram as shown in Figure 3. A barrier block diagram consists of an initiating event, arrows that show the event sequence, barrier functions realized by barrier systems, and possible outcomes. A horizontal arrow indicates that a barrier system fulfils its function, whereas an arrow downwards indicates failure to fulfil the function. In this thesis, the undesired event is hydrocarbon release (loss of containment).
Functions
Fails
Barrier function realized by a
barrier system
Initiating event (Deviation from
normal situation)’’Safe state”
Undesired event
Figure 3. Illustration of a barrier block diagram.
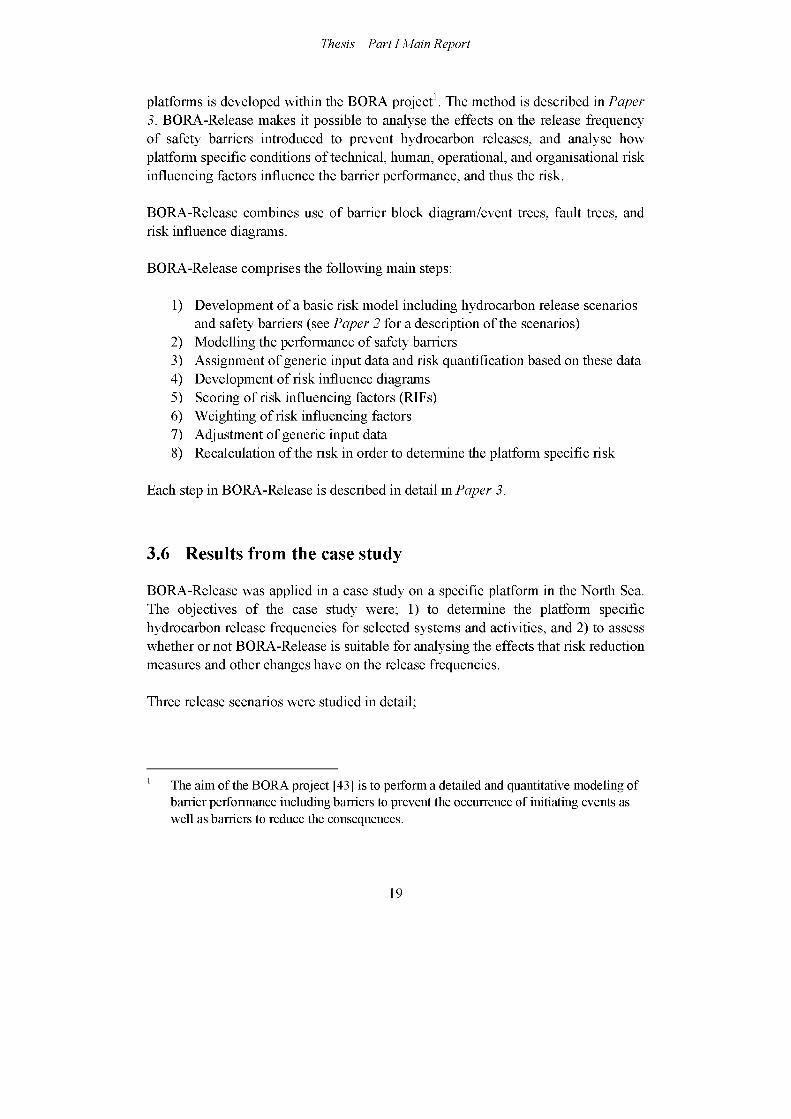
3.5 BORA-Release
A method, called BORA-Release, for qualitative and quantitative risk analyses of the platform specific hydrocarbon release frequency on oil and gas production
18
Thesis - Part I Main Report
platforms is developed within the BORA project1. The method is described in Paper3. BORA-Release makes it possible to analyse the effects on the release frequency of safety barriers introduced to prevent hydrocarbon releases, and analyse how platform specific conditions of technical, human, operational, and organisational risk influencing factors influence the barrier performance, and thus the risk.
BORA-Release combines use of barrier block diagram/event trees, fault trees, and risk influence diagrams.
BORA-Release comprises the following main steps:
1) Development of a basic risk model including hydrocarbon release scenarios and safety barriers (see Paper 2 for a description of the scenarios)
2) Modelling the performance of safety barriers3) Assignment of generic input data and risk quantification based on these data4) Development of risk influence diagrams5) Scoring of risk influencing factors (RIFs)6) Weighting of risk influencing factors7) Adjustment of generic input data8) Recalculation of the risk in order to determine the platform specific risk
Each step in BORA-Release is described in detail in Paper 3.
3.6 Results from the case study
BORA-Release was applied in a case study on a specific platform in the North Sea. The objectives of the case study were; 1) to determine the platform specific hydrocarbon release frequencies for selected systems and activities, and 2) to assess whether or not BORA-Release is suitable for analysing the effects that risk reduction measures and other changes have on the release frequencies.
Three release scenarios were studied in detail; 1
1 The aim of the BORA project [43] is to perform a detailed and quantitative modeling of barrier performance including barriers to prevent the occurrence of initiating events as well as barriers to reduce the consequences.
19

Thesis - Part I Main Report
A. Release due to valve(s) in wrong position after maintenance (flowline inspection)
B. Release due to incorrect fitting of flanges or bolts during maintenance (flowline inspection)
C. Release due to internal corrosion
The analyses of scenario A and B were carried out strictly according to the method description, while the analysis of scenario C differed from the method description. Several workshops with operational personnel from the platform, safety specialists, and corrosion specialists from the oil company were arranged as part of the case study. Detailed results are presented in Paper 4.
An important question regarding the quantitative results is whether or not the calculated release frequencies are trustworthy. The analysis is based on a number of assumptions and simplifications relating to the basic risk model, the generic input data, the risk influence diagrams, the scoring of RIFs, the weighting of RIFs, or the adjustment of the input data. The quantitative results in the case study for scenario A and B based on generic data were assessed to be reasonable compared to release statistics. This view was supported by the comments from the personnel from the actual oil company. The confidence in the results based on the revised input data was not as good due to use of data from a project called Risk Level on the Norwegian Continental Shelf (RNNS) [52] for scoring of RIFs. Since the scoring was based on few and generic questions not originally meant to be used as basis for RIF-scoring, the validity2 of the scoring was assessed to be low. The main reason for using RNNS-data to assess the status of RIFs in the case study was the demand for using existing data in order to minimize the use of resources from the industry representatives in the steering group for the BORA project. Since the revised release frequency to a high degree was influenced by the results from the RNNS-survey, the approach chosen for scoring of RIFs should be discussed in the further work.
The case study demonstrated that BORA-Release may be used to analyse the effect on the hydrocarbon release frequency of safety barriers, and to study the effect on the barrier performance of platform specific conditions of technical, organizational, operational, and human risk influencing factors.
2 Validity refers to whether or not it measures what it is supposed to measure [53].
20

Thesis - Part I Main Report
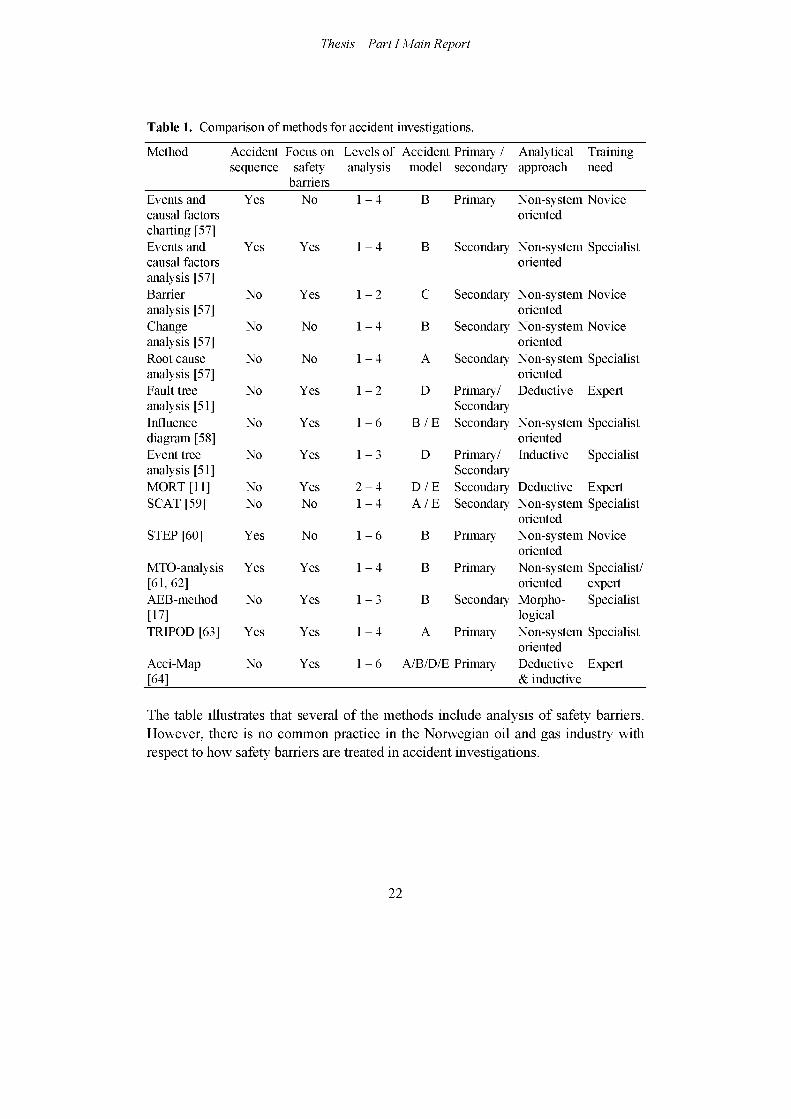
3.7 Safety barriers and methods for accident investigation
So far, the main focus has been on safety barriers in proactive risk analysis. However, analysis of the performance of safety barriers is also an element in accident investigations. Thus, a selection of methods for accident investigation is compared according to a set of characteristics. A summary of the comparison is presented in Table 1 (see Paper 5 for detailed description). The table comprises the following information. Column one contains the names of the methods. Whether or not the methods give a graphical description of the event sequence is assessed in column two. Whether or not the methods focus on safety barriers is assessed in the third column. The level of scope of the different analysis methods is assessed in column four. The levels are classified according to the socio-technical system involved in the control of safety (or hazardous processes) described by Rasmussen [54];
1. The work and technological system2. The staff level3. The management level4. The company level5. The regulators and associations level6. The Government level
What kind of accident models that have influenced the method is assessed in column five. The following accident models are used (e.g., see [55, 56] for description of accident models);
A Causal-sequence modelB Process modelC Energy modelD Logical tree modelE SHE-management models
Whether the different methods are inductive, deductive, morphological or nonsystem-oriented is assessed in column six. In the next column, the different investigation methods are categorized as primary or secondary methods. Primary methods are stand-alone techniques, while secondary methods provide special input as supplement to other methods. The last column assesses the need for education and training in order to use the methods. The terms "Expert", "Specialist", and "Novice" are used.
21
Thesis - Part I Main Report
Table 1. Comparison of methods for accident investigations.
Method Accidentsequence
Focus on safety
barriers
Levels of Accident Primary /analysis model secondary
Analytical Training approach need
Events andcausal factors charting [57]
Yes No 1 - 4 B Primary Non-system Novice oriented
Events and causal factors analysis [57]
Yes Yes 1 - 4 B Secondary Non-system Specialist oriented
Barrier analysis [57]
No Yes 1 - 2 C Secondary Non-system Novice oriented
Change analysis [57]
No No 1 - 4 B Secondary Non-system Novice oriented
Root cause analysis [57]
No No 1 - 4 A Secondary Non-system Specialist oriented
Fault tree analysis [51]
No Yes 1 - 2 D Primary/Secondary
Deductive Expert
Influence diagram [58]
No Yes 1 - 6 B / E Secondary Non-system Specialist oriented
Event tree analysis [51]
No Yes 1 - 3 D Primary/Secondary
Inductive Specialist
MORT [11] No Yes 2 - 4 D / E Secondary Deductive ExpertSCAT [59] No No 1 - 4 A / E Secondary Non-system Specialist
orientedSTEP [60] Yes No 1 - 6 B Primary Non-system Novice
orientedMTO-analysis [61, 62]
Yes Yes 1 - 4 B Primary Non-system Specialist/ oriented expert
AEB-method[17]
No Yes 1 - 3 B Secondary Morpho- Specialist logical
TRIPOD [63] Yes Yes 1 - 4 A Primary Non-system Specialist oriented
Acci-Map[64]
No Yes 1 - 6 A/B/D/E Primary Deductive Expert & inductive
The table illustrates that several of the methods include analysis of safety barriers. However, there is no common practice in the Norwegian oil and gas industry with respect to how safety barriers are treated in accident investigations.
22
Thesis - Part I Main Report
3.8 Standardized procedures for Work Permits
A result with more practical usefulness than academic usefulness, is the attendance in a project group within Together for Safety that developed standardised procedures for work permits (WP) and safe job analysis (SJA). The procedures are implemented on all oil and gas production installations in the Norwegian Continental Shelf. The WP system and the use of SJA represent essential operational safety barriers required in the daily management of work and safety on oil and gas installations.
A process of dialogue and participation, involving the offshore community established the foundation for an industry wide change to improve safety and working conditions. A brief description of the standardized procedures is presented in Paper 6. The procedures are published as OLF Guidelines [46, 47].
An E-learning course3 has been developed by Mintra in order to get everyone actively involved using the new models and new forms. More than 20.000 people have been through the course.
3 See www.samarbeidforsikkerhet.no for more information.
23

Thesis - Part I Main Report
4 Conclusions, discussion, and further research
The main contributions of this thesis are;
• Clarification of the term safety barrier with respect to definitions, classification, and relevant attributes for analysis of barrier performance.
• Development and discussion of a representative set of hydrocarbon release scenarios where each scenario includes an initiating event, barrier functions introduced to prevent hydrocarbon releases, and barrier systems realizing the barrier functions.
• Development and testing of a new method, BORA-Release, for qualitative and quantitative risk analysis of hydrocarbon releases.
The clarification of terms is helpful for the Norwegian offshore industry in order to fulfil the requirements to safety barriers from the Petroleum Safety Authority Norway [1].
The development of the hydrocarbon release scenarios has generated new knowledge about causal factors of hydrocarbon releases and safety barriers introduced to prevent the releases. Collectively, the scenarios cover the most frequent initiating events and give an overview of the most important safety barriers introduced to prevent hydrocarbon releases.
BORA-Release may be applied to analyse the platform specific hydrocarbon release frequency for selected systems on a specific platform. The method may be used to analyse the effects on the release frequency of safety barriers introduced to prevent hydrocarbon releases, and to study the effects on the barrier performance of platform specific conditions of technical, human, operational, and organisational risk influencing factors.
Roughly assessed, the main objective of the PhD project; ”to develop concepts and methods that can 6e used to de/ine, illustrate, analyse, and improve sa/ety Carriers in the operational phase of offshore oil and gas production platforms”, is fulfilled. However, there is still need for further research concerning several of the detailed objectives developed for the thesis, and each of these detailed objectives is discussed in the following.
25

Thesis - Part I Main Report
► To provide definitions of the term safety barrier and related terms
Definitions of the terms safety barrier, barrier function, and barrier system are provided in Paper 1. These definitions may be useful as basis for discussion and analysis of safety barriers. If the definitions are adopted by the industry, the result will be a common language and understanding of safety barriers. Today, the term safety barrier seems to be used in different ways by accident investigators, risk analysts, managers, and operational personnel. One of the main challenges in the future is to contribute to adaptation of the proposed terminology by different types of personnel.
► To develop a framework for categorization of safety barriers
A structure for classification of safety barriers is presented in Paper 1. Barrier systems are classified as passive or active. Passive barriers may be physical or human/operational, while active barriers may be technical or human/operational. In addition, active barriers may be based on a combination of technical and human/operational elements. However, safety barriers may be classified in several other ways. The proposed structure may not always be best suitable for the specific purpose of the classification. Thus, other lines of classification may be as useful in specific cases.
Further work should be carried out to establish a common framework for assessment of the performance of the different classes of safety barriers in the proposed structure. One main challenge is to develop a framework for assessment of the performance of human/operational barriers.
► To identity, define, and describe attributes necessary to analyse the performance of safety barriers
The definitions of some main attributes necessary for assessment of the performance of safety barriers presented in Paper 1 will be useful in both risk analyses and accident investigations. Use of a common set of definitions and common understanding of safety barriers makes it easier to transfer experience from accident investigations to risk analyses, and vice versa. One main challenge is to provide for and achieve use of the proposed attributes in risk analysis as well as accident investigations carried out by the industry.
26
Thesis - Part I Main Report
► To develop a method for analysis of the hydrocarbon release frequency on oil and gas platforms that can be used to analyse the effect of safety barriers introduced to prevent hydrocarbon releases
BORA-Release (see Paper 3) is a method that fulfils this objective. BORA-Release is a new method for qualitative and quantitative risk analysis of the hydrocarbon release frequency on oil and gas platforms. BORA-Release combines use of barrier block diagrams/event trees, fault trees, and risk influence diagrams in order to analyse the risk of hydrocarbon releases from a set of hydrocarbon release scenarios.
BORA-Release may improve today's quantitative risk analyses on two weak points; i) analysis of causal factors of the initiating event hydrocarbon release (loss of containment), and ii) analysis of the effect on the risk of human and organisational factors.
However, the method should be further tested in practical analyses. So far, BORA- Release has been applied in one case study for analysis of the platform specific hydrocarbon release frequencies for three hydrocarbon release scenarios on a specific platform. The method was used to analyse the effect on the release frequency of safety barriers introduced to prevent hydrocarbon releases, and to study the effect on the barrier performance of platform specific conditions of technical, human, operational, and organisational risk influencing factors.
Additional research with respect to further development of BORA-Release should focus on the following main areas:
• To develop a suitable method for assignment of scores of the risk influencing factors affecting the barrier performance.
• To evaluate whether there is need for collection of new types of data to be used as input in the quantitative analyses since relevant offshore data are lacking for some barriers (particularly human reliability data).
• To link existing reliability analyses of technical safety systems (e g., the process shutdown system) to the risk model (release scenarios) developed in BORA-Release.
• To apply the principles within BORA-Release to analyse the effect on the total risk of both safety barriers introduced to prevent hydrocarbon releases and consequence reducing barriers. A total risk analysis by use of the principles within BORA-Release makes it possible to analyse the effect of dependencies among different safety barriers.
27
Thesis - Part I Main Report
► To develop a framework for identification of risk influencing factors (RIFs) affecting the performance of these safety barriers
A framework for identification of RIFs has been developed as part of BORA- Release (see Paper 3 page 8 for further details). The framework consists of five main groups of RIFs; characteristics of the personnel, characteristics of the tasks, characteristics of the technical system, administrative controls, and organisational factors/operational philosophy. In addition, a detailed taxonomy of RIFs is developed. Experience from the case study indicates that the main groups in the framework are adequate for identification of RIFs. However, the taxonomy is not sufficiently tested in practice, and application of the framework in analyses of more scenarios should be carried out in order to assess whether some of the RIFs may be removed, or whether it is necessary to add some new RIFs to the detailed taxonomy.
► To identity safety barriers introduced to prevent hydrocarbon releases on o ffshore oil and gas platforms
A set of hydrocarbon release scenarios is developed and described in terms of an initiating event (i.e., a “deviation'’) reflecting causal factors, barrier functions introduced to prevent the initiating events from developing into a release, and how the barrier functions are realized in terms of barrier systems (see Paper 2). Both passive physical, active technical, and active human/operational safety barriers are included in the release scenarios.
Additional research should be carried out to investigate hydrocarbon releases and study the effect of the identified safety barriers on the event sequences. This research should also identify the risk influencing factors that affected the performance of the safety barriers and assess the importance of these risk influencing factors. Analysis of safety barriers in investigations of hydrocarbon releases may be input to revision of the hydrocarbon release scenarios described in Paper 2 or development of new, additional scenarios.
Focus on safety barriers in accident investigations may fulfil the recommendation from Kletz [65] about avoiding the word cause in accident investigations and rather talk about what might have prevented the accident.
28
Thesis - Part I Main Report
► To earn> out a case study to test and verify the method.
As mentioned above, BORA-Release is applied in a case study where three selected hydrocarbon release scenarios are analysed in detail. The results from the case study are presented in Paper 4. The case study provided useful input to the development of BORA-Release and demonstrated that BORA-Release may be used to analyse the effect on the release frequency of safety barriers introduced to prevent hydrocarbon releases, and to study the effect on the barrier performance of technical, human, operational, and organizational risk influencing factors.
In addition, parts of the method have been applied in a study of hydrocarbon release scenarios during well interventions. The results from this study are presented in Paper 6.
Further research should be carried out to apply BORA-Release to analyse the complete set of hydrocarbon release scenarios presented in Paper 2 in order to establish a total model for the risk of hydrocarbon releases on oil and gas production platforms.
The total risk model may constitute the basis for analyses of; i) the importance of the different scenarios with respect to the total release frequency, ii) the effect on the release frequency of the safety barriers introduced to prevent hydrocarbon releases, and iii) the effect on the barrier performance of platform specific conditions of technical, human, operational, and organisational risk influencing factors.
Another topic that should be addressed in future research is testing and surveillance of different categories of safety barriers. This topic is addressed in Paper 8. Existing strategies for testing and surveillance of safety systems focus primarily on physical and technical safety barriers. Additional research is needed in order to develop adequate strategies for testing and surveillance of the performance of human/ operational barriers.
The main focus of this thesis is safety barriers introduced to prevent hydrocarbon releases on offshore oil and gas production platforms. Thus, the results are primarily useful for the oil and gas industry in their effort to control and reduce the risk of hydrocarbon releases. The Norwegian oil and gas industry can use the results in their work to fulfil the requirements to safety barriers and risk analysis from the Petroleum Safety Authority. However, the concepts and methods may also be
29

Thesis - Part I Main Report
applied in other industries (e.g., the process industry) and application areas (e.g., the transport sector) in their effort to reduce the risk.
30
Thesis - Part I Main Report
5 Acronyms
AEB Accident Evolution and Barrier FunctionARAMIS Accidental Risk Assessment Methodology for Industries in the
Context of the Seveso II DirectiveBORA Barrier and Operational Risk AnalysisESD Emergency Shutdown SystemESREL The European Safety and Reliability ConferenceHC HydrocarbonIEC The International Electrotechnical CommissionISO The International Organisation for StandardizationMORT Management Oversight and Risk TreeMTO Human, Technology, and OrganisationNCS The Norwegian Continental ShelfNTNU The Norwegian University of Science and TechnologyOLF The Norwegian Oil Industry AssociationPSA The Petroleum Safety Authority NorwayQRA Quantitative Risk AnalysisR&D Research and DevelopmentRIF Risk Influencing FactorROSS Reliability, Safety, and Security StudiesSCAT Systematic Cause Analysis TechniqueSHE Safety, Health, and EnvironmentSIL Safety Integrity LevelSINTEF The Foundation for Scientific and Industrial Research at the
Norwegian Institute of TechnologySIS Safety Instrumented SystemSJA Safe Job AnalysisSPE The Society of Petroleum EngineersSTEP Sequential Timed Events PlottingUiS The University of StavangerWP Work Permit
31

Thesis - Part I Main Report
6 References[1] PSA, Regulations relating to management in the petroleum activities (The
Management Regulations). 3 September 2001, Petroleum Safety Authority Norway, Stavanger, 2001.
[2] EC, Council Directive 96/82/EC of 9 December 1996 on the control of major- accident hazards involving dangerous substances (Seveso II-directive), 1996.
[3] EC, Directive 98/37/EC of the European Parliament and of the Council of 22 June 1998 on the approximation of the laws of the Member States relating to machinery as amended by Directive 98/79/EC The Machinery Directive, 1998.
[4] IEC:61508, Part 1 - 7 Functional safety of electrical/electronic/programmable electronic safety-related systems, International Electrotechnical Commission, Geneva, 1998.
[5] IEC:61511, Functional safety - Safety instrumented systems for the process industry sector, International Electrotechnical Commission, Geneva, 2002.
[6] ISO: 13702, Petroleum and natural gas industries - Control and mitigation of fires and explosions on offshore production installations - Requirements and guidelines, International Organization for Standardization, Geneva, 1999.
[7] CCPS, Layer of protection analysis simplified process risk assessment, Center for Chemical Process Safety of the American Institute of Chemical Engineers, New York, 2001.
[8] Duijm, N. J., Andersen, H. B., Hale, A., Goossens, L. and Hourtolou, D., Evaluating and Managing Safety Barriers in Major Hazard Plants, PSAM 7 - ESREL'04, Berlin, Germany, 2004.
[9] Harms-Ringdahl, L., Assessing safety functions - results from a case study at an industrial workplace, Safety Science. 41, 8 (2003) 701-720.
[10] Hollnagel, E., Barrier and Accident Prevention, Ashgate, Hampshire, England, 2004.
[11] Johnson, W. G., MORT safety assurance systems, Marcel Dekker, New York, 1980.
[12] Rosness, R., Ten thumbs and zero accidents? : About fault tolerance and accidents (in Norwegian), Institute for Energy Technology, Kjeller, 2005.
[13] Kecklund, L. J., Edland, A., Wedin, P. and Svenson, O., Safety barrier function analysis in a process industry: A nuclear power application, International Journal of Industrial Ergonomics. 17, 3 (1996) 275-284.
[14] Goossens, L. and Hourtolou, D., What is a barrier?, ARAMIS-working document, 2003.
[15] Sklet, S. and Hauge, S., Reflections on the Concept of Safety Barriers, PSAM7 - ESREL 2004, Berlin, 2004.
33
Thesis - Part I Main Report
[16] Neogy, P., Hanson, A. L., Davis, P. R. and Fenstermacher, T. E., Hazard and Barrier Analysis Guidance Document, Rev. 0, US Department of Energy (DoE), EH-33 Office of Operating Experience Analysis and Feedback, 1996.
[17] Svenson, O , The Accident Evolution and Barrier Function (AEB) Model Applied to Incident Analysis in the Processing Industries, Risk Analysis. 11,3 (1991) 499-507.
[18] Reason, J., Managing the risks of organizational accidents, Ashgate, Aldershot, 1997.
[19] Kaplan, S., The Words or Risk Analysis, Risk Analysis. 17, 4 (1997) 407-417.[20] Hopkins, A., Lessons from Longford: the Esso gas plant explosion, CCH
Australia Ltd, Sydney, 2000.[21] Cullen, W. D , The public inquiry into the Piper Alpha disaster, Hmso,
London, 1990.[22] Vaughan, D , The Challenger launch decision : risky technology, culture, and
deviance at NASA, University of Chicago Press, Chicago, 1996.[23] CAIB, The Colombia Accident Investigation Board Report - Volume 1,
http://www.caib.us/. 2003.[24] NOU-2000:31, Hurtigbaten MS Sleipners forlis 26. november 1999, Justis- og
politidepartementet, Oslo, Norge, 2000.[25] Cullen, W. D , The Ladbroke Grove Rail Inquiry: Report, Part 1, HSE Books,
United Kingdom, 2001.[26] NOU, Astaulykken, 4. januar 2000., Justis- og politidepartementet, Oslo,
Norge, 2000.[27] Sklet, S., Storulykker i Norge de siste 20 arene, In Lydersen, S. (eds), Fra flis i
fingeren til ragnarok, Tapir Akademisk Forlag, Trondheim, 2004.[28] Oien, K, A Focused Literature Review of Organizational Factors' Effect on
Risk. Paper II in the Doctoral thesis Risk Control of Offshore Installations, NTNU, Trondheim, Norway, 2001.
[29] Vinnem, J. E., Aven, T., Hundseid, H, Vassmyr, K. A., Vollen, F. and Oien, K, Risk assessments for offshore installations in the operational phase, ESREL 2003, Maastricht, The Netherlands, 2003.
[30] Andersen, H, Casal, J., Dandrieux, A., Debray, B , De Dianous, V., Duijm, N. J., Delvosalle, C , Fievez, C , Goossens, L., Gowland, R. T., Hale, A. J., Hourtolou, D, Mazzarotta, B , Pipart, A., Planas, E., Prats, F., Salvi, O. and Tixier, J., ARAMIS - User Guide, EC Contract number EVG1-CT-2001- 00036,2004.
[31] Bellamy, L. J., Papazoglou, I. A., Hale, A. R, Aneziris, O. N., Ale, B. J. M., Morris, M. I. and Oh, J. I. H, I-RISK - Development of an Integrated Technical and Management Risk Control and Monitoring Methodology for Managing and Quantifying On-Site and Off-Site Risks. Main Report. Contract No: ENVA-CT96-0243, 1999.
34
Thesis - Part I Main Report
[32] Davoudian, K., Wu, J.-S. and Apostolakis, G. E., Incorporating organisational factors into risk assessment through the analysis of work processes, Reliability Engineering and System Safety. 45 (1994) 85-105.
[33] Davoudian, K., Wu, J.-S. and Apostolakis, G. E., The work process analysis model (WPAM-II), Reliability Engineering and System Safety. 45 (1994) 107 - 125.
[34] Embrey, D. E., Incorporating management and organisational factors into probabilistic safety assessment, Reliability Engineering and System Safety. 38, 1-2(1992) 199-208.
[35] Modarres, M., Mosleh, A. and Wreathall, J. A., Framework for assessing influence of organisation on plant safety, Reliability Engineering & System Safety. 45 (1994) 157- 171.
[36] Murphy, D. M. and Pate-Comell, E. M., The SAM Framework: Modeling the Effects of Management Factors on Human Behavior in Risk Analysis, Risk Analysis. 16, 4 (1996).
[37] 0ien, K. and Sklet, S., Organisational risk indicators Pilot study Statfjord A (In Norwegian), SINTEF-report STF38 A00421, SINTEF, Trondheim, Norway, 2000.
[38] Pitblado, R. M., Williams, J. C. and Slater, D. H , Quantitative Assessment of Process Safety Programs, Plant/Operations Progress. 9, 3 (1990).
[39] Mosleh, A. and Goldfeiz, E. B , An Approach for Assessing the Impact of Organisational Factors on Risk, Technical research report, CTRS, A. James Clark School of Engineering, University of Maryland at College Park, 1996.
[40] Oien, K., A framework for the establishment of organizational risk indicators, Reliability Engineering & System Safety. 74, 2 (2001) 147-167.
[41] Kafka, P, The process of safety management and decision making, ESREL 2005, Tri City, Poland, 2005.
[42] SfS, Barriers - out of the fog, towards increased safety (in Norwegian - Barrierer - ut av takehavet, mot bedre sikkerhet), Together for Safety, OLE., Stavanger, Norway, 2004.
[43] Vinnem, J. E., Aven, T., Hauge, S., Seljelid, J. and Veire, G, Integrated Barrier Analysis in Operational Risk Assessment in Offshore Petroleum Operations, PSAM7 - ESREL'04, Berlin, 2004.
[44] Sklet, S. and Steiro, T., Lekkasje i forbindelse med kabeloperasjoner; Tekniske og operas] onelle forholds betydning for lekkasjer med storulykkespotensiale, STF50 A05177, SINTEF, Trondheim, 2005.
[45] Oien, K., Hauge, S., Sklet, S. and Monsen, J., Barrier Change Analysis Method, PS AM 7 / ESREL '04, Berlin, 2004.
[46] OLE, OLE Recommended Guidelines for Common Model for Work Permits (WP), No.: 088, www.samarbeidforsikkerhet.no. 2003.
[47] OLE, OLE Recommended Guidelines for Common Model for Safe Job Analysis (SJA), No. 090, www.samarbeidforsikkerhet.no. 2003.
35

Thesis - Part I Main Report
[48] Tinmannsvik, R. K., Sklet, S. and Jersin, E., Methods for accident investigations; A survey (In Norwegian), STF38 A04422, SINTEF, Dept, of Safety and Reliability, Trondheim, 2004.
[49] Kaplan, S., Risk Assessment and Risk Management - Basic Concepts and Terminology, In Knief, R. A. (eds), Risk Management - Expanding Horizons in Nuclear Power and Other Industries, Hemisphere Publishing Corporation, USA, 1991.
[50] Hale, A., Note on barriers and delivery systems, PRISM conference, Athens, 2003.
[51] Rausand, M. and Hoyland, A., System reliability theory: models, statistical methods, and applications, Wiley-Interscience, Hoboken, N.J., 2004.
[52] PSA, Trends in risk levels on the Norwegian Continental Shelf Main report Phase 4 2003 (In Norwegian; Utvikling i risikoniva norsk sokkel Hovedrapport Ease 4 2003), The Petroleum Safety Authority, Stavanger, 2004.
[53] statistics, Britannica Student Encyclopedia, Encyclopaedia Britannica Online. 10. nov. 2005 <http://search.eb.com/ebi/article-208648>. 2005.
[54] Rasmussen, 1, Risk management in a dynamic society: a modelling problem, Safety Science. 27,2-3 (1997) 183-213.
[55] Kjellen, U., Prevention of accidents through experience feedback, Taylor & Francis, London, 2000.
[56] Hovden, 1, Sklet, S. and Tinmannsvik, R. K., I etterpaklokskapens klarsyn: Gransking og lasting av ulykker., In Lydersen, S. (eds), Fra flis i fingeren til ragnarok., Tapir Akademisk Forlag, Trondheim, 2004.
[57] DoE, Conducting Accident Investigations DOE Workbook, Revision 2, U.S. Department of Energy, Washington D C, 1999.
[58] Pate-Comell, E. M., Learning from the Piper Alpha accident: a post-mortem analysis of technical and organizational factors, Risk Analysis. 13, 2 (1993).
[59] CCPS, Guidelines for Investigating Chemical Porcess Incidents, Center for Chemical Process Safety of the American Institute of Chemical Engineers, New York, 1992.
[60] Hendrick, K. and Benner, L. 1, Investigating Accidents with STEP, Marcel Dekker, New York, 1987.
[61] Bento, J.-P., Menneske - Teknologi - Organisasjon Veiledning for gjennomforing av MTO-analyser. Kurskompendium for Oljedirektoratet, Oversatt av Statoil,, Oljedirektoratet, Stavanger, Norway, 2001.
[62] Rollenhagen, C , MTO - an introduction; The relationship between humans, technology, and organisation (In Swedish; MTO - en introduktion; Sambanden manniska, teknik och organisation), Utbildningshuset, Lund, 1997.
[63] Groeneweg, 1, Controlling the controllable: The management of safety, DSWO Press, Leiden, The Netherlands, 1998.
[64] Rasmussen, J. and Svedung, I, Proactive Risk Management in a Dynamic Society, Swedish Rescue Services Agency, Stockholm, 2000.
[65] Kletz, T. A., Learning from Accidents, Gulf Prof. Publishing, UK, 2001.
36

Thesis - Part II Papers
Paper 1
Paper 2
Paper 3
Paper 4
Paper 5
Paper 6
Paper 7
Paper 8
PART II PAPERS
Safety barriers: Definition, classification, and performance
Hydrocarbon releases on oil and gas production platforms: Release scenarios and safety barriers
Barrier and operational risk analysis of hydrocarbon releases (BORA-Release); Part I Method description
Barrier and operational risk analysis of hydrocarbon releases (BORA-Release); Part II Results from a case study
Comparison of some selected methods for accident investigation
Qualitative Analysis of Human, Technical and Operational Barrier Elements during Well Interventions
Standardised procedures for Work Permits and Safe Job Analysis on the Norwegian Continental Shelf
Challenges related to surveillance of safety functions


Thesis - Part II Papers
Paper 1
Safety barriers: Definition, classification, and performance
Snorre SkletJournal of Loss Prevention in the Process Industries Article in press, available online 20 January 2006


ARTICLE IN PRESS
ELSEVIER
Available online at www.sciencedirect.com
SCIENCE DIRECT®
Journal of Loss Prevention in the Process Industries I (HID
Journal ofLossPreventionin the process industries
www.elsevier.com/locate/jlp
Safety barriers: Definition, classification, and performanceSnorre Sklet*
Department of Production and Quality Engineering, The Norwegian University of Science and Technology (NTNU), NO-7491 Trondheim, Norway
Received 18 October 2005; received in revised form 6 December 2005; accepted 6 December 2005
Abstract
In spite of the fact that the concept of safety barriers is applied in practice, discussed in the literature, and even required in legislation and standards, no common terminology that is applicable across sectors have been developed of the concept of safety barriers. This paper focuses on safety barriers and addresses the following aspects; definitions and understanding of what is a safety barrier, classification of safety barriers, and attributes of importance for the performance of safety barriers. Safety barriers are physical or non-physical means planned to prevent, control, or mitigate undesired events or accidents. Barrier systems may be classified according to several dimensions, for example as passive or active barrier systems, and as physical, technical, or human/operational barrier systems. Several attributes are necessary to include in order to characterize the performance of safety barriers; functionality/effectiveness, reliability/availability, response time, robustness, and finally a description of the triggering event or condition. For some types of barriers, not all the attributes are relevant or necessary in order to describe the barrier performance.© 2006 Elsevier Ltd. All rights reserved.
Keywords: Safety barrier; Defence-in-depth; Barrier performance; Risk analysis
1. Introduction
Safety barriers have been used to protect humans and property from enemies and natural hazards since the origin of human beings. When human-induced hazards were created due to the industrialism, safety barriers were implemented to prevent accidents caused by these hazards. The concept of safety barriers is often related to an accident model called the energy model (see Fig. 1). Gibson (1961) pioneered the development of the energy model, while Haddon (1980) developed the model further as he presented his ten strategies for accident prevention. Safety barriers also play an important role in the Management Oversight & Risk Tree (MORT) concept (Johnson, 1980).
During recent years, an extended perspective on safety barriers has evolved. This is emphasized by Hollnagel (2004) who states that “whereas the barriers used to defend a medieval castle mostly were of a physical nature, the modern principle of defence-in-depth combines different types of barriers—from protection against the release of
*Tek: +47 73 592902; fax: +47 73 5928 96.E-mail address: snorre. sklet@ sintef.no.
0950-4230/$ - see front matter © 2006 Elsevier Ltd. All rights reserved, doi: 10.1016/j.jlp.2005.12.004
radioactive materials to event reporting and safety policies”. This development is also supported by Fleming and Silady (2002) who states that “the definitions of defence-in-depth have evolved from a rather simple set of strategies to apply multiple lines of defence to a more comprehensive set of cornerstones, strategies, and tactics to protect the public health and safety”. The concept of defence-in-depth was developed within the nuclear industry, but is also used in other high risk industries (e.g., the process industry where also the term multiple protection layers is used; CCPS, 1993).
The focus on the use of risk-informed principles and safety barriers in European regulations such as the Seveso II directive (EC, 1996) and the Machinery directive (EC, 1998), national regulations as the Management regulation from the Petroleum Safety Authority Norway (PSA) (PSA, 2001), and standards such as IEC:61508 (1998), IEC:61511 (2002), and ISO: 13702 (1999) demonstrates the importance of safety barriers in order to reduce the risk of accidents. PSA has developed requirements to safety barriers, but has not given a clear definition of the concept. Discussions have emerged on what is a safety barrier. Specialists do not fully agree on this issue and it is difficult for the companies

ARTICLE IN PRESS2 S. Sklet / Journal of Loss Prevention in the Process Industries I ■■■■ Ill-Ill
Hazard(energy source) Barrier
Victim(vulnerable target)
Fig. 1. The energy model (based on Haddon. 1980).
to know how to fulfil the requirements. It is also difficult for the PSA to manage the regulations without a clear definition and delimitation of the concept.
No common definition of the term safety barrier has been found in the literature, although different aspects of the term have been discussed, see, e.g., (CCPS, 2001; Duijm, Andersen, Hale, Goossens, & Hourtolou, 2004; Goossens & Hourtolou, 2003; Harms-Ringdahl, 2003; Hollnagel, 2004; Johnson, 1980; Kecklund, Edland, Wedin, & Svenson, 1996; Neogy, Hanson, Davis, & Fensterma- cher, 1996; Rosness, 2005; Sklet & Hauge, 2004; Svenson, 1991), and applied in practice for several decades. Different terms with similar meanings (barrier, defence, protection layer, safety critical element, safety function, etc.) have been used crosswise between industries, sectors, and countries. Safety barriers are categorized in numerous ways by different authors and the performance of the barriers is described in several ways.
The extended use of the term safety barrier (and similar terms) and the lack of a common terminology imply a need for clarifying the terminology both in the Norwegian offshore industry and crosswise between sectors. This need is supported by the following statement from Kaplan (1990); "When words are used sloppily, concepts become fuzzy, thinking is muddled, communication is ambiguous, and decisions and actions are suboptimal, to say the least”. To clarify the terms will be useful in order to avoid misconceptions in communication about risk and safety barriers. The results should be of general interest, and furthermore, a clarification of the term will make it easier for the Norwegian offshore industry to fulfil the requirements from the PSA with respect to classification of barriers and analysis of the performance of different types of safety barriers and barrier elements.
The objectives of the paper are: (1) to present a survey of how the concept safety barrier and similar concepts are interpreted and used in various industries and various applications, (2) to provide a clear definition of the concept safety barrier, and associated concepts like barrier func
tion, barrier system, and barrier element, (3) to develop a classification system for safety barriers, (4) to define attributes describing the performance of safety barriers, and (5) to give recommendations on how the concept of safety barrier should be interpreted and used in different contexts.
The paper is based on experience from a literature survey concerning the understanding of safety barriers in different industries, several projects focusing on analysis of safety barriers (e.g., the BORA project (Barrier and Operational Risk Analysis) (Aven, Sklet, & Vinnem, 2005; Sklet, Aven, Hauge, & Vinnem, 2005; Sklet, Vinnem, & Aven, 2005; Vinnem, Aven, Hauge, Seljelid, & Veire, 2004) and a project on behalf of PSA focusing on barriers during well interventions (Sklet, Steiro, & Tjelta, 2005), and a study of how safety barriers are analysed in different accident investigation methods (Sklet, 2004). The literature is identified in literature databases, from references in reviewed literature, and by attending international conferences.
The main focus in this paper is the use of the barrier concept within industrial safety, especially as applied to technical systems in the process and nuclear industry. Even though the main focus is on demands for clarification of the term safety barrier from the Norwegian offshore industry, the discussions are also relevant for other industries (e.g., the process industry) and application areas (e.g., the transport sector). The focus is on the risk of major accidents, i.e., occupational accidents have not been discussed in detail. The attention is directed toward safety issues, but the concepts may also be useful for security issues.
The concept of safety barriers is briefly introduced in this section together with the purpose of the paper. The next section discusses what a safety barrier is and gives an overview of some definitions applicable for explanation of the concept of safety barriers. Section three gives an overview of some schemes for classification of barrier functions and barrier systems. Several measures of barrier performance are presented and discussed in section four. Comments, a brief discussion, and recommendations are included in each section. Finally, some conclusions concerning the concept of safety barriers end the paper.
2. What is a safety barrier?
2.1. Features of safety barriers
The term safety barrier and similar terms like defence (in-depth), layer of protection, safety (critical) function, safety critical element, and safety system are applied in regulations, standards, and the scientific literature. A literature review (e.g., CCPS, 2001; Duijm et ah, 2004; Goossens & Hourtolou, 2003; Harms-Ringdahl, 2003; Hollnagel, 2004; Johnson, 1980; Kecklund et ah, 1996; Neogy et ah, 1996; Rosness, 2005; SfS, 2004; Sklet & Hauge, 2004; Svenson, 1991) shows that there is no
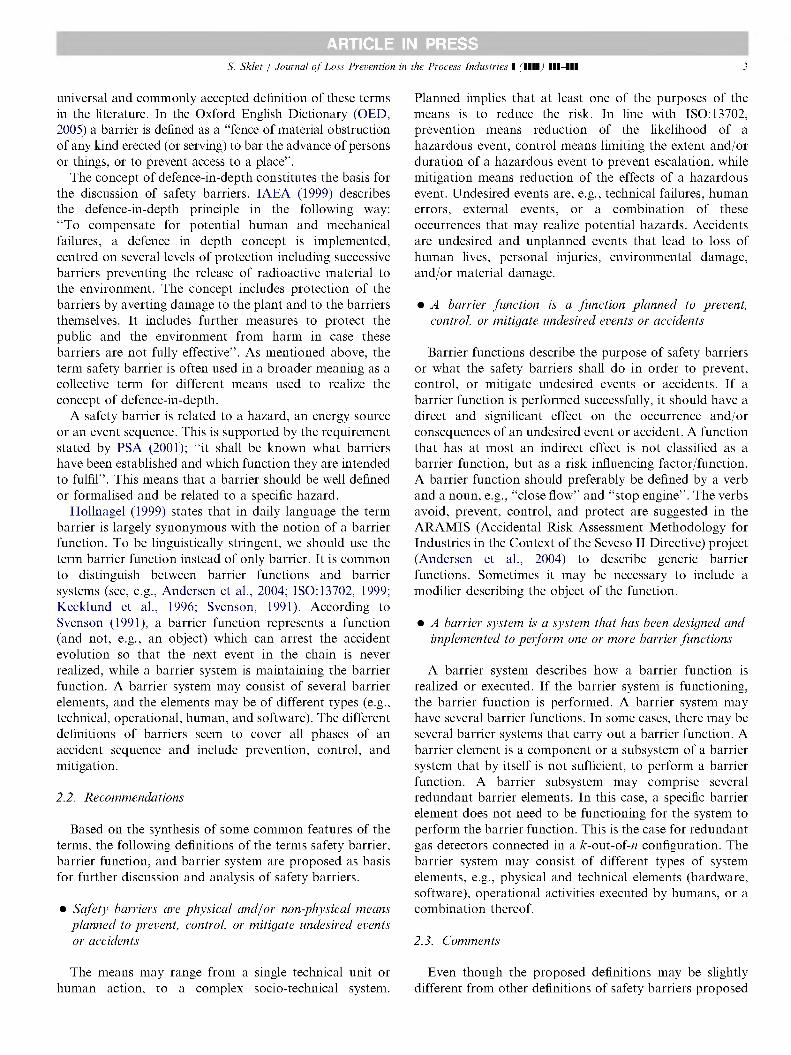
ARTICLE IN PRESSS. Sklet / Journal of Loss Prevention in the Process Industries I ■■■■ Ill-Ill
universal and commonly accepted definition of these terms in the literature. In the Oxford English Dictionary (OED, 2005) a barrier is defined as a "fence of material obstruction of any kind erected (or serving) to bar the advance of persons or things, or to prevent access to a place”.
The concept of defence-in-depth constitutes the basis for the discussion of safety barriers. IAEA (1999) describes the defence-in-depth principle in the following way: "To compensate for potential human and mechanical failures, a defence in depth concept is implemented, centred on several levels of protection including successive barriers preventing the release of radioactive material to the environment. The concept includes protection of the barriers by averting damage to the plant and to the barriers themselves. It includes further measures to protect the public and the environment from harm in case these barriers are not fully effective”. As mentioned above, the term safety barrier is often used in a broader meaning as a collective term for different means used to realize the concept of defence-in-depth.
A safety barrier is related to a hazard, an energy source or an event sequence. This is supported by the requirement stated by PSA (2001); "it shall be known what barriers have been established and which function they are intended to fulfil”. This means that a barrier should be well defined or formalised and be related to a specific hazard.
Hollnagel (1999) states that in daily language the term barrier is largely synonymous with the notion of a barrier function. To be linguistically stringent, we should use the term barrier function instead of only barrier. It is common to distinguish between barrier functions and barrier systems (see, e.g., Andersen et ah, 2004; ISO: 13702, 1999; Kecklund et ah, 1996; Svenson, 1991). According to Svenson (1991), a barrier function represents a function (and not, e.g., an object) which can arrest the accident evolution so that the next event in the chain is never realized, while a barrier system is maintaining the barrier function. A barrier system may consist of several barrier elements, and the elements may be of different types (e.g., technical, operational, human, and software). The different definitions of barriers seem to cover all phases of an accident sequence and include prevention, control, and mitigation.
2.2. Recommendations
Based on the synthesis of some common features of the terms, the following definitions of the terms safety barrier, barrier function, and barrier system are proposed as basis for further discussion and analysis of safety barriers.
• Safety barriers are physical and/or non-physical meansplanned to prevent, control, or mitigate undesired eventsor accidents
The means may range from a single technical unit or human action, to a complex socio-technical system.
Planned implies that at least one of the purposes of the means is to reduce the risk. In line with ISO: 13702, prevention means reduction of the likelihood of a hazardous event, control means limiting the extent and/or duration of a hazardous event to prevent escalation, while mitigation means reduction of the effects of a hazardous event. Undesired events are, e.g., technical failures, human errors, external events, or a combination of these occurrences that may realize potential hazards. Accidents are undesired and unplanned events that lead to loss of human lives, personal injuries, environmental damage, and/or material damage.
• A barrier function is a function planned to prevent.control, or mitigate undesired events or accidents
Barrier functions describe the purpose of safety barriers or what the safety barriers shall do in order to prevent, control, or mitigate undesired events or accidents. If a barrier function is performed successfully, it should have a direct and significant effect on the occurrence and/or consequences of an undesired event or accident. A function that has at most an indirect effect is not classified as a barrier function, but as a risk influencing factor/function. A barrier function should preferably be defined by a verb and a noun, e.g., "close flow” and "stop engine”. The verbs avoid, prevent, control, and protect are suggested in the ARAMIS (Accidental Risk Assessment Methodology for Industries in the Context of the Seveso II Directive) project (Andersen et ah, 2004) to describe generic barrier functions. Sometimes it may be necessary to include a modifier describing the object of the function.
• A barrier system is a system that has been designed andimplemen ted to perform one or more barrier functions
A barrier system describes how a barrier function is realized or executed. If the barrier system is functioning, the barrier function is performed. A barrier system may have several barrier functions. In some cases, there may be several barrier systems that carry out a barrier function. A barrier element is a component or a subsystem of a barrier system that by itself is not sufficient, to perform a barrier function. A barrier subsystem may comprise several redundant barrier elements. In this case, a specific barrier element does not need to be functioning for the system to perform the barrier function. This is the case for redundant gas detectors connected in a k-out-of-n configuration. The barrier system may consist of different types of system elements, e.g., physical and technical elements (hardware, software), operational activities executed by humans, or a combination thereof.
2.3. Comments
Even though the proposed definitions may be slightly different from other definitions of safety barriers proposed
3

ARTICLE IN PRESSS. Sklet / Journal of Loss Prevention in the Process Industries I ■■■■ Ill-Ill
(DoE, 1997; Hollnagel, 2004; ISO: 17776, 2000; Rosness, 2005; SfS, 2004) and protection layer proposed by CCPS (2001) and IEC:61508/11, the interpretations of the proposed definitions are in accordance with these definitions. However, CCPS and IEC:61508 stress the independence between different protection layers as part of their definitions. Barriers are restricted to flow of energy in MORT (Johnson, 1980) where barriers are defined as "the physical and procedural measures to direct energy in wanted channels and control unwanted release”. In the ARAMIS-project (Duijm et ah, 2004), the safety barriers are limited to focus on release of hazardous agents and the following definition is applied; "A safety barrier is a system element that prevents, limits, or mitigates the release of a hazardous agent”. Another equivalent term to safety barrier is the commonly used term defence that Reason (1997) defines as "various means by which the goals of ensuring the safety of people and assets can be achieved”. Reason describes defence-in-depth as "successive layers of protection”. Within the concept of MTO-analysis (Human, Techology, and Organizations) applied in accident investigations, a safety barrier is defined as "any operational, organisational, or technical solution or system that minimizes the probability of events to occur, and limit the consequences of such events” (Bento, 2003). It seems that almost all types of organizational risk influencing factors are included as barriers in the MTO-diagrams presented in the investigation reports.
The definition of a barrier function is similar to several definitions of the term safety function. For example, as presented by Harms-Ringdahl (2000) who states that "a safety function is a technical, organisational or combined function, which can reduce the probability and/or consequences of a set of hazards in a specific system”, and IEC:61511 that defines safety function as "a function [...] which is intended to achieve or maintain a safe state for the process, in respect of a specific hazardous event”. A system may have several functions, and the barrier function may be one of them (Rausand & Hoyland, 2004). For example, the essential function of a pipe on an oil platform is to transport hydrocarbons from system A to system B, whereas the barrier function to prevent release of hydrocarbons to the atmosphere is an auxiliary function.
4
Sometimes a failure of the auxiliary function may be as least as critical as a failure of the essential function.
Most of the authors cover both physical and nonphysical barriers as part of their definitions, but two exceptions are Holand (1997) and IAEA (1999). Holand defines a well barrier as a physical item only, while IAEA distinguishes between physical barriers and other types of protection where both types are incorporated in the concept of defence-in-depth.
There are distinctions between the different definitions regarding to which extent barriers should influence the energy flow or event sequence. On one hand, 180:17776 (2000) states that a barrier should "reduce the probability” or "reduce the consequences”. On the other hand, Holand (1997) says that a barrier should "prevent the flow” and CCPS (2001) says that a protection layer should be "capable of preventing a scenario from proceeding to the undesired consequences”. This topic is related to the effectiveness of the barrier and is further discussed in Section 4 about barrier performance.
Another aspect of the definition is whether such a broad definition undermines the concept of barrier as some claim that almost everything may be considered as a barrier. Therefore, it is important to distinguish between the barrier itself that may prevent, control, or mitigate the event sequence or accident scenario directly (as illustrated in Fig. 2), and the risk influencing factors that influence the barrier performance. Examples on risk influencing factors are competence of a third party checker and testing of gas detectors. Thus, it is important to specify the barrier function in order to clarify at which level different barriers influence the accident scenario. This may be illustrated by the following example; the containment (e.g., a pipe) should prevent release of hydrocarbon to the atmosphere, while inspection is executed to reveal corrosion such that risk reducing measures may be implemented to prevent that corrosion results in a leak.
At least two different accident models or perspectives may be the basis for the concept of safety barriers; the energy model and the process model. The basic principle in the energy model is to separate hazards (energy sources) from victims (vulnerable targets) by safety barriers (Haddon, 1980). Process models divide the accident
Loss of human life
Loss of containment
Corrosion
Failure during flange
assembling
1. Condition monitoring to reveal corrosion 6.2. Inspection to reveal corrosion 7.3. Self control of work to reveal failure 8.4. 3rd party control of work to reveal failure 9.5. Leak test to reveal failure
Process shutdown to reduce size of release Disconnection of ignition sources to prevent ignition Deluge activation to extinguish fire Escape ways for evacuation
Fig. 2. Illustration of barriers influencing a process accident.

ARTICLE IN PRESSS. Sklet / Journal of Loss Prevention in the Process Industries I ■■■■ Ill-Ill 5
sequences in different phases and help us to understand how a system gradually deteriorates from a normal state into a state where an accident occurs (Kjellen, 2000). For process models, factors that prevent transitions between phases in the accident sequence (or process) may be regarded as safety barriers. While the energy model focuses primarily on how to avoid injuries or losses due to release of energy, process models are more focused on event sequences or work processes.
3. Classification of safety barriers
3.1. Classification of barrier functions
When barrier functions are related to a process model or phases in an accident sequence, it is common to classify the barrier functions as prevention, control, and mitigation (IEC:61508, IEC:61511, 180:13702). This classification is similar to the categorization of barrier functions used in MORT (Johnson, 1980), where the terms prevention, control, and minimization are used. Hollnagel (2004) describes only two main functions for safety barriers; prevention and protection. Barriers intended to work before a specific initiating event takes place serve as a means of prevention. They are supposed to ensure that the accident does not happen, or at least to slow down the developments that may result in an accident. Barriers intended to work after a specific initiating event has taken place, serve as means of protection, and are supposed to shield the environment and the people in it, as well as the system itself, from the consequences of the accident.
The ARAMIS-project (Andersen et ah, 2004) classifies safety functions into four main categories described by the action verbs to avoid, to prevent, to control, and to protect. These verbs are described by Duijm et al. (2003), and the avoid function aims at suppressing all the potential causes of an event by changing the design of the equipment or the type of product used, e.g., the use of a non-flammable product is a way to avoid fire. The prevent function aims at reducing the probability of an event by suppressing part of its potential causes or by reducing their intensity, e.g., to prevent corrosion, a better steel grade can be used. It is probably not sufficient to avoid it, but it may reduce its probability. The control function aims at limiting the deviation from a normal situation to an unacceptable one.
A pressure relief system and a computerized supervision system perform a control function. Once an event has occurred, it is necessary to protect the environment from its consequences.
Another viewpoint is used by Vatu (2001) while discussing safety critical functions within the Norwegian railway industry. He differentiates between primary, secondary, and tertiary safety critical functions. Primary safety critical functions are related to technical systems for the rolling material, the rail network, and the traffic control. Secondary safety critical functions are activities performed in order to maintain the primary safety critical functions. Tertiary safety critical functions are safety management systems, maintenance management systems, etc. Wahlstrdm and Gunsell (1998) distinguish between primary and secondary barriers, and as Vatn, they relate the term secondary barriers to control/surveillance of the primary barriers. A similar approach is presented by Schupp (2004), where primary barriers are associated with primary hazards, and secondary barriers with functional hazards. Primary hazards are hazards that are directly harmful to humans, the environment, or the economy, while functional hazards are hazardous to functions of the process (or plant) system. A functional hazard may indirectly become hazardous to humans, for instance, corrosion is a common functional hazard. Corrosion may cause the containment system to fail, thus releasing a primary hazard.
Leveson (1995) focuses on barriers related to software systems and distinguishes between three types of barrier functions, lockout, loclcin, and interlock. A lockout "prevents a dangerous event from occurring or prevents someone or something from entering a dangerous area or state”, a lockin is "something that maintains a condition or preserves a system state”, while an interlock serves "to enforce correct sequencing or to isolate two events in time”.
In Fig. 3 the different barrier functions are related to phases in the Occupational Accident Research Unit (OARU) process model (Kjellen & larsson, 1981). The accident sequence is divided into three phases, the initial phase, the concluding phase, and the injury phase. The generic safety functions prevent, control, and mitigate are related to the transitions between the different phases in the OARU-model. To prevent means to prevent transition
The accident sequence
Normal condition Initial phase Concluding phase Injury phase
Lack of control Loss o f control Energywexposure
Prevent Protect
Prevent Control Mitigate
Avoid Prevent Control Protect
(Hollnagel, 2004)(I EC 61508/11 ISO 13702 (Duijm et at, 2004)
Fig. 3. Generic safety functions related to a process model.
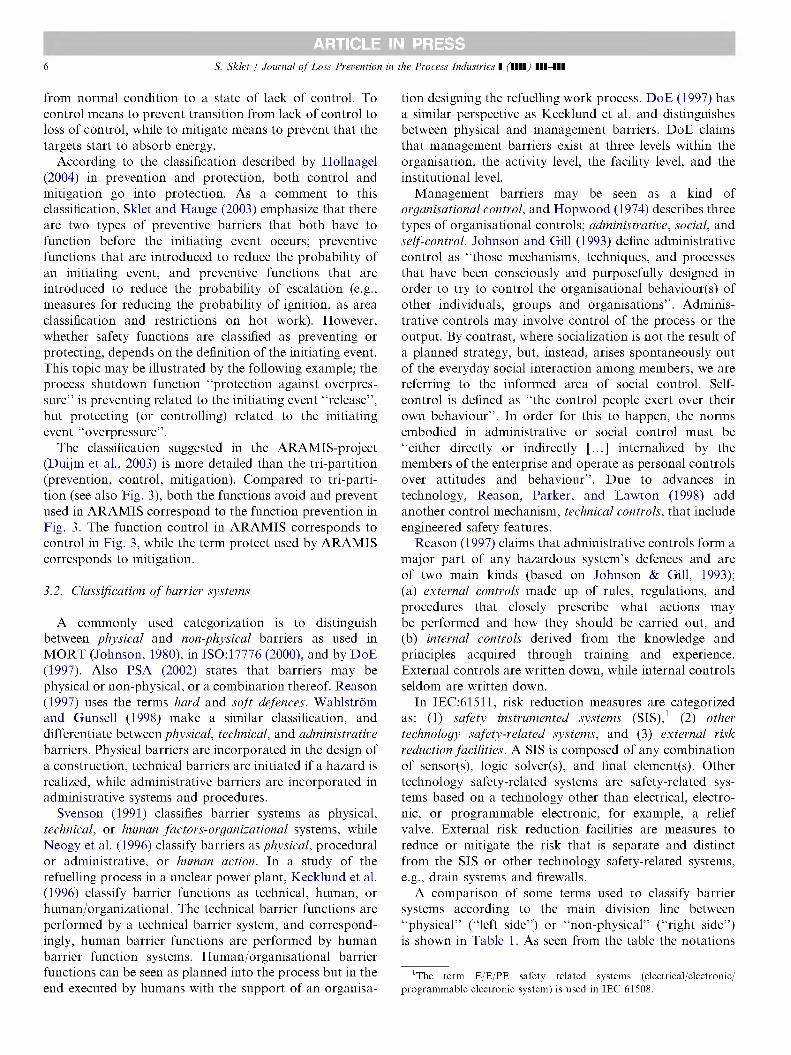
ARTICLE IN PRESSS. Sklet / Journal of Loss Prevention in the Process Industries I ■■■■ Ill-Ill
from normal condition to a state of lack of control. To control means to prevent transition from lack of control to loss of control, while to mitigate means to prevent that the targets start to absorb energy.
According to the classification described by Hollnagel (2004) in prevention and protection, both control and mitigation go into protection. As a comment to this classification, Sklet and Hauge (2003) emphasize that there are two types of preventive barriers that both have to function before the initiating event occurs; preventive functions that are introduced to reduce the probability of an initiating event, and preventive functions that are introduced to reduce the probability of escalation (e.g., measures for reducing the probability of ignition, as area classification and restrictions on hot work). However, whether safety functions are classified as preventing or protecting, depends on the definition of the initiating event. This topic may be illustrated by the following example; the process shutdown function "protection against overpressure” is preventing related to the initiating event "release”, but protecting (or controlling) related to the initiating event "overpressure”.
The classification suggested in the ARAMIS-project (Duijm et ah, 2003) is more detailed than the tri-partition (prevention, control, mitigation). Compared to tri-parti- tion (see also Fig. 3), both the functions avoid and prevent used in ARAMIS correspond to the function prevention in Fig. 3. The function control in ARAMIS corresponds to control in Fig. 3, while the term protect used by ARAMIS corresponds to mitigation.
3.2. Classification of barrier systems
A commonly used categorization is to distinguish between physical and non-physical barriers as used in MORT (Johnson, 1980), in 180:17776 (2000), and by DoF (1997). Also PSA (2002) states that barriers may be physical or non-physical, or a combination thereof. Reason (1997) uses the terms hard and soft defences. Wahlstrdm and Gunsell (1998) make a similar classification, and differentiate between physical, technical, and administrative barriers. Physical barriers are incorporated in the design of a construction, technical barriers are initiated if a hazard is realized, while administrative barriers are incorporated in administrative systems and procedures.
Svenson (1991) classifies barrier systems as physical, technical, or human factors-organizational systems, while Neogy et al. (1996) classify barriers as physical, procedural or administrative, or human action. In a study of the refuelling process in a nuclear power plant, Kecklund et al. (1996) classify barrier functions as technical, human, or human/organizational. The technical barrier functions are performed by a technical barrier system, and correspondingly, human barrier functions are performed by human barrier function systems. Human/organisational barrier functions can be seen as planned into the process but in the end executed by humans with the support of an organisa
6
tion designing the refuelling work process. DoE (1997) has a similar perspective as Kecklund et al. and distinguishes between physical and management barriers. DoE claims that management barriers exist at three levels within the organisation, the activity level, the facility level, and the institutional level.
Management barriers may be seen as a kind of organisational control, and Hopwood (1974) describes three types of organisational controls; administrative, social, and self-control. Johnson and Gill (1993) define administrative control as "those mechanisms, techniques, and processes that have been consciously and purposefully designed in order to try to control the organisational behaviour(s) of other individuals, groups and organisations”. Administrative controls may involve control of the process or the output. By contrast, where socialization is not the result of a planned strategy, but, instead, arises spontaneously out of the everyday social interaction among members, we are referring to the informed area of social control. Self- control is defined as "the control people exert over their own behaviour”. In order for this to happen, the norms embodied in administrative or social control must be "either directly or indirectly [...] internalized by the members of the enterprise and operate as personal controls over attitudes and behaviour”. Due to advances in technology, Reason, Parker, and Lawton (1998) add another control mechanism, technical controls, that include engineered safety features.
Reason (1997) claims that administrative controls form a major part of any hazardous system’s defences and are of two main kinds (based on Johnson & Gill, 1993);(a) external controls made up of rules, regulations, and procedures that closely prescribe what actions may be performed and how they should be carried out, and(b) internal controls derived from the knowledge and principles acquired through training and experience. External controls are written down, while internal controls seldom are written down.
In IEC:61511, risk reduction measures are categorized as: (1) safety instrumented systems (SIS),1 (2) other technology safety-related systems, and (3) external risk reduction facilities. A SIS is composed of any combination of sensor(s), logic solver(s), and final element(s). Other technology safety-related systems are safety-related systems based on a technology other than electrical, electronic, or programmable electronic, for example, a relief valve. External risk reduction facilities are measures to reduce or mitigate the risk that is separate and distinct from the SIS or other technology safety-related systems, e.g., drain systems and firewalls.
A comparison of some terms used to classify barrier systems according to the main division line between "physical” ("left side”) or "non-physical” ("right side”) is shown in Table 1. As seen from the table the notations *
'The term E/E/PE safety related systems (electrical/electronic/ programmable electronic system) is used in IEC 61508.

ARTICLE IN PRESS
Table 1Different classifications of barriers
S. Sklet / Journal of Loss Prevention in the Process Industries 1 Mil Ill-Ill
as physical or non-physical
7
Terms References
PhysicalHard defence
Physical TechnicalPhysical Technical
TechnicalTechnicalTechnicalPhysical
Hardware
Non-physicalSoft defence
AdministrativeHuman factors/organizational
Procedural/administrative Human actionsHuman/organizational HumanOrganizational Operational
ManagementBehavioural
(Johnson. 1980; 180:17776. 2000; DoE. 1997; PSA. 2002) (Reason. 1997)(Wahlstrom & Gunsell. 1998)(Svenson. 1991)(Neogy et al.. 1996)(Kecklund et al.. 1996)(Bento. 2003)(DoE. 1997)(Hale. 2003)
(instrument, mechanical or
human)
Sensor Decision making process
(logic solver, relay, mechanical device,
human)
(instrument, mechanical, or
human)
Action
Fig. 4. Basic elements of active independent protection layer (CCPS. 2001).
physical or technical are both used to describe the "left side”, only Svenson (1991), and Wahlstrdm and Gunsell (1998) distinguish between these two terms. On the nonphysical side, different terms as soft defence, administrative, organisational, human, operational, and management are used. A barrier may consist of physical as well as non-physical elements.
Several authors distinguish between passive and active barriers (see, e.g., CCPS, 2001; Hale, 2003; Kjellen, 2000). CCPS (2001) distinguishes between passive and active independent protection layers where a passive protection layer is not required to take an action in order for it to achieve its function in reducing risk, while active protection layers are required to move from one state to another in response to a change in a measurable process property (e.g., temperature or pressure), or a signal from another source (such as a push-button or a switch). An active protection layer generally comprises a sensor of some type, a decision-making process, and an action (see Fig. 4). Also Kjellen (2000) differentiates between passive and active safety barriers, and states that passive barriers are embedded in the design of the workplace and are independent of the operational control system. Active barriers are, however, dependant on actions by the operators or on a technical control system to function as intended.
Similarly, Hale et al. (2004) distinguish between four parts of a barrier function that all have to be fulfilled. They claim that this division can form the basis of a matrix for classifying different forms of a barrier for fulfilling a given safety function. The four parts are; definition or specification of the barrier, detection mechanism, activation mechanism, and response mechanism. Barriers are divided into passive, active, or procedural (or human action
barriers) in an ARAMIS-memo (Goossens & Hourtolou, 2003). Hale (2003) presents a somewhat more refined classification of barriers with the categories: (a) passive hardware barriers, (b) active hardware barriers, (c) passive behavioural barriers, (d) active behavioural barriers, and (e) mixed barriers, where both hardware and behaviour are involved.
3.3. Other lines of classification
Hollnagel (2004) has developed a classification of barriers based on their nature, and describes four groups of barriers; material or physical barriers, functional barriers, symbolic barriers, and incorporeal barriers (called immaterial in another memo). Material or physical barriers are barriers that physically prevent an action from being carried out or an event from taking place (e.g., buildings, walls, and railings). Functional barriers work by impeding the action to be carried out, for instance by establishing an interlock, either logical or temporal. Symbolic barriers require an act of interpretation in order to achieve its purpose, hence an "intelligent” agent of some kind that can react or respond to the barrier (e.g., signs and signals). Whereas a functional barrier works by establishing an actual pre-condition that must be met by the system, or the user, before further actions can be carried out, a symbolic barrier indicates a limitation on performance that may be disregarded or neglected. Incorporeal barriers mean that the barrier is not physically present or represented in the situation, but that it depends on the knowledge of the user in order to achieve its purpose (typically rules and guidelines).
In the description of the Safety Modelling Language (SML), Schupp (2004) specifies one dimension of barriers called inherent versus add-on. An inherent barrier is a barrier that is created by changing a parameter of a design, for example, using a thicker vessel wall to withstand internal pressure, using stainless steel or a smaller inventory. Add-on barriers are systems or components that are added just because of safety considerations, e.g., pressure valves, interlocks, and sprinkler devices.
Trost and Nertney (1995) describe the following types of barriers within MORT; equipment design, physical

ARTICLE IN PRESSS. Sklet / Journal of Loss Prevention in the Process Industries I ■■■■ Ill-Ill
barriers, warning devices, procedures/work processes, knowledge and skill, and supervision. Another aspect emphasized in a MORT analysis (Johnson, 1980), is the location of the barriers. The location is divided in four categories; on the energy source, between the energy source and worker, on persons/objects, or separation through time and space. This corresponds to the classification developed by Haddon (1980) of risk reducing measures as strategies related to the energy source, strategies related to barriers or strategies related to the vulnerable target. Further, the MORT-concept differentiates between control and safety barriers (Trost & Nertney, 1995). Control barriers are related to control of wanted energy flows, while safety barriers are related to control of unwanted energy flows. An equivalent differentiation is made by DoE (1997).
A distinction between global and local safety functions is made by The Norwegian Oil Industry Association (OLE, 2001). Global safety functions, i.e., fire and explosion hazard safety functions, are functions that typically provide protection for one or several fire cells. Examples comprise emergency shutdown (EDS), isolation of ignition sources and emergency blowdown. Local safety functions,i.e., process equipment safety functions, are functions confined to protection of a specific process equipment unit. A typical example will be protection against high liquid level in a separator through the process shutdown system (PSD). Further, Bodsberg (1994) distinguishes between process con trol function and con trol of the conditions of the equipment. The purpose of the process control function is to prevent that a stable process deviates into a state of lack of control (i.e., high pressure), while, for instance, condition monitoring will measure directly the condition of the plant equipment and may provide advance warning on possible process equipment failures.
Goossens and Hourtolou (2003) distinguish between permanent and activated barriers, where permanent barriers are functioning permanently independent of the state of the process, while activated barriers need a sequence of detection—diagnosis—action. This classification is similar to the distinction between on-line and off-line functions described by Rausand and Hoyland (2004).
Hollnagel (2004) uses the terms permanent and temporary barriers to explain another aspect of barriers. Permanent barriers are usually part of the design base, although they also may be introduced later, for instance, as a response to an accident. Temporary barriers are restrictions that apply for a limited period of time only, typically referring to a change in external conditions. In the same way, Holand (1997) emphasizes two main types of barriers related to well operations, static barriers and dynamic barriers. A static barrier is a barrier that is available over a "long” period of time, while a dynamic barrier is a barrier that varies over time, and will apply for drilling, workover, and completion operations.
Within the human reliability analysis (HRA) domain, the term recovery of human errors is used. In THERP
8
(Technique for Human Error Rate Prediction; Swain & Guttmann, 1983), a recovery factor is any element of a nuclear power plant system that acts to prevent deviant conditions from producing unwanted effects. Kirwan (1994) describes four types of recovery; interned recovery, external recovery, independent human recovery, and system recovery. Internal recovery means that the operator, having committed an error or failed to carry out an act, realises this immediately, or later, and corrects the situation. External recovery means that the operator, having committed an error or having failed to do something that is required, is prompted by a signal from the environment (e.g., an alarm, an error message, some other non-usual system-event). Independent human recovery means that another operator monitors the first operator, detects the error and either corrects it or brings it to the attention to the first operator, who then corrects it. System recovery means that the system itself recovers from the human error. This implies a degree of error tolerance, or of error detection and automatic recovery.
3.4. Recommendations and comments
A recommended way to classify barrier systems is shown in Fig. 5. However, note that active barrier systems often are based on a combination of technical and human/ operational elements (e.g., see (Corneliussen & Sklet, 2003) for a discussion of human/operational and technical elements in an ESD-system). Even though different words are applied, the classification in the fourth level in Fig. 5 is similar to the classification suggested by Hale (2003), and the classification of active, technical barriers is in accordance with IEC:61511.
As regards the time aspect, some barrier systems are online (continuously functioning), while some are off-line (need to be activated). Further, some barriers are permanent while some are temporary. Permanent barriers are implemented as an integrated part of the whole operational life cycle, while temporary barriers only are used in a specified time period, often during specific activities or conditions.
The physical, passive barriers (e.g., containment, fences, and firewalls) are usually functioning continuously as they do not need to be activated. They may also be temporary, e.g., a temporary obstruction fencing a working area during an activity. The passive, human operational barriers (e.g., safety distances in accordance with Haddon’s principle separation in time and space) may be functioning continuously, or be implemented as part of high-risk activities.
Active, human/operational barriers may be in a continuous mode or activated on demand. Often, these barriers are an integrated part of a work process (e.g., self-control of work and third party control of work) in order to reveal potential failures, e.g. introduced by humans.
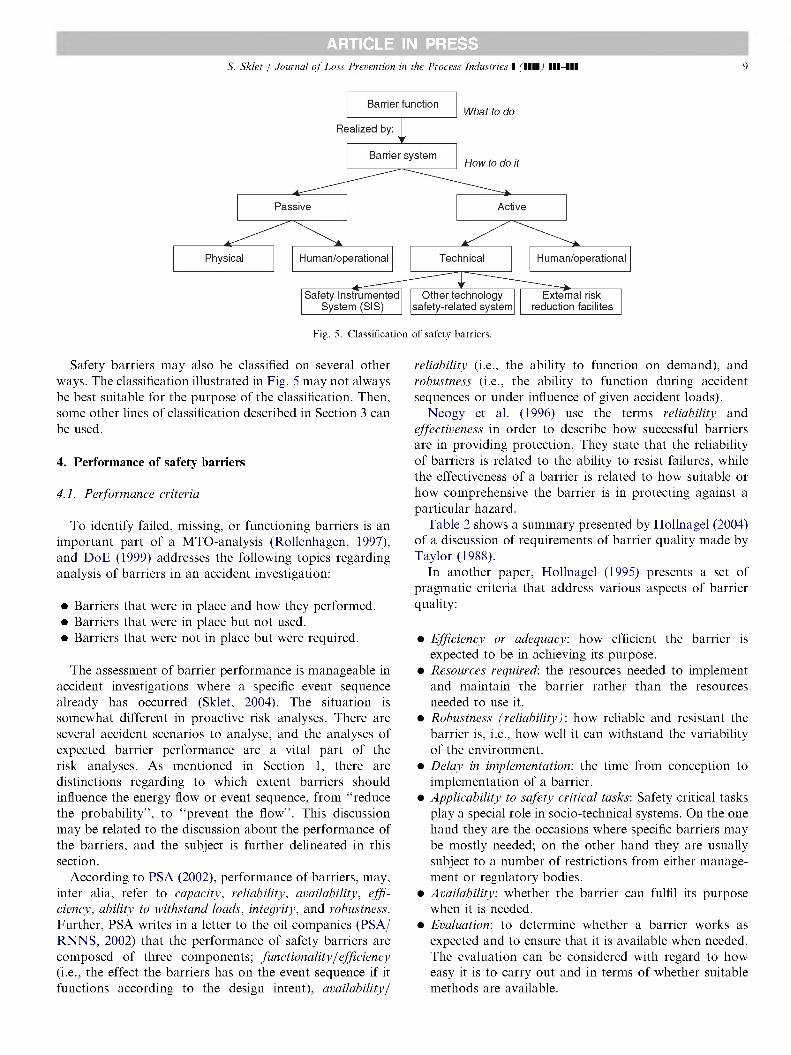
ARTICLE IN PRESSS. Sklet / Journal of Loss Prevention in the Process Industries I ■■■■ Ill-Ill 9
What to do
Realized by:
How to do it
Human/operational Human/operational
Safety Instrumented System (SIS)
External risk reduction facilites
Physical Technical
Other technology safety-related system
Barrier function
Barrier system
ActivePassive
Fig. 5. Classification of safety barriers.
Safety barriers may also be classified on several other ways. The classification illustrated in Fig. 5 may not always be best suitable for the purpose of the classification. Then, some other lines of classification described in Section 3 can be used.
4. Performance of safety barriers
4.1. Performance criteria
To identify failed, missing, or functioning barriers is an important part of a MTO-analysis (Rollenhagen, 1997), and DoE (1999) addresses the following topics regarding analysis of barriers in an accident investigation:
• Barriers that were in place and how they performed.• Barriers that were in place but not used.• Barriers that were not in place but were required.
The assessment of barrier performance is manageable in accident investigations where a specific event sequence already has occurred (Sklet, 2004). The situation is somewhat different in proactive risk analyses. There are several accident scenarios to analyse, and the analyses of expected barrier performance are a vital part of the risk analyses. As mentioned in Section 1, there are distinctions regarding to which extent barriers should influence the energy flow or event sequence, from "reduce the probability”, to "prevent the flow”. This discussion may be related to the discussion about the performance of the barriers, and the subject is further delineated in this section.
According to PSA (2002), performance of barriers, may, inter alia, refer to capacity, reliability, availability, efficiency, ability to withstand loads, integrity, and robustness. Further, PSA writes in a letter to the oil companies (PSA/ RNNS, 2002) that the performance of safety barriers are composed of three components; functionality/efficiency (i.e., the effect the barriers has on the event sequence if it functions according to the design intent), availability/
reliability (i.e., the ability to function on demand), and robustness (i.e., the ability to function during accident sequences or under influence of given accident loads).
Neogy et al. (1996) use the terms reliability and effectiveness in order to describe how successful barriers are in providing protection. They state that the reliability of barriers is related to the ability to resist failures, while the effectiveness of a barrier is related to how suitable or how comprehensive the barrier is in protecting against a particular hazard.
Table 2 shows a summary presented by Hollnagel (2004) of a discussion of requirements of barrier quality made by Taylor (1988).
In another paper, Hollnagel (1995) presents a set of pragmatic criteria that address various aspects of barrier quality:
• Efficiency or adequacy, how efficient the barrier is expected to be in achieving its purpose.
• Resources required: the resources needed to implement and maintain the barrier rather than the resources needed to use it.
• Robustness (reliability): how reliable and resistant the barrier is, i.e., how well it can withstand the variability of the environment.
• Delay in implementation', the time from conception to implementation of a barrier.
• Applicability to safety critical tasks: Safety critical tasks play a special role in socio-technical systems. On the one hand they are the occasions where specific barriers may be mostly needed; on the other hand they are usually subject to a number of restrictions from either management or regulatory bodies.
• Availability: whether the barrier can fulfil its purpose when it is needed.
• Evaluation: to determine whether a barrier works as expected and to ensure that it is available when needed. The evaluation can be considered with regard to how easy it is to carry out and in terms of whether suitable methods are available.
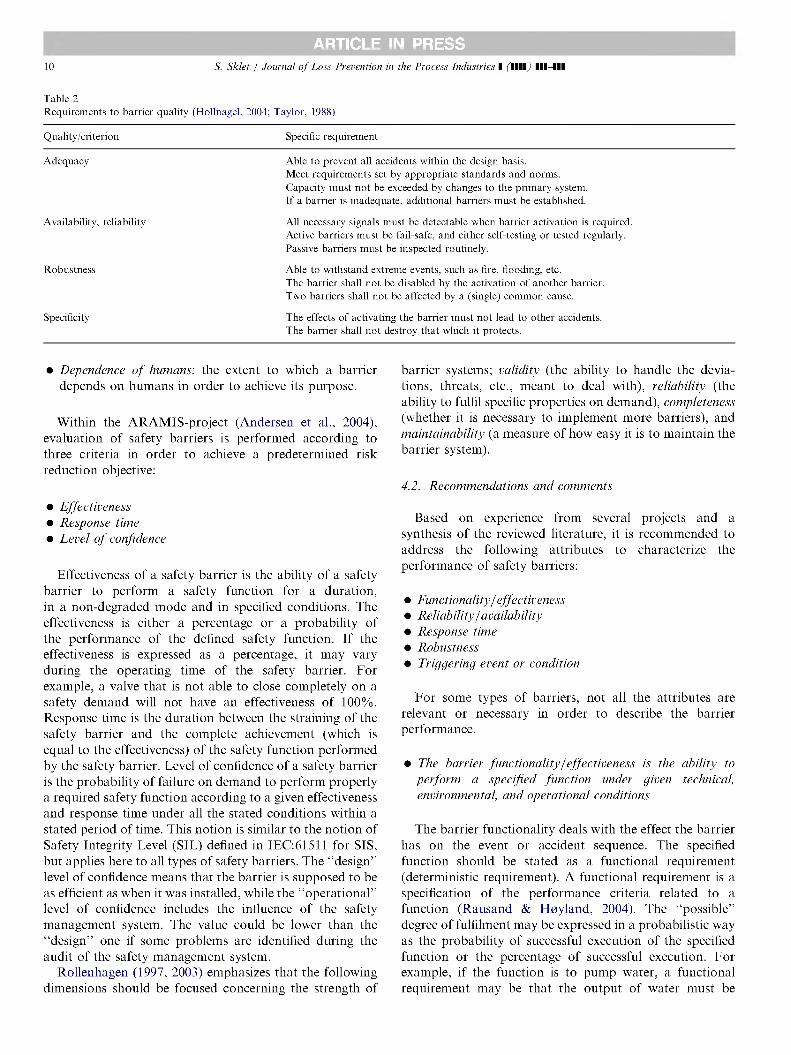
ARTICLE IN PRESS10 S. Sklet / Journal of Loss Prevention in the Process Industries 1 ■■■■ Ill-Ill
Table 2Requirements to barrier quality (Hollnagel. 2004; Taylor. 1988)
Quality/criterion Specific requirement
Adequacy Able to prevent all accidents within the design basis.Meet requirements set by appropriate standards and norms.Capacity must not be exceeded by changes to the primary system.If a barrier is inadequate, additional barriers must be established.
Availability, reliability All necessary signals must be detectable when barrier activation is required.Active barriers must be fail-safe, and either self-testing or tested regularly.Passive barriers must be inspected routinely.
Robustness Able to withstand extreme events, such as fire, flooding, etc.The barrier shall not be disabled by the activation of another barrier.Two barriers shall not be affected by a (single) common cause.
Specificity The effects of activating the barrier must not lead to other accidents.The barrier shall not destroy that which it protects.
• Dependence of humans: the extent to which a barrierdepends on humans in order to achieve its purpose.
Within the ARAMIS-project (Andersen et al., 2004), evaluation of safety barriers is performed according to three criteria in order to achieve a predetermined risk reduction objective:
• Effectiveness• Response time• Level of confidence
Effectiveness of a safety barrier is the ability of a safety barrier to perform a safety function for a duration, in a non-degraded mode and in specified conditions. The effectiveness is either a percentage or a probability of the performance of the defined safety function. If the effectiveness is expressed as a percentage, it may vary during the operating time of the safety barrier. For example, a valve that is not able to close completely on a safety demand will not have an effectiveness of 100%. Response time is the duration between the straining of the safety barrier and the complete achievement (which is equal to the effectiveness) of the safety function performed by the safety barrier. Level of confidence of a safety barrier is the probability of failure on demand to perform properly a required safety function according to a given effectiveness and response time under all the stated conditions within a stated period of time. This notion is similar to the notion of Safety Integrity Level (SIT) defined in IEC:61511 for SIS, but applies here to all types of safety barriers. The "design” level of confidence means that the barrier is supposed to be as efficient as when it was installed, while the "operational” level of confidence includes the influence of the safety management system. The value could be lower than the "design” one if some problems are identified during the audit of the safety management system.
Rollenhagen (1997, 2003) emphasizes that the following dimensions should be focused concerning the strength of
barrier systems; validity (the ability to handle the deviations, threats, etc., meant to deal with), reliability (the ability to fulfil specific properties on demand), completeness (whether it is necessary to implement more barriers), and maintainability (a measure of how easy it is to maintain the barrier system).
4.2. Recommendations and comments
Based on experience from several projects and a synthesis of the reviewed literature, it is recommended to address the following attributes to characterize the performance of safety barriers:
• Functionality / effectiveness• Reliability / availability• Response time• Robustness• Triggering event or condition
For some types of barriers, not all the attributes are relevant or necessary in order to describe the barrier performance.
• The barrier functionality/effectiveness is the ability to perform a specified function under given technical, environmental, and operational conditions
The barrier functionality deals with the effect the barrier has on the event or accident sequence. The specified function should be stated as a functional requirement (deterministic requirement). A functional requirement is a specification of the performance criteria related to a function (Rausand & Hoyland, 2004). The "possible” degree of fulfilment may be expressed in a probabilistic way as the probability of successful execution of the specified function or the percentage of successful execution. For example, if the function is to pump water, a functional requirement may be that the output of water must be
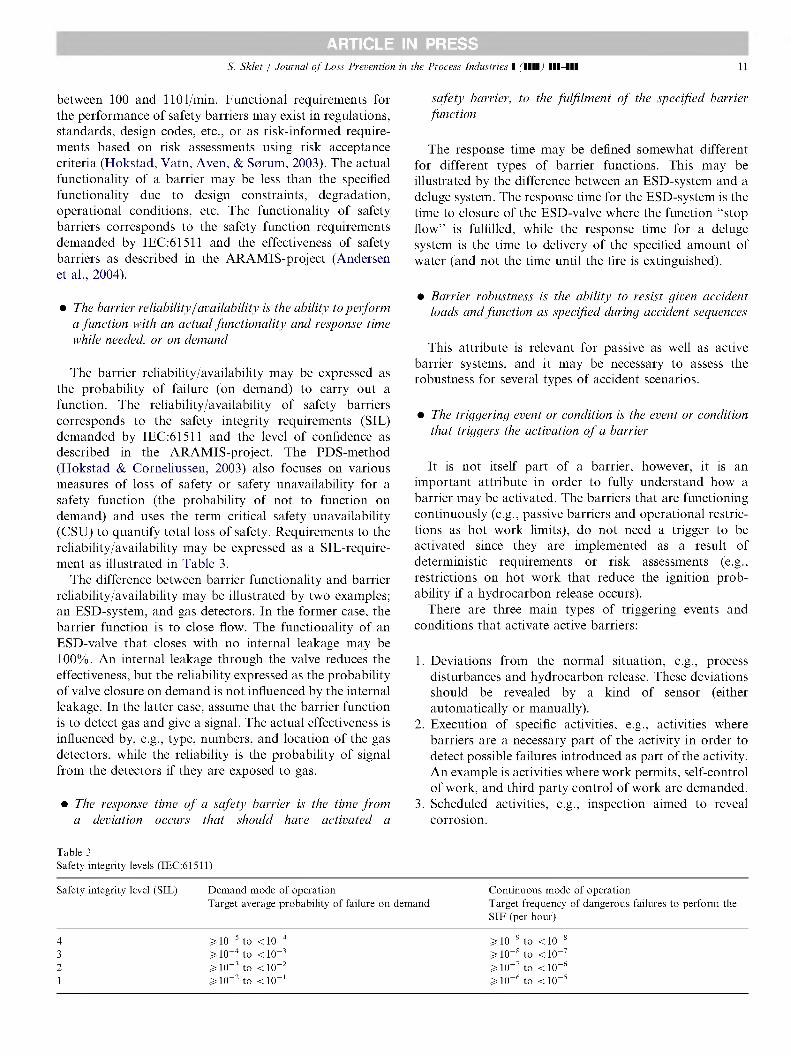
ARTICLE IN PRESSS. Sklet / Journal of Loss Prevention in the Process Industries I ■■■■ Ill-Ill
between 100 and 1101/min. Functional requirements for the performance of safety barriers may exist in regulations, standards, design codes, etc., or as risk-informed requirements based on risk assessments using risk acceptance criteria (Hokstad, Vatn, Aven, & Sorum, 2003). The actual functionality of a barrier may be less than the specified functionality due to design constraints, degradation, operational conditions, etc. The functionality of safety barriers corresponds to the safety function requirements demanded by IEC:61511 and the effectiveness of safety barriers as described in the ARAMIS-project (Andersen et ah, 2004).
• The barrier reliability/availability is the ability to perform a function with an actual functionality and response time while needed, or on demand
The barrier reliability/availability may be expressed as the probability of failure (on demand) to carry out a function. The reliability/availability of safety barriers corresponds to the safety integrity requirements (SIL) demanded by IEC:61511 and the level of confidence as described in the ARAMIS-project. The PDS-method (Hokstad & Corneliussen, 2003) also focuses on various measures of loss of safety or safety unavailability for a safety function (the probability of not to function on demand) and uses the term critical safety unavailability (CSU) to quantify total loss of safety. Requirements to the reliability/availability may be expressed as a SIL-require- ment as illustrated in Table 3.
The difference between barrier functionality and barrier reliability/availability may be illustrated by two examples; an ESD-system, and gas detectors. In the former case, the barrier function is to close flow. The functionality of an ESD-valve that closes with no internal leakage may be 100%. An internal leakage through the valve reduces the effectiveness, but the reliability expressed as the probability of valve closure on demand is not influenced by the internal leakage. In the latter case, assume that the barrier function is to detect gas and give a signal. The actual effectiveness is influenced by, e.g., type, numbers, and location of the gas detectors, while the reliability is the probability of signal from the detectors if they are exposed to gas.
• The response time of a safety barrier is the time from a deviation occurs that should have activated a
safety barrier, to the fulfilment of the specified barrier function
The response time may be defined somewhat different for different types of barrier functions. This may be illustrated by the difference between an ESD-system and a deluge system. The response time for the ESD-system is the time to closure of the ESD-valve where the function "stop flow” is fulfilled, while the response time for a deluge system is the time to delivery of the specified amount of water (and not the time until the fire is extinguished).
• Barrier robustness is the ability to resist given accident loads and function as specified during acciden t sequences
This attribute is relevant for passive as well as active barrier systems, and it may be necessary to assess the robustness for several types of accident scenarios.
• The triggering event or condition is the event or condition that triggers the activation of a barrier
It is not itself part of a barrier, however, it is an important attribute in order to fully understand how a barrier may be activated. The barriers that are functioning continuously (e.g., passive barriers and operational restrictions as hot work limits), do not need a trigger to be activated since they are implemented as a result of deterministic requirements or risk assessments (e.g., restrictions on hot work that reduce the ignition probability if a hydrocarbon release occurs).
There are three main types of triggering events and conditions that activate active barriers:
1. Deviations from the normal situation, e.g., process disturbances and hydrocarbon release. These deviations should be revealed by a kind of sensor (either automatically or manually).
2. Execution of specific activities, e.g., activities where barriers are a necessary part of the activity in order to detect possible failures introduced as part of the activity. An example is activities where work permits, self-control of work, and third party control of work are demanded.
3. Scheduled activities, e.g., inspection aimed to reveal corrosion.
11
Table 3Safety integrity levels (IEC:61511)
Safety integrity level (SIL) Demand mode of operationTarget average probability of failure on demand
Continuous mode of operationTarget frequency of dangerous failures to perform the SIF (per hour)
4 S=1(T5 to <1(T4 > KT* ^ < 1Q-S
3 s=i(r4 to <nr3 5= IQ-8 to <KT72 5= kt3 to <nr2 5= IQ-7 to <10-*1 S=1(T2 to cKT1 >10"* to <1Q-3
ARTICLE IN PRESSS. Sklet / Journal of Loss Prevention in the Process Industries I ■■■■ Ill-Ill
Implementation of safety barriers may have adverse effects like increased costs, need for maintenance, and introduction of new hazards. These adverse effects should be addressed as part of a total analysis of safety barriers, but they are not further discussed in this paper. Some of these aspects, as loss of production regularity and maintenance, are focused in the PDS-method (Hokstad & Corneliussen, 2003) where a measure for quantifying loss of production regularity is the spurious trip rate.
5. Conclusions
The concept of safety barriers is presented and discussed in the paper. The results are based on experience from several research projects focusing on safety barriers and a review of relevant literature. No common terminology applicable crosswise between sectors and application areas has been found, and a set of definitions is therefore proposed in the paper.
Safety barriers are defined as physical and/or nonphysical means planned to prevent, control, or mitigate undesired events or accidents. It is practical to distinguish between the barrier functions and the barrier systems that realize these functions.
Several ways for classification of safety barriers exist. Barrier functions may be classified as preventive, controlling, or mitigating. Barrier systems may be classified in several dimensions, and some main dimensions are; active versus passive, physical/technical versus human/operational, continuously functioning/on-line versus activated/ off-line, and permanent versus temporary.
It is recommended to address the following attributes to characterize the performance of safety barriers: (a) functionality/effectiveness, (b) reliability/availability, (c) response time, (d) robustness, and (e) triggering event or condition. For some types of barriers, not all the attributes are relevant or necessary in order to describe the barrier performance.
The paper improves the understanding of the concept of safety barriers. The results are valuable as a basis for identification, description, development of requirements to, and understanding of the effect of the safety barriers within the field of industrial safety. The results with respect to safety barriers in the paper will primarily be useful for the Norwegian oil industry in their effort to fulfil the requirements from PSA. However, the results may also be applied in other industries (e.g., the process industry) and application areas (e.g., the transport sector) in their effort to reduce the risk.
References
Andersen. H.. Casal. J.. Dandrieux. A.. Debray. B.. De Dianous. V..Duijm, N. J.. et al. (2004). ARAMIS—user guide. EC Contract numberEVG1-CT-2001-00036.
Aven. T.. Sklet. S.. & Vinnem. J. E. (2005). Barrier and operational riskanalysis of hydrocarbon releases (BORA-Release); Part I. Method
12
description. Journal of Hazardous Materials, submitted for publication.
Bento. J.-P. (2003). Review from an MTO-perspective of five investigation reports from BP (Draft). Norway: Stavanger.
Bodsberg. L. (1994). Reliability quantification of control and safety systems: the PDS-II method. Trondheim: SINTEF Safety and Reliability.
CCPS. (1993). Guidelines for safe automation of chemical processes. New York: Center for Chemical Process Safety of the American Institute of Chemical Engineers.
CCPS. (2001). Layer of protection analysis simplified process risk assessment. New York: Center for Chemical Process Safety of the American Institute of Chemical Engineers.
Corneliussen. K.. & Sklet. S. (2003). Challenges related to surveillance of safety functions. In ESREL 2003. Maastricht. The Netherlands: Balkema.
DoE. (1997). Implementation guide for use with DOE Order 225.1A, accident Investigation, DOE G225.IA-I, Rev. 1. Washington. DC: US Department of Energy (DOE).
DoE. (1999). Conducting accident investigations DOE workbook, revision 2. Washington. DC: US Department of Energy.
Duijm. N. J.. Andersen. H. B.. Hale. A.. Goossens. L.. & Hourtolou. D. (2004). Evaluating and managing safety barriers in major hazard plants. In PSAM 7—ESREL ’04, Berlin. Germany.
Duijm. N. J.. Madsen. M. D.. Andersen. H. B.. Hale. A.. Goossens. L.. Londiche. H.. et al. (2003). Assessing the effect of safety management efficiency on industrial risk. In ESREL 2003. Maastricht: Balkema.
EC (1996). Council Directive 96/82/EC of 9 December 1996 on the control of major-accident hazards involving dangerous substances (Seveso Il-directive).
EC (1998). Directive 98/37/EC of the European Parliament and of the Council of 22 June 1998 on the approximation of the laws of the Member States relating to machinery as amended by Directive 98/79/ EC (The Machinery Directive).
Fleming. K. N.. & Silady. F. A. (2002). A risk informed defense-in-depth framework for existing and advanced reactors. Reliability Engineering & System Safety, 75(3). 205-225.
Gibson. J. (1961). The contribution of experimental psychology to the formulation of the problem of safety. In Behavioural Approaches to Accident Research. New York: Association for the Aid of Crippled Children.
Goossens. L.. & Hourtolou. D. (2003). What is a barrier! ARAMIS- working document.
Haddon. W. J. (1980). The basic strategies for reducing damage from hazards of all kinds. Hazard Prevention, September-October(pp. 8—12).
Hale. A. (2003). Note on barriers and delivery systems. In PRISM conference, Athens.
Hale. A.. Goossens. L.. Ale. B.. Bellamy. L.. Post. J.. Oh. J.. et al. (2004). Managing safety barriers and controls at the workplace. In PSAM 7-ESREL '04, Berlin.
Harms-Ringdahi. L. (2000). Assessment of safety function at an industrial workplace—A case study. In ESREL 2000. Edinburgh: Balkema.
Harms-Ringda hi. L. (2003). Assessing safety functions—Results from a case study at an industrial workplace. Safely Science, 47(8). 701-720.
Hokstad. P.. & Corneliussen. K. (2003). Reliability prediction method for safety instrumented systems: PDS method handbook. Trondheim: SINTEF Industrial Management Safety and Reliability.
Hokstad. P.. Vatn. J.. Aven. T.. & Serum. M. (2003). Use of risk acceptance criteria in Norwegian offshore industry: dilemmas and challenges. In ESREL 2003. Maastricht: Balkema Publishers.
Holand. P. (1997). Offshore blowouts: Causes and control. Houston. Tex: Gulf Publ. Co.
Hollnagel. E. (1995). The art of efficient man-machine interaction: Improving the coupling between man and machine. In J.-M. Hoc, P. C. Cacciabue. & E. Hollnagel (Eds.). Cognition & Human-Computer Cooperation. Hillsdale. NJ: Lawrence Erlbaum Associates Inc,
ARTICLE IN PRESSS. Sklet / Journal of Loss Prevention in the Process Industries I ■■■■ Ill-Ill 13
Hollnagel, E. (1999). Memo—Accident analysis and harrier functions. Halden: IFE.
Hollnagel. E. (2004). Barrier and accident prevention. Hampshire. UK: Ashgate.
Hopwood. A. G. (1974). Accounting and human behaviour. London: Haymarket Publishing.
IAEA. (1999). Basic safely principles for nuclear power plants: 75-INSAG- 3, rev.l. Vienna: The International Atomic Energy Agency.
IEC:61508. (1998). Part 1-7 Functional safety of electrical/electronic/ programmable electronic safety-related systems. Geneva: International Electrotechnical Commission.
IEC:61511. (2002). Functioned safely—Safely instrumented systems for the process industry sector. Geneva: International Electrotechnical Commission.
180:13702. (1999). Petroleum and natural gas industries—Control and mitigation of fires and explosions on offshore production installations— Requirements and guidelines. Geneva: International Organization for Standardization.
ISO: 17776. (2000). Petroleum and natural gas industries—Offshore production installations—Guidelines on tools and techniques for hazard identification and risk assessment. Geneva: International Organization for Standardization.
Johnson. P.. & Gill. J. (1993). Management and organizational behaviour. London: Paul Chapman Publishing Ltd.
Johnson. W. G. (1980). MORT safety assurance systems. New York: Marcel Dekker.
Kaplan. S. (1990). Bayes is for eagles. IEEE Transactions on Reliability, 53. 457-481.
Kecklund. L. J.. Edland. A.. Wedin. P.. & Svenson. O. (1996). Safety barrier function analysis in a process industry: A nuclear power application. International Journal of Industrial Ergonomics. 77(3). 275-284.
Kirwan. B. (1994). A guide to practiced human reliability assessment. London: Taylor & Francis.
Kjellen. U. (2000). Prevention of accidents through experience feedback. London: Taylor & Francis.
Kjellen. U.. & larsson. T. (1981). Investigating accidents and reducing risks—A dynamic approach. Journal of occupational accidents. 3. 129-140.
Leveson. N. (1995). SafeWare: System safety and computers. Reading. MA: Addison-Wesley.
Neogy. P.. Hanson. A. L.. Davis. P. R.. & Fenstermacher. T. E. (1996). Hazard and Barrier analysis guidance document, Rev. 0. US Department of Energy (DoF). EH-3 3 Office of Operating Experience Analysis and Feedback.
OED. (2005). Oxford English dictionary online. Oxford: Oxford University Press.
OLE. (2001). Recommended guidelines for the application oflEC 61508 and IEC 61511 in the petroleum activities on the Norwegian Continental Shelf. Stavanger. Norway: The Norwegian Oil Industry Association.
PSA. (2001). Regulations relating to management in the petroleum activities (The Management Regulations). 3 September 2001. Norway. Stavanger: Petroleum Safety Authority.
PSA. (2002). Guidelines to regulations relating to management in the petroleum activities (The management regulations). Norway. Stavanger: Petroleum Safety Authority.
PSA/RNNS. (2002). The development in the risk level on the Norwegian Continental Shelf—Requirements for registration of the performance of safety barriers. Letter to the oil companies (in Norwegian). Rev 9. 17.06.2002. Norway. Stavanger: Petroleum Safety Authority.
Rausand. M.. & Hoyland. A. (2004). System reliability theory: Models, statistical methods, and applications. Hoboken. NJ: Wiley- Interscience.
Reason. J. (1997). Managing the risks of organizational accidents. Aldershot: Ashgate.
Reason. J.. Parker. D.. & Lawton. R. (1998). Organizational controls and safety: The varieties of rule-related behaviour. Journal of Occupational and Organizational Psychology, 71, 289-304.
Rollenhagen, C. (1997). MTO—An introduction; The relationship between humans, technology, and organisation (In Swedish; MTO—en introduk- tion; Sambanden mdnniska, teknik och organisation). Lund: Utbild- ningshuset.
Rollenhagen. C. (2003). To investigate accidents, theory and practice (In Swedish; Alt utreda olycksfall, Teori och praktik). Lund: Studentlitteratur.
Rosness. R. (2005). Ten thumbs and zero accidents? About fault tolerance and accidents. Kjeller: Institute for Energy Technology (in Norwegian).
Schupp. B. (2004). The safety modeling language. ADVISES tutorial in human error analysis, barriers and the safety modelling language. Germany: Paderborn.
SfiS. (2004). Barriers—Out of the fog, towards increased safety (in Norwegian—Barrierer—ut av tdkehavet, mot bedre sikkerhet). Stavanger. Norway: Together for Safety. OLE.
Sklet. S. (2004). Comparison of some selected methods for accident investigation. Journal of Hazardous Materials, 77(1-3). 29-37.
Sklet. S.. Aven. T.. Hauge. S.. & Vinnem. J. E. (2005). Incorporating human and organizational factors in risk analysis for offshore installations. In ESREL 2005, Gdynia.
Sklet. S.. & Hauge. S. (2003). SINTEF-Memo discussion of the term safety barrier. Trondheim: SINTEF (in Norwegian).
Sklet. S.. & Hauge. S. (2004). Reflections on the concept of safety barriers. In PSAM7—ESREL 2004, Berlin.
Sklet. S.. Steiro. T.. & Tjelta. O. (2005). Qualitative analysis of human. Technical and operational barrier elements during well interventions. In ESREL 2005, Tri City. Poland.
Sklet. S.. Vinnem. J. E.. & Aven. T. (2005). Barrier and operational risk analysis of hydrocarbon releases (BORA-Release); Part II. Results from a case study. Journal of Hazardous Materials, submitted for publication.
Svenson. O. (1991). The accident evolution and barrier function (AEB) model applied to incident analysis in the processing industries. Risk Analysis, 77(3). 499-507.
Swain. A. D.. & Guttmann. H. E. (1983). Handbook of human reliability analysis with emphasis on nuclear power plant applications: Final report NUREG CR-1278, SAND80-200. Sandia National Laboratories Statistics Computing and Human Factors Division. Albuquerque.
Taylor. R. J. (1988). Methods for assessment of weapon safety (In Danish; Analysemetoder til vurdering af vdbensikkerhed). Glumso. DK: Institute for Technical Systems Analysis.
Trost. W. A.. & Nertney. R. J. (1995). Barrier analysis. Idaho Falls. US: SCIENTECH Inc.. SCIE-DOE-01 -TRAC-29-95.
Vatn. J. (2001). SINTEF interned memo regarding safety critical functions in the railway system in Norway. Rev. 3. Trondheim: SINTEF.
Vinnem. J. E.. Aven. T.. Hauge. S.. Seljelid. J.. & Veire. G. (2004). Integrated barrier analysis in operational risk assessment in offshore petroleum operations. In PSAM7—ESREL '04. Berlin: Springer.
Wahlstrom. B.. & Gunsell. L. (1998). Reactor safety; a description and assessment of the Nordic safety work (In Swedish; Reaktorsdkerhet; En beskrivning och en vardering av sdkerhetsarbetet i Norden). Riso forskningseenter: NKS-sekretariatet.

Thesis - Part II Papers
Paper 2
Hydrocarbon releases on oil and gas production platforms: Release scenarios and safety barriers
Snorre SkletJournal of Loss Prevention in the Process Industries Article in press, available online 18 January 2006

ARTICLE IN PRESS
ELSEVIER
Available online at www.sciencedirect.com
SCIENCE DIRECT®
Journal of Loss Prevention in the Process Industries I (HID
Journal ofLossPreventionin the process industries
www.elsevier.com/locate/jlp
Hydrocarbon releases on oil and gas production platforms: Release scenarios and safety barriers
Snorre Sklet* 1 *Department of Production and Quality Engineering, The Norwegian University of Science and Technology (NTNU), NO-7491 Trondheim, Norway
Received 27 September 2005; received in revised form 2 December 2005; accepted 4 December 2005
Abstract
The main objective of this paper is to present and discuss a set of scenarios that may lead to hydrocarbon releases on offshore oil and gas production platforms. Each release scenario is described by an initiating event (i.e., a deviation), the barrier functions introduced to prevent the initiating event from developing into a release, and how the barrier functions are implemented in terms of barrier systems. Both technical and human/operational safety barriers are considered. The initiating events are divided into five main categories:(1) human and operational errors, (2) technical failures, (3) process upsets, (4) external events or loads, and (5) latent failures from design. The release scenarios may be used as basis for analyses of: (a) the performance of safety barriers introduced to prevent hydrocarbon releases on specific platforms, (b) the platform specific hydrocarbon release frequencies in future quantitative risk analyses, (c) the effect on the total hydrocarbon release frequency of the safety barriers and risk reducing measures (or risk increasing changes).© 2005 Elsevier Ltd. All rights reserved.
Keywords: Hydrocarbon release; Loss of containment; Safety barrier; Risk analysis; Major accident
1. Introduction
Hydrocarbon releases are a main contributor to the major accident risk on oil and gas production platforms (e.g., see 0ien, 2001). Fig. 1 shows the total number of hydrocarbon releases with a release rate higher than 0.1 kg/s in the process area on platforms on the Norwegian Continental Shelf in the period 1996-2004 (PSA, 2005). Until 1999, there was a declining trend, followed by some years with fluctuations. The total number of hydrocarbon releases has been reduced both in 2003 and 2004. The number of hydrocarbon releases with rate higher than 1 kg/s has not decreased to the same degree (PSA, 2005). The reduction from 2003 to 2004 has mainly taken place in the lowest release rate group (0.1-1 kg/s). The data shows large variations in the frequency of hydrocarbon releases on the various platforms, which indicates a potential for reducing the total release frequency. Data from 2001 to 2004 shows
*Tel.: +47 73 592902; fax: +47 73 5928 96.E-mail address: snorre. sklet@ sintef.no.
0950-4230/$ - see front matter © 2005 Elsevier Ltd. All rights reserved, doi: 10.1016/j.jlp.2005.12.003
that about 40% of the hydrocarbon releases occur due to errors during manual work. About 32% occur during normal production, while the rest (27%) take place in connection with spurious trips and start-up and shutdown of the process.
In 2003, the operators on the Norwegian Continental Shelf were challenged by the Petroleum Safety Authority Norway (PSA) to set a target for reducing the frequency of hydrocarbon releases and to identify improvement measures through a joint industry project. As a follow-up of this initiative, the Norwegian Oil Industry Association (OLE) initiated a project with the objective to reduce by 50% the number of hydrocarbon releases with rate higher than 0.1 kg/s by the end of 2005 (measured against the average in the period 2000-2002). All companies have further established a vision of no gas releases (OLE, 2004).
The frequency of hydrocarbon releases in offshore quantitative risk analyses (QRA) has traditionally been determined by the use of generic frequencies of small, medium, and large hydrocarbon releases from equipment, systems, and areas. In some cases, platform specific release
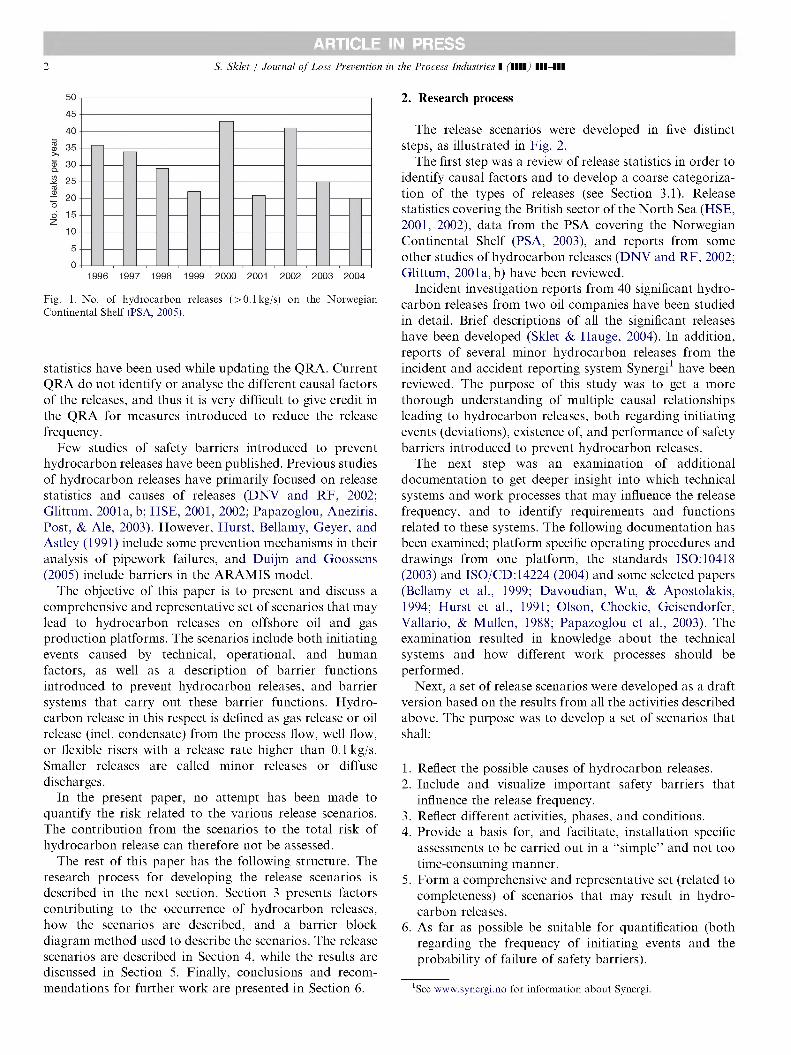
ARTICLE IN PRESSS. Sklet / Journal of Loss Prevention in the Process Industries I ■■■■ Ill-Ill2
S 35 — [
<5 30 —
- 20 —
10 —
1996 1997 1998 1999 2000 2001 2002 2003 2004
Fig. 1. No. of hydrocarbon releases (>0.1 kg/s) on the Norwegian Continental Shelf (PSA. 2005).
statistics have been used while updating the QRA. Current QRA do not identify or analyse the different causal factors of the releases, and thus it is very difficult to give credit in the QRA for measures introduced to reduce the release frequency.
Few studies of safety barriers introduced to prevent hydrocarbon releases have been published. Previous studies of hydrocarbon releases have primarily focused on release statistics and causes of releases (DNV and RF, 2002; Glittum, 2001a, b; HSE, 2001, 2002; Papazoglou, Aneziris, Post, & Ale, 2003). However, Hurst, Bellamy, Geyer, and Astley (1991) include some prevention mechanisms in their analysis of pipework failures, and Duijm and Goossens (2005) include barriers in the ARAMIS model.
The objective of this paper is to present and discuss a comprehensive and representative set of scenarios that may lead to hydrocarbon releases on offshore oil and gas production platforms. The scenarios include both initiating events caused by technical, operational, and human factors, as well as a description of barrier functions introduced to prevent hydrocarbon releases, and barrier systems that carry out these barrier functions. Hydrocarbon release in this respect is defined as gas release or oil release (inch condensate) from the process flow, well flow, or flexible risers with a release rate higher than 0.1 kg/s. Smaller releases are called minor releases or diffuse discharges.
In the present paper, no attempt has been made to quantify the risk related to the various release scenarios. The contribution from the scenarios to the total risk of hydrocarbon release can therefore not be assessed.
The rest of this paper has the following structure. The research process for developing the release scenarios is described in the next section. Section 3 presents factors contributing to the occurrence of hydrocarbon releases, how the scenarios are described, and a barrier block diagram method used to describe the scenarios. The release scenarios are described in Section 4, while the results are discussed in Section 5. Finally, conclusions and recommendations for further work are presented in Section 6.
2. Research process
The release scenarios were developed in five distinct steps, as illustrated in Fig. 2.
The first step was a review of release statistics in order to identify causal factors and to develop a coarse categorization of the types of releases (see Section 3.1). Release statistics covering the British sector of the North Sea (HSE, 2001, 2002), data from the PSA covering the Norwegian Continental Shelf (PSA, 2003), and reports from some other studies of hydrocarbon releases (DNV and RF, 2002; Glittum, 2001a, b) have been reviewed.
Incident investigation reports from 40 significant hydrocarbon releases from two oil companies have been studied in detail. Brief descriptions of all the significant releases have been developed (Sklet & Hauge, 2004). In addition, reports of several minor hydrocarbon releases from the incident and accident reporting system Synergi1 have been reviewed. The purpose of this study was to get a more thorough understanding of multiple causal relationships leading to hydrocarbon releases, both regarding initiating events (deviations), existence of, and performance of safety barriers introduced to prevent hydrocarbon releases.
The next step was an examination of additional documentation to get deeper insight into which technical systems and work processes that may influence the release frequency, and to identify requirements and functions related to these systems. The following documentation has been examined; platform specific operating procedures and drawings from one platform, the standards 180:10418 (2003) and ISO/CD: 14224 (2004) and some selected papers (Bellamy et ah, 1999; Davoudian, Wu, & Apostolakis, 1994; Hurst et ah, 1991; Olson, Chockie, Geisendorfer, Vallario, & Mullen, 1988; Papazoglou et ah, 2003). The examination resulted in knowledge about the technical systems and how different work processes should be performed.
Next, a set of release scenarios were developed as a draft version based on the results from all the activities described above. The purpose was to develop a set of scenarios that shall:
1. Reflect the possible causes of hydrocarbon releases.2. Include and visualize important safety barriers that
influence the release frequency.3. Reflect different activities, phases, and conditions.4. Provide a basis for, and facilitate, installation specific
assessments to be carried out in a "simple” and not too time-consuming manner.
5. Form a comprehensive and representative set (related to completeness) of scenarios that may result in hydrocarbon releases.
6. As far as possible be suitable for quantification (both regarding the frequency of initiating events and the probability of failure of safety barriers). *
'See www.synergi.no for information about Synergi.

ARTICLE IN PRESSS. Sklet j Journal of Loss Prevention in the Process Industries I (Mi) Ill-Ill 3
Cafegodzaf/on of causesRelease
statistics
Description of a set of accidents
Accident reports Criteria for development of scenarios - Initiating events
Procedures Drawings Research papers Standards
^processes
Platformdfaw/ngs
Accident reportsOperationalpersonnel
Verification of scenarios
Examination of documentation
Study of accident reports
Development of draft scenarios
Barrier Block _ Diagrams (Draft)
Review of release statistics
Scenarios Barrier Block Diagrams
Fig. 2. Development of hydrocarbon release scenarios.
A thorough process related to assessment of the draft scenarios was performed. The main steps of this validation/ verification process were:
1. Comparison with the master logic diagram for "loss of containment” in chemical plants developed in the I-RISK project (Bellamy et al., 1999).
2. Comparison with the description of 40 significant hydrocarbon releases developed by Sklet and Hauge (2004).
3. Review by personnel from an oil company and the BORA project2 group resulting in a discussion in a meeting where personnel from the oil company and the BORA project group attended.
Detailed descriptions of the final hydrocarbon release scenarios are given in Section 4.
3. Modelling of barriers introduced to prevent hydrocarbon releases
3.1. Factors contributing to the occurrence of hydrocarbon releases
A classification of factors contributing to hydrocarbon releases is developed based on review of release statistics. The release causes have been divided into five main categories:
1. Human and operational errors2. Technical failures3. Process upsets (process parameters out of range)
'The BORA project (Barrier and Operational Risk Analysis) is a Norwegian research project where the aim is to perform a detailed and quantitative modelling of barrier performance, including barriers to prevent the occurrence of initiating events as well as barriers to reduce the consequences (Vinnem. Aven. Hauge. Seljelid. & Veire. 2004).
4. External events or loads5. Design failures (latent failures).
Hydrocarbon releases due to human and operational errors may occur during normal production (e.g., valves left in open position after taking samples and open valves to the drain-system), be introduced during maintenance as latent failures (e.g., inadequate assembling and installation of equipment ), or occur during maintenance (e.g., failure of isolation, depressurization, draining, blinding, and purging prior to maintenance activities). Technical or physical failures include releases due to mechanical and material degradation of equipment caused by ageing, wear-out, corrosion, erosion, and fatigue. Process upsets include releases due to overpressure, underpressure, overflow, and so forth. External events/loads include releases due to falling objects, collisions, bumping, etc., while design related failures are latent failures introduced during design that cause release during production.
3.2. Description of scenarios
The brief scenario descriptions contain the following information; the name of the scenario, a general description, a definition of the initiating event, information about the operational mode when the error or failure is introduced and when the release occurs, descriptions of barrier functions introduced to prevent hydrocarbon releases, and how these functions are implemented by barrier systems.
The event sequence is illustrated in a barrier block diagram as shown in Fig. 3. A barrier block diagram consists of an initiating event, arrows that show the event sequence, barrier functions realized by barrier systems, and possible outcomes. A horizontal arrow indicates that a barrier system fulfils its function, whereas an arrow downwards indicates failure to fulfil the function. In our
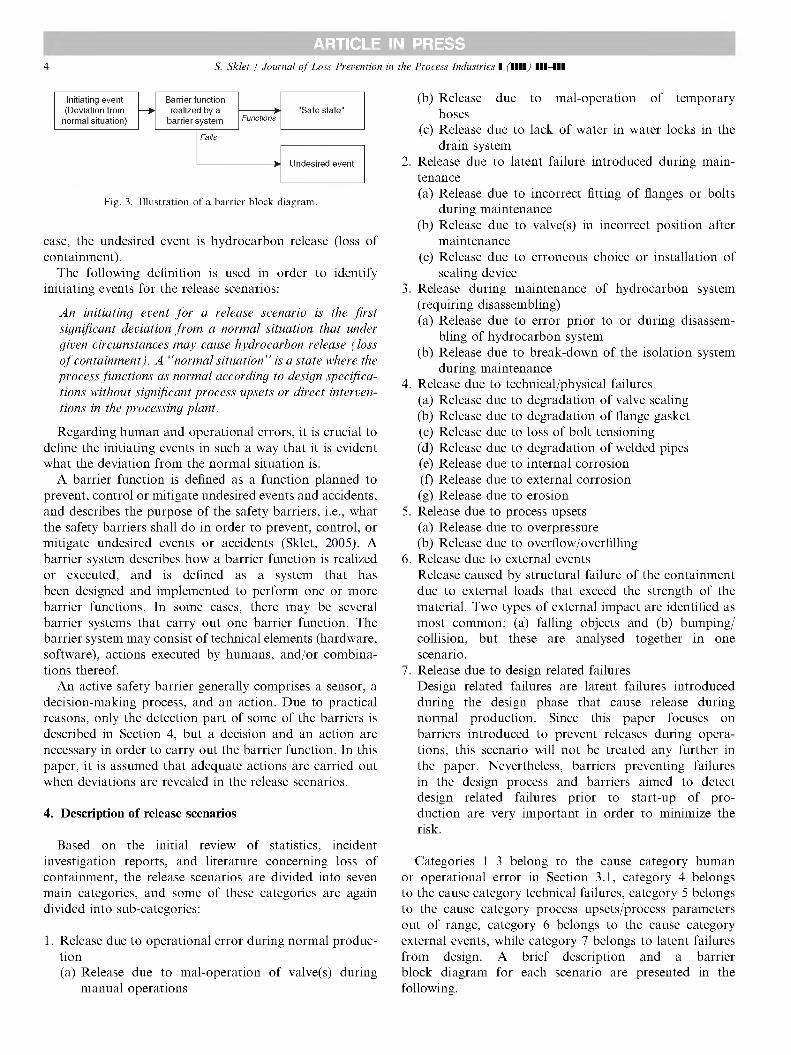
ARTICLE IN PRESS4 S. Sklet / Journal of Loss Prevention in the Process Industries I ■■■■ Ill-Ill
Functions
Barrier function realized by a
barrier system"Safe state"
Initiating event (Deviation from
normal situation)
Undesired event
Fig. 3. Illustration of a barrier block diagram.
case, the undesired event is hydrocarbon release (loss of containment).
The following definition is used in order to identify initiating events for the release scenarios:
An initiating event for a release scenario is the first significant deviation from a normal situation that under given circumstances may came hydrocarbon release (loss of containment). A “normal situation" is a state where the process functions as normal according to design specifications without significant process upsets or direct interventions in the processing plant.
Regarding human and operational errors, it is crucial to define the initiating events in such a way that it is evident what the deviation from the normal situation is.
A barrier function is defined as a function planned to prevent, control or mitigate undesired events and accidents, and describes the purpose of the safety barriers, i.e., what the safety barriers shall do in order to prevent, control, or mitigate undesired events or accidents (Sklet, 2005). A barrier system describes how a barrier function is realized or executed, and is defined as a system that has been designed and implemented to perform one or more barrier functions. In some cases, there may be several barrier systems that carry out one barrier function. The barrier system may consist of technical elements (hardware, software), actions executed by humans, and/or combinations thereof.
An active safety barrier generally comprises a sensor, a decision-making process, and an action. Due to practical reasons, only the detection part of some of the barriers is described in Section 4, but a decision and an action are necessary in order to carry out the barrier function. In this paper, it is assumed that adequate actions are carried out when deviations are revealed in the release scenarios.
4. Description of release scenarios
Based on the initial review of statistics, incident investigation reports, and literature concerning loss of containment, the release scenarios are divided into seven main categories, and some of these categories are again divided into sub-categories: 1
1. Release due to operational error during normal production(a) Release due to mal-operation of valve(s) during
manual operations
(b) Release due to mal-operation of temporary hoses
(c) Release due to lack of water in water locks in the drain system
2. Release due to latent failure introduced during maintenance(a) Release due to incorrect fitting of flanges or bolts
during maintenance(b) Release due to valve(s) in incorrect position after
maintenance(c) Release due to erroneous choice or installation of
sealing device3. Release during maintenance of hydrocarbon system
(requiring disassembling)(a) Release due to error prior to or during disassem
bling of hydrocarbon system(b) Release due to break-down of the isolation system
during maintenance4. Release due to technical/physical failures
(a) Release due to degradation of valve sealing(b) Release due to degradation of flange gasket(c) Release due to loss of bolt tensioning(d) Release due to degradation of welded pipes(e) Release due to internal corrosion(f) Release due to external corrosion(g) Release due to erosion
5. Release due to process upsets(a) Release due to overpressure(b) Release due to overflow/overfilling
6. Release due to external eventsRelease caused by structural failure of the containment due to external loads that exceed the strength of the material. Two types of external impact are identified as most common: (a) falling objects and (b) bumping/ collision, but these are analysed together in one scenario.
7. Release due to design related failuresDesign related failures are latent failures introduced during the design phase that cause release during normal production. Since this paper focuses on barriers introduced to prevent releases during operations, this scenario will not be treated any further in the paper. Nevertheless, barriers preventing failures in the design process and barriers aimed to detect design related failures prior to start-up of production are very important in order to minimize the risk.
Categories 1-3 belong to the cause category human or operational error in Section 3.1, category 4 belongs to the cause category technical failures, category 5 belongs to the cause category process upsets/process parameters out of range, category 6 belongs to the cause category external events, while category 7 belongs to latent failures from design. A brief description and a barrier block diagram for each scenario are presented in the following.

ARTICLE IN PRESSS. Sklet / Journal of Loss Prevention in the Process Industries I ■■■■ Ill-Ill 5
4.1. Scenario la. Release due to mal-operation of valve(s) during manned operation
This scenario covers releases due to all types of mal- operation of valve(s) in hydrocarbon systems during manual operations in the production phase. Examples are valve(s) left in open position after taking samples performed by an area technician or laboratory technician, and isolation valve on the drain system left in open position after removal of temporary connections.
The initiating event is "Valve in wrong position after manual operation during normal production”. The error is introduced and the release will occur during normal production.
The release may be prevented by the barrier function "Detection of valve(s) in wrong position”, which is carried out by the barrier systems "System for self control of work” and "System for 3rd party control of work”. However, if an area technician performs the manual operation himself, there is seldom any 3rd party control of work. The barrier block diagram for this scenario is illustrated in Fig. 4.
4.2. Scenario lb. Release due to mal-operation of temporary hoses
This scenario includes releases due to mal-operation of temporary hoses in the process plant. Examples comprise
Detection of valve(s) in wrong positon
Release
"Safe state" Failure revealed
and correctedSelf control of work
3rd party control of work
Valve in wrong position after manual operation
Initiating event Barrier functions End event
Fig. 4. Barrier block diagram for Scenario la.
use of wrong type of hoses (e.g., wrong pressure rating) and error during hook-up of the hoses.
The initiating event is "Erroneous choice or hook-up of temporary hose”. The operational mode when error is introduced is normal production or maintenance, and the operational mode at time of release is normal production or maintenance.
The following barrier functions may prevent releases; "Detection of erroneous choice of hose” or "Detection of erroneous hook-up”. The former function may be fulfilled by a "System for self control of work” and "System for 3rd party control of work”, while the latter may be fulfilled by "System for purging and pressure testing of hoses”. The barrier block diagram for this scenario is shown in Fig. 5.
4.3. Scenario lc. Release due to lack of water in water locks in the drain system
This scenario includes releases due to lack of water in water locks in the drain system resulting in hydrocarbons escaping through the waterlock system. The initiating event is "Water level in water locks below critical level”. Such releases may occur during normal production.
The release may be prevented by the barrier function "Refilling of water when level is below critical level” that may be realized by the "System for preventive maintenance (PM)” including inspection of water level and refilling if necessary (see Fig. 6).
4.4. Scenario 2a. Release due to incorrect fitting of flanges or bolts during maintenance
This scenario includes releases due to tightening with too low or too high tension, misalignment of flange faces, damaged bolts, etc. The initiating event is "Incorrect fitting of flanges or bolts during maintenance”, and the error is introduced during maintenance. The release will occur during start-up after maintenance or later during normal production.
Detection of erroneous choice of hose
Detection of erroneous hook-up
Release
"Safe state" Failure revealed and corrected
3rd party control of work
Self control of work
Purging and pressure testing of hoses
Erroneous choice or hook up of
temporary hose
Initiating event Barrier functions End event
Fig. 5. Barrier block diagram for Scenario lb.
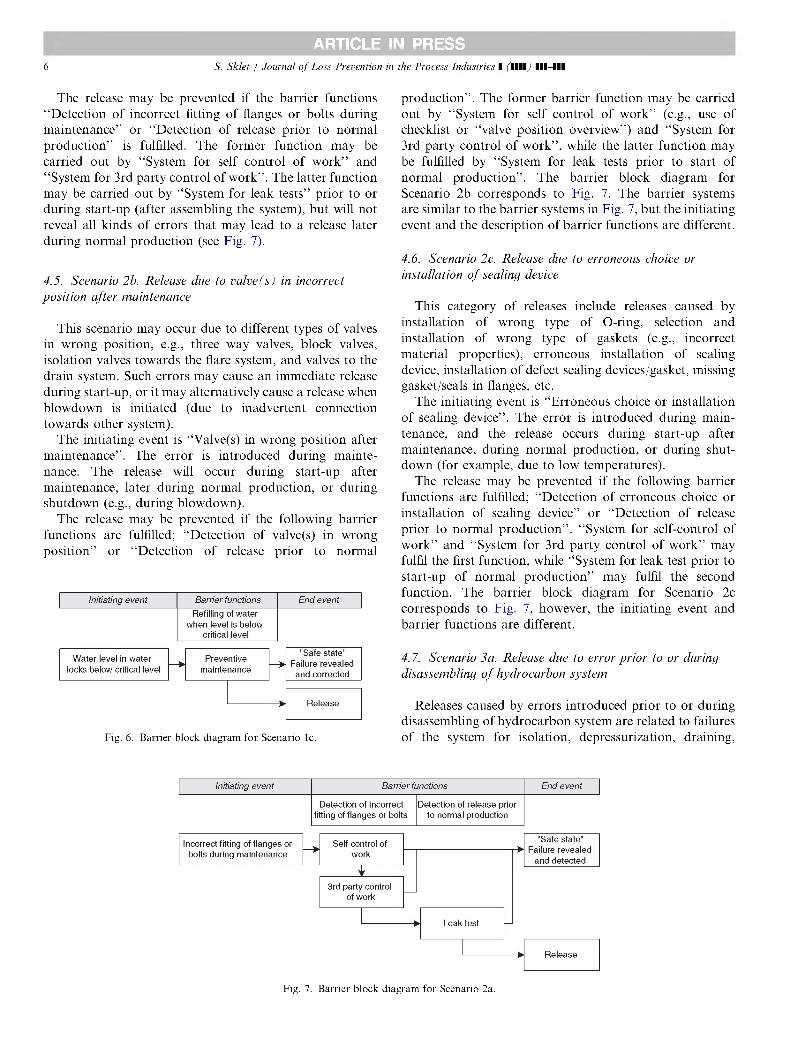
ARTICLE IN PRESS6 S. Sklet / Journal of Loss Prevention in the Process Industries I ■■■■ Ill-Ill
The release may be prevented if the barrier functions "Detection of incorrect fitting of flanges or bolts during maintenance” or "Detection of release prior to normal production” is fulfilled. The former function may be carried out by "System for self control of work” and "System for 3rd party control of work”. The latter function may be carried out by "System for leak tests” prior to or during start-up (after assembling the system), but will not reveal all kinds of errors that may lead to a release later during normal production (see Fig. 7).
4.5. Scenario 2b. Release clue to valve(s) in incorrect position after maintenance
This scenario may occur due to different types of valves in wrong position, e.g., three way valves, block valves, isolation valves towards the flare system, and valves to the drain system. Such errors may cause an immediate release during start-up, or it may alternatively cause a release when blowdown is initiated (due to inadvertent connection towards other system).
The initiating event is "Valve(s) in wrong position after maintenance”. The error is introduced during maintenance. The release will occur during start-up after maintenance, later during normal production, or during shutdown (e.g., during blowdown).
The release may be prevented if the following barrier functions are fulfilled; "Detection of valve(s) in wrong position” or "Detection of release prior to normal
Refilling of water when level is below
critical level
Release
"Safe state" Failure revealed and corrected
Preventivemaintenance
Water level in water locks below critical level
Initiating event Barrier functions End event
Fig. 6. Barrier block diagram for Scenario lc.
production”. The former barrier function may be carried out by "System for self control of work” (e.g., use of checklist or "valve position overview”) and "System for 3rd party control of work”, while the latter function may be fulfilled by "System for leak tests prior to start of normal production”. The barrier block diagram for Scenario 2b corresponds to Fig. 7. The barrier systems are similar to the barrier systems in Fig. 7, but the initiating event and the description of barrier functions are different.
4.6. Scenario 2c. Release clue to erroneous choice or installation of sealing device
This category of releases include releases caused by installation of wrong type of O-ring, selection and installation of wrong type of gaskets (e.g., incorrect material properties), erroneous installation of sealing device, installation of defect sealing devices/gasket, missing gasket/seals in flanges, etc.
The initiating event is "Erroneous choice or installation of sealing device”. The error is introduced during maintenance, and the release occurs during start-up after maintenance, during normal production, or during shutdown (for example, due to low temperatures).
The release may be prevented if the following barrier functions are fulfilled; "Detection of erroneous choice or installation of sealing device” or "Detection of release prior to normal production”. "System for self-control of work” and "System for 3rd party control of work” may fulfil the first function, while "System for leak test prior to start-up of normal production” may fulfil the second function. The barrier block diagram for Scenario 2c corresponds to Fig. 7, however, the initiating event and barrier functions are different.
4.7. Scenario 3a. Release clue to error prior to or during disassembling of hydrocarbon system
Releases caused by errors introduced prior to or during disassembling of hydrocarbon system are related to failures of the system for isolation, depressurization, draining,
Detection of incorrect fitting of flanges or bolts
Detection of release prior to normal production
Release
"Safe state" Failure revealed
and detected
Leak test
Self control of work
3rd party control of work
Incorrect fitting of flanges or bolts during maintenance
Initiating event Barrier functions End event
Fig. 7. Barrier block diagram for Scenario 2a.
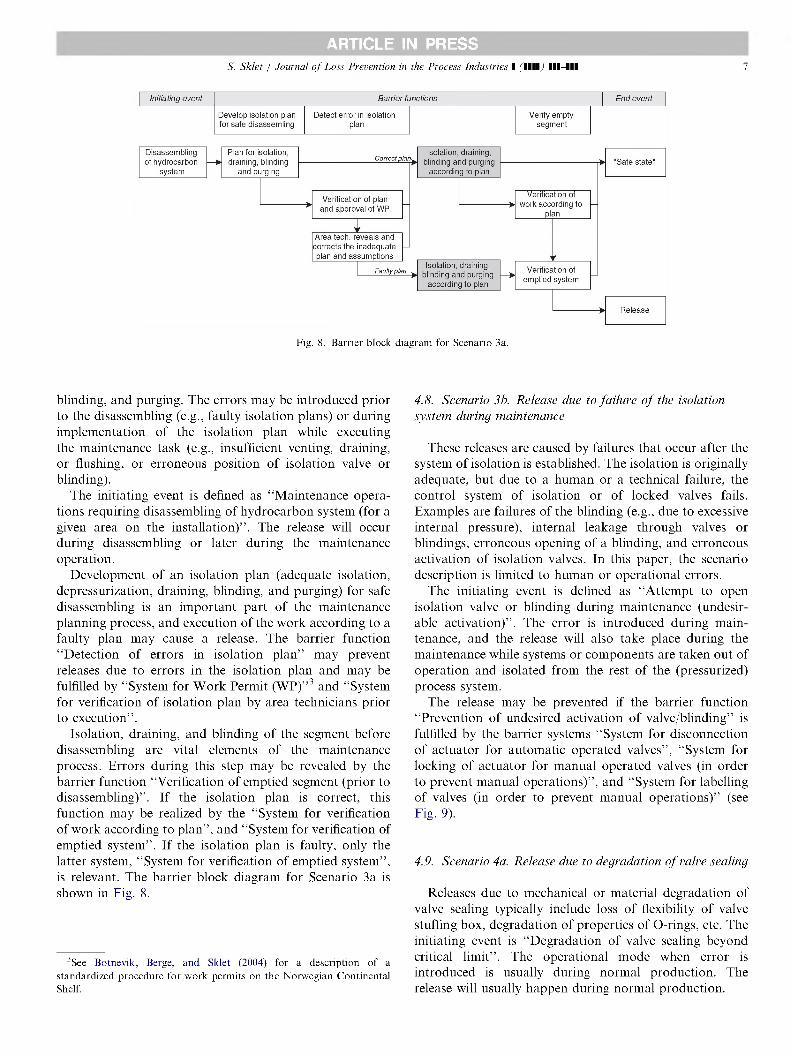
ARTICLE IN PRESSS. Sklet j Journal of Loss Prevention in the Process Industries I (Mi) Ill-Ill 7
Develop isolation plan for safe disassemling
Detect error in isolation plan
Verify empty segment
Correct plan.
Faulty plan
Release
"Safe state"Disassembling of hydrocarbon
system
Verification of emptied system
Verification of work according to ______ plan
Plan for isolation, draining, blinding
and purging
Verification of plan and approval of WP
Isolation, draining, blinding and purging
according to plan
Isolation, draining, blinding and purging
according to plan
Area tech, reveals and corrects the inadequate — plan and assumptions
Initiating event Barrier functions End event
Fig. 8. Barrier block diagram for Scenario 3a.
blinding, and purging. The errors may be introduced prior to the disassembling (e.g., faulty isolation plans) or during implementation of the isolation plan while executing the maintenance task (e.g., insufficient venting, draining, or flushing, or erroneous position of isolation valve or blinding).
The initiating event is defined as "Maintenance operations requiring disassembling of hydrocarbon system (for a given area on the installation)”. The release will occur during disassembling or later during the maintenance operation.
Development of an isolation plan (adequate isolation, depressurization, draining, blinding, and purging) for safe disassembling is an important part of the maintenance planning process, and execution of the work according to a faulty plan may cause a release. The barrier function "Detection of errors in isolation plan” may prevent releases due to errors in the isolation plan and may be fulfilled by "System for Work Permit (WP)”3 and "System for verification of isolation plan by area technicians prior to execution”.
Isolation, draining, and blinding of the segment before disassembling are vital elements of the maintenance process. Errors during this step may be revealed by the barrier function "Verification of emptied segment (prior to disassembling)”. If the isolation plan is correct, this function may be realized by the "System for verification of work according to plan”, and "System for verification of emptied system”. If the isolation plan is faulty, only the latter system, "System for verification of emptied system”, is relevant. The barrier block diagram for Scenario 3a is shown in Fig. 8.
3See Botnevik. Berge. and Sklet (2004) for a description of a standardized procedure for work permits on the Norwegian Continental Shelf.
4.8. Scenario 3b. Release due to failure of the isolation system during maintenance
These releases are caused by failures that occur after the system of isolation is established. The isolation is originally adequate, but due to a human or a technical failure, the control system of isolation or of locked valves fails. Examples are failures of the blinding (e.g., due to excessive internal pressure), internal leakage through valves or blindings, erroneous opening of a blinding, and erroneous activation of isolation valves. In this paper, the scenario description is limited to human or operational errors.
The initiating event is defined as "Attempt to open isolation valve or blinding during maintenance (undesirable activation)”. The error is introduced during maintenance, and the release will also take place during the maintenance while systems or components are taken out of operation and isolated from the rest of the (pressurized) process system.
The release may be prevented if the barrier function "Prevention of undesired activation of valve/blinding” is fulfilled by the barrier systems "System for disconnection of actuator for automatic operated valves”, "System for locking of actuator for manual operated valves (in order to prevent manual operations)”, and "System for labelling of valves (in order to prevent manual operations)” (see Fig. 9).
4.9. Scenario 4a. Release due to degradation of valve sealing
Releases due to mechanical or material degradation of valve sealing typically include loss of flexibility of valve stuffing box, degradation of properties of O-rings, etc. The initiating event is "Degradation of valve sealing beyond critical limit”. The operational mode when error is introduced is usually during normal production. The release will usually happen during normal production.

ARTICLE IN PRESS8 S. Sklet j Journal of Loss Prevention in the Process Industries I (1111) Ill-Ill
Prevention of undesired activation
of valve/blinding
Release
"Safe state" Failure revealed and corrected
"Safe state" Failure revealed
and corrected
Release
Attempt to open isolation valve or
blinding
Locking of manual actuator/ valve/ blinding
Disconnecting of actuator
Labeling of valve/blinding
Initiating event Barrier functions End event
Fig. 9. Barrier block diagram for Scenario 3b.
Maintain valve sealing to prevent Detect diffuse or
minor releasedegradation
Significant
Preventivemaintenance
Area based leak search
"Safe state" Failure revealed and corrected
"Safe state" Minor release
revealed
Release
Degradation of valve sealing
beyond critical limit
Initiating event Barrier functions End event
Fig. 10. Barrier block diagram for Scenario 4a.
The release may be prevented if the following barrier functions are fulfilled; "Maintain the valve sealing to prevent degradation” or "Detect diffuse or minor release”. The following barrier systems may carry out the functions respectively; "System for PM of equipment” and "System for area based leak search”. Fig. 10 shows the barrier block diagram.
4.10. Scenario 4b. Release due to degradation of flange gasket
Releases due to degradation of flange gasket properties typically include releases caused by degradation of material properties of gaskets/seals (e.g., loss of flexibility). The initiating event is "Degradation of flange gasket beyond critical limit”, and the degradation will happen during normal production. The operational mode at time of release is normal production.
The release may be prevented by the barrier functions; "Maintenance of flange gasket to prevent degradation” or "Detection of diffuse or minor release. The functions may be carried out by the barrier systems "System for PM” and "System for area based leak search”, respectively. The barrier block diagram for this scenario corresponds
to Fig. 10 with different descriptions of the initiating event and the barrier functions.
4.11. Scenario 4c. Release due to loss of bolt tensioning
Releases due to loss of bolt tensioning include releases from flanges, valves, instrument couplings, etc., due to loss of bolt tensioning after some time. The bolt tensioning was originally adequate, so the release will occur after some time (not during start-up or shortly after start-up of production).
The initiating event for this scenario is "Loss of bolt tensioning”. The operational mode when the failure is introduced and time of release are normal production.
The barrier functions "Follow-up of bolt tensioning to prevent release” and "Detection of diffuse or minor release” are defined for this scenario. The former function may be fulfilled by "System for PM (inspection and followup of tensioning)”, while the latter function may be fulfilled by "System for area based leak search”. The barrier block diagram for Scenario 4c corresponds to Fig. 10 with different descriptions of the initiating event and the barrier functions.
4.12. Scenario 4d. Release due to degradation of welded pipe
This category of releases includes leaks from welds due to degradation. Examples are releases from welded instrument fittings or valves, or from welds in pipe bends caused for example by fatigue.
The initiating event is "Degradation of weld beyond critical limit”. The operational mode when failure is introduced is normal production. The release will occur during normal production, during start-up, or during shut down.
The release may be prevented if the following safety functions are fulfilled; "Detection of weld degradation” or "Detection of diffuse or minor hydrocarbon release”. The former function may be realized by "System for weld inspection”, while the latter one may be realized by "System for area based leak search”. The barrier block diagram for Scenario 4d corresponds to Fig. 10 with different descriptions of the initiating event and the barrier functions.
4.13. Scenario 4e. Release due to internal corrosion
This scenario includes releases caused by different types of internal corrosion like local C02-corrosion, uniform C02-corrosion, and microbial corrosion (MIC). The initiating event for this scenario is "Internal corrosion beyond critical limit”. The corrosion works during normal production, and the release will occur during normal production or during process disturbances (resulting in, e.g., increased pressure).
The release may be prevented by the barrier functions "Detection of internal corrosion to prevent release” or
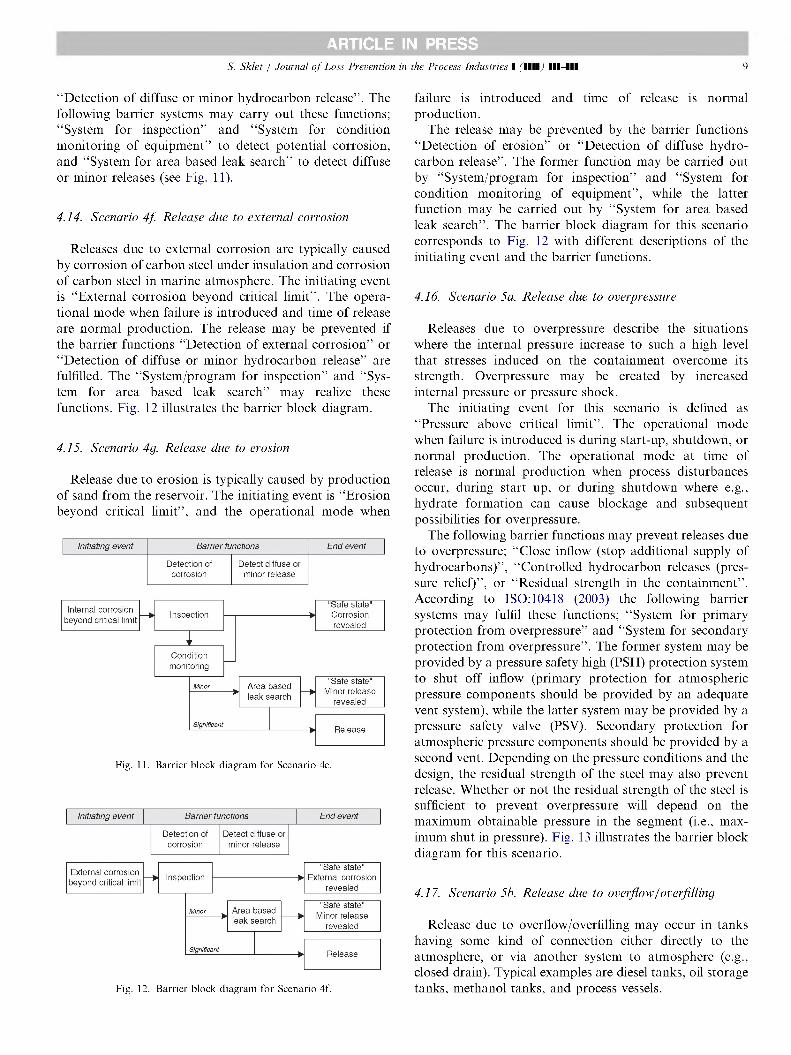
ARTICLE IN PRESSS. Sklet / Journal of Loss Prevention in the Process Industries I ■■■■ Ill-Ill 9
"Detection of diffuse or minor hydrocarbon release”. The following barrier systems may carry out these functions; "System for inspection” and "System for condition monitoring of equipment” to detect potential corrosion, and "System for area based leak search” to detect diffuse or minor releases (see Fig. 11).
4.14. Scenario 4f. Release clue to external corrosion
Releases due to external corrosion are typically caused by corrosion of carbon steel under insulation and corrosion of carbon steel in marine atmosphere. The initiating event is "External corrosion beyond critical limit”. The operational mode when failure is introduced and time of release are normal production. The release may be prevented if the barrier functions "Detection of external corrosion” or "Detection of diffuse or minor hydrocarbon release” are fulfilled. The "System/program for inspection” and "System for area based leak search” may realize these functions. Fig. 12 illustrates the barrier block diagram.
4.15. Scenario 4g. Release clue to erosion
Release due to erosion is typically caused by production of sand from the reservoir. The initiating event is "Erosion beyond critical limit”, and the operational mode when
Detection of Detect diffuse or minor release
Sfpn/fkanf
Area based leak search
"Safe state" Minor release
revealed
"Safe state" Corrosion revealed
Release
Conditionmonitoring
Inspectioninternal corrosion beyond critical limit
Initiating event Barrier functions End event
Fig. 11. Barrier block diagram for Scenario 4e.
Detection of Detect diffuse or minor release
Significant
Inspection
Area based leak search
"Safe state" External corrosion
revealed
"Safe state" Minor release
revealed
Release
External corrosion beyond critical limit
Initiating event Barrier functions End event
Fig. 12. Barrier block diagram for Scenario 4f.
failure is introduced and time of release is normal production.
The release may be prevented by the barrier functions "Detection of erosion” or "Detection of diffuse hydrocarbon release”. The former function may be carried out by "System/program for inspection” and "System for condition monitoring of equipment”, while the latter function may be carried out by "System for area based leak search”. The barrier block diagram for this scenario corresponds to Fig. 12 with different descriptions of the initiating event and the barrier functions.
4.16. Scenario 5a. Release clue to overpressure
Releases due to overpressure describe the situations where the internal pressure increase to such a high level that stresses induced on the containment overcome its strength. Overpressure may be created by increased internal pressure or pressure shock.
The initiating event for this scenario is defined as "Pressure above critical limit”. The operational mode when failure is introduced is during start-up, shutdown, or normal production. The operational mode at time of release is normal production when process disturbances occur, during start up, or during shutdown where e.g., hydrate formation can cause blockage and subsequent possibilities for overpressure.
The following barrier functions may prevent releases due to overpressure; "Close inflow (stop additional supply of hydrocarbons)”, "Controlled hydrocarbon releases (pressure relief)”, or "Residual strength in the containment”. According to ISO: 10418 (2003) the following barrier systems may fulfil these functions; "System for primary protection from overpressure” and "System for secondary protection from overpressure”. The former system may be provided by a pressure safety high (PSH) protection system to shut off inflow (primary protection for atmospheric pressure components should be provided by an adequate vent system), while the latter system may be provided by a pressure safety valve (PSV). Secondary protection for atmospheric pressure components should be provided by a second vent. Depending on the pressure conditions and the design, the residual strength of the steel may also prevent release. Whether or not the residual strength of the steel is sufficient to prevent overpressure will depend on the maximum obtainable pressure in the segment (i.e., maximum shut in pressure). Fig. 13 illustrates the barrier block diagram for this scenario.
4.17. Scenario 5b. Release clue to overflow/overfilling
Release due to overflow/overfilling may occur in tanks having some kind of connection either directly to the atmosphere, or via another system to atmosphere (e.g., closed drain). Typical examples are diesel tanks, oil storage tanks, methanol tanks, and process vessels.
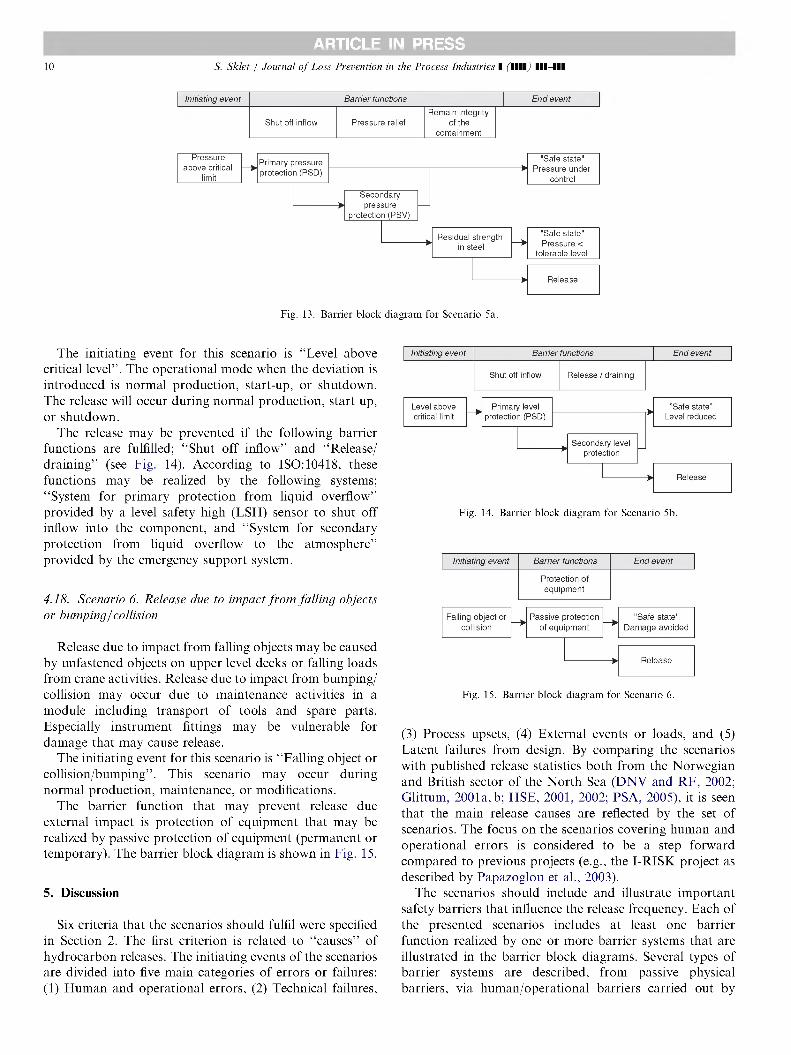
ARTICLE IN PRESS10 S. Sklet j Journal of Loss Prevention in the Process Industries I (1111) Ill-Ill
Initiating event Barrier functions End event
Shut off inflow Pressure reliefRemain integrity
of thecontainment
Pressure above critical
limit
e Primary pressure * protection (PSD)
Secondary pressure
protection (PSV)
"Safe state" Pressure under
control
Residual strength in steel
"Safe state" Pressure <
tolerable level
Release
Fig. 13. Barrier block diagram for Scenario 5a.
The initiating event for this scenario is "Level above critical level”. The operational mode when the deviation is introduced is normal production, start-up, or shutdown. The release will occur during normal production, start up, or shutdown.
The release may be prevented if the following barrier functions are fulfilled; "Shut off inflow” and "Release/ draining” (see Fig. 14). According to ISO: 10418, these functions may be realized by the following systems; "System for primary protection from liquid overflow” provided by a level safety high (LSH) sensor to shut off inflow into the component, and "System for secondary protection from liquid overflow to the atmosphere” provided by the emergency support system.
4.18. Scenario 6. Release clue to impact from falling objects or bumping/collision
Release due to impact from falling objects may be caused by unfastened objects on upper level decks or falling loads from crane activities. Release due to impact from bumping/ collision may occur due to maintenance activities in a module including transport of tools and spare parts. Especially instrument fittings may be vulnerable for damage that may cause release.
The initiating event for this scenario is "Falling object or collision/bumping”. This scenario may occur during normal production, maintenance, or modifications.
The barrier function that may prevent release due external impact is protection of equipment that may be realized by passive protection of equipment (permanent or temporary). The barrier block diagram is shown in Fig. 15.
5. Discussion
Six criteria that the scenarios should fulfil were specified in Section 2. The first criterion is related to "causes” of hydrocarbon releases. The initiating events of the scenarios are divided into five main categories of errors or failures: (1) Human and operational errors, (2) Technical failures,
Shut off inflow Release/draining
Level above critical limit
Primary level protection (PSD)
Secondary level protection
"Safe state” Level reduced
Release
Initiating event Barrier functions End event
Fig. 14. Barrier block diagram for Scenario 5b.
Protection of equipment
Falling object or collision
Release
"Safe state" Damage avoided
Passive protection of equipment
Initiating event Barrier functions End event
Fig. 15. Barrier block diagram for Scenario 6.
(3) Process upsets, (4) External events or loads, and (5) Latent failures from design. By comparing the scenarios with published release statistics both from the Norwegian and British sector of the North Sea (DNV and RF, 2002; Glittum, 2001a, b; HSE, 2001, 2002; PSA, 2005), it is seen that the main release causes are reflected by the set of scenarios. The focus on the scenarios covering human and operational errors is considered to be a step forward compared to previous projects (e.g., the I-RISK project as described by Papazoglou et ah, 2003).
The scenarios should include and illustrate important safety barriers that influence the release frequency. Each of the presented scenarios includes at least one barrier function realized by one or more barrier systems that are illustrated in the barrier block diagrams. Several types of barrier systems are described, from passive physical barriers, via human/operational barriers carried out by
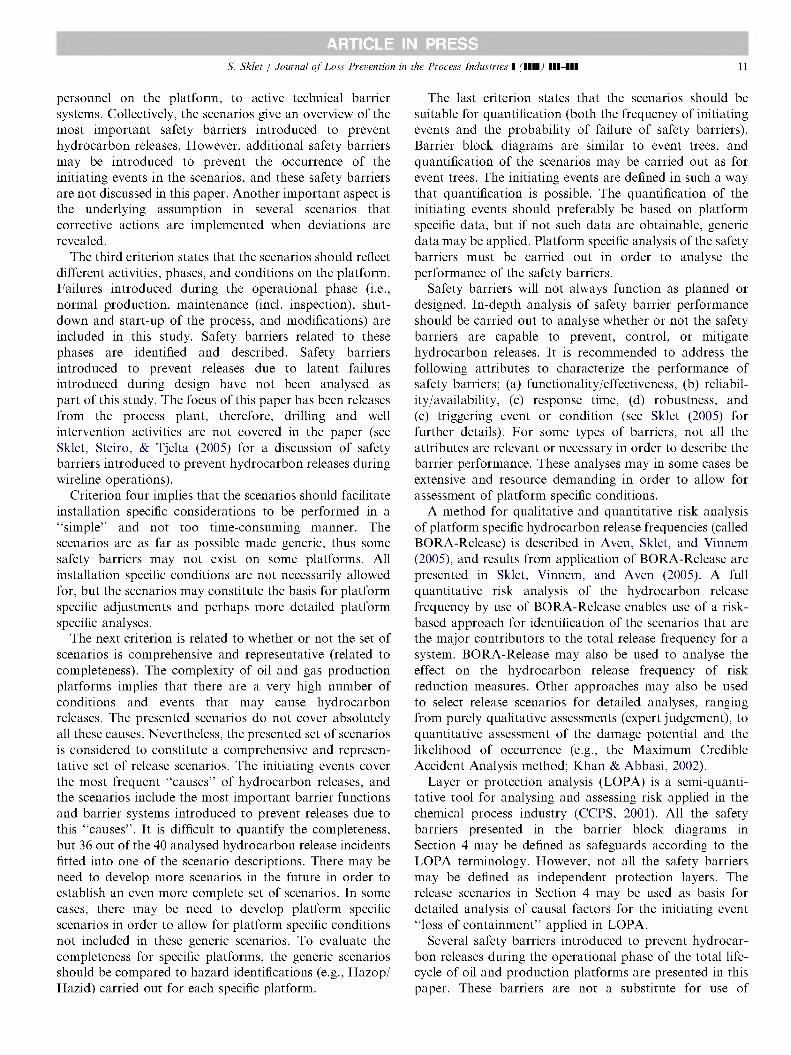
ARTICLE IN PRESSS. Sklet / Journal of Loss Prevention in the Process Industries I ■■■■ Ill-Ill 11
personnel on the platform, to active technical barrier systems. Collectively, the scenarios give an overview of the most important safety barriers introduced to prevent hydrocarbon releases. However, additional safety barriers may be introduced to prevent the occurrence of the initiating events in the scenarios, and these safety barriers are not discussed in this paper. Another important aspect is the underlying assumption in several scenarios that corrective actions are implemented when deviations are revealed.
The third criterion states that the scenarios should reflect different activities, phases, and conditions on the platform. Failures introduced during the operational phase (i.e., normal production, maintenance (inch inspection), shutdown and start-up of the process, and modifications) are included in this study. Safety barriers related to these phases are identified and described. Safety barriers introduced to prevent releases due to latent failures introduced during design have not been analysed as part of this study. The focus of this paper has been releases from the process plant, therefore, drilling and well intervention activities are not covered in the paper (see Sklet, Steiro, & Tjelta (2005) for a discussion of safety barriers introduced to prevent hydrocarbon releases during wireline operations).
Criterion four implies that the scenarios should facilitate installation specific considerations to be performed in a "simple” and not too time-consuming manner. The scenarios are as far as possible made generic, thus some safety barriers may not exist on some platforms. All installation specific conditions are not necessarily allowed for, but the scenarios may constitute the basis for platform specific adjustments and perhaps more detailed platform specific analyses.
The next criterion is related to whether or not the set of scenarios is comprehensive and representative (related to completeness). The complexity of oil and gas production platforms implies that there are a very high number of conditions and events that may cause hydrocarbon releases. The presented scenarios do not cover absolutely all these causes. Nevertheless, the presented set of scenarios is considered to constitute a comprehensive and representative set of release scenarios. The initiating events cover the most frequent "causes” of hydrocarbon releases, and the scenarios include the most important barrier functions and barrier systems introduced to prevent releases due to this "causes”. It is difficult to quantify the completeness, but 36 out of the 40 analysed hydrocarbon release incidents fitted into one of the scenario descriptions. There may be need to develop more scenarios in the future in order to establish an even more complete set of scenarios. In some cases, there may be need to develop platform specific scenarios in order to allow for platform specific conditions not included in these generic scenarios. To evaluate the completeness for specific platforms, the generic scenarios should be compared to hazard identifications (e.g., Hazop/ Hazid) carried out for each specific platform.
The last criterion states that the scenarios should be suitable for quantification (both the frequency of initiating events and the probability of failure of safety barriers). Barrier block diagrams are similar to event trees, and quantification of the scenarios may be carried out as for event trees. The initiating events are defined in such a way that quantification is possible. The quantification of the initiating events should preferably be based on platform specific data, but if not such data are obtainable, generic data may be applied. Platform specific analysis of the safety barriers must be carried out in order to analyse the performance of the safety barriers.
Safety barriers will not always function as planned or designed. In-depth analysis of safety barrier performance should be carried out to analyse whether or not the safety barriers are capable to prevent, control, or mitigate hydrocarbon releases. It is recommended to address the following attributes to characterize the performance of safety barriers; (a) functionality/effectiveness, (b) reliability/availability, (c) response time, (d) robustness, and (e) triggering event or condition (see Sklet (2005) for further details). For some types of barriers, not all the attributes are relevant or necessary in order to describe the barrier performance. These analyses may in some cases be extensive and resource demanding in order to allow for assessment of platform specific conditions.
A method for qualitative and quantitative risk analysis of platform specific hydrocarbon release frequencies (called BORA-Release) is described in Aven, Sklet, and Vinnem (2005), and results from application of BORA-Release are presented in Sklet, Vinnem, and Aven (2005). A full quantitative risk analysis of the hydrocarbon release frequency by use of BORA-Release enables use of a risk- based approach for identification of the scenarios that are the major contributors to the total release frequency for a system. BORA-Release may also be used to analyse the effect on the hydrocarbon release frequency of risk reduction measures. Other approaches may also be used to select release scenarios for detailed analyses, ranging from purely qualitative assessments (expert judgement), to quantitative assessment of the damage potential and the likelihood of occurrence (e.g., the Maximum Credible Accident Analysis method; Khan & Abbasi, 2002).
Layer or protection analysis (LOPA) is a semi-quanti- tative tool for analysing and assessing risk applied in the chemical process industry (CCPS, 2001). All the safety barriers presented in the barrier block diagrams in Section 4 may be defined as safeguards according to the LOPA terminology. However, not all the safety barriers may be defined as independent protection layers. The release scenarios in Section 4 may be used as basis for detailed analysis of causal factors for the initiating event "loss of containment” applied in LOPA.
Several safety barriers introduced to prevent hydrocarbon releases during the operational phase of the total life- cycle of oil and production platforms are presented in this paper. These barriers are not a substitute for use of
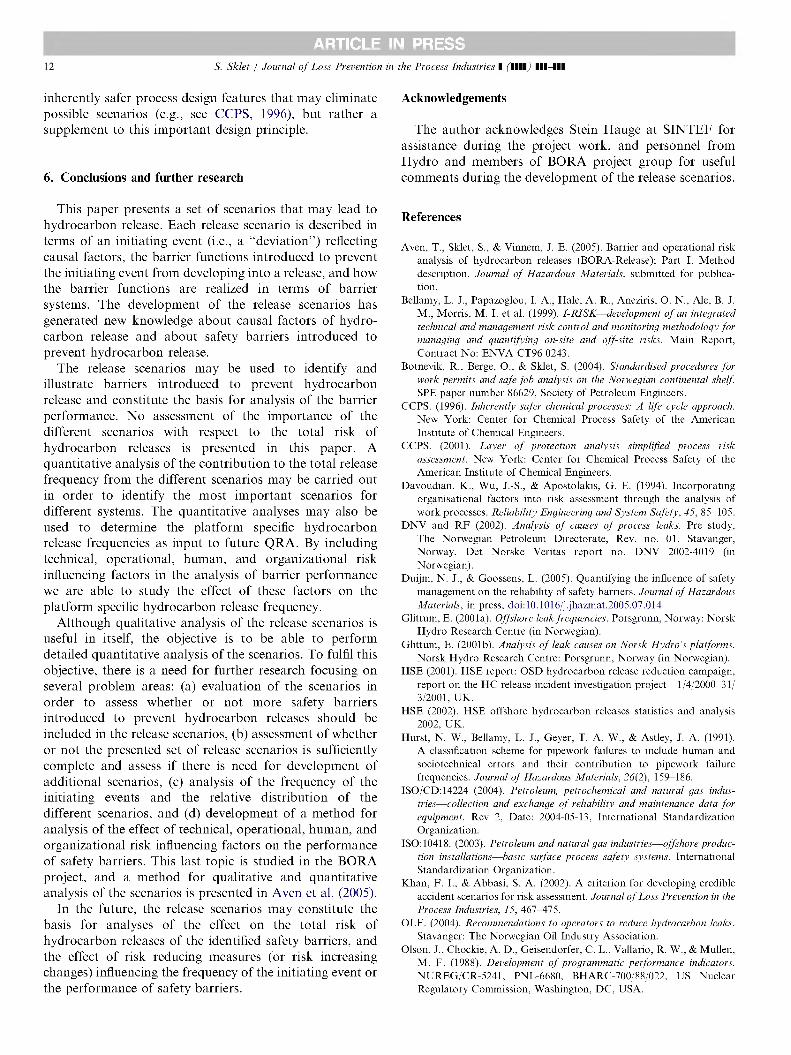
ARTICLE IN PRESS12 S. Sklet / Journal of Loss Prevention in the Process Industries I ■■■■ Ill-Ill
inherently safer process design features that may eliminate possible scenarios (e.g., see CCPS, 1996), but rather a supplement to this important design principle.
6. Conclusions and further research
This paper presents a set of scenarios that may lead to hydrocarbon release. Each release scenario is described in terms of an initiating event (i.e., a "deviation” ) reflecting causal factors, the barrier functions introduced to prevent the initiating event from developing into a release, and how the barrier functions are realized in terms of barrier systems. The development of the release scenarios has generated new knowledge about causal factors of hydrocarbon release and about safety barriers introduced to prevent hydrocarbon release.
The release scenarios may be used to identify and illustrate barriers introduced to prevent hydrocarbon release and constitute the basis for analysis of the barrier performance. No assessment of the importance of the different scenarios with respect to the total risk of hydrocarbon releases is presented in this paper. A quantitative analysis of the contribution to the total release frequency from the different scenarios may be carried out in order to identify the most important scenarios for different systems. The quantitative analyses may also be used to determine the platform specific hydrocarbon release frequencies as input to future QRA. By including technical, operational, human, and organizational risk influencing factors in the analysis of barrier performance we are able to study the effect of these factors on the platform specific hydrocarbon release frequency.
Although qualitative analysis of the release scenarios is useful in itself, the objective is to be able to perform detailed quantitative analysis of the scenarios. To fulfil this objective, there is a need for further research focusing on several problem areas: (a) evaluation of the scenarios in order to assess whether or not more safety barriers introduced to prevent hydrocarbon releases should be included in the release scenarios, (b) assessment of whether or not the presented set of release scenarios is sufficiently complete and assess if there is need for development of additional scenarios, (c) analysis of the frequency of the initiating events and the relative distribution of the different scenarios, and (d) development of a method for analysis of the effect of technical, operational, human, and organizational risk influencing factors on the performance of safety barriers. This last topic is studied in the BORA project, and a method for qualitative and quantitative analysis of the scenarios is presented in Aven et al. (2005).
In the future, the release scenarios may constitute the basis for analyses of the effect on the total risk of hydrocarbon releases of the identified safety barriers, and the effect of risk reducing measures (or risk increasing changes) influencing the frequency of the initiating event or the performance of safety barriers.
Acknowledgements
The author acknowledges Stein Hauge at SINTEF for assistance during the project work, and personnel from Hydro and members of BORA project group for useful comments during the development of the release scenarios.
References
Aven. T.. Sklet. S.. & Vinnem. J. E. (2005). Barrier and operational risk analysis of hydrocarbon releases (BORA-Release); Part I. Method description. Journal of Hazardous Materials. submitted for publication.
Bellamy. L. J.. Papazoglou. I. A.. Hale. A. R.. Aneziris. O. N.. Ale. B. J. M.. Morris. M. I. et al. (1999). I-R1SK—development of an integrated technical and management risk control and monitoring methodology for managing and quantifying on-site and off-site risks. Main Report. Contract No: ENVA-CT96-0243.
Botnevik. R.. Berge. O.. & Sklet. S. (2004). Standardised procedures for work permits and safe job analysis on the Norwegian continental shelf. SPE paper number 86629. Society of Petroleum Engineers.
CCPS. (1996). Inherently saj'er chemical processes: A lij'e cycle approach. New York: Center for Chemical Process Safety of the American Institute of Chemical Engineers.
CCPS. (2001). Layer of protection analysis simplified process risk assessment. New York: Center for Chemical Process Safety of the American Institute of Chemical Engineers.
Davoudian. K.. Wu, J.-S.. & Apostolakis. G. E. (1994). Incorporating organisational factors into risk assessment through the analysis of work processes. Reliability Engineering and System Safety. 45. 85-105.
DNV and RE (2002). Analysis of causes of process leaks. Pre study. The Norwegian Petroleum Directorate. Rev. no. 01. Stavanger. Norway. Det Norske Veritas report no. DNV 2002-4019 (in Norwegian).
Duijm. N. J.. & Goossens. L. (2005). Quantifying the influence of safety management on the reliability of safety barriers. Journal of Hazardous Materials, in press. doi:10.1016/j.jhazmat.2005.07.014
Glittum. E. (2001a). Offshore leak frequencies. Porsgrunn. Norway: Norsk Hydro Research Centre (in Norwegian).
Glittum. E. (2001b). Analysis of leak causes on Norsk Hydro’s platforms.Norsk Hydro Research Centre: Porsgrunn. Norway (in Norwegian).
HSE (2001). HSE report: OSD hydrocarbon release reduction campaign, report on the HC release incident investigation project—1/4/2000-31/ 3/2001. UK.
HSE (2002). HSE offshore hydrocarbon releases statistics and analysis 2002. UK.
Hurst. N. W.. Bellamy. L. J.. Geyer. T. A. W.. & Astley. J. A. (1991). A classification scheme for pipework failures to include human and sociotechnical errors and their contribution to pipework failure frequencies. Journal of Hazardous Materials. 26(2). 159-186.
ISO/CD: 14224 (2004). Petroleum, petrochemical and natural gas industries—collection and exchange of reliability and maintenance data for equipment. Rev 2. Date: 2004-05-13. International Standardization Organization.
ISO:10418. (2003). Petroleum and natural gas industries—offshore production installations—basic surface process safety systems. International Standardization Organization.
Khan. F. I.. & Abbasi. S. A. (2002). A criterion for developing credible accident scenarios for risk assessment. Journal of Loss Prevention in the Process Industries. 15. 467-475.
OLE. (2004). Recommendations to operators to reduce hydrocarbon leaks.Stavanger: The Norwegian Oil Industry Association.
Olson. J.. Chockie. A. D.. Geisendorfer. C. L.. Vallario. R. W.. & Mullen. M. F. (1988). Development of programmatic performance indicators. NUREG/CR-5241, PNL-6680. BHARC-700/88/022. US Nuclear Regulatory Commission. Washington. DC. USA.

ARTICLE IN PRESSS. Sklet / Journal of Loss Prevention in the Process Industries I ■■■■ Ill-Ill 13
Papazoglou. I. A.. Aneziris. O. N.. Post. J. G.. & Ale. B. J. M. (2003). Technical modeling in integrated risk assessment of chemical installations. Journal of Loss Prevention in the Process Industries, 16, 575-591.
PSA. (2003). The risk level on the Norwegian Continental Shelf 2002.Stavanger: The Petroleum Safety Authority.
PSA. (2005). Trends in risk levels—summary report Phase 5 (2004).Stavanger: The Petroleum Safety Authority.
Sklet. S. (2005). Safety barriers: definition, classification, and performance. Journal of Loss Prevention in the Process Industries, accepted for publication.
Sklet. S.. & Hauge. S. (2004). Safely harriers to prevent release of hydrocarbons during production of oil and gas. Trondheim: SINTEF Industrial Management Safety and Reliability.
Sklet. S.. Steiro. T.. Tjelta. O.. (2005). Qualitative analysis of human, technical and operational harrier elements during well interventions. ESREL 2005. Tri City. Poland: Balkema.
Sklet. S.. Vinnem. J. E.. & Aven. T. (2005). Barrier and operational risk analysis of hydrocarbon releases (BORA-Release); Part II. Results from a case study. Journal of Hazardous Materials, submitted for publication.
Vinnem. J. E.. Aven. T.. Hauge. S.. Seljelid. J.. & Veire. G. (2004). Integrated harrier analysis in operational risk assessment in offshore petroleum operations. PSAM7-ESREL'04. Berlin: Springer.
0ien. K. (2001). Risk indicators as a tool for risk control. Reliability Engineering & System Safety, 74(2), 129-145.

Thesis - Part II Papers
Paper 3
Barrier and operational risk analysis of hydrocarbon releases (BORA- Release); Part I Method description
Terje Aven, Snorre Sklet, Jan Erik Vinnem Journal of Hazardous Materials
Submitted for publication December 2005

Barrier and operational risk analysis of hydrocarbon releases (BORA-Release);
Part I Method description
Terje Aven b, Snorre Sklet a’ 1, Jan Erik Vinnem ba Dept. of Production and Quality Engineering, The Norwegian University of
Science and Technology (NTNU), NO-7491 Trondheim, Norway b University of Stavanger (UiS), NO-4036 Stavanger, Norway
AbstractInvestigations of major accidents show that technical, human, operational, as well as organisational factors influence the accident sequences. In spite of these facts, quantitative risk analyses of offshore oil and gas production platforms have focused on technical safety systems. This paper presents a method (called BORA-Release) for qualitative and quantitative risk analysis of the platform specific hydrocarbon release frequency. By using BORA-Release it is possible to analyse the effect of safety barriers introduced to prevent hydrocarbon releases, and how platform specific conditions of technical, human, operational, and organisational risk influencing factors influence the barrier performance. BORA-Release comprises the following main steps; 1) Development of a basic risk model including release scenarios, 2) Modelling the performance of safety barriers, 3) Assignment of generic data and risk quantification based on these data, 4) Development of risk influence diagrams, 5) Scoring of risk influencing factors, 6) Weighting of risk influencing factors, 7) Adjustment of generic input data, and 8) Recalculation of the risk in order to determine the platform specific risk related to hydrocarbon release. The various steps in BORA-Release are presented and discussed. Part II of the paper presents results from a case study where BORA-Release is applied.
Keywords: Risk analysis, hydrocarbon release, loss of containment, safety barrier, organisational factors. *
1 Corresponding author. Tel.: +47 73 59 29 02, Fax: +47 73 59 28 96 E-mail: snorre.sklet@,sintef.no
Barrier and operational risk analysis of hydrocarbon releases (BORA-Release);Part I Method description
1 IntroductionIn-depth investigations of major accidents, like the process accidents at Longford [1] and Piper Alpha [2], the loss of the space shuttles Challenger [3] and Colombia [4], the high-speed craft Sleiper accident [5], the railway accidents at Ladbroke Grove [6] and Asta [5], and several major accidents in Norway the last 20 years [7] show that both technical, human, operational, as well as organisational factors influence the accident sequences. In spite of these findings, the main focus in quantitative risk analyses (QRA) is on technical safety systems. As regards offshore QRA, one of the conclusions drawn by Vinnem et al [8] is that a more detailed analysis of all aspects of safety barriers is required.
Several models and methods for incorporating organisational factors in QRA or probabilistic risk assessments (PRA) have been proposed. Among these are Manager [9], MACHINE (Model of Accident Causation using Hierarchical Influence NEtwork) [10], ISM (Integrated Safety Method) [11], WPAM (The Work Process Analysis Model) [12, 13], I-RISK (Integrated Risk) [14-16], the ©-factor model [17], SAM (System Action Management) [18, 19], ORIM (Organisational Risk Influence Model) [20, 21], and ARAMIS [22]. These models/methods have been developed and described in the literature the last 15 years. However, none of them are so far used as an integrated part of offshore QRA.
The Petroleum Safety Authority Norway (PSA) gives several requirements to risk analysis and safety barriers in their regulations [23]: QRA shall be carried out to identify contributors to major accident risk and provide a balanced and comprehensive picture of the risk. The operator, or the one responsible for the operation of a facility, shall stipulate the strategies and principles on which the design, use, and maintenance of safety barriers shall be based, so that the barrier function is ensured throughout the lifetime of the facility. It shall be known which safety barriers that have been established, which function they are intended to fulfil, and what performance requirements have been defined with respect to the technical, operational or organisational elements that are necessary for the individual barrier to be effective.
In spite of these requirements, the QRA of offshore platforms are still limited to analysis of consequence reducing barriers with no, or limited analysis of barriers introduced to reduce the probability of hydrocarbon release. Therefore, a method that may be applied to analyse safety barriers introduced to prevent hydrocarbon releases is required. The method ought to be used for qualitative and quantitative analyses of the effect on the barrier performance, and thus the risk, of plant specific conditions of technical, human, operational, as well as organisational risk
2
influencing factors (RIFs). With this background, the BORA-project (Barrier and Operational Risk Analysis) was initiated in order to perform a detailed and quantitative modelling of barrier performance, including barriers to prevent the occurrence of initiating events (e.g., hydrocarbon release), as well as barriers to reduce the consequences [24].
The main objective of this paper is to present and discuss a new method for qualitative and quantitative analyses of the platform specific hydrocarbon release frequency, called BORA-Release. BORA-Release makes it possible to analyse the effect on the hydrocarbon release frequency of safety barriers introduced to prevent release, and how platform specific conditions of technical, human, operational, and organisational RIFs influence the barrier performance. The paper is limited to analysis of hydrocarbon release (or loss of containment). However, the principles in BORA-Release are relevant for analysis of the consequence barriers as well.
The paper is organized as follows. Section 2 describes the process for development of the method. Section 3 describes BORA-Release. Section 4 discusses critical issues of the method. The discussion is divided in three parts; a discussion of the different steps in BORA-Release, a discussion of the extent of fulfilment of a set of criteria, and a discussion of application areas. Some conclusions and ideas for further work are presented in section 5. Part II presents some results from a case study where BORA-Release is applied.
Barrier and operational risk analysis of hydrocarbon releases (BORA-Release);Part I Method description
2 Research approachThe research process for development of BORA-Release consists of the following main steps:
1. Development of a set of criteria the method should fulfil2. Literature review3. Selection of modelling approach4. Development of a preliminary (draft) version of the method5. Application of the method in case studies6. Revision of the method
Several criteria the BORA-Release should fulfil were developed. The criteria were developed as a result of discussions of the purpose of the analysis method. The aim was to develop a method that:
3

1. Facilitates identification and illustration of safety barriers introduced to prevent hydrocarbon releases
2. Contributes to an understanding of which factors that influence the performance of the safety barriers, including technical, human, operational, as well as organisational factors
3. Reflects different causes of hydrocarbon releases4. Is suitable for quantification of the frequency of initiating events and the
performance of the safety barriers5. Allows use of available input data as far as possible, or allows collection of
input data in not a too time consuming manner6. Allows consideration of different activities, phases, and conditions7. Enables identification of common causes and dependencies8. Is practically applicable regarding use of resources9. Provides basis for “re-use” of the generic model in such a way that
installation specific considerations may be performed in a simple and not too time-consuming manner
To what extent BORA-Release fulfils these criteria are discussed in subsection 4.2.
A literature review was carried out in order to identify existing methods incorporating the effect of organisational factors in QRA. Several models and methods for quantification of the influence of organisational factors on the total risk are described in the literature. Among these are Manager [9], MACHINE) (Model of Accident Causation using Hierarchical Influence NEtwork) [10], ISM (Integrated Safety Model) [11], the ©-factor model [17], WPAM (The Work Process Analysis Model) [12, 13], SAM (System Action Management) [18, 19], I-RISK (Integrated Risk) [14-16], ORIM (Organisational Risk Influence Model) [20, 21], and ARAMIS [22].
These models and methods were reviewed and compared in view of criteria 1 - 9 above. The review was partly based in the framework for evaluation of models/methods for this type of risk analyses introduced by 0ien [25]. The conclusion was that none of the models/methods were directly applicable for analysis of platform specific release frequencies allowing for analysis of the effect of safety barriers introduced to prevent release, and analysis of how platform specific conditions of technical, human, operational, and organisational RIFs influence the barrier performance. However, the comparison resulted in knowledge about the existing methods used as basis for development of BORA-Release.
Barrier and operational risk analysis of hydrocarbon releases (BORA-Release);Part I Method description
4
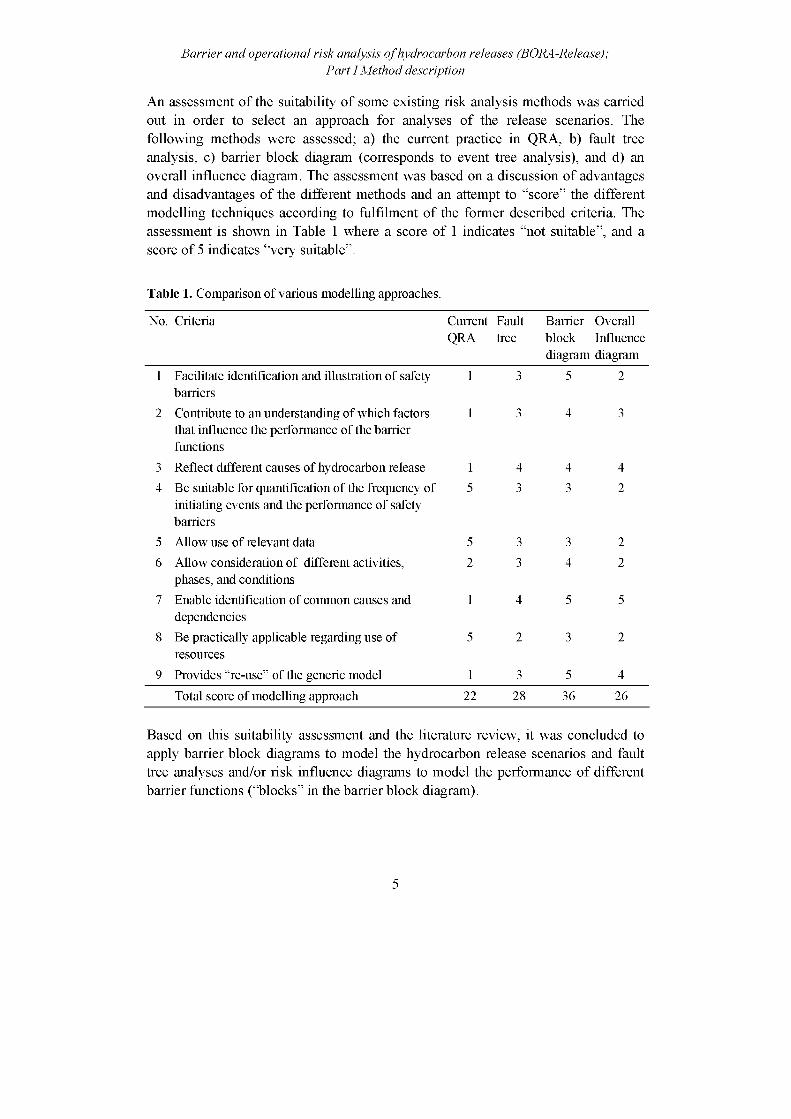
An assessment of the suitability of some existing risk analysis methods was carried out in order to select an approach for analyses of the release scenarios. The following methods were assessed; a) the current practice in QRA, b) fault tree analysis, c) barrier block diagram (corresponds to event tree analysis), and d) an overall influence diagram. The assessment was based on a discussion of advantages and disadvantages of the different methods and an attempt to “score” the different modelling techniques according to fulfilment of the former described criteria. The assessment is shown in Table 1 where a score of 1 indicates “not suitable”, and a score of 5 indicates “very suitable”.
Barrier and operational risk analysis of hydrocarbon releases (BORA-Release);Part I Method description
Table 1. Comparison of various modelling approaches.
No. Criteria CurrentQRA
Faulttree
Barrierblockdiagram
OverallInfluencediagram
1 Facilitate identification and illustration of safety barriers
1 3 5 2
2 Contribute to an understanding of which factors that influence the performance of the barrier functions
1 3 4 3
3 Reflect different causes of hydrocarbon release 1 4 4 44 Be suitable for quantification of the frequency of
initiating events and the performance of safety barriers
5 3 3 2
5 Allow use of relevant data 5 3 3 26 Allow consideration of different activities,
phases, and conditions2 3 4 2
7 Enable identification of common causes and dependencies
1 4 5 5
8 Be practically applicable regarding use of resources
5 2 3 2
9 Provides “re-use” of the generic model 1 3 5 4Total score of modelling approach 22 28 36 26
Based on this suitability assessment and the literature review, it was concluded to apply barrier block diagrams to model the hydrocarbon release scenarios and fault tree analyses and/or risk influence diagrams to model the performance of different barrier functions (“blocks” in the barrier block diagram).
5
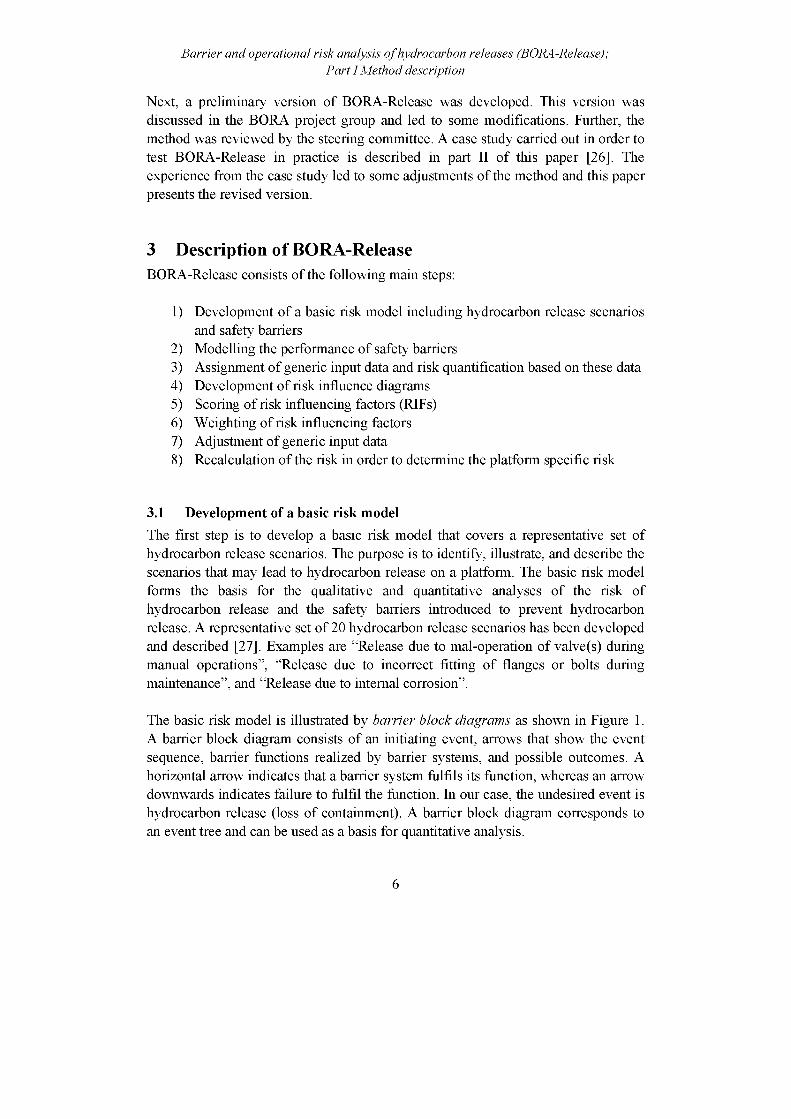
Next, a preliminary version of BORA-Release was developed. This version was discussed in the BORA project group and led to some modifications. Further, the method was reviewed by the steering committee. A case study carried out in order to test BORA-Release in practice is described in part II of this paper [26]. The experience from the case study led to some adjustments of the method and this paper presents the revised version.
Barrier and operational risk analysis of hydrocarbon releases (BORA-Release);Part I Method description
3 Description of BORA-ReleaseBORA-Release consists of the following main steps:
1) Development of a basic risk model including hydrocarbon release scenarios and safety barriers
2) Modelling the performance of safety barriers3) Assignment of generic input data and risk quantification based on these data4) Development of risk influence diagrams5) Scoring of risk influencing factors (RIFs)6) Weighting of risk influencing factors7) Adjustment of generic input data8) Recalculation of the risk in order to determine the platform specific risk
3.1 Development of a basic risk modelThe first step is to develop a basic risk model that covers a representative set of hydrocarbon release scenarios. The purpose is to identify, illustrate, and describe the scenarios that may lead to hydrocarbon release on a platform. The basic risk model forms the basis for the qualitative and quantitative analyses of the risk of hydrocarbon release and the safety barriers introduced to prevent hydrocarbon release. A representative set of 20 hydrocarbon release scenarios has been developed and described [27]. Examples are “Release due to mal-operation of valve(s) during manual operations”, “Release due to incorrect fitting of flanges or bolts during maintenance”, and “Release due to internal corrosion”.
The basic risk model is illustrated by barrier block diagrams as shown in Figure 1. A barrier block diagram consists of an initiating event, arrows that show the event sequence, barrier functions realized by barrier systems, and possible outcomes. A horizontal arrow indicates that a barrier system fulfils its function, whereas an arrow downwards indicates failure to fulfil the function. In our case, the undesired event is hydrocarbon release (loss of containment). A barrier block diagram corresponds to an event tree and can be used as a basis for quantitative analysis.
6
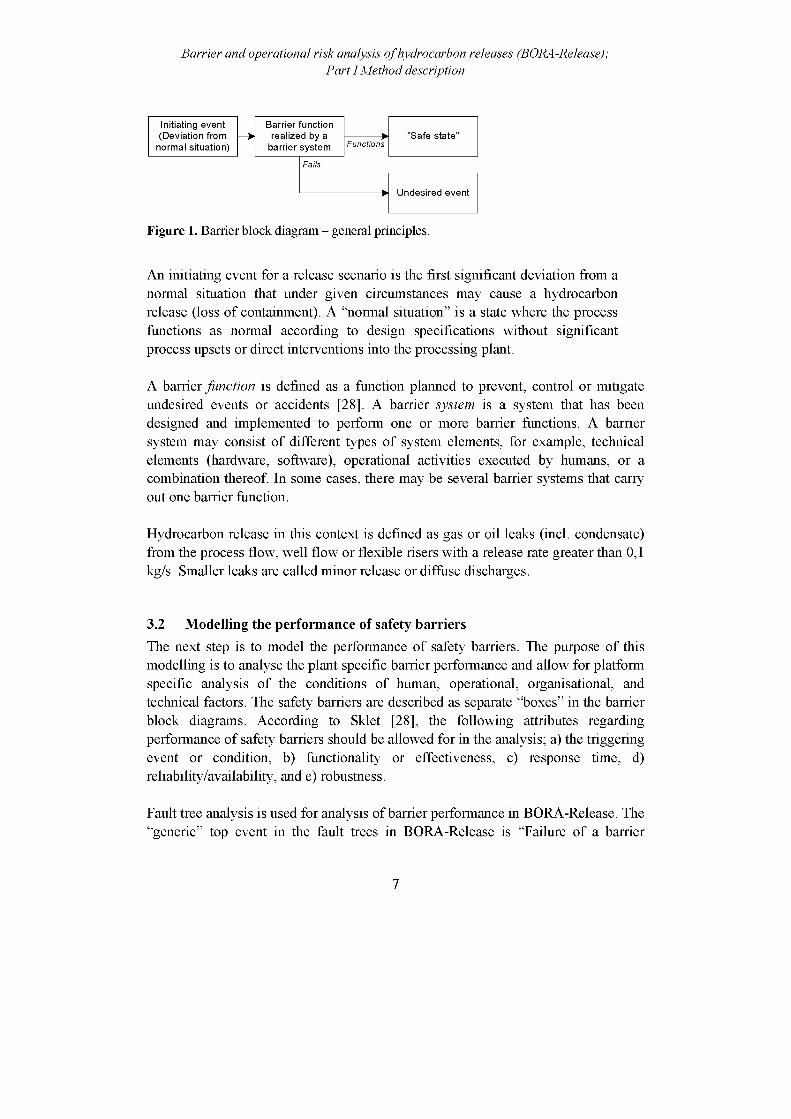
Barrier and operational risk analysis of hydrocarbon releases (BORA-Release);Part I Method description
Functions
Fails
Barrier function realized by a
barrier system
Initiating event (Deviation from
normal situation)’’Safe state”
Undesired event
Figure 1. Barrier block diagram - general principles.
An initiating event for a release scenario is the first significant deviation from a normal situation that under given circumstances may cause a hydrocarbon release (loss of containment). A “normal situation” is a state where the process functions as normal according to design specifications without significant process upsets or direct interventions into the processing plant.
A barrier function is defined as a function planned to prevent, control or mitigate undesired events or accidents [28]. A barrier system is a system that has been designed and implemented to perform one or more barrier functions. A barrier system may consist of different types of system elements, for example, technical elements (hardware, software), operational activities executed by humans, or a combination thereof. In some cases, there may be several barrier systems that carry out one barrier function.
Hydrocarbon release in this context is defined as gas or oil leaks (incl. condensate) from the process flow, well flow or flexible risers with a release rate greater than 0,1 kg/s. Smaller leaks are called minor release or diffuse discharges.
3.2 Modelling the performance of safety barriersThe next step is to model the performance of safety barriers. The purpose of this modelling is to analyse the plant specific barrier performance and allow for platform specific analysis of the conditions of human, operational, organisational, and technical factors. The safety barriers are described as separate “boxes” in the barrier block diagrams. According to Sklet [28], the following attributes regarding performance of safety barriers should be allowed for in the analysis; a) the triggering event or condition, b) functionality or effectiveness, c) response time, d) reliability/availability, and e) robustness.
Fault tree analysis is used for analysis of barrier performance in BORA-Release. The “generic” top event in the fault trees in BORA-Release is “Failure of a barrier
7
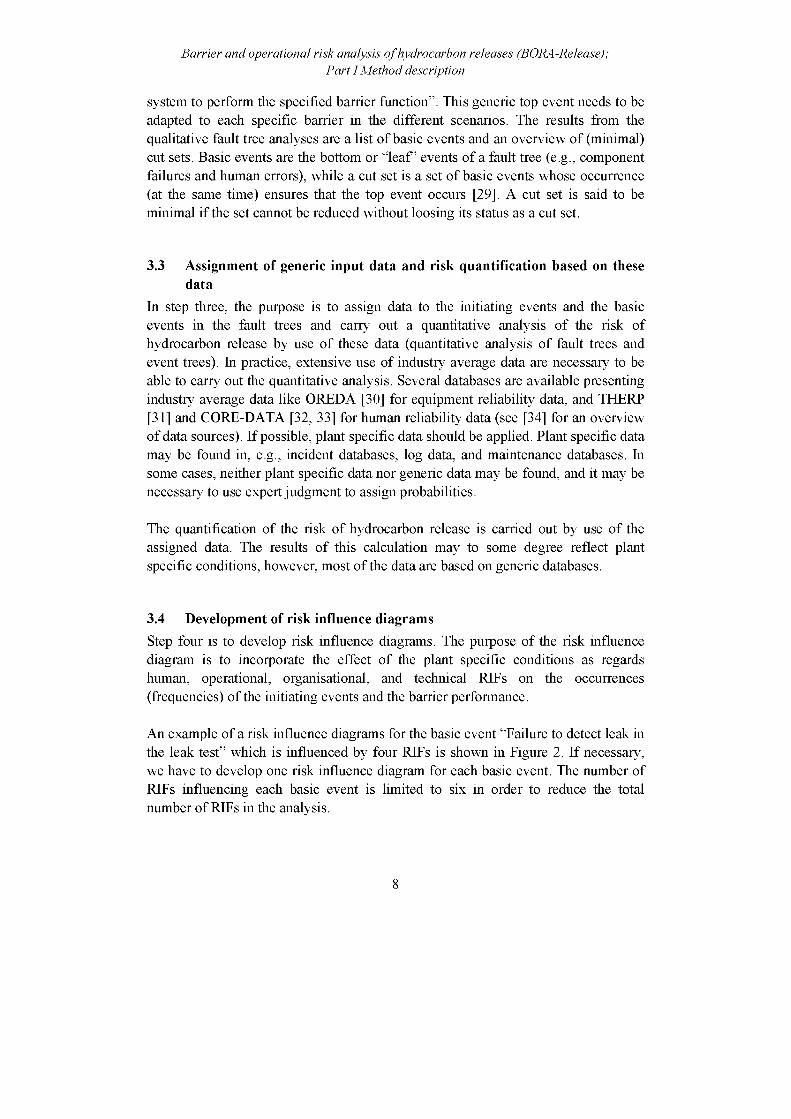
system to perform the specified barrier function”. This generic top event needs to be adapted to each specific barrier in the different scenarios. The results from the qualitative fault tree analyses are a list of basic events and an overview of (minimal) cut sets. Basic events are the bottom or “leaf” events of a fault tree (e.g., component failures and human errors), while a cut set is a set of basic events whose occurrence (at the same time) ensures that the top event occurs [29]. A cut set is said to be minimal if the set cannot be reduced without loosing its status as a cut set.
Barrier and operational risk analysis of hydrocarbon releases (BORA-Release);Part I Method description
3.3 Assignment of generic input data and risk quantification based on these data
In step three, the purpose is to assign data to the initiating events and the basic events in the fault trees and carry out a quantitative analysis of the risk of hydrocarbon release by use of these data (quantitative analysis of fault trees and event trees). In practice, extensive use of industry average data are necessary to be able to carry out the quantitative analysis. Several databases are available presenting industry average data like OREDA [30] for equipment reliability data, and THERP [31] and CORE-DATA [32, 33] for human reliability data (see [34] for an overview of data sources). If possible, plant specific data should be applied. Plant specific data may be found in, e.g., incident databases, log data, and maintenance databases. In some cases, neither plant specific data nor generic data may be found, and it may be necessary to use expert judgment to assign probabilities.
The quantification of the risk of hydrocarbon release is carried out by use of the assigned data. The results of this calculation may to some degree reflect plant specific conditions, however, most of the data are based on generic databases.
3.4 Development of risk influence diagramsStep four is to develop risk influence diagrams. The purpose of the risk influence diagram is to incorporate the effect of the plant specific conditions as regards human, operational, organisational, and technical RIFs on the occurrences (frequencies) of the initiating events and the barrier performance.
An example of a risk influence diagrams for the basic event “Failure to detect leak in the leak test” which is influenced by four RIFs is shown in Figure 2. If necessary, we have to develop one risk influence diagram for each basic event. The number of RIFs influencing each basic event is limited to six in order to reduce the total number of RIFs in the analysis.
8
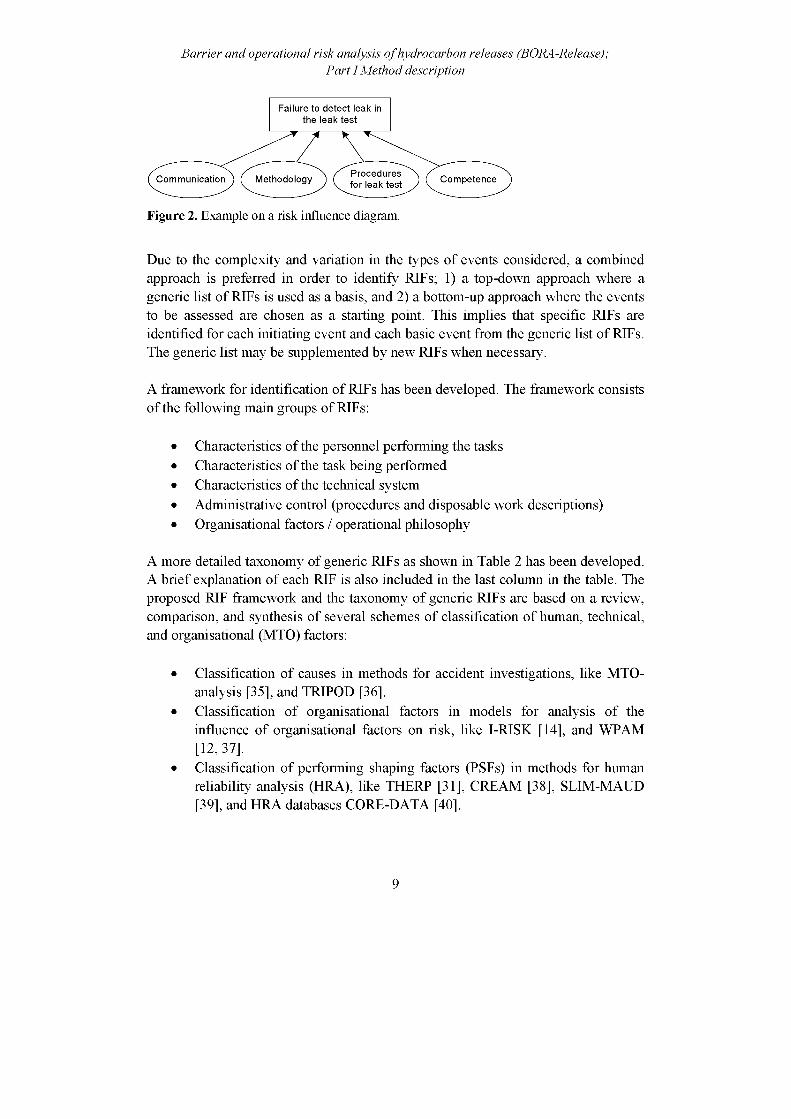
Barrier and operational risk analysis of hydrocarbon releases (BORA-Release);Part I Method description
Failure to detect leak in the leak test
Figure 2. Example on a risk influence diagram.
Due to the complexity and variation in the types of events considered, a combined approach is preferred in order to identify RIFs; 1) a top-down approach where a generic list of RIFs is used as a basis, and 2) a bottom-up approach where the events to be assessed are chosen as a starting point. This implies that specific RIFs are identified for each initiating event and each basic event from the generic list of RIFs. The generic list may be supplemented by new RIFs when necessary.
A framework for identification of RIFs has been developed. The framework consists of the following main groups of RIFs:
• Characteristics of the personnel performing the tasks• Characteristics of the task being performed• Characteristics of the technical system• Administrative control (procedures and disposable work descriptions)• Organisational factors / operational philosophy
A more detailed taxonomy of generic RIFs as shown in Table 2 has been developed. A brief explanation of each RIF is also included in the last column in the table. The proposed RIF framework and the taxonomy of generic RIFs are based on a review, comparison, and synthesis of several schemes of classification of human, technical, and organisational (MTO) factors:
• Classification of causes in methods for accident investigations, like MTO- analysis [35], and TRIPOD [36].
• Classification of organisational factors in models for analysis of the influence of organisational factors on risk, like I-RISK [14], and WPAM [12, 37].
• Classification of performing shaping factors (PSFs) in methods for human reliability analysis (HRA), like THERP [31], CREAM [38], SLIM-MAUD [39], and HRA databases CORE-DATA [40].
9

A draft version of the taxonomy of RIFs was applied and discussed in the case study [26] and three specific RIFs were added to the list of RIFs in Table 2 based on discussions in a workshop with platform personnel.
Barrier and operational risk analysis of hydrocarbon releases (BORA-Release);Part I Method description
Table 2. Descriptions of risk influencing factors.
RIF group RIF RIF descriptionPersonal Competence Cover aspects related to the competence, experience, systemcharacteristics knowledge and training of personnel
Working load / stress Cover aspects related to the general working load on persons (the sum of all tasks and activities)
Fatigue Cover aspects related to fatigue of the person, e.g., due to night shift and extensive use of overtime
Work environment Cover aspects related to the physical working environment like noise, light, vibration, use of chemical substances, etc.
Task Methodology Cover aspects related to the methodology used to carry out acharacteristics specific task.
Task supervision Cover aspects related to supervision of specific tasks by a supervisor (e.g., by operations manager or mechanical supervisor)
Task complexity Cover aspects related to the complexity of a specific task.
Time pressure Cover aspects related to the time pressure in the planning, execution and finishing of a specific task
Tools Cover aspects related to the availability and operability of necessary tools in order to perform a task.
Spares Cover aspects related to the availability of the spares needed to perform the task.
Characteristics Equipment design Cover aspects related to the design of equipment and systemsof the technical such as flange type (ANSI or compact), valve type, etc.system Material properties Cover aspects related to properties of the selected material with
respect to corrosion, erosion. fatigue, gasket material properties, etc.
Process complexity Cover aspects related to the general complexity of the process plant as a whole
HMI (Human Cover aspects related to the human-machine interface such asMachine Interface) ergonomic factors, labelling of equipment, position feedback
from valves, alarms, etc.Maintainability/ Cover aspects related to the maintainability of equipment andaccessibility systems like accessibility to valves and flanges, space to use
necessary tools, etc.System feedback Cover aspects related to how errors and failures are
instantaneously detected, due to alarm, failure to start, etc.
Technical condition Cover aspects related to the condition of the technical system
10
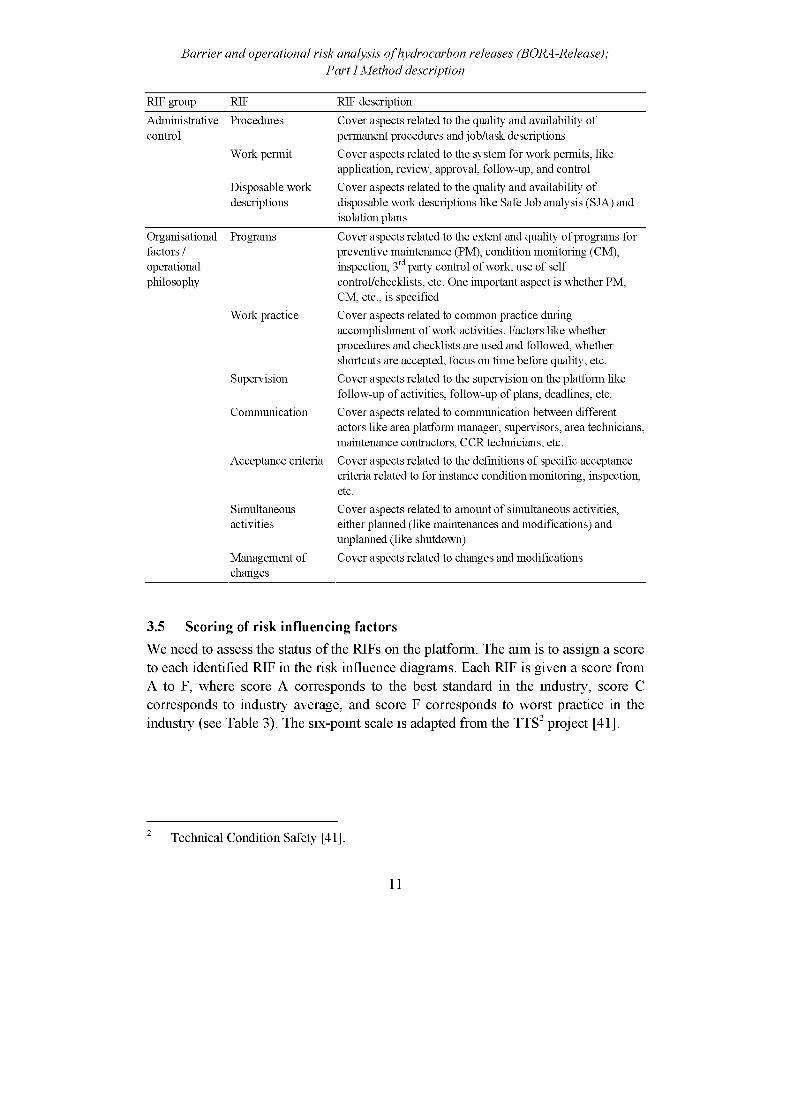
Barrier and operational risk analysis of hydrocarbon releases (BORA-Release);Part I Method description
RIF group RIF RIF descriptionAdministrative Procedures Cover aspects related to the quality and availability ofcontrol permanent procedures and job/task descriptions
Work permit Cover aspects related to the system for work permits, like application, review, approval, follow-up, and control
Disposable work Cover aspects related to the quality and availability ofdescriptions disposable work descriptions like Safe Job analysis (SJA) and
isolation plansOrganisational Programs Cover aspects related to the extent and quality of programs forfactors / preventive maintenance (PM), condition monitoring (CM),operational inspection, 3rd party control of work, use of selfphilosophy control/checklists, etc. One important aspect is whether PM,
CM, etc., is specifiedWork practice Cover aspects related to common practice during
accomplishment of work activities. Factors like whether procedures and checklists are used and followed, whether shortcuts are accepted, focus on time before quality, etc.
Supervision Cover aspects related to the supervision on the platform like follow-up of activities, follow-up of plans, deadlines, etc.
Communication Cover aspects related to communication between different actors like area platform manager, supervisors, area technicians, maintenance contractors, CCR technicians, etc.
Acceptance criteria Cover aspects related to the definitions of specific acceptance criteria related to for instance condition monitoring, inspection,
Simultaneous Cover aspects related to amount of simultaneous activities,activities either planned (like maintenances and modifications) and
unplanned (like shutdown)Management of changes
Cover aspects related to changes and modifications
3.5 Scoring of risk influencing factorsWe need to assess the status of the RIFs on the platform. The aim is to assign a score to each identified RIF in the risk influence diagrams. Each RIF is given a score from A to F, where score A corresponds to the best standard in the industry, score C corresponds to industry average, and score F corresponds to worst practice in the industry (see Table 3). The six-point scale is adapted from the TTS2 project [41].
2 Technical Condition Safety [41].
11
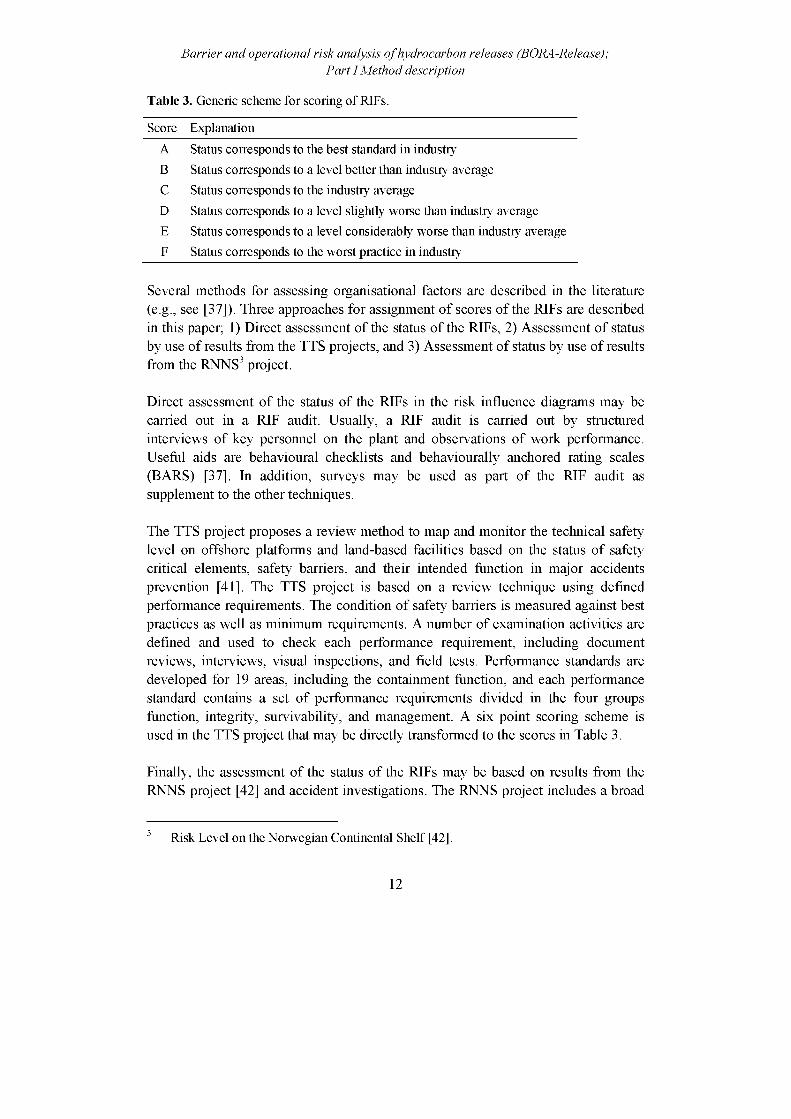
Table 3. Generic scheme for scoring of RIFs.
Score ExplanationA Status corresponds to the best standard in industry B Status corresponds to a level better than industry average C Status corresponds to the industry average D Status corresponds to a level slightly worse than industry averageE Status corresponds to a level considerably worse than industry averageF Status corresponds to the worst practice in industry
Barrier and operational risk analysis of hydrocarbon releases (BORA-Release);Part I Method description
Several methods for assessing organisational factors are described in the literature (e.g., see [37]). Three approaches for assignment of scores of the RIFs are described in this paper; 1) Direct assessment of the status of the RIFs, 2) Assessment of status by use of results from the TTS projects, and 3) Assessment of status by use of results from the RNNS3 project.
Direct assessment of the status of the RIFs in the risk influence diagrams may be carried out in a RIF audit. Usually, a RIF audit is carried out by structured interviews of key personnel on the plant and observations of work performance. Useful aids are behavioural checklists and behaviourally anchored rating scales (BARS) [37]. In addition, surveys may be used as part of the RIF audit as supplement to the other techniques.
The TTS project proposes a review method to map and monitor the technical safety level on offshore platforms and land-based facilities based on the status of safety critical elements, safety barriers, and their intended function in major accidents prevention [41]. The TTS project is based on a review technique using defined performance requirements. The condition of safety barriers is measured against best practices as well as minimum requirements. A number of examination activities are defined and used to check each performance requirement, including document reviews, interviews, visual inspections, and field tests. Performance standards are developed for 19 areas, including the containment function, and each performance standard contains a set of performance requirements divided in the four groups function, integrity, survivability, and management. A six point scoring scheme is used in the TTS project that may be directly transformed to the scores in Table 3.
Finally, the assessment of the status of the RIFs may be based on results from the RNNS project [42] and accident investigations. The RNNS project includes a broad
3 Risk Level on the Norwegian Continental Shelf [42].
12
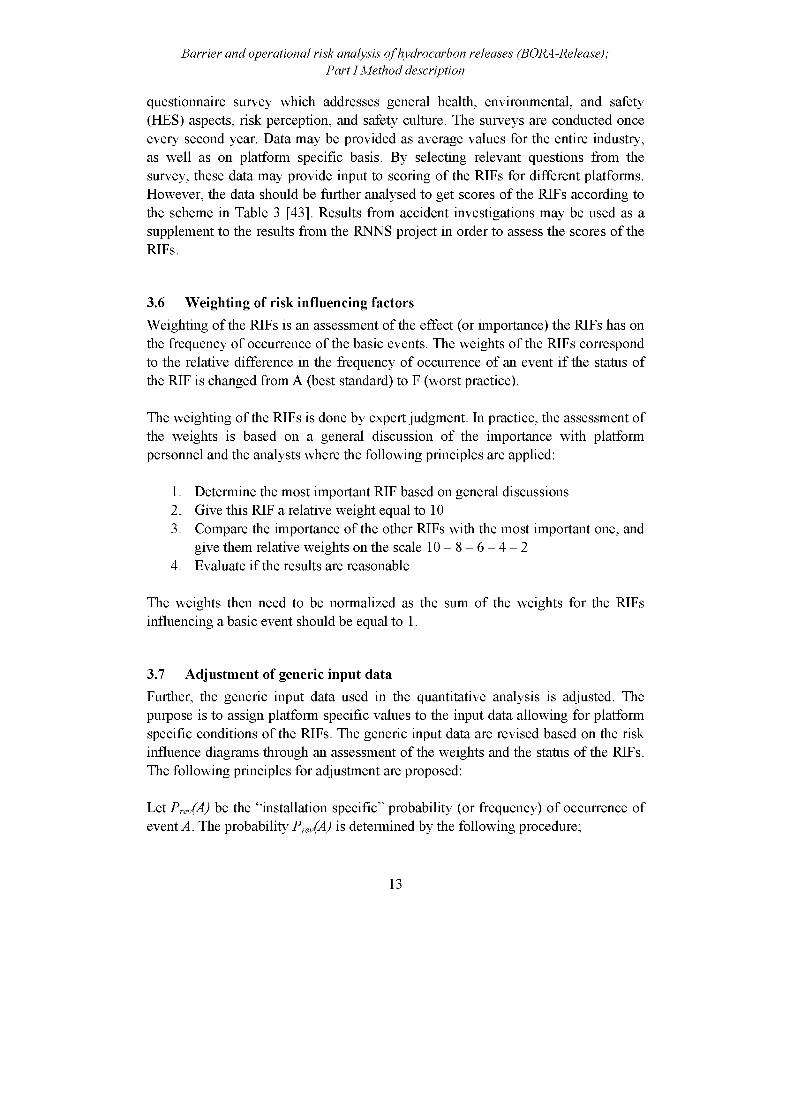
questionnaire survey which addresses general health, environmental, and safety (HES) aspects, risk perception, and safety culture. The surveys are conducted once every second year. Data may be provided as average values for the entire industry, as well as on platform specific basis. By selecting relevant questions from the survey, these data may provide input to scoring of the RIFs for different platforms. However, the data should be further analysed to get scores of the RIFs according to the scheme in Table 3 [43]. Results from accident investigations may be used as a supplement to the results from the RNNS project in order to assess the scores of the RIFs.
Barrier and operational risk analysis of hydrocarbon releases (BORA-Release);Part I Method description
3.6 Weighting of risk influencing factorsWeighting of the RIFs is an assessment of the effect (or importance) the RIFs has on the frequency of occurrence of the basic events. The weights of the RIFs correspond to the relative difference in the frequency of occurrence of an event if the status of the RIF is changed from A (best standard) to F (worst practice).
The weighting of the RIFs is done by expert judgment. In practice, the assessment of the weights is based on a general discussion of the importance with platform personnel and the analysts where the following principles are applied:
1. Determine the most important RIF based on general discussions2. Give this RIF a relative weight equal to 103. Compare the importance of the other RIFs with the most important one, and
give them relative weights on the scale 10 - 8 - 6 - 4 - 24. Evaluate if the results are reasonable
The weights then need to be normalized as the sum of the weights for the RIFs influencing a basic event should be equal to 1.
3.7 Adjustment of generic input dataFurther, the generic input data used in the quantitative analysis is adjusted. The purpose is to assign platform specific values to the input data allowing for platform specific conditions of the RIFs. The generic input data are revised based on the risk influence diagrams through an assessment of the weights and the status of the RIFs. The following principles for adjustment are proposed:
Let Prev(A) be the “installation specific” probability (or frequency) of occurrence of event A. The probability Prev(A) is determined by the following procedure;
13
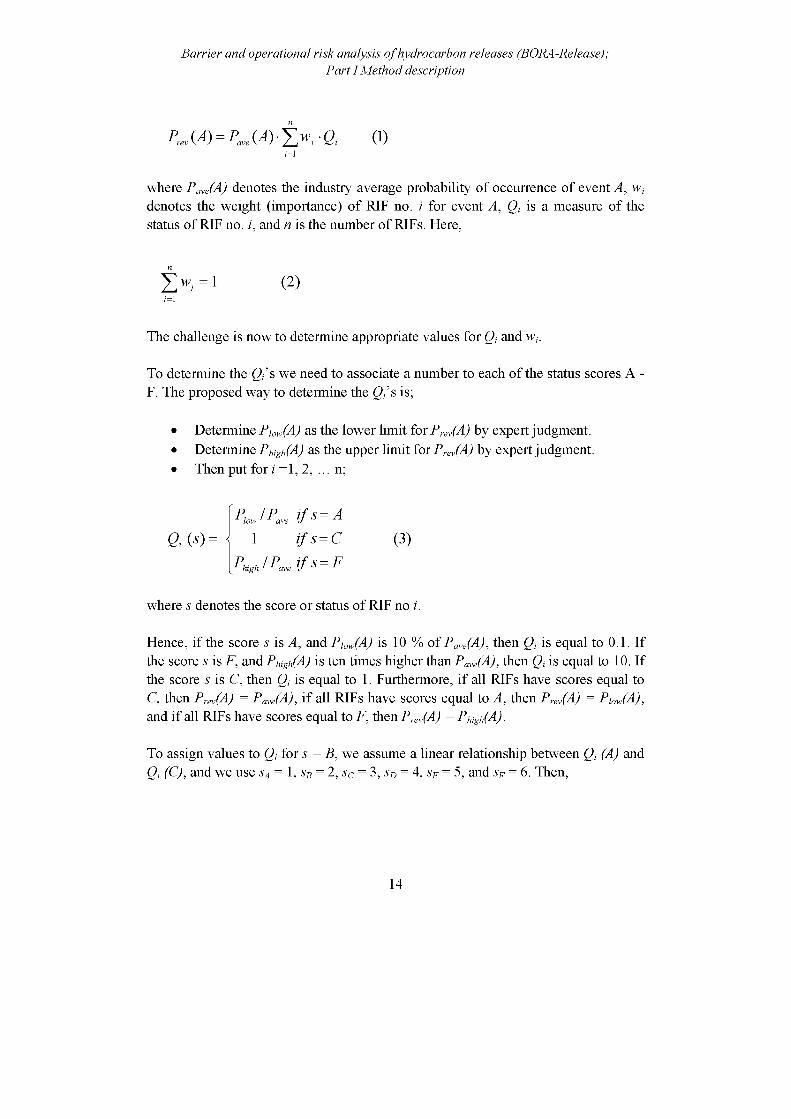
Barrier and operational risk analysis of hydrocarbon releases (BORA-Release);Part I Method description
P„, (A) = P_ (A) Wi ■ Qi (1)i=1
where Pcve(A) denotes the industry average probability of occurrence of event A, wi
denotes the weight (importance) of RIF no. i for event A, Qi is a measure of the status of RIF no. i, and n is the number of RIFs. Here,
i Wi= 1 (2)i =1
The challenge is now to determine appropriate values for Qi and wi.
To determine the Q/s we need to associate a number to each of the status scores A - F. The proposed way to determine the Q/s is;
• Determine Plow(A) as the lower limit for Prev(A) by expert judgment.• Determine Phigh(A) as the upper limit for Prev(A) by expert judgment.• Then put for i =1, 2, ... n;
Qi (s)/PL fs = A
< 1 if s = C
Pgh/ f s = F(3)
where s denotes the score or status of RIF no i.
Hence, if the score s is A, and Pow(A) is 10 % of Pave(A), then Qi is equal to 0.1. If the score s is F, and Phigh(A) is ten times higher than Pcn,e(A), then Qi is equal to 10. If the score s is C, then Qi is equal to 1. Furthermore, if all RIFs have scores equal to C, then Prev(A) = Pave(A), if all RIFs have scores equal to A, then Prev(A) = Pow(A), and if all RIFs have scores equal to F, then Prev(A) = Phigh(A).
To assign values to Qi for s = B, we assume a linear relationship between Qi (A) andQi (C), and we use sA = 1, sb = 2, sc = 3, sd = 4, se = 5, and sF = 6. Then,
14
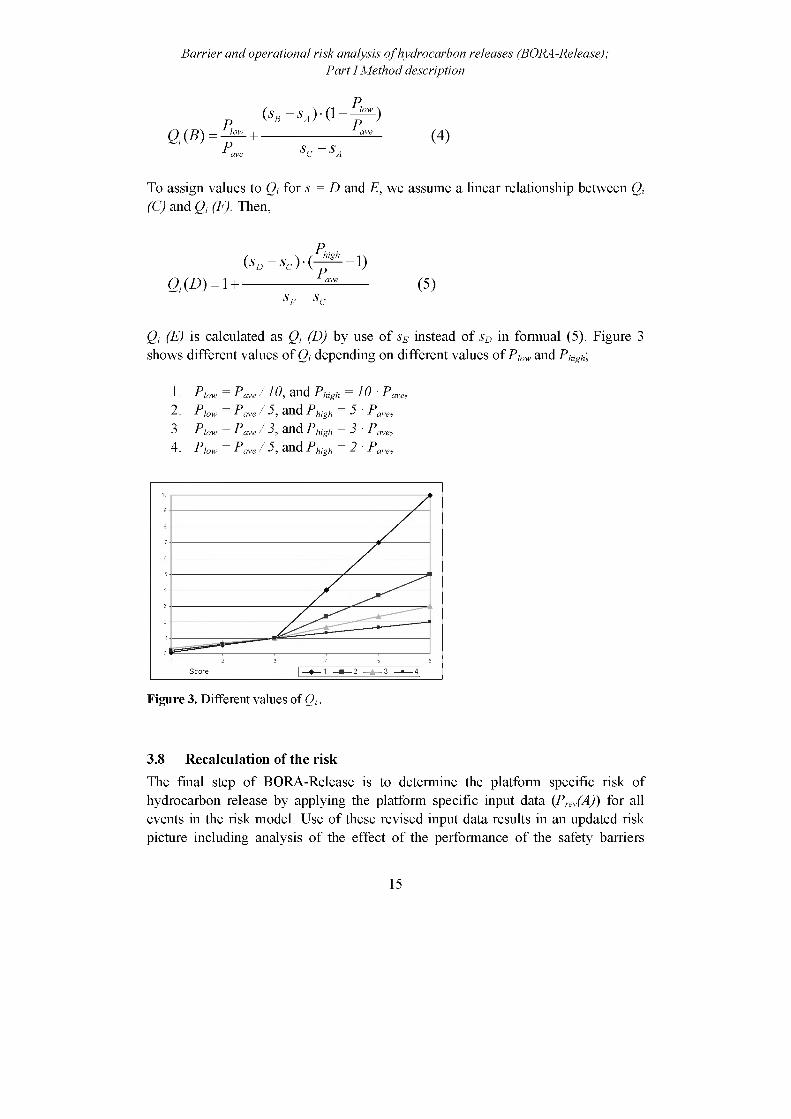
Barrier and operational risk analysis of hydrocarbon releases (BORA-Release);Part I Method description
OiB) (4)
To assign values to <9, for v 1) and E, we assume a linear relationship between O, (() and Qt (F). Then,
(SD
0,(D) = 1 + — sF sc (5)
Qj (E) is calculated as O, (D) by use of sE instead of sD in formual (5). Figure 3 shows different values of O, depending on different values of Piow and Phigh,
1. P2. P3. P4. P
Piwe 10, and Phigh 10 ' PLiyc.Pcn’e f 2- and Phigh 2 1 \.. . -Pcn’e f 3, and Phigh 3 1 \.. . -Pcn’e f 3, and Phigh 2 1 \.. . -
Figure 3. Different values of Oh.
3.8 Recalculation of the risk
The final step of BORA-Release is to determine the platform specific risk of hydrocarbon release by applying the platform specific input data (Pie/Aj) for all events in the risk model. Use of these revised input data results in an updated risk picture including analysis of the effect of the performance of the safety barriers
15

introduced to prevent hydrocarbon release. The revised risk picture takes the platform specific conditions of technical, human, operational, and organisational RIFs into consideration.
Barrier and operational risk analysis of hydrocarbon releases (BORA-Release);Part I Method description
4 DiscussionThe discussion is divided in three main parts. The first part contains a discussion of the different steps in BORA-Release. Part two contains a discussion to what extent the criteria presented in section 2 are fulfilled, while application areas of BORA- Release are discussed in part three.
4.1 Discussion of BORA-Release Development of a basic risk model
The basic risk model developed as part of BORA-Release may be seen as an extended QRA-model compared to the current status of QRA for three reasons:
1. It facilitates a detailed modelling of loss of containment including initiating events reflecting different causal factors of hydrocarbon release and safety barriers introduced to prevent release
2. The risk model incorporates different operational barriers such as use of self control of work/checklists, 3rd party control of work, and inspection to detect corrosion
3. Event trees and fault trees are linked together in one common risk model
No analysis of causal factors of hydrocarbon release is carried out in existing QRA, but the calculation of the release frequency is based on a combination of counting of process equipment and historic leak frequencies for the different equipment categories. In some cases, platform specific release statistics are used for updating of the QRA. Development of a risk model with a set of hydrocarbon release scenarios and RIFs answers the criticism formulated by e.g., Kafka [44] that the existing QRA are not suitable for analysing the effect of the most effective safety measures to avoid initiating events.
Combination of barrier block diagrams/event trees and fault trees is an attractive modelling technique as barrier block diagrams makes it possible to give a clear and consistent representation and illustration of the different barrier systems that fulfil the defined barrier functions introduced to prevent hydrocarbon release. The approach enables a separate analysis of each barrier at the desired level of detail. The barrier block diagrams may be generic for several platforms, however, the
16

detailed analysis of the different safety barriers may be platform specific. A challenge for some scenarios is to define the initiating events in such a way that they are suitable for quantitative analysis.
Barrier and operational risk analysis of hydrocarbon releases (BORA-Release);Part I Method description
Modelling the performance of safety barriers
BORA-Release is based on a broad view on safety barriers, which means that the performance of different types of safety barriers like the process shutdown system, 3rd party control of work, and the inspection program need to be analysed.
The chosen method for analysis of the performance of safety barriers is fault tree analysis. The fault trees are linked to the event trees in one common risk model. The fault tree analysis will not necessarily cover all attributes relevant for analysis of the barrier performance, and there may be need to carry out other analysis (e.g., human reliability analysis (HRA), analysis of fire and explosion loads, impairment analysis, and qualitative assessments of barrier functionality). As part of the case study, another approach was used to analyse the effectiveness of the inspection barrier (see [26] for further details).
Assignment of generic input data and risk quantification based on these data
Assignment of generic input data implies use of generic databases in addition to extraction of platform specific information regarding operational conditions, experience from surveillance of operational activities, and testing of technical systems. Recovery of data from internal databases or surveillance systems may require extensive manual work and often some interpretations of the recorded data may be necessary. Due to the novelty of the modelling of the containment, relevant data are lacking for some barriers. The availability of relevant human reliability data are low, as there is need for collection of data to support the analysis. Alternatively, some expert judgment sessions may be carried out in order to generate relevant data.
Development of risk influence diagrams
A combination of a top-down approach and a bottom-up approach is used to develop risk influence diagrams. The top-down approach by using a predetermined framework for identification of RIFs ensures that the RIFs are identified and defined in the same manner in different analysis, while the bottom-up approach ensures that unique RIFs for specific plants are identified and assessed. To reduce the total number of RIFs in the overall analysis, a maximum of six RIFs are allowed for each basic event.
17

The framework used to identify RIFs and develop risk influence diagram consists of characteristics of the personnel, the task, the technical system, administrative control, and organisational factors/operational conditions. The framework is based on a review, comparison, and synthesis of several schemes of classification of MTO- factors. While traditional performance influence factors (PIFs) as reviewed by Kim and Jung [45] focuses on factors influencing human failure events, the RIF framework presented in subsection 3.4 also includes factors influencing hardware (system/component) failure events (e.g., material properties and program for preventive maintenance).
However, the main groups in the RIF framework are similar to a model of the task context of nuclear power plants described by Kim and Jung [45]. The main difference is that we have defined an additional group called administrative control including for example procedures, as Kim and Jung [45] include as part of the task. Further, we have defined organisational factors/operational conditions as a separate group (and not as part of the environment).
Experience from the case study indicates that the main groups in the framework are adequate for identification of RIFs. But the list of generic RIFs in Table 2 may be supplemented by more RIFs to cover all the basic events included in the analyses of barrier performance. This implies that the list of generic RIFs may be a “living” document that may be revised due to more experience by use of the list.
Scoring of risk influencing factors
A six-point score scheme is used for assignment of scores to the RIFs and the scores are related to different levels in the industry. Three anchor points are defined where score A corresponds to the best standard in the industry, score C corresponds to the industry average standard, and score F corresponds to the worst practice in the industry. The rationale behind is that industry average data reflects the industry average standard as regards status of the RIFs. The argument for the misalignment of the scores (A and B better than average, and D, E, and F worse than average) is that the existing safety level within the industry is so high that the potential for declining in the status is greater than the improvement potential.
Three approaches for giving scores to the RIFs are described. The approaches may be used separately, or combined in order to assign scores. The first approach, direct assessment of the status of the RIFs by a RIF-audit is the most resource demanding approach. However, this approach may ensure a high validity4 of the assignment of
Barrier and operational risk analysis of hydrocarbon releases (BORA-Release);Part I Method description
4 Validity refers to whether or not it measures what it is supposed to measure. [46]
18
scores since the assessment of the specific RIFs is based on the risk influence diagrams developed for each basic event. There is demand for development of aids for execution of RIF audits, e.g., BARS with description of the reference levels for scoring. Such aids will contribute to better consistence of the assignment of scores.
The second approach, assessment of status by use of results from the TTS projects, uses existing data from a project carried out for several platforms on the Norwegian Continental Shelf (NCS) so the use of resources will be limited. The scoring scheme used in the TTS project also consists of a six-point scale, but the scores are related to some performance criteria and not to the industry average level. However, the TTS scores may be transformed to the BORA scores. There are some disadvantages of this approach. The TTS projects are not carried out for all platforms on the NCS. The main focus in the project is the status of technical aspects of the consequence reducing barriers so limited knowledge may be collected about the organisational factors. The TTS assessment may be carried out several years before the actual analysis as the time aspect may cause that the data to be out-of-date. Finally, the relevance of the data may be questionable since the original assessments have been performed for another purpose. Thus, the results should be interpreted prior to use.
The third approach, use of results from the RNNS survey and accident investigations has been applied during the case study. The main advantage is the availability of platform specific results form the survey on all platforms on the NCS. However, there are several disadvantages with this approach. The main disadvantage is the low validity since the scores are assigned based on questions from a questionnaire not developed for this purpose where the questions are rather general and not specific for the specific RIFs. As an example, the RIF “Time pressure” will be given the same score for all activities on the platform regardless of who, when, or where the activity is carried out. The survey is carried out every second year as the results from the last survey may not be up to date when the data are applied. The last aspect is that the answers in the survey may be influenced by other factors, e.g., general dissatisfaction with the working conditions not relevant for the analysed RIF.
The credibility of the status assessment is one important aspect to consider when selecting approach for scoring of RIFs. As a rule of thumb, we may say that more specific, detailed, and resource demanding the assessment of the RIF status are, the more credible are the results. However, the use of resources should be balanced against the argument from the representatives from the oil companies that it is important to use existing data in order to minimize the use of resources.
Barrier and operational risk analysis of hydrocarbon releases (BORA-Release);Part I Method description
19

Weighting of risk influencing factors
A rather simple technique for weighting of RIFs by use of expert judgment is proposed. The weighting process is easy to carry out in practice. The results from the weighting process are unambiguous, and the traceability is good.
An important aspect of the identification, scoring, and weighting of RIFs is the involvement of operational personnel working on the platform. Nobody is as competent as the operational personnel to carry out these steps. However, a risk analyst knowing the methodology should guide the operational personnel through the weighting process.
Adjustment of average data
The revised probabilities of occurrences of the basic events are calculated as a sum of products of the scores and the normalized weights of the relevant RIFs for each basic event multiplied with the generic input data. The upper (Phigh) and lower (Plow) values act as anchor values and contribute to credibility of the results. A wide range implies the possibility for major changes in the risk level, while a small range implies minor changes in the risk level. The upper and lower limits may be established by expert judgment or by use of the upper and lower limits presented in the generic databases (e.g., OREDA and THERP).
As illustrated in Figure 3, a linear relationship is assumed between Qi(A) and Qi(C), and Qi(C) and Qi(F) respectively. Other relationships may be assumed here. Figure 3 illustrates another important aspect of the method, that the risk improvement potential is less than the risk worsening potential. This aspect may be explained by the existing low risk level due to high focus on risk reduction measures for several years.
Recalculation of the risk
The final step of BORA-Release, recalculation of the risk in order to calculate the platform specific risk by use of revised platform specific data, is easy to execute when the other steps have been carried out. The revised hydrocarbon release frequency takes platform specific conditions as regards technical, human, operational, as well as organisational RIFs into consideration. In addition, the effect of the performance of safety barriers introduced to prevent hydrocarbon releases is included in the results.
The recalculated risk picture gives valuable input to decision-makers. Some areas of application of BORA-Release are discussed in subsection 4.3. The improved knowledge about existing and non-existing safety barriers, and better understanding
Barrier and operational risk analysis of hydrocarbon releases (BORA-Release);Part I Method description
20
of the influence of RIFs (i.e., the qualitative analysis) are important results in itself independent of the quantitative results.
Barrier and operational risk analysis of hydrocarbon releases (BORA-Release);Part I Method description
4.2 Fulfilment of criteriaThe extent of fulfilment of the set of criteria presented in section 2 is discussed in the following. The first criterion treated identification and illustrations of safety barriers introduced to prevent hydrocarbon release. Use of barrier block diagrams evidently facilitates identification and illustration of safety barriers. During the case studies, the illustrations of the safety barriers by barrier block diagrams were very useful in the discussions with operational personnel.
A risk model that consists of a combination of barrier block diagrams/event trees, fault trees, and risk influence diagrams allows inclusion of technical, human, operational, as well as organisational elements. Further, graphical illustrations are important elements of barrier block diagrams/event trees, fault trees, as well as risk influence diagrams that make them well suited for use in presentations and discussions that will increase the understanding of RIFs and criterion two is fulfilled. The qualitative analysis of the scenarios is an important result from the total analysis.
BORA-Release fulfil criterion three because it allows for analysis of technical failures and human errors as initiating events, as well as analysis of technical, human, and operational barriers. For further illustrations of analysis of different causes reference is made to the overview of release scenarios presented by Sklet [27].
Use of event trees, fault trees, and risk influence diagram also fulfil the fourth criterion regarding quantification of the frequency of initiating events and the performance of the safety barriers. Rather small fault trees were developed for quantitative analysis of the barrier performance in the release scenarios analysed in the case study. However, it may be necessary to develop larger and more complex fault trees for safety barriers included in other release scenarios. With respect to use of other methods, see the discussion of step three of BORA-Release.
A problem may arise in respect to the availability of relevant input data (criterion five). To be able to use relevant input data it may be necessary to collect new types of data. Especially within the field of human reliability data it seems to lack relevant data from the offshore field. Some data on a limited set of activities has been
21
collected on the British sector [32, 33], but it has been necessary to use data from the nuclear industry in the case study.
The focus of the next criterion is consideration of different activities, phases, and conditions in the analysis. So far, the focus has been on failures introduced during normal production, maintenance, shutdown, and start-up within the operational phase of the life-cycle of a platform, and safety barriers introduced to prevent releases due to such failures. Latent failures from the design phase and safety barriers aimed to prevent such failures has not been analysed.
Criterion seven states that the method should enable identification of common causes and dependencies. This aspect is taken into account in Section 5.
Criterion eight deals with practical applicability with respect to use of resources. Unfortunately, to carry out a comprehensive analysis of the complex reality in a process plant is resource demanding. If the analysis shall give adequate support during the decision-making process the level of detail of the analysis need to reflect the reality on the platform. However, it may be possible to carry out less comprehensive analysis of specific problem areas on the platform with less use of resources.
The last criterion states that the method shall provide a basis for “re-use” of the generic model. If a generic risk model is developed, it will be manageable to carry out some installation specific considerations about the status on each platform, and to carry out simple comparisons with other platforms (e.g., practice regarding operational barriers as third party control of work or status of the RIFs).
Barrier and operational risk analysis of hydrocarbon releases (BORA-Release);Part I Method description
4.3 Application of BORA-ReleaseBORA-Release is a method for qualitative and quantitative analysis of the platform specific hydrocarbon release frequency on oil and gas production platforms. BORA- Release makes it possible to analyse the effect of safety barriers introduced to prevent hydrocarbon release and allows considerations of platform specific conditions of technical, human, operational, and organisational RIFs. The method may be used to analyse the plant specific frequency of loss of containment in other types of process plants. Application of BORA-release to analyse the frequency of loss of containment gives a more detailed risk picture than traditional QRA where no analysis is made of causal factors of loss of containment.
22
The qualitative analysis of the release scenarios including the safety barriers generates knowledge about factors influencing the frequency of hydrocarbon release within the process plant even though no quantitative analysis is carried out. This knowledge may support decisions of importance for the future performance of the safety barriers.
Although BORA-Release may be used to calculate platform specific hydrocarbon release frequencies, the main area of application is not the release frequency itself, but use of the model to assess the effect of risk reducing measures and risk increasing changes during operations. Sensitivity analysis may be carried out in order to analyse the effect of changes in technical, human, operational, as well as organisational RIFs. Focus on relative changes in the release frequency instead of absolute numbers may increase the credibility to the results. In addition, the effect of introduction of new safety barriers may be analysed. The results from a case study where BORA-Release was used to analyse several release scenarios showed that the model is useful to analyse the effect of different risk reducing measures [26].
Barrier and operational risk analysis of hydrocarbon releases (BORA-Release);Part I Method description
5 Conclusions and further workThis paper presents BORA-Release, a method for qualitative and quantitative analyses of the platform specific hydrocarbon release frequency. The method makes it possible to analyse the effect on the release frequency of safety barriers introduced to prevent hydrocarbon release, and platform specific conditions of technical, human, operational, and organisational RIFs.
The case study [26] demonstrates that the method is useful in practice. Personnel from the actual oil company considered the results from some of the scenarios useful since they got more knowledge about safety barriers introduced to prevent hydrocarbon releases and the RIFs influencing the performance of these barriers. The results from the qualitative analysis were considered to be as useful as the quantitative results. BORA-Release ought to be applied in additional case studies in order to conclude whether or not it is cost-effective to apply the method in an overall analysis. It is resource demanding to perform such an analysis due to the complexity of oil and gas production platforms.
There is still need for further research focusing on some of the steps in BORA- Release. The main challenge is the scoring of the RIFs. Further work will be carried out in order to assess whether the results from the TTS project may be used, or if it is necessary to perform specific RIF-audits. In the latter case, it may be necessary to
23

develop behaviourally anchored rating scales (BARS) or similar aids that may be used as basis for the RIF-audits.
Lack of relevant data, especially for human error probabilities on offshore platforms is a challenge. There may be need for collecting new types of data that are not available in existing databases. However, collection of data are resource demanding and it may be difficult to initiate such projects.
A high number of RIFs are listed in Table 2. Further work should be initiated in order to improve the descriptions and assess whether the total number of RIFs may be reduced, e.g., by combining two of the RIFs into one new RIF.
Events in BORA-Release are considered independent conditional of the RIFs. Independence could be questioned, however, it is likely to be sufficiently accurate from a practical point of view.
There may be interaction effects among the RIFs influencing one basic event. Interaction effects mean that a RIF will have a different effect on the basic event, depending on the status of another RIF (positive correlation), e.g., if the competence of personnel is poor, it will be even more serious if the quality of procedures also is poor. A simple approach is suggested for analysis of interaction effects among RIFs in BORA-Release. If two or more RIFs are assumed to interact, and the status are worse than average (D, E, or F), the score of one of them is reduced one category (e.g., from D to E). Similarly, if the scores of two interacting RIFs are better than average, the score of one of the RIFs is increased one category (from B to A). However, more sophisticated methods should be assessed as part of future research, e.g., use of Bayesian belief networks to more accurately model the interactions between the RIFs (see e.g., [20]).
Development of a risk model including safety barriers that may prevent, control, or mitigate accident scenarios with in-depth modelling of barrier performance allows explicit modelling of functional common cause failures (e.g., failures due to functional dependencies on a support system). However, further research will be carried out to assess the effect of residual common cause failures that may lead to simultaneous failures of more than one safety barrier, for example errors introduced during maintenance (e.g., calibration) that may cause simultaneous failures of several types of detectors (e.g., gas detectors and fire detectors).
One basis for BORA-Release is the assumption that the average standard of RIFs corresponds to generic input data and better standard on the RIFs than average lead
Barrier and operational risk analysis of hydrocarbon releases (BORA-Release);Part I Method description
24

to a lower probability of occurrence of the basic events. This assumption seems to be realistic where generic data from the offshore industry exists. However, there are needs for further discussions whether the adjustment of human error probabilities should be based on scores of the RIFs related to the average standard in the North Sea or whether traditional assessment of performance shaping factors applied in human reliability analysis should be applied (adjustment of nominal human error probabilities by assessment of task specific performance shaping factors).
Only a limited sample of the release scenarios described by Sklet [27] have been analysed quantitatively so far. Further work will be carried out in the BORA-project in order to analyse quantitatively some of the release scenarios not included in the first case study. In addition, further work will be carried out in order to link the model of the hydrocarbon release scenarios to the traditional QRA model that includes analysis of the consequence reducing barriers.
Barrier and operational risk analysis of hydrocarbon releases (BORA-Release);Part I Method description
6 AcknowledgementThe development of BORA-Release has been carried out as part of the BORA- project financed by the Norwegian Research Council, The Norwegian Oil Industry Association, and Health and Safety Executive in UK. The authors acknowledge personnel from the steering committee that have commented on the preliminary version of BORA-Release.
7 References[1] Hopkins, A., Lessons from Longford: the Esso gas plant explosion, CCH
Australia Ltd, Sydney, 2000.[2] Cullen, W. D., The public inquiry into the Piper Alpha disaster, Hmso, London,
1990.[3] Vaughan, D., The Challenger launch decision : risky technology, culture, and
deviance at NASA, University of Chicago Press, Chicago, 1996.[4] CAIB, The Colombia Accident Investigation Board Report - Volume 1,
http://www.caib.us/. 2003.[5] NOU, Astaulykken, 4. januar 2000., Justis- og politidepartementet, Oslo,
Norge, 2000.[6] Cullen, W. D., The Ladbroke Grove Rail Inquiry: Report, Part 1, HSE Books,
United Kingdom, 2001.[7] Sklet, S., Storulykker i Norge de siste 20 arene, In Lydersen, S. (eds), Fra flis i
fingeren til ragnarok, Tapir Akademisk Forlag, Trondheim, 2004.
25

[8] Vinnem, J. E., Aven, T., Hundseid, H., Vassmyr, K. A., Vollen, F. and 0ien, K., Risk assessments for offshore installations in the operational phase, ESREL 2003, Maastricht, The Netherlands, 2003.
[9] Pitblado, R. M., Williams, J. C. and Slater, D. H., Quantitative Assessment of Process Safety Programs, Plant/Operations Progress. 9, 3 (1990).
[10] Embrey, D. E., Incorporating management and organisational factors into probabilistic safety assessment, Reliability Engineering and System Safety. 38,1-2 (1992) 199 - 208.
[11] Modarres, M., Mosleh, A. and Wreathall, J. A., Framework for assessing influence of organisation on plant safety, Reliability Engineering & System Safety. 45 (1994) 157 - 171.
[12] Davoudian, K., Wu, J.-S. and Apostolakis, G. E., Incorporating organisational factors into risk assessment through the analysis of work processes, Reliability Engineering and System Safety. 45 (1994) 85-105.
[13] Davoudian, K., Wu, J.-S. and Apostolakis, G. E., The work process analysis model (WPAM-II), Reliability Engineering and System Safety. 45 (1994) 107 - 125.
[14] Bellamy, L. J., Papazoglou, I. A., Hale, A. R., Aneziris, O. N., Ale, B. J. M., Morris, M. I. and Oh, J. I. H., I-RISK - Development of an Integrated Technical and Management Risk Control and Monitoring Methodology for Managing and Quantifying On-Site and Off-Site Risks. Main Report. Contract No: ENVA- CT96-0243, 1999.
[15] Papazoglou, I. A., Aneziris, O. N., Post, J. G. and Ale, B. J. M., Technical modeling in integrated risk assessment of chemical installations, Journal of Loss Prevention in the Process Industries. 15, 6 (2002) 545 - 554.
[16] Papazoglou, I. A., Bellamy, L. J., Hale, A. R., Aneziris, O. N., Post, J. G. and Oh, J. I. H., I-Risk: development of an integrated technical and Management risk methodology for chemical installations, Journal of Loss Prevention in the Process Industries. 16 (2003) 575 - 591.
[17] Mosleh, A. and Goldfeiz, E. B., An Approach for Assessing the Impact of Organisational Factors on Risk, Technical research report, CTRS, A. James Clark School of Engineering, University of Maryland at College Park, 1996.
[18] Murphy, D. M. and Pate-Cornell, E. M., The SAM Framework: Modeling the Effects of Management Factors on Human Behavior in Risk Analysis, Risk Analysis. 16, 4 (1996).
[19] Pate-Cornell, E. M. and Murphy, D. M., Human and management factors in probabilistic risk analysis: the SAM approach and observations from recent applications, Reliability Engineering and System Safety. 53 (1996) 115 - 126.
[20] 0ien, K., A framework for the establishment of organizational risk indicators, Reliability Engineering & System Safety. 74, 2 (2001) 147-167.
Barrier and operational risk analysis of hydrocarbon releases (BORA-Release);Part I Method description
26
[21] 0ien, K. and Sklet, S., Organisatoriske risikoindikatorer Pilotstudie Stall]ord A, SINTEF-report STF38 A00421, SINTEF, Trondheim, Norway, 2000.
[22] Andersen, H , Casal, J., Dandrieux, A., Debray, B , De Dianous, V , Duijm, N. J., Delvosalle, C , Fievez, C , Goossens, F., Gowland, R. T., Hale, A. J., Hourtolou, D., Mazzarotta, B , Pipart, A., Planas, E., Prats, F., Salvi, O. and Tixier, J., ARAMIS - User Guide, EC Contract number EVG1-CT-2001-00036, 2004.
[23] PSA, Regulations relating to management in the petroleum activities (The Management Regulations). 3 September 2001, Petroleum Safety Authority Norway, Stavanger, 2001.
[24] Vinnem, J. E., Aven, T., Hauge, S., Seljelid, J. and Veire, G, Integrated Barrier Analysis in Operational Risk Assessment in Offshore Petroleum Operations, PSAM7 - ESREF'04, Berlin, 2004.
[25] 0ien, K., A Focused Fiterature Review of Organizational Factors' Effect on Risk. Paper II in the Doctoral thesis Risk Control of Offshore Installations, NTNU, Trondheim, Norway, 2001.
[26] Sklet, S., Vinnem, J. E. and Aven, T., Barrier and operational risk analysis of hydrocarbon releases (BORA-Release); Part II Results from a case study, Journal of Hazardous Materials. Submitted for publication (2005).
[27] Sklet, S., Hydrocarbon releases on oil and gas production platforms; Release scenarios and safety barriers, Journal of Foss Prevention in the Process Industries. Accepted for publication (2005).
[28] Sklet, S., Safety barriers; definition, classification, and performance, Journal of Foss Prevention in the Process Industries. Submitted for publication (2005).
[29] Rausand, M. and Hoyland, A., System reliability theory: models, statistical methods, and applications, Wiley-Interscience, Hoboken, NT., 2004.
[30] OREDA, Offshore Reliability Data Handbook 4th Edition (OREDA 2002), SINTEF, Trondheim, Norway, 2002.
[31] Swain, A. D. and Guttmann, H. E., Handbook of human reliability analysis with emphasis on nuclear power plant applications: Final report NUREG CR- 1278, SAND80-200, Sandia National Laboratories Statistics Computing and Human Factors Division, Albuquerque, 1983.
[32] Basra, G, Gibson, H. and Kirwan, B , Collection of Offshore Human Error Probability Data, Phase 2, Volume 1: Offshore Drilling Data, Health & Safety Executive, 1998.
[33] Basra, G, Gibson, H. and Kirwan, B , Collection of Offshore Human Error Probability Data, Phase 2, Volume 2: Permit to Work data, Health & Safety Executive, 1998.
[34] ROSS-website, Data Sources for Risk and Reliability Studies, http://www.ntnu.no/ross/info/data.php.
Barrier and operational risk analysis of hydrocarbon releases (BORA-Release);Part I Method description
27

[35] Bento, J.-P., Menneske - Teknologi - Organisasjon Veiledning for gjennomforing av MTO-analyser. Kurskompendium for Oljedirektoratet, Oversatt av Statoil,, Oljedirektoratet, Stavanger, Norway, 2001.
[36] Groeneweg, J., Controlling the controllable: The management of safety, DSWO Press, Leiden, The Netherlands, 1998.
[37] Jacobs, R. and Haber, S., Organisational processes and nuclear power plant safety, Reliability Engineering and System Safety. 45 (1994) 75 - 83.
[38] Hollnagel, E., Cognitive reliability and error analysis method: CREAM, Elsevier, Oxford, 1998.
[39] Embrey, D. E., Humphreys, P , Rosa, E. A., Kirwan, B. and Rea, K., SLIM- MAUD: An approach to assessing human error probabilities using structured expert judgment, Department of Energy, USA, 1984.
[40] Gibson, H, Basra, G. and Kirwan, B , Development of the CORE-DATA database, Paper dated 23.04.98, University of Birmingham, Birmingham, United Kingdom, 1998.
[41] Thomassen, O. and Sorum, M., Mapping and monitoring the technical safety level. SPE 73923, 2002.
[42] PSA, Trends in risk levels - summary report Phase 5 (2004), The Petroleum Safety Authority, Stavanger, 2005.
[43] Aven, T., Hauge, S., Sklet, S. and Vinnem, J. E., Operational risk analysis. Total analysis of physical and non-physical barriers. H2.1 Methodology for analysis of HOF factors, Draft 1, Rev 1, 2005.
[44] Kafka, P, The process of safety management and decision making, ESREL 2005, Tri City, Poland, 2005.
[45] Kim, J. W. and Jung, W D , A taxonomy of performance influencing factors for human reliability analysis of emergency tasks, Journal of Loss Prevention in the Process Industries. 16, 6 (2003) 479-495.
[46] statistics, Britannica Student Encyclopedia, Encyclopaedia Britannica Online. 10. nov. 2005 <http://search,eb.com/ebi/article-208648>. 2005.
Barrier and operational risk analysis of hydrocarbon releases (BORA-Release);Part I Method description
28
Thesis - Part II Papers
Paper 4
Barrier and operational risk analysis of hydrocarbon releases (BORA- Release); Part II Results from a case study
Snorre Sklet, Jan Erik Vinnem, Terje Aven Journal of Hazardous Materials
Submitted for publication December 2005

Barrier and operational risk analysis of hydrocarbon releases (BORA-Release);
Part II Results from a case study
Snorre Sklet a’ 1, Jan Erik Vinnem b, Terje Aven ba Dept. of Production and Quality Engineering, The Norwegian University of
Science and Technology (NTNU), NO-7491 Trondheim, Norway b University of Stavanger (UiS), NO-4036 Stavanger, Norway
AbstractThis paper presents results from a case study carried out on an oil and gas production platform with the purpose to apply and test BORA-Release, a method for barrier and operational risk analysis of hydrocarbon releases. A description of the BORA-Release method is given in part I of the paper. BORA-Release is applied to express the platform specific hydrocarbon release frequencies for three release scenarios for selected systems and activities on a specific platform. The method is used to analyse the effect on the release frequency of safety barriers introduced to prevent hydrocarbon releases, and to study the effect on the barrier performance of platform specific conditions of technical, human, operational, and organisational risk influencing factors (RIFs). BORA-Release is also used to analyse the effect on the release frequency of several risk reducing measures.
Keywords: Risk analysis, hydrocarbon release, loss of containment, safety barrier, organisational factor.
1 IntroductionThe Petroleum Safety Authority Norway (PSA) focuses on safety barriers in their regulations relating to management in the petroleum activities [1] and requires that it shall be known what barriers have been established, which function they are
1 Corresponding author. Tel.: +47 73 59 29 02, Fax: +47 73 59 28 96 E-mail: [email protected]
intended to fulfil, and what performance requirements have been defined with respect to technical, operational, and organisational elements that are necessary for the individual barrier to be effective.
These requirements and a recognition of the insufficient modelling of human, operational, and organisational factors in existing quantitative risk analyses (QRA) were the background for the BORA project [2]. The aim of the BORA project is to perform a detailed and quantitative modelling of barrier performance, including barriers to prevent the occurrence of initiating events (like hydrocarbon release) as well as consequence reducing barriers. One of the activities in the BORA project has been to develop BORA-Release, a method suitable for qualitative and quantitative analyses of hydrocarbon release scenarios [3, 4]. The method has been tested in a case study on a specific oil and gas producing platform. The purpose of the case study was to determine the platform specific hydrocarbon release frequencies for selected systems and activities for selected release scenarios and assess whether or not BORA-Release is suitable for analyzing the effect of risk reduction measures and changes that may increase the release frequency.
The main objective of the present paper is to present and discuss the results from a case study on an oil and gas production platform on the Norwegian Continental Shelf applying BORA-Release. BORA-Release has been used to analyse the release frequency considering the effect of safety barriers introduced to prevent hydrocarbon release and analyse the effect on the barrier performance of platform specific conditions of technical, human, operational, as well as organisational risk influencing factors (RIFs).
This paper contains four main sections where this first section describes the background and the purpose of the paper. The next section explains how the case study was carried out, the basis for the case study with respect to selection of release scenarios for detailed analysis, and relevant descriptions of the technical systems, operational activities, and conditions. Section three presents the results from the qualitative and quantitative analyses of the selected scenarios and the overall results. A discussion of the results and experiences from the case study, and some conclusions are presented in section four.
Barrier and operational risk analysis of hydrocarbon releases (BORA-Release);Part II Results from a case study
2 Case study descriptionIn BORA-Release, the qualitative and quantitative analyses of the risk related to hydrocarbon releases comprise the following main steps [3]:
2
1) Development of a basic risk model including hydrocarbon release scenarios and safety barriers
2) Modelling the performance of safety barriers3) Assignment of generic input data and quantification based on these data4) Development of risk influence diagrams5) Scoring of risk influencing factors (RIFs)6) Weighting of risk influencing factors7) Adjustment of generic input data8) Recalculation of the risk in order to determine the platform specific risk.
The basis for development of the basic risk model in the case study was 20 hydrocarbon release scenarios described in [5]. Initially, two scenarios were selected for detailed analyses. Later on, one additional scenario was selected such that the following three release scenarios have been analysed in detail:
A. Release due to valve(s) in wrong position after maintenance (flowline inspection)
B. Release due to incorrect fitting of flanges or bolts during maintenance (flowline inspection)
C. Release due to internal corrosion.
Flowline inspection was selected as activity for analysis of scenario A and B. A flowline is a line segments between an automatic flow valve (AFV) in the valve tree and the production or test header. There may be up to 30 - 40 flanges on each flowline, and between 5 and 15 of them are disassembled during a flowline inspection. Flowline inspections are performed by visual inspections in order to reveal corrosion in the pipes, flanges, and instrument fittings on the flowlines. Each flowline is inspected at least twice a year. The inspector plans the inspection and identifies inspection points. The area technician is responsible for shutdown of the actual well and isolation, depressurization, and draining of the actual flowline. The inspections are carried out while the other wells are producing. The mechanics disassemble and assemble the flowlines zone by zone and install new bolts and gaskets in the flanges after each inspection. The inspector carries out the inspection and decides whether or not some pipe spools need to be changed due to degradation. Findings from the inspection are documented in a specific database. The area technician is responsible for execution of a leak test prior to start-up of normal production, while a central control room (CCR) technician monitors the pressure. Two service point valves (SP1/SP2) are used during the leak test and may be left in wrong position after the inspection. The valves are operated by a single area technician and there is no isolation plan or valve list showing the valve positions for
Barrier and operational risk analysis of hydrocarbon releases (BORA-Release);Part II Results from a case study
3
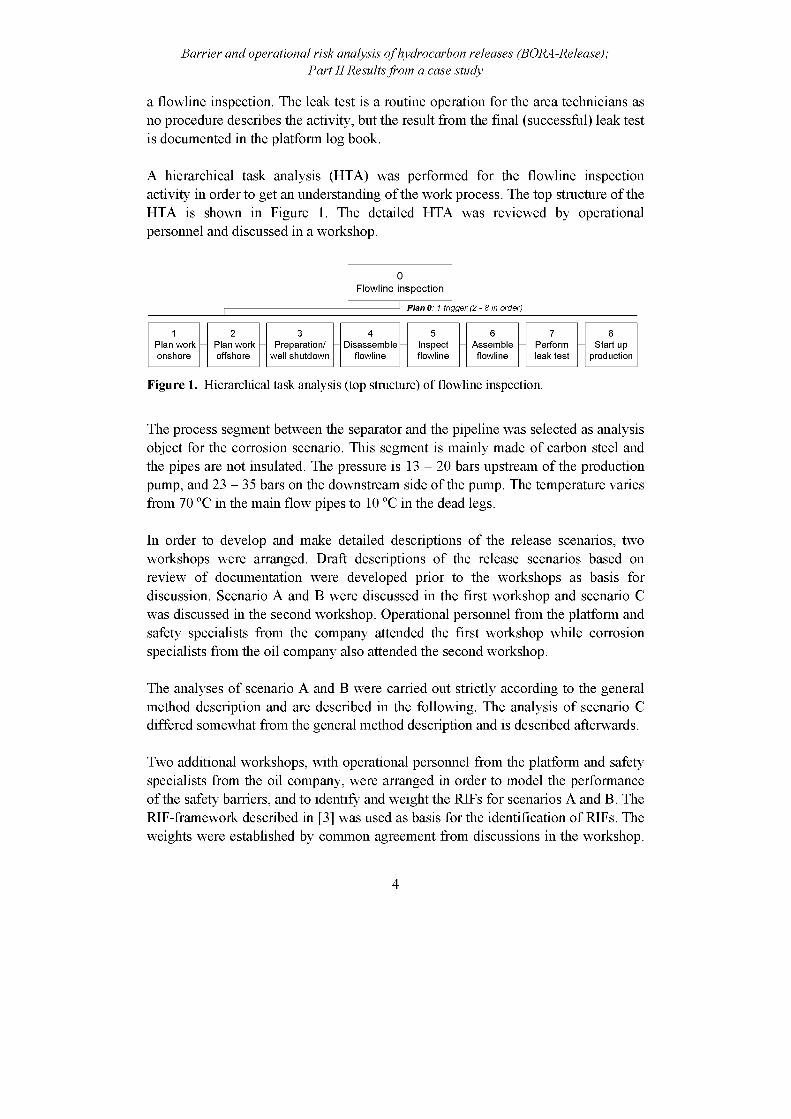
a flowline inspection. The leak test is a routine operation for the area technicians as no procedure describes the activity, but the result from the final (successful) leak test is documented in the platform log book.
A hierarchical task analysis (HTA) was performed for the flowline inspection activity in order to get an understanding of the work process. The top structure of the HTA is shown in Figure 1. The detailed HTA was reviewed by operational personnel and discussed in a workshop.
Barrier and operational risk analysis of hydrocarbon releases (BORA-Release);Part II Results from a case study
0Flowline inspection
—I Plan 0: 1 trigger (2 - 8 in order)
1 2 3 4 5 6 7 8Plan work Plan work Preparation/ Disassemble Inspect Assemble Perform Start uponshore offshore well shutdown flowline flowline flowline leak test production
Figure 1. Hierarchical task analysis (top structure) of flowline inspection.
The process segment between the separator and the pipeline was selected as analysis object for the corrosion scenario. This segment is mainly made of carbon steel and the pipes are not insulated. The pressure is 13 - 20 bars upstream of the production pump, and 23 - 35 bars on the downstream side of the pump. The temperature varies from 70 °C in the main flow pipes to 10 °C in the dead legs.
In order to develop and make detailed descriptions of the release scenarios, two workshops were arranged. Draft descriptions of the release scenarios based on review of documentation were developed prior to the workshops as basis for discussion. Scenario A and B were discussed in the first workshop and scenario C was discussed in the second workshop. Operational personnel from the platform and safety specialists from the company attended the first workshop while corrosion specialists from the oil company also attended the second workshop.
The analyses of scenario A and B were carried out strictly according to the general method description and are described in the following. The analysis of scenario C differed somewhat from the general method description and is described afterwards.
Two additional workshops, with operational personnel from the platform and safety specialists from the oil company, were arranged in order to model the performance of the safety barriers, and to identify and weight the RIFs for scenarios A and B. The RIF-framework described in [3] was used as basis for the identification of RIFs. The weights were established by common agreement from discussions in the workshop.
4

The most important RIF for each basic event was identified and assigned a relative weight equal to 10. Thereafter, the other RIFs were given weights relative to the most important one on the scale 10 - 8 - 6 - 4 - 2.
The generic input data were discussed in the workshops and some input data were established based on discussions during the workshops. The assignment of industry average data for human errors was primarily based on data from THERP ([6]).
The scoring of the RIFs was based on secondary analysis of answers on a questionnaire from a survey of the risk level on the Norwegian Continental Shelf (RNNS-project) [7]. Further information about the scoring is given in [8].
Revised input data were established by the analysts as described in the method description [3] using the formula:
Barrier and operational risk analysis of hydrocarbon releases (BORA-Release);Part II Results from a case study
P,v ( A) = Pve ( A)-2 W ■ Qi (1)
i=1
where Pave(A) is the industry average probability of occurrence of event A, wi is the weight of RIF no. i for the event, Qi is a measure of the status of RIF no. i, and n is the number of RIFs for each basic event. The calculation of Qi is described in detail in [3]. In formula (1),
2 W = 1 (2)i =1
The revised platform specific data were used as input in the risk model in order to recalculate the release frequencies for the selected scenarios.
The analysis of scenario C was carried out somewhat different. The two main differences were; 1) An overall RIF-analysis was not carried out, but the effects of changes were studied based on sensitivity analyses, and 2) Fault tree analysis was not used for quantitative analysis of the inspection effectiveness. The performance of the safety barrier inspection was analysed based on a method described by API [9], and assessment of the practice on the platform. Several workshops were arranged to discuss the model used for analysis of the corrosion scenario and the current status of corrosion and inspection on the platform. In addition, results from the last inspection were reviewed in order to predict the corrosion rate within the system.
5
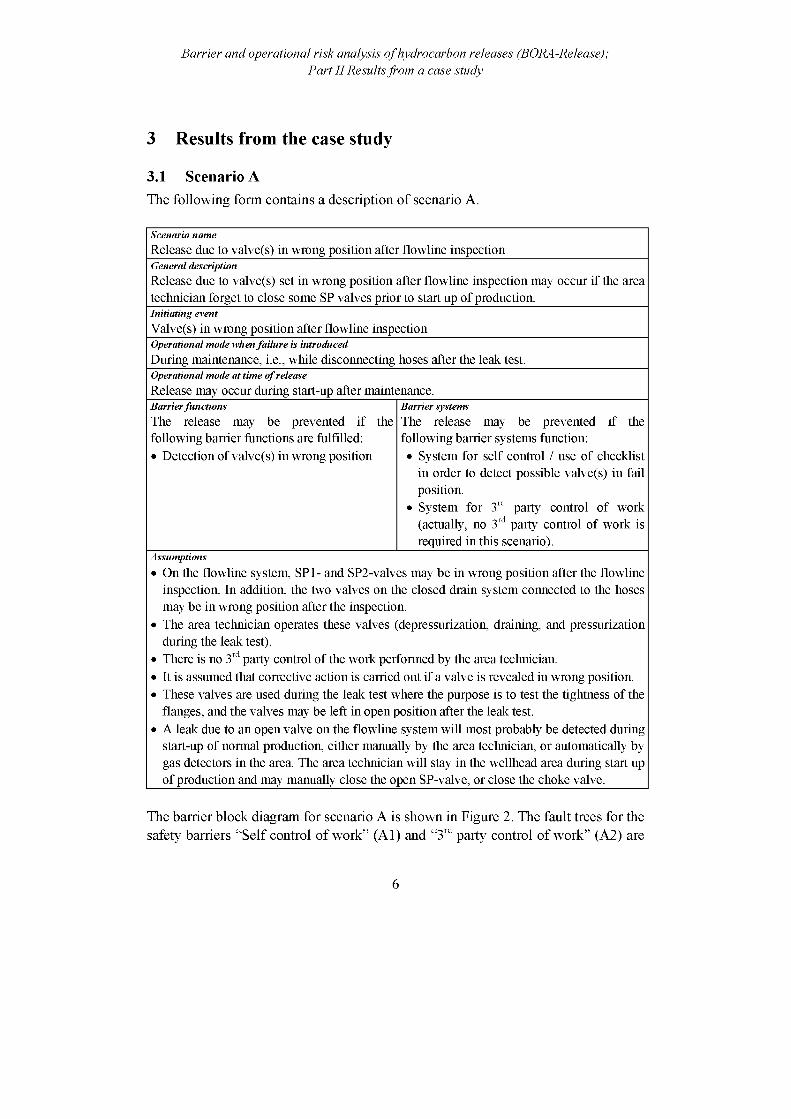
Barrier and operational risk analysis of hydrocarbon releases (BORA-Release);Part II Results from a case study
3 Results from the case study
3.1 Scenario AThe following form contains a description of scenario A.
Scenario nameRelease due to valve(s) in wrong position after flowline inspectionGeneral descriptionRelease due to valve(s) set in wrong position after flowline inspection may occur if the area technician forget to close some SP valves prior to start up of production.Initiating eventValve(s) in wrong position after flowline inspectionOperational mode when failure is introducedDuring maintenance, i.e., while disconnecting hoses after the leak test.Operational mode at time of releaseRelease may occur during start-up after maintenance.Barrier functionsThe release may be prevented if the following barrier functions are fulfilled:• Detection of valve(s) in wrong position
Barrier systemsThe release may be prevented if the following barrier systems function:• System for self control / use of checklist
in order to detect possible valve(s) in fail position.
• System for 3rd party control of work (actually, no 3rd party control of work is required in this scenario).
Assumptions
• On the flowline system, SP1- and SP2-valves may be in wrong position after the flowline inspection. In addition, the two valves on the closed drain system connected to the hoses may be in wrong position after the inspection.
• The area technician operates these valves (depressurization, draining, and pressurization during the leak test).
• There is no 3rd party control of the work performed by the area technician.• It is assumed that corrective action is carried out if a valve is revealed in wrong position.• These valves are used during the leak test where the purpose is to test the tightness of the
flanges, and the valves may be left in open position after the leak test.• A leak due to an open valve on the flowline system will most probably be detected during
start-up of normal production, either manually by the area technician, or automatically by gas detectors in the area. The area technician will stay in the wellhead area during start up of production and may manually close the open SP-valve, or close the choke valve.
The barrier block diagram for scenario A is shown in Figure 2. The fault trees for the safety barriers “Self control of work” (A1) and “3rd party control of work” (A2) are
6
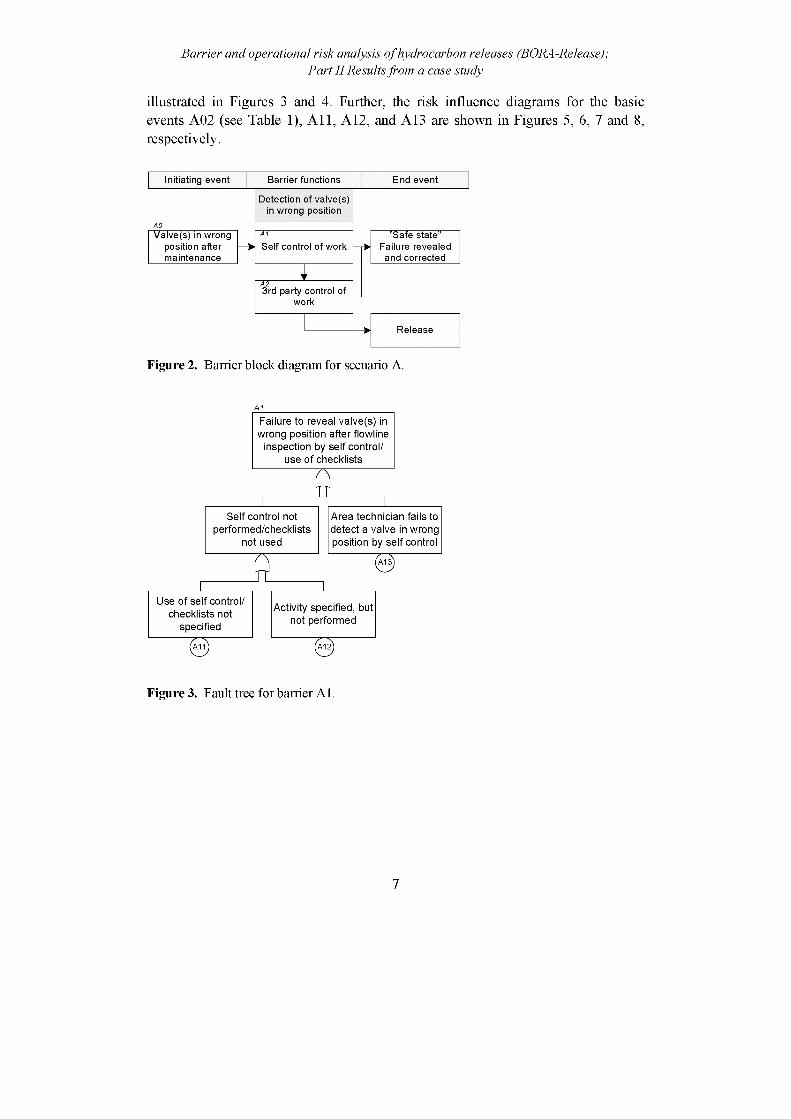
illustrated in Figures 3 and 4. Further, the risk influence diagrams for the basic events A02 (see Table 1), All, A12, and A13 are shown in Figures 5, 6, 7 and 8, respectively.
Barrier and operational risk analysis of hydrocarbon releases (BORA-Release);Part II Results from a case study
Detection of valve(s) in wrong position
Valve(s) in wrong position after maintenance
"Safe state” Failure revealed and corrected
Release
A23rd party control of
work
Self control of work
Initiating event Barrier functions End event
Figure 2. Barrier block diagram for scenario A.
A1
Activity specified, but not performed
Use of self control/ checklists not
specified
Self control not performed/checklists
not used
Area technician fails to detect a valve in wrong position by self control
Failure to reveal valve(s) in wrong position after flowline
inspection by self control/ use of checklists
Figure 3. Fault tree for barrier A1.
7
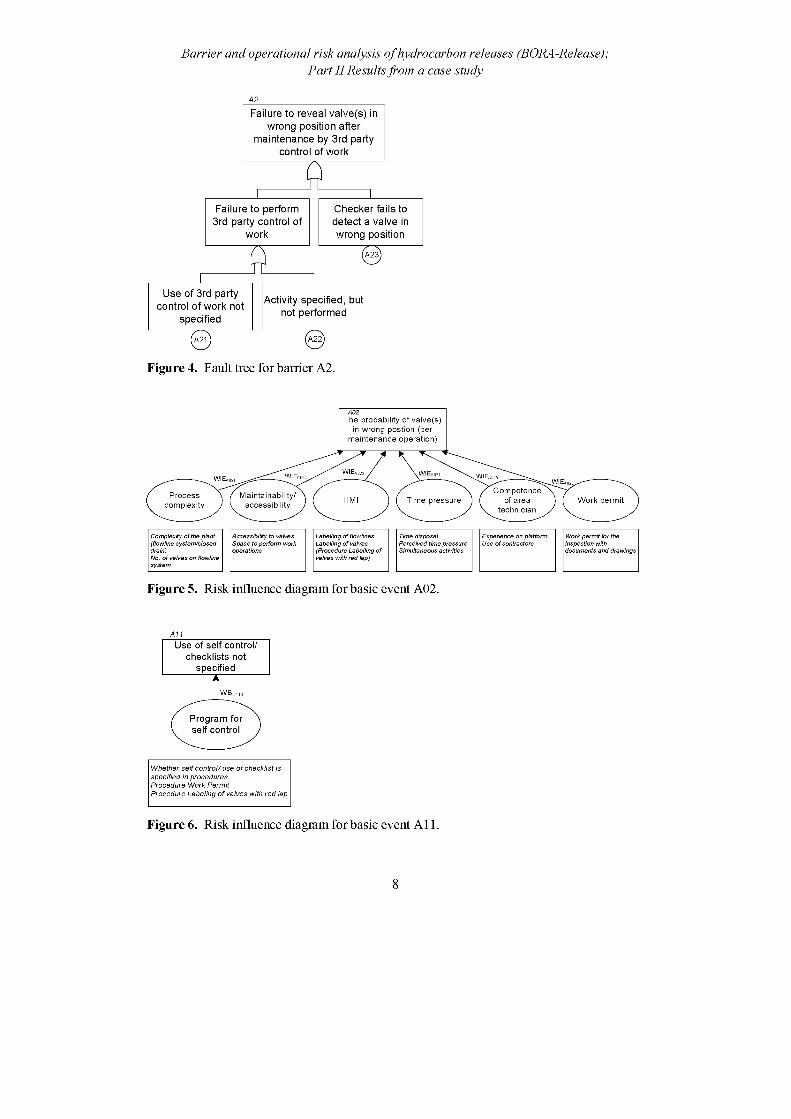
Barrier and operational risk analysis of hydrocarbon releases (BORA-Release);Part II Results from a case study
A2
Failure to reveal valve(s) in wrong position after
maintenance by 3rd party control of work
Failure to perform Checker fails to3rd party control of detect a valve in
work wrong position
Figure 4. Fault tree for barrier A2.
The probability of valve(s) in wrong postion (per
maintenance operation)
Competence of area
technician
Processcomplexity
Maintainability/accessibility HMI Time pressure Work permit
Complexity of the plant (flowline system/closed
No. of valves on flowline system
Accessibility to valves Space to perform work operations
Labelling of flowlines Labelling of valves (Procedure Labelling of valves with red lap)
Time disposalPerceived time pressure Simultaneous activities
Experience on platform Use of contractors
Work permit for the inspection with documents and drawings
Figure 5. Risk influence diagram for basic event A02.
A11
Whether self control/ use of checklist is specified in procedures Procedure Work Permit Procedure Labeling of valves with red lap
Figure 6. Risk influence diagram for basic event A11.
8
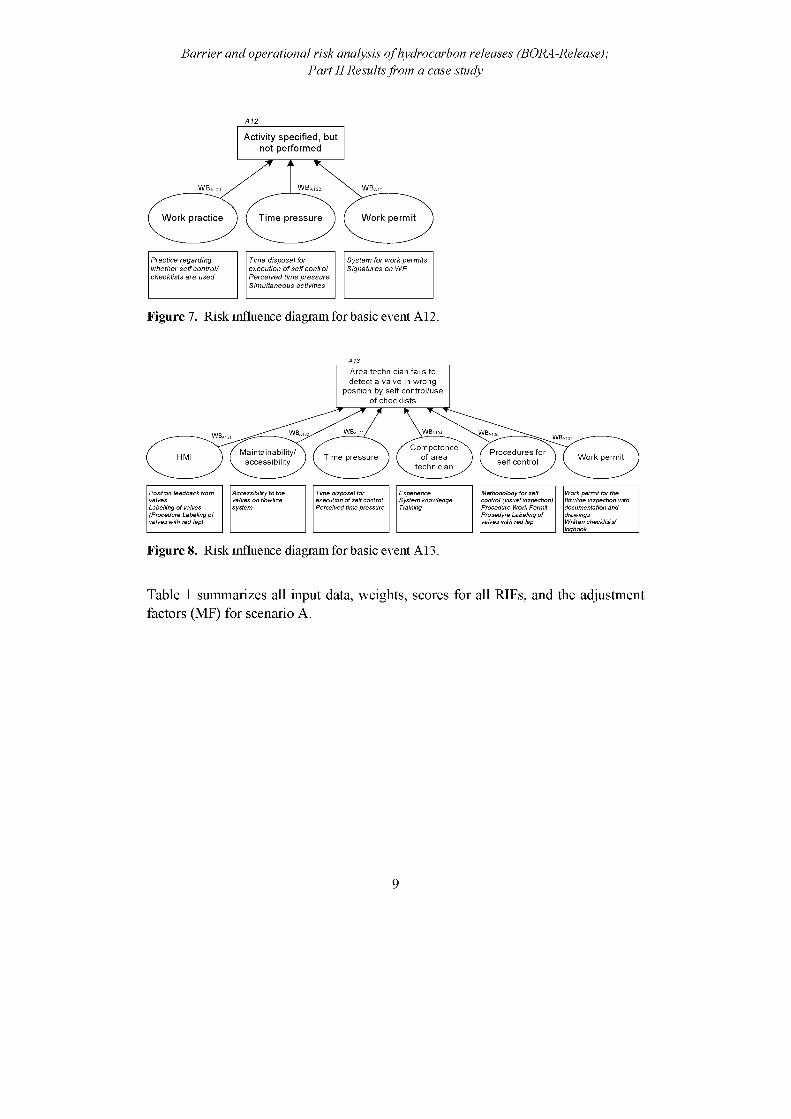
Barrier and operational risk analysis of hydrocarbon releases (BORA-Release);Part II Results from a case study
A12
Activity specified, but not performed
WB,
Work practice Time pressure Work permit
Practice regarding whether self control/ checklists are used
Time disposal for execution of self control
Perceived time pressure Simultaneous activities
System for work permits Signatures on WP
Figure 7. Risk influence diagram for basic event A12.
Area technician fails to detect a valve in wrong
position by self control/use of checklists
Competence of area
technician
Maintainability/accessibility
Procedures for self controlHMI Time pressure Work permit
Position feedback from Accessibility to the Time disposal for Experience Methodolody for self Work permit for thevalves on flowline execution of self control System knowledge control (visual inspection) flowline inspection with
Labelling of valves system Perceived time pressure Training Procedure Work Permit documentation and(Procedure Labeling of Prosedyre Labeling of drawingsvalves with red lap) valves with red lap Written checklists/
logbook
Figure 8. Risk influence diagram for basic event A13.
Table 1 summarizes all input data, weights, scores for all RIFs, and the adjustment factors (MF) for scenario A.
9
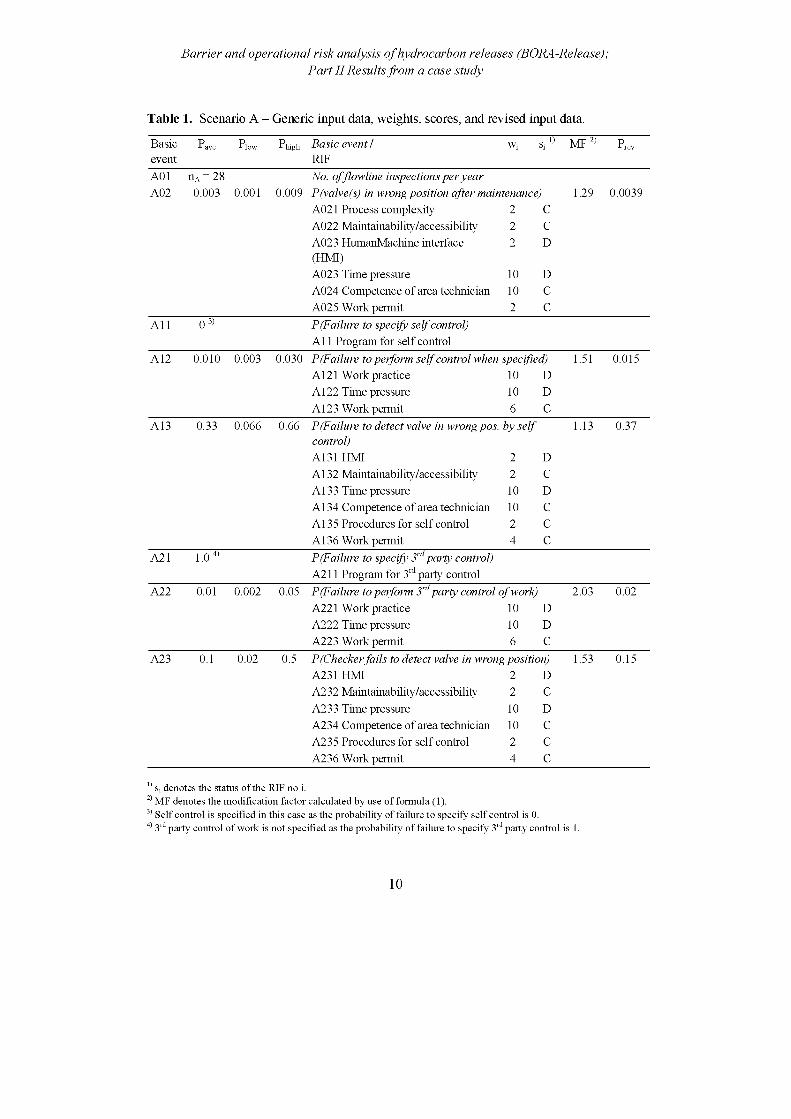
Barrier and operational risk analysis of hydrocarbon releases (BORA-Release);Part II Results from a case study
Table 1. Scenario A - Generic input data, weights, scores, and revised input data.
Basic Pave Phigh Basic event / Wi si 1) MF 2) Prevevent RIFA01
00<NII£ No. of flowline inspections per year
A02 0.003 0.001 0.009 P(valve(s) in wrong position after maintenance) 1 .29 0.0039A021 Process complexity 2 CA022 Maintainability/accessibility 2 CA023 HumanMachine interface 2 D(HMI)A023 Time pressure 10 DA024 Competence of area technician 10 CA025 Work permit 2 C
A11 0 3) P(Failure to specify self control)A11 Program for self control
A12 0.010 0.003 0.030 P(Failure to perform self control when specified) 1.51 0.015A121 Work practice 10 DA122 Time pressure 10 DA123 Work permit 6 C
A13 0.33 0.066 0.66 P(Failure to detect valve in wrong pos. by self 1.13 0.37control)
A131 HMI 2 DA132 Maintainability/accessibility 2 CA133 Time pressure 10 DA134 Competence of area technician 10 CA135 Procedures for self control 2 CA136 Work permit 4 C
A21 1.0 4) P(Failure to specify 3rdparty control) A211 Program for 3rd party control
A22 0.01 0.002 0.05 P(Failure to perform 3rd party control of work) 2.03 0.02A221 Work practice 10 DA222 Time pressure 10 DA223 Work permit 6 C
A23 0.1 0.02 0.5 P(Checker fails to detect valve in wrong position) 1.53 0.15A231 HMI 2 DA232 Maintainability/accessibility 2 CA233 Time pressure 10 DA234 Competence of area technician 10 CA235 Procedures for self control 2 CA236 Work permit 4 C
1) s; denotes the status of the RIF no i.2) MF denotes the modification factor calculated by use of formula (1).3) Self control is specified in this case as the probability of failure to specify self control is 0.4) 3rd party control of work is not specified as the probability of failure to specify 3rd party control is 1.
10
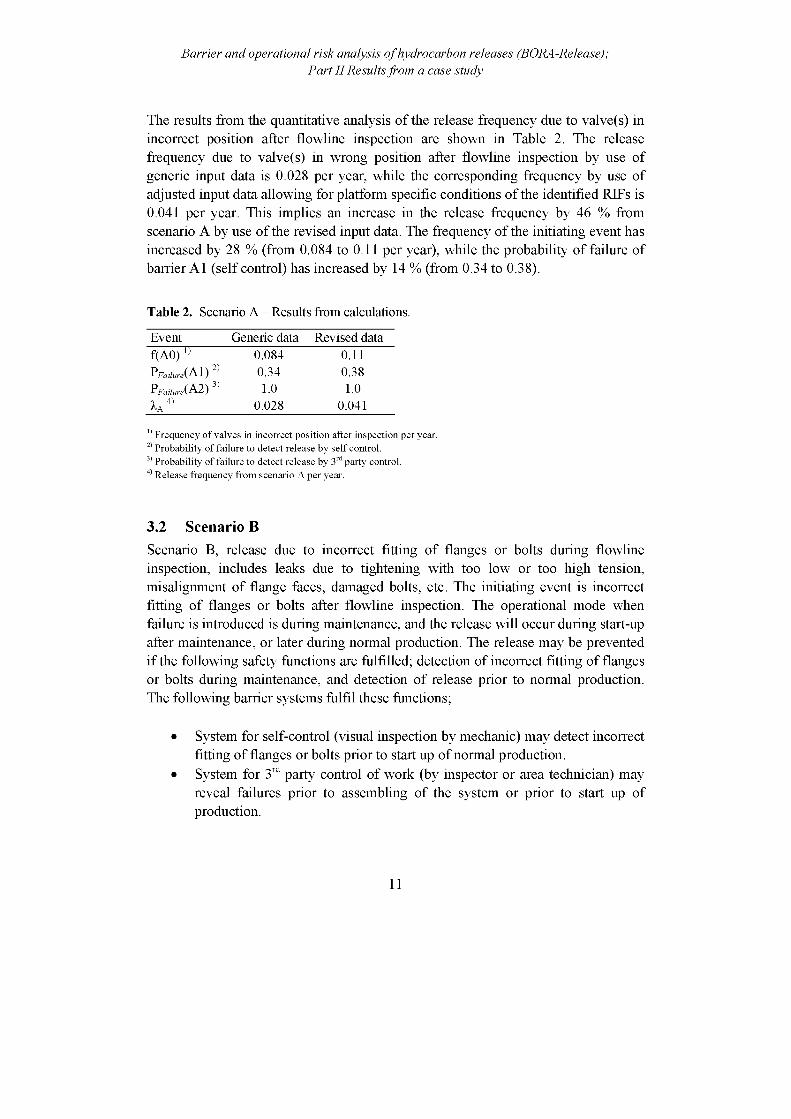
Barrier and operational risk analysis of hydrocarbon releases (BORA-Release);Part II Results from a case study
The results from the quantitative analysis of the release frequency due to valve(s) in incorrect position after flowline inspection are shown in Table 2. The release frequency due to valve(s) in wrong position after flowline inspection by use of generic input data is 0.028 per year, while the corresponding frequency by use of adjusted input data allowing for platform specific conditions of the identified RIFs is 0.041 per year. This implies an increase in the release frequency by 46 % from scenario A by use of the revised input data. The frequency of the initiating event has increased by 28 % (from 0.084 to 0.11 per year), while the probability of failure of barrier A1 (self control) has increased by 14 % (from 0.34 to 0.38).
Table 2. Scenario A - Results from calculations.
Event Generic data Revised dataf(A0) 1 0.084 0.11PFailure(A1) 2 0.34 0.38PFailure(A2) 3 1.0 1.0
0.028 0.041
Frequency of valves in incorrect position after inspection per year.2) Probability of failure to detect release by self control.3) Probability of failure to detect release by 3rd party control.4) Release frequency from scenario A per year.
3.2 Scenario BScenario B, release due to incorrect fitting of flanges or bolts during flowline inspection, includes leaks due to tightening with too low or too high tension, misalignment of flange faces, damaged bolts, etc. The initiating event is incorrect fitting of flanges or bolts after flowline inspection. The operational mode when failure is introduced is during maintenance, and the release will occur during start-up after maintenance, or later during normal production. The release may be prevented if the following safety functions are fulfilled; detection of incorrect fitting of flanges or bolts during maintenance, and detection of release prior to normal production. The following barrier systems fulfil these functions;
• System for self-control (visual inspection by mechanic) may detect incorrect fitting of flanges or bolts prior to start up of normal production.
• System for 3rd party control of work (by inspector or area technician) may reveal failures prior to assembling of the system or prior to start up of production.
11

• System for leak tests may reveal potential failures prior to start up of production. The leak test may be carried out in two ways: 1) by use of glycol/water or 2) by use of injection water.
The results from scenario B are not described as detailed as the results from scenario A since the principles in the method already is illustrated, but the barrier block diagram for scenario B is shown in Figure 9. Neither the fault trees of the barriers, nor the risk influence diagrams are shown since the principles are similar as used in scenario A.
Barrier and operational risk analysis of hydrocarbon releases (BORA-Release);Part II Results from a case study
Detection of release prior to normal
producton
Detection of incorrect fitting of flanges
Release
Leak test
"Safe state” Failure revealed and corrected
3rd party control of work
Self-control of work
Incorrect fitting of flanges during maintenance
Initiating event Barrier functions End event
Figure 9. Barrier block diagram for scenario B.
Table 3 summarizes all input data, weights, scores for all RIFs, as well as the adjustment factors for scenario B.
12
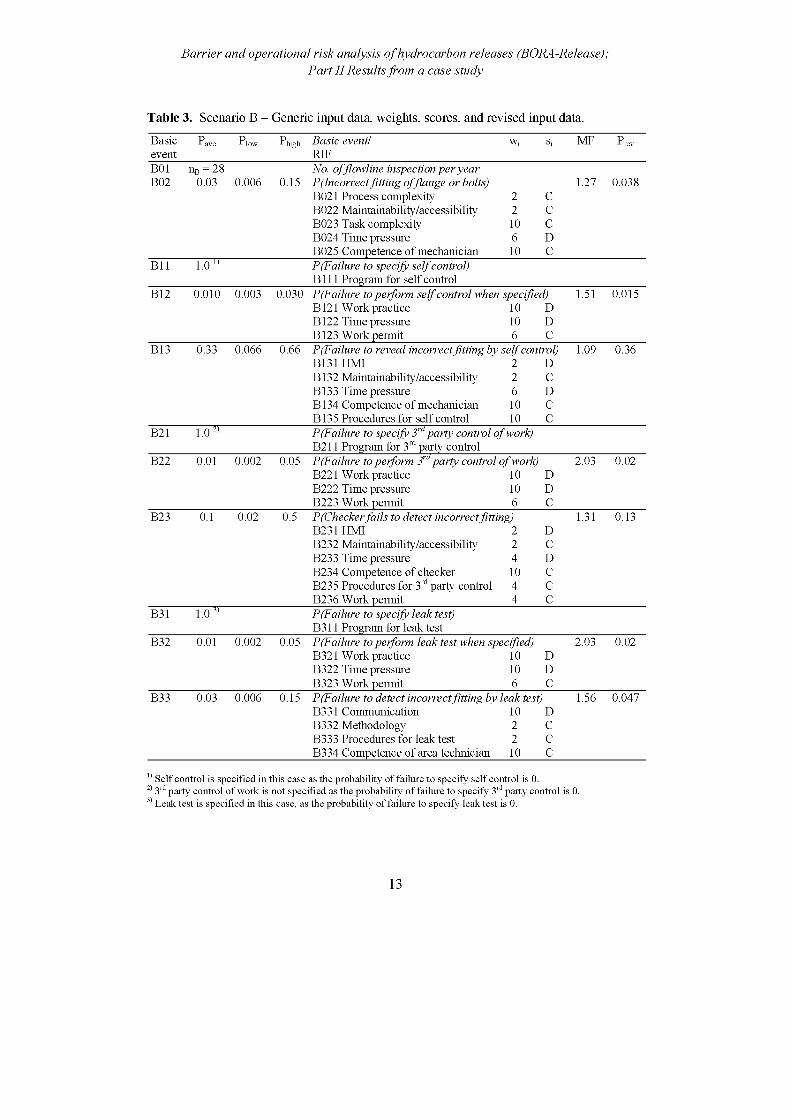
Barrier and operational risk analysis of hydrocarbon releases (BORA-Release);Part II Results from a case study
Table 3. Scenario B - Generic input data, weights, scores, and revised input data.
Basicevent
Pave Phigh Basic event/RIF
Wi si MF Prev
B01 nB = 28 No. of flowline inspection per yearB02 0.03 0.006 0.15 P(Incorrect fitting of flange or bolts) 1.27 0.038
B021 Process complexity 2 CB022 Maintainability/accessibility 2 CB023 Task complexity 10 CB024 Time pressure 6 DB025 Competence of mechanician 10 C
B11 1.0 11 P(Failure to specify self control)B111 Program for self control
B12 0.010 0.003 0.030 P(Failure to perform self control when specified) 1.51 0.015B121 Work practice 10 DB122 Time pressure 10 DB123 Work permit 6 C
B13 0.33 0.066 0.66 P(Failure to reveal incorrect fitting by self control) 1.09 0.36B131 HMI 2 DB132 Maintainability/accessibility 2 CB133 Time pressure 6 DB134 Competence of mechanician 10 CB135 Procedures for self control 10 C
B21 1.0 2) P(Failure to specify 3rd party control of work)B211 Program for 3rd party control
B22 0.01 0.002 0.05 P(Failure to perform 3rd party control of work) 2.03 0.02B221 Work practice 10 DB222 Time pressure 10 DB223 Work permit 6 C
B23 0.1 0.02 0.5 P(Checker fails to detect incorrect fitting) 1.31 0.13B231 HMI 2 DB232 Maintainability/accessibility 2 CB233 Time pressure 4 DB234 Competence of checker 10 CB235 Procedures for 3rd party control 4 CB236 Work permit 4 C
B31 1.0 3) P(Failure to specify leak test)B311 Program for leak test
B32 0.01 0.002 0.05 P(Failure to perform leak test when specified) 2.03 0.02B321 Work practice 10 DB322 Time pressure 10 DB323 Work permit 6 C
B33 0.03 0.006 0.15 P(Failure to detect incorrectfitting by leak test) 1.56 0.047B331 Communication 10 DB332 Methodology 2 CB333 Procedures for leak test 2 CB334 Competence of area technician 10 C
Self control is specified in this case as the probability of failure to specify self control is 0.2) 3rd party control of work is not specified as the probability of failure to specify 3rd party control is 0.3) Leak test is specified in this case, as the probability of failure to specify leak test is 0.
13
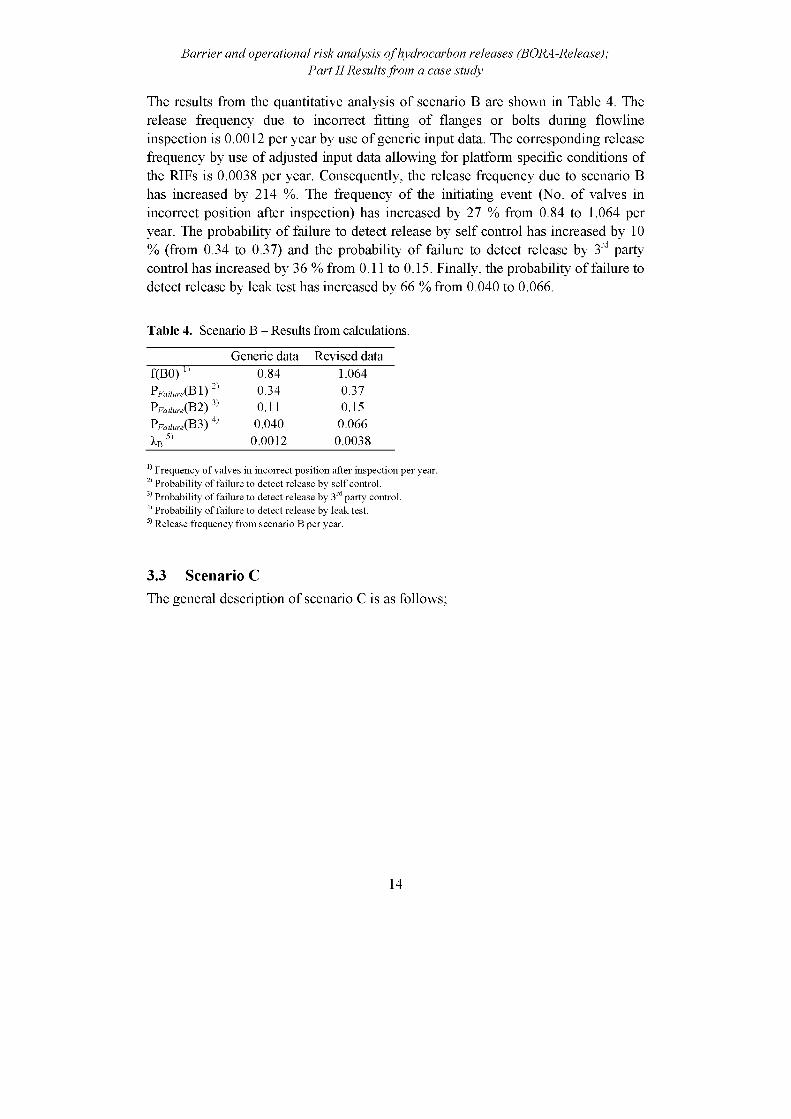
The results from the quantitative analysis of scenario B are shown in Table 4. The release frequency due to incorrect fitting of flanges or bolts during flowline inspection is 0.0012 per year by use of generic input data. The corresponding release frequency by use of adjusted input data allowing for platform specific conditions of the RIFs is 0.0038 per year. Consequently, the release frequency due to scenario B has increased by 214 %. The frequency of the initiating event (No. of valves in incorrect position after inspection) has increased by 27 % from 0.84 to 1.064 per year. The probability of failure to detect release by self control has increased by 10 % (from 0.34 to 0.37) and the probability of failure to detect release by 3rd party control has increased by 36 % from 0.11 to 0.15. Finally, the probability of failure to detect release by leak test has increased by 66 % from 0.040 to 0.066.
Barrier and operational risk analysis of hydrocarbon releases (BORA-Release);Part II Results from a case study
Table 4. Scenario B - Results from calculations.
Generic data Revised dataf(B0)1J 0.84 1.064PFailure^1) 2 0.34 0.37PFailure(B2) 3 0.11 0.15Pfailure(B3) 4 0.040 0.0661b 5) 0.0012 0.0038
1) Frequency of valves in incorrect position after inspection per year.2) Probability of failure to detect release by self control.3) Probability of failure to detect release by 3rd party control.4) Probability of failure to detect release by leak test.5) Release frequency from scenario B per year.
3.3 Scenario CThe general description of scenario C is as follows;
14
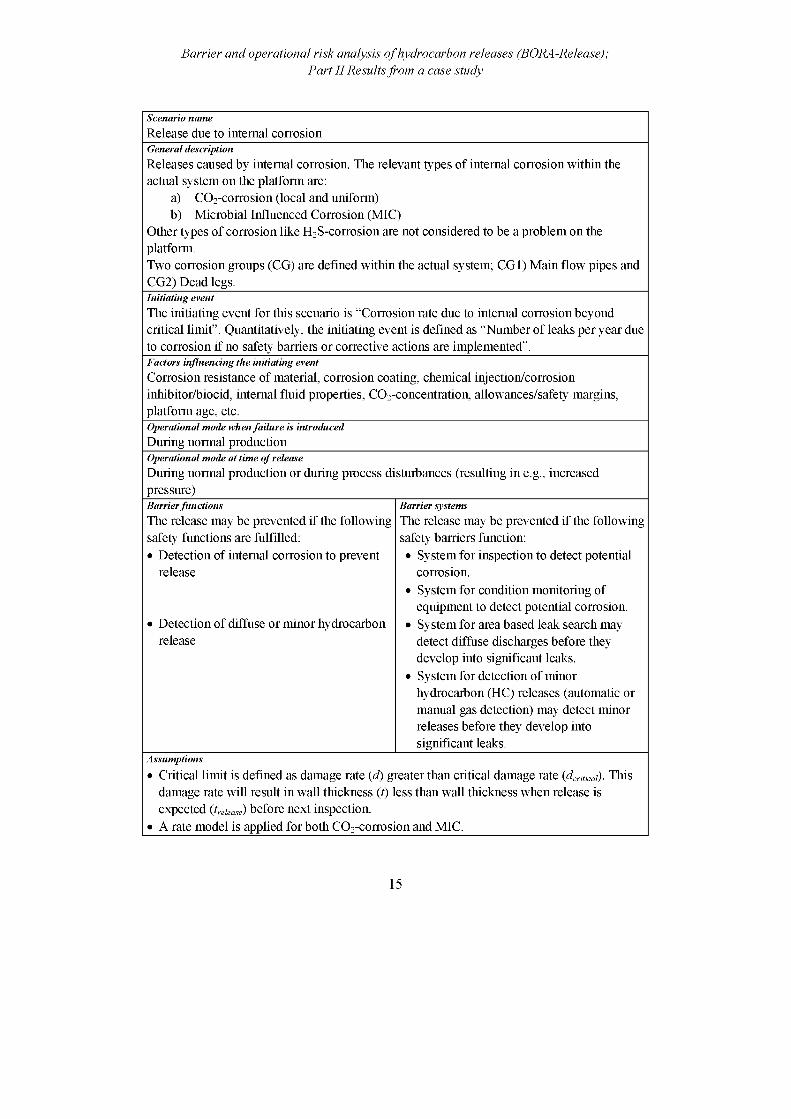
Barrier and operational risk analysis of hydrocarbon releases (BORA-Release);Part II Results from a case study
Scenario nameRelease due to internal corrosionGeneral descriptionReleases caused by internal corrosion. The relevant types of internal corrosion within the actual system on the platform are:
a) CO2-corrosion (local and uniform)b) Microbial Influenced Corrosion (MIC)
Other types of corrosion like H2S-corrosion are not considered to be a problem on the platform.Two corrosion groups (CG) are defined within the actual system; CG1) Main flow pipes and CG2) Dead legs.Initiating eventThe initiating event for this scenario is “Corrosion rate due to internal corrosion beyond critical limit”. Quantitatively, the initiating event is defined as “Number of leaks per year due to corrosion if no safety barriers or corrective actions are implemented”.Factors influencing the initiating eventCorrosion resistance of material, corrosion coating, chemical injection/corrosion inhibitor/biocid, internal fluid properties, CO2-concentration, allowances/safety margins, platform age, etc.Operational mode when failure is introducedDuring normal productionOperational mode at time of releaseDuring normal production or during process disturbances (resulting in e.g., increased pressure)Barrier functionsThe release may be prevented if the following safety functions are fulfilled:• Detection of internal corrosion to prevent
release
• Detection of diffuse or minor hydrocarbon release
Barrier systemsThe release may be prevented if the following safety barriers function:• System for inspection to detect potential
corrosion.• System for condition monitoring of
equipment to detect potential corrosion.• System for area based leak search may
detect diffuse discharges before they develop into significant leaks.
• System for detection of minor hydrocarbon (HC) releases (automatic or manual gas detection) may detect minor releases before they develop into significant leaks.
Assumptions
• Critical limit is defined as damage rate (d) greater than critical damage rate (denial)- This damage rate will result in wall thickness (t) less than wall thickness when release is expected (trelease) before next inspection.
• A rate model is applied for both CO2-corrosion and MIC.
15
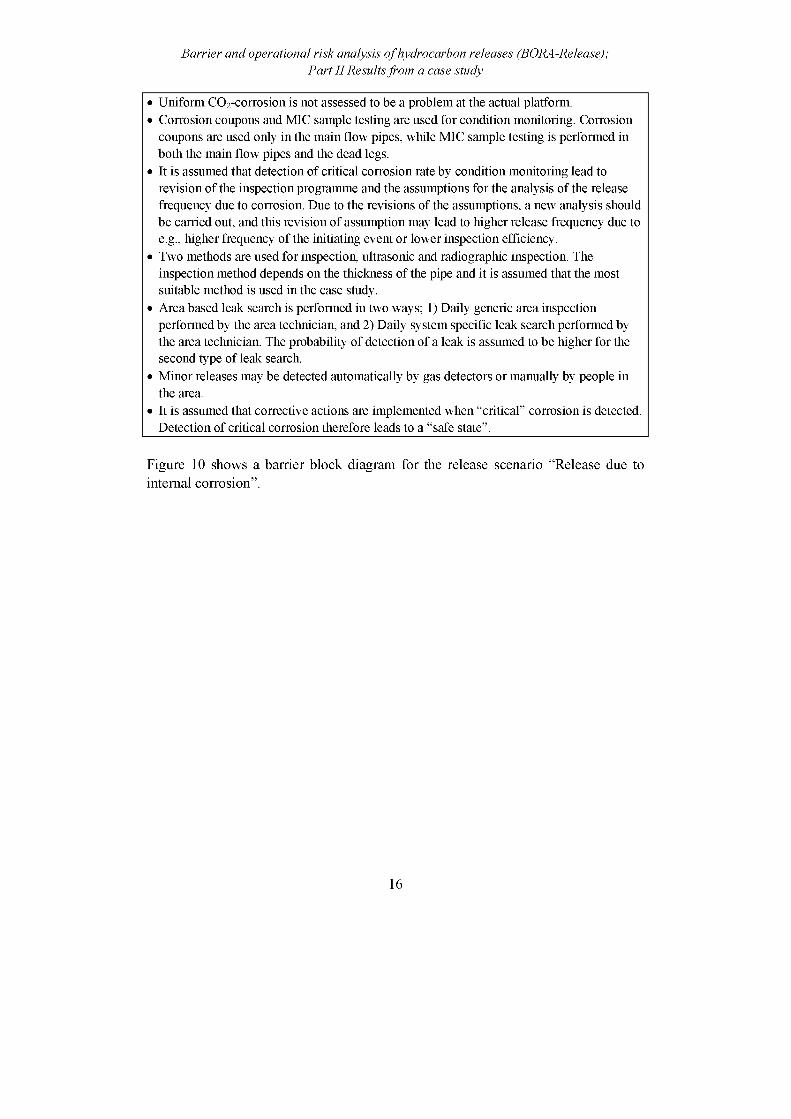
Barrier and operational risk analysis of hydrocarbon releases (BORA-Release);Part II Results from a case study
• Uniform CO2-corrosion is not assessed to be a problem at the actual platform.• Corrosion coupons and MIC sample testing are used for condition monitoring. Corrosion
coupons are used only in the main flow pipes, while MIC sample testing is performed in both the main flow pipes and the dead legs.
• It is assumed that detection of critical corrosion rate by condition monitoring lead to revision of the inspection programme and the assumptions for the analysis of the release frequency due to corrosion. Due to the revisions of the assumptions, a new analysis should be carried out, and this revision of assumption may lead to higher release frequency due to e.g., higher frequency of the initiating event or lower inspection efficiency.
• Two methods are used for inspection, ultrasonic and radiographic inspection. The inspection method depends on the thickness of the pipe and it is assumed that the most suitable method is used in the case study.
• Area based leak search is performed in two ways; 1) Daily generic area inspection performed by the area technician, and 2) Daily system specific leak search performed by the area technician. The probability of detection of a leak is assumed to be higher for the second type of leak search.
• Minor releases may be detected automatically by gas detectors or manually by people in the area.
• It is assumed that corrective actions are implemented when “critical” corrosion is detected. Detection of critical corrosion therefore leads to a “safe state”.
Figure 10 shows a barrier block diagram for the release scenario “Release due to internal corrosion”.
16
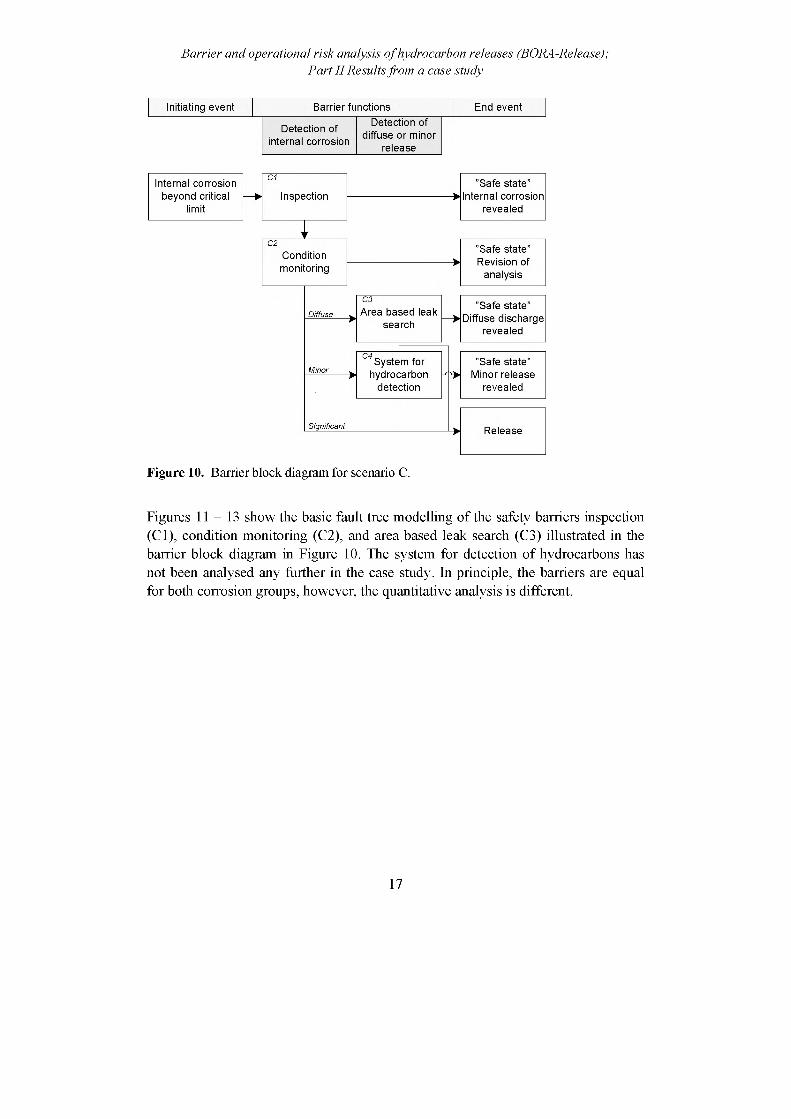
Barrier and operational risk analysis of hydrocarbon releases (BORA-Release);Part II Results from a case study
Detection of diffuse or minor
release
Detection of internal corrosion
Diffuse
Minor
Significant
Conditionmonitoring
"Safe state” Revision of
analysis
"Safe state” Minor release
revealed
System for hydrocarbon
detection
Inspection
Release
"Safe state” Diffuse discharge
revealed
Area based leak search
"Safe state” Internal corrosion
revealed
Internal corrosion beyond critical
limit
Initiating event Barrier functions End event
Figure 10. Barrier block diagram for scenario C.
Figures 11-13 show the basic fault tree modelling of the safety barriers inspection (Cl), condition monitoring (C2), and area based leak search (C3) illustrated in the barrier block diagram in Figure 10. The system for detection of hydrocarbons has not been analysed any further in the case study. In principle, the barriers are equal for both corrosion groups, however, the quantitative analysis is different.
17
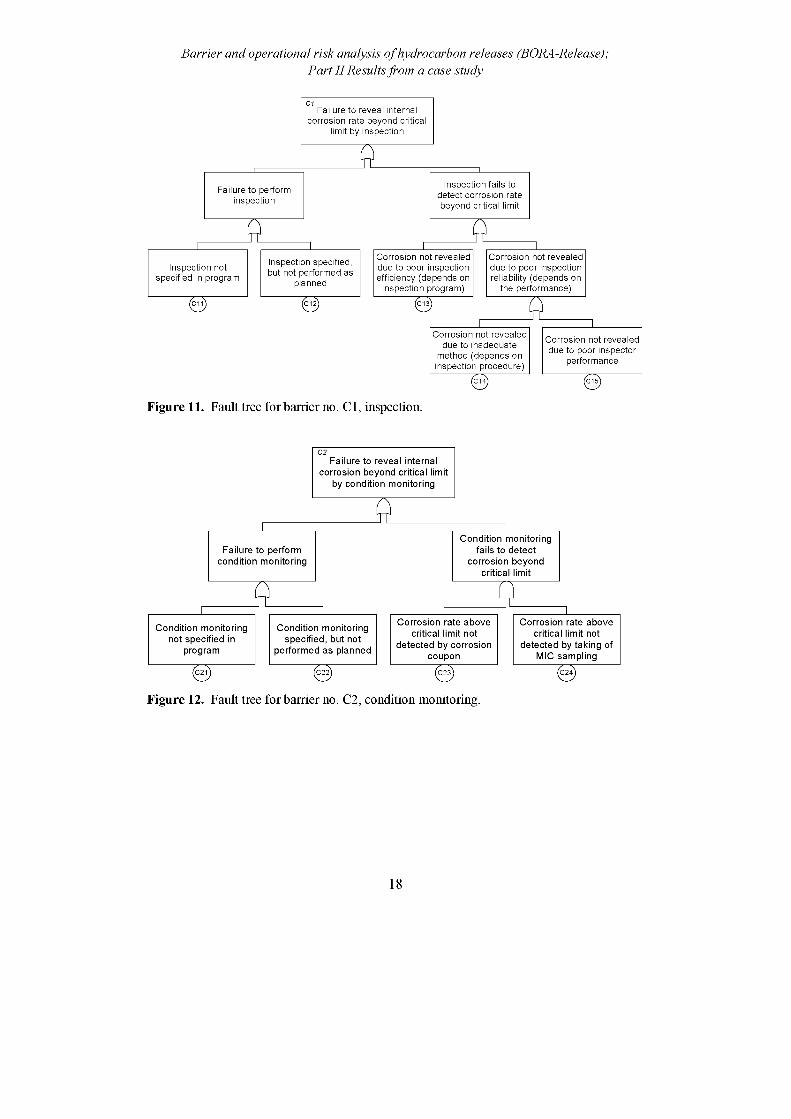
Barrier and operational risk analysis of hydrocarbon releases (BORA-Release);Part II Results from a case study
Failure to reveal internal corrosion rate beyond critical
limit by inspection
Failure to perform inspection
nInspection fails to
detect corrosion rate beyond critical limit
Inspection specified, but not performed as
planned
Corrosion not revealed Corrosion not revealedInspection not
specified in programdue to poor inspection efficiency (depends on
inspection program)
due to poor inspection reliability (depends on
the performance)
0 0 0______________
Corrosion not revealed due to inadequate
method (depends on inspection procedure)
"W
=LCorrosion not revealed due to poor inspector
performance
Figure 11. Fault tree for barrier no. C1, inspection.
Failure to perform condition monitoring
Condition monitoring fails to detect
corrosion beyond critical limit
C2Failure to reveal internal
corrosion beyond critical limit by condition monitoring
Condition monitoring Condition monitoringnot specified in specified, but not
program performed as planned
(S)
Corrosion rate above Corrosion rate abovecritical limit not critical limit not
detected by corrosion detected by taking ofcoupon MIC sampling
0Figure 12. Fault tree for barrier no. C2, condition monitoring.
18
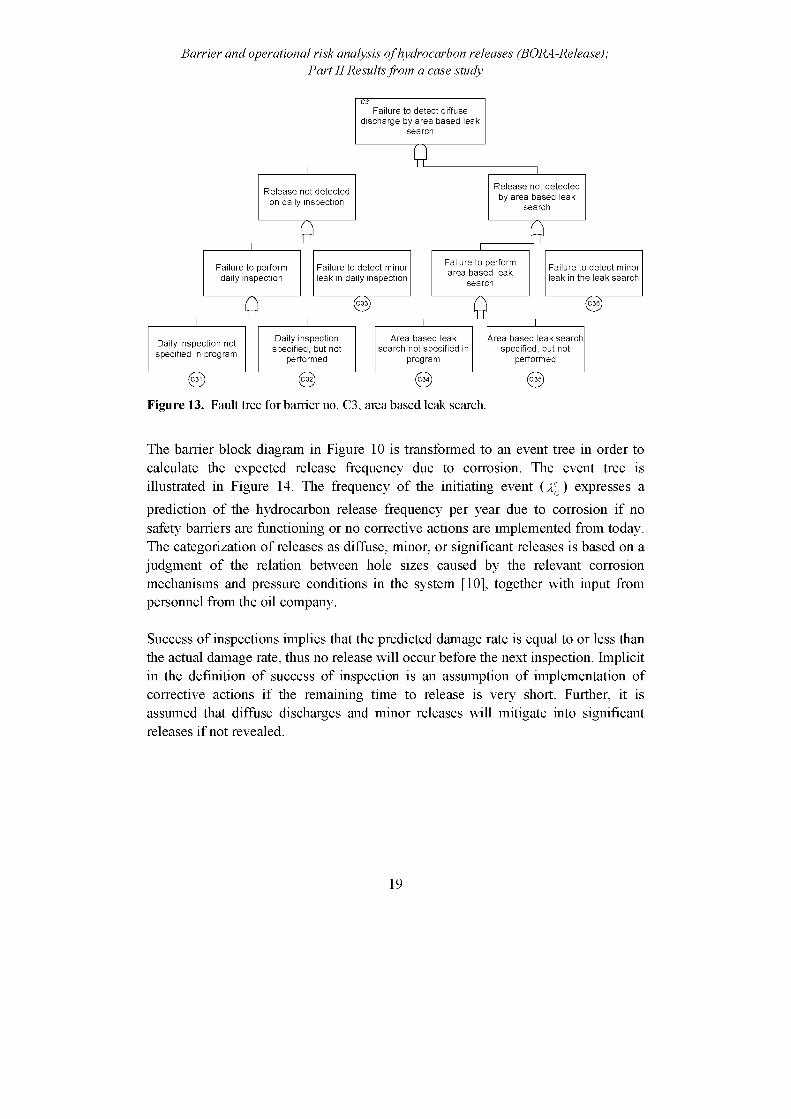
Barrier and operational risk analysis of hydrocarbon releases (BORA-Release);Part II Results from a case study
(ST "W
Figure 13. Fault tree for barrier no. C3, area based leak search.
The barrier block diagram in Figure 10 is transformed to an event tree in order to calculate the expected release frequency due to corrosion. The event tree is illustrated in Figure 14. The frequency of the initiating event (a°c ) expresses aprediction of the hydrocarbon release frequency per year due to corrosion if no safety barriers are functioning or no corrective actions are implemented from today. The categorization of releases as diffuse, minor, or significant releases is based on a judgment of the relation between hole sizes caused by the relevant corrosion mechanisms and pressure conditions in the system [10], together with input from personnel from the oil company.
Success of inspections implies that the predicted damage rate is equal to or less than the actual damage rate, thus no release will occur before the next inspection. Implicit in the definition of success of inspection is an assumption of implementation of corrective actions if the remaining time to release is very short. Further, it is assumed that diffuse discharges and minor releases will mitigate into significant releases if not revealed.
19
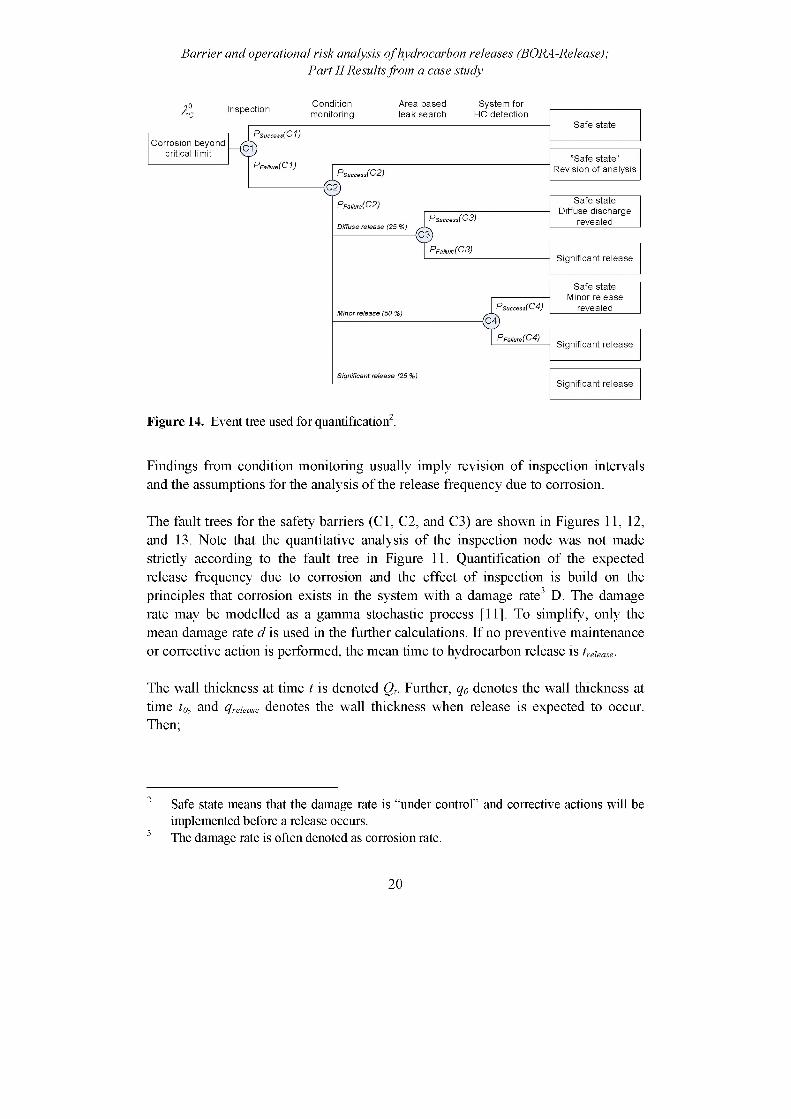
Barrier and operational risk analysis of hydrocarbon releases (BORA-Release);Part II Results from a case study
Conditionmonitoring
Area based leak search
System for HC detectioninspection
Diffuse release (25
Minor release (50
Significant release (25
Corrosion beyond critical limit
Significant release
Safe state
"Safe state" Revision of analysis
Safe state Diffuse discharge
revealed
Safe state Minor release
revealed
Significant release
Significant release
Figure 14. Event tree used for quantification2.
Findings from condition monitoring usually imply revision of inspection intervals and the assumptions for the analysis of the release frequency due to corrosion.
The fault trees for the safety barriers (Cl, C2, and C3) are shown in Figures 11, 12, and 13. Note that the quantitative analysis of the inspection node was not made strictly according to the fault tree in Figure 11. Quantification of the expected release frequency due to corrosion and the effect of inspection is build on the principles that corrosion exists in the system with a damage rate2 3 D. The damage rate may be modelled as a gamma stochastic process [11]. To simplify, only the mean damage rate d is used in the further calculations. If no preventive maintenance or corrective action is performed, the mean time to hydrocarbon release is trelease.
The wall thickness at time t is denoted Ot. Further, q0 denotes the wall thickness at time t0, and qreuase denotes the wall thickness when release is expected to occur. Then;
2 Safe state means that the damage rate is “under control” and corrective actions will be implemented before a release occurs.
3 The damage rate is often denoted as corrosion rate.
20

Barrier and operational risk analysis of hydrocarbon releases (BORA-Release);Part II Results from a case study
treleaseq'release
d(3)
The damage rate d is unknown, but may be predicted e.g., by using measurements from inspections.
If d denotes the predicted damage rate, a prediction of Release, t release may be determined from the following;
'orelease
'release
d(4)
However, safety barriers are implemented in order to prevent release of hydrocarbons. Inspections are planned to be executed at time ti approximately equal to 0.5 x t release in order to measure the wall thickness and calculate updated damage
rates (d). When the wall thickness is less than a critical limit, corrective actions are implemented.
Hydrocarbon releases may occur if the damage rate d is greater than dcritical, i.e., the damage rate that will result in release prior to execution of next inspection (at planned time (ti) or delayed). If the inspection ti is cancelled, the next planned inspection will be carried out at time ti+1.
For further quantification, a simplification is made; the corrosion rate is categorized in three damage rate states si (according to [9]):
s1 Predicted rate or less d < d
In this case we will not have release before t release (because trelease > t release).
As ti ~ 0.5 x t release , we have trelease > U+i. Thus, even if the first inspection (ti) is cancelled, an inspection (ti+1) will take place before release will occur.
s2 Predicted rate to two times rate d 6 (d, 2 d]In this case trelease > ti, but ti+i > trelease. A release may occur if an inspection is delayed or cancelled.
s3 Two to four times predicted rate d > 2 dIn this case, trelease < ti , and a release will occur prior to the first inspection.
21

Hence, the probability of failure to reveal that the actual damage rate is greater than the critical damage rate (d > dcritical) by inspection may as an approximation be expressed as;
Pwure (C1) = P(s3 )-(1 - P(delayed)) + P(s2) - p(deloyed) (5)
where P(delayed) expresses the probability that the planned inspection at time ti is delayed or cancelled. In formula (5), P(delayed) corresponds to the probability of occurrence of basic event C12 in Figure 11, while P(s3) denotes the probability of occurrence of basic event C13. The effect of poor inspection reliability (basic event C14 and basic event C15) is not included in the quantification process in this case study. However, this may be included as part of further work.
Our confidence in the predicted damage rate (d ) is important by use of this formula. API [9] describes how to calculate the effect of the inspection program on the confidence level in the damage rate and presents data for the confidence in predicted damage rates prior to an inspection, the likelihood that the inspection results determine the true damage state, and the confidence in damage rate after inspections.
As mentioned above, the frequency of the initiating event (A°C) in Figure 14expresses a prediction of the release frequency per year due to corrosion if no safety barriers are functioning or corrective actions are implemented from today. The frequency A°C is calculated as the number of segments with t release less than 10 years
divided by 10 years. The time limit has been set to 10 years since the maximum permissible inspection interval is 5 years and ti ~ 0.5 x t release. The prediction of l0C
is based on results from the last inspection on the platform and is calculated to be 2.2
per year. This frequency is based on a prediction of the damage rate (d). Therefore,
a consequence of changes in d is that a°c must be recalculated. We need to
calculate 2°C for each of the defined corrosion groups, where A°CCG1 relates to
corrosion group 1 Main flow pipes, and y0cCG2 related to corrosion group 2 Dead
legs. Based on a rough calculation, the following numbers were used in this case study:
A°CCG1 = 0.8 leaks/year, y°cCG2 = 1.4 leaks/year
Barrier and operational risk analysis of hydrocarbon releases (BORA-Release);Part II Results from a case study
22
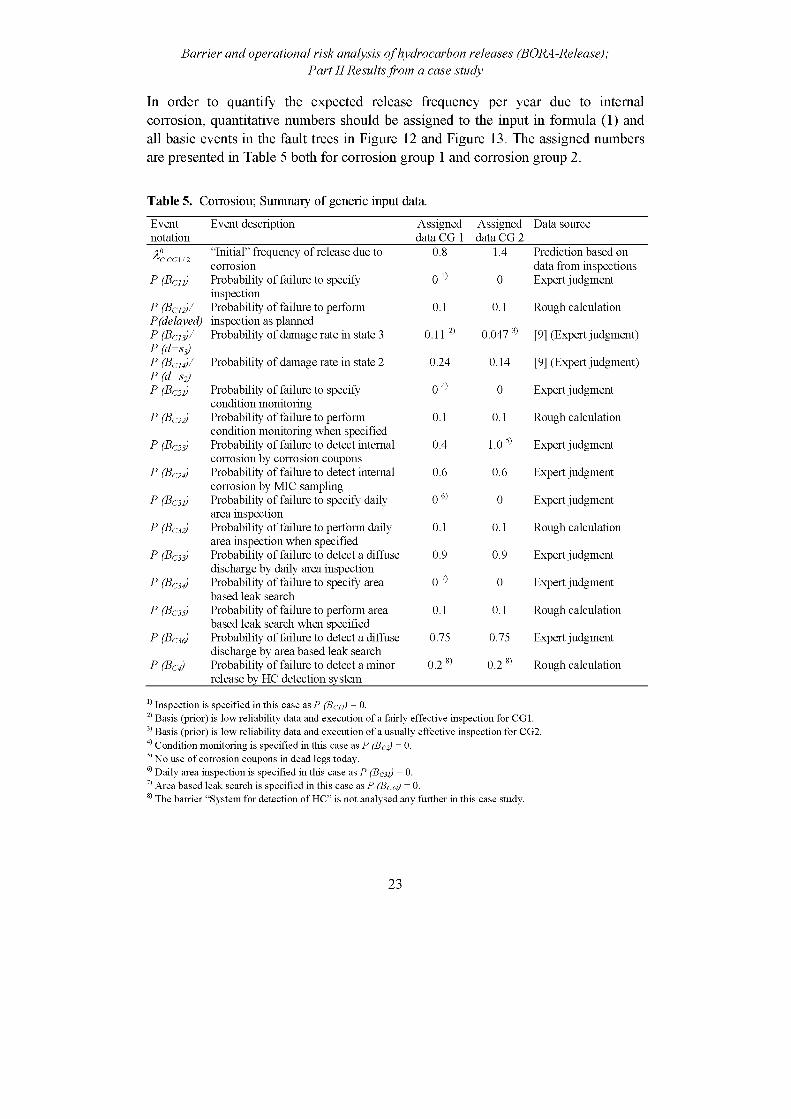
In order to quantify the expected release frequency per year due to internal corrosion, quantitative numbers should be assigned to the input in formula (1) and all basic events in the fault trees in Figure 12 and Figure 13. The assigned numbers
are presented in Table 5 both for corrosion group 1 and corrosion group 2.
Barrier and operational risk analysis of hydrocarbon releases (BORA-Release);Part II Results from a case study
Table 5. Corrosion; Summary of generic input data.
Eventnotation
Event description Assigned data CG 1
Assigned data CG 2
Data source
^CCG1/2 “Initial” frequency of release due to corrosion
0.8 1.4 Prediction based on data from inspections
P (BC11) Probability of failure to specify inspection
0 1) 0 Expert judgment
P (Bel)P(delayed)
Probability of failure to perform inspection as planned
0.1 0.1 Rough calculation
P (Bci3)/P (d=sj)
Probability of damage rate in state 3 0.11 2) 0.047 % [9] (Expert judgment)
P (Bci4)/P (d=s^)
Probability of damage rate in state 2 0.24 0.14 [9] (Expert judgment)
P (BC21) Probability of failure to specify condition monitoring
0 4) 0 Expert judgment
P (BC22) Probability of failure to perform condition monitoring when specified
0.1 0.1 Rough calculation
P (BC23) Probability of failure to detect internal corrosion by corrosion coupons
0.4 1.0 5) Expert judgment
P (BC24) Probability of failure to detect internal corrosion by MIC sampling
0.6 0.6 Expert judgment
P (BC31) Probability of failure to specify daily area inspection
0 6) 0 Expert judgment
P (BC32) Probability of failure to perform daily area inspection when specified
0.1 0.1 Rough calculation
P (BC33) Probability of failure to detect a diffuse discharge by daily area inspection
0.9 0.9 Expert judgment
P Probability of failure to specify area based leak search
0 7) 0 Expert judgment
P (BC3j) Probability of failure to perform area based leak search when specified
0.1 0.1 Rough calculation
P (BC3«) Probability of failure to detect a diffuse discharge by area based leak search
0.75 0.75 Expert judgment
P (BC4) Probability of failure to detect a minor release by HC detection system
0.2 8) 0.2 ^ Rough calculation
Inspection is specified in this case as P (Bcii) = 0.2) Basis (prior) is low reliability data and execution of a fairly effective inspection for CG1.3) Basis (prior) is low reliability data and execution of a usually effective inspection for CG2.4) Condition monitoring is specified in this case as P (BC2) = 0.5) No use of corrosion coupons in dead legs today.6 Daily area inspection is specified in this case as P (Bc3i) = 0.7 Area based leak search is specified in this case as P (Bc34) = 0.8 The barrier “System for detection of HC” is not analysed any further in this case study.
23
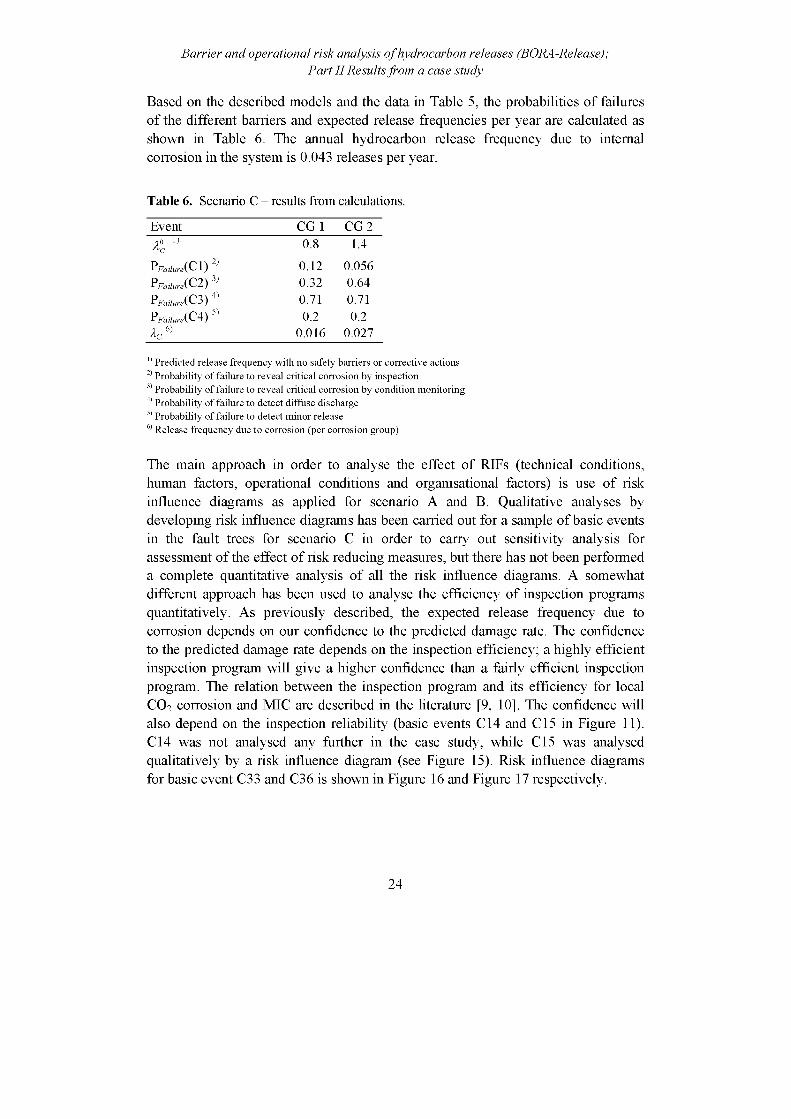
Based on the described models and the data in Table 5, the probabilities of failures of the different barriers and expected release frequencies per year are calculated as shown in Table 6. The annual hydrocarbon release frequency due to internal corrosion in the system is 0.043 releases per year.
Barrier and operational risk analysis of hydrocarbon releases (BORA-Release);Part II Results from a case study
Table 6. Scenario C - results from calculations.
Event CG 1 CG 24 ^ 0.8 1.4PFailure(C1) 2 0.12 0.056Pfailure(C2) 3 0.32 0.64Pfailur«(C3) ^ 0.71 0.71Pfailure(C4) 5 0.2 0.2Ac S 0.016 0.027
1) Predicted release frequency with no safety barriers or corrective actions2) Probability of failure to reveal critical corrosion by inspection3) Probability of failure to reveal critical corrosion by condition monitoring4) Probability of failure to detect diffuse discharge5) Probability of failure to detect minor release6) Release frequency due to corrosion (per corrosion group)
The main approach in order to analyse the effect of RIFs (technical conditions, human factors, operational conditions and organisational factors) is use of risk influence diagrams as applied for scenario A and B. Qualitative analyses by developing risk influence diagrams has been carried out for a sample of basic events in the fault trees for scenario C in order to carry out sensitivity analysis for assessment of the effect of risk reducing measures, but there has not been performed a complete quantitative analysis of all the risk influence diagrams. A somewhat different approach has been used to analyse the efficiency of inspection programs quantitatively. As previously described, the expected release frequency due to corrosion depends on our confidence to the predicted damage rate. The confidence to the predicted damage rate depends on the inspection efficiency; a highly efficient inspection program will give a higher confidence than a fairly efficient inspection program. The relation between the inspection program and its efficiency for local CO2 corrosion and MIC are described in the literature [9, 10]. The confidence will also depend on the inspection reliability (basic events C14 and C15 in Figure 11). C14 was not analysed any further in the case study, while C15 was analysed qualitatively by a risk influence diagram (see Figure 15). Risk influence diagrams for basic event C33 and C36 is shown in Figure 16 and Figure 17 respectively.
24
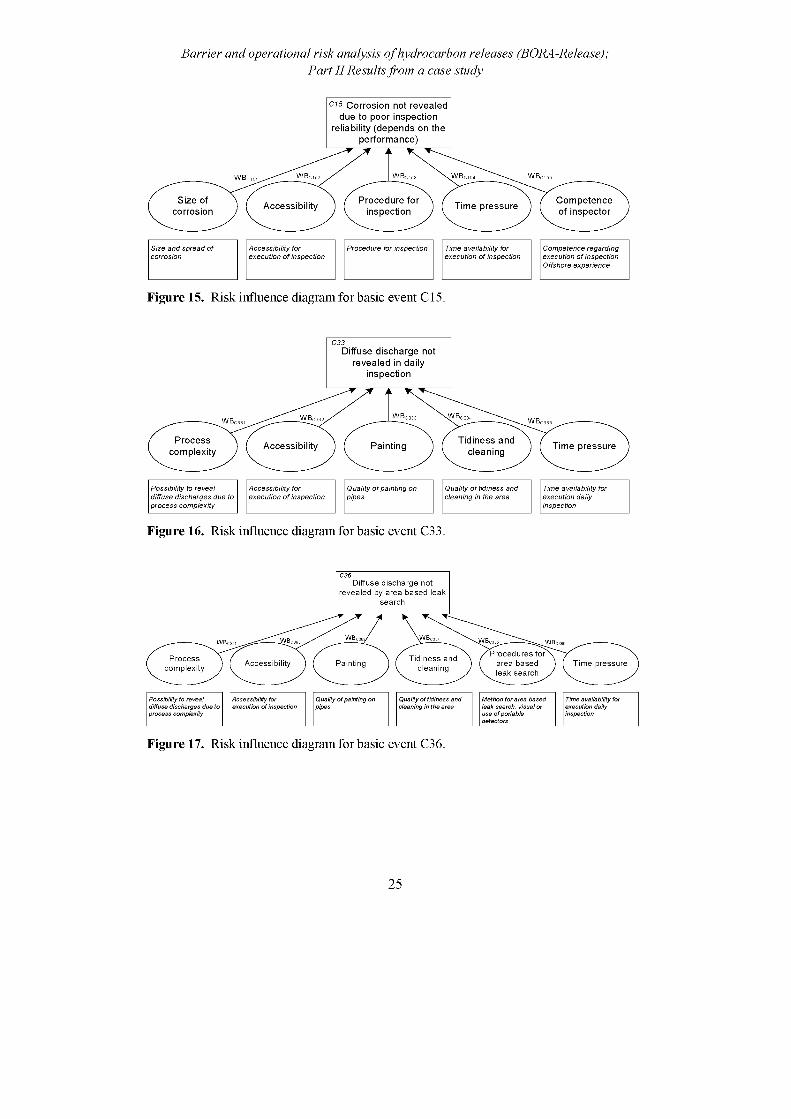
Barrier and operational risk analysis of hydrocarbon releases (BORA-Release);Part II Results from a case study
C15 Corrosion not revealed due to poor inspection
reliability (depends on the performance)
WBc WBc wb, WBcWB,
Size of corrosion
Procedure for inspection
Competence of inspector
Accessibility Time pressure
Size and spread of corrosion
Accessibility for execution of inspection
Procedure for inspection Time availability for
execution of inspection
Competence regarding
execution of inspection Offshore experience
Figure 15. Risk influence diagram for basic event C15.
Diffuse discharge not revealed in daily
inspection
WB, ■WBcWBcWBc WBc
Processcomplexity
Tidiness and cleaning
Accessibility Painting Time pressure
Possibility to reveal Accessibility for Quality of painting on Quality of tidiness and Time availability for
diffuse discharges due to execution of inspection cleaning in the area execution dailyprocess complexity inspection
Figure 16. Risk influence diagram for basic event C33.
Diffuse discharge not revealed by area based leak
search
Procedures for area based leak search
Processcomplexity
Tidiness and cleaningAccessibility Painting Time pressure
Possibility to reveal Accessibility for Quality of painting on Quality of tidiness and Method for area based Time availability fordiffuse discharges due to execution of inspection cleaning in the area leak search, visual or execution dailyprocess complexity use of portable
detectorsinspection
Figure 17. Risk influence diagram for basic event C36.
25
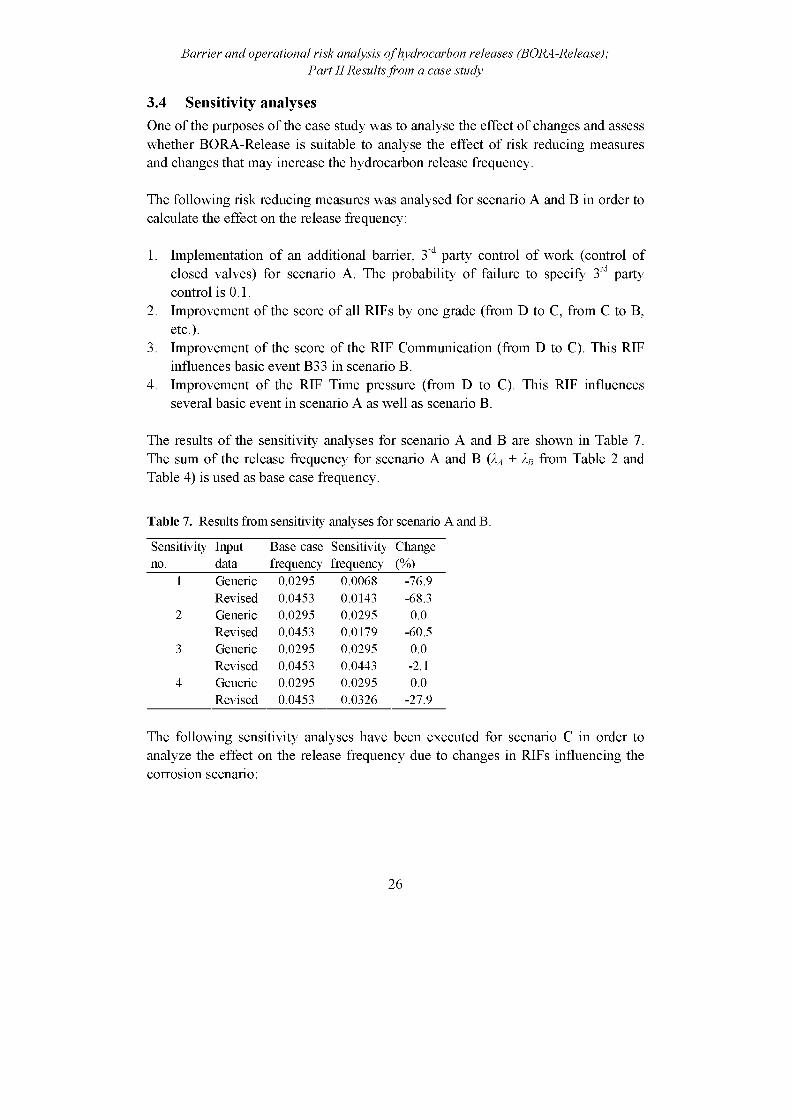
3.4 Sensitivity analysesOne of the purposes of the case study was to analyse the effect of changes and assess whether BORA-Release is suitable to analyse the effect of risk reducing measures and changes that may increase the hydrocarbon release frequency.
The following risk reducing measures was analysed for scenario A and B in order to calculate the effect on the release frequency:
1. Implementation of an additional barrier, 3rd party control of work (control of closed valves) for scenario A. The probability of failure to specify 3rd party control is 0.1.
2. Improvement of the score of all RIFs by one grade (from D to C, from C to B, etc.).
3. Improvement of the score of the RIF Communication (from D to C). This RIF influences basic event B33 in scenario B.
4. Improvement of the RIF Time pressure (from D to C). This RIF influences several basic event in scenario A as well as scenario B.
The results of the sensitivity analyses for scenario A and B are shown in Table 7. The sum of the release frequency for scenario A and B (Aa + XB from Table 2 and Table 4) is used as base case frequency.
Barrier and operational risk analysis of hydrocarbon releases (BORA-Release);Part II Results from a case study
Table 7. Results from sensitivity analyses for scenario A and B.
Sensitivity Input Base case Sensitivity Changeno. data frequency frequency (%)
1 Generic 0.0295 0.0068 -76.9Revised 0.0453 0.0143 -68.3
2 Generic 0.0295 0.0295 0.0Revised 0.0453 0.0179 -60.5
3 Generic 0.0295 0.0295 0.0Revised 0.0453 0.0443 -2.1
4 Generic 0.0295 0.0295 0.0Revised 0.0453 0.0326 -27.9
The following sensitivity analyses have been executed for scenario C in order to analyze the effect on the release frequency due to changes in RIFs influencing the corrosion scenario:
26
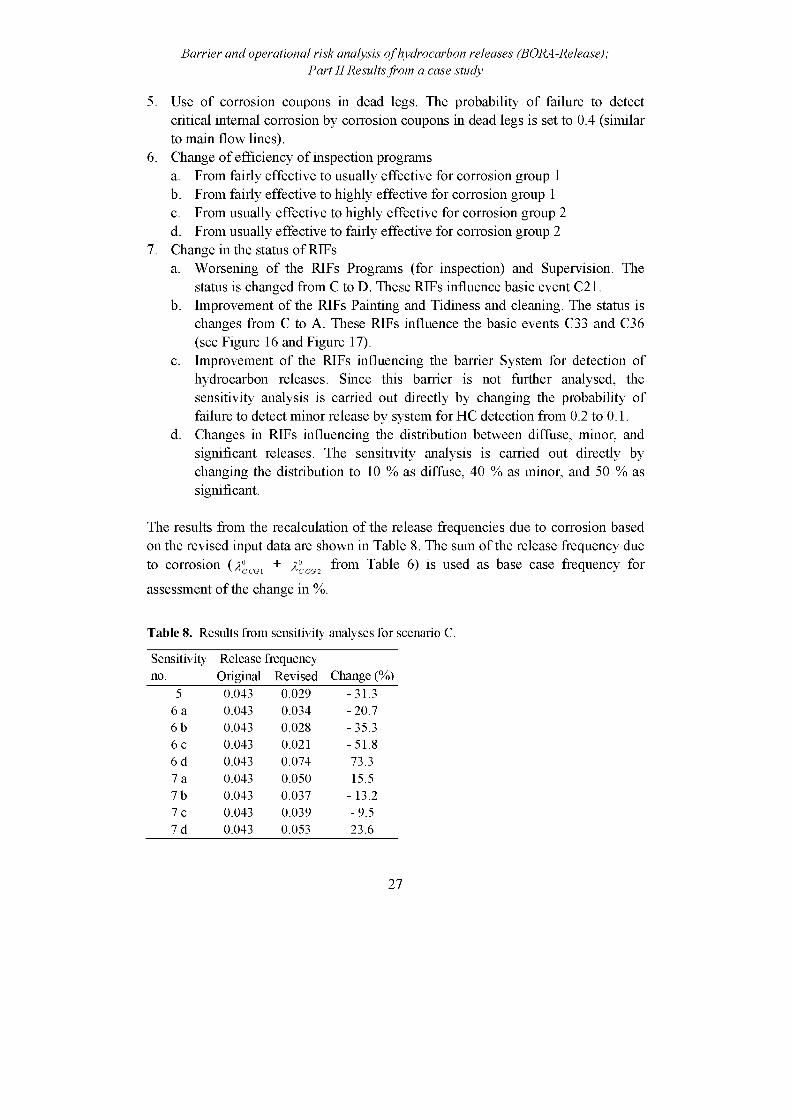
5. Use of corrosion coupons in dead legs. The probability of failure to detectcritical internal corrosion by corrosion coupons in dead legs is set to 0.4 (similarto main flow lines).
6. Change of efficiency of inspection programsa. From fairly effective to usually effective for corrosion group 1b. From fairly effective to highly effective for corrosion group 1c. From usually effective to highly effective for corrosion group 2d. From usually effective to fairly effective for corrosion group 2
7. Change in the status of RIFsa. Worsening of the RIFs Programs (for inspection) and Supervision. The
status is changed from C to D. These RIFs influence basic event C21.b. Improvement of the RIFs Painting and Tidiness and cleaning. The status is
changes from C to A. These RIFs influence the basic events C33 and C36 (see Figure 16 and Figure 17).
c. Improvement of the RIFs influencing the barrier System for detection of hydrocarbon releases. Since this barrier is not further analysed, the sensitivity analysis is carried out directly by changing the probability of failure to detect minor release by system for HC detection from 0.2 to 0.1.
d. Changes in RIFs influencing the distribution between diffuse, minor, and significant releases. The sensitivity analysis is carried out directly by changing the distribution to 10 % as diffuse, 40 % as minor, and 50 % as significant.
The results from the recalculation of the release frequencies due to corrosion basedon the revised input data are shown in Table 8. The sum of the release frequency dueto corrosion (?)CCGl + X>CCG2 from Table 6) is used as base case frequency for
assessment of the change in %.
Barrier and operational risk analysis of hydrocarbon releases (BORA-Release);Part II Results from a case study
Table 8. Results from sensitivity analyses for scenario C.
Sensitivity Release frequency no. Original Revised Change (%)
5 0.043 0.029 - 31.36 a 0.043 0.034 - 20.76 b 0.043 0.028 - 35.36 c 0.043 0.021 - 51.86 d 0.043 0.074 73.37 a 0.043 0.050 15.57 b 0.043 0.037 - 13.27 c 0.043 0.039 - 9.57 d 0.043 0.053 23.6
27

Barrier and operational risk analysis of hydrocarbon releases (BORA-Release);Part II Results from a case study
The main results from the sensitivity analyses are:
• Implementation of an additional barrier (3rd party control of work) in scenario A reduces the release frequency from scenario A and B with 77 % by use of generic data, and 68 % by use of revised data.
• Improvement of the scores of all RIFs by one grade reduces the release frequency from scenario A and B with 61 %.
• Improvement of the score of the RIF Communication (from D to C) reduces the release frequency from scenario A and B with 2 %.
• Improvement of the RIF Time pressure (from D to C) reduces the release frequency from scenario A and B with 28 %.
• Implementation of condition monitoring by use of corrosion coupons in dead legs reduce the expected release frequency due to corrosion by 31 %.
• Improvement of the efficiency of the inspection program has a relative high influence on the release frequency due to corrosion (see sensitivity 6a, 6b, and 6c). Changing from fairly effective to usually effective for corrosion group 1 reduces the expected release frequency by 21 %. Changing from fairly effective to highly effective for corrosion group 1 reduces the expected release frequency by 35 %. Changing from usually effective to highly effective for corrosion group 2 reduces the release frequency by 52 %.
• Reduction of the efficiency of the inspection program increases the expected release frequency due to corrosion. Changing from usually effective to fairly effective for corrosion group 2 increases the release frequency by 73 %.
• Increased probability of occurrence of basic event C12 (Inspection specified, but not performed as planned) from 0.1 to 0.2 (i.e., even more of the planned inspections are delayed or cancelled) leads to an increase in the release frequency due to corrosion by 16 %.
• Improvement of the status of the RIFs Painting, and Tidiness and cleaning has positive impact on the expected release frequency due to corrosion (reduction by13 %).
• Changing the probability of failure to detect minor release by system for HC detection from 0.2 to 0.1 reduces the release frequency by 10 %.
• Changes in the distribution between diffuse, minor and significant releases to 10 % as diffuse, 40 % as minor, and 50 % as significant, increase the release frequency 24 %.
28
4 Discussion and conclusionsBORA-Release has been used to analyse three hydrocarbon release scenarios on one specific oil and gas production platform on the Norwegian Continental Shelf. Application of BORA-Release for analysis of the loss of containment barrier evidently presents a more detailed risk picture than traditional QRA since no analyses of causal factors of hydrocarbon release are carried out in existing QRA. Analysis of consequence reducing barriers on the platform has not been within the scope of the case study.
The qualitative modelling of the release scenarios by use of barrier block diagrams has raised the question of which type of barriers that most effectively may prevent hydrocarbon release among personnel in the oil company. One example is the discussions of whether 3rd party control of work to reveal potential valve(s) in wrong position should be implemented as part of the flowline inspection. This discussion was supported by the results from the sensitivity analyses that showed that implementation of an additional barrier (3rd party control of work) in scenario A reduced the release frequency from scenario A and B with 77 % by use of generic data and 68 % by use of revised data. Similarly, the qualitative modelling of barrier performance by use of fault trees and risk influence diagrams raised the consciousness of different RIFs that influenced the barrier performance.
A main question as regards the quantitative results is whether the calculated release frequencies are trustworthy (i.e., we have confidence to the frequencies being able to provide good predictions of the actual number of releases) since the analysis is based on a number of assumptions and simplifications. These relate to the basic risk model, the generic input data, the risk influence diagrams, the scoring of RIFs, the weighting of RIFs, or the adjustment of the input data. The quantitative results in the case study for scenario A and B based on generic data were assessed to be reasonable compared to release statistics. This view was supported by the comments from the personnel from the actual oil company. The confidence in the results based on the revised input data was not as good due to use of the RNNS-data for scoring of RIFs. Since the scoring was based on few and generic questions not originally meant to be used as basis for RIF-scoring, the validity4 of the scoring was assessed to be low. The main reason for use of RNNS-data to assess the status of RIFs in the case study was the demand for use of existing data in order to minimize the use of resources from the industry representatives in the steering group for the BORA project. Since the revised release frequency to a high degree was influenced by the
Barrier and operational risk analysis of hydrocarbon releases (BORA-Release);Part II Results from a case study
4 Validity refers to whether or not it measures what it is supposed to measure [12].
29

results from the RNNS-survey, the approach chosen for scoring of RIFs should be discussed in the further work.
Another aspect of the scoring is how specific the assessment of the status of RIFs needs to be. This may be illustrated by an example; is it sufficient to assess the competence in general for all groups of personnel on a platform, or is it necessary to assess the competence for each group in order to reflect differences between the groups? As far as possible, the level of detail should be sufficiently detailed and specific to reflect scenario specific factors, but in practice, it may be necessary to be somewhat more general.
The confidence in the quantitative results from the corrosion scenario by personnel from the actual oil company is lower than for scenario A and B. The corrosion phenomenon is a complex and dynamic scenario and several assumptions made during the work should be further discussed. The present version is a test model and further research is required to better reflect how more aspects of the corrosion scenario influence the release frequency, e.g., the effect of the inspection reliability (see [13] for a discussion of attributes characterizing barrier performance).
The case study has demonstrated that BORA-Release is a useful tool for analysing the effect on the hydrocarbon release frequency of safety barriers introduced to prevent hydrocarbon releases, and to study the effect on the barrier performance of platform specific conditions of technical, human, operational, and organizational RIFs. One of the main application areas of BORA-Release may be to study the effect on the release frequency of risk reducing measures or risk increasing changes.
When it comes to further work, BORA-Release should be applied for analysis of the other release scenarios described in [5]. This set of release scenarios is considered to constitute a comprehensive and representative set of hydrocarbon release scenarios where the initiating events cover the most frequent “causes” of hydrocarbon releases. The scenarios include the most important barrier functions and barrier systems introduced prevent hydrocarbon release. A detailed analysis of these scenarios will increase the knowledge about how safety barriers influence the release frequency, and how technical, human, operational, and organisational RIFs influence the barrier performance on a platform.
The main focus on the further development of BORA-Release should be on other methods for assessment of the status of RIFs. Two possible ways are use of results from the TTS project [14], or to develop specific scoring schemes for the different RIFs similar to BARS as described in Jacobs and Haber [15]. Since the main focus
Barrier and operational risk analysis of hydrocarbon releases (BORA-Release);Part II Results from a case study
30
of the TTS project is on technical aspects of technical barriers, a combination of these two methods may be a possible approach. However, TTS projects are not carried out on all platforms on the Norwegian Continental Shelf. A more detailed discussion of BORA-Release in general and the different steps is presented in [3].
As stated, this case study has focused on analysis of the loss of containment. Further development of BORA-Release should also make an attempt to apply the method on consequence reducing barriers in order to test how suitable the method is for an overall risk analysis. An overall risk model including preventive, controlling, and protective barriers will also make it possible to analyse the effect of potential dependencies (common-cause failures) between different barriers in the event sequence.
5 AcknowledgementsThe case study is carried out as part of the BORA-project financed by the Norwegian Research Council, The Norwegian Oil Industry Association, and Health and Safety Executive in UK. The authors acknowledge personnel from the actual oil company that attended the workshops, and Helge Langseth at SINTEF for valuable input as regards quantification of the inspection effectiveness.
Barrier and operational risk analysis of hydrocarbon releases (BORA-Release);Part II Results from a case study
6 References[1] PSA, Regulations relating to management in the petroleum activities (The
Management Regulations). 3 September 2001, Petroleum Safety Authority Norway, Stavanger, 2001.
[2] Vinnem, J. E., Aven, T., Hauge, S., Seljelid, J. and Veire, G., Integrated Barrier Analysis in Operational Risk Assessment in Offshore Petroleum Operations, PSAM7 - ESREL'04, Berlin, 2004.
[3] Aven, T., Sklet, S. and Vinnem, J. E., Barrier and operational risk analysis of hydrocarbon releases (BORA-Release); Part I Method description, Journal of Hazardous Materials. Submitted for publication (2005).
[4] Sklet, S., Aven, T., Hauge, S. and Vinnem, J. E., Incorporating human and organizational factors in risk analysis for offshore installations, ESREL 2005, Gdynia, 2005.
[5] Sklet, S., Hydrocarbon releases on oil and gas production platforms; Release scenarios and safety barriers, Journal of Loss Prevention in the Process Industries. Accepted for publication (2005).
[6] Swain, A. D. and Guttmann, H. E., Handbook of human reliability analysis with emphasis on nuclear power plant applications: Final report NUREG CR-
31

1278, SAND80-200, Sandia National Laboratories Statistics Computing and Human Factors Division, Albuquerque, 1983.
[7] PSA, Trends in risk levels on the Norwegian Continental Shelf Main report Phase 4 2003 (In Norwegian; Utvikling i risikoniva norsk sokkel Hovedrapport Fase 4 2003), The Petroleum Safety Authority, Stavanger, 2004.
[8] Vinnem, J. E., Sklet, S., Aven, T. and Braarud, P. 0. Operational Risk Analysis - Total Analysis of Physical and Non-Physical Barriers. H2.6 Quantification of Leak Frequency with BBD methodology. Draft 0, Rev. 8, April 2005, Preventer, Bryne, Norway, 2005.
[9] API, Risk-Based Inspection Base Resource Document. API Publication 581, First Edition, American Petroleum Institute, Washington, USA, 2000.
[10] DNV, Risk Based Inspection of Offshore Topsides Static Mechanical Equipment, Recommended Practice, Det Norske Veritas, Norway, 2002.
[11] Rausand, M. and Hoyland, A., System reliability theory: models, statistical methods, and applications, Wiley-Interscience, Hoboken, NT., 2004.
[12] statistics, Britannica Student Encyclopedia, Encyclopaedia Britannica Online.10. nov. 2005 <httn://search,eb.com/ebi/article-208648>. 2005.
[13] Sklet, S., Safety barriers; definition, classification, and performance, Journal of Loss Prevention in the Process Industries. Submitted for publication (2005).
[14] Thomassen, O. and Sorum, M., Mapping and monitoring the technical safety level. SPE 73923, 2002.
[15] Jacobs, R. and Haber, S., Organisational processes and nuclear power plant safety, Reliability Engineering and System Safety. 45 (1994) 75 - 83.
Barrier and operational risk analysis of hydrocarbon releases (BORA-Release);Part II Results from a case study
32
Thesis - Part II Papers
Paper 5
Comparison of some selected methods for accident investigation
Snorre SkletJournal of Hazardous Materials
2004, Volume 111, Issues 1 - 3, Pages 29 - 37


ELSEVIER Journal of Hazardous Materials 111 (2004) 29-37
Journal ofHazardousMaterials
www.elsevier.com/locate/jhazmat
Comparison of some selected methods for accident investigationSnorre Sklet
The Norwegian University of Technology and Science (NTNU)ZSINTEF Industrial Management, N-7465 Trondheim, Norway
Available online 13 April 2004
Abstract
Even if the focus on risk management is increasing in our society, major accidents resulting in several fatalities seem to be unavoidable in some industries. Since the consequences of such major accidents are unacceptable, a thorough investigation of the accidents should be performed in order to learn from what has happened, and prevent future accidents.
During the last decades, a number of methods for accident investigation have been developed. Each of these methods has different areas of application and different qualities and deficiencies. A combination of several methods ought to be used in a comprehensive investigation of a complex accident.
This paper gives a brief description of a selection of some important, recognised, and commonly used methods for investigation of accidents. Further, the selected methods are compared according to important characteristics.© 2004 Elsevier B.V. All rights reserved.
Keywords: Accident investigation; Risk management; Accidents
1. Introduction
Even if the frequency is low, major accidents seem to be unavoidable in some low-frequency, high consequence industries. The process industry accidents at Longford [1] and on the Piper Alpha platform [2], the loss of the space-shuttles Challenger [3] and Colombia [4], the high speed craft Sleipner-accident [5], and the railway accidents at Ladbroke Grove [6] and Asta [7] are all tragic examples on major accidents in different industries. The consequences of such major accidents are not accepted in our society, therefore major accidents should be investigated in order to prevent them from reoccurring (called organisational learning by [8]). This is also in accordance with the evolutionary strategy for risk management (one out of three main strategies) described by [9].* 1
E-mail address: [email protected] (S. Sklet).1 [9] described the following three strategies for risk management:
• The empirical strategy, which is related to occupational safety (frequent, but small-scale accidents), and safety is typically controlled empirically from epidemiological studies of past accidents.
• The evolutionary strategy, where protection against medium size, infrequent accidents evolve from design improvements in response to analysis of the individual, latest major accidents.
• The analytical strategy, where protection against very rare and unacceptable accidents must be based on reliable, predictive models of accident processes and probability of occurrences (probabilistic risk/ safety analysis.
0304-3894/$ - see front matter © 2004 Elsevier B.V. All rights reserved.doi:10.1016/j.jhazmat.2004.02.005
The accident investigation process is described somewhat different by different authors. DOE [10] divides the process in three (partially overlapping) main phases: (i) collection of evidence and facts; (ii) analysis of evidence and facts and development of conclusions; and (iii) development of judgements and need and writing the report. Other authors, like Kjellen [11], also include the implementation and follow-up of recommendations as part of the investigation. The focus in this paper is on phase (ii), more specifically on methods available for analysis of evidence and facts helpful for development of conclusions.
COPS [12] describes three main purposes of techniques for accident investigation. The first purpose is to organise information about the accident once evidence has been collected. The second is to help in describing accident causation and developing hypothesis for further examination by experts, and the last is to help with the assessment of proposed corrective actions. In addition, the analytical techniques may also ensure that the results are transparent and verifiable.
During the last decades, a number of methods for accident investigation have been developed and described in the literature. Authors like Johnson [13], Handrick and Benner [14], Groeneweg [15] and Svensson [16] have developed and described their own investigation method, while CCPS [10], DOE [12] and [17] have reviewed and described several methods. In addition, a lot of companies and authorities
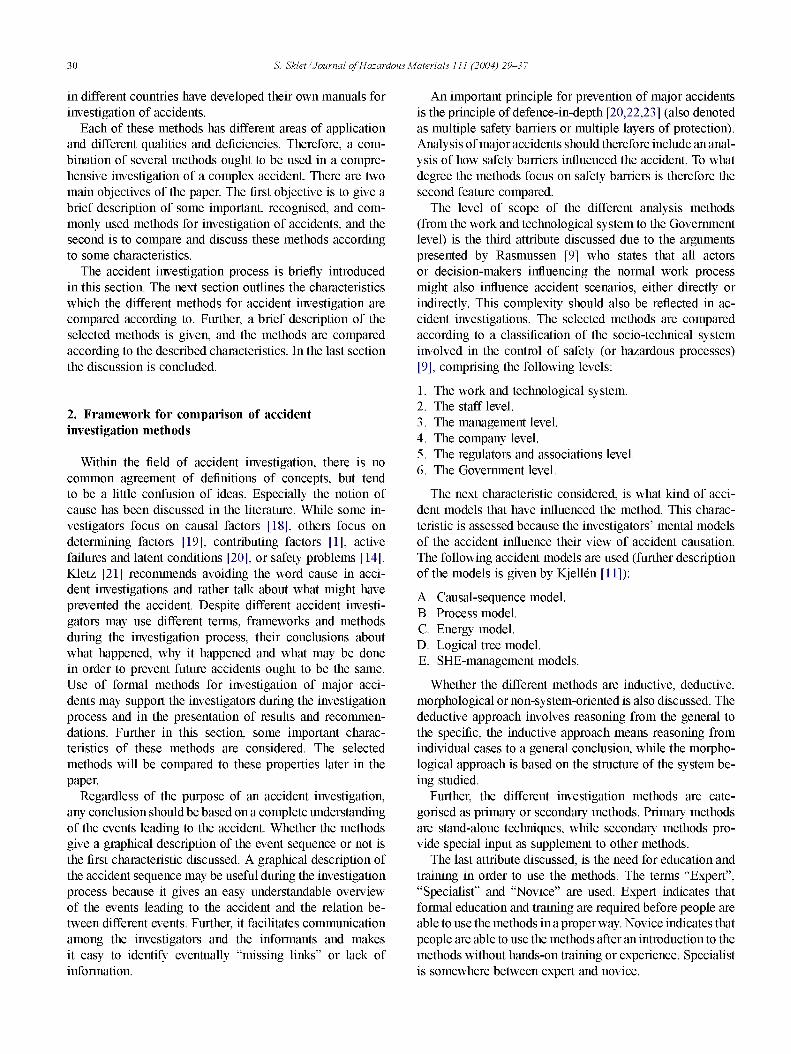
30 & jS%Zef/Jbw?7%zZ 777 f200^ 2P-^7
in different countries have developed their own manuals for investigation of accidents.
Each of these methods has different areas of application and different qualities and deficiencies. Therefore, a combination of several methods ought to be used in a comprehensive investigation of a complex accident. There are two main objectives of the paper. The first objective is to give a brief description of some important, recognised, and commonly used methods for investigation of accidents, and the second is to compare and discuss these methods according to some characteristics.
The accident investigation process is briefly introduced in this section. The next section outlines the characteristics which the different methods for accident investigation are compared according to. Further, a brief description of the selected methods is given, and the methods are compared according to the described characteristics. In the last section the discussion is concluded.
2. Framework for comparison of accident investigation methods
Within the field of accident investigation, there is no common agreement of definitions of concepts, but tend to be a little confusion of ideas. Especially the notion of cause has been discussed in the literature. While some investigators focus on causal factors [18], others focus on determining factors [19], contributing factors [1], active failures and latent conditions [20], or safety problems [14]. Kletz [21] recoimnends avoiding the word cause in accident investigations and rather talk about what might have prevented the accident. Despite different accident investigators may use different terms, frameworks and methods during the investigation process, their conclusions about what happened, why it happened and what may be done in order to prevent future accidents ought to be the same. Use of formal methods for investigation of major accidents may support the investigators during the investigation process and in the presentation of results and recommendations. Further in this section, some important characteristics of these methods are considered. The selected methods will be compared to these properties later in the paper.
Regardless of the purpose of an accident investigation, any conclusion should be based on a complete understanding of the events leading to the accident. Whether the methods give a graphical description of the event sequence or not is the first characteristic discussed. A graphical description of the accident sequence may be useful during the investigation process because it gives an easy understandable overview of the events leading to the accident and the relation between different events. Further, it facilitates communication among the investigators and the informants and makes it easy to identify eventually “missing links” or lack of information.
An important principle for prevention of major accidents is the principle of defence-in-depth [20,22,23] (also denoted as multiple safety barriers or multiple layers of protection). Analysis of major accidents should therefore include an analysis of how safety barriers influenced the accident. To what degree the methods focus on safety barriers is therefore the second feature compared.
The level of scope of the different analysis methods (from the work and technological system to the Government level) is the third attribute discussed due to the arguments presented by Rasmussen [9] who states that all actors or decision-makers influencing the normal work process might also influence accident scenarios, either directly or indirectly. This complexity should also be reflected in accident investigations. The selected methods are compared according to a classification of the socio-teclmical system involved in the control of safety (or hazardous processes) [9], comprising the following levels:
1. The work and technological system.2. The staff level.3. The management level.4. The company level.5. The regulators and associations level.6. The Government level.
The next characteristic considered, is what kind of accident models that have influenced the method. This characteristic is assessed because the investigators’ mental models of the accident influence their view of accident causation. The following accident models are used (further description of the models is given by Kjellen [11]):
A. Causal-sequence model.B. Process model.C. Energy model.D. Logical tree model.E. SHE-management models.
Whether the different methods are inductive, deductive, morphological or non-system-oriented is also discussed. The deductive approach involves reasoning from the general to the specific, the inductive approach means reasoning from individual cases to a general conclusion, while the morphological approach is based on the structure of the system being studied.
Further, the different investigation methods are categorised as primary or secondary methods. Primary methods are stand-alone techniques, while secondary methods provide special input as supplement to other methods.
The last attribute discussed, is the need for education and training in order to use the methods. The terms “Expert”, “Specialist” and “Novice” are used. Expert indicates that formal education and training are required before people are able to use the methods in a proper way. Novice indicates that people are able to use the methods after an introduction to the methods without hands-on training or experience. Specialist is somewhere between expert and novice.

& jSWgf/JowmaZ q/'TT'ozarckwf MafgnaZf 777 (1200^ 2P-.37 31
3. Methods for accident investigation
A number of methods for accident investigation have been developed, with their own strengths and weaknesses. Some methods of great importance are selected for further examination in this paper. The selection of methods is based on the following selection criteria: The methods should be widely used in practice, well acknowledged, described in the literature and some of the methods should be relatively recently developed. Based on these criteria, the following methods were selected for comparison:
• Events and causal factors charting and analysis.• Barrier analysis.• Change analysis.• Root cause analysis.• Fault tree analysis.• Influence diagram.• Event tree analysis.• Management and Oversight Risk Tree (MORT).• Systematic Cause Analysis Technique (SCAT).• Sequential Timed Events Plotting (STEP).• Man, Technology and Organisation (MTO)-analysis.• The Accident Evolution and Barrier Function (AEB)-
method.• TRIPOD.• Acci-Map.
3.1. Events and causal factors charting (ECFC) and events and causal factors analysis
Events and causal factors charting [10] is a graphical display of the accident’s chronology, and is used primarily for compiling and organising evidence to portray the sequence of the accident’s events. The events and causal factors chart consists of the primary events sequence, secondary events sequences and conditions influencing the events.
The primary sequence of events that led to an accident is drawn horizontally, chronologically, from left to right in the diagram. Secondary events are then added to the events and causal factors chart, inserted where appropriate in a line above the primary sequence line. Events are active and are stated using one noun and one active verb. Conditions that affect either the primary or secondary events are then placed above or below these events. Conditions are passive and describe states or circumstances rather than occurrences or events.
Events and causal factors analysis is the application of analysis to determine causal factors by identifying significant events and conditions that led to the accident. As the results from other analytical techniques are completed, they are incorporated into the events and causal factors chart. “Assumed” events and conditions may also be incorporated in the chart.
The events and causal factors chart are used to determine the causal factors of an accident, as illustrated in Fig. 1.
Ask questions to determine causal factors (why, how,
what, and who)
(Causal factor)
Causal factor
Why did the system allow the conditions to exist?
How did the conditions originate?
Event Event
Why did this event happen?
Event
Fig. 1. Events and causal factors analysis [10].
This process is an important first step in later determining the root causes of an accident. Events and causal factors analysis requires deductive reasoning to determine which events and/or conditions that contributed to the accident.
3.2. Barrier analysis
Barrier analysis [10] is used to identify hazards associated with an accident and the barriers that should have been in place to prevent it.
A barrier is any means used to control, prevent, or impede the hazard from reaching the target. Two main types of barriers are described: physical barriers and management barriers. To analyse management barriers, investigators may need to obtain information about barriers at three organisational levels responsible for the work: the activity, facility and institutional levels.
The barrier analysis addresses:
• Barriers that were in place and how they performed.• Barriers that were in place but not used.• Barriers that were not in place but were required.• The barrier(s) that, if present or strengthened, would pre
vent the same or similar accidents from occurring in the future.
The basic steps in a barrier analysis are:
1. Identify the hazard and the target.2. Identify each barrier.3. Identify how the barrier performed.4. Identify and consider probable causes for the barrier fail
ure.5. Evaluate the consequences of the failure in this accident.
3.3. Change analysis
Change analysis [10] examines planned or unplanned changes that caused undesired outcomes. Change is anything that disturbs the “balance ” of a system operating as planned. Changes are often the sources of deviations in system operations. In an accident investigation, this technique is used to examine an accident by analysing the difference between what lias occurred before or was expected and the
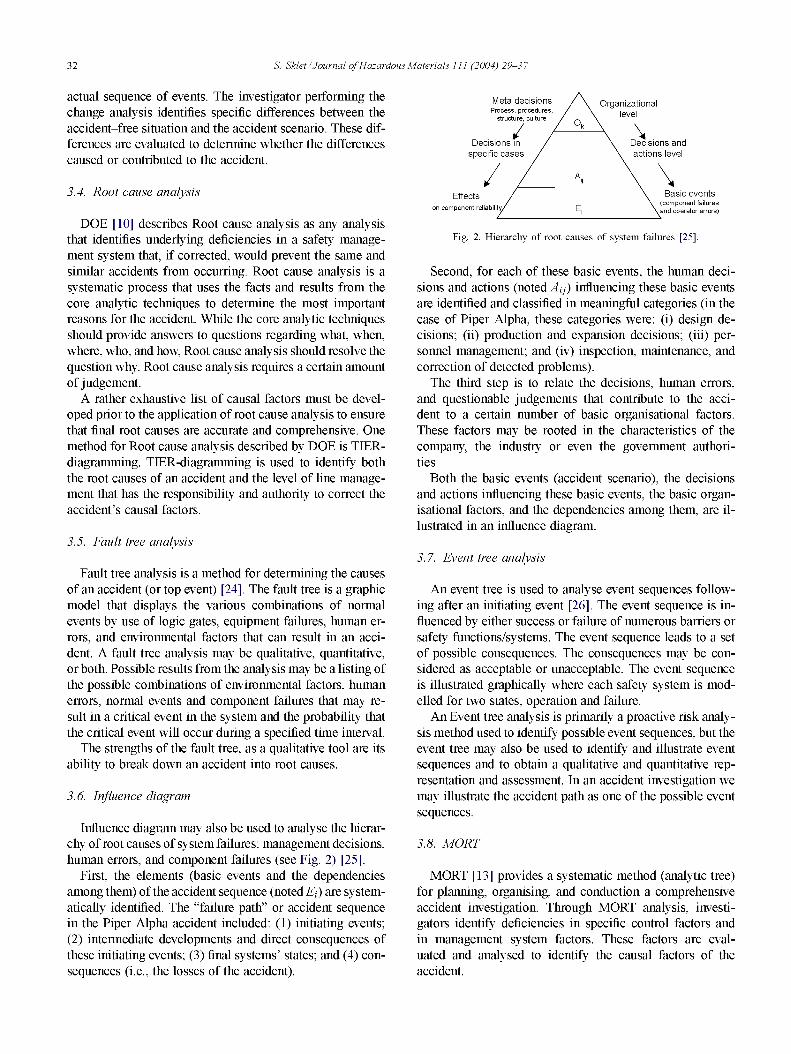
32 & jS%Zef/Jbw?7%zZ 777 f200^ 2P-^7
actual sequence of events. The investigator performing the change analysis identifies specific differences between the accident-free situation and the accident scenario. These differences are evaluated to determine whether the differences caused or contributed to the accident.
3.4. Root cause analysis
DOE [10] describes Root cause analysis as any analysis that identifies underlying deficiencies in a safety management system that, if corrected, would prevent the same and similar accidents from occurring. Root cause analysis is a systematic process that uses the facts and results from the core analytic techniques to determine the most important reasons for the accident. While the core analytic techniques should provide answers to questions regarding what, when, where, who, and how. Root cause analysis should resolve the question why. Root cause analysis requires a certain amount of judgement.
A rather exhaustive list of causal factors must be developed prior to the application of root cause analysis to ensure that final root causes are accurate and comprehensive. One method for Root cause analysis described by DOE is TIER- diagraimning. TIER-diagramming is used to identity both the root causes of an accident and the level of line management that has the responsibility and authority to correct the accident’s causal factors.
3.5. Fault tree analysis
Fault tree analysis is a method for determining the causes of an accident (or top event) [24]. The fault tree is a graphic model that displays the various combinations of normal events by use of logic gates, equipment failures, human errors, and environmental factors that can result in an accident. A fault tree analysis may be qualitative, quantitative, or both. Possible results from the analysis may be a listing of the possible combinations of environmental factors, human errors, normal events and component failures that may result in a critical event in the system and the probability that the critical event will occur during a specified time interval.
The strengths of the fault tree, as a qualitative tool are its ability to break down an accident into root causes.
3.6. Influence diagram
Influence diagram may also be used to analyse the hierarchy of root causes of system failures: management decisions, human errors, and component failures (see Fig. 2) [25].
First, the elements (basic events and the dependencies among them) of the accident sequence (noted £)) are systematically identified. The “failure path” or accident sequence in the Piper Alpha accident included: (1) initiating events; (2) intermediate developments and direct consequences of these initiating events; (3) final systems’ states; and (4) consequences (i.e., the losses of the accident).
Meta decisionsProcess, procedures,
structure, culture
Organizationallevel
Decisions in specific cases
Decisions and actions level
Basic events(component failures and operator errors)
Effectson component reliability/
Fig. 2. Hierarchy of root causes of system failures [25].
Second, for each of these basic events, the human decisions and actions (noted .1,,) influencing these basic events are identified and classified in meaningful categories (in the case of Piper Alpha, these categories were: (i) design decisions; (ii) production and expansion decisions; (iii) personnel management; and (iv) inspection, maintenance, and correction of detected problems).
The third step is to relate the decisions, human errors, and questionable judgements that contribute to the accident to a certain number of basic organisational factors. These factors may be rooted in the characteristics of the company, the industry or even the government authorities.
Both the basic events (accident scenario), the decisions and actions influencing these basic events, the basic organisational factors, and the dependencies among them, are illustrated in an influence diagram.
3.7. Event tree analysis
An event tree is used to analyse event sequences following after an initiating event [26]. The event sequence is influenced by either success or failure of numerous barriers or safety functions/systems. The event sequence leads to a set of possible consequences. The consequences may be considered as acceptable or unacceptable. The event sequence is illustrated graphically where each safety system is modelled for two states, operation and failure.
An Event tree analysis is primarily a proactive risk analysis method used to identity possible event sequences, but the event tree may also be used to identify and illustrate event sequences and to obtain a qualitative and quantitative representation and assessment. In an accident investigation we may illustrate the accident path as one of the possible event sequences.
A/ORT
MORT [13] provides a systematic method (analytic tree) for planning, organising, and conduction a comprehensive accident investigation. Through MORT analysis, investigators identify deficiencies in specific control factors and in management system factors. These factors are evaluated and analysed to identify the causal factors of the accident.

S. SMet / Journal of Hazardous Materials 111 (2004) 29—37 33
Lack of control
Basiccauses
Immediatecauses
Incident Loss
Inadequate:
Program Program
standards Compliance to standards
Personalfactors
Job factors
Substandardacts
Substandardconditions
Contact with energy,
substance or people
PeoplePropertyProduct
EnvironmentService
Fig. 3. The ILCI Loss Causation Model [27].
Basically, MORT is a graphical checklist in which contains generic questions that investigators attempt to answer using available factual data. This enables investigators to focus on potential key causal factors.
3.9. Systematic Cause Analysis Technique (SCAT)
The International Loss Control Institute (ILCI) developed SCAT [12] for the support of occupational incident investigation. The ILCI Loss Causation Model [27] is the framework for the SCAT system (see Fig. 3).
The Systematic Cause Analysis Technique is a tool to aid an investigation and evaluation of accidents through the application of SCAT chart. The chart acts as a checklist to ensure that an investigation has looked at all facets of an accident. There are five blocks on a SCAT chart. Each block corresponds to a block of the Loss Causation Models.
3.10. Sequential Timed Events Plotting (STEP)
The STEP-method [14] proposes a systematic process for accident investigation based on multi-linear sequences of events and a process view of the accident phenomena. STEP builds on four concepts:
1. Neither the accident nor its investigation is a single linear sequence of events. Rather, several activities take place at the same time.
2. The event Building Block format for data is used to develop the accident description in a worksheet. A building block describes one event, i.e., one actor performing one action.
3. Events flow logically during a process. Arrows in the STEP worksheet illustrate the flow.
4. Both productive and accident processes are similar and can be understood using similar investigation procedures. They both involve actors and actions, and both are capable of being repeated once they are understood.
A STEP-worksheet provides a systematic way to organise the building blocks into a comprehensive, multi-linear description of the accident process. The STEP worksheet is simply a matrix, with one row for each actor and events (an action performed by an actor) along a horizontally timescale. Arrows are used to link tested relationships among events in
the accident sequence. The STEP methodology also includes a recommended method for identification of safety problems and development of safety recommendations. Safety problems are marked with diamonds in the STEP worksheet.
3.11. MTO-analvsis
The basis for the MTO-analysis is that human, organisational, and technical factors should be focused equally in an accident investigation [28,29],2 The method is based on Human Performance Enhancement System (HPES) which is not described further in this paper.
The MTO-analysis is based on three methods:
1. Structured analysis by use of an event- and cause- diagrams.
2. Change analysis by describing how events have deviated from earlier events or coimnon practice.
3. Barrier analysis by identifying technological and administrative barriers in which have failed or are missing.
Fig. 4 illustrates the MTO-analysis worksheet. The first step in an MTO-analysis is to develop the event sequence longitudinally and illustrate the event sequence in a block diagram. The next step is to identify possible technical and human causes of each event and draw these vertically to each event in the diagram. Further, analyse which technical, human or organisational barriers that have failed or was missing during the accident progress and illustrate all missing or failed barriers below the events in the diagram. Assess which deviations or changes in which differ the accident progress from the normal situation. These changes are also illustrated in the diagram (see Fig. 4).
A checklist for identification of failure causes is also part of the MTO-methodology [29]. The checklist contains the following factors: Work organisation. Work practice. Management of work. Change procedures. Ergonomic/deficiencies in the technology. Communication, Instructions/procedures, Education/competence, and Work environment. For each of these failure causes, there is a detailed checklist for basic or fundamental causes.
2 The MTO-analysis has been widely used in the Norwegian offshore industry recently, but it has been difficult to obtain a comprehensive description of the method.
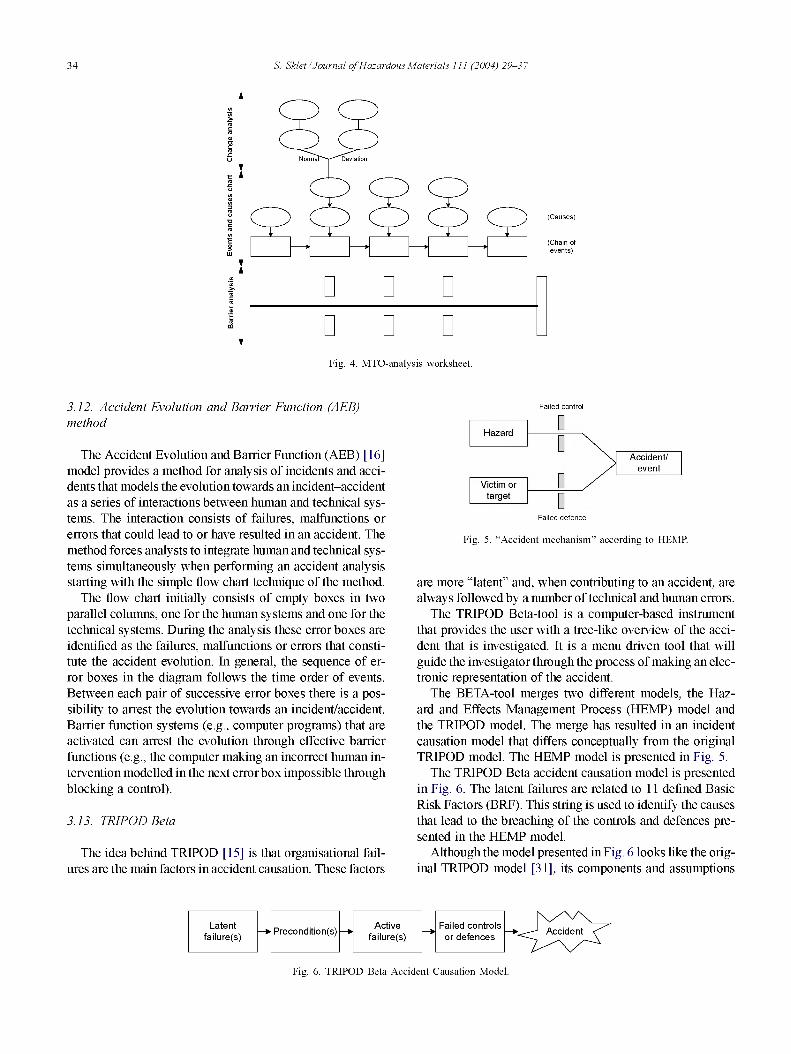
34 S. SMet / Journal of Hazardous Materials 111 (2004) 29—37
Fig. 4. MTO-analysis worksheet.
3.12. Accident Evolution and Barrier Function (AEB) method
The Accident Evolution and Barrier Function (AEB) [16] model provides a method for analysis of incidents and accidents that models the evolution towards an incident-accident as a series of interactions between human and technical systems. The interaction consists of failures, malfunctions or errors that could lead to or have resulted in an accident. The method forces analysts to integrate human and technical systems simultaneously when performing an accident analysis starting with the simple flow chart technique of the method.
The flow chart initially consists of empty boxes in two parallel columns, one for the human systems and one for the technical systems. During the analysis these error boxes are identified as the failures, malfunctions or errors that constitute the accident evolution. In general, the sequence of error boxes in the diagram follows the time order of events. Between each pair of successive error boxes there is a possibility to arrest the evolution towards an incident/accident. Barrier function systems (e.g., computer programs) that are activated can arrest the evolution through effective barrier functions (e.g., the computer making an incorrect human intervention modelled in the next error box impossible through blocking a control).
The idea behind TRIPOD [15] is that organisational failures are the main factors in accident causation. These factors
Failed control
Hazard
Victim or target
Accident/event
Failed defence
Fig. 5. “Accident mechanism” according to HEMP.
are more “latent” and, when contributing to an accident, are always followed by a number of technical and human errors.
The TRIPOD Beta-tool is a computer-based instrument that provides the user with a tree-like overview of the accident that is investigated. It is a menu driven tool that will guide the investigator through the process of making an electronic representation of the accident.
The BETA-tool merges two different models, the Hazard and Effects Management Process (HEMP) model and the TRIPOD model. The merge has resulted in an incident causation model that differs conceptually from the original TRIPOD model. The HEMP model is presented in Fig. 5.
The TRIPOD Beta accident causation model is presented in Fig. 6. The latent failures are related to 11 defined Basic Risk Factors (BRF). This string is used to identify the causes that lead to the breaching of the controls and defences presented in the HEMP model.
Although the model presented in Fig. 6 looks like the original TRIPOD model [31], its components and assumptions
Fig. 6. TRIPOD Beta Accident Causation Model.
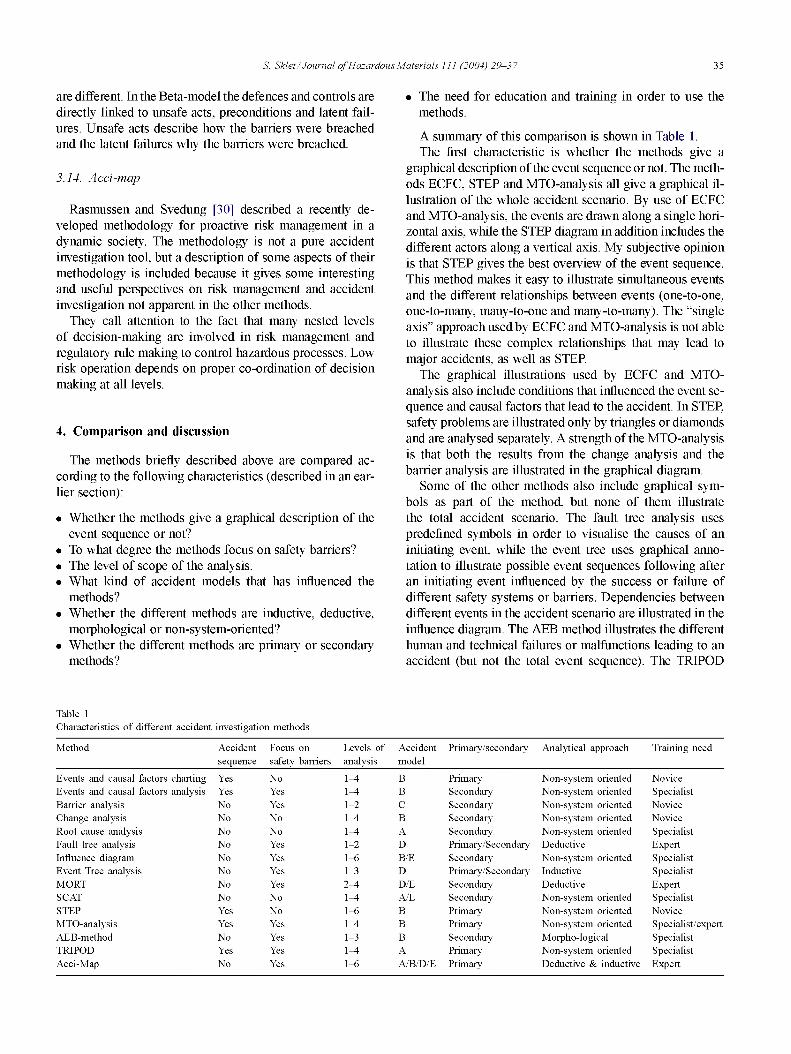
& jSWgf/JowmaZ q/'TT'ozarckwf MafgnaZf 777 (1200^ 2P-.37 35
are different. In the Beta-model the defences and controls are directly linked to unsafe acts, preconditions and latent failures. Unsafe acts describe how the barriers were breached and the latent failures why the barriers were breached.
3.14. Acci-map
Rasmussen and Svedung [30] described a recently developed methodology for proactive risk management in a dynamic society. The methodology is not a pure accident investigation tool, but a description of some aspects of their methodology is included because it gives some interesting and useful perspectives on risk management and accident investigation not apparent in the other methods.
They call attention to the fact that many nested levels of decision-making are involved in risk management and regulatory rule making to control hazardous processes. Low risk operation depends on proper co-ordination of decision making at all levels.
4. Comparison and discussion
The methods briefly described above are compared according to the following characteristics (described in an earlier section):
• Whether the methods give a graphical description of the event sequence or not?
• To what degree the methods focus on safety barriers?• The level of scope of the analysis.• What kind of accident models that has influenced the
methods?• Whether the different methods are inductive, deductive,
morphological or non-system-oriented?• Whether the different methods are primary or secondary
methods?
• The need for education and training in order to use themethods.
A summary of this comparison is shown in Table 1.The first characteristic is whether the methods give a
graphical description of the event sequence or not. The methods ECFC, STEP and MTO-analysis all give a graphical illustration of the whole accident scenario. By use of ECFC and MTO-analysis, the events are drawn along a single horizontal axis, while the STEP diagram in addition includes the different actors along a vertical axis. My subjective opinion is that STEP gives the best overview of the event sequence. This method makes it easy to illustrate simultaneous events and the different relationships between events (one-to-one, one-to-many, many-to-one and many-to-many). The “single axis” approach used by ECFC and MTO-analysis is not able to illustrate these complex relationships that may lead to major accidents, as well as STEP.
The graphical illustrations used by ECFC and MTO- analysis also include conditions that influenced the event sequence and causal factors that lead to the accident. In STEP, safety problems are illustrated only by triangles or diamonds and are analysed separately. A strength of the MTO-analysis is that both the results from the change analysis and the barrier analysis are illustrated in the graphical diagram.
Some of the other methods also include graphical symbols as part of the method, but none of them illustrate the total accident scenario. The fault tree analysis uses predefined symbols in order to visualise the causes of an initiating event, while the event tree uses graphical annotation to illustrate possible event sequences following after an initiating event influenced by the success or failure of different safety systems or barriers. Dependencies between different events in the accident scenario are illustrated in the influence diagram. The AEB method illustrates the different human and technical failures or malfunctions leading to an accident (but not the total event sequence). The TRIPOD
Table 1Characteristics of different accident investigation methods
Method Accidentsequence
Focus on safety barriers
Levels of analysis
Accidentmodel
Primary/secondary Analytical approach Training need
Events and causal factors charting Yes No 1^1 B Primary Non-system oriented NoviceEvents and causal factors analysis Yes Yes 1^1 B Secondary Non-system oriented SpecialistBarrier analysis No Yes 1-2 C Secondary Non-system oriented NoviceChange analysis No No 1^1 B Secondary Non-system oriented NoviceRoot cause analysis No No 1^1 A Secondary Non-system oriented SpecialistFault tree analysis No Yes 1-2 D Primary/Secondary Deductive ExpertInfluence diagram No Yes 1-6 B/E Secondary Non-system oriented SpecialistEvent Tree analysis No Yes 1-3 D Primary/Secondary Inductive SpecialistMORT No Yes 2^1 D/E Secondary Deductive ExpertSCAT No No 1^1 A/E Secondary Non-system oriented SpecialistSTEP Yes No 1-6 B Primary Non-system oriented NoviceMTO-analysis Yes Yes 1^1 B Primary Non-system oriented Specialist/expertAEB-method No Yes 1-3 B Secondary Morpho-logical SpecialistTRIPOD Yes Yes 1^1 A Primary Non-system oriented SpecialistAcci-Map No Yes 1-6 A/B/D/E Primary Deductive & inductive Expert
36 & jS%Zef/Jbw?7%zZ 777 f200^ 2P-^7
Beta illustrates grapliically a target (e.g., worker), a hazard (e.g., hot pipework) and the event (e.g., worker gets burned) in addition to the failed or missing defences caused by active failures, preconditions and latent failures (BRF) (“event trios”).
Several of the methods focus on safety barriers. First of all, the only purpose of barrier analysis is analysis of safety barriers. The results from the barrier analysis may also be included in the Events and Causal Factor Analysis as causal factors. The fault tree analysis is suitable for analysis of failures of barriers, while the Event tree analysis may be used to analyse the effect of failure or success of different safety barriers. Failure or loss of safety barriers may be illustrated directly in an influence diagram. In a STEP-analysis, missing, or failures of barriers may be illustrated as safety problems and investigated further in separate analyses. Analyses of barriers are separate parts of both MTO-analysis and the AEB-method. Both failed and functioning barriers are illustrated in the schemes. TRIPOD Beta used the term defence, and identification and analysis of missing defences is a vital part of the tool. An assessment of whether barriers are less than adequate (LTA) is also a part of MORT. Acci-Map does not focus directly on safety barriers, but indirectly through the effects of decisions made by decision-makers at all levels of the socio-teclmical system.
Concerning the scope of the methods, it seems as the scope of most of the methods is limited to Level 1 (the work and technological system) to Level 4 (the company level) of the socio-teclmical system involved in the control of safety (or hazardous processes). Although STEP was originally developed to cover Level 1-4, experience from SINTEF’s accident investigations show that the method also may be used to analyse events influenced by the regulators and the Government. In addition to STEP, only influence diagram and Acci-Map put focus on Level 5 and 6. This means that investigators focusing on the Government and the regulators in their accident investigation to a great extend need to base their analysis on experience and practical judgement, more than on results from formal analytical methods.
The investigation methods are influenced by different accident models. Both the Root cause analysis, SCAT and TRIPOD are based on causal-sequence models. Events and causal charting and analysis, change analysis, STEP, MTO- analysis, and the AEB-method are all based on process models. The barrier analysis is based on the energy model, while fault tree analysis. Event tree analysis and MORT are based on logical tree models. MORT and SCAT are also based on SHE-management models. The influence diagram is based on a combination of a process model and a SHE- management model, while the Acci-map is based on a combination of a causal-sequence model, a process model, a logical tree model, and a SHE-management model.
There is also made an assessment whether the methods are a primary method or a secondary method. Primary methods are stand-alone techniques, while secondary methods provide special input as supplement to other methods. Events
and Causal Factors Charting and Analysis, STEP, MTO- analysis, TRIPOD and Acci-map are all primary methods. The fault tree analysis and Event tree analysis might be both primary and secondary methods. The other methods are secondary methods that might give valuable input to the other investigation methods.
The different methods may have a deductive, inductive, morphological, or non-system oriented approach. Fault tree analysis and MORT are deductive methods while event three analysis is an inductive method. Acci-map might be both inductive and deductive. The AEB-method is characterised as morphological, while the other methods are non-system oriented.
The last characteristic assessed, is the need of education and training in order to use the methods. The terms “Expert”, “Specialist” and “Novice” are used in the table. Fault tree analysis, MORT and Acci-map enter into the “experf’-category. ECFC, barrier analysis, change analysis and STEP enter into the category “novice”. “Specialist” is somewhere between “expert” and “novice”, and Events and Causal Factors Analysis, Root cause analysis. Event tree analysis, SCAT, MTO-analysis, AEB-method and TRIPOD enter into this category.
5. Conclusion
Seen from a safety scientist’s view, the aim of accident investigations should be to identify the event sequences and all (causal) factors influencing the accident scenario in order to be able to suggest risk reducing measures suitable for prevention of future accidents. Experience from accidents shows that major accidents almost never result from one single cause, but most accidents involve multiple, interrelated, causal factors. All actors or decision-makers influencing the normal work process might also influence accident scenarios, either directly or indirectly. This complexity should be reflected in the accident investigation process, and there may be need for analytical techniques to support the investigators to structure information and focus on the most important features.
Several methods for accident investigation have been developed during the last decades. Each of the methods has different areas of application and qualities and deficiencies, such that a combination of methods ought to be used in a comprehensive investigation of a complex accident. A selection of methods is described in this paper and the methods are compared according to some characteristics. This comparison is summarised in Table 1.
Some of the methods may be used to visualise the accident sequence, and are useful during the investigation process because it provides an effective visual aid that summarises key information and provide a structured method for collecting, organising and integrating collected evidence to facilitate communication among the investigators. Graphical illustrations also help identifying information gaps.
& jSWgf/JowmaZ MafgnaZf 777 (1200^ 2P-.37 37
Most of the examined methods include an analysis of safety barriers, but it seems that most of the methods are limited to focus on Level 1 (the work and technological system) to Level 4 (the company level) of the socio-technical system involved in the control of safety (or hazardous processes). This means that investigators focusing on the Government and the regulators in their accident investigation to a great extend need to base their analysis on experience and practical judgement, more than on results from formal analytical methods.
During the investigation process, different methods might be used in order to analyse arising problem areas. Among a multi-disciplinary investigation team, there should be at least one member having good knowledge about the different accident investigation methods, being able to choose the proper methods for analysing the different problems. Just like the technicians have to choose the right tool on order to repair a technical system, an accident investigator has to choose proper methods analysing different problem areas.
References
[1] A. Hopkins, Lessons from Longford, CCH Australia Limited, Australia. 2000. ISBN 1 86468 422 4.
[2] Cullen, Tire Public Inquiry into the Piper Alpha Disaster, HMSO Publication, United Kingdom, 1990, ISBN 0 10 113102.
[3] D. Vaughan, Tire Challenger Launch Decision: Risky Technology, Culture and Deviance at NASA, University of Chicago Press, London, 1996.
[4] NASA, 2003, http://www.nasa.gov/colunrbia/.[5] NOU, Hurtigbaten MS Sleipners forlis 26 November 1999, Justis-
departenrentet, vol. 31, 2000.[6] Cullen, Tire Ladbroke Grove Rail Inquiry: Report, Part 1, HSE
Books, United Kingdom, 2001, ISBN 0 7176 2056 5.[7] NOU, Asta-ulykken, vol. 30, Justisdepartenrentet, 4 Januar 2000.[8] A. Hale, Introduction: the goals of event analysis, in: A. Hale,
B. Wilpert, M. Freitag (Eds.), After The Event From Accident to Organizational Learning, Perganron Press, 1997, ISBN 0 08 0430740.
[9] J. Rasmussen, Risk management in a dynamic society: a modelling problem, Safety Sci. 27 (2-3) (1997) 183-213.
[10] DOE, Conducting Accident Investigations, DOE Workbook, Revision 2, US Department of Energy, Washington, DC, USA, 1 May 1999.
[11] U. Kjellen, Prevention of Accidents Thorough Experience Feedback, Taylor & Francis, London, UK, 2000, ISBN 0-7484-0925-4.
[12] CCPS, Guidelines for Investigating Chemical Process Incidents, Center for Chemical Process Safety of the American Institute of Chemical Engineers, 1992, ISBN 0-8169-0555-X.
[13] W.G. Johnson, MORT Safety Assurance Systems, Marcel Dekker, New York, USA, 1980.
[14] K. Hendrick, L. Benner Jr., Investigating Accidents with STEP, Marcel Dekker, New York, 1987, ISBN 0-8247-7510-4.
[15] J. Groeneweg, Controlling the controllable, Tire Management of Safety, 4th ed., DSWO Press, Leiden University, Tire Netherlands, 1998.
[16] O. Svensson, Accident Analysis and Barrier Function (AEB) Method—Manual for Incident Analysis, ISSN 1104-1374, SKI Report 00:6, Sweden, 2000.
[17] A.D. Livingston, G. Jackson, K. Priestley, Root Causes Analysis: Literature Review, Contract Research Report 325/2001, HSE Books, 2001. ISBN 0 7176 1966 4.
[18] DOE, Implementation Guide For Use With DOE Order 225.1 A, Accident Investigations, DOE G 225.1A-1, Revision 1, US Department of Energy, Washington, DC, USA, 26 November 1997.
[19] U. Kjellen, T.J. Larsson, Investigating accidents and reducing risks—a dynamic approach, J. Occup. Accid. 3 (1981) 129-140.
[20] J. Reason, Managing the Risks of Organizational Accidents, Ashgate, England. 1997. ISBN 1 84014 105 0.
[21] T. Kletz, Learning from Accidents, 3rd ed., Gulf Professional Publishing. UK. 2001. ISBN 0 7506 4883 X.
[22] IAEA, INSAG-12, Basic Safety Principles for Nuclear Power Plants 75-INSAG-3, Revision 1, IAEA, Vienna, 1999.
[23] CCPS, Layer of Protection Analysis Simplified Process Risk Assessment, Center for Chemical Process Safety, New York, 2001, ISBN 0-8169-0811-7.
[24] A. Hoyland, M. Rausand, System reliability Theory: Models and Statistical Methods, Wiley, New York, 1994, ISBN 0-471-59397-4.
[25] M.E. Pate-Comell, Learning from the piper alpha accident: a postmortem analysis of technical and organizational factors, Risk Analysis, vol. 13, No. 2, 1993.
[26] A. Villemeur, Reliability, Availability, Maintainability and Safety Assessment—Methods and Techniques, vol. 1, Chichester, UK, 1991, ISBN 0 471 93048 2.
[27] EE. Bird Jr., G.L. Germain, Practical Loss Control Leadership, International Loss Control Institute, Georgia, USA, 1985, ISBN 0- 88061-054-9.
[28] C. Rollenhagen, MTO—En Introduktion, Sambandet Manniska, Teknik och Organisation, Studentlitteratur, Lund, Sweden, 1995, ISBN 91-44-60031-3.
[29] J.P. Bento, MTO-analys av handelsesrapporter, OD-OO-2, Oljedirek- toratet, Stavanger, 1999.
[30] J. Rasmussen, I. Svedung, Proactive Risk Management in a Dynamic Society, Swedish Rescue Services Agency, 2000, ISBN 91-7253- 084-7.
[31] J. Reason, et al., TRIPOD—A Principled Basis for Accident Prevention, 1988.

Thesis - Part II Papers
Paper 6
Qualitative Analysis of Human, Technical and Operational Barrier Elements during Well Interventions
Snorre Sklet, Trygve Steiro, Odd Tjelta ESREL 2005, Tri City, Poland

Qualitative Analysis of Human, Technical and Operational Barrier Elements during Well Interventions
S. Sklet & T. SteiroSINTEF Technology and Society, Dept. of Safety and Reliability
O. TjeltaPetroleum Safety Authorithy Norway
ABSTRACT: There has been established a common goal to reduce the number of major hydrocarbon releases by 50 % in the Norwegian oil and gas industry. Several initiatives have been established including initiatives focusing on barriers to improve the safety standards. Traditionally a lot of attention has been directed towards leakages from the topside process equipment on the platform. However, in order to meet the overall objectives of the industry, focus should also be put on the risk of release during well interventions. This paper presents results from a case study where the main objective has been to analyse the risk of release of hydrocarbons associated with well interventions. The focus of the case study has been wireline operations, and the purpose has been to identify and analyze physical and non-physical barriers aimed to prevent release of hydrocarbons during wireline operations.
1 INTRODUCTION
1.1 Background
There has been established a common goal to reduce the number of major hydrocarbon (HC) releases by 50 % in the Norwegian oil and gas industry. Several initiatives have been established including initiatives focusing on barriers to improve the safety standards. It has been stressed that leakages could serve as the most leading indicator with regards to major accidents (0ien & Sklet, 2001).
Traditionally a lot of attention has been directed towards leakages from the topside process equipment on the platforms. However, in order to meet the overall objectives of the industry, focus should also be put on
the risk of release due to well interventions. The operator company is responsible for running the continuous process on the platform, whereas well interventions are interrupted activities mainly performed as shorttime projects by contractor companies (well service companies). This means that the interfaces between the operator company and the contractors are of great interest as regards planning, co-operation, communication, etc. Well interventions are often the subject of time pressure from both the process side and the drilling side that may lead to conflict of interest between productivity and safety.
The Petroleum Safety Authorities Norway (PSA) consider control of safety barriers as an important means in order to control the risk on oil and gas production platforms, and focus on control of safety barriers in their safety regulations (PSA, 2001).
Qualitative analysis of human, technical, and operational barrier elements during well interventions
In 2002, PSA initiated a project that focused on the risk of release of hydrocarbons during well interventions. The main objective of this project has been to ensure a better and more systematic understanding of human, technological and organizational aspects of the risk associated with well interventions.
Further, the objectives may be summarized as:- To improve planning (both onshore and
offshore) and improve the co-operation between onshore and offshore personnel.
- To identify both physical and nonphysical barriers aimed to prevent release of hydrocarbons during wireline operations (WL).
- To ensure transfer of experience between companies.
- To improve the understanding of well interventions for the authorities by performing a case study focusing on wireline operations.One way to achieve these objectives has
been to establish contact and cooperation between risk analysts, accident investigators and operational personnel in oil companies and wireline contractors.
1.2 Purpose of the paper
This paper presents some main results from the previously mentioned project, and the purposes of the paper are; a) to give a short descriptions of some characteristics of wireline operations and well barriers, b) to present some findings from a review of wireline incident reports, and c) to present a set of release scenarios that may lead to release of hydrocarbons during wireline operations. These scenarios include safety barriers aimed to prevent or reduce the size of the releases during wireline operations.
1.3 Wireline operations
There are three types of well interventions; coiled tubing operations, wireline operations, and snubbing operations. Our project focused on wireline operations, and wireline operations are also treated in this paper. However, the same methodology may be used in order to analyze the risk of release of hydrocarbons associated with coiled tubing and snubbing operations.
Wireline operations are performed in order to maintain the wells and are applied in all phases of a well's life. The tools and equipment are conveyed into wells either through an "open hole" without surface pressure, or through special pressure control equipment which allows the toolstrings to be conveyed into live wells with full production pressure. Wireline services encompass slick, braided or electric line. Typical operational objectives are; mechanical operations like setting plugs, well clean up like removal of sand or debris, explosive services like punching or perforation, and data acquisition like production logging (MWS, 2004).
The wireline equipment is assembled on the top of the valve tree, and the main elements are the well head adaptor, wireline riser, wireline blowout preventing valve(s) (BOP), lubricator, stuffing box, grease injection system, wireline, winch, depth indicator, weight indicator and systems for pressure control (Jorgensen, 1998).
A wireline operation is made up of the following main steps;1 Develop well operation plan2 Spot wireline equipment3 Hand-over of well from the production
department to the well and drilling department
4 Hook-up and test wireline riser/BOP equipment
2
Qualitative analysis of human, technical, and operational barrier elements during well interventions
5 Rig-up wireline equipment with pressure control equipment
6 Run in hole, perform wireline operation^), and pull out of hole
7 Hand-over of well from the well and drilling department to the production department
8 Rig-down wireline equipmentThe total number of wireline operations
on the Norwegian Continental Shelf is several hundreds per year. Due to maturing oil fields and the need to maintain the wells, the number of wireline operations will increase the next years. This is also explained by technological innovations, the market for wireline operations are expanded and eating market shares from both snubbing operations and coiled tubing operations.
1.4 Well barriers
In most hazardous industries there have been long traditions using barriers to control the release of energy. The barrier concept can be traced back to Haddon (1970, 1980) who developed Gibson's (1961) energy and barrier perspectives for accident prevention. Reason (1997) extended this model to include the principle of defences in depth, meaning that a whole set of barriers were needed to control the release of energy or to prevent an accident or to reduce the impact of an accident.
In the nuclear industry the IAEA (1999) describes the defence-in-depth principle in the following way: "To compensate for potential human and mechanical failures, a defence in depth concept is implemented, centred on several levels of protection including successive barriers preventing the release of radioactive material to the environment. The concept includes protection of the barriers by averting damage to the plant and to the barriers themselves. It includes further
measures to protect the public and the environment from harm in case these barriers are not fully effective".
Traditionally, the focus on barriers within the “drilling and well intervention sphere” has been rather technical or physical which is illustrated by the following definition of well barrier in a NORSOK standard; well barrier is defined as well envelope of one or several dependent barrier elements preventing fluids or gases from flowing unintentionally from the formation, into another formation or to surface (NORSOK, 2004). The defined well barriers in this standard for wireline operations are illustrated in Figure 1.
The well barrier elements are classified as primary well barriers or secondary well barriers as shown in Table 1, and from this table we see that all the well barrier elements are physical. Furthermore, we see that most of the elements are placed down in the well, but the subject of interest in our project has been the wireline equipment assembled on top of the valve tree.
However, experience from well intervention incident reports shows that it is important not only to focus on the technical aspects of the barriers. The incident reports show that it is also important to include human and organizational aspects to enable the physical barriers to function and be maintained. Operational activities as leak tests functions as barriers against failure of the physical envelope preventing fluids or gas from flowing from the formation.
3
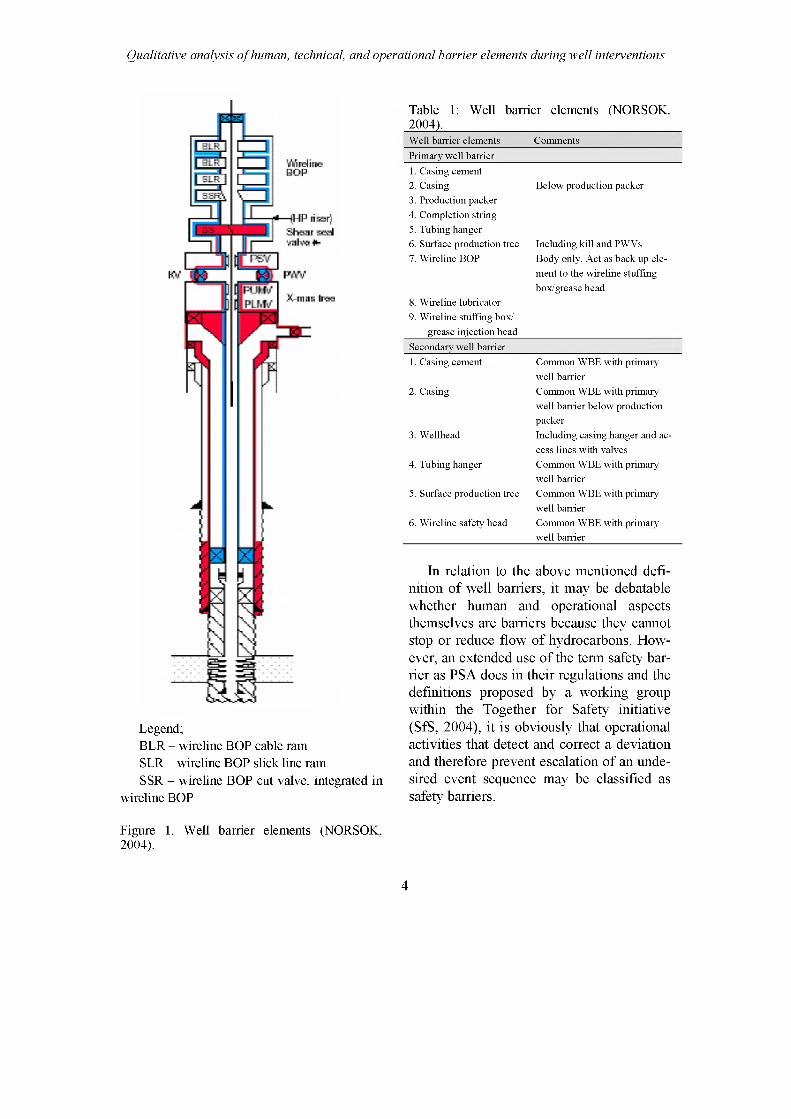
Qualitative analysis of human, technical, and operational barrier elements during well interventions
Legend;BLR - wireline BOP cable ram SLR - wireline BOP slick line ram SSR - wireline BOP cut valve, integrated in
wireline BOP
Table 1: Well barrier elements (NORSOK, 2004).Well barrier elements CommentsPrimary well barrier1. Casing cement2. Casing Below production packer3. Production packer4. Completion string5. Tubing hanger6. Surface production tree Including kill and PWVs7. Wireline BOP Body only. Act as back up ele
ment to the wireline stuffing box/grease head
8. Wireline lubricator9. Wireline stuffing box/
grease injection headSecondary well barrier1. Casing cement Common WBE with primary
well barrier2. Casing Common WBE with primary
well barrier below production packer
3. Wellhead Including casing hanger and access lines with valves
4. Tubing hanger Common WBE with primary well barrier
5. Surface production tree Common WBE with primary well barrier
6. Wireline safety head Common WBE with primary well barrier
In relation to the above mentioned definition of well barriers, it may be debatable whether human and operational aspects themselves are barriers because they cannot stop or reduce flow of hydrocarbons. However, an extended use of the term safety barrier as PSA does in their regulations and the definitions proposed by a working group within the Together for Safety initiative (SIS, 2004), it is obviously that operational activities that detect and correct a deviation and therefore prevent escalation of an undesired event sequence may be classified as safety barriers.
Figure 1. Well barrier elements (NORSOK, 2004).
4

Qualitative analysis of human, technical, and operational barrier elements during well interventions
2 METHOD FOR DEVELOPMENT OF RELEASE SCENARIOS
In order to answer our research questions, i.e., to ensure a better and more systematic understanding of human, technological and organizational aspects of the risk associated with well interventions and the development of a set of release scenarios describing barriers aimed to prevent release of hydrocarbons during wireline operations, a triangulation of methods have been applied:- Document analysis; review of standard
textbooks, research papers, and operational procedures.
- Hierarchical task analysis of wireline operations.
- Review of investigation reports from incident/accidents occurred during wireline operations the last five years from all operator companies operating on the Norwegian Continental Shelf.
- Interviews with key personnel onshore from both operator companies and a wireline contractor.
- Workshop with experts in wireline operations.
- Observation of a wireline operation and interviews of offshore personnel on a four days visit to an oil and gas installation.All the methods used are qualitative
methods. The numbers of incident/ accident reports investigated are too few to undergo any statistical analysis.
3 RESULTS
The main results presented in this paper are; a) some findings from the review of incident reports, and b) a set of release scenarios that may lead to undesired release of hydrocarbons during wireline operations.
3.1 Review of incident reports21 incident reports were reviewed as part of the project. The sample of incidents was based on reported incidents to PSA. The main focus was incidents that had resulted in release of hydrocarbons, but three other types of incidents were also reviewed due to the consequence potential. Table 2 summarizes when the incidents occurred during the wireline operations.
Table 2. Incidents related to phase of wireline operation.Phase of wireline operation No. of
incidentsDuring spotting of equipment and pressure testing
3
During execution of wireline operation
6
During pulling out of hole 3During rig-down of wireline equipment
5
During start-up of normal production 1Event not leading to release 3Sum of events 21
As seen in Table 2, incidents have occurred during all the phases of the wireline operations. The analysis of the event sequences and the causes of the incidents showed that both technical and human failures caused the incidents. These facts were allowed for during the development of the release scenarios.
Three of the most serious incidents were analyzed in more detail, and one important finding was the importance of a good understanding of the risk associated with each specific wireline operation in order to obtain an adequate situational awareness. This emphasizes the importance of an adequate risk analysis of the operation that is allowed for in the detailed planning of each wireline operation.
5
Qualitative analysis of human, technical, and operational barrier elements during well interventions
3.2 Hydrocarbon release scenarios
Eight release scenarios were developed based on the review of incident reports and documents, interviews, and workshops. The scenarios are;
1 Release of hydrocarbons due to insufficient depressurization/draining of hydrocarbons.
2 Release of hydrocarbons due to leakage in stuffing box/ grease injection head.
3 Release of hydrocarbons due to leakage in lubricator over wireline BOP.
4 Release of hydrocarbons due to leakage in the riser between the wireline BOP and the valve tree.
5 Release of hydrocarbons due to cable breakage
6 Release of hydrocarbons due to error in coupling to closed drain.
7 Release of hydrocarbons due to valve in open position to closed drain after ended wireline operation.
8 Release of hydrocarbons due to external damage on wireline equipment.
The scenarios were described by the following characteristics:- Name of the scenario- General description- Initiating event- Factors influencing the initiating event- Operational mode- Barrier functions and barrier systems- Potential size of the release- Comments.
In the following subsections, examples on description of scenario 2, scenario 3, and scenario 5 are given.
3.2.1 Release of hydrocarbons due toleakage in stuffing box/ grease in'ec-tion head
Release through the stuffing box/grease injection head may be caused by wear and tear in the gaskets or the cable, failure during assembling of stuffing box, or loss of hydraulic pressure.
The initiating event is a “diffuse” release of hydrocarbons in the stuffing box or grease injection head. Factors influencing the initiating event are the procedure for assembling and control of the stuffing box/grease injection head, competence, time pressure, wear and tear on cable, pulling out of hole speed, etc.
Operational mode when release occurs is during the wireline operation.
The existing barrier functions are;- Recovery of pressure control in stuffing
box/ grease injection head by increasing the hydraulic pressure in stuffing box/grease injection head.
- To close flow of hydrocarbons from the well.
The barrier systems are:- System for recovery of pressure control
in stuffing box/grease injection that contains the following main elements; hydraulic pump, hoses, pump operator, power supply.
- System for closing the flow of hydrocarbons, including wireline BOP valve (seal BOP and shear/seal BOP), hydraulic master valve (HMV) in valve tree, and system for depressurization/draining to closed drain. The wireline BOP functionality should be functional tested, and this testing may be regarded as an operational barrier against the wireline BOP failure mode “failure to close on demand”.
6
Qualitative analysis of human, technical, and operational barrier elements during well interventions
Potential size of the release;- Diffuse or very small if the pressure in
the stuffing box/grease injection head is recovered.
- Minor if the wireline BOP closes immediately and the system is depressurized and drained. Then the upper limit of the size is the volume between the wireline BOP and the stuffing box/grease injection head. If the HMV closes, the size is limited to the volume between the HMV and the stuffing box/grease injection head.
- Major leak if neither wireline BOP nor HMV closes.
Comments;- By a ’’diffuse” release is meant a very
small release that usually not will be detected by gas detectors or will be registered in any incident registration system like Synergi.
- If the wireline BOP closes, the stuffing box may be repaired.
- Critical event if this occurs at the same time as the wireline equipment is stuck in the wireline BOP/valve tree and hinders the closing of valves.
- Hydraulic master valve in valve tree is qualified as ”wireline shear valve” on some platforms, but not on all.
- If all these barriers fail, it may still be possible to recover the “safe state”, either by closing the downhole safety valve or by killing the well by mud through the kill wing valve on the valve tree.
3.2.2 Release due of hydrocarbons due to failure during assembling of lubricator
Release of hydrocarbons due to failure during assembling of the lubricator may becaused by use of wrong gasket, use of damaged gasket, damaging the gasket during as
sembling, damage on thread, or not screwed enough together, etc.
The initiating event is failure during assembling of the lubricator. Factors influencing the initiating event are procedure for assembling of the lubricator, time pressure, competence, layout of working place, etc.
Operational mode when release occurs is during start-up of wireline operation or later during the wireline operation.
The existing barrier functions are;- To reveal failure during assembling, incl.
gasket failures- To detect release from lubricator before
start-up of the wireline operation.
The barrier systems are;- System for 3rd party inspection of work,
incl. inspection of used gaskets.- System for leak testing of lubricator be
fore start-up of the wireline operation- System for closing the flow of hydrocar
bons, including wireline BOP valve (seal BOP and shear/seal BOP), hydraulic master valve (HMV) in valve tree, and system for depressurization/draining to closed drain. The wireline BOP functionality should be functional tested, and this testing may be regarded as an operational barrier against the wireline BOP failure mode “failure to close on demand”.
Potential size of the release;- No release if failures are revealed before
start-up of the wireline operation.- Minor if the wireline BOP closes imme
diately and the system is depressurized and drained. Then the upper limit of the size is the volume between the wireline BOP and the stuffing box/grease injection head. If the HMV closes, the size is limited to the volume between the HMV
7
Qualitative analysis of human, technical, and operational barrier elements during well interventions
and the stuffing box/grease injection head.
- Major leak if neither wireline BOP nor HMV closes.
Comments;- Visual inspection of the gaskets is per
formed prior to assembling, but it may be difficult to reveal potential damage in the gasket after assembling.
- It doesn’t exist data for how often failures are made during assembling of lubricators, but the interviews indicate that during leak testing failures are revealed up to 1 out of 20 times.
3.2.3 Release of hydrocarbons due to cable breakage
Release due to cable breakage may occur when the cable breaks and the cable are pressed out through the stuffing box/grease injection head. The cable may be broken by an incident or as a planned action due to operational problems.
The initiating event is cable breakage where the cable is pressed out through the stuffing box/grease injection head. Factors influencing the initiating event are wear and tear of cable, efficiency of weight indicator, ”weak-point”, coupling to tool-string, etc.
Operational mode when release occurs is during the wireline operation.
The existing barrier function is to close flow of hydrocarbons from the well.
The barrier systems are;- Blowout preventing plug in the stuffing
box/ grease injection head.- System for closing the flow of hydrocar
bons, including wireline BOP valve (seal BOP and shear/seal BOP), hydraulic master valve (HMV) in valve tree, and system for depressurization/draining to closed drain. The wireline BOP func
tionality should be functional tested, and this testing may be regarded as an operational barrier against the wireline BOP failure mode “failure to close on demand”.
Potential size of the release;- No release if the blow out preventing
plug is functioning as planned.- Minor if the wireline BOP closes imme
diately and the system is depressurized and drained. Then the upper limit of the size is the volume between the wireline BOP and the stuffing box/grease injection head. If the HMV closes, the size is limited to the volume between the HMV and the stuffing box/grease injection head.
- Major leak if neither wireline BOP nor HMV closes.
Comments;- The blow out preventing plugs in the
stuffing box/grease injection head may be of different types.
- The cable may be broken by an incident or as an intended action due to operational problems like the wireline equipment got stuck in the well, need for interrupting the wireline operation due to bad weather conditions, etc.
- During pulling out of the hole factors as time pressure and tool weight is important.
3.3 Use of barrier block diagrams
Barrier block diagrams were developed in order to illustrate and communicate these scenarios. Barrier block diagrams are equivalent to event trees. The barrier block diagrams illustrate an initiating event and barrier functions and systems aimed to prevent leakages. The barrier block diagrams
8

Qualitative analysis of human, technical, and operational barrier elements during well interventions
were preferred as modeling technique because it gives a clear and consistent representation of the different barrier functions and elements which are available in order to prevent releases despite of occurrences of the initiating events. Further, it enables separate analysis of different barrier functions by use of suitable analysis methods (e.g., fault tree analysis). By defining the initiating event different from the release, focus is automatically moved towards likelihood reducing measures.
These barrier systems include technical, organizational and human aspects. For a more detailed description of barrier block diagrams, see Sklet & Hauge (2004).
In Figure 2 - Figure 4 barrier block diagrams for the same three scenarios as described in subsection 3.2 are shown in order to illustrate the principles.
Depressurization/draining
"Diffuse” release in Recovery of pressurestuffing box/grease -> control in stuffing box/
injection head grease injection head
Figure 2. Release of hydrocarbons due to leakage in stuffing box/ grease injection head.
3rd party inspection of
Failure during assembling of
Failure during assembling
Depressurization/draining
Figure 3. Release of hydrocarbons due to failure during assembling of the lubricator.
Blowout plug in stuffing "Safe state”Cable
breaks
HMV in valve tree
Release
WL shear/ seal BOP
closes
WL seal BOP closes
Depressurization/draining
Figure 4. Release of hydrocarbons due to cable breakage.
3.4 Summary of physical and non-physicalbarriers
As seen in the barrier block diagrams, both physical and non-physical barriers aimed to prevent release of hydrocarbons during wireline operations are identified. This barrier block diagrams will represent the left side of a Bow-Tie representation of a total
9
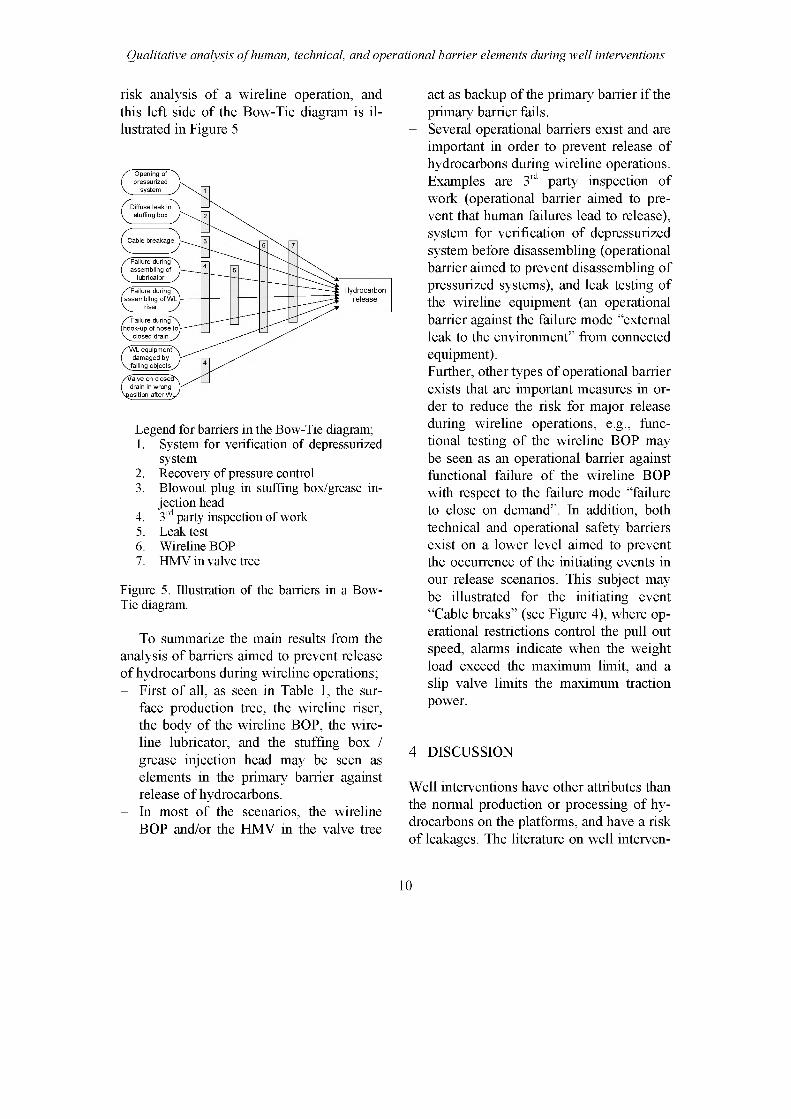
Qualitative analysis of human, technical, and operational barrier elements during well interventions
risk analysis of a wireline operation, and this left side of the Bow-Tie diagram is illustrated in Figure 5
Opening of pressurized
system
stuffing box
Cable breakage
Failure during assembling of
Hydrocarbon/^Failure during ̂assembling of WL
/^Failure during'N [hook-up of hose to]
WL equipment damaged by
Jailing objects^
drain in wrong
Legend for barriers in the Bow-Tie diagram;1. System for verification of depressurized
system2. Recovery of pressure control3. Blowout plug in stuffing box/grease in
jection head4. 3rd party inspection of work5. Leak test6. Wireline BOP7. HMV in valve tree
Figure 5. Illustration of the barriers in a Bow- Tie diagram.
To summarize the main results from the analysis of barriers aimed to prevent release of hydrocarbons during wireline operations;- First of all, as seen in Table 1, the sur
face production tree, the wireline riser, the body of the wireline BOP, the wire- line lubricator, and the stuffing box / grease injection head may be seen as elements in the primary barrier against release of hydrocarbons.
- In most of the scenarios, the wireline BOP and/or the HMV in the valve tree
act as backup of the primary barrier if the primary barrier fails.
- Several operational barriers exist and are important in order to prevent release of hydrocarbons during wireline operations. Examples are 3rd party inspection of work (operational barrier aimed to prevent that human failures lead to release), system for verification of depressurized system before disassembling (operational barrier aimed to prevent disassembling of pressurized systems), and leak testing of the wireline equipment (an operational barrier against the failure mode “external leak to the environment'’ from connected equipment).
- Further, other types of operational barrier exists that are important measures in order to reduce the risk for major release during wireline operations, e.g., functional testing of the wireline BOP may be seen as an operational barrier against functional failure of the wireline BOP with respect to the failure mode "failure to close on demand". In addition, both technical and operational safety barriers exist on a lower level aimed to prevent the occurrence of the initiating events in our release scenarios. This subject may be illustrated for the initiating event “Cable breaks" (see Figure 4), where operational restrictions control the pull out speed, alarms indicate when the weight load exceed the maximum limit, and a slip valve limits the maximum traction power.
4 DISCUSSION
Well interventions have other attributes than the normal production or processing of hydrocarbons on the platforms, and have a risk of leakages. The literature on well interven-
10

Qualitative analysis of human, technical, and operational barrier elements during well interventions
tions has mainly focused on the technical aspects related to the downhole equipment, and has not paid as much attention to the risk of release associated with the operational aspects. Another characteristic is that there are contractor companies working on an irregular basis that perform the well interventions, and the operational conditions of each wireline operation are different because the wells are different. This means that planning, risk analysis, co-operation and communication between other organizations involved in the operation or involved in parallel operations are essential.
There are several important aspects that have been revealed in this study. Wireline operations demonstrate the importance of having control of the energy, since these operations are operating on a live well. One basic requirement to well operations is that during drilling and well operations there should at all times be at least two independent and tested well barriers (PSA, 2001b). In some critical steps in some types of wireline operations this requirement is not fulfilled due to technical constraints on the platform design and layout of the wireline equipment. These steps should be identified during the planning of the wireline operation, and risk compensating measures should be identified.
This subject may be illustrated by an incident on one platform where a plug was incidentally released in the valve tree. For a while this plug blocked both the valves in the valve tree and the wireline BOP at the same time as the downhole safety valve was out of function. In this situation, the secondary well barrier was unavailable at some time during this wireline operation. The triggering cause for this event was a human failure while setting the release time (operation of the minute switch instead of the hour switch) that resulted in release of the plug
after 10 minutes instead of one hour. After the incident, several measures have been discussed, both a physical barrier to prevent human failure (hide the minute switch by a cover), and an operational barrier to prevent human failure (3rd party verification of the timer setting). This discussion of risk reducing measures illustrates the barriers at different levels, in this case a barrier against the human failure “setting wrong release time”.
The presented release scenarios shows the importance of both physical as well as non-physical barriers, and it is important that the operator companies identify all critical work tasks where 3rd party inspection of work should be required in order to reduce the risk of leakage.
5 CONCLUSIONS
This paper has presented some results from a study focusing on physical and nonphysical barriers aimed to prevent release of hydrocarbons during wireline operations on oil and gas production platforms.
The basic requirement is that during drilling and well operations, there should at all times be at least two independent and tested well barriers.
Eight release scenarios has been developed reflecting different causes of release and illustrating different types of barriers aimed to prevent release. Our study has revealed some non-physical barriers that seem to be important in order to prevent release of hydrocarbons in addition to the physical barriers. The most important non-physical barriers are;- System for verification of depressurized
and drained system before disassemblingof normally pressurized hydrocarbonsystems.
11

Qualitative analysis of human, technical, and operational barrier elements during well interventions
- 3rd party inspection of critical work tasks in order to reveal human failures.
- Leak test of equipment.
Our study has also identified several important barriers on a lower level, either aimed to prevent the occurrence of the initiating events in our scenarios, or to ensure the functionality of the technical barriers. In addition some key success factors in order to avoid releases, such as understanding of the risk associated with each specific wireline operation, allowance of the risk factors in planning and execution, communication, distribution of responsibility and coordination (e.g. in emergency situations where the wireline operators has local control of the well), have been identified.
6 ACKNOWLEDGEMENTS
We would like to express our sincere gratitude to all the people who has been willing to share information and discuss these issues with us both onshore and offshore. A special thanks to the companies Statoil and Maritime Well Service for their active involvement in the project. However, the contents of this paper are the responsibility of the authors only.
7 REFERENCES
Gibson, J. J., 1961. The contribution of experimental psychology to the formulation of the problem of safety- a brief for basic research. In Behavioral Approaches to Accident Research. New York: Association for the Aid of Crippled Children, pp. 77-89. Reprinted in W. Haddon, E. A. Schuman and D. Klein (1964): Accident Research: Methods and Approaches. New York: Harper & Row.
Haddon, W.,1970. On the escape of tigers: An ecological note. Technological review, 72
(7), Massachusetts Institute of Technology, May, 1970.
Haddon, W., 1980. The Basic Strategies for Reducing Damage from Hazards of All Kinds. Hazardprevention, Sept./ Oct. 1980.
IAEA, 1999. INSAG-12. Basic Safety Principles for Nuclear Power Plants 75-INSAG-3 Rev. 1. IAEA, Vienna, 1999
Jorgensen, E., 1998. Produksjonsteknikk 1.
ISBN 82-412-0318-7, Vett & Viten, Nesbru, Norway.
Kjellen, U., 2000. Prevention of Accidents Through Experience Feedback. Taylor & Francis, London and New York
MWS, 2004. http://www.akerkvaerner.com/ Internet/AboutUs/GroupStructure/ProductsandTechnologies/MaritimeWell Service.htm
NORSOK, 2004. NORSOK Standard D-010 Rev. 3, August 2004 Well integrity in drilling and well operations, Standards Norway
0ien, K. & Sklet, S., 2001. Risk Analyses during Operation ("The Indicator Project") - Executive Summary, SINTEF-report STF38 A01405, March 2001, Trondheim.
PSA, 2001a. Regulations relating to management in the petroleum activities (the Management regulations). Petroleum Safety Authority Norway.
PSA 2001b. Regulation relating to conduct of activities in the petroleum activities (the Activities regulations). Petroleum Safety Authority Norway.
PSA, 2004. Trends in Risk Levels on the Norwegian Continental Shelf, Phase 4 - 2003 Petroleum Safety Authority Norway.
Reason, J., 1997. Managing the risks of organizational accidents. Aldershot: Ashgate.
SfS, 2004. Barrierer - ut av takehavet, mot bed- re sikkerhet (in Norwegian). Report from a working group within Working Together for Safety (Samarbeid for Sikkerhet), October 2004.
Sklet S & Hauge S, 2004. Reflections about safety barriers. In Spitzer C, C., Schmocker, U. and Dang V.N. (eds), Probabilistic Safety Assessment and Management 2004, ISBN 1- 85233-827-X, Springer. PSAM 7 - ESREL '04, June 14 - 18, Berlin.
12
Thesis - Part II Papers
Paper 7
Standardised procedures for Work Permits and Safe Job Analysis on theNorwegian Continental Shelf
Rune Botnevik, Oddvar Berge, Snorre Sklet SPE Paper Number 86629
The 7th SPE International Conference on Health, Safety, and Environment in Oil and Gas Exploration and Production, Calgary, Alberty, Canada, 29-31 March 2004.

Society of Petroleum Engineers
SPE 86629
Standardised procedures for Work Permits and Safe Job Analysis on the Norwegian Continental ShelfR.Botnevik, Statoil, O.Berge, ExxonMobil and S.Sklet, Sintef
Copyright 2004, Society of Petroleum Engineers Inc.
This paper was prepared for presentation at The Seventh SPE International Conference on Health, Safety, and Environment in Oil and Gas Exploration and Production held in Calgary, Alberta, Canada, 29-31 March 2004.
This paper was selected for presentation by an SPE Program Committee following review of information contained in a proposal submitted by the author(s). Contents of the paper, as presented, have not been reviewed by the Society of Petroleum Engineers and are subject to correction by the authors). The material, as presented, does not necessarily reflect any position of the Society of Petroleum Engineers, its officers, or members. Papers presented at SPE meetings are subject to publication review by Editorial Committees of the Society of Petroleum Engineers. Electronic reproduction, distribution, or storage of any part of this paper for commercial purposes without the written consent of the Society of Petroleum Engineers is prohibited. Permission to reproduce in print is restricted to a proposal of not more than 300 words; illustrations may not be copied. The proposal must contain conspicuous acknowledgment of where and by whom the paper was presented. Write Librarian, SPE, P.O. Box 833836, Richardson, TX 75083-3836, U S A., fax 01-972-952-9435.
AbstractPromoting safety in an offshore environment where more than 2/3 of the workforce travel between different operating companies and installations represents a continuous challenge since the procedures and requirements are different from installation to installation. The Work Permit (WP) system and the use of Safe Job Analysis (SJA) represent essential operational safety barriers required in the daily management of work and safety on oil and gas installations.
Through a process of dialogue and participation, involving the offshore community a standardised procedure for WP and SJA has been developed and approved for implementation on all production installations on the Norwegian Continental Shelf (NCS). The objective of this industry wide change is to improve safety and working conditions offshore through the use of standardised procedures and practices.
IntroductionMore than 70 offshore oil and gas installations have been put to operation on the NCS, representing a total yearly output of approx. 174 mill Sm3 (1.1 bill bbls) of oil and 65 bill Sm3 (2.3 trill scf) of gas. Eight different operating companies with their own safety management systems and procedures operate these installations.
Promoting safety in an offshore environment where more than 2/3 of the workforce travel between operating companies and installations represents a continuous challenge since the procedures and requirements are different from installation to installation.
An extensive collaboration initiative within health, safety and the environment in the Norwegian oil and gas industry, "Working Together for Safety" (1), was established at the turn of the year 2000/2001. The overall objective was to
improve safety in human activities on board offshore vessels and installations. Establishing standardised procedures for Work Permits and Safe Job Analysis was defined as one key project.
The WP system and the use of SJA represent essential operational safety barriers required in the daily management of work and safety on oil and gas installations. These are barriers based on industry practice and Norwegian regulatory requirements (2) to reduce risk and to prevent mistakes, hazards and accidents. They are required due to the wide range of activities that can take place within a limited area and the high risk if hazardous work is not properly controlled and coordinated. Other issues are the limited escape possibilities and the lack of external emergency services.
For personnel travelling between different installations, such as maintenance- and drilling contractors, the various WP- and SJA systems have become a source for frustration as well as an increased safety risk.
This paper covers the work to develop and obtain agreement and acceptance for standardised procedures for WP and SJA on production installations on the entire NCS. It covers the process pursued to establish a principle framework and final recommendations, the solutions that were adopted, the plan for implementation as well as some lessons learned.
The process to arrive at best practice
Project group and mandate. The project group was composed of management and union representatives from six different operating companies, two contractor companies and one research institute. The project mandate was to:□ Establish a common model for WP and SJA□ Develop and provide a specific and agreed procedure that
the operating companies would be committed to apply
Planning for change. At the commencement of the work in March 2002, the project group realized that more than to overcome a technical challenge, a significant part of the work would be to facilitate a major change process to establish standardised and agreed procedures for WP and SJA. The outcome would impact the daily operations of several large companies influencing the working routines on some 70 installations and many thousand people in the offshore community.
To a large extent the terminology, the principles and practical solutions previously applied within the industry, have
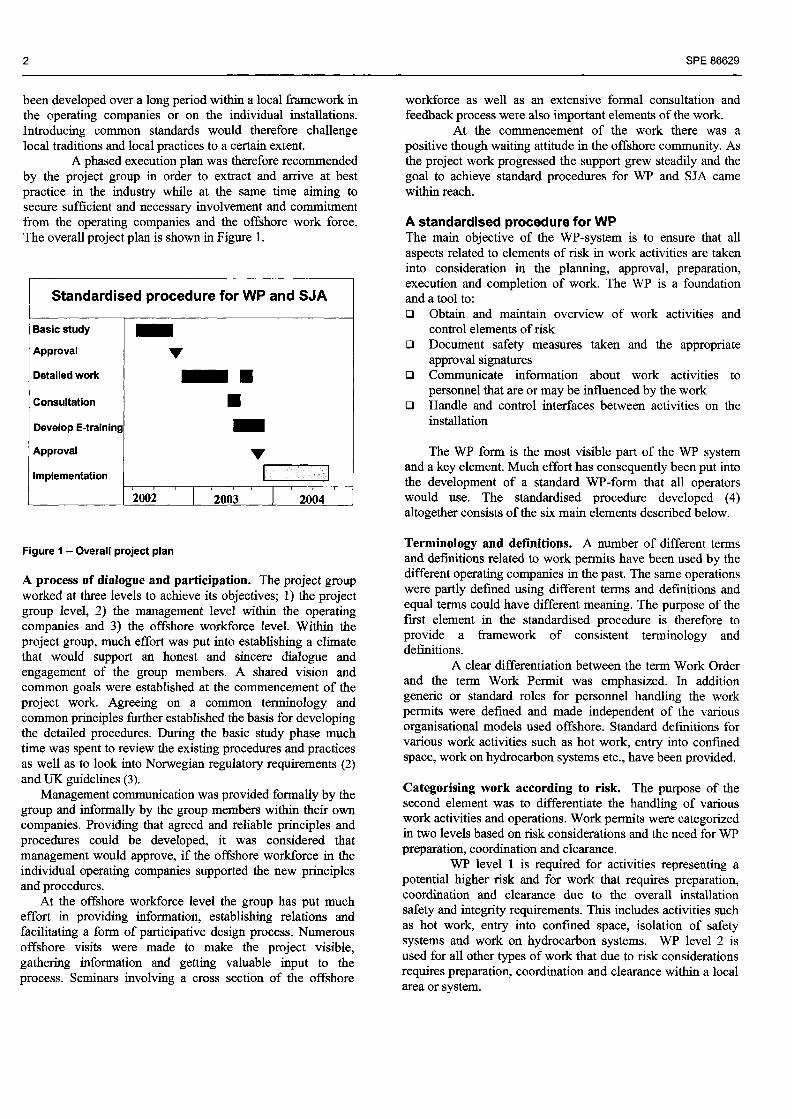
2 SPE 86629
been developed over a long period within a local framework in the operating companies or on the individual installations. Introducing common standards would therefore challenge local traditions and local practices to a certain extent.
A phased execution plan was therefore recommended by the project group in order to extract and arrive at best practice in the industry while at the same time aiming to secure sufficient and necessary involvement and commitment from the operating companies and the offshore work force. The overall project plan is shown in Figure 1.
Standardised procedure for WP and SJA
Basic study
Approval
Detailed work
Consultation
Develop E-training
Approval
Implementation
▼
■
■
▼
2002 2003 2004
Figure 1 - Overall project plan
A process of dialogue and participation. The project group worked at three levels to achieve its objectives; 1) the project group level, 2) the management level within the operating companies and 3) the offshore workforce level. Within the project group, much effort was put into establishing a climate that would support an honest and sincere dialogue and engagement of the group members. A shared vision and common goals were established at the commencement of the project work. Agreeing on a common terminology and common principles further established the basis for developing the detailed procedures. During the basic study phase much time was spent to review the existing procedures and practices as well as to look into Norwegian regulatory requirements (2) and UK guidelines (3).
Management communication was provided formally by the group and informally by the group members within their own companies. Providing that agreed and reliable principles and procedures could be developed, it was considered that management would approve, if the offshore workforce in the individual operating companies supported the new principles and procedures.
At the offshore workforce level the group has put much effort in providing information, establishing relations and facilitating a form of participative design process. Numerous offshore visits were made to make the project visible, gathering information and getting valuable input to the process. Seminars involving a cross section of the offshore
workforce as well as an extensive formal consultation and feedback process were also important elements of the work.
At the commencement of the work there was a positive though waiting attitude in the offshore community. As the project work progressed the support grew steadily and the goal to achieve standard procedures for WP and SJA came within reach.
A standardised procedure for WPThe main objective of the WP-system is to ensure that all aspects related to elements of risk in work activities are taken into consideration in the planning, approval, preparation, execution and completion of work. The WP is a foundation and a tool to:□ Obtain and maintain overview of work activities and
control elements of risk□ Document safety measures taken and the appropriate
approval signatures□ Communicate information about work activities to
personnel that are or may be influenced by the work□ Handle and control interfaces between activities on the
installation
The WP form is the most visible part of the WP system and a key element. Much effort has consequently been put into the development of a standard WP-form that all operators would use. The standardised procedure developed (4) altogether consists of the six main elements described below.
Terminology and definitions. A number of different terms and definitions related to work permits have been used by the different operating companies in the past. The same operations were partly defined using different terms and definitions and equal terms could have different meaning. The purpose of the first element in the standardised procedure is therefore to provide a framework of consistent terminology and definitions.
A clear differentiation between the term Work Order and the term Work Permit was emphasized. In addition generic or standard roles for personnel handling the work permits were defined and made independent of the various organisational models used offshore. Standard definitions for various work activities such as hot work, entry into confined space, work on hydrocarbon systems etc., have been provided.
Categorising work according to risk. The purpose of the second element was to differentiate the handling of various work activities and operations. Work permits were categorized in two levels based on risk considerations and the need for WP preparation, coordination and clearance.
WP level 1 is required for activities representing a potential higher risk and for work that requires preparation, coordination and clearance due to the overall installation safety and integrity requirements. This includes activities such as hot work, entry into confined space, isolation of safety systems and work on hydrocarbon systems. WP level 2 is used for all other types of work that due to risk considerations requires preparation, coordination and clearance within a local area or system.
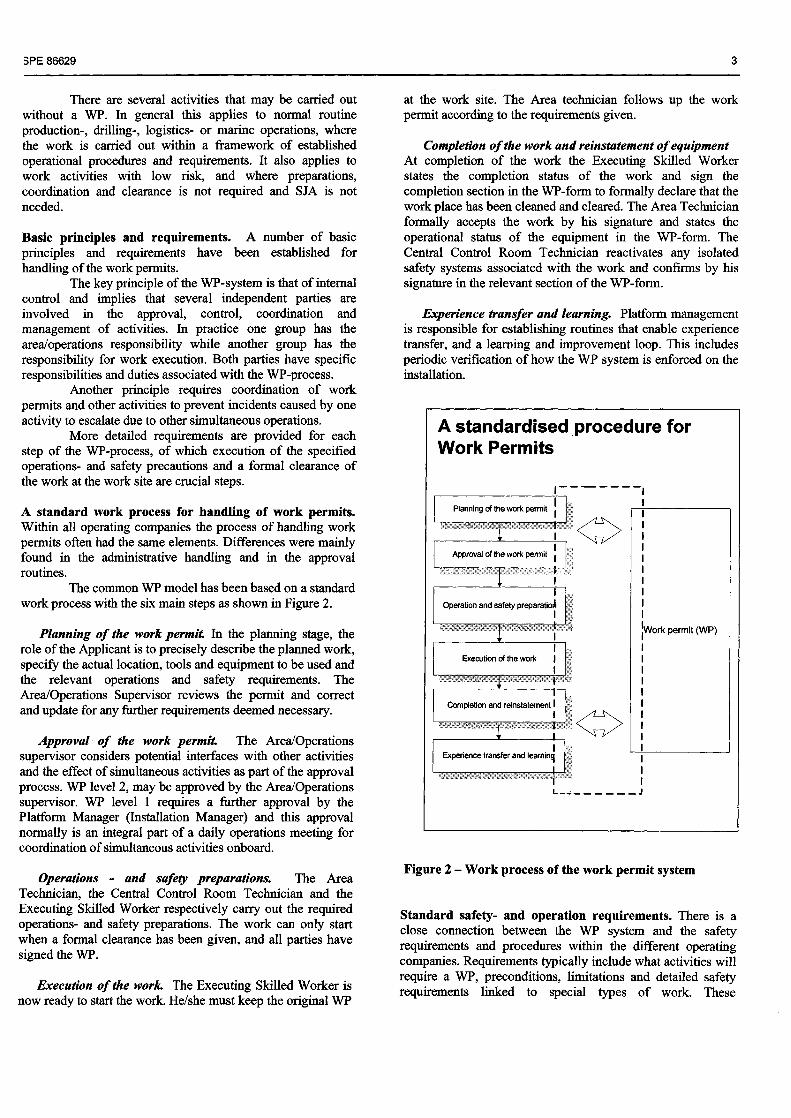
BRE 86629 3
There are several activities that may be carried out without a WP. In general this applies to normal routine production-, drilling-, logistics- or marine operations, where the work is carried out within a framework of established operational procedures and requirements. It also applies to work activities with low risk, and where preparations, coordination and clearance is not required and SJA is not needed.
Basic principles and requirements. A number of basic principles and requirements have been established for handling of the work permits.
The key principle of the WP-system is that of internal control and implies that several independent parties are involved in the approval, control, coordination and management of activities. In practice one group has the area/operations responsibility while another group has the responsibility for work execution. Both parties have specific responsibilities and duties associated with the WP-process.
Another principle requires coordination of work permits and other activities to prevent incidents caused by one activity to escalate due to other simultaneous operations.
More detailed requirements are provided for each step of the WP-process, of which execution of the specified operations- and safety precautions and a formal clearance of the work at the work site are crucial steps.
A standard work process for handling of work permits.Within all operating companies the process of handling work permits often had the same elements. Differences were mainly found in the administrative handling and in the approval routines.
The common WP model has been based on a standard work process with the six main steps as shown in Figure 2.
Planning of the work permit In the planning stage, the role of the Applicant is to precisely describe the planned work, specify the actual location, tools and equipment to be used and the relevant operations and safety requirements. The Area/Operations Supervisor reviews the permit and correct and update for any further requirements deemed necessary.
Approval of the work permit The Area/Operations supervisor considers potential interfaces with other activities and the effect of simultaneous activities as part of the approval process. WP level 2, may be approved by the Area/Operations supervisor. WP level 1 requires a further approval by the Platform Manager (Installation Manager) and this approval normally is an integral part of a daily operations meeting for coordination of simultaneous activities onboard.
Operations - and safety preparations. The Area Technician, the Central Control Room Technician and the Executing Skilled Worker respectively carry out the required operations- and safety preparations. The work can only start when a formal clearance has been given, and all parties have signed the WP.
Execution of the work. The Executing Skilled Worker is now ready to start the work. He/she must keep the original WP
at the work site. The Area technician follows up the work permit according to the requirements given.
Completion of the work and reinstatement of equipment At completion of the work the Executing Skilled Worker states the completion status of the work and sign the completion section in the WP-form to formally declare that the work place has been cleaned and cleared. The Area Technician formally accepts the work by his signature and states the operational status of the equipment in the WP-form. The Central Control Room Technician reactivates any isolated safety systems associated with the work and confirms by his signature in the relevant section of the WP-form.
Experience transfer and learning. Platform management is responsible for establishing routines that enable experience transfer, and a learning and improvement loop. This includes periodic verification of how the WP system is enforced on the installation.
A standardised procedure for Work Permits
Planning of the work permit
Approval of the work permit
Completion and reinstatement
Execution of the work
Experience transfer and
Operation and safety preparation
Work permit (WP)
i-------------------------------J
Figure 2 - Work process of the work permit system
Standard safety- and operation requirements. There is a close connection between the WP system and the safety requirements and procedures within the different operating companies. Requirements typically include what activities will require a WP, preconditions, limitations and detailed safety requirements linked to special types of work. These
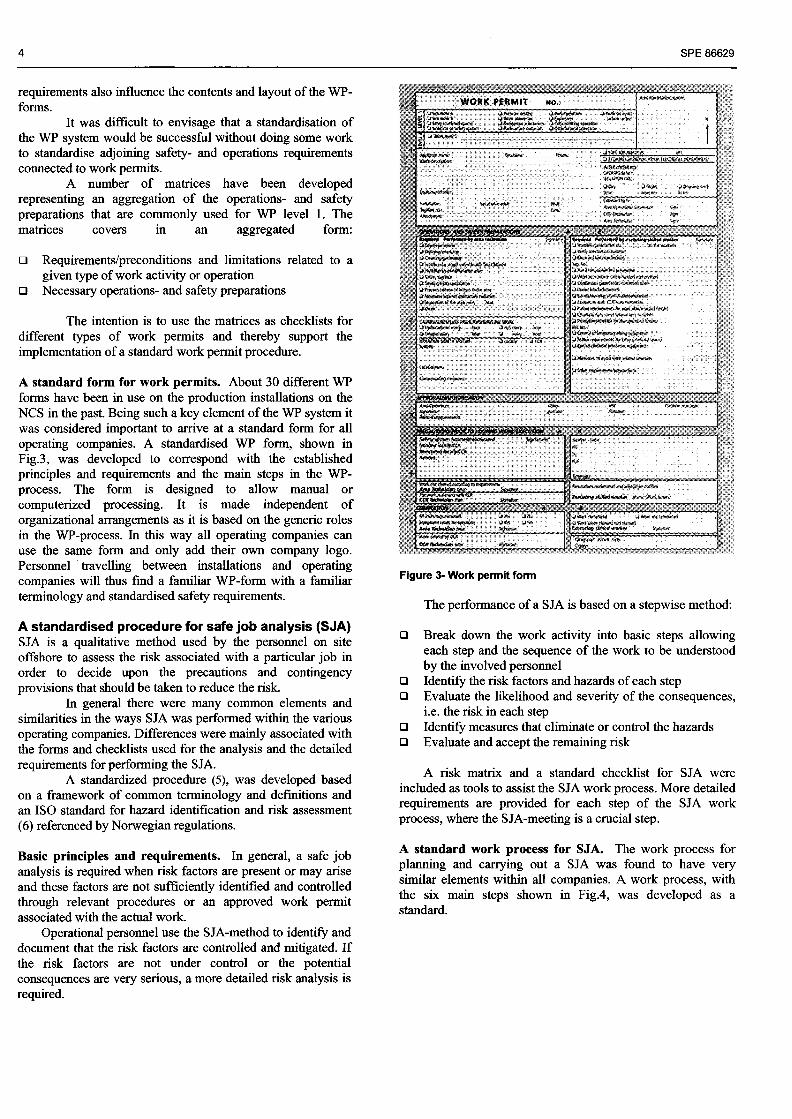
4 SPE 86629
requirements also influence the contents and layout of the WP- forms.
It was difficult to envisage that a standardisation of the WP system would be successful without doing some work to standardise adjoining safety- and operations requirements connected to work permits.
A number of matrices have been developed representing an aggregation of the operations- and safety preparations that are commonly used for WP level 1. The matrices covers in an aggregated form:
□ Requirements/preconditions and limitations related to a given type of work activity or operation
□ Necessary operations- and safety preparations
The intention is to use the matrices as checklists for different types of work permits and thereby support the implementation of a standard work permit procedure.
A standard form for work permits. About 30 different WP forms have been in use on the production installations on the NCS in the past. Being such a key element of the WP system it was considered important to arrive at a standard form for all operating companies. A standardised WP form, shown in Fig.3, was developed to correspond with the established principles and requirements and the main steps in the WP- process. The form is designed to allow manual or computerized processing. It is made independent of organizational arrangements as it is based on the generic roles in the WP-process. In this way all operating companies can use the same form and only add their own company logo. Personnel travelling between installations and operating companies will thus find a familiar WP-form with a familiar terminology and standardised safety requirements.
A standardised procedure for safe job analysis (SJA)SJA is a qualitative method used by the personnel on site offshore to assess the risk associated with a particular job in order to decide upon the precautions and contingency provisions that should be taken to reduce the risk.
In general there were many common elements and similarities in the ways SJA was performed within the various operating companies. Differences were mainly associated with the forms and checklists used for the analysis and the detailed requirements for performing the SJA.
A standardized procedure (5), was developed based on a framework of common terminology and definitions and an ISO standard for hazard identification and risk assessment (6) referenced by Norwegian regulations.
WORK FERMST
Jt -wow*** wiyd #%#****,J W % *&*$&?*«4
?«***%# nifikat wm**
id 'wpjutf. wwwi
Figure 3- Work permit form
The performance of a SJA is based on a stepwise method:
□ Break down the work activity into basic steps allowing each step and the sequence of the work to be understood by the involved personnel
□ Identify the risk factors and hazards of each step□ Evaluate the likelihood and severity of the consequences,
i.e. the risk in each step□ Identify measures that eliminate or control the hazards□ Evaluate and accept the remaining risk
A risk matrix and a standard checklist for SJA were included as tools to assist the SJA work process. More detailed requirements are provided for each step of the SJA work process, where the SJA-meeting is a crucial step.
Basic principles and requirements. In general, a safe job analysis is required when risk factors are present or may arise and these factors are not sufficiently identified and controlled through relevant procedures or an approved work permit associated with the actual work.
Operational personnel use the SJA-method to identify and document that the risk factors are controlled and mitigated. If the risk factors are not under control or the potential consequences are very serious, a more detailed risk analysis is required.
A standard work process for SJA. The work process for planning and carrying out a SJA was found to have very similar elements within all companies. A work process, with the six main steps shown in Fig.4, was developed as a standard.

SPE 86629 5
Standardised procedure for Safe Job Analysis
Identify need for SJA
Approval of SJA
Experience transfer and learning
Preparation for SJA
Execution of the work
Performing SJA: The SJA-meeting
Figure 4- Work process for SJA
A standard SJA form. A number of different SJA forms have previously been in use on the production installations on the NCS. Being such a key element it was considered important to develop a standard form for all operating companies. A standardised form was developed and laid out to correspond with the ISO standard (6), the established principles and the requirements and the main steps in the SJA work process.
Implementation in the industryThe Norwegian Oil Industry Association (OLF) approved the standardised procedures for WP and for SJA early in November 2003. By this approval the industry jointly committed itself to start the implementation process. The objective is to have the new guidelines implemented on all NCS production installations by the autumn of 2004.
The main steps in the implementation process in each operating company are to:
• Prepare and update procedures and governing documents in line with the new OLF guidelines
• Implement necessary changes to manual- or computer based systems used for handling of work permits and safe job analysis
• Provide information to, and training of the offshore personnel
The implementation process represents a significant effort as more than 10000 people will be directly influenced in their daily work offshore.
E-learning to support implementation. In order to assist the operating companies in the implementation process and to achieve a consistent, common practice, a web-based training program (7) has been developed. The training tool is made available to the industry on the internet and on CD -ROM. A view from the program is shown in Fig 5.
Learning and improvement in the future. To maintain the guidelines and facilitate experience transfer, learning and improvement in the future, the Norwegian Oil Industry Association (OLF) will put suitable mechanisms in place in order to secure an effective handling of feedback and recommended improvements from the users.
Figure 5 - E-learning program for WP and SJA
Reflections and lessons learnedThe effort to enable, facilitate, and carry through such a major change, affecting the daily operations in an entire industry, should not be underestimated. The oil industry is a technically strong, competent and proud community. Even though the technical and analytical aspects to achieve the project objectives have demanded a fair amount of work, a key factor has been to address and care for - “the people issues” both internally in the project group and in the overall process in the offshore community.
Initially, the project group emphasized the differences between the companies. As the work progressed, a different picture emerged, where the fundamental similarities became visible and could form the basic elements of the final procedures.
It is too early to judge the final outcome of this effort. Much work is still to be done in the implementation phase. The project group, however, strongly believes that a foundation has been established for an industry wide change to improve safety and working conditions on the NCS. Although the driving force of the project has been safety improvements there are strong reasons to believe that the oil and gas industry will reap additional benefits in the form of increased efficiency in the daily operations offshore.
6 SPE 86629
ConclusionsStandardised procedures for work permits and safe job analysis have been developed and approved for implementation on all production installations on the NCS. A process of dialogue and participation, involving the offshore community has established the foundation for an industry wide change to improve safety and working conditions. An E- leaming program has been developed to assist the operating companies in the implementation process and to achieve a consistent, common practice.
AcknowledgementsWe would like to thank the other members of the project group that contributed to this work: T.Enes (Statoil), T.A.Grimsrud (Norske Shell), J.Jakobsen (Halliburton), M.Repaja (ABB), S.Rognsvag (Norsk Hydro), B.Skulstad (BP), S.Vage (ConocoPhillips).
We also would like to thank A.Meiner and 0.Berg (Mintra), T.Tjensvoll (Statoil) and J.G.Leigland (Sorco) for valuable contributions in the work to develop a web based training program. A special thank you is extended to C.Bowitz and K.B.Trondsen of the Norwegian Oil Industry Association (OLE), that gave valuable support and assistance.
References1. http://www.samarbeidforsikkerhet.no/2. Norwegian Petroleum Directorate regulations for the NCS3. Oil Industry Advisory Committee: “Guidance on permit-to-
work systems in the petroleum industry”, 19974. OLF Guideline 088: “Common model for Work Permits”5. OLF Guideline 090: “ Common model for Safe Job
Analysis”6. ISO 17776 Guidelines on tools and techniques for hazard
identification and risk assessment7. http://www. samarbeidforsikkerhet.no

Thesis - Part II Papers
Paper 8
Challenges related to surveillance of safety functions
Kjell Comeliussen and Snorre Sklet ESREL 2003, Maastricht, The Netherlands

Challenges related to surveillance of safety functions
K. Corneliussen & S. SkletDept. of Production and Quality Engineering, NTNU / SINTEF Industrial Management, Trondheim, Norway
ABSTRACT: One of the main principles for the safety work in high-risk industries such as the nuclear and process industry, is the principle of defence-in-depth that imply use of multiple safety barriers or safety functions in order to control the risk.Traditionally, there has been a strong focus on the design of safety functions. However, recent standards and regulations focus on the entire life cycle of safety functions, and this paper focuses on the surveillance of safety functions during operations and maintenance. The paper presents main characteristics of safety functions, factors influencing the performance, a failure category classification scheme, and finally a discussion of challenges related to the surveillance of safety functions during operations and maintenance. The discussion is based on experiences from the Norwegian petroleum industry and results from a research project concerning the reliability and availability of computerized safety systems.The main message is that there should be an integrated approach for surveillance of safety functions that incorporates hardware, software and human/organizational factors, and all failure categories should be systematically analyzed to 1) monitor the actual performance of the safety functions and 2) systematically analyze the failure causes in order to improve the functionality, reliability and robustness of the safety functions.
1 INTRODUCTION
One of the main principles for the safety work in high-risk industries such as the nuclear and process industry, is the principle of defence-in-depth or use of multiple layers of protection (IAEA 1999, Reason 1997, CCPS 2001).
The Norwegian Petroleum Directorate (NPD) emphasizes this principle in their new regulations concerning health, safety and environment in the Norwegian offshore industry (NPD, 2001a). An important issue in these new regulations is the focus on safety barriers, and in the first section of the
management regulation, it is stated that “barriers shall be established which a) reduce the probability that any such failures and situations of hazard and accident will develop further, and b) limit possible harm and nuisance”.
The IEC 61508 (IEC 1998) and IEC 61511 (IEC 2002) standards have a major impact on the safety work within the process industry, and describe a risk-based approach to ensure that the total risk is reduced to an acceptable level. The main principle is to identify necessary safety functions and allocate these safety functions to different safety-related systems or external risk reduction facilities. In IEC 61511 a safety function is defined as a “function to
Challenges related to surveillance of safety functions
be implemented by a SIS (Safety Instrumented System), other technological safety- related system or external risk reduction facilities which is intended to achieve or maintain a safe state for the process in respect to a specific hazardous event”. An important part of the standards is a risk-based approach for determination of the safety integrity level requirements for the different safety functions. IEC 61508 is a generic standard common to several industries, while the process industry currently develops a sector specific standard for application of SIS, i.e., IEC 61511 (IEC 2002). In Norway, the offshore industry has developed a guideline for the use of the standards IEC 61508 and IEC 61511 (OLF 2001), and the Norwegian Petroleum Directorate (NPD) refers to this guideline in their new regulations (NPD 2001a). Overall, it is expected that these standards will contribute to a more systematic safety work and increased safety in the industry.
Further, the NPD in section 7 in the management regulation (NPD, 2001a) requires that “the party responsible shall establish monitoring parameters within his areas of activity in order to monitor matters of significance to health, environment and safety”, and that “the operator or the one responsible for the operation of a facility, shall establish indicators to monitor changes and trends in major accident risk”. These requirements imply a need for surveillance of safety functions during operation. In accordance with these requirements, NORSOK (2001) suggests that “verification of that performance standards for safety and emergency preparedness systems are met in the operational phase may be achieved through monitoring trends for risk indicators. [...] Examples of such indicators may be availability of essential safety systems”. Also IEC requires proof testing and inspec
tion during operations and maintenance in order to ensure that the required functional safety of safety-related systems is fulfilled (IEC 2002).
In order to monitor the development in the risk level on national level, the NPD initiated a project called “Risk Level on the Norwegian Continental Shelf”. The first phase of the project focused on collection of information about defined situations of hazard and accident (DSHA), while the second phase also focus on collection of information about the performance of safety barriers (NPD/RNNS 2002). According to this project, the performance of safety barriers has three main elements: 1) functionality/efficiency (the ability to function as specified in the design requirements), 2) reliability/availability (the ability to function on demand), and 3) robustness (ability to function as specified under given accident conditions).
The NPD uses the term safety barrier in their regulations. However, they have not defined the term, and in a letter to the oil companies as part of the project “Risk Level on the Norwegian Continental Shelf’ (NPD/RNNS, 2002), they have referred to the definition proposed by ISO (2000): “Measure which reduces the probability of realizing a hazard’s potential for harm and which reduces its consequence” with the note “barriers may be physical (materials, protective devices, shields, segregation, etc.) or non-physical (procedures, inspection, training, drills, etc.)”. Accordingly, the NPD uses the term barrier in an extended meaning and is therefore similar to other terms used in the literature, such as defence (Reason 1997), protection layer (CCPS 2001), and safety function (as used by IEC). The term safety function is used in this paper.
Surveillance of safety functions during operations in order to meet the requirements
2

Challenges related to surveillance of safety functions
stated by the NPD (NPD 2001a) and IEC (IEC 1998 and IEC 2002) is not a straightforward task, but is a challenge for the oil companies. Therefore, several oil companies have initiated internal projects to fulfill the requirements (see e.g. Sorum & Thomassen 2002). This paper focuses on the surveillance of safety functions during operations and maintenance. The paper presents main characteristics of safety functions, factors influencing the performance, a failure category classification scheme, and finally a discussion of challenges related to the surveillance of safety functions during operations and maintenance. The discussion is based on experiences from the Norwegian petroleum industry and results from a research project concerning the reliability and availability of computerized safety systems.
2 CHARACTERISTICS OF SAFETYFUNCTIONS
Safety functions may be characterized in different ways, and some of the characteristics influence how the surveillance of the safety function is performed. The following characteristics are further discussed in this section: type of safety function, local vs. global safety functions and active vs passive systems.
IEC 61511 (IEC 2002) defines a safety function as a “function to be implemented by a SIS, other technology safety-related system or external risk reduction facilities, which is intended to achieve or maintain a safe state for the process, in respect of a specific hazardous events”. By SIS IEC means an instrumented system used to implement one or more safety instrumented functions. A SIS is composed of any combination of sensor(s), logic solver(s), and final element(s). Other technology safety-related
systems are safety-related systems based on a technology other than electrical/electronic/programmable electronic, for example a relief valve. External risk reduction facilities are measures to reduce or mitigate the risk that are separate and distinct from the SIS. Examples are drain systems, firewalls and bunds.
A distinction between global and local safety functions is made by The Norwegian Oil Industry Association (OLF) (OLF, 2001). Global safety functions, or fire and explosion hazard safety functions, are functions that typically provide protection for one or several fire cells. Examples are emergency shutdown, isolation of ignition sources and emergency blowdown. Local safety functions, or process equipment safety functions, are functions confined to protection of a specific process equipment unit. A typical example is the protection against high level in a separator through the PSD (Process Shutdown) system.
CCPS distinguishes between passive and active independent protection layers (IPL) (CCPS 2001). A passive IPL is not required to take an action in order to achieve its function in reducing risk. Active IPLs are required to move from one state to another in response to a change in a measurable process property (e.g. temperature or pressure), or a signal from another source (such as a push-button or a switch). An active IPL generally comprises a sensor of some type (detection) that gives signal to a decisionmaking process that actuates an action (see Figure 1).
Action(instrument,
mechanical, or human)
Sensor(instrument,
mechanical or human)
Decision making process
(logic solver, relay, mechanical device, human)
Figure 1. Basic elements of active protectionlayers (CCPS, 2001)
3
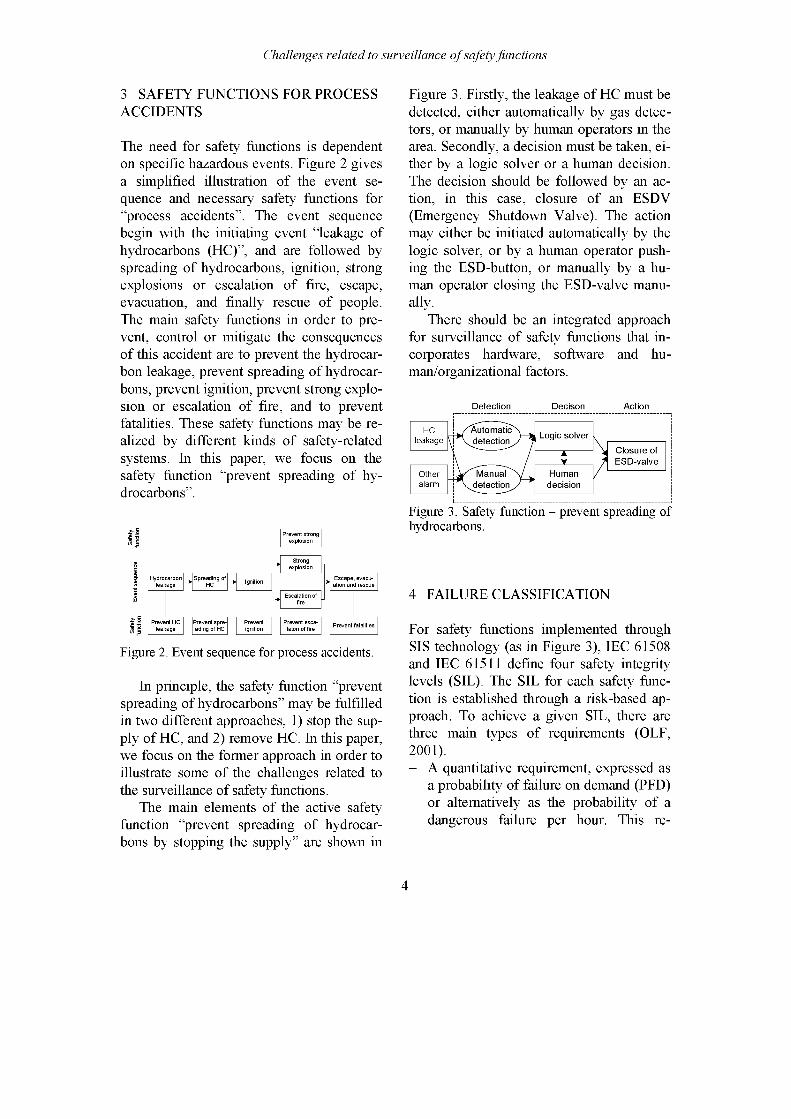
Challenges related to surveillance of safety functions
3 SAFETY FUNCTIONS FOR PROCESS ACCIDENTS
The need for safety functions is dependent on specific hazardous events. Figure 2 gives a simplified illustration of the event sequence and necessary safety functions for “process accidents”. The event sequence begin with the initiating event “leakage of hydrocarbons (HC)”, and are followed by spreading of hydrocarbons, ignition, strong explosions or escalation of fire, escape, evacuation, and finally rescue of people. The main safety functions in order to prevent, control or mitigate the consequences of this accident are to prevent the hydrocarbon leakage, prevent spreading of hydrocarbons, prevent ignition, prevent strong explosion or escalation of fire, and to prevent fatalities. These safety functions may be realized by different kinds of safety-related systems. In this paper, we focus on the safety function “prevent spreading of hydrocarbons”.
Spreading of
Prevent spreading of HC
Ignition
ignition
Hydrocarbonleakage
leakage
explosion
Prevent strong explosion
Escape, evacu-
Figure 2. Event sequence for process accidents.
In principle, the safety function “prevent spreading of hydrocarbons” may be fulfilled in two different approaches, 1) stop the supply of HC, and 2) remove HC. In this paper, we focus on the former approach in order to illustrate some of the challenges related to the surveillance of safety functions.
The main elements of the active safety function “prevent spreading of hydrocarbons by stopping the supply” are shown in
Figure 3. Firstly, the leakage of HC must be detected, either automatically by gas detectors, or manually by human operators in the area. Secondly, a decision must be taken, either by a logic solver or a human decision. The decision should be followed by an action, in this case, closure of an ESDV (Emergency Shutdown Valve). The action may either be initiated automatically by the logic solver, or by a human operator pushing the ESD-button, or manually by a human operator closing the ESD-valve manually.
There should be an integrated approach for surveillance of safety functions that incorporates hardware, software and human/organizational factors.
Detection Decison Action
HCleakage
Otheralarm
Logic solver
Humandecision
Automaticdetection
Manualdetection
Closure of ESD-valve
Figure 3. Safety function - prevent spreading of hydrocarbons.
4 FAILURE CLASSIFICATION
For safety functions implemented through SIS technology (as in Figure 3), IEC 61508 and IEC 61511 define four safety integrity levels (SIL). The SIL for each safety function is established through a risk-based approach. To achieve a given SIL, there are three main types of requirements (OLF, 2001):- A quantitative requirement, expressed as
a probability of failure on demand (PFD) or alternatively as the probability of a dangerous failure per hour. This re-
4
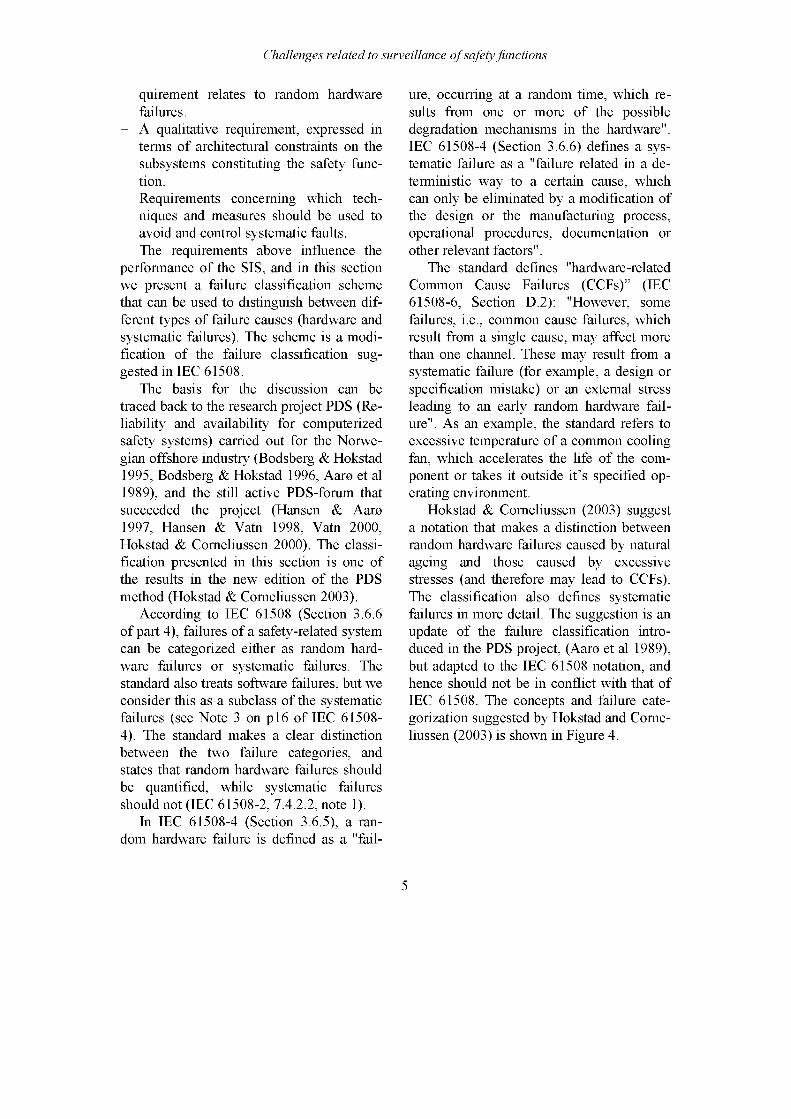
Challenges related to surveillance of safety functions
quirement relates to random hardware failures.
- A qualitative requirement, expressed in terms of architectural constraints on the subsystems constituting the safety function.
- Requirements concerning which techniques and measures should be used to avoid and control systematic faults.The requirements above influence the
performance of the SIS, and in this section we present a failure classification scheme that can be used to distinguish between different types of failure causes (hardware and systematic failures). The scheme is a modification of the failure classification suggested in IEC 61508.
The basis for the discussion can be traced back to the research project PDS (Reliability and availability for computerized safety systems) carried out for the Norwegian offshore industry (Bodsberg & Hokstad 1995, Bodsberg & Hokstad 1996, Aaro et al 1989), and the still active PDS-forum that succeeded the project (Hansen & Aara 1997, Hansen & Vatn 1998, Vatn 2000, Hokstad & Corneliussen 2000). The classification presented in this section is one of the results in the new edition of the PDS method (Hokstad & Corneliussen 2003).
According to IEC 61508 (Section 3.6.6 of part 4), failures of a safety-related system can be categorized either as random hardware failures or systematic failures. The standard also treats software failures, but we consider this as a subclass of the systematic failures (see Note 3 on p16 of IEC 615084). The standard makes a clear distinction between the two failure categories, and states that random hardware failures should be quantified, while systematic failures should not (IEC 61508-2, 7.4.2.2, note 1).
In IEC 61508-4 (Section 3.6.5), a random hardware failure is defined as a "fail
ure, occurring at a random time, which results from one or more of the possible degradation mechanisms in the hardware". IEC 61508-4 (Section 3.6.6) defines a systematic failure as a "failure related in a deterministic way to a certain cause, which can only be eliminated by a modification of the design or the manufacturing process, operational procedures, documentation or other relevant factors".
The standard defines "hardware-related Common Cause Failures (CCFs)” (IEC 61508-6, Section D.2): "However, some failures, i.e., common cause failures, which result from a single cause, may affect more than one channel. These may result from a systematic failure (for example, a design or specification mistake) or an external stress leading to an early random hardware failure". As an example, the standard refers to excessive temperature of a common cooling fan, which accelerates the life of the component or takes it outside it’s specified operating environment.
Hokstad & Corneliussen (2003) suggest a notation that makes a distinction between random hardware failures caused by natural ageing and those caused by excessive stresses (and therefore may lead to CCFs). The classification also defines systematic failures in more detail. The suggestion is an update of the failure classification introduced in the PDS project, (Aaro et al 1989), but adapted to the IEC 61508 notation, and hence should not be in conflict with that of IEC 61508. The concepts and failure categorization suggested by Hokstad and Corne- liussen (2003) is shown in Figure 4.
5

Challenges related to surveillance of safety functions
Systematic(Non-physical)(Physical)
Ageing
• Natural ageing • Sandblasting • Random: • Software error(within design • Humidity • Scaffolding • Sensor doesenvelope) • Overheating cover up not distinguish
sensor true and false• Test/periodic: demand
• Leave in • Wrong locationby-pass of sensor
• Cover up
Figure 4. Failure categorization (Hokstad &Corneliussen 2003).
Hokstad & Corneliussen (2003) define thefailure categories as:- Random hardware failures are physical
failures, where the delivered service deviates from the specified service due to physical degradation of the module. Random hardware failures are split into ageing failures and stress failures, where ageing failures occur under conditions within the design envelope of a module, while stress failures occur when excessive stresses are placed on the module. The excessive stresses may be caused either by external causes or by human errors during operation.
- Systematic failures are non-physical failures, where the delivered service deviates from the specified service without any physical degradation of the module. The failure can only be eliminated by a modification either of the design or the manufacturing process, the operating procedures, the documentation or other relevant factors. Thus, modifications rather than repairs are required in order to remove these failures. The systematic failures are further split into interaction failures and design failures, were interaction failures are initiated by human errors during operation or testing. Design failures are initiated during engineering and
construction and may be latent from the first day of operation.As a general rule, stress, interaction and
design failures are dependent failures (giving rise to common cause failures), while the ageing failures are denoted independent failures.
To avoid a too complex classification, every failure may not fit perfectly into the above scheme. For instance, some interaction failures might be physical rather than non-physical.
The PDS method focuses on the entire safety function (Hokstad & Corneliussen 2003), and intends to account for all failures that could compromise the function (i.e. result in "loss of function"). Some of these failures are related to the interface (e.g. "scaffolding cover up sensor"), rather than the safety function itself. However, it is part of the "PDS philosophy" to include such events.
5 SURVEILLANCE OF SAFETY FUNCTIONS
This section discusses the surveillance of safety functions during operation related to the failure classification in the previous section.
The requirements for surveillance are related to the functional safety, and not only to the quantitative SIL requirements (see section 4). In IEC 61508-2, section 7.6.1 it is stated that one should “develop procedures to ensure that the required functional safety of the SIS is maintained during operation and maintenance”, and more explicitly stated in IEC 61511-1, section 16.2.5, “the discrepancies between expected behavior and actual behavior of the SIS shall be analyzed and where necessary, modification made such that the required safety is main-
6
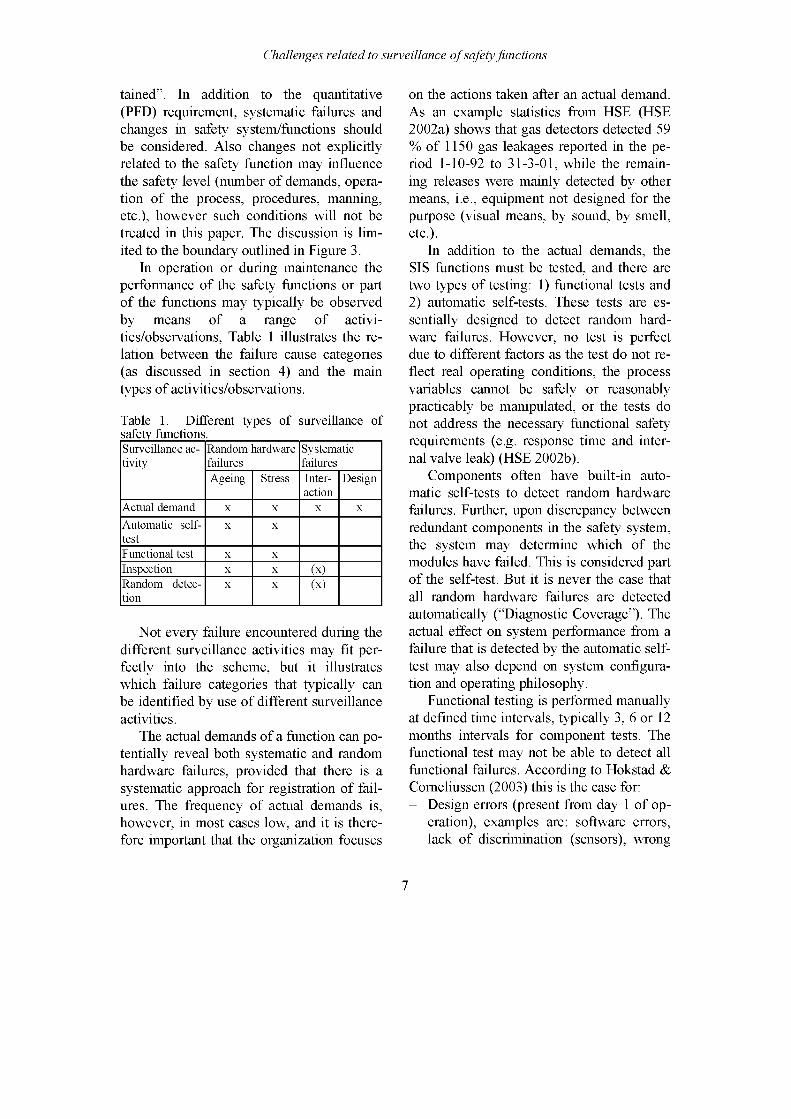
Challenges related to surveillance of safety functions
tained”. In addition to the quantitative (PFD) requirement, systematic failures and changes in safety system/functions should be considered. Also changes not explicitly related to the safety function may influence the safety level (number of demands, operation of the process, procedures, manning, etc.), however such conditions will not be treated in this paper. The discussion is limited to the boundary outlined in Figure 3.
In operation or during maintenance the performance of the safety functions or part of the functions may typically be observed by means of a range of activities/observations, Table 1 illustrates the relation between the failure cause categories (as discussed in section 4) and the main types of activities/observations.
Table 1. Different types of surveillance of safety functions._____ ___________________Surveillance activity
Random hardware failures
Systematicfailures
Ageing Stress Interaction
Design
Actual demand x x x xAutomatic selftest
x x
Functional test x xInspection x x (x)Random detection
x x (x)
Not every failure encountered during the different surveillance activities may fit perfectly into the scheme, but it illustrates which failure categories that typically can be identified by use of different surveillance activities.
The actual demands of a function can potentially reveal both systematic and random hardware failures, provided that there is a systematic approach for registration of failures. The frequency of actual demands is, however, in most cases low, and it is therefore important that the organization focuses
on the actions taken after an actual demand. As an example statistics from HSE (HSE 2002a) shows that gas detectors detected 59 % of 1150 gas leakages reported in the period 1-10-92 to 31-3-01, while the remaining releases were mainly detected by other means, i.e., equipment not designed for the purpose (visual means, by sound, by smell, etc.).
In addition to the actual demands, the SIS functions must be tested, and there are two types of testing: 1) functional tests and 2) automatic self-tests. These tests are essentially designed to detect random hardware failures. However, no test is perfect due to different factors as the test do not reflect real operating conditions, the process variables cannot be safely or reasonably practicably be manipulated, or the tests do not address the necessary functional safety requirements (e.g. response time and internal valve leak) (HSE 2002b).
Components often have built-in automatic self-tests to detect random hardware failures. Further, upon discrepancy between redundant components in the safety system, the system may determine which of the modules have failed. This is considered part of the self-test. But it is never the case that all random hardware failures are detected automatically (“Diagnostic Coverage”). The actual effect on system performance from a failure that is detected by the automatic selftest may also depend on system configuration and operating philosophy.
Functional testing is performed manually at defined time intervals, typically 3, 6 or 12 months intervals for component tests. The functional test may not be able to detect all functional failures. According to Hokstad & Corneliussen (2003) this is the case for:- Design errors (present from day 1 of op
eration), examples are: software errors,lack of discrimination (sensors), wrong
7

Challenges related to surveillance of safety functions
location (of sensor), and other shortcomings in the functional testing (the test demand is not identical to a true demand and some part of the function is not tested).
- Interaction errors that occur during functional testing, e.g., maintenance crew forgetting to test specific sensor, tests performed erroneously (wrong calibration or component is damaged), maintenance personnel forgetting to reset bypass of component.Thus, most systematic failures are not
detected even by functional testing. In almost all cases it is correct to say that functional testing will detect all random hardware failures but no systematic failures.
The functional tests may be tests of:- The entire system/function typically per
formed when the process is down, e.g., due to revision stops.
- Components or sub-functions. Component tests are normally performed when the process is in operation.Component tests are more frequent than
the system tests due to less consequences on production. Experience do, however, show that full tests (from input via logic to output device) “always” encounter failures not captured during component tests.
In IEC 61511-1, inspection is described as “periodical visual inspection”, and this restricts the inspections to an activity that reveals for example unauthorized modifications and observable deteriorations of the components. An operator may also detect failures in between tests (Random detection). For instance the panel operator may detect a transmitter that is “stuck” or a sensor left in by-pass (systematic failure).
6 DISCUSSION
The data from the various activities described above should be systematically analyzed to 1) monitor the actual performance of the safety functions and 2) systematically analyze the failure causes in order to improve the performance of the function. The organization should handle findings from all above surveillance activities, and should focus on both random hardware and systematic failures. The failure classification in PDS may assist in this work.
6.1 Performance of safety functions
As stated above, the performance of safety functions has three elements: 1) the functionality/efficiency, 2) the reliability, and 3) the robustness. The functionality is influenced by systematic failures. Since these failures seldom are revealed during testing, it is necessary to register systematic failures after actual demands or events that are observed by the personnel (inhibition of alarms, scaffolding, etc.).
Traditionally, the reliability is quantified as the probability of failure on demand (PFD) and is mainly influenced by the dangerous undetected random hardware failure rate (XDU), the test interval (t) and the fraction of common cause failures (P).
The PDS-method (Hokstad & Corneliussen 2003), however, accounts for major factors affecting reliability during system operation, such as common cause failures, automatic self-tests, functional (manual) testing, systematic failures (not revealed by functional testing) and complete systems including redundancies and voting. The method gives an integrated approach to hardware, software and human/organizational factors. Thus, the model
8
Challenges related to surveillance of safety functions
accounts for all failure causes as shown in Figure 4.
The main benefit of the PDS taxonomy compared to other taxonomies is the direct relationship between failure causes and the means used to improve the performance of safety functions.
The robustness of the function is defined in the design phase, and should be carefully considered when modifications on the process or the safety function are performed.
6.2 Analysis of random hardware failures from functional tests
Data from functional tests on offshore installations is summarized in a CMMS (computerized maintenance management system). The level of detail in reporting may vary between oil companies and between installations operated by the same company. Typically, the data is presented as failure rates per component class/type independent of the different safety functions which the components are part of. This means that the data from component tests must be combined with the configuration of a given safety function in a reliability model (e.g. a reliability block diagram or PDS) to give meaning with respect to SIL for that safety function. Alternatively a “SIL budget” for detection (input), decision (logic) and action (output) might be developed. This can be advantageous since tests of the components are more frequent, and data from tests can be used to follow up component performance independent of safety functions.
It is important to have a historical overview of the number of failures and the total number of tests for all the functional tests in order to adjust the test interval, but it is equally important to analyze the failure causes to prevent future failures. This is particularly the case for dependent failures (i.e.
stress failures). An example is sensors placed in an environment that results in movements and temperature conditions that further may lead to stress failures on several sensors. The functional tests will reveal random hardware failures but will not differentiate between independent (ageing) and dependent failures, and the fraction between independent and dependent failures must be analyzed.
Common cause failures may greatly reduce the reliability of a system, especially of systems with a high degree of redundancy. A significant research activity has therefore been devoted to this problem, and Huyland and Rausand (1994) describe various aspects of dependent failures.
For the P-factor model we need an estimate of the total failure rate X, or the independent failure rate (XI), and an estimate of P. Failure rates may be found in a variety of data sources. Some of the data sources present the total failure rata, while other present the independent failure rate. However, field data collected from maintenance files normally do not distinguish between independent failures and common cause failures, and hence presents the total failure rate. In this case, the P, and XI will normally be based on sound engineering judgment. An approach is outlined in IEC 61508 for determining the plant specific P(s).
The maintenance system (procedures and files) should be designed for assisting in such assessments, and it is especially important to focus on the failure causes discussed in this paper
The tests and calculated PFD numbers may be used as arguments for reducing the test interval or more critical, to increase the test interval. Such decisions should not be based on pure statistical evidence, but should involve an assessment of all assumptions the original SIL requirement was
9
Challenges related to surveillance of safety functions
based on. OLF suggests an approach for assessment of the failure rate (OLF, 2001), but the oil companies have not implemented this approach fully yet.
6.3 Analysis of systematic failures
As described earlier, the systematic failures are almost never detected in the tests or by inspection, but it is important to analyze the systematic failures that occur in detail and have a system to control systematic failures.
Systematic failures are usually logged in other systems than the CMMS, but the information is normally not analyzed in the same detail as the data from functional tests. In particular, it is important to investigate the actions taken by the safety functions when an actual demand occurs. Systematic analysis of gas leaks is important for gas detection systems. Such analyses may indicate if the sensors have wrong location and do not detect gas leakages. In addition, other systems like incidents investigation, systems or procedures for inhibition of alarms, scaffolding work, and reset of sensors must be in place and investigated periodically. Another possibility that could be utilized more in the future, is to build in more detailed logging features in the SIS logic, to present the signal path when actual demands occur. This type of logging might give details about failed components and information about how the leak was detected.
6.4 Procedure/system for collection of failure data
Experiences from the failure cause analysis should be used to improve the procedures and systems for collection and analysis of failure data. A structured analysis of failures and events may reveal a potential for improvements in the actual maintenance or test
procedures, or need for modifications of the safety-related systems to improve the functionality.
An important aspect regarding collection of failure data is the definitions of safety- critical failures. Ambiguous definitions of safety-critical failures may lead to incorrect registration of critical failures (e.g. failures that are repaired/rectified “on the spot” are not logged) or registration of non-critical failures as critical ones. The oil companies in Norway have initiated a joint project with the objective to establish common definitions of critical failures of safety functions.
6.5 SIS vs. other types of safety functions
Our case, “prevent spreading of HC by stopping the supply” is an active safety function, and we have not discussed challenges related to surveillance of passive safety functions. However, the functionality of passive safety functions is integrated in the design phase of the installation, and in practice, passive safety functions will be tested only during real accidents. Surveillance of passive safety functions may be carried out by continuous condition monitoring or periodic inspection.
The focus of this paper has been surveillance of SIS. However, surveillance of other safety functions as other technology safety- related systems and external risk reduction facilities is important to control the risk during operation. The failure classification and the surveillance activities presented above may also be used for other active, safety- related systems. Surveillance of some kinds of external risk reduction facilities in the form of operational risk reducing measures as operational procedures may require use of other kinds of surveillance activities.
10
Challenges related to surveillance of safety functions
7 CONCLUSIONS
Recent standards and regulations focus on the entire life cycle of safety functions, and in this paper we have focused on the surveillance of safety functions during operations and maintenance.
The main message is that there should be an integrated approach for surveillance of safety functions that incorporates hardware, software and human/organizational factors, and all failure categories should be systematically analyzed to 1) monitor the actual performance of the safety functions and 2) systematically analyze the failure causes in order to improve the functionality, reliability and robustness of safety functions.
Not all surveillance activities reveal all kind of failures, and a comprehensive set of activities should be used. Failures of safety functions should be registered during actual demands (e.g. gas leaks), testing (functional tests and self-tests), and inspection. The presented failure classification scheme can contribute to an understanding of which surveillance activities that reveal different types of failures.
8 REFERENCES
Aare R, Bodsberg L, Hokstad P. Reliability Prediction Handbook; Computer-Based Process Safety Systems. SInTeF report STF75A89023, 1989.
Bodsberg L, Hokstad P. A System Approach to Reliability and Life-Cycle Cost for Process Safety Systems. IEC Trans. on Reliability, Vol. 44, No. 2, 1995, 179-186.
Bodsberg L, Hokstad P. Transparent reliability model for fault-tolerant safety systems. Reliability Engineering & System Safety, 55 (1996) 25-38.
CCPS, 2001. Layer of Protection Analysis - Simplified Process Risk Assessment. ISBN 08169-0811-7, Center for Chemical Process
Safety of the American Institute of Chemical Engineers, New York, US.
Hansen GK, Aare R. Reliability Quantification of Computer-Based Safety Systems. An Introduction to PDS. SINTEF report STF38 A97434, 1997.
Hansen GK, Vatn. Reliability Data for Control and Safety Systems. 1998 edition. SINTEF report STF38 A98445, 1999.
Hokstad P, Corneliussen K. Improved common cause failure model for IEC 61508. SINTEF report STF38 A00420, 2000.
Hokstad P, Corneliussen K. PDS handbook, 2002 Edition. SINTEF report STF38 A02420. 2003.
HSE 2002. Offshore hydrocarbon releases statistics, 2001. HID Statistics Report HSR 2001 002. Health & Safety Executive, UK.
HSE 2002b. Principles for proof testing of safety instrumented systems in the chemical industry, 2002. Contract research report 428/2002. Health & Safety Executive, UK.
Hey land A & Rausand M, 1994. System Reliability Theory Models and Statistical methods. ISBN 0-471-59397-4, Wiley- Interscience.
IAEA, 1999. Basic Safety Principles for Nuclear Power Plants INSAG-12, 75-INSAG-3 Rev. 1. IAEA, Vienna, 1999.
IEC 1998. IEC 61508 1998. Functional safety of electrical/electronic/programma6le electronic safety-related systems. International Electrotechnical Commission.
IEC, 2002. IEC 61511-1 2002. Functional safefy: Safety Instrumented Systems fbr the process industry sector Part 1: Framework, definitions, system, hardware and software requirements, Version for FDIS issue 8/1/02. International Electrotechnical Commission.
ISO, 1999. ISO 13702:1999. Petroleum and natural gas industries - Control and mitigation of fires and explosions on offshore production installations - requirements and guidelines. International Electrotechnical Commission.
ISO, 2000. ISO 17776:2000. Petroleum and natural gas industries - Offshore production installations - Guidelines on tools and techniques for hazard identification and risk assessment.
11
Challenges related to surveillance of safety functions
NORSOK, 2001. Risk and emergency preparedness analysis, NORSOK standard Z-013 Rev. 2, 2001-09-01, NTS, Oslo, Norway.
NPD, 2001a. Regulations relating to management in the petroleum activities (The Management Regulations). 3 September 2001, The Norwegian Petroleum Directorate
NPD, 2001b. Regulations relating to design and outfitting of facilities etc. in the petroleum activities, (The Facilities Regulations). 3 September 2001, The Norwegian Petroleum Directorate.
NPD/RNNS, 2002. The Risk Level on the Norwegian Continental Shelf (In Norwegain - Risikoniva pa norsk sokkel), Oljedirektor- atet, Stavanger, Norway.
OLF, 2001. Recommended Guidelines for the Application of IEC 61508 and IEC 61511 in the Petroleum Activities on the Norwegian Continental Shelf. The Norwegian Oil Industry Association.
Reason, J. 1997. Managing the risk of organizational accidents, ISBN 1 84014 105 0, Ash- gate Publishing Limited, England.
Sorum M, Thomassen O. 2002. Mapping and monitoring technical safety. SPE paper 739230.
Vatn J. Software reliability quantification in relation to the PDS method. SINTEF report STF38 A0016, 2000.
12