phenotypic plasticity ability of an organism to express different phenotypes depending on the biotic...
TRANSCRIPT
Phenotypic Plasticity Ability of an organism to express different
phenotypes depending on the biotic or abiotic environment
Involves regulatory genes that switch on structural genes given the appropriate stimulus
Many trees and shrubs produce shade leaves and sun leaves Shade leaves are thinner and much greater
in surface area than sun leaves How is the type of leaf determined?
The genes which determine the shape of a particular leaf are sensitive to light
Specifically, the portion of the plant is responsive to the ratio of far red light to red light

Red light is absorbed by leaves higher in the canopy but far red light passes through to the ground
Therefore, the ratio of far red:red light increases in more shaded areas
When the FR:R ratio exceeds a critical value, a leaf will be formed as a shade leaf, which is much more efficient at gathering light under darker conditions (high surface area)
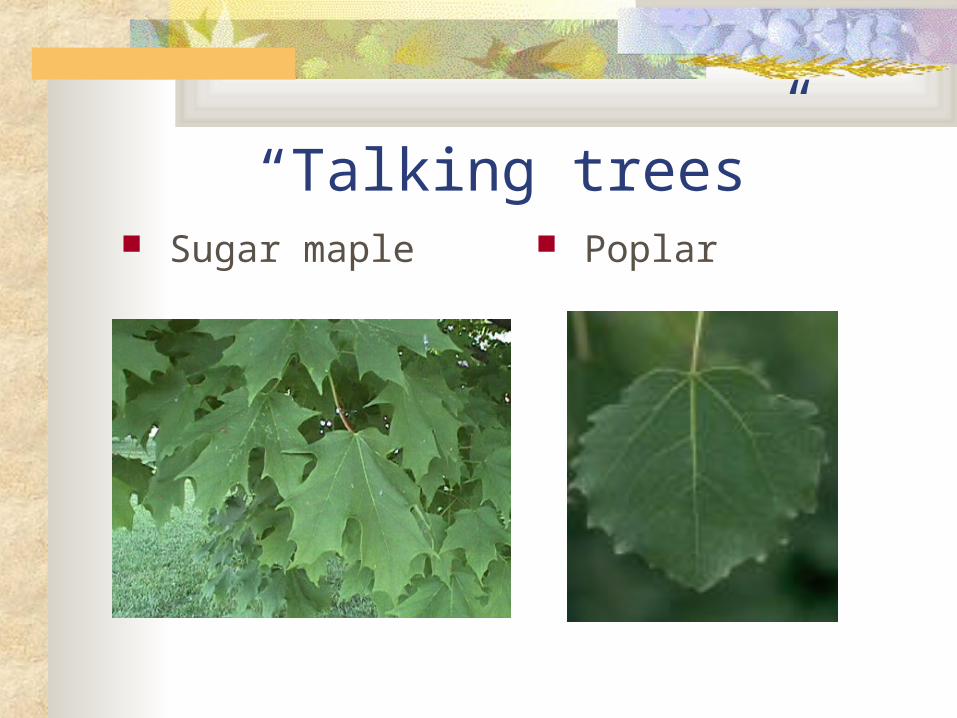
“Talking trees” Sugar maple Poplar

Some vascular plants are known to produce herbivore-deterrent compounds There is evidence that the production of
these allelochemicals can be induced Producing these compounds only when
needed presumably saves the plant energy Many of these allelochemicals degrade
quickly, making an inducible response even more economical

Some researchers at Dartmouth tested some sugar maples and poplars to see if the production of allelochemicals can be induced by herbivores

The experiment involved tearing off 7% of the leaf area of each tree The level of allelochemicals was measured
before the “artificial herbivory” and 52 hours later
For both sugar maples and poplars, an increase in the production of allelochemicals was seen after 52 hours

But the really cool result was . . . Control trees in the same environmental
chamber increased their production of allelochemicals too
This result suggests that an airborne cue from plants that have been grazed alerts surrounding trees to step up their chemical defense
Hence, the “talking tree” metaphor

The dogwhelk, Nucella lamellosa, a common rocky intertidal snail along the western North American coast
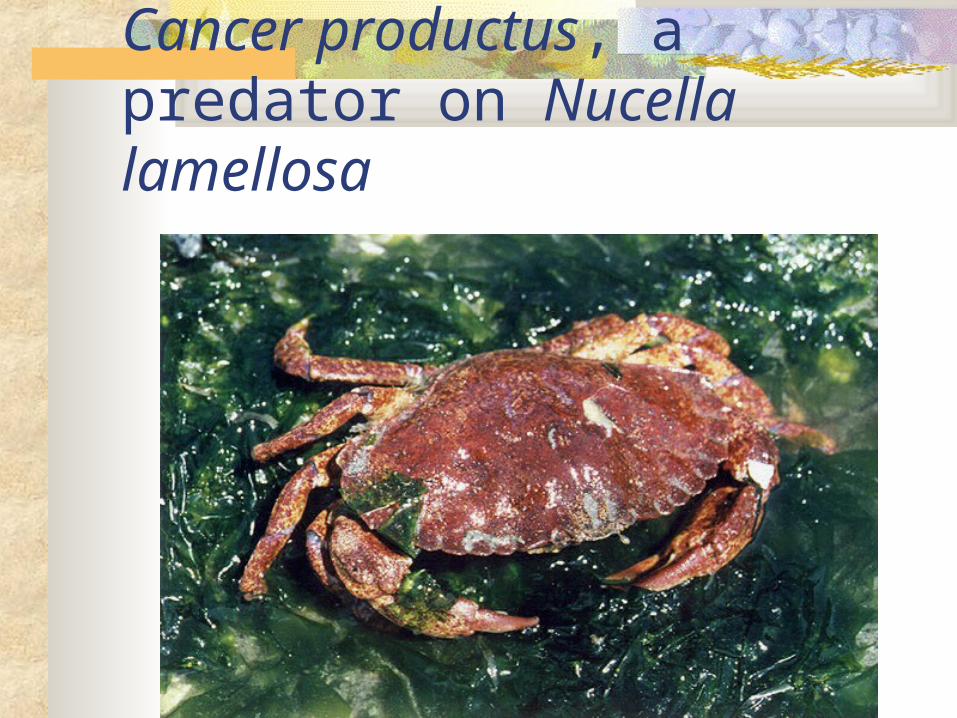
Cancer productus, a predator on Nucella lamellosa

Phenotypic plasticity in Nucella Workers exposed some Nucella to water in
which Cancer productus was present, some Nucella to water in which the metabolites of recently damaged Nucella was present and a control of water without either type of chemical signal
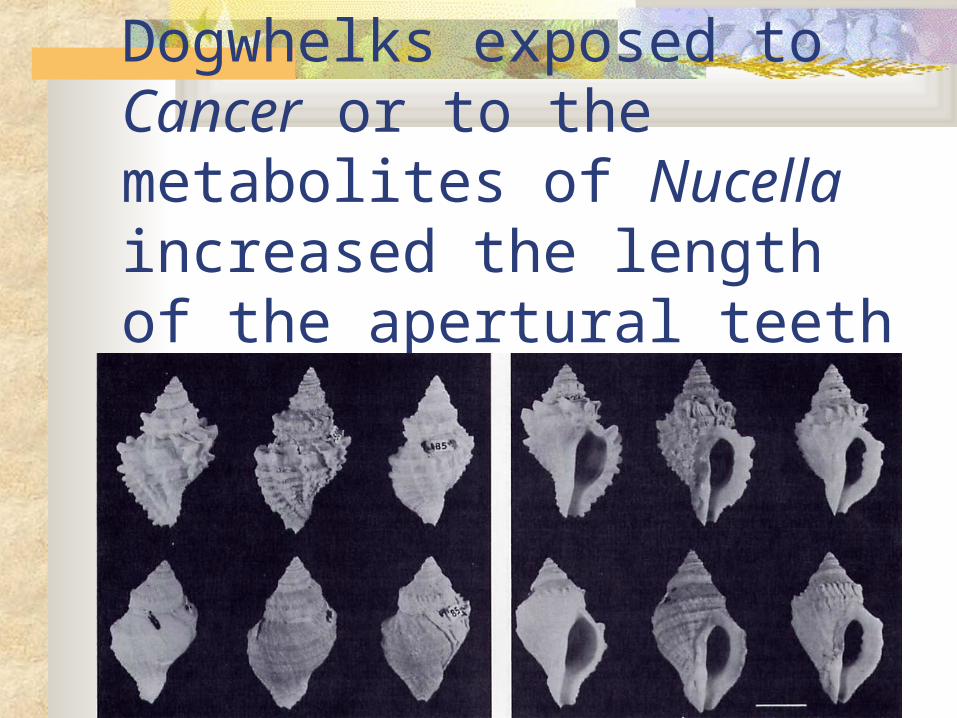
Dogwhelks exposed to Cancer or to the metabolites of Nucella increased the length of the apertural teeth
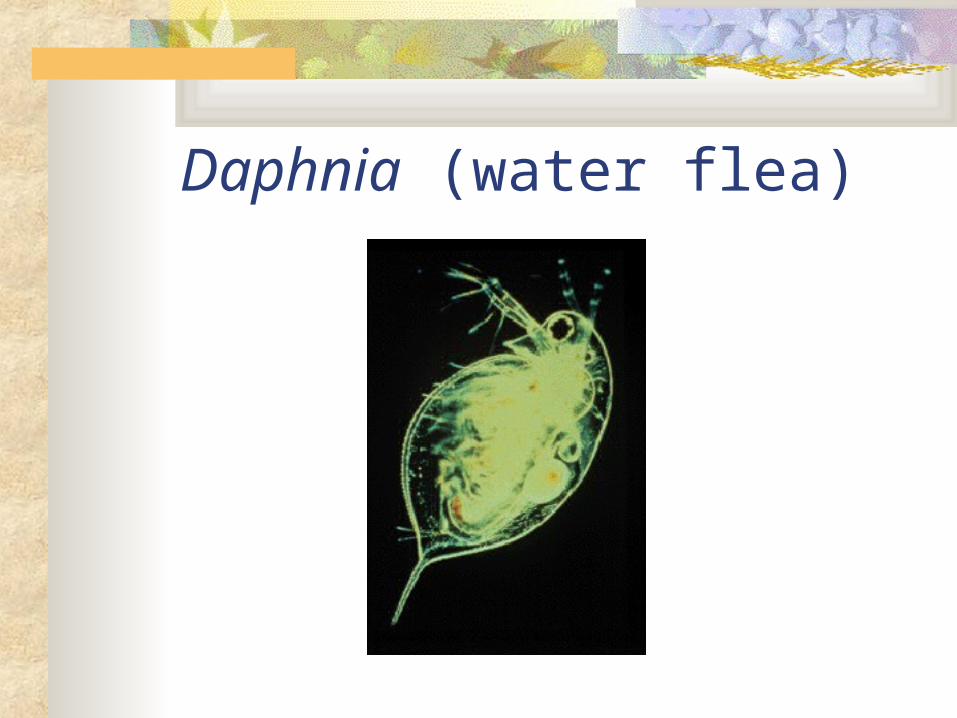
Daphnia (water flea)

A backswimmer, a potent predator on Daphnia

Phantom midge larva, another potent predator on Daphnia

Helmeted and normal Daphnia
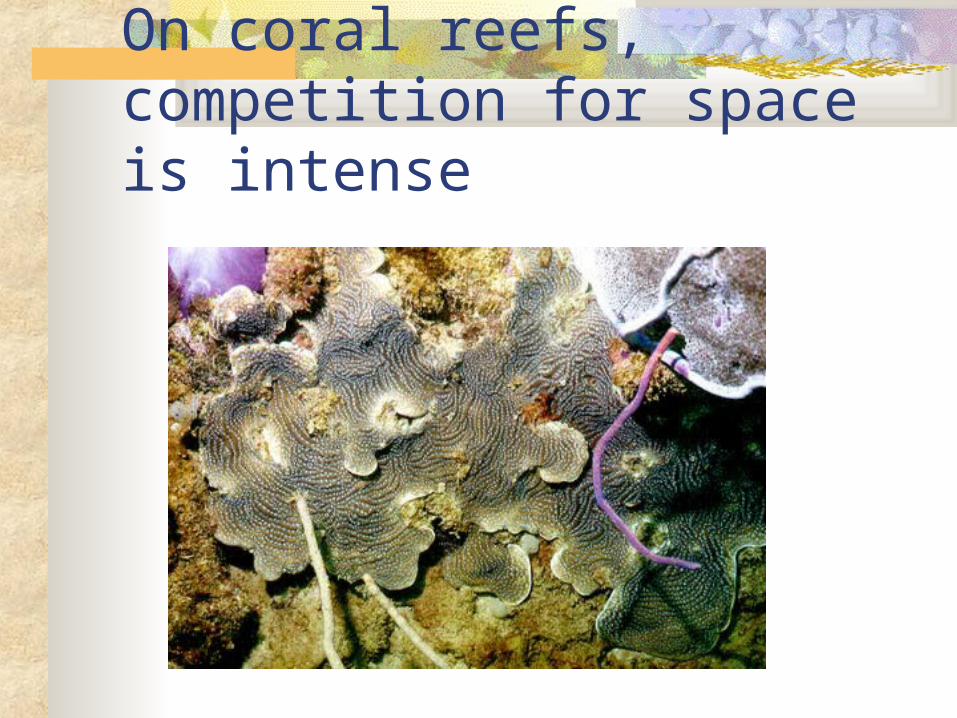
On coral reefs, competition for space is intense

Some corals use particularly virulent nematocysts (specialized stinging organelles) to kill competitors

The coral Agaricia grows elongate sweeper tentacles when a competitor comes in contact

Sweeper tentacles in the coral Agaricia
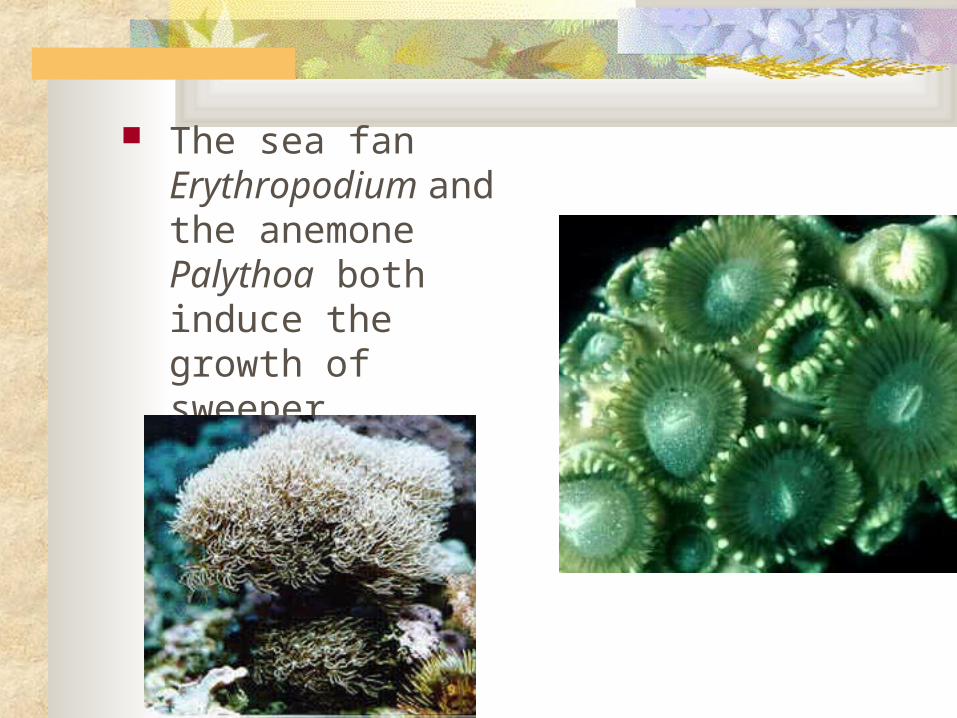
The sea fan Erythropodium and the anemone Palythoa both induce the growth of sweeper tentacles in Agaricia
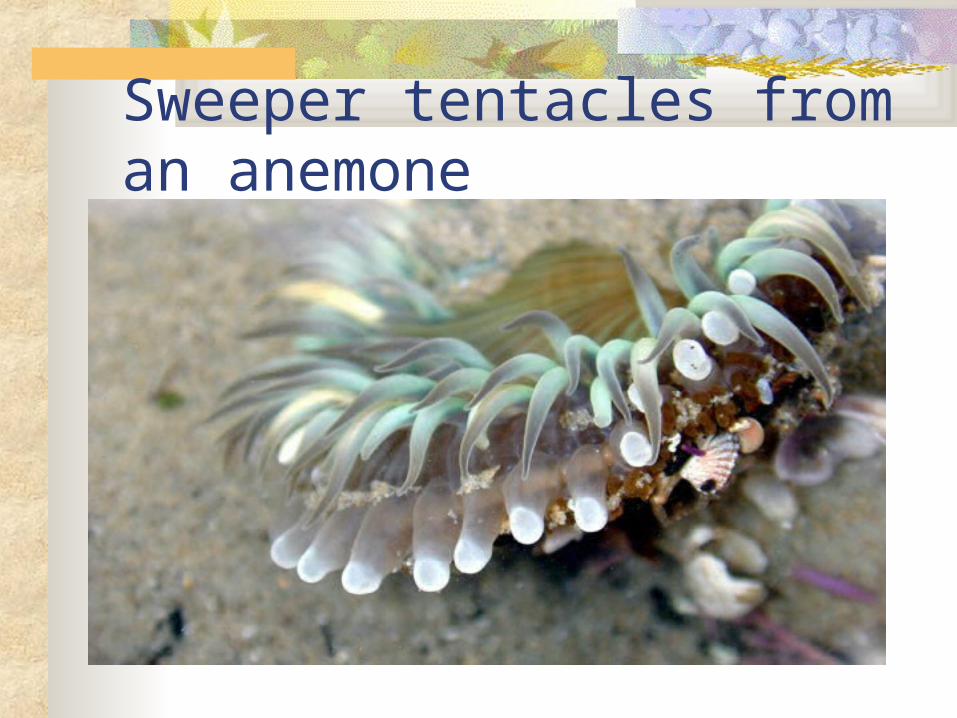
Sweeper tentacles from an anemone

Mechanisms of Evolutionary Change
Mechanisms that change allele frequencies in populations: Natural selection Mutation Gene flow (migration) Genetic drift (sampling error)

Genetic Structure of Populations All the genes contained by the individuals of
population constitute the gene pool To understand the genetics of evolution, we study
the gene pool of a population rather than the genotypes of its individual members
Quantitative measures of the gene pool Genotype frequencies Allele frequencies

Scarlet Tiger Moth

Scarlet Tiger Moth Genotype Frequencies Collection from one locality in England
yielded the following numbers of genotypes: 452 BB, 43 Bb and 2 bb for a total of 497 moths f(BB) = 452/497 = 0.909 f(Bb) = 43/497 = 0.087 f(bb) = 2/497 = 0.004 Total 1.000
Allele Frequencies Used by most population geneticists
instead of genotype frequencies Allele frequency =
number copies of a given allele
sum of all alleles in the population
Calculation of allele frequencies When two alleles are present at a locus (let’s call
it the A locus), we can use the following formula to calculate the allele frequency of A. The frequency of A is abbreviated as f(A) or p.
p = f(A) = (2 x number of AA homozygotes) +(number of Aa heterozygotes)(2 x total number of individuals)
Example calculation Imagine a population of 1000 individuals with 353 AA,
494 Aa and 153 aa individuals Each AA individual has two A alleles while each
heterozygote has one A allele p = f(A) = [(2 x 353)+ 494]/(2 x 1000 individuals) p = 1200/2000 = 0.60 The total of all allele frequencies must be 1.0 Only two alleles are involved at this locus We can therefore calculate q = f(a) = 1.0 - 0.6 = 0.4