phenotypic plasticity or speciation? a case from a clonal marine organism
TRANSCRIPT

BioMed CentralBMC Evolutionary Biology
ss
Open AcceResearch articlePhenotypic plasticity or speciation? A case from a clonal marine organismCarlos Prada*, Nikolaos V Schizas and Paul M YoshiokaAddress: Department of Marine Sciences, University of Puerto Rico-Mayagüez, Isla Magueyes Laboratories, P.O. Box 908, Lajas, PR 00667, USA
Email: Carlos Prada* - [email protected]; Nikolaos V Schizas - [email protected]; Paul M Yoshioka - [email protected]
* Corresponding author
AbstractBackground: Clonal marine organisms exhibit high levels of morphological variation.Morphological differences may be a response to environmental factors but also they can beattributed to accumulated genetic differences due to disruption of gene flow among populations. Inthis study, we examined the extensive morphological variation (of 14 characters) in naturalpopulations observed in the gorgonian Eunicea flexuosa, a widely distributed Caribbean octocoral.Eco-phenotypic and genetic effects were evaluated by reciprocal transplants of colonies inhabitingopposite ends of the depth gradient and analysis of population genetics of mitochondrial andnuclear genes, respectively.
Results: Significant differences (P < 0.001) in 14 morphological traits were found among coloniesinhabiting 12 locations distributed in seven reefs in southwest Puerto Rico. Results from principalcomponent analysis indicated the presence of two groups based on depth distribution, suggestingthe presence of two discrete morphotypes (i.e. shallow type < 5 m and deep type > 17 m). Adiscriminant function analysis based on a priori univariate and multivariate analyses (whichseparated the colonies in morphotypes) correctly classified 93% of the colonies for eachenvironment. Light, water motion and sediment transport might influence the distribution of thetwo morphotypes. Reaction norms of morphological characters of colonies reciprocallytransplanted showed gradual significant changes through the 15 months of transplantation. Scleritesof shallow water colonies became larger when transplanted to deeper environments and vice versa,but neither of the two transplanted groups overlapped with the residents' morphology. Geneticanalysis of mitochondrial and nuclear genes suggested that such discrete morphology and non-overlapping phenotypic plasticity is correlated with the presence of two independent evolutionarylineages. The distribution of the lineages is non-random and may be related to adaptationalresponses of each lineage to the environmental demands of each habitat.
Conclusion: The extensive distribution and ample morphological variation of Eunicea flexuosacorresponds to two distinct genetic lineages with narrower distributions and more rigid phenotypicplasticity than the original description. The accepted description sensu Bayer (1961) of E. flexuosais a complex of at least two distinct genetic lineages, adapted to different habitats and do notexchange genetic material despite living in sympatry. The present study highlights the importanceof correctly defining species, because the unknowingly use of species complexes can overestimategeographical distribution, population abundance, and physiological tolerance.
Published: 13 February 2008
BMC Evolutionary Biology 2008, 8:47 doi:10.1186/1471-2148-8-47
Received: 4 October 2007Accepted: 13 February 2008
This article is available from: http://www.biomedcentral.com/1471-2148/8/47
© 2008 Prada et al; licensee BioMed Central Ltd. This is an Open Access article distributed under the terms of the Creative Commons Attribution License (http://creativecommons.org/licenses/by/2.0), which permits unrestricted use, distribution, and reproduction in any medium, provided the original work is properly cited.
Page 1 of 19(page number not for citation purposes)
BMC Evolutionary Biology 2008, 8:47 http://www.biomedcentral.com/1471-2148/8/47
BackgroundThe phenotype is considered the product of inheritedgenetic information and its interaction with the environ-ment. Thus, differences in the phenotype can be explainedby variations in environmental conditions, but also suchphenotypic differences may reflect accumulated geneticvariation due to disruption of gene flow between popula-tions, and their subsequent speciation into biological spe-cies.
First, phenotypic plasticity enhances the survival andreproductive success of individuals by contributing totheir ability to cope with environmental changes and topotentially adapt to new niches. Plasticity is an emergentproperty of the genotype and therefore also susceptible tonatural selection [1]. The change of the plastic response isoften continuous, when the trait under analysis is sub-jected to an environmental gradient suspected to inducechanges [2]. The spectrum of phenotypes due to the envi-ronmental change describes the norms of reaction [2,3].Among the metazoans that exhibit the most extensivephenotypic plasticity are the marine modular species.
Phenotypic plasticity has been studied in algae [4],sponges [5], barnacles [6], gastropods [7,8], bryozoans [9]and anthozoans [10-16]. This plasticity provides organ-isms with the ability to generate the fittest phenotype suit-ing local conditions. Morphology is then acquiredthrough development under the current environment andcan be changed in the next generation, if conditions aremodified. Strong environmental gradients in the sea (e.g.light, water flow, sediment transport) may restrict the dis-tribution of individuals to habitats, representing oppositeends of the gradient, where each phenotype is adapted[17,18]. Furthermore, the fitness of the phenotypes variesalong the environmental gradient [17]. Disruptive selec-tion may enhance the success of the two phenotypes at theopposite ends of the gradient by ecologically favoringeach phenotype in its more suitable environment and byincreasing genetic divergence. In this case, organisms set-tle and suffer high mortalities in non-optimal environ-ments. Disruptive selection may be an influentialevolutionary force leading to two disparate phenotypes bythe existence of non-random mating related to habitat uti-lization [19].
In the absence of local adaptation, the high dispersalpotential of marine propagules usually results in genetichomogeneity over large distances [20-22]. However, allo-patric speciation is possible mainly because changes inoceanographic conditions, the emergence of land masses[23], and disconnection of populations by lower sea levels[24]. As gene flow is disrupted by a geographic barrier,populations become isolated and diverge due to geneticdrift. After genetic divergence has been acquired through
generations of genetic drift and restricted gene flow, sec-ondary contact can be achieved when the two new line-ages attain similar geographic distributions [25].
Apart from allopatric divergence, sympatric divergence isalso plausible. Speciation has occurred in spawningorganisms with larvae capable of long dispersal [26-28]and genetic differences have been detected in sympatricpopulations [29,30]. Ecological specializations to differ-ent habitats [31,32], variable symbiotic relationshipsrelated to habitat distribution [33] and unsynchronizedgamete release [34-36] may prevent organisms to repro-duce randomly in sympatry, leading to a rapid evolutionof mating systems [37-39] and eventually to speciation. Itis not surprising that sibling species in the sea are morecommon than previously thought [40]. Species with novelgene combinations can also be formed sympatricallythrough hybridization, an important process of diversifi-cation in marine and terrestrial systems [41-43].
In octocorals, phenotypic plasticity along environmentalgradients or habitats is not uncommon [12,14,29,44-47].Octocorals are relatively abundant and visually dominantin low relief hard ground habitats with preference for highwater motion areas [48,49]. Light, water motion and sed-iment transport are determining factors in the distributionof gorgonians [49]. These abiotic factors may induce mor-phological adjustments in broadly distributed species tooptimize fitness under suboptimal conditions. Coloniesof Eunicea flexuosa (Lamouroux 1821), in shallow forereefareas are susceptible to high water motion and are gener-ally taller; grow in a single plane with thicker branchesand bigger calices. In contrast, colonies in deeper environ-ments are exposed to low water motion and less light.There, the colonies exhibit multiplane growth, are smallerwith fewer terminal branches than their shallow counter-parts with smaller and more sparse calices [12]. Scleriteplasticity has also been correlated with differences inwater motion and light [12,14]. Smaller and thinner clubsand spindles are present in high water motion environ-ments (i.e., forereef areas), providing a stronger structureand support to the colony [14]. The high morphologicalvariability in E. flexuosa could be due to phenotypic plas-ticity, genetic differentiation or a combined effect. In thisstudy, first, the morphological variation of 14 traits of E.flexuosa was evaluated in seven reefs (from protected toexposed areas to water motion) at two depths (< 5 m and>17 m) and the correlation of morphology with light,water motion and sediment patterns was inferred. Second,environmental and/or genetic factors were studied todefine the morphological variation of E. flexuosa. Recipro-cal transplants of colonies inhabiting the opposite ends ofthe depth gradient were used to infer patterns, magnitudeand direction of the phenotypic response. Gene genealo-gies of the mitochondrial gene msh1 and the nuclear gene
Page 2 of 19(page number not for citation purposes)
BMC Evolutionary Biology 2008, 8:47 http://www.biomedcentral.com/1471-2148/8/47
18S were used to elucidate possible genetic-phenotypicinteractions. Lastly, allopatric and sympatric divergence(through ecological differentiation) and hybridizationwas considered as possible evolutionary processes thatproduce and maintain the morphological and genetic var-iation found in E. flexuosa.
ResultsNatural Variability of Morphological TraitsMean values per trait and habitat are shown in Fig. 1.Measurements of morphological characters of most colo-nies in a given location fell within a narrow range aroundthe mean. However, there were few colonies that did notmatch the mean population values. These atypical colo-nies were closer morphologically to colonies inhabitingthe opposite depth habitat than to their neighbours andshowed that in a given location, colonies under similarenvironmental conditions develop different morpholo-gies. All traits varied significantly between reefs andamong depths (Fig. 1). Values for CL, CW, CAL, CAW CD,SA, BT, CH, PD, TBN, and TBM decreased as depthincreased, whereas values for SL, SW and ID increasedwith increasing depth (Fig. 1).
Depth differences were also recovered in the principalcomponent analysis. The first principal component (PC1)explained 64% of the variance among measurements andwas characterized by high negative loadings for SL, SWand ID and high positive loadings for CW, CAW, SA andBT (Table 1). PC2 explained 16% of the variance and wascharacterized mainly by positively weighted CL, CW andCAL and negatively by CD. Two-way ANOVA on the load-ing values of the first three principal components showedsignificant differences in reef and depth in PC1 (Table 2)and PC2 loadings showed significant differences in reef.Since 80% of the variation was explained by the first twoprincipal components, environmental gradients related todepth, water motion, light and sediment transport couldprobably explain a portion of the morphological differ-ences. As these co-vary with depth, it was not possible toquantify their individual effects on the morphological var-iation of E. flexuosa.
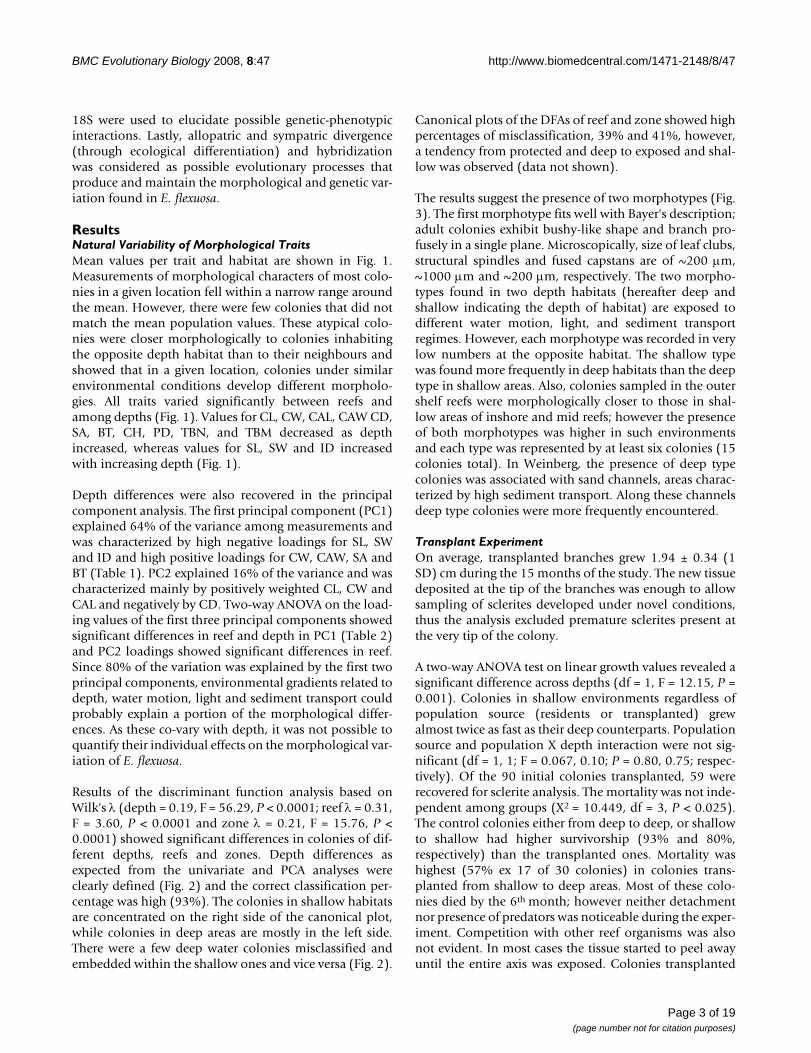
Results of the discriminant function analysis based onWilk's λ (depth = 0.19, F = 56.29, P < 0.0001; reef λ = 0.31,F = 3.60, P < 0.0001 and zone λ = 0.21, F = 15.76, P <0.0001) showed significant differences in colonies of dif-ferent depths, reefs and zones. Depth differences asexpected from the univariate and PCA analyses wereclearly defined (Fig. 2) and the correct classification per-centage was high (93%). The colonies in shallow habitatsare concentrated on the right side of the canonical plot,while colonies in deep areas are mostly in the left side.There were a few deep water colonies misclassified andembedded within the shallow ones and vice versa (Fig. 2).
Canonical plots of the DFAs of reef and zone showed highpercentages of misclassification, 39% and 41%, however,a tendency from protected and deep to exposed and shal-low was observed (data not shown).
The results suggest the presence of two morphotypes (Fig.3). The first morphotype fits well with Bayer's description;adult colonies exhibit bushy-like shape and branch pro-fusely in a single plane. Microscopically, size of leaf clubs,structural spindles and fused capstans are of ~200 μm,~1000 μm and ~200 μm, respectively. The two morpho-types found in two depth habitats (hereafter deep andshallow indicating the depth of habitat) are exposed todifferent water motion, light, and sediment transportregimes. However, each morphotype was recorded in verylow numbers at the opposite habitat. The shallow typewas found more frequently in deep habitats than the deeptype in shallow areas. Also, colonies sampled in the outershelf reefs were morphologically closer to those in shal-low areas of inshore and mid reefs; however the presenceof both morphotypes was higher in such environmentsand each type was represented by at least six colonies (15colonies total). In Weinberg, the presence of deep typecolonies was associated with sand channels, areas charac-terized by high sediment transport. Along these channelsdeep type colonies were more frequently encountered.
Transplant ExperimentOn average, transplanted branches grew 1.94 ± 0.34 (1SD) cm during the 15 months of the study. The new tissuedeposited at the tip of the branches was enough to allowsampling of sclerites developed under novel conditions,thus the analysis excluded premature sclerites present atthe very tip of the colony.
A two-way ANOVA test on linear growth values revealed asignificant difference across depths (df = 1, F = 12.15, P =0.001). Colonies in shallow environments regardless ofpopulation source (residents or transplanted) grewalmost twice as fast as their deep counterparts. Populationsource and population X depth interaction were not sig-nificant (df = 1, 1; F = 0.067, 0.10; P = 0.80, 0.75; respec-tively). Of the 90 initial colonies transplanted, 59 wererecovered for sclerite analysis. The mortality was not inde-pendent among groups (X2 = 10.449, df = 3, P < 0.025).The control colonies either from deep to deep, or shallowto shallow had higher survivorship (93% and 80%,respectively) than the transplanted ones. Mortality washighest (57% ex 17 of 30 colonies) in colonies trans-planted from shallow to deep areas. Most of these colo-nies died by the 6th month; however neither detachmentnor presence of predators was noticeable during the exper-iment. Competition with other reef organisms was alsonot evident. In most cases the tissue started to peel awayuntil the entire axis was exposed. Colonies transplanted
Page 3 of 19(page number not for citation purposes)

BMC Evolutionary Biology 2008, 8:47 http://www.biomedcentral.com/1471-2148/8/47
Page 4 of 19(page number not for citation purposes)
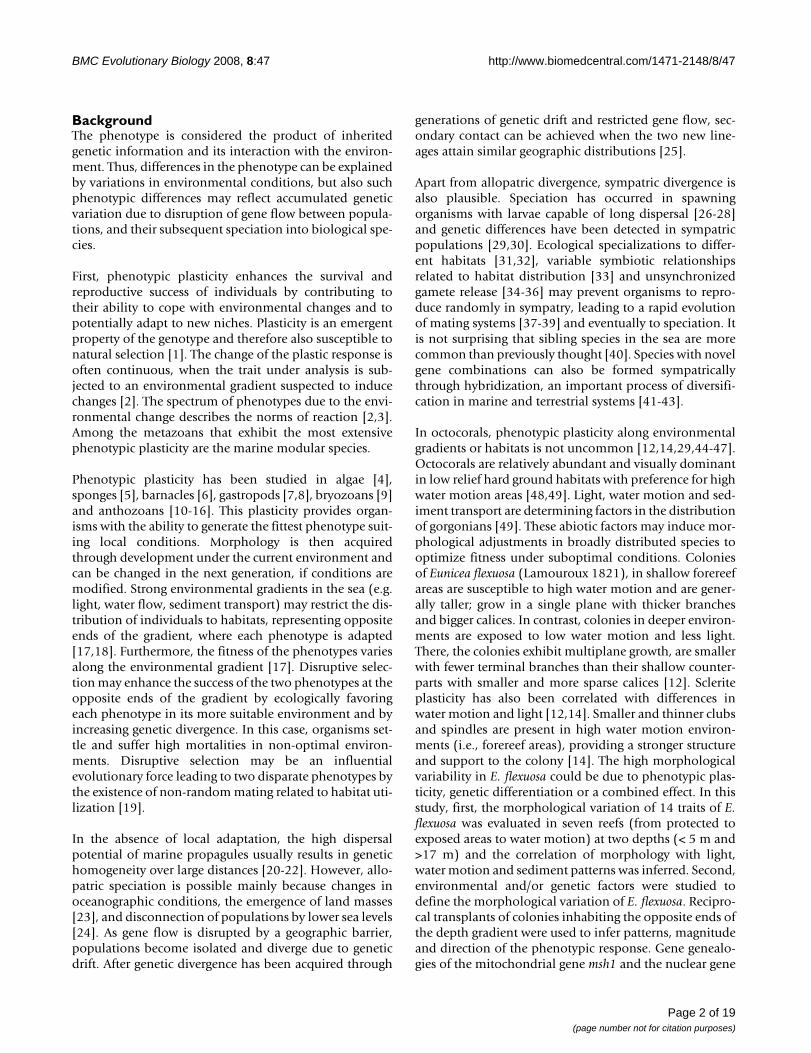
Extent of variation in phenotypic traits analyzed by individual nested ANOVAs for 14 morphological charactersFigure 1Extent of variation in phenotypic traits analyzed by individual nested ANOVAs for 14 morphological characters. Colonies are nested within habitats. Black and white bars represent samples in shallow and deep areas, respectively. Values are shown as mean value ± SE (n = 300 measurements per location for micromorphological characters and 15 per location for macromor-phological characters). Lowercase letters indicate treatments that are statistically different by post hoc analysis. The location codes are as in Table 6.
Club length (μm)
120 140 160
PSPDCSCDRSRDTSTDMSMD
HW
Capstan length (μm)
120 150 180
Capstan width (μm)
30 40 50
Spindle length (μm)
1000 2000 3000
PSPDCSCDRSRDTSTDMSMD
HW
Spindle width (μm)
200 400 600
calice diameter (μm)
300 400 500 600
Inter-calice distance (μm)
400 600 800 1000
Surface area 1cm2 (mm2)
0.8 1.2 1.6
Branch thickness (mm)
2 3 4 5
PSPDCSCDRSRDTSTDMSMD
HW
Colony height (cm)
30 45 60
Club width (μm)
50 60 70
Average length of terminal branches (cm)
3 4 5 6 7 8
Polyp density/cm245 60
Number of terminal
branches/colony
0 30 60 90 120
bc
aba
aaab
abaa
ac
a
ab
abab
ab
b
aba
a
abc
abcdabc
abcd
d
abcdab
abcd
a
abcd
bcd
abcd
abca
a
de
ea
a
a
a
cde
cd
cde
dea
a
a
ade
cd
a
ae
bcd
cde
cdecde
bc
e
dea
cd
ab
acde
cde
a
abcd
cd
d
cda
cd
abcde
abcef
abcde
bcdef
cdefabcd
abcde
a
abcd
cd
d
cda
cd
ab
abab
ab
a
a
a
ab
ab
ab
ab
a
cd
abc
bcd
a
a
ab
d
abcd
e
bc
a
ab
e
bc
a
ab
a
ab
de
cde
e
de
a
cd
ab
bc
cd
cd
a
ab
f
def
ab
bc
cd
cd
a
ab
ab
a
P< 0.0001
P< 0.0001P< 0.0001
P< 0.0001P< 0.0001
P< 0.0001
P< 0.0001P< 0.0001
P< 0.0001 P< 0.0001
P< 0.0001
P< 0.0002
P< 0.0001
P< 0.0001
a
b
ab
b
a
b
a
a
c
c
c
a
c
b
a
a
bc
bc
bc
a
c
c
a
a

BMC Evolutionary Biology 2008, 8:47 http://www.biomedcentral.com/1471-2148/8/47
from deep to shallow areas had high survivorship (77% ex23 of 30 colonies), nonetheless bleaching was recorded in14 colonies (46%) and 23% of those died.
After 15 months of the experiment, measurements of scle-rites for shallow and deep colonies were within the rangesuggested by the natural variability analyses (Fig. 4). How-ever, spindle width and length of the reciprocally trans-planted colonies gradually became similar to those of theresident colonies but never overlapped, colonies trans-
planted from shallow to deep areas tended to increase insclerite size while spindles of colonies from deep to shal-low became smaller. CL, CW, CAL and CAW showed sim-ilar trends but exhibited lower percent variation withingroups, therefore resulting in non-significance betweengroups comparisons (i.e., DD, SS, SD and DS) (Fig. 4).Some colonies (i.e., SD16, SD18, SD19, DS7, DS8, DS14,DS 15, DS17, DS22, DS 23 and DD2) differed signifi-cantly from their source population either shallow ordeep. Such atypical colonies did not show the gradual
Discriminant function analysis plot based on 14 morphologi-cal characters of E. flexuosa colonies inhabiting different depth habitats (D for deep and S for shallow)Figure 2Discriminant function analysis plot based on 14 morphologi-cal characters of E. flexuosa colonies inhabiting different depth habitats (D for deep and S for shallow). Multivariate comparison (fixed-effect MANOVA) among depths was sig-nificant (Wilks' λ = 0.2769; F = 30.7713 df = 14/167; P < 0.001). Misclassified colonies = 14 (7%). The canonical axis 1 mostly weighted by length and width of spindle and club, intercalice distance surface area and branch thickness, while canonical axis 2 was mostly weighted by width and length of clubs and calice density.
5
6
7
8
9
10
11
Can
onic
al2
D S
-1 0 1 2 3 4 5 6 7
Canonical1
Table 2: Two-way ANOVA results showing the effects of depth, zone and the interaction between depth and zone on the first three principal components.
Parameter df PC1 PC2 PC3
MS F MS F MS F
Zone 1 0.044 0.279 3.238 3.415 11.553 13.571***Reef(Zone) 2 0.826 5.198*** 3.755 3.96* 0.328 0.385
Depth 1 99.079 623.196*** 0.087 0.092 0.029 0.034Zone*Depth 1 0.100 0.628 0.074 0.078 9.721 11.42***
Error 114 0.159 0.948 0.851
The PCA loading scores were obtained from analysis of 12 morphological features of E. flexuosa in the sampling environments. Note that only eight of the 12 locations were included to achieve a balanced design. Significant values are represented by ***, ** and * for P < 0.001, P < 0.01 and P < 0.05, respectively.
Table 1: Summary results of the principal component analysis.
Characters PC1 PC2 PC3
Eigenvalue 7.67 1.87 0.93Explained Variance (%) 64 16 8
CL 0.14 0.43 0.60CW 0.26 0.36 -0.07CAL 0.17 0.53 0.01CAW 0.27 -0.10 -0.01
SL -0.31 0.18 0.19SW -0.31 0.13 0.16CD 0.24 -0.37 -0.04ID -0.31 0.13 -0.15SA 0.30 0.09 -0.27BT 0.30 0.09 -0.27
TBM 0.20 0.32 -0.21TBN 0.27 -0.23 0.42CH 0.27 -0.17 0.43PD 0.32 -0.01 -0.05
The first three principal components are shown, calculated from 14 skeletal traits measured on E. flexuosa, collected from the 12 locations (seven reefs were included). The character codes are: club length (CL), club width (CW), capstan length (CAL), capstan width (CAW), spindle length (SL), spindle width (SW), calice diameter (CD), intercalice distance (ID), surface area (SA), polyp density (PD), branch thickness (BT), terminal branch number (TBN) terminal branch average length (TBL) and colony height (CH).
Page 5 of 19(page number not for citation purposes)

BMC Evolutionary Biology 2008, 8:47 http://www.biomedcentral.com/1471-2148/8/47
change in spicule size over time, observed within theirtransplanted group. Two-way repetitive measurementANOVAs (Table 3) also showed significant differencesamong populations (DD, SS, SD and DS) for most traits(except CL and CAL) and the time X population interac-tion in SL and SW.
DNA AnalysisAll colonies found in either shallow or deep areas wereclassified as deep habitat or shallow habitat. Morphologywas used to define the second group of populations (deepor shallow types). The two classification schemes are notidentical, as the atypical colonies found during the mor-phological analysis could be correctly classified. Also,each reef was treated as one population so that among reefcomparisons could be established.
Msh1A total of 130 sequences of msh1 (723 bp) resulted in 10distinct haplotypes, with three to nine haplotypes perpopulation. The numbers of segregating sites were similarbetween populations, 9 and 8 sites were observed for col-onies inhabiting shallow and deep environments, respec-tively.
The shallow type possessed 6 haplotypes and the deeptype contained 4 haplotypes, among which the maximumdifference was 6 substitutions. There were 2 and 3 segre-gating sites in the shallow and deep types, respectively.The most common haplotypes within each of shallow anddeep types were represented by 54 and 30 individuals,respectively. The values of the nucleotide diversity indices(π, θ) for the pooled data were 0.0039 and 0.0024, respec-
Differences among colonies inhabiting deep and shallow areasFigure 3Differences among colonies inhabiting deep and shallow areas. A. Colonies in shallow areas (left), compared to deep colonies (right) are more branched and bigger in size. Thicker colonies are found in shallow areas with smaller spindles and more polyps per area (B and C). Right showing differences among sclerites; club (D), capstan (E), spindle (F) and spindle close up (G) of col-onies inhabiting shallow (left) and deep (right) areas. Spindles of shallow area colonies compared to deep colonies are bigger in size. The surface arrangements of warts are sparser in shallow area colonies (G).
Page 6 of 19(page number not for citation purposes)

BMC Evolutionary Biology 2008, 8:47 http://www.biomedcentral.com/1471-2148/8/47
Page 7 of 19(page number not for citation purposes)
Reaction norms of morphological traits through time in transplanted coloniesFigure 4Reaction norms of morphological traits through time in transplanted colonies. Spindle changes are more drastic than club and capstans. Population codes are SS: Shallow to shallow; DD: Deep to deep for residents and SD: Shallow to deep and DS: Deep to shallow for reciprocal transplants. Values are given as mean value ± 1 standard deviation.
Experimental Time (Months)
0 2 4 6 8 10 12 14 16
Cap
stan
Len
gth
(μm
)
130
135
140
145
150
155
160
165
P < 0.012
Experimental Time (Months)
0 2 4 6 8 10 12 14 16
Cap
stan
Len
gth
(μm
)
130
135
140
145
150
155
160
165
P < 0.012
Experimental Time (Months)
0 2 4 6 8 10 12 14 16
Cap
stan
Wid
th (μm
)
30
35
40
45
50
55
P < 0.032
P < 0.029
Experimental Time (Months)
0 2 4 6 8 10 12 14 16
Cap
stan
Wid
th (μm
)
30
35
40
45
50
55
P < 0.032
P < 0.029
0 2 4 6 8 10 12 14 16
Clu
b W
idth
(μm
)
56
58
60
62
64
66
68
70
72
P < 0.023
P < 0.028
0 2 4 6 8 10 12 14 16
Clu
b W
idth
(μm
)
56
58
60
62
64
66
68
70
72
P < 0.023
P < 0.028
0 2 4 6 8 10 12 14 16
Spi
ndle
Len
gth
(μm
)
800
1000
1200
1400
1600
1800
2000
2200
2400
P < 0.0046
P < 0.043
0 2 4 6 8 10 12 14 16
Spi
ndle
Len
gth
(μm
)
800
1000
1200
1400
1600
1800
2000
2200
2400
P < 0.0046
P < 0.043
250
300
350
400
450
500
0 2 4 6 8 10 12 14 16
Spi
ndle
Wid
th (μm
)
P < 0.001
P < 0.0098
250
300
350
400
450
500
h (μ
m)
P < 0.001
e W
idt
0 2 4 6 8 10 12 14 16
Spi
ndl
P < 0.0098
150
152
154
156
158
160
162
164
166
168
0 2 4 6 8 10 12 14 16
Clu
b Le
ngth
(μm
)
P < 0.031
P < 0.028
150
152
154
156
158
160
162
164
166
168
P < 0.031
0 2 4 6 8 10 12 14 16
Clu
b Le
ngth
(μm
)
P < 0.028
DDSSSDDS
DDSSSDDS

BMC Evolutionary Biology 2008, 8:47 http://www.biomedcentral.com/1471-2148/8/47
tively. π ranged from 0.0007 (shallow type) to 0.0039(Romero reef), whereas θ was lowest in deep type(0.0009) and highest in Media Luna reef (0.0028). Mostof the haplotypes were singletons; this mutation patternwas more common in colonies of shallow habitats. Fu's Fstest for the shallow and deep type revealed a significantdeparture from equilibrium only for the shallow type (-3.05038, P = 0.037). The excess of rare mutationsobserved in the shallow type is consistent with populationexpansion or purifying selection. Tajima's D tests were notsignificant.
The within shallow and deep type divergence varied from0% to 0.3%, as estimated with the Kimura-2-parametermodel [50]. Divergence between shallow and deep typesranged from 0.61% to 1.07%. The shallow type was moreclosely related (0.61% to 0.76%) to Plexaura homomallathan the deep type (0.92% to 1.23%).
18SA 251 bp fragment of 18S was sequenced from 143 colo-nies of E. flexuosa. Most of the sequences (90) were fromMedia Luna reef (colonies used in the transplant experi-ment), while 32 sequences were from Romero and anadditional 21 from Culebra. Among all sequences, 15haplotypes were discernable with colonies in shallowhabitats presenting the highest haplotype diversity (h =11). Among reefs, Media Luna had the highest number ofhaplotypes (h = 11). The values of the nucleotide diversityindices (π, θ) for the pooled data were 0.0088 and 0.0079,respectively. π ranged from 0.0014 (deep type) to 0.0093(Romero reef), whereas the lowest (0.0044) and the high-est θ (0.0089) was also observed in the same data parti-tions. The within shallow type genetic variability rangedfrom 0% to 0.97%, and the within deep type variabilityranged from 0 to 0.48%, as estimated by the Kimura-2-parameter model. Divergence between shallow and deeptypes was similar to the msh1 divergence and ranged from0.97% to 1.95%. Fu's Fs test for the data partitionsrevealed a significant departure from equilibrium for the
shallow type (-3.7390, P = 0.0459) and the deep type (-4.4450, P = 0.0036). The excess of rare mutationsobserved in the ribosomal gene of the shallow type maybe explained by population expansion or purifying selec-tion. Tajima's D was significant only for the deep type (-1.6119, P = 0.0224). Departure from equilibrium wasconsistently observed across the two genes only for theshallow type group. The significant departure from neu-trality recorded in the deep type by the 18S gene and notthe msh1 gene, may be attributed to the fact that the twogenes belong to different genomes and are under differentselection and stochastic processes.
AMOVA tests showed significant differentiation amongpopulations (Table 4), regardless whether the popula-tions were divided per habitat (shallow or deep) or bymorphotype (shallow type and deep type). Nonetheless,population differentiation was maximized when the latterassignment was used. A comparison among reefs (MediaLuna and Romero) yielded non-significant FST values, sug-gesting an extensive gene flow among these two reefs.Also, a comparison of all shallow habitats (Romero shal-low, Media Luna shallow and Culebra) suggested homo-geneity among populations. The genetic homogeneitywithin La Parguera is not surprising because of the shortdistance between the reefs. Even when including coloniesfrom Culebra, which is 100 km northeast from La Par-guera, genetic homogeneity was still observed. However,when comparisons of reefs lacking the deep habitats (e.g.,in Culebra only shallow areas were sampled), FST valueswere significant, suggesting population subdivision. Asinferred from the AMOVAs the haplotype network analy-sis showed similar patterns (Fig. 5). Two groups wereextracted from the haplotype network analysis, the firstconsists of the vast majority of sequences that have theshallow morphotype and the second group contains mostof the deep morphotype.
Gene genealogies were constructed in PAUP using MLwith the HKY and Jukes Cantor as most suitable substitu-
Table 3: Repetitive measurements ANOVAs evaluating the effects of population (transplanted and residents), time (every 5 months until 15 months) and their interaction.
Source of variation
df SL SW CL CW CAL CAW
MS F MS F MS F MS F MS F MS F
Population 3 15688573 47.7*** 15688573
47.7*** 78.207 0.2 271.916 2.8* 197.896 0.5 1140.334
14.6***
Time 3 59699.93 1.8 59699.93 1.8 598.211 6.2*** 115.605 5.3** 519.5 3.2* 23.082 1.7Pop × Time
9 306976.5 9.7*** 306976.5 9.7*** 74.681 0.8 37.413 1.7 447.227 2.7** 23.718 1.8
Total 259 294507.5 294507.5 144.101 43.889 233.867 42.047
Significant values are represented by ***, ** and * for P < 0.001, P < 0.01 and P < 0.05, respectively. Codes are as in table 1.
Page 8 of 19(page number not for citation purposes)

BMC Evolutionary Biology 2008, 8:47 http://www.biomedcentral.com/1471-2148/8/47
tion models for msh1 and 18S, respectively. Analysis per-formed using neighbour joining and parsimony yieldedsimilar patterns. Also, the topology of msh1 and 18S wassimilar, however the 18S analysis recovered only one ofthe clades, as 18S was less variable than msh1.
The genealogy divided the individuals in two clades (Fig.6), which are highly indicative of the habitat origin (shal-low or deep). In the bottom clade, 62 of the colonies arefrom deep areas; however nine colonies fell within thisclade. These nine colonies are the atypical colonies foundduring the morphological analysis (e.g., Media Luna shal-
low), where comparisons of morphological characters ofthese atypical colonies did not match the overall popula-tion mean, despite living in the same habitat. Similar pat-terns are displayed for the top clade, which represents 68colonies sampled in shallow areas and three atypical col-onies found in deep areas. Furthermore, these atypicalcolonies in each clade are those colonies that were mis-classified (7%) by the discriminant function analysis.Table 5 shows a summary of the number of individualswithin each genetic lineage divided by habitat and mor-photype (shallow and deep types). The atypical colonieswithin each habitat were later shown by the DNA analysis(Fig. 6) to be phylogenetically closer to their oppositehabitat congeners, reinforcing the morphological differ-ences.
DiscussionEunicea flexuosa is divided into two discrete morphologi-cal forms in southwest Puerto Rico. The shallow type ispervasive in shallow areas, but a few colonies of the shal-low type can be found in deep habitats. The second mor-photype (deep type) could be described as small colonies,with fewer terminal branches, more sparsely polyps, thin-ner branches and bigger spindles. The deep type is foundat the muddy bed at the base of forereef of inside and midreefs and largely confined to deep areas with low watermotion patterns, high sediment transport and lower lightlevels. The observed variation in E. flexuosa resembles
Table 4: Analysis of molecular variance (AMOVA) for msh1 and 18S (in parenthesis).
Comparison tested d.f. Sum of squares Variance component
% variation ΦST
Between habitats (shallow Vs deep)Among populations 1 (1) 84. 89 (55.599) 1.29890 (0.79038)Va 66.87 (49.27) 0.66873 (0.49266)***Within populations 128 (141) 82.36 (114.765) 0.64345 (0.81394)Vb 33.13 (50.73)
Total 129 (142) 167.254 (170.364) 1.94235 (1.60431)Between morphotypes (shallowtype Vs deeptype)
Among populations 1 (1) 130.412 (108.532) 2.06222 (1.59683)Va 87.89 (78.45) 0.87891 (0.78455)***Within populations 128 (141) 36.084 (61.832) 0.28413 (0.43852)Vb 12.11 (21.55)
Total 129 (142) 167.254 (170.364) 1.94235 (2.03536)Between reefs (Romero Vs Media Luna)
Among populations 1 (1) 1.702 (0.642) 0.00829 (0.01242)Va 0.64 (0.96) 0.00637 (0.01043)Within populations 128 (107) 165.552 (128.744) 1.29338 (1.20321)Vb 99.36 (99.04)
Total 129 (108) 167.254 (129.385) 1.94235 (1.19079)Between reefs considering shallow populations only (Romero Vs Media Luna Vs Culebra)
Among populations 2 (2) 0.921 (1.790) 0.00157 (0.00257)Va 0.37 (0.30) 0.00366 (0.00305)Within populations 65 (74) 27.844 (62.210) 0.42837 (0.84067)Vb 99.63 (99.70)
Total 67 (76) 167.254 (64.000) 1.94235 (0.84324)Among reefs with different depth profiles (Media Luna Vs Romero Vs Culebra)
Among populations 2 (2) 15.034 (4.639) 0.18265 (0.03526)Va 13.22 (2.91) 0.13223 (0.02911)***Within populations 127 (120) 152.22 (141.101) 1.19859 (1.17584)Vb 86.78 (97.09)
Total 129 (122) 167.254 (145.740) 1.94235 (1.21110)
Comparisons of population were made among depth profiles, morphotypes and reefs. The significance of the ΦST values were obtained by randomizations of 10,000 permutations. P < 0.001 is represented by ***. Sampling in Culebra is limited to shallow habitats.
Table 5: Number of individuals in each genetic lineage.
Habitat (shallow and deep)
Genetic lineage Shallow Deep
G1 65 3G2 9 53
Morphotypes (shallow-type and deep-type)
Genetic lineage Shallow-type Deep-typeG1 68 0G2 0 62
In the top-half of the table the genetic lineages are divided by their living habitat. The bottom-half shows the genetic lineage division based on morphology (morphotypes).
Page 9 of 19(page number not for citation purposes)

BMC Evolutionary Biology 2008, 8:47 http://www.biomedcentral.com/1471-2148/8/47
findings on phenotypic plasticity of other modular organ-isms. Mechanical stimuli such as wind speed or watermotion induce morphological adjustments in both terres-trial and marine plants [4,51]. Other marine modular taxasuch as the bryozoan Membranipora membranacea adapt towater flow to maximize food capture [52], the demos-ponge Halichondria panacea develop stiffer branches inhigh energy habitats [5] and the coral Madracis mirabilis
exhibit sparser and thicker branches in high flow areas[10]. Light has also been associated with phenotypicchanges in plants [53], algae [54] and corals [55]. Othernon-mechanical stimuli such as presence of predators inthe bryozoan M. membranacea can induce plasticresponses (i.e. defensive spines) [9].
The discrete morphological distribution found in E. flexu-osa is in concordance with previous studies of octocorals,where colonies inhabiting deep forereef areas were thin-ner with more sparse and fewer calices and have biggerspindles than the colonies in shallow habitats in eitherback or forereef areas in the Florida Keys [12]. Spindles atthe branch tip were significantly smaller and presumablyunderdeveloped in E. flexuosa, while in Briareum asbesti-num, West [47] reported bigger spindles at the tips. Thediscrepancy of the findings may be related to differentecological pressures on the two species, different functionof spindles in each species (i.e., B. asbestinum lacks a cen-tral axis) or may depict difference responses constrainedby their separate phylogenetic history. Moreover in termsof habitat differences, smaller spindles at high watermotion areas are thought to increase stiffness of the col-ony to avoid breakage. Grigg [56], West et al. [14] andKim et al. [12] reported that sclerite size is negatively cor-related with water motion for B. asbestinum and E. flexuosa.However, the opposite observation has been made inEunicella singularis [45]. Colony size, calice diameter andpolyp density may compensate water flow changes andenhance respiration, feeding or structure as has beenreported for scleractinian corals [10,57,58]. Furthermore,the overall discrepancy in colony development (more andbigger terminal branches) may be interpreted as aresponse to the water drag forces acting upon the colony,yet colonies in shallow areas are exposed to higher waterflow and vice versa.
In E. flexuosa, the differences of the two morphotypes arerelated to depth profiles, water motion and sedimenttransport. However, as water motion, sediment transportand light co-vary along depth profiles, the study could notdistinguish the individual influences. Furthermore, thedeep habitats of the inside and mid reefs differ signifi-cantly from those of the outer reefs. In the inside and midreefs, loose sediments move along the slope and aredeposited at the base of the forereef, where deep colonieswere sampled. Therefore, settling larvae in such areas aresubject to higher sediment deposition and probably havedeveloped an adaptational response to such environmen-tal condition. Similarly, colonies in the two outer reefs, ElHoyo and Weinberg, developed in the edges of sandpatches were different than those spread along the hardground bottom. In La Parguera, the octocoral communityobserved at the sand bed adjacent to the forereef (~20 m),is less diverse than the community of hard ground habi-
Parsimony haplotype networks based on msh1 for colonies inhabiting shallow or deep areasFigure 5Parsimony haplotype networks based on msh1 for colonies inhabiting shallow or deep areas. The network indicates the six haplotypes found in shallow areas (i.e., shallow type) and the four haplotypes found in the deep areas (i.e., deeptype). The size of the circle is proportional to the observed number of sequences for the corresponding haplotype. The minimum number of steps is represented by the small empty circles.
Shallow Lineage
Deep Lineage
Colonies sampled in shallow areas
Colonies sampled in deep areas
Shallow Lineage
Deep Lineage
Colonies sampled in shallow areas
Colonies sampled in deep areas
Page 10 of 19(page number not for citation purposes)

BMC Evolutionary Biology 2008, 8:47 http://www.biomedcentral.com/1471-2148/8/47
tats. In such suboptimal habitats, Pseudopterogorgia spp.,Plexaurella spp. and some Muricea spp. (except Muriciamuricata) are the dominant species. These species areprobably better adapted to overcome sediment suffoca-tion and develop. Pseudopterogorgia spp. and Muricea spp.avoid sediment burial by rapidly reaching a safe size dueto the lack of thick central axis which allows for fastergrowth. In Plexaurella spp., the presence of big polyps canefficiently remove sediment from the colony. The deeptype of E. flexuosa is a thin colony with a small central axisand few polyps, which might grow fast enough to over-come sediment overload.
The morphology of E. flexuosa can also be affected by lightand other factors associated with depth such as foodresources, presence of predators and hydrostatic pressure.Nonetheless, water motion covaries with depth and there-fore both are related. Light is likely a major factor relatedto depth and affects anthozoan morphology, as presenceof zooxanthellae is tightly related to carbonate uptake andenergy supply for the host. Light levels influence the phe-notype of anthozoans due to changes in zooxanthellaeconcentration and decrease of calcification rates[14,55,59,60]. Moreover, plate-like colonies most likelyrepresent an evolutionary response to compensate for lowlevels of light by increasing area and zooxanthellae con-centrations.
The two morphologies of E. flexuosa associated with differ-ent habitats showed some degree of phenotypic plasticityin sclerite characters (especially spindles), which showeda clear tendency to increase and decrease when trans-planted to deep and shallow areas, respectively. Nonethe-less, after the 15 months of the experiment in neither casethe spindles of transplanted colonies became similar insize as the residents' spindles. The results suggest thateither there was not enough time for the colonies to pro-duce new tissue under the novel conditions or there is anon-environmental factor accounting for the rest of themorphological variation. There is less evidence for theformer; colonies grew on average ~2 cm during the trans-plant experiment, and since the analysis was performedusing tissue 1 cm from the branch tip, there was morethan 0.5 cm tissue to be analyzed. Also, the reaction normgraphs showed a stabilization of the curve at 10 and 15months, suggesting that the maximum of variation wasreached.
Gorgonian corals resemble plants in many ways and mor-phologically they are modular organisms where integra-tion/disintegration can occur in response toenvironmental gradients [61]. If phenotypic plasticity ingorgonians is expressed at the modular level (polyp andbranch), the transplant results may be interpreted as thesum of all historical (branches before transplantation)
Gene genealogy for msh1Figure 6Gene genealogy for msh1. Bootstrap values for 100 and 1000 replicates in maximum likelihood and neighbor joining analyses are shown. Similar topologies and bootstrap values were recovered using maximum parsimony but not shown. Muricea muricata was used as an outgroup. In grey are colo-nies sampled in shallow areas and in black colonies in deep areas. The genealogy divided the individuals in two clades, which are highly indicative of the habitat origin (shallow or deep). In one clade (bottom) most of the colonies (62) are from deep areas (black), however 9 colonies (grey) fall within this clade. These 9 colonies had a different morphology despite living in the same habitat. The same pattern was observed for the top clade.
Sha
llow
type
linea
geD
eept
ype
linea
ge
M. muricata
Colonies sampled in shallow areas
Colonies sampled in deep areas
100/100
70/73
87/83
Sha
llow
type
linea
geD
eept
ype
linea
ge
M. muricata
Colonies sampled in shallow areas
Colonies sampled in deep areas
100/100
70/73
87/83
Page 11 of 19(page number not for citation purposes)

BMC Evolutionary Biology 2008, 8:47 http://www.biomedcentral.com/1471-2148/8/47
and experimental (branches during transplantation)interactive and antagonistic changes between modules.The observed changes in sclerite size which are changesaffecting individual modules suggest there is some plastic-ity at the modular level. The plastic response of moduleshas cascade effects on the colony level. For example, whencolonies are transplanted from deep to shallow areas, scle-rites become smaller and denser enhancing the flexibilityof the colony.
Other transplant experiments with modular organisms(e.g., the sponge Halichondria panacea) exhibit variableresponses to environmental stimuli [5]. When colonies ofH. panacea were placed in high energy areas, they becamestiffer, a response which is in agreement with our observa-tions on E. flexuosa. Alternatively, plasticity may be mostlikely promoted during the early life stages rather than inmature colonies. Other stochastic environmental factorssuch as the 2005 Caribbean wide bleaching event mayhave affected the results.
The possibility that no environmental factors account forthe majority of morphological variation is supported bythe genetic data. Analysis of the msh1 and 18S genesresulted in two major lineages associated with depth. Col-onies transplanted from shallow to deep habitats sufferedabout 50% mortality; those transplanted from deep toshallow suffered 20% mortality. Since survivorship is afundamental attribute of fitness then increase in mortalitywould indicate lower fitness. Therefore, each morphotypeis better adapted to the deep or shallow areas. The resultsfrom the transplant experiments may represent experi-mental error or a drastic response of the colonies to novelenvironmental conditions. Previous studies have shownthat adult colonies (> 20 cm) in natural populations arestable and have a normal survivorship rates above 90%[62], suggesting that such high mortalities are naturalresponses rather than sampling error. Although the twogenetic lineages are associated with the two habitats, thereis a noticeable response of both shallow and deep type toenvironmental stimuli. As previous studies have reported,there is a positive correlation of spindles to increase in sizeas depth increases and vice versa [12,14]. Clubs and cap-stans slightly changed with depth but the tendency wasnot consistent.
In Puerto Rico, the morphological divergence found incolonies of E. flexuosa is genetically based. Gene genealo-gies, haplotype networks and AMOVA analysis of bothnuclear and mitochondrial genes suggested that such dis-crete morphological distribution is correlated with thepresence of two distinct lineages, distributed non-ran-domly in shallow and deep environments. However,either of the two lineages can infrequently be found inboth depth habitats. The genetic break found in nuclear
and mitochondrial DNA suggests that gene flow ceased along time ago and divergence may have led to speciation.Fixed differences in both nuclear and mitochondrial genesare comparable to those reported between species of octo-corals [63,64]. Therefore, the current description sensuBayer [46] of E. flexuosa is a complex of at least two dis-tinct genetic lineages, adapted to different habitats andthat do not exchange genetic material despite living insympatry. The extensive distribution and ample morpho-logical variation corresponds to two distinct genetic line-ages with narrower distributions and more rigidphenotypic plasticity. The observed genetic pattern mayhave resulted from 1) secondary contact after populationsdiverged in allopatry and reproductive incompatibilitydeveloped, 2) by divergence with gene flow through eco-logical specialization in sympatry or 3) by the poorlyunderstood process of hybridization in anthozoan evolu-tion.
Processes of DivergenceThe planulae of most anthozoan broadcasters such as E.flexuosa are capable of staying days to weeks in the watercolumn producing genetically homogeneous populationsacross large geographic areas [21,22,65]. Despite the highpotential for dispersion and population connectivity,allopatric speciation is probably the most common modeof speciation in marine environments [23,24,66,67].Recent genetic studies [68-71] have contradicted earlierassumptions of population homogeneity in Caribbeanpopulations of marine taxa [72,73]. Even though allopat-ric distribution could have caused the divergence of thelineages, there is no recent evidence of geological proc-esses that may have altered the patterns of Caribbean cir-culation. However, distinct sympatric lineages have beenuncovered in other Caribbean invertebrates [74].
On the other hand, sympatric speciation by ecological dif-ferentiation [17] and disruption of gene flow in proximatepopulations is plausible. The two genetic lineages of E.flexuosa are found at the opposite ends of a depth gradient.Diversifying selection may favor the two phenotypes atthe extremes of the depth gradient, preventing gene flowthrough assortative mating and eventually leading to newspecies [75]. These ecological specializations to depthhabitats have been pointed out in earlier reviews [32].Such ecological differences in niche utilization may bereinforced by dissimilar characteristics associated with thehabitats they occupy. Symbiotic relationships to host [76]or to environment [77], differential timing of gameterelease due to depth related differences [34,35] may haveprovided different resources to populations at differenthabitats and eventually prevent random mating. As a con-sequence, rapid evolution of mating systems may havebeen favoured [37-39]. In Caribbean corals, diversifyingselection has been proposed in at least two species: Mon-
Page 12 of 19(page number not for citation purposes)

BMC Evolutionary Biology 2008, 8:47 http://www.biomedcentral.com/1471-2148/8/47
tastraea annularis [27] and Favia fragum [30]. It is likelythat the genetic differences reported by Brazeau and Har-vell [29] in the gorgonian B. asbestinum could have arisenthrough the same mechanism. Although, disruptive selec-tion seems to explain the divergence of the two lineages ofE. flexuosa, hybridization is also another plausible mecha-nism to cause diversification in marine taxa.
Hybridization is a common phenomenon in plants andthe rise of new lineages due to reticulations is oftenreported in flowering plants [41,78]. In the marine envi-ronment, there are instances of hybridization in angel-fishes [79], cichlids [80], blue mussels [81] and corals [82-84], suggesting that hybridization is an important evolu-tionary mechanism for speciation. Nonetheless, it is oftenassumed that discrepancies in gene phylogenies or FST sta-tistics from different molecular markers is interpreted asincomplete lineage sorting, rather than reticulations as itis interpreted often in plants [41,78]. The phenomenon ofreticulate evolution may have great influence in the speci-ation of marine species especially those living in sympatrywith high potential for hybridization (e.g., spawners).
Veron [43] has provided a theoretical framework to con-sider reticulate evolution as an important factor of coralevolution. Direct measures of chromosome differencesestablished in Acropora [85], genetic surveys of the nucleargenome of corals [83,84,86] and direct crosses of gametes[82] have shown introgression in natural populations. InE. flexuosa, the two uncovered lineages may have arisen byhybridization between the common form of E. flexuosawith another Eunicea or Plexauraspecies. Furthermore,hybrid fitness may increase over parent fitness in novelenvironment or in extreme habitats. Hybrids tend toexplore novel habitats avoiding introgression and compe-tition with their parents [87,88]. Therefore, it is likely thatthe lineage related to deep muddy areas is of hybrid originand is better adapted to such conditions than the parentalspecies.
ConclusionThe accepted description sensu Bayer [46] of E. flexuosa isa complex of at least two distinct genetic lineages, adaptedto different habitats and that do not exchange geneticmaterial despite living in sympatry. The present studyhighlights the importance of correctly defining species,because the unknowingly use of species complexes canoverestimate geographical distribution, population abun-dance, and physiological tolerance. The non-random dis-tribution of both morphotypes can yield misleadingpopulation genetic inferences in the absence of adequatetaxonomy. Consequently, decisions based on these esti-mates will have repercussions in conservation programs[32]. Detailed studies of the mechanism by which antho-zoans achieve assortative mating and become reproduc-
tively isolated would give us insights in the speciationprocess. Also, cross fertilization experiments, geneticassessment of shared alleles through genetic markers andkaryotyping may shed light on the speciation process viahybridization. Reticulations are common in plants, agroup that resembles most of the ecological aspects (bethedging strategies, modular organization, philopatricrecruitment, etc.) that govern marine modular organisms.
MethodsThe SpeciesFormerly known as Plexaura flexuosa, the species has beenrecently placed into the genus Eunicea based on moleculardata and the size ratio of spindles and clubs [89]. Euniceaflexuosa is an octocoral cnidarian forming colonies of ~1m in height found in coral reefs and tropical rocky walls[46,49,90]. Eunicea flexuosa is relatively abundant in lowrelief hard ground habitats with preference for high watermotion areas [48,49]. The distribution of the speciesspans through several environmental gradients (e.g.,depth, light, water motion and sediment transport) [90]and display an unusual amount of morphological varia-bility. Eunicea flexuosa is a gonochoric gorgonian thatreproduces sexually by spawning gametes [91]. Asexualreproduction through fragmentation can also take placewhen loose branches spread to the surroundings (< 10 m)and new colonies develop from clone-mate propagulesbut is not as common as in P. kuna [92]. The colony is pro-duced by the asexual budding of its polyps, generating abranching dichotomous morphology, arranged in an axialskeleton of fused sclerites of calcium carbonate [46].Adult colonies exhibited bush-like shape and branch pro-fusely in a single plane. Microscopically, the apertures(calices) present an inconspicuous lower lip with anunarmed collaret. Sclerites are arranged in three layers.The axial sheath is made up of fused capstans usually pur-ple and ≤ 200 μm in length. The external layer containsleaf clubs of ~200 μm with 3 or 4 serrate folia and struc-tural spindles (~2000 μm in length) are disposed in a midlayer [46]. The last two features distinguish the speciesfrom the other plexaurids. For both P. homomalla and P.nina the leaf clubs and spindles are smaller (150 μm and700 μm, respectively), spindles are also more slender andcalyces usually exerted in P. nina (Bayer 1961). Contraryto P. homomalla, colonies of E. flexuosa in the field usuallytend to be branched in one plane but not in a net-likeshape with calyces as a lower lip. All colonies sampled atdifferent depths and reefs fell within the original descrip-tion of Eunicea flexuosa (sensu Bayer 1961, modified byGrajales et al. 2007). None of the colonies exhibitedprominent and well developed calyces, typical of otherEunicea species.
Page 13 of 19(page number not for citation purposes)

BMC Evolutionary Biology 2008, 8:47 http://www.biomedcentral.com/1471-2148/8/47
The EnvironmentThe study was carried out in La Parguera southwest PuertoRico (Table 6) during September 2004 to August 2006.The hydrography of the area has been studied anddescribed elsewhere [93]. Reefs off La Parguera areexposed to wave action, generated by the easterly tradewinds. The shallow (< 10 m) benthic community is visu-ally dominated by octocorals, forming colourful gardens,especially in shallow reef platforms with high watermotion and wave energy. The current abundance of gor-gonians may have been enhanced by the die off of the her-bivorous sea urchin Diadema antillarum [62]. La Parguerais composed by three prominent reef formations, locatedparallel to the shoreline: 1) inshore reefs which are moreprotected to waves and currents, but subjected to highersedimentation rates, direct contact with sewage dischargesand lower scleractinian cover, 2) mid reefs and 3) outerreefs which are fully exposed to wave energy, with highercoral cover and significant bottom relief.
Gorgonian colonies were sampled in seven reefs for mor-phological measurements (Table 6). Three inshore, pro-tected reefs (Conservas, Pelotas and Romeo); two mid-shelf reefs exposed to wave action (Media Luna and Tur-rumote) and two outer-shelf reefs (El Hoyo and Wein-berg) were included. In each site, morphologicalvariability of E. flexuosa was assessed at two depths (shal-low < 5 m and deep > 17 m), except in the outer reefs ElHoyo and Weinberg, which are at depth 23–27 m. There-fore, in most reefs there are two depths, except the outerreefs. In each location, 15 colonies were sampled (n = 30/reef).
Natural Variability of Morphological TraitsThree macro-morphological traits: colony height (CH),branch thickness (BT) and branch development (BD)
were measured in 180 colonies, representing fifteen colo-nies per location (7 reefs per 2 depths, except El Hoyo andWeinberg which represent deep habitats). Branch devel-opment was assessed as the total number of terminalbranches (Fig. 7b) and the average length of 10 haphaz-ardly chosen branches from branch tip to the first node interminal branches (Fig. 7b).
Nine microscopic characters from the same 180 colonieswere measured at 2 cm off the tip to avoid measuringunderdeveloped sclerites because new tissue is generatedat the tips and contains higher number of smaller sclerites,especially in the spindle width and length [94]. Two cmoff the branch tip was far enough to avoid smaller, under-developed sclerites, but within the range in which the newtissue would be generated under the novel environmentalconditions during the reciprocal transplant experiment.Polyp density (PD), calice diameter (CD), inter-calice dis-tance (ID) and width and length of external clubs (CWand CL) mid-layer spindles (SW and SL) and axial sheathcapstans (CAW and CAL) were selected for the analysis(Fig. 7). Polyp density was estimated by counting thenumber of polyps/cm2 and standardized with branchthickness, assuming cylindrical shape of the branches. Inthese micro-morphological traits, 20 measurements(except polyp density) were performed in randomlyselected calices in CD and ID or sclerites in CW, CL, SW,SL, CAW and CAL; representing 300 measurements perdepth, 600 per reef, 3,600 per character and 28,800 intotal, excluding polyp density measures. Octocoralbranches were collected by clipping off a 5 cm section atthe branch tip, slightly bleached with Clorox (5%) toremove some tissue, rinsed in distilled water, and dried.The slight bleaching kept the colony shape intact, avoid-ing colony dissolution while allowing clear observationsof the calices. For sclerite analysis 1 cm section at 2 cm
Table 6: Relative differences in environmental characteristics of the sampling locations.
Locations Coordinates Zone Depth (m) Depth Water Flow (cm/s)
Sedimentation rates (g/day)
Pelotas 17°57.442 N – 67°04.176 W Inner 3 PS 4 0.28 (0.18)17 PD 9.3 0.11 (0.05)
Conservas 17°57.336 N – 67°02.569 W 3 CS 5.6 *17 CD 9.5 *
Romero 17°56.249 N – 66°59.443W 3 RS > 19.5 0.86 (0.69)18 RD < 13.5 0.34 (0.25)
Turrumote 17°56.097 N – 67°01.130 W Mid 3 TS > 25.5 0.46 (0.21)17 TD <14.0 0.15 (0.11)
Media Luna 17°56.093 N – 67°02.931 W 3 MS > 25.5 0.32 (0.3)20 MD < 14.3 0.15 (0.14)
El Hoyo 17°52.559 N – 67°02.619 W Outer 22 H >23.3 0.09 (0.11)Weinberg 17°53.429 N – 66°59.320 W 23 W >23.3 0.04 (0.03)
Estimations on water flow were taken from McGehee [113]; standard deviations for the data were not available. Sedimentation rates are reported as mean values ± standard deviation (Coral Reef Ecosystem Studies Project, unpublished data). * Represents not available data for that reef, however the sedimentation patterns are similar to those in Pelotas.
Page 14 of 19(page number not for citation purposes)

BMC Evolutionary Biology 2008, 8:47 http://www.biomedcentral.com/1471-2148/8/47
from the tip was collected and dissolved with Clorox(5%), following Bayer's protocol [46]. For clubs and cap-stans the samples were taken by placing the spicules inslides and random samples were obtained by movingblindly the slide and measuring all sclerites in each newvisual field until 20 sclerites were measured. Spindle, cal-ice and polyp were analyzed by photographing the char-acters with an Olympus BX-51 compound microscope. Allmeasurements were carried out using photographs (cali-brated with a slide of 10 μm accuracy) taken with anOlympus C-5050 camera system attached to an Olympus
SZH-10 stereo microscope. Analysis of the photos wasperformed using SigmaScan (SPSS Inc.).
The extent of variation among habitats (i.e., PS, PD) inmorphological traits (14) was analyzed by individualOne-way ANOVAs. Principal component analysis (PCA)was applied to test the association of the traits and visuallyexamine overall trends, the analysis was done with bothraw and standardized (in a 0 to 1 scale) data. The PCAscores of the first three principal components were used totest for differences among groups and factor interactions
Phenotypic traits measured in E. flexuosaFigure 7Phenotypic traits measured in E. flexuosa. a) colony height (CH); b) average length of terminal branches (TBL) and number of terminal branches (TBN); c) branch thickness (BT); d) calice diameter (CD) and intercalice distance (ID) and e) length and width of capstans (CAL and CAW), clubs (CL and CW) and spindles (SL and SW). Surface area (SA) and polyp density (PD) were measured in 1 linear cm.
TBLTBLTBL TBLTBLTBL
15cm15cm
BT
2mm
BT
2mm
a)
b)
c)
d) e)
500μm
TBLTBLTBL TBLTBLTBL
15cm15cm
BT
2mm
BT
2mm
a)
b)
c)
d) e)
500μm
Page 15 of 19(page number not for citation purposes)

BMC Evolutionary Biology 2008, 8:47 http://www.biomedcentral.com/1471-2148/8/47
in a two-way ANOVA. The two factors were degree of pro-tection (zone) and depth (< 5 m and < 17 m). Reefs werenested within zones and depth was factorial with reefs.Kolmogorov-Smirnov and Levene's test were used to testfor normality and homogeneity of variance, respectively[95]. Discriminant function analysis (DFA) of 14 mor-phological characters (CH, BT, BD, PD, CD, ID, CW, CL,SW, SL, CAW and CAL, Fig. 7) was used to explore if colo-nies could be assigned independently to one of the tworesulting morphotypes and replicate the same predeter-mined groups in the sampled populations (i.e., innerzone, mid zone, shallow and deep). Wilk's λ was used inthe DFA to test for multivariate differences among groups[96]. Individual DFA's were employed for depth, locationand zone.
Transplant ExperimentIf reciprocally transplanted colonies become similar insclerite size to the neighbouring colonies, the environ-ment is likely to have an effect on the phenotype. As gor-gonian growth is slow (< 3 cm a year; Yoshioka unpub.data) only sclerite related traits were evaluated. We exam-ined the subapical parts of branches of transplanted gor-gonians because this is where new spicules and skeletonmaterial are generated. By avoiding the sampling of tipsno underdeveloped sclerites were counted [94].
To test for eco-phenotypic responses of the species to dif-ferent depth habitats, thirty branches (< 30 cm) of differ-ent colonies separated by >10 m from each other, fromeach depth were reciprocally transplanted in Media Lunareef. Additionally, 15 branches from each of the twodepths were auto-transplanted (transplanted to the samedepth) to serve as controls. In each depth, 45 brancheswere transplanted per depth. Fifteen of them were resi-dents and 30 were introduced from either the shallow orthe deep habitat, for a total of 90 colonies in the experi-ment. Each branch was glued into a short piece of plasticPVC pipe with marine hydraulic cement. The cement didnot affect the octocoral growth, as live tissue quickly over-grew the dried cement; the same material has been suc-cessfully used in restoration of gorgonian populations(Yoshioka et al. unpub. data). Each of the plastic pipeswas attached to a 1.5 × 1 m cement panel. Fifteenbranches were randomly assigned in each cement panel(allowing enough distance to avoid conspecific aggres-sions) and three panels were placed per depth (45 colo-nies per depth) separated by 5 m from each other. Eachbranch was assigned a code and individually tagged onthe panels. The same code was also used for genetic anal-ysis. The experiments were monitored every month toremove fouling organisms and sediment from the panels.Three times during the 15 months of the study (once everyfive months) surveys were carried out and linear growthand survivorship recorded. As the transplanted colonies
were introduced to the novel habitat, the survivorship andlinear growth were used to evaluate the overall colonyresponse in each treatment. Linear growth was measuredfrom base to tip of the colony and survivorship wasrecorded as live or dead. Branch thickness and polyp den-sity could also reflect phenotypic plasticity but theseparameters were not measured because detectable varia-tion requires a longer experimental time due to the slowgrowth (~3 cm y-1) of E. flexuosa.
Linear growth of the transplanted colonies was assessedby subtracting the initial length from the final length. Atwo-way ANOVA was performed to test for differences inpopulation (colonies from shallow and deep areas) anddepth (colonies grew in shallow and deep environments)and their interactions. Both factors were considered fixedeffects. Chi-square analysis on the number of dead colo-nies was used to test for survivorship independenceamong groups. To check for environmental effects on thegroups, morphological trends were visually examined bygraphing the reaction norm through time per group pertrait. Repetitive measurement ANOVAs were used to testthe effect of population and time and their interaction.ANOVA assumptions were evaluated as previouslydescribed. All statistical analyses were performed in JMPver 5.0.1, InfoStat ver. 2004, and SigmaStat.
Genetic AnalysisPortions of msh1 and the 18S genes were sequenced to testfor genetic differentiation among populations of E. flexu-osa living in different depths and reefs (Media Luna,Romero and Isla Culebra) in Puerto Rico. Msh1 is a mito-chondrial gene unique to octocorals that codes for a DNAmismatch repair protein and is not present in other Cni-daria [97]. Msh1 and the nuclear 18S provide enough res-olution to discriminate between closely related species ofoctocorals [63,64]. Segments of msh1 and 18S genes of alltransplanted colonies in the eco-phenotypic experimentwere examined, 90 colonies in total (45 individuals foreach depth habitat). Additional samples from Romeroand Culebra were included in the analysis to test thereproducibility of the preliminary results found in MediaLuna. Thirty one colonies from Romero and 21 coloniesfrom Culebra were included for the msh1 analysis. Thirtytwo colonies from Romero and 21 from Culebra wereincluded for the 18S analysis. A 3 to 5 cm colony fragmentwas brought to the laboratory for immediate DNA extrac-tion or stored in 95% ethanol for subsequent work. ThePureGene DNA isolation kit (Gentra) was used for DNAextraction. The PCR amplifications was performed in anEppendorf MasterCycler with the same cycling conditionsfor both genes, consisted of an initial denaturation at95°C for 3 min, followed by a touch-down routine ofannealing of 10 cycles at 43°C of 45 sec and 25 cycles at48°C of 45 sec; denaturation at 94°C for 45 sec and elon-
Page 16 of 19(page number not for citation purposes)

BMC Evolutionary Biology 2008, 8:47 http://www.biomedcentral.com/1471-2148/8/47
gation at 72°C for 5 min. The primers used to amplify 18S(A18S – 5'-GATCGAACGGTTTAGTGAGG-3' and ITS-4 –5'-TCCTCCGCTTATTGATATGC-3') and msh1 were devel-oped by Takabayashi [98] and France and Hoover [99],respectively. Sequencing reactions were prepared with aDYEnamic ET Terminator Cycle Sequencing Kit (GE) andloaded in a MEGABase 96 lane Sequencer for capillaryelectrophoresis.
DNA sequencing trace files were imported into the Phrap/Phred/Consed programs [100] for base calling, qualityassessment, assembly and visualization. Mutations wereverified in both the forward and reverse direction.Sequences were then aligned in MacClade [101] and com-pared with BLAST to publicly available sequences ofclosely related gorgonians. The haplotype (h) and thenucleotide diversity (π), number of segregating sites (S),the Watterson's estimator (θw) were evaluated accordingto Nei [102] as implemented in DNAsp 4.0 [103].Tajima's D [104] and Fu's Fs [105] were used in ARLE-QUIN [106] to test for deviations from neutrality. A parsi-mony haplotype network was constructed for the msh1sequences using the Templeton et al. [107] algorithm asimplemented in TCS version 1.21 [108]. The parsimonynetwork was constructed with confidence level set at 95%.Analysis of molecular variation [AMOVA, [109]] ofamong reefs, between habitats and between morphotypeswas performed in ARLEQUIN. The AMOVAs were per-formed with 10,000 permutations by using conventionalF-statistics with haplotype frequencies.
Gene genealogies were constructed for msh1 and 18Susing the maximum likelihood (ML) method in PAUP*[110]. Hierarchical likelihood ratio tests in MODELTEST3.6 [111] suggested that the HKY [112] and JC modelswere the best substitution models for msh1 and 18S,respectively. For the heuristic searches in ML, data werebootstrapped 100 times, and sequences were added ran-domly ten times. Phylogenetic relationships were alsoconstructed using neighbor-joining and maximum parsi-mony with 1000 bootstrap replicates as implemented inPAUP*. Given the uncertain phylogenetic position of E.flexuosa and its conspecifics [64], several outgroups wereused, including P. homomalla, Muricea muricata and Euni-cea spp. Regardless the outgroup, identical topologieswere obtained. All sequences have been deposited inGenBank (Accession numbers EF659469-EF659598 andEF659599- EF659741)
Authors' contributionsCP conceived the project, collected the data, carried outthe analyses and wrote the manuscript. PY and NVSadvised on analyses, NVS provided samples and lab mate-rials. PY and NVS participated in discussions. All authorsread and approved the final manuscript.
AcknowledgementsWe thank Ernesto Weil, Aldo Croquer, Joe Staton, Raul Machiavelli, Her-nan Torres-Pratts and two anonymous reviewers for their comments. Alex Mercado, Diana Beltrán, and Elizabeth McLean helped in the field. Prada thanks Cielo Montoya for her unconditional support. This work was pre-sented as partial fulfilment of the requirements for Prada's Masters Thesis at the Department of Marine Sciences of UPRM. Funds for this project came from Sigma Xi research-in-aid grant (G200610111157185072) and Sea Grant Seed Money awarded to Prada and Schizas, a "Restoration of Gorgonian populations" Grant (535480) from the Sea Grant program of the UPRM, and the Coral Reef Ecosystem Studies from NOAA to Yoshioka and a Caribbean Coral Reef Institute grant awarded to Schizas. SEMs were made possible through the help of José Almodovar. DNA sequencing was performed in the Sequencing and Genotyping facility, University of Puerto Rico-Río Piedras which is supported in part by NCRR AABRE Grant (P20 RR16470), NIH-SCORE Grant (S06GM08102), University of Puerto Rico Biology Department, NSFCREST Grant (0206200).
References1. Pigliucci M: Evolution of phenotypic plasticity: where are we
going now? Trends Ecol Evol 2005, 20(9):481-486.2. Futuyma DJ: Evolutionary Biology. Sunderland, MA. , Sinauer;
1998. 3. Schlichting CD: The evolution of phenotypic plasticity in
plants. Annu Rev Ecol Syst 1986, 17:667-693.4. Fowler-Walker MJ, Wernberg T, Connell SD: Differences in kelp
morphology between wave sheltered and exposed localities:morphologically plastic or fixed traits? Mar Biol 2006,148:755-767.
5. Palumbi SR: Tactics of acclimation: morphological changes ofsponges in an unpredictable environment. Science 1984,225:1478-1480.
6. Marchinko KB: Dramatic phenotypic plasticity in barnacle legs(Balanus glandula Darwin): Magnitude, age-dependence andspeed of response. Evolution 2003, 57:1281-1290.
7. Trussell GC: Phenotypic plasticity in an intertidal snail: therole of a common crab predator. Evolution 1996, 50:448-454.
8. Vermeij GJ: Phenotypic evolution in a poorly dispersing snailafter arrival of a predator. Nature 1982, 299:349-350.
9. Yoshioka PM: Predator-Induced Polymorphism in the Bryo-zoan Membranipora membranacea. J Exp Mar Biol Ecol 1982,61:233-242.
10. Bruno JF, Edmunds PJ: Clonal variation for phenotypic plasticityin the coral Madracis mirabilis. Ecology 1997, 78:2177-2190.
11. Gleason DF: The adaptive significance of morphological plas-ticity in the reef coral Porites astreoides. Am Zool 1992,32:92D.
12. Kim E, Lasker HR, Coffroth MA, Kim K: Morphological andgenetic variation across reef habitats in a broadcast-spawn-ing octocoral. Hydrobiologia 2004, 530/531:423–432.
13. Takabayashi M, Hoegh-Guldberg O: Ecological and physiologicaldifferences between two colour morphs of the coral Pocillo-pora damicornis. Mar Biol 1995, 123:705-714.
14. West JM, Harvell CD, Walls AM: Morphological plasticity in agorgonian coral (Briareum asbestinum) over a depth cline.Mar Ecol Prog Ser 1993, 94:61-69.
15. Willis BL, Ayre DJ: Asexual reproduction and genetic determi-nation of growth form in the coral Pavona cactus: biochem-ical genetic and immunogenetic evidence. Oecologia 1985,65:516-525.
16. Grajales A, Aguilar C, Sánchez JA: Phylogenetic reconstructionusing secondary structures of Internal Transcribed Spacer 2(ITS2, rDNA): finding the molecular and morphological gapin Caribbean gorgonian corals. BMC Evolutionary Biology 2007,7:90.
17. Doebeli M, Dieckmann U: Speciation along environmental gra-dients. Nature 2003, 421:259-264.
18. Hilbish TJ: Demographic and temporal structure of an allelefrequency cline in the mussel Mytilus edulis. Mar Biol 1985,86:163-171.
19. Doebeli M, Dieckmann U, Metz JAJ, Tautz D: What we have alsolearned: adaptive speciation is theoretically plausible. Evolu-tion 2005, 59:691-695.
Page 17 of 19(page number not for citation purposes)

BMC Evolutionary Biology 2008, 8:47 http://www.biomedcentral.com/1471-2148/8/47
20. Grosberg RK, Cunningham CW: Genetic structure in the sea:from populations to communities. In Marine Community EcologyEdited by: M. D. Bertness, S. Gaines, Hay ME. Sunderland, MA , Sin-auer; 2001:61-84.
21. McFadden CS, R. K. Grosberg, B. B. Cameron, D. P. Karlton, D.Secord: Genetic relationships within and between solitaryand clonal forms of the sea anemone Anthopleura elegan-tissima revisited: Evidence for the existence of two species.Mar Biol 1997, 128:127-139.
22. Lessios HA, Robertson DR: Crossing the impassable: geneticconnections in 20 reef fishes across the Eastern Pacific Bar-rier. Proc R Soc Lond B 2006, 273:2201-2208.
23. Knowlton N, Mills DEK: The systematic importance of colorand color Pattern: Evidence for complex of sibling species ofsnapping shrimp (Caridea: Alpheidae: Alpheus) from theCaribbean and pacific coasts of Panama. Proc San Diego Soc NatHist 1992, 18:1-5.
24. Barber PH, S. R. Palumbi, M. V. Erdmann, Moosa MK: Sharp geneticbreaks among populations of Haptosquilla pulchella (Sto-matopoda) indicate limits to larval transport: patterns,causes, and consequences. 2002, 11:659-674.
25. Jiggins CD, Mallet J: Bimodal hybrid zones and speciation.Trends Ecol Evol 2000, 15:250-255.
26. Knowlton N, Weil E, Weigt LA, Guzman HM: Sibling species inMontastraea annularis, coral bleaching, and the coral cli-mate record. Science 1992, 255:330 333.
27. Weil E, Knowlton N: A multi-character analysis of the Carib-bean coral Montastraea annularis (Ellis and Solander, 1786)and its two sibling species, M. faveolata (Ellis and Solander,1786) and M. franksi (Gregory, 1895). Bull Mar Sci 1994,55:151-175.
28. Palumbi SR, Metz E: Strong reproductive isolation in closelyrelated tropical sea urchins (genus Echinometra). Mol Biol Evol1991, 8:227-239.
29. Brazeau DA, Harvell CD: Genetic structure of local populationsand divergence between growth forms in a clonal inverte-brate, the Caribbean octocoral Briareum asbestinum. MarBiol 1994, 119:53-60.
30. Carlon DB, Budd AF: Incipient speciation across a depth gradi-ent in a scleractinian coral? Evolution 2002, 56:2227-2242.
31. Duffy JE: Species boundaries, specialization, and the radiationof sponge-dwelling alpheid shrimp. Biol J Linn Soc 1996,58:307-324.
32. Knowlton N, Jackson JBC: New taxonomy and niche partition-ing on coral reefs: Jack of all trades or master of some? TrendsEcol Evol 1994, 9:7-9.
33. Santos SR, T.L. Shearer, A.R. Hannes, Coffroth. MA: Fine-scalediversity and specificity in the most prevalent lineage of sym-biotic dinoflagellates (Symbiodinium, Dinophyceae) of theCaribbean. Mol Ecol 2004, 13:459-469.
34. Knowlton N, Mate JL, Guzman HM, Rowan R, Jara J: Direct evi-dence for reproductive isolation among the three species ofthe Montastraea annularis complex in Central America(Panama and Honduras). Mar Biol 1997, 127:705-711.
35. Lessios HA: Possible prezygotic reproductive isolation in seaurchins separated by the Isthmus of Panama. Evolution 1984,35:1144-1148.
36. Levitan DR, Fukami H, Jara J, Kline D, McGovern TA, McGhee KM,Swanson CA, Knowlton N: Mechanisms of reproductive isola-tion among sympatric broadcast-spawning corals of theMontastraea annularis complex. Evolution 2004, 58:308-323.
37. Hellberg ME, Moy GW, Vacquier VD: Positive selection andpropeptide repeats promote rapid Interspecific divergenceof a gastropod sperm protein. Mol Biol Evol 2000, 17(3):458-466.
38. Palumbi SR: Species formation and the evolution of gameterecognition loci. In Endless Forms: Species and Speciation Edited by:Howard DJ, Berlocher SH. NY , Oxford Univ. Press; 1998:271-278.
39. Vacquier VD, Swanson WJ, Lee YH: Positive Darwinian selectionon two homologous fertilization proteins: what is the selec-tive pressure driving their divergence? J Mol Evol 1997,44:15-22.
40. Knowlton N: Sibling species in the sea. Annu Rev Ecol Syst 1993,24:189-216.
41. Arnold ML: Natural Hybridization and Evolution. In OxfordSeries in Ecology and Evolution New York , Oxford Univ. Press; 1997.
42. Rieseberg LH, Fossen CV, Desrochers AM: Hybrid speciationaccompanied by genomic reorganization in wild compara-tive mapping between Arabidopsis sunflowers. Nature 1995,375:313-316.
43. Veron JEN: Corals in space and time. Sydney. Sydney , Univ. ofNew South Wales Press; 1995:321.
44. Kim K, Lasker HR: Flow-mediated competition among suspen-sion feeding gorgonians. J Exp Mar Biol Ecol 1997, 215:49-64.
45. Skoufas G: Comparative biometry of Eunicella singularis (gor-gonian) sclerites at East Mediterranean Sea (North AegeanSea, Greece) . Mar Biol 2006, 149:1365-1370.
46. Bayer FM: The Shallow-Water Octocorallia of the WestIndian Region. A Manual for marine biologists. The Hague ,Martinus Nijhoff; 1961:373 pp.
47. West JM: Plasticity in the sclerites of a gorgonian coral: Testsof water motion, light level, and damage cues. Biol Bull 1997,192:279-289.
48. Kinzie RA: The zonation of West Indian gorgonians. Bul Mar Sci1973, 23:93-155.
49. Yoshioka PM, Yoshioka BB: Effects of water motion, topo-graphic relief and sediment transport on the distribution ofshallow-water gorgonian community. Mar Ecol Prog Ser 1989,54:257-264.
50. Kimura M: A simple method for estimating evolutionary ratesof base substitutions through comparative studies of nucle-otide sequences. J Mol Evol 1980, 16:111-120.
51. Pigliucci M: Touchy and bushy: phenotypic plasticity and inte-gration in response to wind stimulation in Arabidopsis thal-iana. Int J Plant Sci 2002, 163:399-408.
52. Okamura BJ, Partridge C: Suspension Feeding Adaptations toExtreme Flow Environments in a Marine Bryozoan. Biol Bull1999, 196:205-215.
53. Callahan H, Pigliucci M: Shade-induced plasticity and its ecolog-ical significance in wild populations of Arabidopsis thaliana.Ecology 2002, 83:1965-1980.
54. Monro K, Poore AGB: Light quantity and quality induce shade-avoiding plasticity in a marine macroalga. J Evol Biol 2005 , 18:426-435.
55. Graus RR, Macintyre. IG: Light control of growth forms in colo-nial reef corals: computer simulation. Science 1976,193:895-897.
56. Grigg RW: Orientation and growth form of sea fans. Limn Oce-anogr 1972, 17:185-192.
57. Lesser MP, Weis VM, Patterson MP, Jokiel PL: Effects of morphol-ogy and water motion on carbon delivery and productivity inthe reef coral, Pocillopora damicornis (Linnaeus): diffusionbarriers, inorganic carbon limitation, and biochemical plas-ticity. J Exp Mar Biol Ecol 1994, 178:153-179.
58. Sebens KP, Witting J, Helmuth B: Effects of water flow andbranch spacing on particle capture by the reef coral Madra-cis mirabilis (Duchassaing and Michelotti). J Exp Mar Biol Ecol1997, 211:1-28.
59. Meroz E, Brickner I, Loya Y, Peretzman-Shemer A, Ilan M: The effectof gravity on coral morphology. Proc R Soc Lond B 2002,269:717-720.
60. Stambler N, Dubinsky Z: Corals as light collectors: an integrat-ing sphere approach. Coral Reefs 2005, 24:1-9.
61. de Kroon H, H.Huber, J.F.Stuefer, van Groenendael JM: A modularconcept of phenotypic plasticity in plants. New Phytologist 2005,166:73-82.
62. Yoshioka PM, Yoshioka BB: A comparison of the survivorshipand growth of shallow-water gorgonian species of PuertoRico. Mar Ecol Prog Ser 1991, 69:253-260.
63. McFadden CS, France SC, Sánchez JA, Alderslade P: A molecularphylogenetic analysis of the Octocorallia (Cnidaria: Antho-zoa) based on mitochondrial protein-coding sequences. MolPhyl Evol 2006, 41:513-527.
64. Sanchez JA, McFadden CS, France SC, Lasker HR: Molecular phylo-genetic analyses of shallow-water Caribbean octocorals. MarBiol 2003, 142:975-987.
65. Hellberg ME: Dependence of gene flow on geographic distancein two solitary corals with different larval dispersal capabili-ties. Evolution 1996, 50:1167-1175.
66. Avise JC: Molecular Markers, Natural History and Evolution.2nd edition. Sunderland MA , Sinauer; 2004:684 p.
Page 18 of 19(page number not for citation purposes)

BMC Evolutionary Biology 2008, 8:47 http://www.biomedcentral.com/1471-2148/8/47
67. Mayr E: Systematics and the Origin of Species. New York ,Columbia Univ. Press; 1942.
68. Baums IB, Miller MW, Hellberg ME: Regionally isolated popula-tions of an imperiled Caribbean coral, Acropora palmata.Molecular Ecology 2005, 14:1377-1390.
69. Gutiérrez-Rodríguez C, Lasker HR: Microsatellite variationreveals high levels of genetic variability and population struc-ture in the gorgonian coral Pseudopterogorgia elisabethaeacross the Bahamas. Mol Ecol 2004, 13:2211-2221.
70. Taylor MS, Hellberg ME: Marine radiations at small geographicscales: speciation in Neotropical reef gobies (Elacatinus).Evolution 2005, 59:374-385.
71. Vollmer SV, Palumbi SR: Restricted gene flow in the Caribbeanstaghorn coral Acropora cervicornis: Implications for therecovery of endangered reefs. J Heredity 2007, 98:40-50.
72. Briggs JC: Operation of zoogeographic barriers. Syst Zool 1973,23:248-256.
73. Shulman MJ, Bermingham E: Early life histories, ocean currents,and the population genetics of Caribbean reef fishes. Evolution1995, 49:897-910.
74. Zardus JD, Hadfield MG: Multiple origins and incursions of theAtlantic barnacle Chthamalus proteus in the Pacific. Mol Ecol2005, 14(12):3719–3733.
75. Palumbi SR: Marine speciation on a small planet. Trends Ecol Evol1992, 7:114-117.
76. Diekmann OE, Olsen JL, Stam WT, Bak RPM: Genetic variationwithin Symbiodinium clade B from the coral genus Madracis inthe Caribbean (Netherlands Antilles). Coral Reefs 2003, 22:29-33.
77. Rowan R, Knowlton N: Intraspecific diversity and ecologicalzonation in coral-algal symbiosis. Proc Natl Acad Sci 1995,92:2850-2853.
78. Rieseberg LH, Carter R, Zona S: Molecular tests of the hypothe-sized hybrid origin of two diploid Helianthus species (Aster-aceae). Evolution 1990, 44:1498-1511.
79. Pyle RL, Randall JE: A review of hybridization in marine angel-fishes (Perciformes: Pomacanthidae) . Environ Biol Fishes 1994,41:127-145.
80. Schelly R, Salzburger W, Koblmuller S, Duftner N, Sturmbauer C:Phylogenetic relationships of the lamprologine cichlid genusLepidiolamprologus (Teleostei: Perciformes) based on mito-chondrial and nuclear sequences, suggesting introgressivehybridization. Mol Phyl Evol 2006, 38:426-438.
81. Gilg MR, Hilbish TJ: Patterns of larval dispersal and their effecton the maintenance of a blue mussel hybrid zone in South-west England. Evolution 2003, 57:1061-1077.
82. Hatta M, Fukami H, Wang WQ, Omori M, Shimoike K, HayashibaraT, Ina Y, Sugiyama T: Reproductive and genetic evidence for areticulate evolutionary history of mass-spawning corals. MolBiol Evol 1999, 16:1607-1613.
83. van Oppen MJH, Willis BL, van Vugt HWJA, Miller DJ: Examinationof species boundaries in the Acropora cervicornis group(Scleractinia, Cnidaria) using nuclear DNA sequence analy-ses. Mol Ecol 2000, 9:1363-1373.
84. Vollmer SV, Palumbi SR: Hybridization and the evolution of reefcoral diversity. Science 2002, 296:2023-2025.
85. Kenyon JC: Models of reticulate evolution in the coral genusAcropora based on chromosome numbers: parallels withplants. Evolution 1997, 51:756-767.
86. Willis BL, van Oppen MJH, Miller DJ, V. VS, Ayre DJ: The role ofhybridization in the evolution of reef corals. Annu Rev Ecol Syst2006, 37:489-517.
87. Burke JM, Rieseberg LH: The fitness effects of transgenic dis-ease resistance in wild sunflowers. Science 2003, 300:1250.
88. Gompert Z, Fordyce JA, Forister ML, Shapiro AM, Nice CC: Homo-ploid hybrid speciation in an extreme habitat. Science 2006,314:1923-1925.
89. Sánchez JA, Aguilar C, Dorado D, Manrique N: Phenotypic plastic-ity and morphological integration in a marine modular inver-tebrate. BMC Evolutionary Biology 2007, 7:122.
90. Lasker HR, Coffroth MA: Octocoral distribution at Carrie BowCay, Belize. Mar Ecol Prog Ser 1983, 13:21-28.
91. Beiring EA, Lasker HR: Egg production by colonies of a gorgo-nian coral. Mar Ecol Prog Ser 2000, 196:169-177.
92. Lasker HR: Asexual reproduction, fragmentation, and skeletalmorphology of a plexaurid gorgonian. Mar Ecol Prog Ser 1984,19:261-268.
93. Garcia JR, Schmitt C, Heberer G, Winter A: La Parguera PuertoRico UNESCO. In CARICOMP- Caribbean coral reef, sea grass andmangrove sites Paris , UNESCO; 1998:347.
94. Prada C: Phenotypic and genetic variability in the octocoralPlexaura flexuosa. Master's thesis. In Department of Marine SciencesVolume M.S.. Puerto Rico , University of Puerto Rico, Mayaguez. ; 2007.
95. Sokal RR, Rohlf FJ: Biometry. 3rd ed. New York , W. H. and Free-man; 1995.
96. Quinn GP, Keough MJ: Experimental design and data analysisfor biologists. Cambridge, UK , Cambridge Univ. Press; 2002.
97. Pont-Kingdon GA, Okada NA, Macfarlane JL, Beagley CT, Wolsten-holme DR, Cavalier-Smith T, Clark-Walker GD: A coral mitochon-drial mutS gene. Nature 1995, 375:109-111.
98. Takabayashi M, Carter DA, Loh WKW, Hoegh-Guldberg O: A coralspecific primer for PCR amplification of the internal tran-scribed spacer region in ribosomal DNA. Mol Ecol 1998,7:925-931.
99. France SC, Hoover LL: Analysis of variation in mitochondrialDNA sequences (ND3, ND4L, MSH) among Octocorallia(=Alcyonaria) (Cnidaria: Anthozoa). Bull Biol Soc Wash 2001,10:110-118.
100. Gordon D: Viewing and editing assembled sequences usingconsed. In Current Protocols in Bioinformatics Edited by: Baxevanis ADDDB. New York , John Wiley & Co; 2004:11.12.11-11.12.43.
101. Maddison WP, Maddison DR: MacClade version 3: Analysis ofphylogeny and character evolution. (book) + 900K (compu-ter program). Sunderland MA , Sinauer; 1992:398 pp.
102. Nei M: Molecular evolutionary genetics. New York , ColumbiaUniv. Press; 1987.
103. Rozas J, Sandez-DelBurrio JC, Messeguer X, Rozas. R: DnaSP: DNApolymorphism analyses by the coalescent and other meth-ods. Bioinformatics 2003, 19:2496-2497.
104. Tajima F: Statistical method for testing the neutral mutationhypothesis by DNA polymorphism. Genetics 1989, 105:437-460.
105. Fu YX: Statistical tests of neutrality of mutations against pop-ulation growth, hitchhiking and background selection. Genet-ics 1997, 147(2):915-925.
106. Schneider S, Roessli D, Excoffier L: ARLEQUIN. A software forpopulation genetic data analysis, Version 2.00. Geneva, Swit-zerland , Genetics and Biometry Laboratory, Department of Anthro-pology, Univ. of Geneva; 2000.
107. Templeton AR, Crandall KA, Sing CF: A cladistic analysis of phe-notypic associations with haplotypes inferred from restric-tion endonuclease mapping and DNA sequence data. III.Cladogram estimation. Genetics 1992, 132: 619-633.
108. Clement M, Posada D, Crandall K: TCS: a computer program toestimate gene genealogies. Mol Ecol 2000, 9(10):1657-1660.
109. Excoffier L, Smouse PE, Quattro JM: Analysis of molecular vari-ance inferred from metric distances among DNA haplo-types: application to human mitochondrial restriction data.Genetics 1992, 131:479-491.
110. Swofford DL: PAUP*: Phylogenetic analysis using parsimony*,version 4.0b10. Sunderland, MA , Sinauer; 2002.
111. Posada D, Crandall KA: Modeltest: testing the model of DNAsubstitution. Bioinformatics 1998, 14:817-818.
112. Hasegawa M, Kishino H, Yano T: Dating of the human-ape split-ting by a molecular clock of mitochondrial DNA. J Mol Evol1985, 22:160-174.
113. McGehee A: Comparisons of water motion in coral reef bymeasuring corrosion rates of dissimilar metals. Carib J Sci1998, 34:286-297.
Page 19 of 19(page number not for citation purposes)