philip la~'1 bound...abstract glass formation in alkali-molybdate and -tungstate systems...
TRANSCRIPT
-,
PHI LIP '~libl.l~aLla~'1I
- - - - - ._.__, ,-'I.
RESEARCH. REPORTS·'SUPPLEMENTS .'
, ., 27 SE P. 1971 - ,
HlllPS RESEARCH LABORATORIESPhilips Res. Repts Suppl. 1971 No.3~Inted In the Netherlands.
/
© N.V, Philips' Gloeilampenfabrieken, Eindhoven, Netherlands, 1971.Articles or illustrations reproduced, in whole or in part, must be
accompanied by full acknowledgement of the- source:PHILlPS RESEARCH REPORTS SUPPLEMENTS
PROPERTIES OF VITREOUS ANDMOLTEN ALKALI MOLYBDATES
AND TUNGSTATES*)
BY
R. G. GOSSINK
*) Thesis, Technological University Eindhoven, June 1971.Promotor: Prof. Dr J. M. Stevels.Copromotor: Prof. Dr G. C. A. Schuit.
Philips Res. Repts. Suppl. 1971, No. 3.
AbstractGlass formation in alkali-molybdate and -tungstate systems(M2Mo04-Mo03 and M2W04-W03, where M = alkali ion) wasfound by previous authors in relatively narrow composition regionsround 50 mole% Mo03 and W03 respectively. Structures for theseglasses have been proposed, which, however, are based on a limitedamount of experimental data. The investigations described in this papertry to approach the structures of these glasses from various points ofview.--" Determination of the temperatures at which crystallisation sets in
when the melt is slowly cooled or the glass slowly heated.- The regions of glass formation were extended by application of the
splat-cooling technique, involving cooling rates of the order of106oC S-1. This permitted an extensive infrared-spectroscopicstudy.
- Determination of densities (by the buoyancy method), surface ten-sions (by the ring method) and viscosities (by the oscillating-hollow-cylinder method) of the molten systems as a function of compositionand temperature, based on the concept that there will be noessential difference between the structures of glass and melt.
Analysis of the results obtained shows that alkali-tungstate glasses con-tain averagely short chains of W04 tetrahedra, which have undergonesignificant disproportionation. Alkali-molybdate glasses also containsmall groups, such as Mo042- monomers, in addition to which, how-ever, larger groups are found, comprising Mo atoms with coordinationnumbers higher than 4. The structures of the glasses essentially differfrom those found in crystalline alkali molybdates and tungstates in theglass-formation regions, which contain infinite-chain-type anions. Bothgroups of glasses have low-viscous melts (1-20 cP). Mixing of eithertwo different alkali species or Mo and W atoms strongly decreases thevalue of the critical cooling rate and, therefore, favours glass formation.
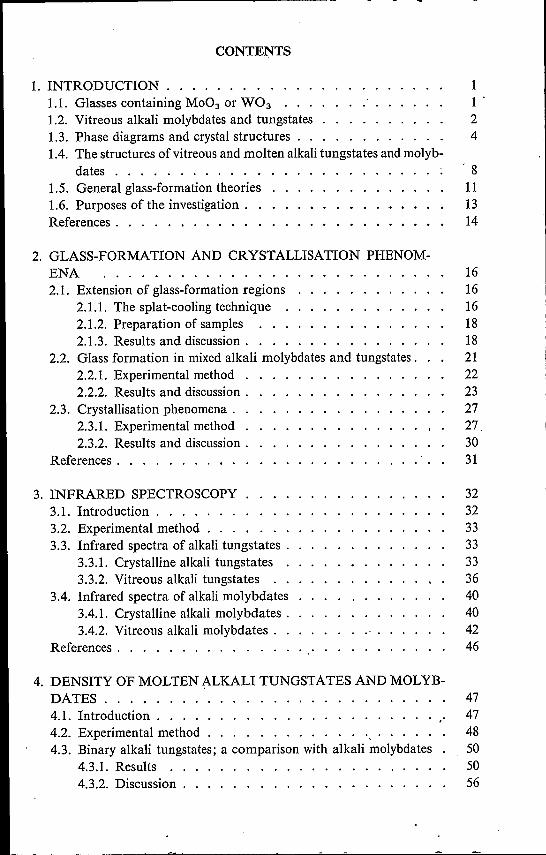
CONTENTS1. INTRODUCTION . . . .
1.1. Glasses containing Mo03 or W03 • • 1 .1.2. Vitreous alkali molybdates and tungstates 21.3. Phase diagrams and crystal structures . . 41.4. The structures ofvitreous and molten alkali tungstates and molyb-
dates . . . . . . . . . . . . ' 81.5. General glass-formation theories 111.6. Purposes of the investigation . 13References. . . . . . . . . . . . 14
2. GLASS-FORMATION AND CRYSTALLISATION PHENOM-ENA2.1. Extension of glass-formation regions
2.1.1. The splat-cooling technique2.1.2. Preparation of samples2.1.3. Results and discussion. . .
2.2. Glass formation in mixed alkali molybdates and tungstates .2.2.1. Experimental method .2.2.2. Results and discussion .
2.3. Crystallisation phenomena. .2.3.1. Experimental method .2.3.2. Results and discussion.
References. . . . . . . . . .
3. INFRARED SPECTROSCOPY3.1. Introduction. . . . . . .3.2. Experimental method . . .3.3. Infrared spectra of alkali tungstates .
3.3.1. Crystalline alkali tungstates .3.3.2. Vitreous alkali tungstates . .
3.4. Infrared spectra of alkali molybdates3.4.1. Crystalline alkali molybdates .3.4.2. Vitreous alkali molybdates .
References. . . . . . . . . . . . . .
4. DENSITY OF MOLTEN ALKALI TUNGSTATES AND MOLYB-DATES .4.1. Introduction. . . . . . . . . . . . . . . . . . . . . . "4.2. Experimental method . . . . . . . . . . . . ',' . . . .4.3. Binary alkali tungstates; a comparison with alkali molybdates
4.3.1. Results . .4.3.2. Discussion . . . . . . . . . . . . . . . . . . . .
1
161616181821222327273031
32323333333640404246
474748505056

4.4. Mixed alkali tungstates and molybdates 604.4.1. Results . . 604.4.2. Discussion . 60
References. . . . . . 64
5. SURFACE TENSION OF MOLTEN ALKALI TUNGSTATESAND MOLYBDATES . 655.1. Introduetion . . . . . . . . . . . . 655.2. Experimental method . . . . . . . . 655.3. Binary alkali tungstates and molybdates 67
5.3.1. Results . . . . . . . . . . . 675.3.2. Discussion. . . . . . . . . . 72
5.4. Mixed alkali tungstates and molybdates 74References. . . . . . . : . . . . . . . 77
6. VISCOSITY OF MOLTEN ALKALI TUNGSTATES AND MO-LYBDATES . . . . . . 786.1. Introduetion . . . . . . . . . . . . . . . . . . . . . .. 786.2. Experimental method . . . . . . . . . . . . . . . . . .. 786.3. Binary alkali tungstates and molybdates; a comparison with elec-
trical-conductivity data 826.3.1. Results . . . . . . . . . . . 826.3.2. Discussion . . . . . . . . . . 91
6.4. Mixed alkali tungstates and molybdates 95References. . . . . . . . . . . . 98
7. CONCLUSIONS AND REMARKS 997.1. The structure of vitreous and molten alkali tungstates and moIyb-
dates . . . . . . . . . . . . . 997.2. Glass formation . . . . . . . . 1027.3. A comparison with similar glasses 1047.4. Final remarks 105References. . . . . . . . . . . . . 105
-:-1-
1. INTRODUCTION
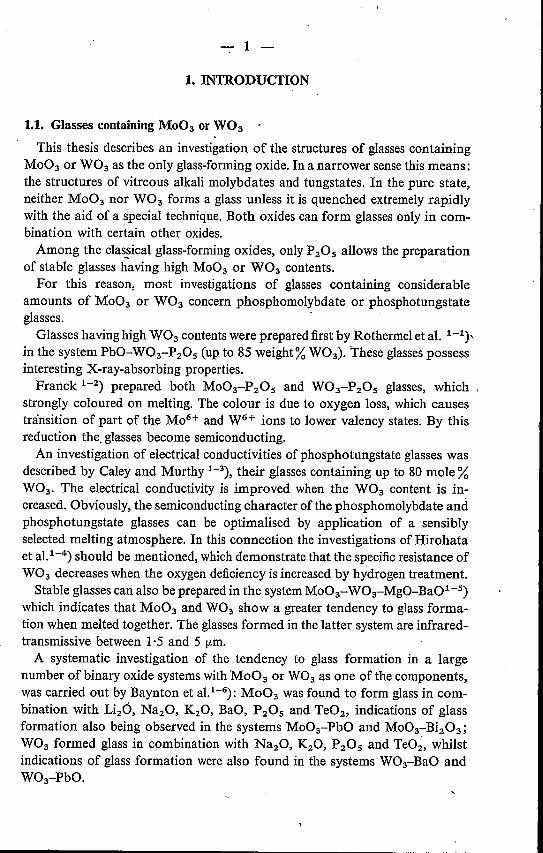
1.1. Glasses containingMo03 or W03This thesis describes an investigation of the structures of glasses containing
Mo03 or W03 as the only glass-forming oxide. In a narrower sense this means:the structures of vitreous alkali molybdates and tungstates. In the pure state,neither Mo03 nor W03 forms a glass unless it is quenched extremely rapidlywith the aid of a special technique. Both oxides can form glasses only in com-bination with certain other oxides.Among the classical glass-forming oxides, only P20s allows the preparation
of stable glasses having high Mo03 or W03 contents.For this reason, most investigations of glasses containing considerable
amounts of Mo03 or W03 concern phosphomolybdate or phosphotungstateglasses.Glasses having high W03 contents were prepared first by Rothermei et al. 1-1),
in the system PbO-W03-P20s (up to 85 weight% W03). These glasses possessinteresting X-ray-absorbing properties.Franck 1-2) prepared both M003-P20S and W03-P20S glasses, which
strongly coloured on melting. The colour is due to oxygen loss, which causestransition of part of the MoH and WH ions to lower valency states. By thisreduction the. glasses become semiconducting.An investigation of electrical conductivities of phosphotungstate glasses was
described by Caley and Murthy 1-3), their glasses containing up to 80 mole %W03. The electrical conductivity is improved when the W03 content is in-creased. Obviously, the semiconducting character ofthe phosphomolybdate andphosphotungstate glasses can be optimalised by application of a sensiblyselected melting atmosphere. In this connection the investigations of Hirohataet a1.1-4)should be mentioned, which demonstrate that the specific resistance ofW03 decreases when the oxygen deficiency is increased by hydrogen treatment.Stable glasses can also be prepared in the system Mo03- W03-MgO-Ba01-S)
which indicates that Mo03 and W03 show a greater tendency to glass forma-tion when melted together. The glasses formed in the latter system are infrared-transmissive between 1·5 and 5 !Lm.A systematic investigation of the tendency to glass formation in a large
number of binary oxide systems with Mo03 or W03 as one of the components,was carried out by Baynton et aI.1-6): Mo03 was found to form glass in com-bination with Li2Ö, Na20, K20, BaO, P20s and Te02' indications of glassformation also being observed in the systems Mo03-PbO and Mo03-:--Bi203;W03 formed glass in combination with Na20, K20, P20s and Te02, whilstindications of glass formation were also found in the systems W03-BaO andW03-PbO.
-2-
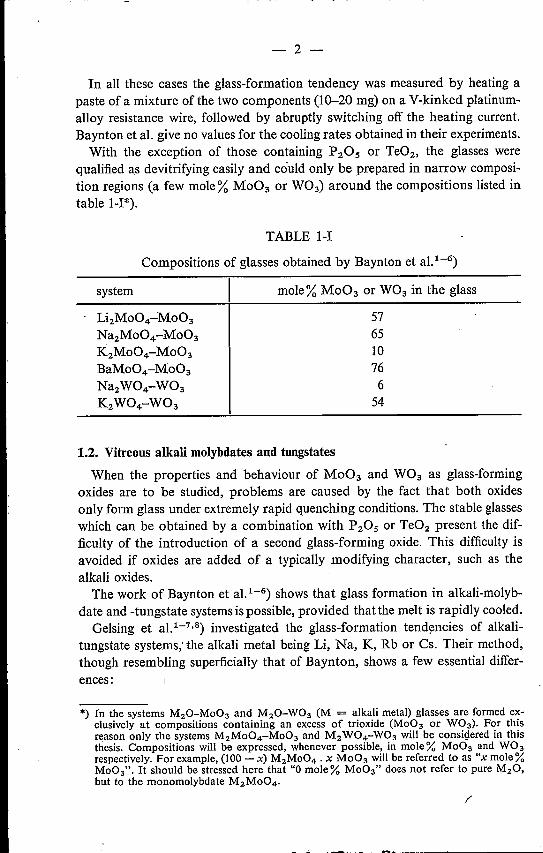
In all these cases the glass-formation tendency was measured by heating apaste of a mixture of the two components (10-20 mg) on a V-kinked platinum-alloy resistance wire, followed by abruptly switching off the heating current.Baynton et al. give no values for the cooling rates obtained in their experiments.
With the exception of those containing P20s or Te02' the glasses werequalified as devitrifying easily and could only be prepared in narrow composi-tion regions (a few mole% Mo03 or W03) around the compositions listed intable l-I*).
TABLE I-I
Compositions of glasses obtained by Baynton et aI.1-6)
system mole% Mo03 or W03 in the glass
Li2Mo04-Mo03Na2Mo04-Mo03K2Mo04-Mo03BaMo04-Mo03Na2W04-W03K2W04-W03
57651076654
1.2. Vitreous alkali molybdates and tnngstates
When the properties and behaviour of Mo03 and W03 as glass-formingoxides are to be studied, problems are caused by the fact that both oxidesonly form glass under extremely rapid quenching conditions. The stable glasseswhich can be obtained by a combination with P20S or Te02 present the dif-ficulty of the introduetion of a second glass-forming oxide. This difficulty isavoided if oxides are added of a typically modifying character, such as thealkali oxides.The work of Baynton et al. 1-6) shows that glass formation in alkali-molyb-
date and -tungstate systems is possible, provided that the melt is rapidly cooled.Gelsing et aI.1-7,8) investigated the glass-formation tendencies of alkali-
tungstate systems; the alkali metal being Li, Na, K, Rb or Cs. Their method,though resembling superficially that of Baynton, shows a few essential differ-ences:
*) In the systems M20-Mo03 and M20-W03 (M = alkali metal) glasses are formed ex-clusively at compositions containing an excess of trioxide (Mo03 or W03). For thisreason only the systems M2Mo04-Mo03 and M2 W04-W03 will be considered in thisthesis. Compositions will be expressed, whenever possible, in mole % Mo03 and W03respectively. For example, (100 - x) M2Mo04 • X Mo03 will be referred to as "x mole%Mo03". It should be stressed here that "0 mole% Mo03" does not refer to pure M20,but to the monomolybdate M2Mo04•
-3-
(a) Gelsing's samples were prepared before being melted on the resistance wire;(b) cooling rates could be varied, and high cooling rates were obtained by
directing a current of air onto the sample;(c) the apparatus used permitted an accurate determination of cooling rates.This experimental method, also applied in our work, will be described in moredetail in chapter 2.
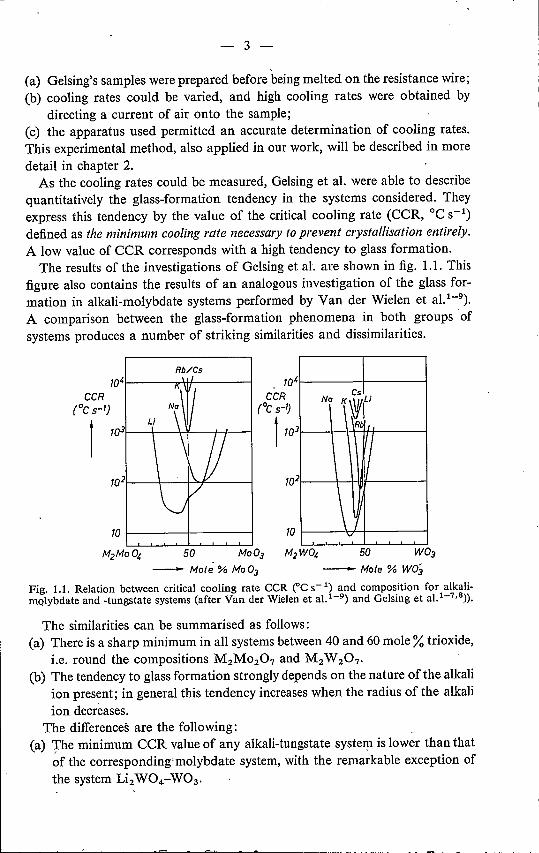
As the cooling rates could be measured, Gelsing et al. were able to describequantitatively the glass-formation tendency in the systems considered. Theyexpress this tendency by the value of the critical cooling rate (eeR, oe S-l)defined as the minimum cooling rate necessary to prevent crystallisation entirely.A low value of eeR corresponds with a high tendency to glass formation.
The results of the investigations of Gelsing et al, are shown in fig. 1.1. Thisfigure also contains the results of an analogous investigation of the glass for-mation in alkali-molybdate systems performed by Van der Wielen et aU-9).A comparison between the glass-formation phenomena in both groups ofsystems produces a number of striking similarities and dissimilarities.
Rb/CsT04
CCR(oC 5-1)
1T03
Icsl_N, KWLi
-\ \Rbll/
~
\~v
T041----rr\-l-l---------lCCR
(oC 5-1)
1 103
50 50
TO 1----11------1
- Mole" % 1'4003 - Mole % WO';
Fig. 1.1. Relation between critical cooling rate CCR eC ç 1) and composition for alkali-molybdate and -tungstate systems (after Van der Wielen et a1.1-9) and Gelsing et a1.1-7•8)).
The similarities can be summarised as follows:(a) There is a sharp minimum in all systems between 40 and 60 mole % trioxide,
i.e. round the compositions M2M0207 and M2W 207'
(b) The tendency to glass formation strongly depends on the nature of the alkaliion present; in general this tendency increases when the radius of the alkaliion decreases.
The differences are the following:(a) The minimum eeR value of any alkali-tungstate system is lower than that
of the corresponding-rnolybdate system, with the remarkable exception ofthe system Li2W04-W03•
-4-
(b) The CCR-composition curves of the tungstate systems are narrower andshow a greater mutual similarity (than those of the molybdate systems.
The overall minimum CCR value reached in these systems is approximately9°C S-l (at the composition 0·62 Na2 W04 . 0·38 W03).
The compositions of the glasses prepared by Baynton et al. (see table I-I)deviate appreciably from the compositions of minimum CCR, found by Gelsinget al. and Van der Wielen et al. This should be attributed to Baynton's prepa-ration method, which may cause serious errors in composition.
In fig. Uit is seen that a cooling rate of 104oe S-l is still insufficient tobring Mo03 or W03 into the vitreous state. Sarjeant and Roy 1-11), however,obtained partly vitreous Mo03 and W03, using the splat-cooling method withcooling rates of 106-107 °C S-l. The latter method will also be describedin chapter 2.
1.3. Phase diagrams and crystal structures
For our investigation, knowledge of the phase diagrams of alkali-molybdateand alkali-tungstate systems, and the crystal structures ofthe compounds foundin these phase diagrams, is indispensable. Therefore, a short survey of theliterature data available will be given. Phase diagrams of alkali-tungstate andalkali-molybdate systems have been reported by a great number of authors.However, the results obtained are often contradictory, owing to the variousexperimental methods applied.
In our opinion the phase diagrams determined by Gelsing et al.l-12),Caillet 1-13), Van der Wielen et aU-9) and Salmon and Caillet 1-14) are themost reliable for reasons of sample-preparing and measuring methods. Theabove-mentioned authors obtained their samples by a slow solid-state reaction.
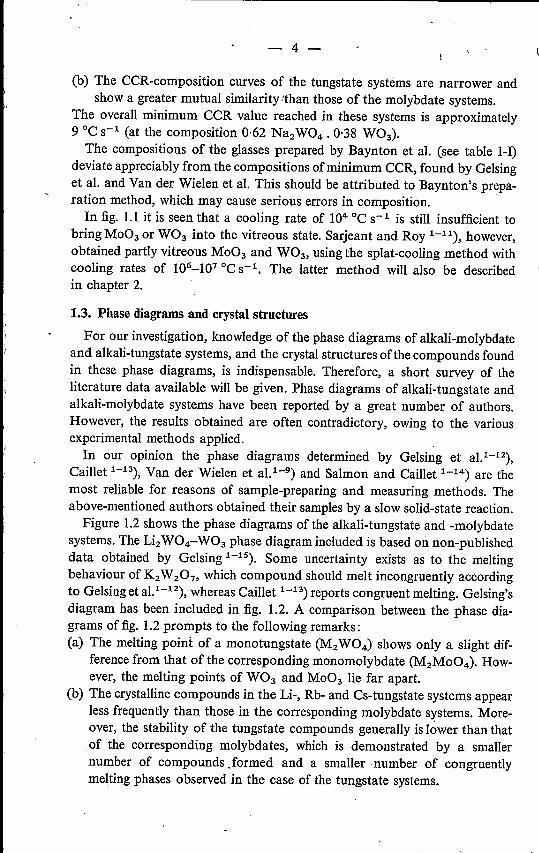
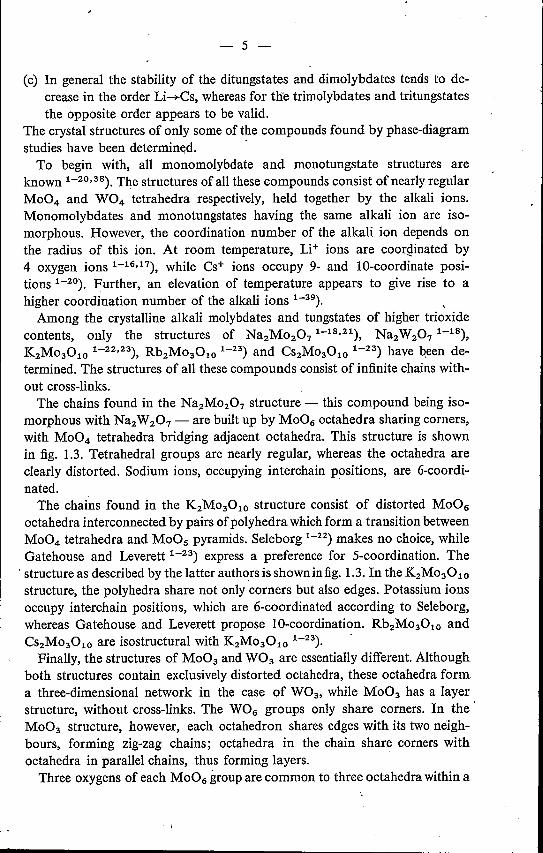
Figure 1.2 shows the phase diagrams of the alkali-tungstate and -molybdatesystems. The Li2W04-W03 phase diagram included is based on non-publisheddata obtained by Gelsing 1-15). Some uncertainty exists as to the meltingbehaviour of K2W207' which compound should melt incongruently accordingto Gelsing et al.l-12), whereas Caillet 1-13) reports congruent melting. Gelsing'sdiagram has been included in fig. 1.2. A comparison between the phase dia-grams of fig. 1.2 prompts to the following remarks:Ca) The melting point of a monotungstate (M2W04) shows only a slight dif-
ference from that of the corresponding monomolybdate (M2Mo04). How-ever, the melting points of W03 and Mo03 lie far apart.
(b) The crystalline compounds in the Li-, Rb- and Cs-tungstate systems appearless frequently than those in the corresponding molybdate systems. More-over, the stability of the tungstate compounds generally is lower than thatof the corresponding molybdates, which is demonstrated by a smallernumber of compounds .formed and a smaller, number of congruentlymelting phases observed in the case of the tungstate systems.
-5-
Cc) In general the stability of the ditungstates and dimolybdates tends to de-crease in the order Li~Cs, whereas for tile trimolybdates and tritungstatesthe opposite order appears to be valid.
The crystal structures of only some of the compounds found by phase-diagramstudies have been determined, .To begin with, all monomolybdate and monotungstate structures are
known 1-20,38).The structures of all these compounds consist of nearly regularMo04 and W04 tetrahedra respectively, held together by the alkali ions.Monomolybdates and monotungstates having the same alkáli ion are iso-morphous. However, the coordination number of the alkali ion depends onthe radius of this ion. At room temperature, Li" ions are coordinated by4 oxygen ions 1-16,17), while Cs+ ions occupy 9- and IO-coordinate posi-tions 1-20). Further, an elevation of temperature appears to give rise to ahigher coordination number of the alkali ions 1-39). ,Among the crystalline alkali molybdates and tungstates of higher trioxide
contents, only the structures of Na2M02071-18,21), Na2W2071-18),K2M03010 1-22,23), Rb2M03010 1-23) and Cs2M03010 1-23) have been de-termined. The structures of all these compounds consist of infinite chains with-out cross-links.The chains found in the Na2M0207 structure - this compound being iso-
morphous with Na2W207 - are built up by Mo06 octahedra sharing corners,with Mo04 tetrahedra bridging adjacent octahedra. This structure is shownin fig. 1.3. Tetrahedral groups are nearly regular, whereas the octahedra areclearly distorted. Sodium ions, occupying interchain positions, are 6-coordi-nated.The chains found in the K2M03010 structure consist of distorted Mo06
octahedra interconnected by pairs of polyhedra which form a transition betweenMo04 tetrahedra and MoO, pyramids. Seleborg 1-22)makes no choice, whileGatehouse and Leverett 1-23) express a preference for 5-coordination. The. structure as described by the latter authors is shown in fig. 1.3. In the K2M03010structure, the polyhedra share not only corners but also edges. Potassium ionsoccupy interchain positions, which are 6-coordinated according to Seleborg,whereas Gatehouse and Leverett propose lO-coordination. RbzM03010 andCs2M030lO are isostructural with K2M03010 1-23). .Finally, the structures of Mo03 and W03 are essentially different. Although
both structures contain exclusively distorted octahedra, these octahedra forma three-dimensional network in the case of W03, while Mo03 has a layerstructure, without cross-links. The W06 groups only share corners. In the'Mo03 structure, however, each octahedron shares edges with its two neigh-bours, forming zig-zag chains; octahedra in the chain share corners withoctahedra in parallel chains, thus forming layers.Three oxygens of each Mo06 group are common to three octahedra within a
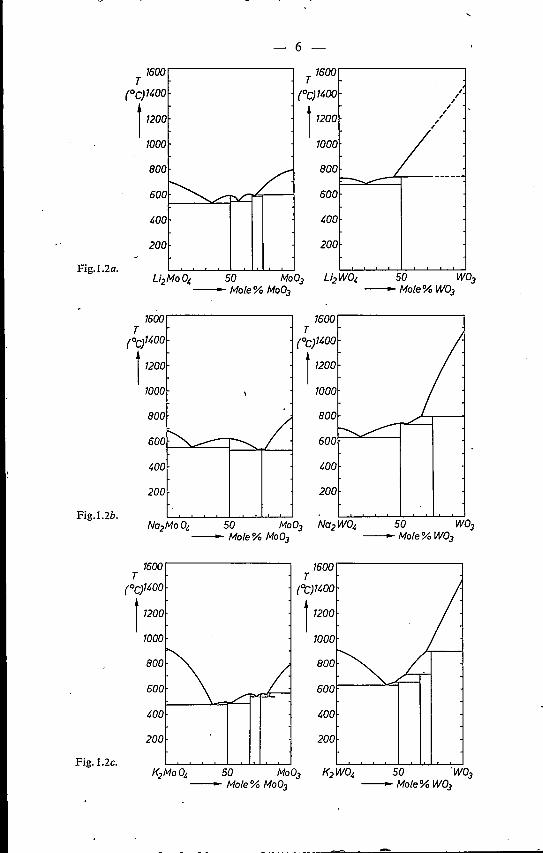
Fig.1.2a.
Fig.1.2b.
Fig.1.2c.
6 -
1600 T 1600T(Oe) 1400 (OC)14oo ;
,,t 1200 1
1200,;,,,
1000 1000
800
~~~/600 600
400 400
200 200
Li2Mo 0, 50 Mo03 Li2WO, 50 W03- Mole% Mo03 - Mole% W03
1600T
(Od400
t 1200
1000 \
~--- ,,/800
600
400
200
1600T
(Oe)1400
112001000
400
200
No2MoO, 50 Mo03 No2WO, 50 W03- Mole% Mo03 -Mole%W03
1600,----------,T
(OC)1400
t 1200
1000
400
200
1600,----------,T
("c)14oo
11200
1000
600
400
200
K2Mo0. 50 Mo03 K2WO. 50 W03- Mole% Mo03 - Mole% W03
Fig. 1.2. Phase diagrams of alkali-molybdate and -tungstate systems.(a) System Li2Mo04-Mo03 (ref. 1-9); system Li2W04-W03 (ref. 1-15).(b) System Na2Mo04-Mo03 (ref. 1-13); system Na2W04-W03 (ref. 1-13).(c) System K2Mo04-Mo03 (ref. 1-13); system K2W04-W03 (ref. 1-12).(d) System Rb2Mo03-Mo03 (ref. 1-14); system Rb2W04-W03 (ref. 1-14).(e) System Cs2Mo04-Mo03 (ref. 1-14); system CS2W04-W03 (ref. 1-14).
- 7
16001600T T
(ocJ1~OO (oC)1~00
l1200 11200
1000 1000
800 800
600 600
~OO ~OO
200 200
Fig.l.2d.Rb2MoO" 50 Mo03
- "foIe% Mo03
1600,------------,T
(OcJ1~OO
l1200
1000
200
Fig.1.2e.Cs2MoO" 50 Mo03
-Mo/e%Mo03
Rb2WO" 50 W03-Mole%W03
1600T
(Oc)1~oo
11200
1000
600
~OO
200
CS2WO" 50 W03-Mole%W03

-8-
OctahedronTetrahedron
~~
M003
Fig. 1.3. Schematic diagrams of the crystal structures of Na2Mo207/Na2 W 207 (ref. 1-18),K2Mo3010 (ref. 1-23), and Mo03 (ref. 1-24).
chain, while two oxygens are common to two octahedra in adjacent chains,one oxygen being non-bridging. The structure of Mo03 is elucidated in fig. 1.3.The dependence of the stability of di- and trimolybdates (and corresponding
tungstates) on the radius of the alkali ion is obvious when we consider theabove-described crystal structures. The large rubidium and caesium ions donot fit into the 6-coordinated alkali positions of the Na2M0207 (Na2W207)structure. On the other hand the small lithium ions would "rattle" in theK2M03010 structure.In the molybdate systems a sharp transition between tetrahedral and octa-
hedral coordinations is absent. The same conclusion does not seem to bejustified in the case ofthe tungstates, at least not on the basis of crystal-structuredata. On the contrary, the lower stabilities ofthe tritungstates as compared withthose of the trimolybdates may indicate that the W atoms are not liable toassume 5-coordination and prefer either strictly tetrahedral or strictly octa-hedral coordinations, if necessary in combination (cf. Na2W207)' (Sele-borg 1-22) reports that K2W3010 and K2M030lO are not isomorphous; nofurther data are given.)
1.4. The structures of vitreous and molten alkali ,tungstates and molybdates
As a first approach towards the elucidation of the structure of vitreoustungstates, Gelsing et al. 1-7,8) applied infrared spectroscopy in the frequencyrange 1700-650 cm-I. The spectra of all glasses measured were found to besimilar, the frequency of the band of maximum absorption being approximately
-9-
equal to that of the crystalline monotungstates. From this the authors con-cluded that the oxygen coordination of the W atoms in all alkali-tungstateglasses is the same, viz. tetrahedral.However, the value of the W/O ratio in the glass-formation regions forces
isolated tetrahedra to combine in the form of chains, the average chain lengthbeing 2 at the composition 50 mole% W03 (M2W207)' According to Gelsinget al. it is highly improbable that the chain length in glass or melt should beuniform. Disproportionation may occur by reactions of the type
2W20l-:(± W042- +W30102-.
The relatively high glass-formation tendency found at compositions around45 mole % W03 is explained qualitatively in the following way. Addition ofW03 to an M2W04 melt forces isolated tetrahedra to combine, thus favouringglass formation. However, an increase ofW03 content also engenders a growingtendency to octahedral coordination. According to the above authors, theformation of octahedra implies the creation of three-dimensional units withstrong internal bonds, in which adjacent polyhedra share edges (this is notsupported by the structure of crystalline Na2W207' a compound containingtwo-dimensional units built up by both tetrahedra and octahedra not sharingedges). By this mechanism the positions of polyhedra with respect to neigh-bouring polyhedra become more and more fixed, so reducing the glass-forma-tion tendency.The dependence of CCR on the nature of the alkali ion is, as Gelsing et al.
point out, based on different influencing of the disproportionation equilibrium.The remarkable position of the Li" ion in tungstate glasses (cf. fig. 1.1) isattributed to the "well-known ordering effect exerted by Li+ on all kinds ofmelts".It should be stressed that this glass structure, also thought to be valid for the
melt, is essentially different from that of crystalline Na2W207, the only com-pound formed in a glass-formation region the structure of which is known.The proposed glass structure is only possible if the infinite Na2W207 chainsundergo nearly complete dissociation on melting.Partial support for this can be found in the cryometric studies of Kordes
and Nolte 1-25,26,27).In the first place, these authors point out that Na2W207possesses an unusually high melting enthalpy of 22·7 kcal mole=" (cf.K2Cr207: 8·9 kcal mole-I). This, together with the fact that the liquidustemperature of Na2W207 shows no noticeable decrease when a few mole %Na2W04 or W03 are added, is attributed to a nearly complete dissociationin Na2W04 and W03 on melting. In our opinion, however, Kordes and Noltemake too rigorous a distinction between dissociation of Na2W207 in eitherW207 dimers or a mixture of monotungstate and W03• Intermediate situations,such as chains oftetrahedra that are subject to disproportionation, may equally

-10-
well account for the phenomena found. The only condition which must be ful-filled is that dissociation should give rise to an appreciable concentration ofW042- ions.
Finally, it should be remarked that for diluted solutions of Na2W207 inK2Cr207 and nitrate melts, Kordes and Noltel-2S.27) and Kust 1-28)respectively accept the existence of dimers W207,At first sight, the structure of molten alkali tungstates and their tendency to
glass formation seems to be explained. However, the evidence put forward byGelsing et al. that vitreous alkali tungstates contain exclusively tetrahedralW04 groups, is rather limited. In the infrared frequency range 1700-650 cm-1both crystalline an vitreous alkali tungstates only show important absorptionmaxima at frequencies lower than 1000cm-I. In this rather narrow region thesimilarity between the spectra of vitreous tungstates and those of the crystallinemonotungstates reported by Gelsing et al. is not so obvious as was suggested.The spectra of the tungstate glasses show strong absorption at frequencieslower than 770 cm-1, contrary to the spectra of the monotungstates. This makesit worthwhile to know the spectra of glasses and crystals in lower frequencyregions. Moreover, an infrared-spectroscopic study of more glasses of differentcompositions would be of great interest.Alkali-molybdate glasses were subjected by Van der Wielen et al. 1-9) to
an analogous infrared-spectroscopic investigation. At the same time, the den-sities of molten lithium, sodium and potassium molybdates were measured.The infrared spectra of vitreous molybdates were found to differ appreciably
from those of the crystalline monomolybdates, indicating that the coordinationof the Mo atom in the molybdate glasses is more complicated than that of theW atom in the corresponding tungstate glasses (according to Gelsing's hypoth-esis). From density isotherms, Van der Wielen et al. concluded that the den-sities of the alkali-molybdate melts in the glass regions are relatively low. Vander Wielen et al. assume the Mo04 group to be more liable to distortion thanthe W04 group. In connection with this, the structure proposed for the molyb-date glasses differs from Gelsing's structure only in that it contains distortedpolyhedra (it is even suggested that the distortion is so strong that the limits of5- and 6-coordination are approached). This explains the infrared-absorptionspectra found and also the fact that the Li" ion does not occupy any special
, position in the molybdate glasses: the ordering effect of Li+ is counteractedby the distortion of the Mo04 tetrahedron.The structure proposed by Van der Wielen et al. likewise differs essentially
from the structures of crystalline compounds in the glass-formation regions,viz. Na2M0207 and K2M0301o (the glass regions do not as yet includeRb2M0301o and Cs2M03010).Again, this implies a dissociation on melting. Some support for this is found
in the work of Navrotsky and Kleppa 1-29) on the enthalpies of mixing in the

r--------------------------------------------------- - -
-11-
- ~system Na2Mo04-Mo03' The results obtained suggest that Na2M0207undergoes significant dissociation on melting, this dissociation, however,being incomplete. Dissociation is expected to increase in the orderK2M0207 -+ Na2M0207 -+ Li2M0207.Our remarks concerning Van der Wielen's structure are partly analogous to
those expressed with respect to Gelsing's. An infrared-spectroscopic investiga-tion only involving the frequency range 1700-650 cm? forms an uncertainbasis for a structure determination. Also, Van der Wielen et al. point out thatthe formation of octahedra is inherent in the occurrence of three-dimensionalunits, this being contrary to the crystal structures of compounds found in theglass-formation regions.Turning to the density isotherms, we are of the opinion that little argument
is put forward to render plausible the view that on the average short chains oftetrahedra effect a lower density than units containing octahedra.And, finally, no attention is given to the fact that a distortion of the Mo04
group to such a degree that the limits of 5-coordination are approached orpassed implies the formation of larger structural units.
1.5. General glass-formation theories
Various theories have been put forward on the basis of which it should bepossible to predict which inorganic oxidic systems will form glasses and whichwill not. None of these theories seems to be valid without exception. In orderto indicate the position of the glasses under consideration in relation to thesetheories, a brief survey will be given.Zachariasen 1-30) assumed the existence of a "random network" to be a
necessary condition for glass formation. The existence of such a network wasconsidered to be restricted to oxides in which the glass-forming cations were3- or 4-coordinated, with adjacent polyhedra having not more than 1 oxygen.in common. Obviously, Mo03 and W03 do not obey Zachariasen's rules, andin fact these oxides only form glasses if extremely rapid quenching is applied.The limitation of Zachariasen's theory is that it only concerns systems whichare liable to form a three-dimensional network. However, on the addition ofalkali oxide to Mo03 and W03 the network is no longer three-dimensional, sothat the structure of the system is no longer covered by Zachariasen's theory.
Hägg 1-31), one of the first of Zachariasen's critics, did not require a specificcoordination number of the glass-forming cation. Emphasizing the importanceof the presence of large and irregular complex anions in the melt, Hägg pointedout that structures consisting of layers of chains can also form a glass. Histheory mayalso apply to the molybdate and tungstate glasses. A drawback ofHägg's theory is its qualitative character. .Smekall-32) expressed the view that the presence of mixed bonds is a neces-
sary condition for glass formation. Calculation of the amount of ionic character

-12 -
of Mo-O and W-O bonds from electronegativity values gives 51 and 55% ofionic character respectively. -
According to the classification of Stanwortb 1-33), Mo03 should, therefore,belong to the intermediates, while W03 should be classed among the selectgroup of glass formers. Obviously, the latter classification does not correspondto reality.
Sun 1-34) suggested the importance of a strong bond between the glass-forming cation and the oxygens surrounding it. During crystallisation a rearran-gement process must take place, this frequently involving the breaking ofcation-oxygen bonds. According to Sun's criterion both Mo03 and W03,having values of the "single-bond strength" (BM-O) of 92 and 103 kcal mole."!respectively, should be reckoned among the glass-forming oxides.
Rawson 1-35) modified Sun's criterion in that he also took the value of theliquidus temperature into account. His theory is based on the view that thechance of breaking a bond is not only related to the strength of the bond, butalso to the amount of thermal energy available. If the ratio BM_O/Tllqu.(where Tllqu• = liquidus temperature, K) is taken as a criterion, W03, as aresult of its high melting point (1473 "C), passes over to the group of inter-mediates.
The merit of Rawson's theory is that it can also be used for binary systemsand that it gives an explanation of the fact that a number of oxides (calledconditional glass formers) which do not form glass when melted alone, caneasily be vitrified in combination with other oxides. On the other hand, Rawson'scriterion gives only a rough indication of glass-formation ranges to be expected.For instance, in most of the alkali-molybdate and -tungstate systems, the com-position of minimum eeR deviates considerably from that ofthe lowest liquidustemperature (cf. figs 1.1 and 1.2).
Furthermore, it is doubtful whether Rawson's argumentation is quite correct.Both liquidus temperature and glass-formation tendency are affected by thestructure ofthe melt. The liquidus temperature, however, is a thermodynamical-equilibrium value, whereas glass formation presupposes the very absence ofequilibrium.
DietzeI1-36) considers the reciprocal value of the maximum linear crystal-growing rate, represented by the term "Glasigkeit" (glassiness), to be a criterionfor the prediction of glass formation. The lowest glassiness is expected to occurat compositions corresponding with congruently melting phases, since at thesecompositions the structural units in the melt should be identical to those in thecrystal lattice to be formed.
In the systems under consideration, however, it is not seldom that the mini-_mum eeR value is found exactly at the composition of a congruently meltingphase (cf. figs 1.1 and 1.2). This may indicate that, at least at these compositions,structural units appearing in the melt are not identical to those in the crystal

-13-I
to be formed (this would be in conformity with the ideas discussed in the pre-vious section).
The views put forward by Turnbulll-37) and Sarjeant and Roy 1-10), whichare based on a theoretical consideration of nucleation and crystal growth, arenot suitable for the prediction of glass formation in complex systems and,moreover, require the knowledge of viscosity values. These theories, however,will be briefly discussed in chapter 6.
1.6. Purposes of the investigation
In the previous section we have seen that a number of questions with regardto glass formation in alkali-molybdate and -tungstate systems and in particularwith regard- to the structures of the glasses formed, are still unsatisfactorilyanswered.This thesis is an attempt to solve some of the problems, at least in part.In chapter 2 the questions will be discussed whether the composition regions
of glass formation may still be extended, and whether the glass-formation tend-ency is enhanced by the mixing either of two different alkali ions or of molyb-date and tungstate. Further, an investigation of crystallisation phenomena,which was undertaken in view of the ideas expressed by Dietzel (see sec. 1.5),is described. In chapter 3 attention will be paid to the question whether by anextension of the infrared-spectroscopie studies with respect to both frequencyand composition ranges, new structural information can be obtained.The structure of a glass is seldom understood completely if the investigation
is one-sided in its approach. The problem should be approached from variousdirections, e.g. by means of spectroscopie methods and by measuring certainproperties of the glass as a function of composition. The latter method, however,is not applicable in ~he case of vitreous alkali molybdates and tungstates, assamples of reasonable amount can only be prepared over small compositionregions.A way of avoiding this difficulty is the method in which measurement is
made of the properties of the same system in the molten state, the basis ofwhiehis the concept that the structures of melt and glass will not be essentially dif-ferent.
Sueh an investigation has been started by Van der Wielen et al. 1-9) bymeans of determination of the densities of molten lithium-, sodium- andpotassium-molybdate systems as a function of composition and temperature.
This thesis is largely devoted to this method of obtaining indirect informationon the structures of the vitreous alkali molybdates and tungstates .. In chapters 4, 5 and 6 respectively the determinations of density, surface-'tension and viscosity values of both molten alkali-molybdate and -tungstatesystems will be discussed, the alkali ions being lithium, sodium and potassium.Special attention will be paid to mutual comparisons of property/composition

14 -
isotherms of molten molybdates on the one hand, ~nd molten tungstates on theother. From the similarities and dissimilarities observed, conclusions will bedrawn concerning the structures of the corresponding glasses.Finally, in chapter 7, an attempt will be made to give a synthesis ofthe results
found -by the various methods applied.One observation should be made in concluding this introductory chapter.
In the previous section it was shown that vitreous molybdates and tungstatesdo not obey dissimilar theories advanced in respect of glass formation. Con-versely, these theories do not describe the facts as found for vitreous molyb-dates an~ tungstates. Therefore, an investigation of glass formation in thesesystems is at the same time a study of the fundamental mechanisms governingglass formation.
REFERENCES1-1) J. J. Rothermei, K. H. Sun and A. Silverman, J. Am. ceram. Soc. 32, 153-162,
1949.1-2) H. H. Franck, Tag. Ber. chem. Ges. DDR, 119-122,1955.1-3) R. H. Caley and M. K. Murthy, J. Am. ceram. Soc. 453, 254-257, 1970.1-4) H. Hirohata, K. Shimada and Y. Li d a, Funtai Oyobi Funmatsuyakin 16, 86-89,
1969.1-5) Brit. Pat. Spec. 1,444,153; No. 23872/66.1-6) P. L. Baynton, H. Rawson and J. E. Stanworth, Nature 178, 910-911, 1956.
Trav. du IVe congr. internat. du verre (Paris 1956), Imprimerie Chaix, Paris, 1957,pp.62-69.
1-7) R. J. H. Gelsing, H. N. Stein and J. M. Stevels, Phys. Chem. Glasses 7, 185-190,1966.
1-8) R. J. H. Gelsing, Klei en Keramiek 17, 183-189, 1967.1-9) J. C. Th. G. M. van der Wielen, H. N. Stein and J. M. Stevels, J. non-cryst,
Solids 1, 18-28, 1968. -1-10) P. T. Sarjean tand R. Roy, Mat. Res. Bull. 3, 265-280, 1968.1-11) P. T. Sarjeant and R. Roy, J. Am. ceram. Soc. 50, 500-503, 1967.1-12) R. J. H. Gelsing, H. N. Stein and J. M. Stevels, Rec. Trav. chim. 84, 1452-1458,
1965.1-13) P. CailIet, Bull. Soc. chim. 4750-4755, 1967.1-14) R. Salmon and P. Caillet, Bull. Soc. chim. 1569-1573, 1969.1-15) R. J. H. Ge ls in g, personal communication.1-16) W. H. Zachariasen, Norsk geol. Tidsskrift 9, 65-73, 1926.1-17) W. H. Zachariasen and H. A. Plettinger, Acta cryst. 14, 229-230, 1961.1-18) I. Lindqvist, Acta chem.Scand. 4, 1066-1074, 1950.1-19) B. M. Gatehouse and P. Leverett, J. chem. Soc. (A), 849-854, 1969.1-20) A. S. Koster, F. X. N. M. Kools and G. D. Rieck, Acta cryst. B25, 1704-1708,
1969.1-21) M. Seleborg, Acta chem, Scand. 21, 499-504, 1967.1-22) M. Seleborg, Acta chem. Scand. 20, 2195-2201, 1966.1-23) B. M. Gatehouse and P. Leverett, J. chem. Soc. (A), 1398-1405, 1968.1-24) A. F. Wells, Structural inorganic chemistry, Clarendon Press, Oxford, 1962, 3rd ed.,
pp.468-469. .1-25) G. Nolte, Thesis, Bonn, 1967.1-26) G. Nolte and E. Kordes, Z. anorg. allgem. Chem. 371, 149-155, 1969.1-27) E. Kordes and G. Nolte, Z. anorg. allgem. Chem. 371, 156-171, 1969.1-28) R. N. Kust, Inorg. Chem. 6, 157-160, 1967.1-29) A. Navrotsky and O. J. Kleppa, Inorg. Chem. 6, 2119-2121, 1967.1-30) W. H. Zacharias en, J. Am. chem. Soc. 54, 3841-3851, 1932.1-31) G. Hägg, J. chem. Phys. 3, 42-49, 1935.

- 15-
1-32) A. Smekal, J. Soc. Glass TechnoI. 35, 411-420, 1951.1-33) J. E. Stanworth, J. Soc. Glass TechnoI. 32, 366-372,1948.1-34) K. H. Sun, J. Am. ceram. Soc. 30, 277-281, 1947.1-35) H. Rawson, Trav. du !Ye congr. internat. du verre (Paris 1956), Imprimerie Chaix,
Paris, 1957, pp. 62-69; Inorganic glass-forming systems, Academic Press, London,1967, pp. 25-29.
1-36) A. Dietzel and H. Wickert, Glastechn. Ber. 29, 1-4, 1956.1-37) D. Turnbull, Contemp. Phys. 10, 473-488, 1969.1-38) F. X. N. M. Kools, A. S. Koster and G. D. Rieck, Acta cryst. B 26, 1974-1977,
1970. '1-39) A. W. M. van den Akker, A. S. Koster and G. D. Rieck, J. appI. Cryst. 3,389-392,
1970.
-16 -
2. GLASS-FORMATION AND CRYSTALLISATION PHENOMENA
2.1. Extension of glass-formation regions
Enlargement of the glass-formation regions, found so far 2-1,2,3), is neces-'sary if the infrared-spectroscopie study of vitreous molybdates and tungstatesis to be extended as far as composition is concerned.The consequence of this is that higher cooling rates have to be realised. Several
methods exist by which extremely high cooling rates can be attained, all beingbased on dividing a quantity of a melt into a great number of small droplets,which are ca~ght in a cool liquid or on a cool substrate.
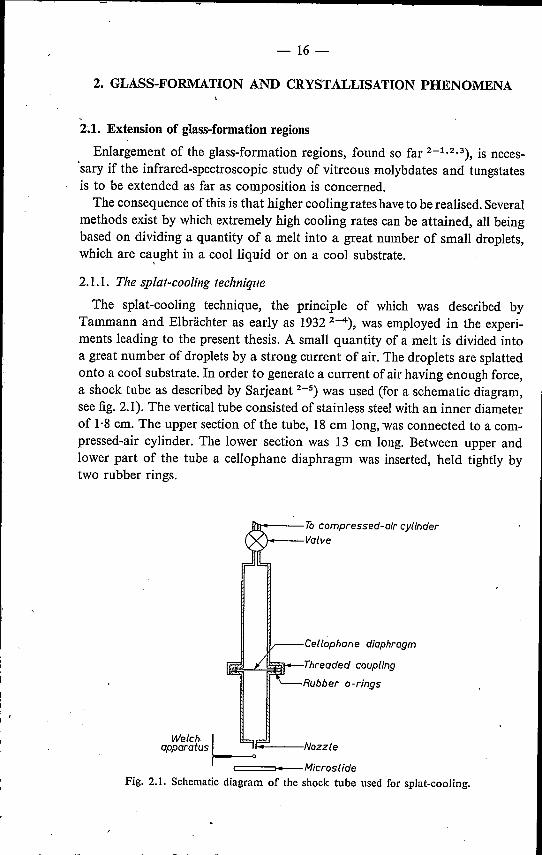
2.1.1. The splat-cooling technique
The splat-cooling technique, the principle of which was described byTammann and Elbrächter as early as 1932 2-4), was employed in the experi-ments leading to the present thesis. A small quantity of a melt is divided intoa great number of droplets by a strong current of air. The droplets are splattedonto a cool substrate. In order to generate a current of air having enough force,a shock tube as described by Sarjeant 2-5) was used (for a schematic diagram,see fig. 2.1). The vertical tube consisted of stainless steel with an inner diameterof 1·8cm. The upper section of the tube, 18 cm long, was connected to a com-pressed-air cylinder. The lower section was 13 cm long. Between upper andlower part of the tube a cellophane diaphragm was inserted, held tightly bytwo rubber rings.
Cellophane diaphragm
Threaded coupling
Rubber a-rings
Iht-oo--- Tocompressed-air cylinderValve
===---MicroslideFig. 2.1. Schematic diagram of the shock tube used for splat-cooling.
-17 -
The nozzle at the lower end of the tube was placed at a distance of 0·5 cmfrom the substance under study, the substance being melted into the loop ofa V-kinked thermocouple (Pt 5% Rh/Pt 20% Rh).The thermocouple was switched alternately into a heating circuit and a
measuring circuit, the frequency of switching being 50 cIs (a diagram of thecircuits is given in fig. 2.3; see also sec. 2.2.1).Samples of 2-4 mg were used. The temperature was maintained at approxi-
mately 100°C above the liquidus.The air shock was produced by raising the pressure beyond the bursting
pressure of the diaphragm. Application of cellophane of two different thick-nesses (bursting pressures being 2·5 and 4 ato respectively) did not have amarkedly different effect on glass formation.The melt was driven off the thermocouple by the shock and shot onto a
microscope slide which was placed at a distance of 1 cm below the thermo-couple.Our experiments confirm Sarjeant's experience that metal substrates, though
better heat-conducting, are unsuitable for the purpose, because an oxidic meltdoes not attach itself to a metal surface. Only glass substrates give satisfactoryresults in this respect and, moreover, show no signs of reaction with thesample.The samples obtained - referred to as splats - were examined for the
occurrence of crystallisation with a Carl Zeiss WL Pol microscope, using bothnormal and polarised light (magnification 125 and 500x).Although visual examination using normallight gives reliable information on
the extent of crystallisation, the distinction between vitreous and crystallineregions was even clearer between crossed nicols. In general, this method canbe safely used in the systems under investigation, since among the crystal struc-tures known, only the structures of Na2Mo04 and Na2W04 possess cubicsymmetry.A few splats which were classified as "glass with very slight crystallisation"
were also examined by X-ray diffraction (Debije-Scherrer technique; CuKetradiation). Itwas established that the crystals seenunder the microscope, whichwere few in number and small in size, were not observed by X-ray-diffractio-metric examination.For calculation of the cooling rate, a number of material properties such as
layer thickness, heat-transfer coefficient and thermal conductivity must beknown. The latter two properties have not been determined for the systemsunder consideration. However, Sarjeant and Roy 2-6) demonstrated that thecooling rate is mainly dependent on the layer thickness. In our experiments thedroplets were found to have a thickness of 1-2 [Lm (measured under themicroscope, using a micrometer). For this thickness, we estimate the coolingrate to have an order of magnitude of 106°C S-l, this being the value calculated

-18 -
by Sarjeant and Roy for a few very dissimilar compounds, viz. Si02, MgA1204,NaCl and Pb.
2.1.2. Preparation of samples
Samples were made from alkali carbonates, Mo03 and W03• The followingchemicals were used:
Li2C03 Merck, extra pureNa2C03 anhydrous, Merck, pro analysiK2C03 Merck, pro analysiRb2C03 MerckCS2C03 + H20 BDHMo03 Merck, pro analysiW03 Merck
Before being weighed the alkali carbonates were dried for a few hours at 300°C.Calculated quantities of alkali carbonate and trioxide were mixed intimately
and melted together in a platinum dish for several hours at 900-1000 °C.Tungstates having a W03 content higher than 75 mole% were excluded from
the experiments because of their high liquidus temperatures and tendency tooxygen loss, which gave rise to greying or blackening.
2.1.3. Results and discussion
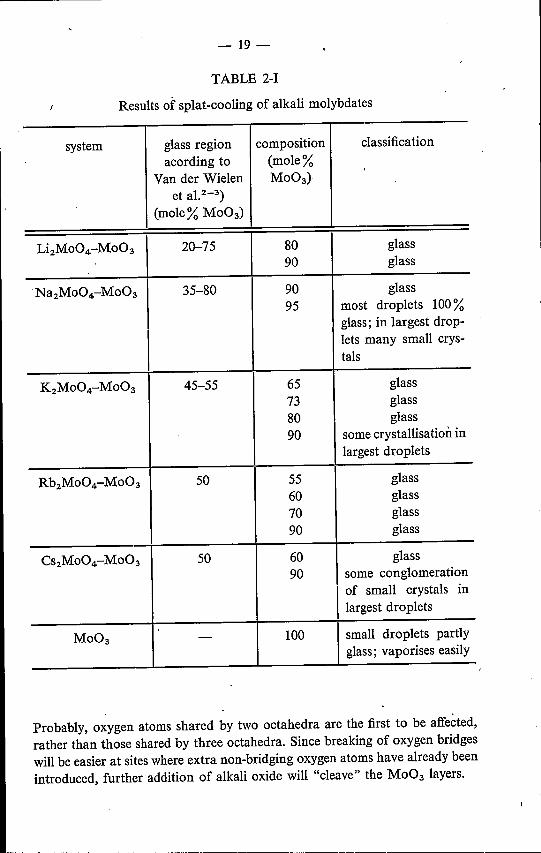
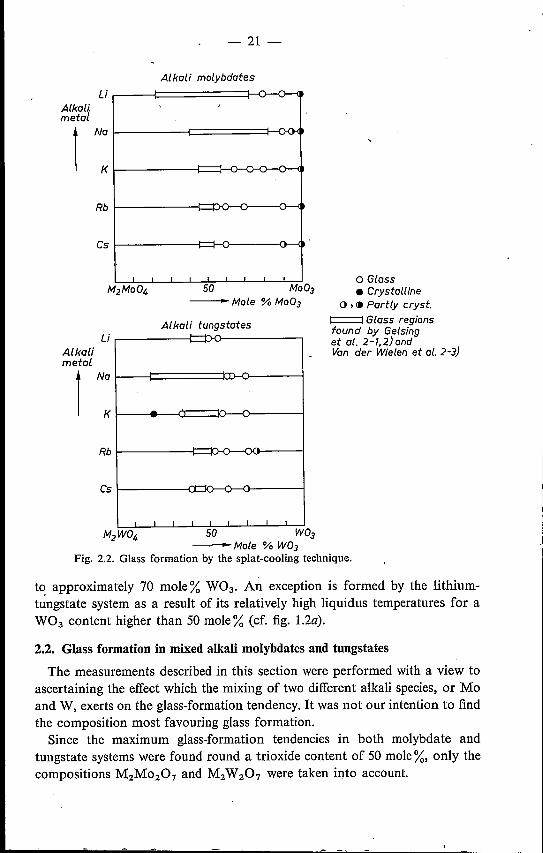
The results of the splat-cooling experiments are shown in tables 2-1 and2-11and in fig. 2.2.The results obtained demonstrate that application of the splat-cooling tech-
nique gives a considerable extension ofthe glass-formation regions in the directionof higher trioxide content, especially in the case ofthe molybdate systems, whichhave relatively low liquidus temperatures, irrespective of trioxide content.
The observation of Sarjeant and Roy 2-7) that even pure Mo03 can be madepartly vitreous was confirmed.
In trying to extend the glass-formation regions to a lower trioxide content,splats were obtained which rapidly attracted moisture. Since it was the purposeof the experiments to prepare samples for infrared-spectroscopic measurements,no further attempts were made in this direction.
From table 2-1 and fig. 2.2 it is seen that addition of a small quantity of anyalkali monomolybdate to Mo03 considerably raises the tendency to glass for-mation. It seems unlikely that the addition of, for instance, 10mole % of an alkalimonomolybdate produces a glass structure analogous to that described by Vander Wielen et al.2-3) (see sec. 1.4), as this would involve a sudden and completetransition to distorted tetráhedral coordination.Addition of monomolybdate (or rather alkali oxide) means the introduetion
of extra oxygen atoms, which will be used for the partial breaking of oxygenbridges in the Mo031ayers (see sec. 1.3)and the creation ofnew oxygen bridges.
- 19-
TABLE 2-1Results of splat-cooling of alkali molybdates
system glass region composition classificationacording to (mole%
Van der Wielen Mo03)et a1.2-3)
(mole% Mo03)
Li2Mo04-Mo03 20-75 80 glass90 glass
·Na2Mo04-Mo03 35-80 90 glass95 most droplets 100%
glass; in largest drop-lets many small crys-tals
K2Mo04-Mo03 45-55 65 glass73 glass80 glass90 some crystallisation in
largest droplets
Rb2Mo04-Mo03 50 55 glass60 glass70 glass90 glass
Cs2Mo04-Mo03 50 60 glass90 some conglomerationI of small crystals in
largest droplets
Mo03 - 100 small droplets partlyglass; vaporises easily
Probably, oxygen atoms shared by two octahedra are the first to be affected,rather than those shared by three octahedra. Since breaking of oxygen bridgeswill be easier at sites where extra non-bridging oxygen atoms have already beenintroduced, further addition of alkali oxide will "cleave" the Mo03 layers.

- 20-
TABLE 2-11
Results of splat-cooling of alkali tungstates
system glass region composition classificationindicated by (mole%
Gelsing eta!. 2-1.2) W03)(mole% W03)
Li2W04-W03 41-49 40 glass50 glass55 glass
Na2W04-W03 23-61 23 glass, hygroscopic50 glass60 glass61'5 glass70 glass
K2W04-W03 36-57 20 crystal, hygroscopic35 glass56 glass70 glass
Rb2W04-W03 I 42-52 52·3 glass58·3 glass71·4 glass75 largest droplets partly
crystalline
CS2W04-W03 44-47 40 glass, hygroscopic50 glass60 glass70 largest droplets for t~e
greater part crystalline
Essentially, this process may continue until chains of octahedra only, withoutcross-links, are left. However, a stoichiometrie calculation shows that to effectthis, so much trioxide has to be added that the monomolybdate compositionis reached. Naturally, long before this is realised a tendency to the formationof 5- and 4-ocordinations has occurred. .For the alkali-tungstate systems (see table 2-11and fig. 2.2), application of
the splat-cooling technique gives an extension of the glass-formation regions
- 21
Alkali molybdates
- -'-'
cv
- - - -
LiAlkalimetal
1Na
K
Rb
Cs
o Glass• Crystalline
o ,~ Partly cryst.r::::=:::I Glass regionsfound by Gelsinget al. 2-7,2)andVan der Wielen et al. 2-3)
M2Mo04 50 Mo03-Mole %Mo03
Alkali tungstatesLi
--
""'" - -~~
I I
Rb
Cs
M..,W04 50 W03----- Mole % W03
Fig. 2.2. Glass formation by the splat-cooling technique.
t~ approximately 70 mole % W03• An exception is formed by the lithium-tungstate system as a result of its relatively high liquidus temperatures for aW03 content higher than 50 mole% (cf. fig. 1.2a).
2.2. Glass formation in mixed alkali molybdates and tungstates
The measurements described in this section were performed with a view toascertaining the effect which the mixing of two different alkali species, or Moand W, exerts on the glass-formation tendency. Itwas not our intention to findthe composition most favouring glass formation.
Since the maximum glass-formation tendencies in both molybdate andtungstate systems were found round a trioxide content of 50 mole%, only thecompositions M2M0207 and M2W207 were taken into account.
-22-
As a criterion of the tendency to glass formation, we considered the valueof the critical cooling rate (eeR), in accordance with the work of Gelsinget aF-l.2) and Van der Wielen et al,2-3).The question may arise whether eeR forms a valuable criterion of the tend-
ency to glass formation, as its value is liable to be dependent on factorsinfluencing the occurrence of heterogeneous nucleation, such' as impurities,materials in contact with the sample, and quantity of the sample.The answer is that the experiments were performed under conditions which
were kept constant as much as possible. Furthermore, in the course of eeRmeasurements on various systems 2-1.3.11.1l) it was observed that the value ofeeR was reproducible within ± 50%, when various thermocouples and cru-cibles were used and the quantity of the sample was varied from some miIIi-grammes to several grammes. An error of ± 50% may seem to be extremelylarge. Generally, however, the value of eeR strongly varies with composition,so that such an error has virtually no effect on the relation between eeR andcomposition.
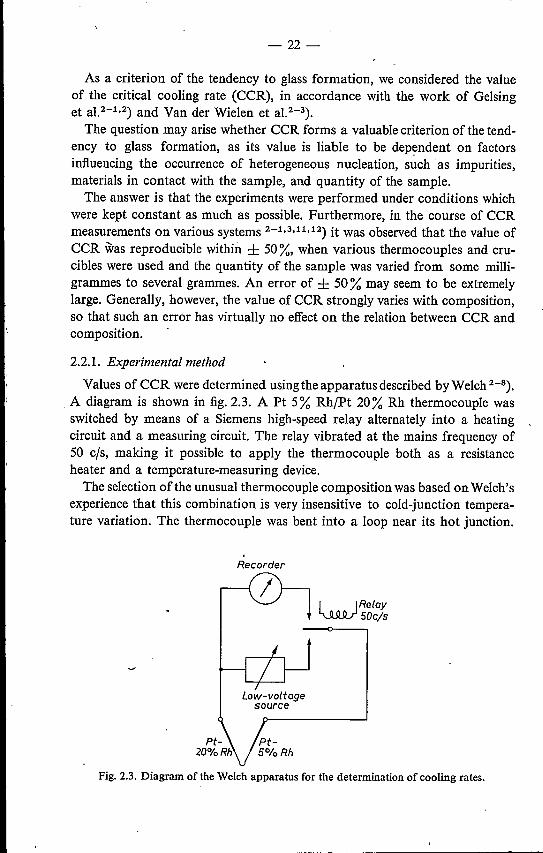
2.2.1. Experimental method
Values of eeR were determined using the apparatus described by Welch 2-8).A diagram is shown in fig. 2.3. A Pt 5% RhfPt 20% Rh thermocouple wasswitched by means of a Siemens high-speed relay alternately into a heatingcircuit and a measuring circuit. The relay vibrated at the mains frequency of50 cIs, making it possible to apply the thermocouple both as a resistanceheater and a temperature-measuring device.The selection ofthe unusual thermocouple composition was based on Welch's
experience that this combination is very insensitive to cold-junction tempera-ture variation. The thermocouple was bent into a loop near its hot junction.
Recorder
I IRelay'-I...O..Q.2... 50c/s
Fig. 2.3. Diagram of the Welch apparatus for the determination of cooling rates.

- 23-
A quantity of 2-4 mg of the sample to be studied was melted into the loop.The sample was observed through a Vernier measuring microscope (JamesSwift & Sons), using a magnification of 24 X .The heating current was turned down by means of a servomotor with variable
speed. The cooling rate, therefore, could be varied within wide limits. If theheating current was switched off abruptly a cooling rate of approximately200°C S-l was observed. Higher cooling rates could be attained by simultane-ously directing a current of air onto the sample.Cooling rates were determined with the aid of a Goerz Servogor Type RE 511
compensation recorder or (at high cooling rates) with a Tektronix Type 546storage oscilloscope.CCR values reported are the arithmetic mean of the lowest cooling rate
preventing crystallisation entirely, and the highest cooling rate producing asample in which traces of crystallisation could still be observed.Samples were prepared by the method described in sec. 2.1.2.
2.2.2. Results and discussionThe results of the measurements are shown in figs 2.,4-2.7.Figure 2.4 demonstrates the effect which the replacement of Mo atoms by
10'~---r------'
oU«Na
, -Mo{e%M2W207Fig. 2.4. Critical cooling rate CCR <"Cg-l) in the systems MzMoz07-MzWZ07 (M = Li,Na, K).

-24-
W atoms has ori the value of CCR in the systems Li2M0207-Li2 W207'Na2M0207-Na2 W207 and K2M0207-K2 W207. In aU three cases partialreplacement of Mo by W gives a CCR value showing anegative departurefrom linearity. The extent of this glass-formation-favouring effect, however,strongly depends on the nature of the alkali ion present, and decreases in theorder K -+ Na -+ Li. In the system Li2M0207-Li2 W207 the effect found isparticularly small, probably because the effect raising the glass-formation tend-ency is crossed by the glass-formation-counteracting effect of the presence ofLi" ions in a tungstate melt (cf. sec. 1.2).When dimolybdate and ditungstate are mixed, crystallisation may be ham-
pered if one of the following mechanisms occurs:(a) Molybdate and tungstate polyhedra form common complex anions. This
possibility seems to be most likely if the structure of molten dimolybdateis (nearly) identical to that of the molten distungstate.
(b) Molybdate and tungstáte polyhedra do not form common anions, butmolybdate and tungstate anions are mutually mixed. This possibility seemsto be most likely if an essential difference exists between the structures ofmolten dimolybdate and ditungstate.
(c) A combination of Ca) and (b), possibly depending on the alkali speciespresent.
At this stage, the question of which of the proposed possibilities occurs, can-not be answered. Nevertheless, as the glass-formation-favouring effect increasesin the order Li -)- Na -+ K, the conclusion seems to be justified that the sta-bility of mixing increases in the same order.Figure 2.5 shows the effect of the presence of two different alkali species in
a dimolybdate melt.In all three cases examined, mixing of two alkali species strongly reduces the
value of CCR. This glass-formation-favouring effect increases, as the dif-ference in field strength between the two alkali ions is raised. In the systemLi2M0207-K2M0207 considerably lower CCR values are reached than in thesystem Li2M0207-Na2M0207. Likewise, the system Li2M0207-K2M0207shows easier glass formation than the system Na2M0207-K2M0207.In order to examine whether this trend is also found when Li+ and Rb+ ions,
and Li+ and Cs+ ions are mixed, the CCR values of the following compositionswere measured:
LiRbM0207: CCR = 2·6 °c S-1
LiCsM0207: CCR = 1·5°c S-1.
These values possess the same order of magnitude as the minimum CCR valueoccurring in the system Li2M0207-K2M0207' in spite of the glass-formationtendencies of Rb2M0207 and Cs2M0207 being considerably lower than thatof K2M0207 (see fig. 1.1).

-25 -
10·,-------,--------,M M'
CCR 0 Na K(OC s-ry • Li Na
lA Li K103~------+-------~
- Mo/e% Mi M02 07
Fig. 2.5. Critical cooling rate CCR fC s" 1) in mixed-alkali dimolybdate systems.
...Figure 2.6 shows the effect of the simultaneous presence of two different
alkali species in a ditungstate melt.Again, a marked increase of glass-formation tendency is observed in all three ..
systems examined. The decrease of CCR found in the systemsLi,Wz07- Kz W Z07
and LizWZ07-NaZWZ07' however, is less than that found in the correspondingmolybdate systems.In the system Li,Wz07-Kz WZ07' glass formation is easier than in the system
LizWZ07-NaZW Z07' Nevertheless, supplementary experiments showed thatLiRbWz07 and LiCsWz07 only form glass if cooling rates higher than103°C ç 1 are applied.Considerable increase of the glass-formation tendency when two or more
alkali species are mixed is a well-known phenomenon in glass technology. Inaddition to the tendency to glass formation, other properties as well may benon-additive in such a system. This is known as the mixed-alkali effect.
Striking examples are formed by the nitrate glasses, where the simultaneouspresence of alkali ions and alkaline-earth ions of sufficiently different fieldstrength is a necessary condition for glass formation. Thilo et al,Z-9) point outthat for electrostatic reasons the ions ofhighest :fieldstrength will be coordinatedpreferably by ions having the lowest field strength. The stability of mixing will
-26 -
increase with the difference in field.strength. The positions of the ions in themelt will no longer correspond then to the positions which these ions shouldoccupy in the crystallattice. Therefore, crystallisation is hampered.A similar mechanism may explain the increase of the glass-formation tend-
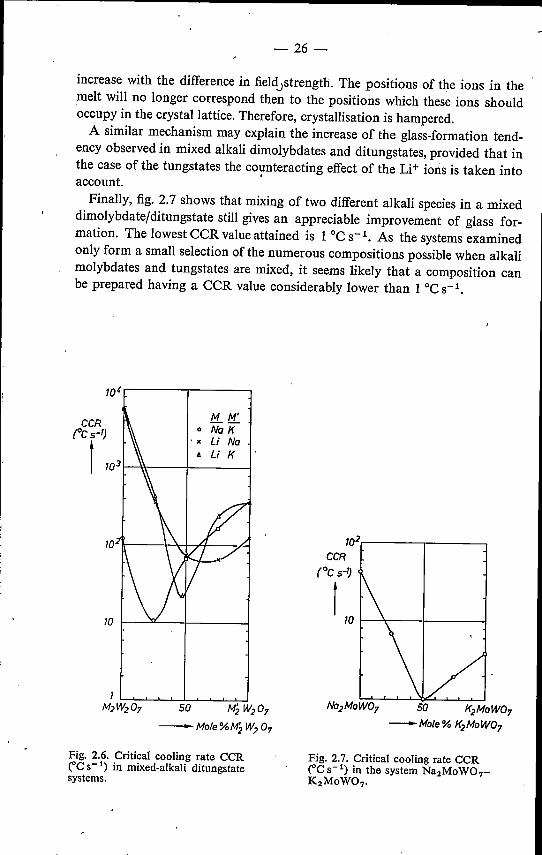
ency observed in mixed alkali dimolybdates and ditungstates, provided that inthe case of the tungstates the co~nteracting effect of the Li" ions is taken intoaccount.Finally, fig. 2.7 shows that mixing of two different alkali species in a mixed
dimolybdatejditungstate still gives an appreciable improvement of glass for-mation. The lowest eeR value attained is 1 oeS-I. As the systems examinedonly form a small selection of the numerous compositions possible when alkalimolybdates and tungstates are mixed, it seems likely that a composition canbe prepared having a eeR value considerably lower than 1 oeS-I.
T02r-----,------,CCR
(OC s-ry
tTO I----\---t------j
TO' ,------,------,
K2MoW07-Mole% K2MoW07
Fig. 2.6. Critical cooling rate CCR<"CS-I) in mixed-alkali ditungstatesystems.
Fig. 2.7. Critical cooling rate CCR<"CS-I) in the system Na2MoW07-K2MoW07·

I :r
CCRII
:t LII
0·55Na2WO"0·45 W03
- 27-
2.3. Crystallisation phenomena
2.3.1. Experimental method
Section 1.5 discussed Dietzel's theory, which relates glass formation to a lowvalue ofthe maximum linear crystal-growth rate. In the systems under consider-ation, the composition of highest glass-formation tendency is frequently foundnear compositions corresponding to congruently or incongruently melting
. compounds. Therefore, it seemed of interest to determine crystal-growth ratesin these systems, the more so as the Welch apparatus described in sec. 2.2.1is excellently suited for the purpose 2-10).
Preliminary experiments, however, demonstrated that the determination ofcrystal-growth rates presented the following difficulties:(a) In most cases considerable undercooling was necessary to start crystallisa-
tion.(b) Once a nucleus was formed, growing proceeded so rapidly that it could not
be measured.(c) This instantaneous crystallisation was accompanied by such a heat effect
that, though the thermocouple material guarantees good heat conducting,the temperature was strongly raised (50-100 "C).
The minimum degree of imdercooling necessary for nucleation, however, wasfound to be satisfactorily reproducible and relatively independent of coolingrate.
This is illustrated by fig. 2.8, which shows the relations between the tem-perature of crystallisation from the meIt (tCM) and cooling rate for a non-glass-forming sample (Na2 W04) and a relatively easily glass-forming sample(0'55 Na2 W04 • 0·45 W03). Both samples were cooled 5 times at each cooling
760
720fc,./'c)
680
640
600
560
520
480
440
400
3600·1 0-2
I I I I I
, 6 8 10 20 '0 6080100_ Cooling rafe(OC s=l )
Fig. 2.8. Influence of cooling rate on crystallisation temperature tCM for the compositionsNa2 W04 and 0'55 Na2 W04 • 0'45 W03•
2
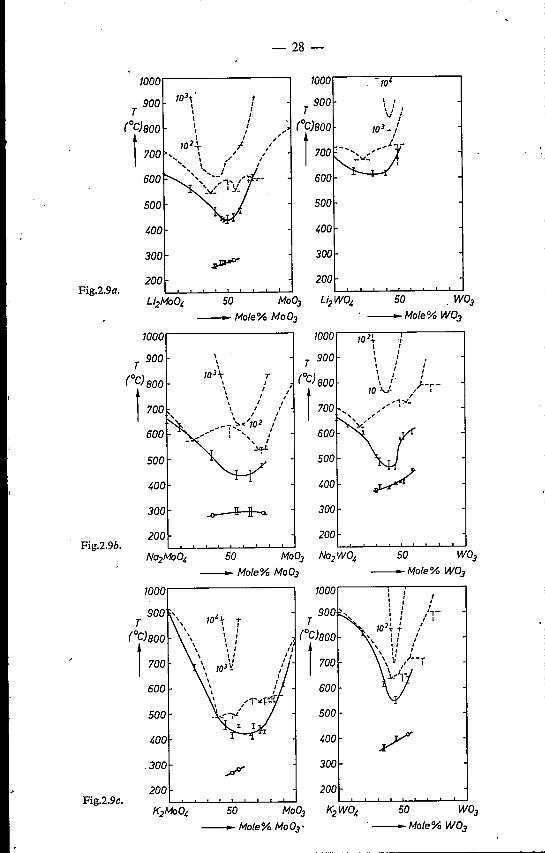
Fig.2.9a.
Fig.2.9b.
Fig.2.9c.
1000.----------,
T 900
(OC)800
t 700
t,,,,,,I
I-I
~OO
300
50-Mole%Mo03
1000...----------,
T 900
(OC)800
t 700
600
\\\
103\ T\ ,\ " /\ I I\ I I\ I I
__ \~<'102 "..."'" ...... I
...' : ", "~
500
~OO
300
200
50
/,I,,
II
- 28-
500
~OO
300
200
50-Mole%W03
1000,--,0-2"'.\.--.,...-----,, ,, ,T 900 \ I i
(OC)800 \ / :
tla V /J--j-",'l'Y-, ,, ''Y:
500
~00
300
- __ Mole%M003 -Mole% w03
1000 1000
900T
(OC)800
t 700
600
.300
50- Mole%Mo03·
50
T(OC)aoo
t 700
600
III/,-
, IIII
.'
500
~OO
300
50'-Mole%W03

29 -
1000 1000
900 T 900T(OC)eoo (OC)eoo
1I
tII
700 I 700III
600 I 600I
II /"1~-f ' I I 500500 \ ,t;(--
1,00 \~ 1,00
300 300
200 200
Fig.2.9d. Rb2MoO~ , 50 Mo03 Rb2WO~ 50 W03-Mole%Mo03
1000 1000
" T 900,,(OC)eoo
\(OC)eoo\
\
t\
t,
700 \ 1 I/O' 700\\ 'J
600 \ 600
500 500
1,00 1,00
300 300:It
200 200
Fig.2.ge. CS2MoO~ 50 Mo03 CS2WO~
--Mole%W03
50 W03-Mole%W03
Fig. 2.9. Relationship between crystallisation temperatures tCM and tCG and composition,projected on phase diagram and critical-cooling-rate curve.(a) System Li2Mo04-Mo03; system Li2W04-W03.(b) System Na2Mo04-Mo03; system Na2W04-W03.(c) System K2Mo04-Mo03; system K2W04-W03.(d) System Rb2Mo04-Mo03; system Rb2W04-W03.(e) System Cs2Mo04-Mo03; system CS2W04-W03.
-Mole%Mo03

- 30-
rate. In the figure the temperature ranges are indicated between highest andlowest tCM found. The value of tCM proves to be satisfactorily reproducible,provided that no cooling rates lying near eeR are applied.
The tCM values for al arge number of binary alkali-molybdate and -tungstatesamples were determined. In all cases the cooling rate was maintained atapproximately 1 oe S-l. Again, tCM of each sample was measured 5 times.
Thanks to the extent of the heat effect, crystallisation temperatures wereregistered easily by means of a recorder (Kipp type BD!). At the same time,samples were observed through the measuring microscope referred to in sec.2.2.1.
Samples which could be made completely vitreous on the thermocouple wereslowly reheated.1t was visually established at which temperature devitrificationset in. The crystal-growth rate in the glass was considerably lower than thatin the supercooled melt. Therefore, a heating rate of 0·1 oe S-l was chosen.
The temperature of crystallisation from the glass (tCG) also proved to besatisfactorily reproducible. Again, tCG of each sample was determined 5 times.
2.3.2. Results and discussion
Figures 2.9 a - e show the relations between tCM, tCG and composition forthe systems M2Mo04-Mo03 and M2W04-W03 CM = Li, Na, K, Rb, Cs)projected on phase diagrams and glass-formation regions.
From these figures it is seen that the values of tCM and the phase diagramshow little correlation, at least in the glass-formation regions. On the otherhand, a clear correlation can be observed between tCM and eeR. Generally,at a low trioxide content, tCM follows the course of the liquidus temperature.Whereas, however, in all systems the liquidus temperature shows a eutectic,and increases beyond this point as a result of the occurrence of higher mol yb-dates and tungstates, tCM continues to decrease beyond the eutectic composi-tion.
From the high degree of undercooling necessary for nucleation found in thisregion, and the extremely rapid crystallisation once a nucleus has been formed,it can be concluded that in this case not crystal growth, but nucleation is thelimiting step for crystallisation.
At the monomolybdate and monotungstate compositions, monomolybdateand -monotungstate nuclei start crystallisation. The same holds when, forinstance, 10 mole % trioxide is added. The continuing decrease of tCM evenbeyond eutectic composition suggests that in this composition region crystallisa-tion still depends on monomolybdate or monotungstate nuclei.This implies that the melt must contain a considerable amount of MoOl-
and W042- ions.When a melt is cooled, the température region between tCM and tCG forms
the region where crystallisation can occur. All other things being equal, the

- 3]-
chance of by-passing crystallisation increases as the extent ofthe region tCM-tCG
decreases. As mentioned above, a clear correlation exists between tCM and CCR,on the understanding that the composition of minimum tCM generally corre-sponds with that of minimum CCR. The temperature tCG is not independent ofcomposition and shows a tendency to increase with increasing trioxide content.Nevertheless, the variation of tCG with composition does not appear to be asstrong as the corresponding variation of tCM' Therefore, the composition ofminimum tCM (and consequently of minimum CCR) generally will be approxi-mately equal to that of minimum tCM'- tCG, and the correlation between theextent of the region tCM - tCG and the glass-formation tendency, outlined above,is indeed found to exist.
However, when the various systems are compared, the value of tCM- tCGproves to be no quantitative indication of the tendency to glass formation. Forinstance, the minimum tCM - tCG values in the systems Li2Mo04-Mo03,Na2Mo04-Mo03' K2Mo04-Mo03, Cs2Mo04-Mo03 and K2W04-W03 alllie in the range 145-170°C, whereas the minimum CCR values in these 'sys-tems vary widely.The rapid crystal growth observed in the systems once a nucleus has been
created may be an indication of a low melt viscosity. This is supported by Vander Wielen's statement that the viscosity of an alkali-molybdate melt has anorder of magnitude of 1 cP (ref. 2-3).
REFERENCES2-1) R. J. Gelsing, H. N. Stein and J. M. Stevels, Phys. Chem. Glasses 7, 185-190, 1966.2-2) R. J. Gelsing, Klei en Keramiek 17, 183-189, 1967.2-3) J. C. Th. G. M. van der Wielen, H. N. Stein and J. M. Stevels, J. non-cryst,
Solids 1, 18-28, 1968.2-4) G. Tammann and A. Elbräehter, Z. anorg. allgem. Chem. 207, 268-272, 1932.2-5) P. T. Sa rjea n t, Thesis, Pennsylvania, 1967, pp. 8-12.2-6) P. T. Sarjeant and R. Roy, Mat. Res. Bull. 3, 265-280, 1968.2-7) P. T. Sarjeant and R. Roy, J. Am. eeram. Soc. 50, 500-503, 1967.2-8) J. H. Welch, J. sei. Instr. 31, 458-462, 1954.2-9) E. Thilo, C. Wieeker and W. Wiecker, Silikattechnik 15,109-111, 1964.2-10) H. Scholze and K. A. Kumm, Tonind.-Ztg. 90, 559-561, 1966.2-11) A. C. J. Havermans, H. N. Stein and J. M. Stevels, J. non-cryst. Solids 5,66-69,
1970.2-12) M. H. C. Baeten and J. M. Stevels, to be published in Silic. Ind.
- 32-
3. INFRARED SPECTROSCOPY
3.1. Introduction
In sec. 1.4 the infrared-spectrocopic studies of vitreous alkali tungstates andmolybdates, carried out by Gelsing et aP-l.2) and Van der Wielen et aP-3)respectively, were discussed.It was seen that these studies, which form the basis of the glass structure
proposed by these authors, were rather limited with respect to the compositionand frequency ranges covered.
The splat-cooling technique described in sec. 1.2, allowed a considerableextension of the regions of glass formation, especially in the case of the molyb-date systems. Extension of the frequency range is merely a question of instru-mentation.
Apart from those reported by the above authors, no other spectra of alkali-tungstate or -molybdate glasses are known. The majority of the crystallinecompounds in the systems under consideration, however, have been studiedby infrared spectroscopy.
By far the most attention has been paid to the spectra of monomolybdatesand monotungstates. The spectra of the monotungstates were studied in detailby Clark and Doyle 3-4) (4000-250 cm-I), and Caillet and Saumagne 3-5)(2000-70 cm-I). Extensive reports on alkali-monomolybdate spectra werepublished by Clark and Doyle 3-4),. Caillet and Saumagne 3-5), and Van derWielen et al. 3-3) (1700-650 cm-I). Caillet and Saumagne have given a bandassignment for the spectra of the alkali monocompounds examined.
Spectra of crystalline tungstates and molybdates having a higher trioxidecontent have been reported by Dupuis 3-6) (Na2W207' Na2W4013;1670-670 cm-I), Dupuis and Viltange 3-7) (Na2W207, Na2M0207;1.670-300 cm-I), Gelsing 3-2) (ditungstates; 1700-650 cm-I), Van der Wielenet al,3-3) (dimolybdates; 1700-650 cm-I), and Caillet and cooperators 3-8.9.10)(di-, tri- and tetratungstates and -molybdates of Na, K, Rb, Cs, as well as afew Rb and Cs tungstates and molybdates of particularly high trioxide con-tent; 4000-200 cm-I).
Dupuis and Viltange 3-7) have given a band assignment for Na2 W 207 andNa2M0207. This, however, is of little value, as it is based on the incorrectconcept of a crystal structure containing only double tetrahedra.
CailIet and Saumagne 3-10) have given a partial band assignment for a largenumber of compounds, this band assignment, however, being founded on acomparison with the spectra of the arbitrarily chosen compounds W03 andAg2Mo04.
The infrared spectrum of W03 has been studied inter alia by Caillet andSaumagne 3-10) (4000-200 cm-I). Barraclough et al. 3-11) (1100-800 cm-I)and Lipsch 3-12) (1100-400 cm-I) have reported on the spectrum of Mo03.
- 33-
Barraclough et al. have proposed a band assignment for the absorptionmaxima of Mo03 appearing in the frequency region 1000-800 cm-I.
From the spectra of the crystalline alkali tungstates and molybdates aspublished by the authors mentioned above, it is apparent that in the systemsunder study, considerable absorption is found only at wavenumbers lower than1100 cm-I. Important absorption maxima are certainly found in the frequencyregion under 650 cm-I. It is expected that this region will be of similar interestin the case of vitreous tungstates and molybdates.
3.2. Experimental method
Crystalline alkali-tungstate and -molybdate samples were prepared by themethod of melting together alkali carbonate and W03 or Mo03, described insec. 2.1.2. In regions of relatively easy glass formation, vitreous samples weremade on the thermocouple of the Welch apparatus (see sec. 2.2.1). Vitreoussamples having high CCR values were prepared with the aid of the splat-cooling technique.A quantity of 1-2 mg of the sample to be studied was mixed and ground
thoroughly with less than 100 mg dry KBr, and subsequently pressed into athin disc (thickness not more than 0·5 mm).All spectra were measured by the double-beam technique. The frequency
region 1200-700 cm-1 was covered with a Hilger and Watts H 800 spectro-photometer, and the frequency region 700-300 cm-1 with a Hitachi ModeEPI-Li grating spectrometer.KBr is excellently infrared-transmissive at wavenumbers higher than
400 cm-I. It can, however, be used down to 300 cm- \ if sufficiently thin discsare employed 3-13).
3.3. Infrared spectra of alkali tungstates
3.3.1. Crystalline alkali tungstatesBefore discussion of infrared spectra of crystalline alkali tungstates is under-
taken, a few remarks, which will also apply to the spectra discussed in sub-sequent sections, must be made. Not all spectra measured are shown in thevarious figures. These figures, however, give a good impression of the resultsobtained. The spectra not included would not introduce new elements into thediscussion.In each case a number of spectra is shown at constant alkali species but'
varying trioxide content. For this purpose, the systems having the highestglass-formation tendencies (Na2W04-W03 and Li2Mo04-Mo03) wereselected.In addition to this, spectra are given at approximately constant trioxide
content, but with varying alkali species. In the case of the tungstates the com-
- 34-
position of 70 mole % W03 was selected, whereas in that of the molybdates60 and 90 mole% Mo03 were chosen.The figures are arranged in such a way that comparisons are possible between
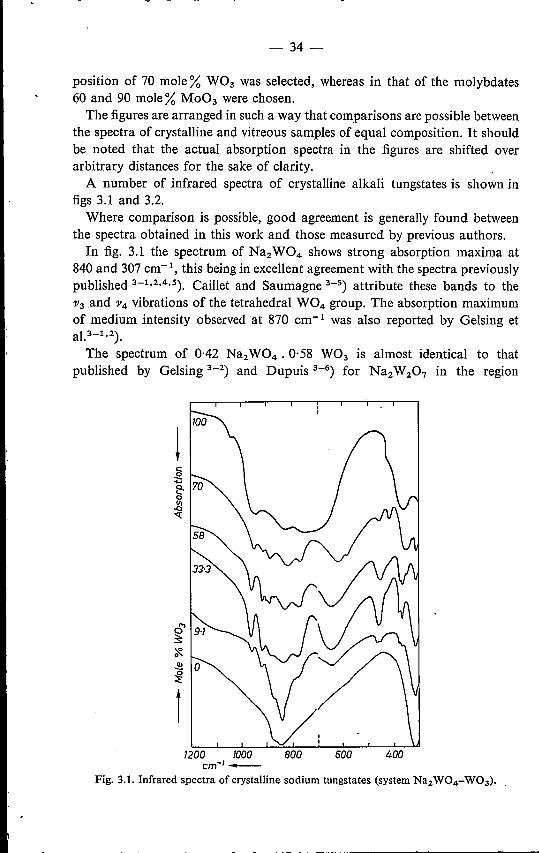
the spectra of crystalline and vitreous samples of equal composition. It shouldbe noted that the actual absorption spectra in the figures are shifted overarbitrary distances for the sake of clarity.A number of infrared spectra of crystalline alkali tungstates is shown in
figs 3.1 and 3.2.Where comparison is possible, good agreement is generally found between
the spectra obtained in this work and those measured by previous authors.In fig. 3.1 the spectrum of Na2W04 shows strong absorption maxima at
840 and 307 cm-i, this being in excellent agreement with the spectra previouslypublished 3-1.2,4.5). Caillet and Saumagne 3-5) attribute these bands to the')I3.and ')14vibrations of the tetrahedral W04 group. The absorption maximumof medium intensity observed at 870 cm-1 was also reported by Gelsing etaP-1.2).The spectrum of 0·42 Na2W04 . 0·58 W03 is almost identical to that
published by Gelsing 3_2) and Dupuis 3-6) for Na2W207 in the region
!
1200 1000cm-I-
600
Fig. 3.1. Infrared spectra of crystalline sodium tungstates (system Na2W04-W03).

intermediatecompositions x x x x x x
- 35:_
1200-650 cm-I, and, over the complete frequency range measured, showsgood agreement with the Na2W207 spectrum reported by Caillet andSaumagne 3-10). The spectrum of 0·30 Na2W04 . 0·70 W03 is in excellentcorrespondence with the Na2W4013 spectrum published by the latter authors.Likewise, the W03 spectrum of these is confirmed by our results, with theexception of a few bands of minor importance.The spectra shown in fig. 3.1 are found to be highly dependent on W03
content. Addition of9·1 mole % W03 to Na2W04 already raises considerablythe number of bands which can be observed in the spectrum. Special attentionshould be paid to the absorption maximum occurring at 640-610 cm-I, asthis is neither shown by Na2W04 nor by W03.The same holds for the band found in the frequency region 460-410 cm-1.
All compositions except Na2W04 have, furthermore, an absorption band at960-940 cm". And finally strong absorption is shown by all compositions inthe 840-820 and 400-300 cm-1 regions.The main absorptions found in the spectra of crystalline sodium tungstates
and W03 are summarised in table 3-1.Turning to fig. 3.2, the spectrum of 0·30 K2W04 . 0·70 W03 is found to
show good agreement with the K2W4013 spectrum measured by Caillet andSaumagne 3-10). Agreement with the spectrum of the latter compound whichcontains 75 mole % W03 is far better than with the spectrum of K2W3010'containing 67 mole % W03. Figure 3.2 shows that the infrared spectrum ofcrystalline alkali tungstates clearly depends on the alkali species present, at
TABLE 3-1
Main infrared absorption regions of crystalline sodium tungstates and W03;X denotes the presence of strong absorption;- denotes the absence of strong absorption."Intermediate compositions" relates to sodium tungstates included in fig. 3.1having a W03 content of 9'1, 33,3, 58 and 70 mole % respectively
composition frequency region (cm-1)
960-940 840-820 780-760 640-610 460-410 400-300
x X
x x X x x

- 36-
!c:se-~1----_"{
7200 7000 800 600 40()cm-I-
Fig. 3.2. Infrared spectra of crystalline alkali tungstates at 70 mole% W03•
least at the composition 70 mole% W03• All four spectra presented in thefigure show a great number of absorption bands without having much in com-mon.
Our spectroscopie study of crystalline alkali tungstates confirms, therefore,the conclusions drawn by Gelsing et aP-l.2) on the basis of more limitedinformation, viz. that the infrared spectra of these systems are strongly affectedby variation either of W03 content or of alkali species present. These con-clusions, for that matter, will not come as a surprise, since it can be derivedfrom the data given in sec. 1.3 that the structures and stabilities of the com-pounds found in alkali-tungstate systems vary widely with composition.
3.3.2. Vitreous alkali tungstates
Figures 3.3and 3.4 show the spectra of a number of vitreous alkali tungstates.These spectra are in excellent agreement with those reported by Gelsing etal.3-1.2) in the frequency region 1200-659 cm-I. The tungstate glasses exhibitstrong absorption at 880-850 cm-I, whilst a band of medium intensity is foundat 950-930 cm-I. Gelsing's conclusion that spectra of vitreous tungstateshardly depend on W03 content and nature of the alkali ions, is confirmed.(It should, however, be pointed out that in fig. 3.4 the absorption maximumobserved at 945 cm-1 is more pronounced in the order Na - K - Rb - CsThe same applies to the spectra of the corresponding crystalline tungstates.)In the frequency region 650-300 cm-I, not measured by Gelsing et al., the

1200 1000cm-'-
800 600 400
- 37-
1200 1000cm-'-
Fig. 3.3. Infrared spectra of vitreous sodium tungstates (system Na2W04-W03).. .
800 600 400
Fig. 3.4. Infrared spectra of vitreous alkali tungstates at 70 mole % W03•
spectra show two additional absorption bands, viz. at 650-600 cm-I and at355-320 cm-I. The composition 0·67 Na2W04' 0·33 W03 shows an extraabsorption maximum at 485 cm-1. From comparison of the spectra of tungstateglasses with the Na2W04 spectrum (other monotungstates having nearlyidentical spectra 3-1,2,3,4)), it is seen that, in the glass spectra, the two mostimportant bands of the monotungstate spectrum are observed, though dis-placed to some extent. At the same time, however, it is obvious that strong

- 38-
absorption is also found in frequency regions where absorption in the mono-. tungstate spectrum is absent.
Therefore, the similarity between the spectra ofvitreous tungstates and mono-tungstates forms too small a basis for the conclusion that the coordination ofthe W atom is identical in both cases, i.e. tetrahedral (as was assumed byGelsing et al., cf. sec. 1.4).This does not mean, however, that the structure proposed by Gelsing et al.
cannot be correct. According to this structure the glass contains a mixture ofchains of W04' tetrahedra, which implies that in the glass a bond is foundwhich is not present in the monotungstate structure, viz. the W-O-W bond.Obviously, this bond will give rise to additional absorption maxima.In the analogous case of the crystalline potassium chromates the infrared
spectrum is essentially changed by the creation of double tetrahedra. K2Cr04(containing isolated Cr042- tetrahedra) shows only one region of strong ab-sorption in the frequency range 1200-300 cm-I, viz. at 885-855 cm-1• Thedichromate K2Cr207 (containing double tetrahedra) absorbs strongly at966-885 cm-1 and at 796-764 cm-I, whilst a few bands of lower intensity arefound at lower wavenumbers 3-14.15). Stammreich et aP-14) attribute theband at 796-764 cm-1 and those at lower frequencies to vibrations of theCr-O-Cr bond. Therefore, if a structure consisting exclusively of W04 tetra-hedra existed, then, in addition to the monotungstate bands, new absorptions,the number and character of which would depend on the symmetry propertiesof the polytungstate chains, would arise.The aspect of the spectra of vitreous tungstates might also be accounted for
by a dissociation according to the views of Kordes and Nolte 3-16,17) (cf. sec.1.4), who assume Na2W207 to undergo dissociation by the reaction
Na2W207 -)- 2 Na+ +W042- +W03.
The spectrum of a tungstate glass should then correspond to that of a mixtureof monotungstate, W03 and (when the dissociation is not complete) poly-tungstate, accompanied by a band-broadening effect caused by the absence oflong-range order.
To examine this possibility, we will "synthesize" the spectrum of vitreousNa2W207 from the spectra of crystalline Na2W04 (I), Na2W207 (H) andW03 (HI).
For convenience the spectrum of crystalline Na2W207 is assumed to beidentical with that of 0·42 Na2W04. 0·58 W03 (cf. sec.3.3.l, where it waspointed out that the spectrum of the latter composition shows excellent agree-ment with that of Na2W207 as published by previous authors).In order to obtain "mixed spectra" the spectra of crystalline I, H and III
were shifted with respect to each other to the extent that the maximum absorp-tions observed in these spectra were caused to lie at the same value. After this
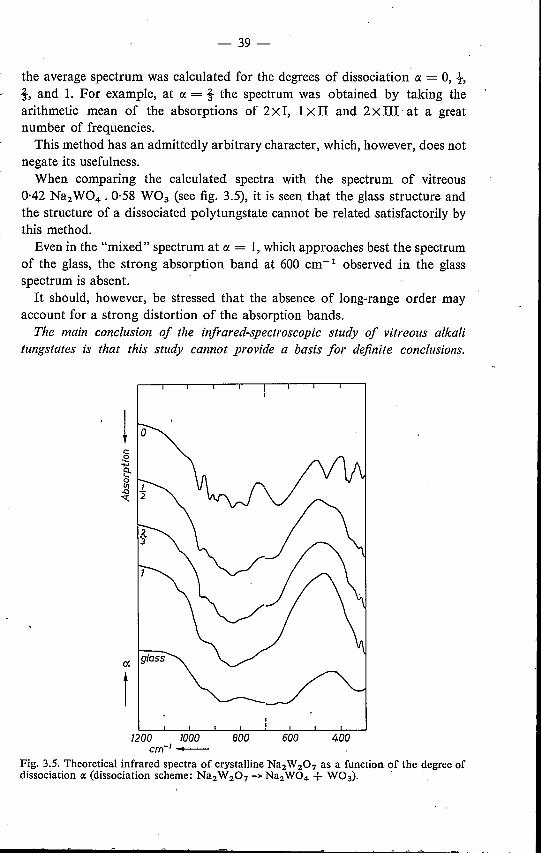
- 39-
the average spectrum was calculated for the degrees of dissociation ct = 0, ·ht, and 1. For example, at ct = t the spectrum was obtained by taking thearithmetic mean of the absorptions of 2X I, 1X II and 2X III at a greatnumber of frequencies.This method has an admittedly arbitrary character, which, however, does not
negate its usefulness.When comparing the calculated spectra with the spectrum of vitreous
0·42 Na2W04 • 0·58 W03 (see fig. 3.5), it is seen that the glass structure andthe structure of a dissociated polytungstate cannot be related satisfactorily bythis method.Even in the "mixed" spectrum at ct = 1,which approaches best the spectrum
of the glass, the strong absorption band at 600 cm'"! observed in the glassspectrum is absent.It should, however, be stressed that the absence of long-range order may
account for a strong distortion of the absorption bands.The main conclusion of the infrared-spectroscopie study of vitreous alkali
tungstates is that this study cannot provide a basis for definite conclusions.
t7200 7000
cm-I-Fig. 3.5. Theoretical infrared spectra of crystalline Na2W207 as a function of the degree ofdissociation oe(dissociation scheme: Na2 W207 -+ Na2W04 + W03).

- 40 .:;
However, the great similarity observed between the spectra may be an indicationof a great similarity between the .structures of tungstate glasses of varyingcomposition. For this, both a structure according to the ideas of Gelsinget aP-1.Z), and a structure according to those of Kordes and Nolte 3":'16.17)can be responsible.
3.4. Infrared spectra of alkali molybdates
3.4.1. Crystalline alkali molybdates
Infrared spectra of a number of crystalline molybdates are shown in figs 3.6,3.7 and 3.8.
In the frequency region 1200-650 cm-1 the spectrum of LizMo04 (fig. 3.6)shows good agreement with the LizMo04 spectra reported before 3-3.4). Inthe region 650-300 cm"! a few differences with respect to Clark and Doyle'sspectrum are observed, presumably as a result of higher resolution demonstratedby our spectrum.
The spectrum of 0·60 LizMo04 • 0·40 Mo03 is similar to that of LizMoz07measured by Van der Wielen et al. in the region 1200-650 cm-1• And, finally,
1200 1000cm-I-
800 600 400
Fig. 3.6. Infrared spectra of crystalline lithium molybdates (system LizMo04-Mo03).

-41-
1200 1000 800 600 400cm-'-
Fig. 3.7. Infrared spectra of crystalline alkali molybdates at 60 mole% Mo03 (potassiummolybdate at 65 mole % Mo03).
the Mo03 spectrum in fig. 3.6 is identical to that reported by Lipsch 3-12)
for the frequency region 1200-400 cm-1• -
It is seen from fig. 3.6 that crystalline alkali molybdates, like the corre-sponding tungstates, possess infrared spectra which are strongly dependent ontrioxide content.In fig. 3.7 the spectrum of 0·35 K2Mo04• 0·65 Mo03 shows excellent
agreement with that of K2M03010 (containing 67mole % Mo03) as publishedby Caillet and Saumagne 3-10). Likewise, our spectra of 0·40 Rb2Mo04 •
. 0·60 Mo03 and 0·40 Cs2Mo04• 0·60 Mo03 strongly resemble those of thetrimolybdates.A striking mutual similarity is observed in the spectra of K, Rb and Cs
molybdates. This may be explained by the fact that K, Rb and Cs trimolyb-dates exist and are isomorphous (see sec. 1.3), whereas in the Na-molybdatesystem no trimolybdate is formed.The congruently melting phase Li2M03010, reported by Van dei Wielen et
al. (see fig. 1.2a) either is not formed during crystallisation from the melt, orhas a structure essentially different from that of K2Mo3010•

-42-
1200 1000cm-'-
800 500 400
Fig. 3.8. Infrared spectra of crystalline alkali molybdates at 90 mole % Mo03•
The spectra ofO·10 Rb2Mo04. 0·90 Mo03 and 0·10 Cs2Mo04. 0·90Mo03(fig. 3.8) show excellent agreement with the spectra of Rb2M09028 andCs2M09028 (89 mole % Mo03) respectively, measured by Salmon andCaillet 3-9). Again, Rb- and Cs-molybdate spectra show a strong similarity,whereas equally strong dissimilarities are observed with respect to the spectraof 0·10 Na2Mo04. 0·90 Mo03 and 0·10 Li2Mo04 . 0·90 Mo03. The lattertwo spectra already resemble the spectrum of pure Mo03, due to the factthat no compounds Na2M09028 and Li2M09028 exist (see figs 1.2a and 1.2b).The molybdates of highest Mo03 content formed in the Na2Mo04-Mo03and Li2Mo04-Mo03 systems are the tetramolybdates, containing 75 mol%Mo03•
3.4.2. Vitreous alkali molybdates
Spectra of a number of vitreous alkali molybdates are presented in figs 3.9,3.10 and 3.11.
Comparing our spectra with those of the 6 vitreous molybdates publishedby Van der Wielen et aP-3), we observe good agreement in the frequencyregio~ 1200-650 cm-1 between our spectrum of 0·60 Li2Mo04 . 0·40 Mo03
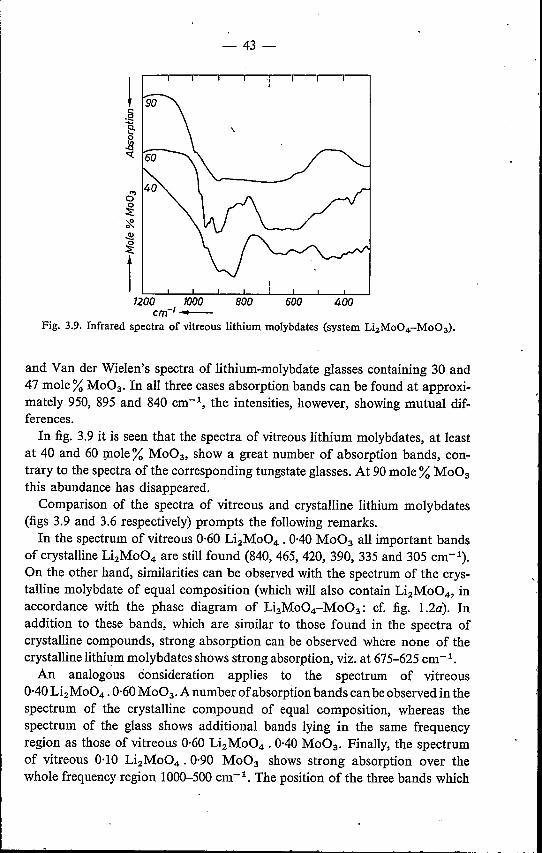
-43 -
B~it.~
iL____I_--l.,__...J.___J_--,--_'_.L__1.__1200 1000 800 600 400
cm-I-Fig. 3.9. Infrared spectra of vitreous lithium molybdates (system Li2Mo04-Mo03).
and Van der Wielen's spectra of lithium-molybdate glasses containing 30 and47 mole % Mo03• In all three cases absorption bands can be found at approxi-mately 950, 895 and 840 cm=", the intensities, however, showing mutual dif-ferences.In fig. 3.9 it is seen that the spectra of vitreous lithium molybdates, at least
at 40 and 60 mole % Mo03, show a great number of absorption bands, con-trary to the spectra of the corresponding tungstate glasses. At 90 mole %Mo03this abundance has disappeared.
Comparison of the spectra of vitreous and crystalline lithium molybdates(figs 3.9 and 3.6 respectively) prompts the following remarks.In the spectrum of vitreous 0·60 Li2Mo04 • 0·40 Mo03 all important bands
of crystalline Li2Mo04 are still found (840, 465, 420, 390, 335 and 305 cm=").On the other hand, similarities can be observed with the spectrum of the crys-talline molybdate of equal composition (which will also contain Li2Mo04, inaccordance with the phase diagram of Li2Mo04-Mo03: cf. fig. 1.2a). Inaddition to these bands, which are similar to those found in the spectra ofcrystalline compounds, strong absorption can be observed where none of thecrystalline lithium molybdates shows strong absorption, viz. at 675-625 cm=",An analogous consideration applies to the spectrum of vitreous
0·40 Li2Mo04 •0·60 Mo03• A number of absorption bands can be observed in thespectrum of the crystalline compound of equal composition, whereas thespectrum of the glass shows additional bands lying in the same frequencyregion as those of vitreous 0·60 Li2Mo04 • 0·40 Mo03• Finally, the spectrumof vitreous 0·10 Li2Mo04• 0·90 Mo03 shows strong absorption over thewhole frequency region 1000-500 cm=", The position ofthe three bands which
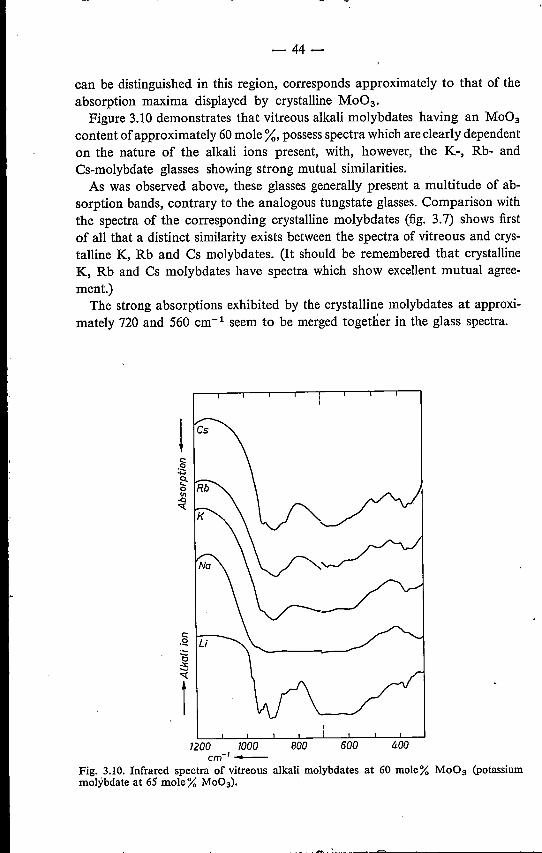
-44-
can be distinguished in this region, corresponds approximately to that of theabsorption maxima displayed by crystalline Mo03•
Figure 3.10 demonstrates that vitreous alkali molybdates having an Mo03content of approximately 60 mole %, possess spectra which are clearly dependenton the nature of the alkali ions present, with, however, the K-, Rb- andCs-molybdate glasses showing strong mutual similarities.As was observed above, these glasses generally present a multitude of ab-
sorption bands, contrary to the analogous tungstate glasses. Comparison withthe spectra of the corresponding crystalline molybdates (fig. 3.7) shows firstof all that a distinct similarity exists between the spectra of vitreous and crys-talline K, Rb and Cs molybdates. (It should be remembered that crystallineK, Rb and Cs molybdates have spectra which show excellent mutual agree-ment.)
The strong absorptions exhibited by the crystalline molybdates at approxi-mately 720 and 560 cm"! seem to be merged together in the glass spectra.
!
.§
7200 7000 800 600 400cm-I-
Fig. 3.10. Infrared spectra of vitreous alkali molybdates at 60 mole% Mo03 (potassiummolybdate at 65 mole % Mo03).

-45 -
The resemblance between the-spectra of vitreous 0·40 Na2Mo04• 0·60Mo03 and 0·40 Li2Mo04 • 0·60 Mo03 and those of the corresponding crys-talline molybdate is less easily seen, although the spectrum of the sodium-molybdates glass may be considered to have originated from a rigorousbroadening of the many bands observed in the spectrum of the crystallinemolybdate. '
Figure 3.11 demonstrates that the spectrum of molybdate glasses at 90 mole %Mo03 hardly depends on the nature of the alkali ions, contrary to the spectraof the corresponding crystalline molybdates (see fig. 3.8). This suggests thatthe structures of the alkali-molybdate glasses at high Mo03 content aresimilar.An explanation for this may be the structure proposed in sec. 2.1.3: addition
of alkali oxide to pure Mo03 raises the number of non-bridging oxygens bythe breaking of bridges between two octahedra; the number of bonds involvingthree octahedra remains constant; by this mechanism the Mo03 layers are"cleft" .From the above discussion of infrared spectra of vitreous alkali molybdates
it is seen that these spectra(a) are dependent on Mo03 content;(b) are dependent on the nature of the alkali ions present, provided that the
Mo03 content is not very high;(c) show similarities with the spectra of the corresponding crystalline molyb-
dates;
Fig. 3.11. Infrared spectra of vitreous alkali molybdates at 90 mole% Mo03•

-46 -'-
(d) show, however, additional absorption bands not observed in the latterspectra.
It appears to be impossible to account for these phenomena by a glass structureconsisting exclusively of chains of tetrahedra, even if these are assumed to bestrongly distorted 3-3) (see sec. 1.4). In that case, the mutual similarities be-tween the spectra of the ;'itreous molybdates would undoubtedly be greaterthan they are now. The similarities between the spectra of the glasses andthose of the corresponding crystalline molybdates, however, suggest that evenin the vitreous state, complex anions are found built up by tetrahedra as weUas octahedra, probably forming chains, as is the case with the crystalline poly-molybdates.Naturally, within the limits of this structure some variation is possible. For
example, the average chain length of the polymolybdate anion may decreaseon melting. In association therewith, the average coordination number of theMo atoms may change, as for reasons of stoichiometry there is a correlationbetween the average coordination number and the dimensions of the complexanions.Again, it should be stressed that definite conclusions cannot easily be drawn
on the basis of an infrared-spectroscopie study.
RFFERENCES3-1) R. J. H. Gelsing, H. N. Stein and J. M. Stevels, Phys. chem. Glasses 7, 185-190,
1966. '3-2) R. J. H. Gelsing, Klei en Keramiek 17, 183-189, 1967.3-3) J. C. Th. G. M. van der Wielen, H. N. Stein and J. M. Stevels, J. non-cryst.
Solids 1, 18-28, 1968.3-4) G. M. Clark and W. P. Doyle, Spectrochim. Acta 22, 1441-1447, 1966.3-S) P. CailIet and P. Saumagne, J. mol. Struct. 4, 191-201, 1969.3-6) T. Dupuis, Mikrochim. Acta 214-222, 1963.3-7) T. Dupuis and M. Viltange, Mikrochim. Acta 232-238, 1963.3-8) P. CailIet, C.R. Acad. Sci. Paris 256, 1968-1989, 1963.3-9) R. Salmon and P. CailIet, Bull. Soc. chim. 1569-1573, 1969.3-10) P. Caillet and P. Saumagne, J. mol. Struct. 4, 351-359, 1969.3-11) C. G. Barraclough, J. Lewis and R. S. Nyh o lrn, J. chem, Soc. 3552-3555, 1959.3-12) J. M. J. G. Lipsc h, Thesis, Eindhoven, 1968, p. 29.3-13) J. Derkosch, Absorptionsspektralanalyse, Akademische Verlagsgesellschaft, Frank-
furt, 1967, p. 60.3-14) H. Stammreich, D. Bassi, O. Sala and H. Sieb er t, Spectrochim. Acta 13,192-196,
1958.3-1S) J. A. Camp bell, Spectrochim. Acta 21, 1333-1343, 1965.3-16) G. Nolte, Thesis, Bonn, 1967.3-17) E. Kordes and G. Nolte, Z. anorg. allgem. Chem. 371,156-171,1969.
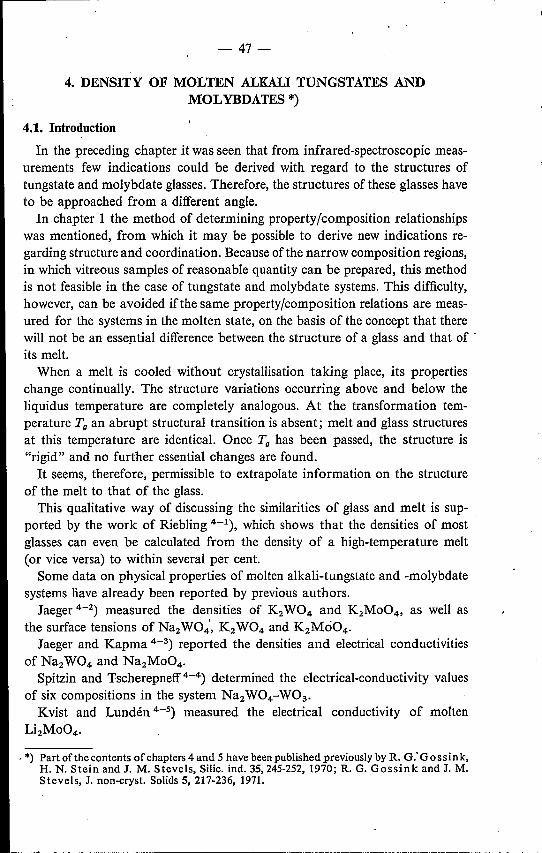
-47-
4. DENSITY OF MOLTEN ALKALI TUNGSTATES ANDMOL YBDATES *)
4.1. Introduetion
In the preceding chapter it was seen that from infrared-spectroscopic meas-urements few indications could be derived with regard to the structures oftungstate and molybdate glasses. Therefore, the structures of these glasses haveto be approached from a different angle.In chapter 1 the method of determining property/composition relationships
was mentioned, from which it may be possible to derive new indications re-garding structure and coordination. Because of the narrow composition regions,in which vitreous samples of reasonable quantity can be prepared, this methodis not feasible in the case of tungstate and molybdate systems. This difficulty,however, can be avoided ifthe same property/composition relations are meas-ured for the systems in the molten state, on the basis of the concept that therewill not be an essential difference between the structure of a glass and that of .its melt.When a melt is cooled without crystallisation taking place, its properties
change continually. The structure variations occurring above and below theliquidus temperature are completely analogous. At the transformation tem-perature Tg an abrupt structural transition is absent; melt and glass structuresat this temperature are identical. Once Tg has been passed, the structure is"rigid" and no further essential changes are found.It seems, therefore, permissible to extrapolate information on the structure
of the melt to that of the glass.This qualitative way of discussing the similarities of glass and melt is sup-
ported by the work of Riebling 4-1), which shows that the densities of mostglasses can even be calculated from the density of a high-temperature melt(or vice versa) to within several per cent.
Some data on physical properties of molten alkali-tungstate and -molybdatesystems liave already been reported by previous authors.Jaeger 4-2) measured the densities of K2W04 and K2Mo04, as well as
the surface tensions of Na2W04', K2W04 and K2Mo04•Jaeger and Kapma 4-3) reported the densities and electrical conductivities
of Na2W04 and Na2Mo04•Spitzin and Tscherepneff 4-4) determined the electrical-conductivity values
of six compositions in the system Na2WOCW03•Kvist and Lundén 4-5) measured the electrical conductivity of molten
Li2Mo04•
. *) Part ofthe contents of chapters 4 and 5 have been published previously by R. G:Gossink,H. N. Stein and J. M. Stevels, Silic. indo 35,245-252, 1970; R. G. Gossink and J. M.Stevels, J. non-cryst. Solids 5, 217-236, 1971.

- 48-
An extensive study of density and electrical conductivity in molten alkali-molybdate and alkali-tungstate systems, the alkali metal being Li, Na or K,has been published by Morris and cooperators 4-6,7,8). However, on the basisof their data it is not always possible to obtain reliable isotherms, as the indi-vidual temperature ranges valid for the compositions measured in many casesdo not sufficiently overlap. Their only thorough discussion of results concernsthe electrical-conductivity values of Li- and K-molybdate systems4-7), and isbased on conductivity/composition relationships at 100 oe above the liquidus.It will not come as a surprise that maxima and minima observed in these con-ductivity/composition graphs correspond to melting points and eutectics inthe phase diagrams. It is, however, doubtful whether conclusions drawn fromthis kind of relationship have any real significanee with regard to the structureof the melt.The density measurements on Li, Na and K molybdates carried out by Van
der Wielen et al. have already been mentioned in sec. 1.4. It should be notedthat the results of Van der Wielen's measurements have been published onlyin part 4-9,10). From their results, Van der Wielen et al. calculated the de-partures between ideal and actual density values at 920 oe. It was concludedthat actual density values were relatively low in regions of optimal glass for-mation, involving a relatively spacious structure in the vitreous state. Van derWielen et al. considered this to be an indication of a structure comprisingchains of tetrahedra which have undergone disproportionation, as in theiropinion this structure would require more space than a structure consistingof large groups also containing octahedra.
Our own investigations concern the determination of density, surface-tensionand viscosity values. Like Morris and cooperators and Van der Wielen et al.,we have restricted ourselves to systems containing Li, Na or K.In addition to those of the binary alkali-tungstate and -molybdate systems,
we have measured the properties of a few mixed-alkali and mixed-molyb-date-tungstate systems, viz. the systems
Na2W207-K2 W207;Na2W207-Na2M0207;
Na2M0207-K2M0207 ;K2W207-K2M0207'
In the present chapter density measurements on molten alkali-tungstate systemswill be described, and the results will be compared with Van der Wielen's dataon the corresponding molybdate systems.
Surface-tension measurements will be described in chapter 5, and the deter-mination of viscosities in chapter 6.
4.2. Experimental method
Alkali tungstates were prepared from alkali carbonates and W03 Dy themethod described in sec. 2.1.2.

-49 -
Densities 'were measured by Mackenzie's method 4-11) using the apparatusof Van der Wielen et a1.4-9) (see fig. 4.1). This method involves the deter-mination of the buoyancy exerted on a platinum bob on submersion in themelt.The melt was contained in a cylindrical Pt/Rh-alloy crucible having a diam-
eter of 3 cm and a height of 5 cm. This crucible was placed in an electricfurnace.The volume of the cylindrical Pt bob at 0 oe was Vo = 1·4607cm", It was
corrected for thermal expansion by the formula
Vt = Vo (1 + 0·269631 . 10-4 t + 0.34379.10-8 t2 + 0.4062.10-12 t3),
where Vt is the volume (cm") of the bob at tand t is the temperature COc),which was calculated from the linear-expansion formula of Esser and Euster-broek 4-12).
Density measurements with the aid of the above method may be influencedby the effect of surface tension exerted by the melt on the suspension wire(Pt/Rh-alloy wire; diameter 0·2 mm). To eliminate this difficulty completely,either the surface-tension effect has to be calculated by means of a formuladerived by Shartsis and Spinner 4-13), or two bobs of different sizes must beused.
Balance
I----tl--- Quartz-glasstube
1---1-1--- Elevatingt.====~===.J mechanism
Fig. 4.1. Apparatus for the determination of melt densities.

- 50-
In employing the latter approach, Van der Wielen et a1.4-9) found thatsignificant surface-tension effects were absent for the apparatus used and thesystems investigated. Further, Riebling 4-11) observed little difference between
l
densities calculated by the method of two bobs, and uncorrected single-bobdata using a bob of 1·6 cm", And, finally, calculation of the surface-tensioneffect for an "average" case (the density of.0·70 Na2W04 • 0·30 W03 at950°C) using the formula of Shartsis and Spinner 4-13), showed that an errorof 0·07% was made when the effect of surface tension was not taken intoaccount.Putting all this together, it was decided to neglect the effect of surface ten-
sion on the suspension wire.Temperatures were measured in the melt with a calibrated thermocouple
(pt-Pt/IO %Rh).The density of each sample was determined at 5-10 different temperatures,
the temperature range covered being at least 150 oe.The accuracy of the measurements is estimated to be ± 0·5%.
4.3. Binary alkali tungstates; a comparison with alkali molybdates
4.3.1. ResultsFor all compositions measured the relation between density and temperature
can be represented satisfactorily by the linear equation
(! = a- b t,
where (! is the density (g cm-3), a and b are constants (> 0), and t is thetemperature (0C).Values of a and b obtained by the method of least-squares minimisingI:(L1(!)2, as well as the standard deviations of estimate of the least-squareslines *) are included in table 4-1. This table also contains the values of thedensity at 950 oe «(!950), the molar volume at 950°C (V950), the thermal-expansion coefficient at 950 oe (1X950 = [(I/v) dv/dt]950), as. well as the tem-perature ranges for which the equations are valid.
Comparison of our values of (!950 for the monotungstates with those ob-tained by Jaeger 4-2), Jaeger and Kapma 4-3), and Morris and Robinson 4-7)
*) The standard deviation of estimate s(ê) is the square root of the variance of estimate asdefined by Volk 4-15):
s(ê) = 1/ (e -ê)2 ,Y 11-2
where ê is the density according to least-squares line, e the density measured, and 11 thenumber of measuring points.
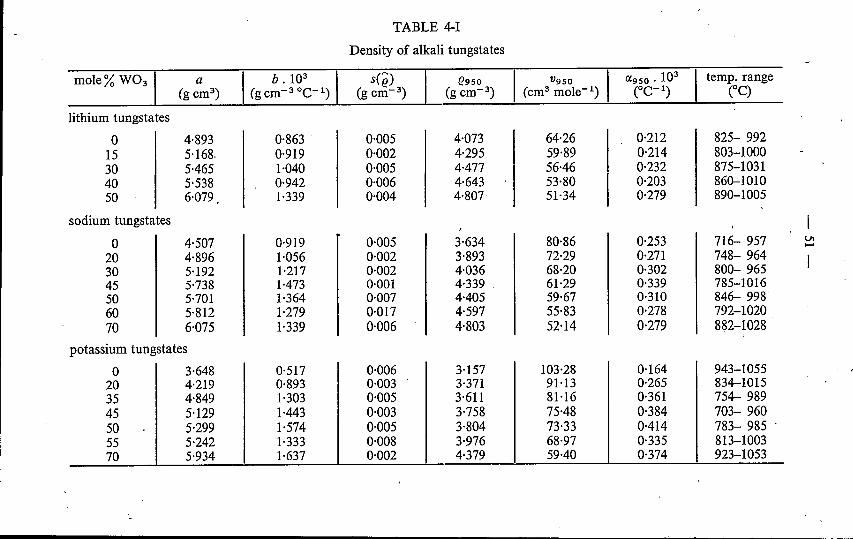
TABLE 4-1
Density of alkali tungstates
mole% W031 a Ib.l03 I s(ê) (;>950 V950 I CX950 • 103 I temp. range(g cm") . (gem-3°C-I) . (g cm-3) (g cm-3) (cm" mole>') COC-I) COC)
lithium tungstates
0 4·893 0·863 0·005 4·073 64·26 0·212 825- 99215 5·168. 0·919 0·002 4·295 59·89 0·214 803-100030 5·465 1·040 0·005 4·477 56·46 0·232 875-103140 5·538 0·942 0·006 4·643 53·80 I 0·203 860--101050 6·079 1·339 0·004 4·807 51·34 0·279 890--1005
sodium tungstates
0 4·507 0·919 0·005 3·634 80·86 0·253 716- 957 UII-'
20 4·896 1·056 0·002 3·893 72·29 0·271 748- 96430 5·192 1·217 0·002 4·036 68·20 0·302 800- 96545 5·738 1·473 0·001 4·339 61·29 0·339 785-101650 5·701 1·364 0·007 4·405 59·67 0·310 846- 99860 5·812 1·279 0·017 4·597 55·83 0·278 792-102070 6·075 1·339 0·006 4·803 52·14 0·279 882-1028
potassium tungstates
0 3·648 0·517 0·006 3·157 103·28 0·164 943-105520 4·219 0·893 0·003 3·371 91·13 0·265 834--101535 4·849 1·303 0·005 3·611 81·16 0'361 754- 98945 5·129 1·443 0·003 3·758 75·48 0·384 703- 96050 5·299 1·574 0·005 3·804 73·33 0-414 783- 985 .55 5·242 1·333 0·008 3·976 68·97 0·335 813-100370 5·934 1·637 0·002 4·379 59·40 0·374 923-1053
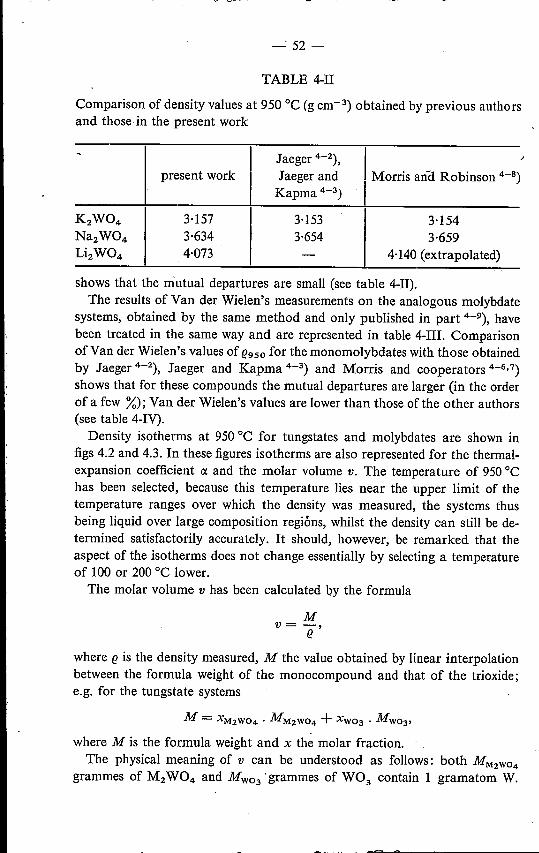
-<52-
TABLE 4-II
Comparison of density values at 950°C (g cm-3) obtained by previous authorsand those in the present work
~ Jaeger 4-2), I -'. pre_s_en_t__w_o_r_k__~ __J_a_e_g_e_r_a_n_d__-4_11__0_r_ri_s_a_n-_a_R__o_b_in_s_o_n_4_-~8)._ Kapma 4-3)
K2W04 3·157Na2W04 3·634Li2W04 4·073
3·1543·659
4·140 (extrapolated)
3·1533·654
shows that the mutual departures are small (see table 4-II).The results of Van der Wielen's measurements on the analogous molybdate
systems, obtained by the same method and only published in part 4-9), havebeen treated in the same way and are represented in table 4-III. Comparisonof Van der Wielen's values of e950 for the monomolybdates with those obtainedby Jaeger 4-2), Jaeger and Kapma 4-3) and Morris and cooperators 4-6,7)shows that for these compounds the mutual departures are larger (in the orderof a few %); Van der Wielen's values are lower than those of the other authors(see table 4-IV).Density isotherms at 950°C for tungstates and molybdates are shown in
figs 4.2 and 4.3. In these figures isotherms are also represented for the thermal-expansion coefficient ct and the molar volume v. The temperature of 950°Chas been selected, because this temperature lies near the upper limit of thetemperature ranges over which the density was measured, the systems thusbeing liquid over large composition regions, whilst the density can still be de-termined satisfactorily accurately. It should, however, be remarked that theaspect of the isotherms does not change essentially by selecting a temperatureof 100 or 200°C lower.The molar volume v has been calculated QYthe formula
Mv= -,ewhere e is the density measured, M the value obtained by linear interpolationbetween the formula weight of the monocompound and that of the trioxide;e.g. for the tungstate systems
where M is the formula weight and x the molar fraction.The physical meaning of v can be understood as follows: both MM2W04
grammes of M2W04 and MW03 .grammes of W03 contain 1 gramatom W.
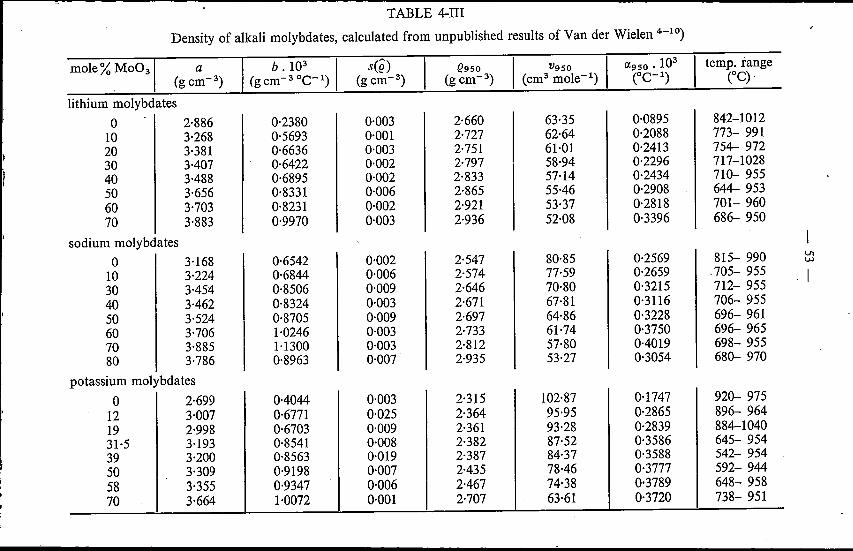
TABLE 4-I11
Density of alkali molybdates, calculated from unpublished results of Van der Wielen 4-10)
mole%Mo03I a b.l03 I s(ê) I e950 I V950 I 0(950 • 103 I temp. range(g cm:") (gcm-3 Oe-I) (g cm-3) (g cm:") (cm? mole>') COC-I) COC)
lithium molybdates0 2·886 0·2380 0·003 2·660 63·35 0·0895 842-1012
10 3·268 0·5693 0·001 2·727 62·64 0·2088 773- 99120 3·381 0·6636 0·003 2·751 61·01 0·2413 754- 97230 3·407 0·6422 0·002 2·797 58·94 0·2296 717-102840 3·488 0·6895 0·002 2·833 57·14 0·2434 710- 95550 3·656 0·8331 0·006 2·865 55·46 0·2908 644- 953
60 3·703 0·8231 0·002 2·921 53·37 0·2818 701- 960
70 3·883 0·9970 0·003 2·936 52·08 0·3396 686- 950
sodium molybdates0 3·168 0·6542 0·002 2·547 80·85 0·2569 815- 990 VI
VJ
10 3·224 0·6844 0·006 2'574 77·59 0·2659 -705- 955 . I30 3·454 0·8506 0·009 2·646 70·80 0·3215 712- 955
40 3·462 0·8324 0·003 2·671 67·81 0·3116 706- 955
50 3·524 0·8705 0·009 2·697 64·86 0·3228 696- 96160 3·706 1·0246 0·003 2·733 61·74 0·3750 696- 96570 3·885 1·1300 0·003 2·812 57·80 0·4019 698- 95580 3·786 0·8963 0·007 2·935 53·27 0·3054 680- 970
potassium molybdates0 2·699 0·4044 0·003 2·315 102·87 0·1747 920- 975
12 3·007 0·6771 0·025 2·364 95·95 0·2865 896- 96419 2·998 0·6703 0·009 2·361 93·28 0·2839 884-104031·5 3·193 0·8541 0·008 2·382 87'52 0·3586 645- 95439 3·200 0·8563 0·019 2·387 84·37 0·3588 542- 95450 3·309 0·9198 0·007 2·435 78·46 0·3777 592- 944
58 3·355 0·9347 0·006 2-467 74·38 0·3789 648- 958
70 3·664 1·0072 0·001 2·707 63·61 0·3720 738- 951
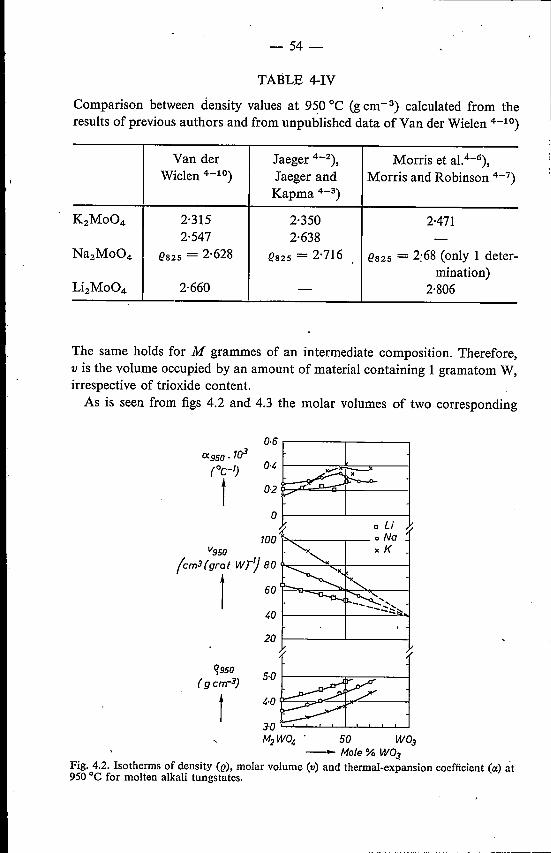
- 54-
TABLE 4-IV
Comparison between density values at 950°C (g cm=") calculated from theresults of previous authors and from unpublished data of Van der Wielen 4-10)
Van der Jaeger 4-2), Morris et al.4-6),Wielen 4-10) Jaeger and Morris and Robinson 4-7)
Kapma 4-3)
K2Mo04 2·315 2·350 2·4712·547 2·638 -
Na2Mo04 l?S25 = 2·628 l?S25 = 2·716 l?S25 = 2:68 (only 1 deter-mination)
Li2Mo04 2·660 - 2·806
The same holds for M grammes of an intermediate composition. Therefore,v is the volume occupied by an amount of material containing 1 gramatom W,irrespective of trioxide content.As is seen from figs 4.2 and 4.3 the molar volumes of two corresponding
0·6 ,-------,,-------,
oU'p.....,- __ --.-_ 0 Na
xKV950
(cm3(grat wr'] 80k-____.:"'=+-----I
r 60 t-='9--=~~-I
40~---~-____.:~
20~---L----
q950
( gcm-3)
t 3.0 '---L---L--'---'---'-"'_'___'---'-----'
M2WO, 50 W03- Mo{e% W03
Fig. 4.2. Isotherms of density (e), molar volume (v) and thermal-expansion coefficient (ex)at950 oe for molten alkali tungstates.

- 55-
°o·~1---...,-::b=Ik---j
0:950.10](Oe-I) 0'2t4~:JL::q=-t 01---+-
20~------~----~
3·5 I-------l---"----~
2{) '--lL....1.----,--,---L.,__'__L......L----L__l
M2MoO, 50 MoO]--- Mole % MoO]
Fig. 4.3. Isotherms of density (e), molar volume (v) and thermal-expansion coefficient (oe)at 950 oe for molten alkali molybdates (calculated from the data of Van der Wielen etal.4-9,10)).
monocompounds (e.g. Li2W04 and Li2Mo04) are approximately equal, whichis not surprising, as corresponding monocompounds are isomorphous and haveapproximately equal unit-cell dimensions when crystalline (cf. sec. 1.3). Themolar-volume isotherms appear to be linear in the case of the tungstate systems,whereas for the molybdate systems departures from linearity are found,especially in the case of the sodium and potassium molybdates (it should beremarked that the accuracy of v is equal to that of e, viz. ± 0·5%). Thesedepartures from linearity can be shown objectively in the following way: whenby the method of least squares the linear coefficient is calculated that repre-sents best the relation between V9SÖ and trioxide content, each individualmeasuring point shows a departure LlV9S0 from the linear relation.In fig. 4.4 this particular departure LlV9S0 is plotted vs composition for all
compositions measured. The value of LlV9S0 is small and non-systematic forthe tungstate systems. The same applies to the lithium-molybdate system.However, for the sodium and potassium molybdates larger departures are seen.Clearly, there is a maximum, and at higher Mo03 content large negativedepartures are found.The same effect is shown by fig. 4.3. The dashed lines represent the linear

- 56-
LlV950
(cm3 graf-I) 2
t~ ~.
VC . U\ '\\
-clI-O;c; x0
x
c LioNa _xK
Tungsfafes
o Molyb do fes
-2
2
o-2
o 50 100- Mole % trioxide
Fig. 4.4. Departure from linearity (Llv) of molar-volume isotherms for molten alkali molyb-dates and tungstates at 950°C.
interpolation lines between VMZMo04 and VMo03 (VM003' based on the data ofMorris et aI.4-6), = 47·53 cm3/grat Mo).Little can be said regarding the isotherms of the thermal-expansion coefficient
(see figs 4.2 and 4.3). The values of 0:950 for both tungstates and molybdatesare found in the same range, viz. 0.1-0.4.10-3 .COC-1).
4.3.2. Discussion
When trioxide is added to alkali monotungstate or monomolybdate, in thecrystalline state compounds are formed in which various types of polyhedra- tetrahedra, units having 5-coordination, octahedra - build up large anionicgroups of the infinite-chain type (cf. the crystal structures of Na; WZ07'NazMoz07, KzM03010, discussed in sec. 1.3).In the previous chapters indications were found for the fact that these large
anionic groups dissociate on melting. According to the ideas of Gelsing et al.(cf. sec. 1.4) the dissociation in tungstate-systems is so strong that the meltcontains a mixture of on the average short chains ofW04 tetrahedra. Navrotskyand Kleppa (cf. sec. 1.4), on the other hand, assume that alkali dimolybdates(MzMoz07) do not undergo complete dissociation on melting, the degree ofdissociation being dependent on the alkali species present.
Generally, on the addition of trioxide to molten alkali monotungstate ormonomolybdate, a melt will be formed, the structure of which is situated be-tween two extreme possibilities:A. When the degree of dissociation of the large anionic groups is very low,
the melt will contain large groups in which Mo or W atoms, having coordi-nation numbers higher than 4, occur.
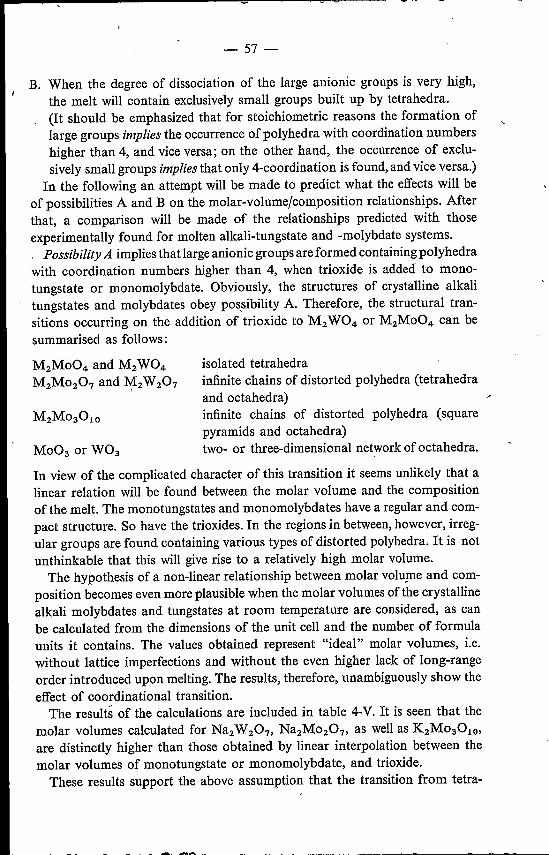
- 57-
B. When the degree of dissociation of the large anionic groups is very high,the melt will contain exclusively small groups built up by tetrahedra.(It should be emphasized that for stoichiometrie reasons the formation oflarge groups implies the occurrence of polyhedra with coordination numbershigher than 4, and vice versa; on the other hand, the occurrence of exclu-sively small groups implies that only 4-coordination is found, and vice versa.)
In the following an attempt will be made to predict what the effects will beof possibilities A and B on the molar-volume/composition relationships. Afterthat, a comparison will be made of the relationships predicted with thoseexperimentally found for molten alkali-tungstate and -molybdate systems., Possibility A implies that large anionic groups are formed containing polyhedrawith coordination numbers higher than 4, when trioxide is added to mono-tungstate or monomolybdate. Obviously, the structures of crystalline alkalitungstates and molybdates obey possibility A. Therefore, the structural tran-sitions occurring on the addition of trioxide to M2W04 or M2Mo04 can besummarised as follows:
M2Mo04 and M2W04M2M0207 and M2W207
isolated tetrahedrainfinite chains of distorted polyhedra (tetrahedraand octahedra)infinite chains of distorted polyhedra (squarepyramids and octahedra)two- or three-dimensional network of octahedra.
In view of the complicated character of this transition it seems unlikely that alinear relation will be found between the molar volume and the compositionof the melt. The monotungstates and monomolybdates have a regular and com-pact structure. So have the trioxides. In the regions in between, however, irreg-ular groups are found containing various types of distorted polyhedra. It is notunthinkable that this will give rise to a relatively high molar volume.The hypothesis of a non-linear relationship between molar volume and com-
position becomes even more plausible when the molar volumes of the crystallinealkali molybdates and tungstates at room temperature are considered, as canbe calculated from the dimensions of the unit cell and the number of formulaunits it contains. The values obtained represent "ideal" molar volumes, i.e.without lattice imperfections and without the even higher lack of long-rangeorder introduced upon melting. The results, therefore, unambiguously show theeffect of coordinational transition.The results of the calculations are included in table 4-V. It is seen that the
molar volumes calculated for Na2W207, Na2M0207, as well as K2Mo3010,are distinctly higher than those obtained by linear interpolation between themolar volumes of monotungstate or monomolybdate, and trioxide.These results support the above assumption that the transition from tetra-
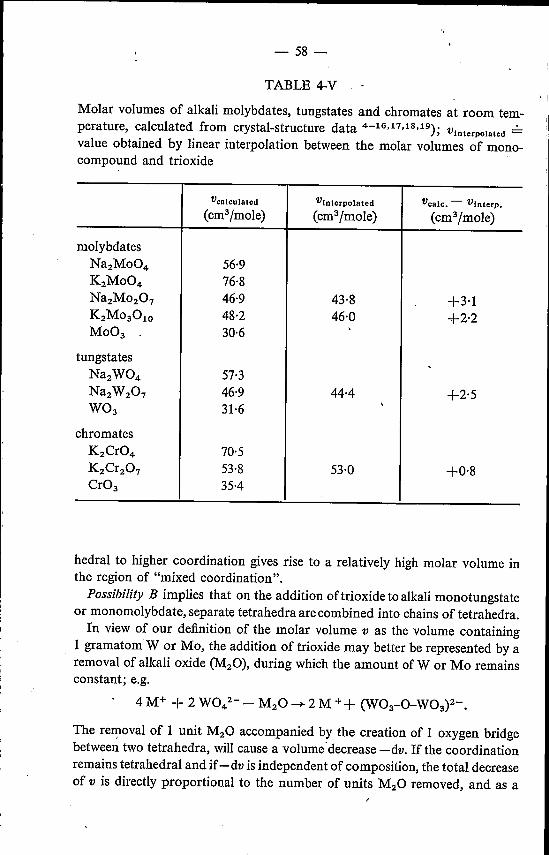
- 58-
TABLE 4-V• !
Molar volumes of alkali molybdates, tungstates and chromates at room tem-perature, calculated from crystal-structure data 4-16,17,18,19); Vlnterpolated ...:..
value obtained by linear interpolation between the molar volumes of mono-compound and trioxide
Vealeulated Vlnterpolated Veale• - Vin terp.
(cm3fmole) (cm3fmole) (cm3jmole)
molybdatesNa2Mo04 56·9K2Mo04 76·8Na2M0207 46·9 43·8 +3'1K2M03010 48·2 46·0 +2·2Mo03 30·6 ,
tungstates ,Na2W04 57·3Na2W207 46·9 44·4 +2'5W03 31·6
,
chromatesK2Cr04 70'5K2Cr207 53·8 53·0 +0'8Cr03 35·4
hedral to higher coordination gives rise to a relatively high molar volume inthe region of "mixed coordination".Possibility B implies that on the addition oftrioxide to alkali monotungstate
or monomolybdate, separate tetrahedra are combined into chains of tetrahedra.In view of our definition of the molar volume v as the volume containing
1 gramatom' W or Mo, the addition of trioxide may better be represented by aremoval of alkali oxide (M20), during which the amount of W or Mo remainsconstant; e.g.
4 M+ + 2 W042- - M20 ~ 2 M ++ (W03-0-W03)2-.
The removal of 1 unit M20 accompanied by the creation of 1 oxygen bridgebetween two tetrahedra, will cause a volurnedecrease -dv. If the coordinationremains tetrahedral and if-dv is independent of composition, the total decreaseof v is directly proportional to the number of units M20 removed, and as a

-59 -
consequence to the trioxide content expressed in mole % *). A linear relationbetween v and mole % trioxide will then be found.
To make it acceptable that -dv is only slightly dependent on the trioxidecontent, we will again consider suitable crystal structures, viz. those in theK2Cr04-Cr03 system. In sec. 3.3.2 it was observed that in the K2Cr04 aswell as in the K2Cr207 structure all Cr atoms are tetrahedrally coordinatedby oxygens. The same holds for the structure of Cr03 in which the tetrahedraform infinite chains 4-19).
The molar volumes of these three compounds, calculated from unit-celldimensions, are shown in table 4-V. It is seen from this table that the molarvolume of crystalline K2Cr207 hardly differs from the value obtained by linearinterpolation between the molar volumes of K2Cr04 and Cr03'
On consideration of the molar-volume isotherms at 950°C for molten alkali-tungstate and alkali-molybdate systems (figs 4.2 and 4.3) it is seen that thetungstate melts show a behaviour corresponding to possibility B, whereas thebehaviour of the molybdate melts complies with possibility A.
This strongly suggests that in molten molybdates dissociation has not pro-ceeded as far as in molten tungstates. In molybdate melts a structure willprobably still be found resembling that of the crystalline molybdates, involvingpolyhedra of various coordination numbers which form large groups.
From fig. 4.3 it is seen that the extent of the departure from linearity shownby the molar-volume isotherms for the molybdate systems, is dependent on thenature of the alkali ion. This may be attributed to the fact that the alkali ionsmay influence the position of the dissociation equilibrium.
Navrotsky and Kleppa 4-20) (cf. sec. 1.4) have suggested that alkali-dimolyb-date melts might undergo stronger dissociation in the order K2M0207--+-+ Na2M0207 -+ Li2M0207. The increase of dissociation in this order maycounteract the molar-volume-raising effect described above.
Tungstate melts appear to be strongly dissociated and show the behaviourexpected for a melt containing exclusively W04 tetrahedra, in accordance withthe structure proposed by Gelsing et al. (see sec. 1.4). This being the case, thevalue obtained by extrapolation of V950 to pure W03 (see fig. 4.2), approxi-
·)~The equivalency ofthe expressions "number of units M20 removed" and "mole % trioxide"can be shown as follows. The number ofunits M20 removed is proportional to the fractionof M20 removed. Let this fraction be x. When the tungstate systems are taken as anexample, the composition obtained can be represented by M2(1-X)W04-x• This is equiv-alent to
M2(1-x)W(1-x)04(1-X)' Wx03x or (I-x) M2W04• X W03•
The mole percentage of W03 is
x .100% = x. 100%.x + (I-x)
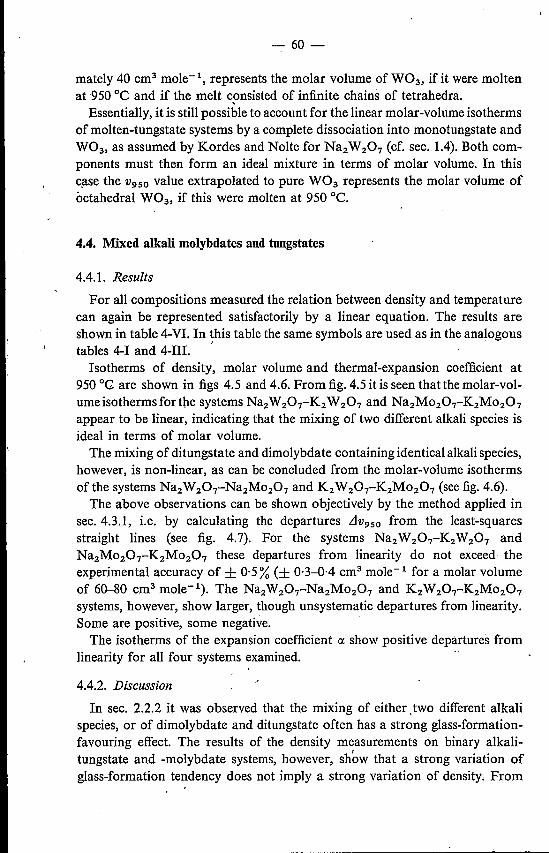
- 60-
mately 40 cm" mole=", represents the molar volume of W03, if it were moltenat 950°C and if the melt consisted of infinite chains of tetrahedra.,Essentially, it is still possible to account for the linear molar-volume isotherms
of molten-tungstate systems by a complete dissociation into monotungstate andW03, as assumed by Kordes and Nolte for Na2W207 (cf. sec. 1.4). Both corn-ponents must then form an ideal mixture in terms of molar volume. In thiscase the V950 value extrapolated to pure W03 represents the molar volume ofoctahedral W03, if this were molten at 950°C.
4.4. Mixed alkali molybdates and tungstates
4.4.1. Results
For all compositions measured the relation between density and temperaturecan again be represented satisfactorily by a linear equation. The results areshown in table 4-VI. In this table the same symbols are used as in the analogoustables 4-1 and 4-III. 'Isotherms of density, molar volume and thermal-expansion coefficient at
950 oe are shown in figs 4.5 and 4.6. From fig. 4.5 it is seen that the molar-vol-ume isotherms for the systems Na2W207-K2 W207 and Na2M0207-K2M0207appear to be linear, indicating that the mixing of two different alkali species isideal in terms of molar volume.The mixing of ditungstate and dimolybdate containing identical alkali species,
however, is non-linear, as can be concluded from the molar-volume isothermsofthe systems Na2W207-Na2M0207 and K2W207-K2M0207 (see fig. 4.6).The above observations can be shown objectively by the method applied in
sec. 4.3.1, i.e. by calculating the departures LlV950 from the least-squaresstraight lines (see fig. 4.7). For the systems Na2W207-K2 W207 andNa2M0207-K2M0207 these departures from linearity do not exceed theexperimental accuracy of ± 0'5% (± 0·3-0,4 cm" mole-i for a molar volumeof 60-80 cm" mole-i). The Na2W207-Na2M0207 and K2W207-K2M0207systems, however, show larger, though unsystematic departures from linearity.Some are positive, some negative.The isotherms of the expansion coefficient ct show positive departures from
linearity for all four systems examined.
4.4.2. Discussion
In sec. 2.2.2 it was observed that the mixing of either .two different alkalispecies, or of dimolybdate and ditungstate often has a strong glass-formation-favouring effect. The results of the density measurements on binary alkali-tungstate and -molybdate systems, however, sh~w that a strong variation ofglass-formation tendency does not imply a strong variation of density. From
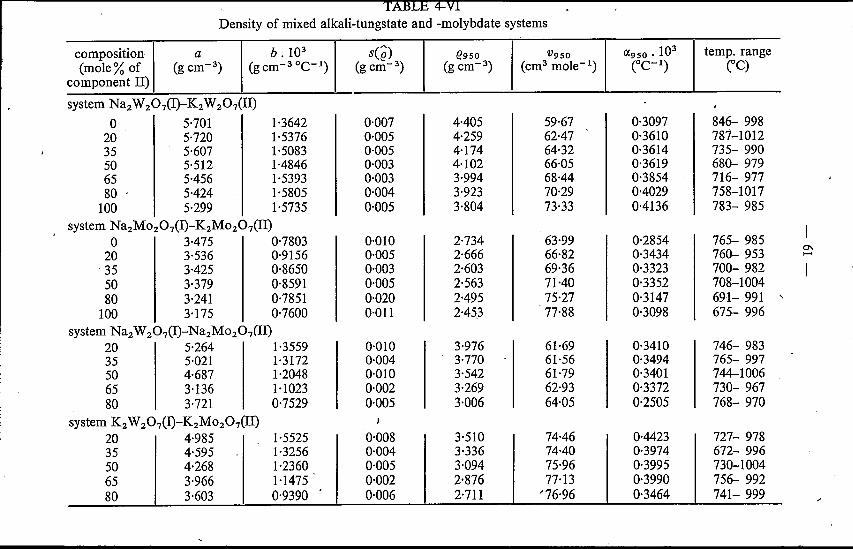
Density of mixed alkali-tungstate and -molybdate systems
composition a b.l03 s(ê) (1950 V950 (;(950 • 103 temp. range(mole% of (g cm=") (gcm-3OC-I) (g cm-3) (g cm-3) (cm" mole>') COC-I) COC)
component II)
system Na2W20iI)-K2 W20ilI)0 5·701 1·3642 0·007 4·405 59·67 0·3097 846- 998
20 5·720 1·5376 0·005 4·259 62·47 0·3610 787-101235 5·607 1'5083 0·005 4·174 64·32 0·3614 735- 99050 5·512 1·4846 0·003 4'102 66·05 0·3619 680- 97965 5·456 1·5393 0·003 3·994 68·44 0·3854 716- 97780 . 5·424 1·5805 0·004 3·923 70·29 0·4029 758-1017
100 5·299 1·5735 0·005 3·804 73·33 0·4136 783- 985
system Na2Mo207(I)-K2Mo207(II)0 3·475 0·7803 0·010 2·734 63·99 0·2854 765- 985
20 3·536 0·9156 0·005 2·666 66·82 0·3434 760- 9530'\
. 35 3·425 0·8650 0·003 2·603 69·36 0·3323 700- 98250 3·379 0·8591 0·005 2·563 71·40 0·3352 708-100480 3·241 0·7851 0·020 2·495 75·27 0·3147 691- 991 ,
100 3·175 0·7600 0·011 2·453 77·88 0·3098 675- 996system Na2W207(I)-Na2Mo20iII)
20 5·264 1·3559 0·010 3·976 61·69 0·3410 746- 98335 5·021 1·3172 0·004 3·770 61·56 0·3494 765- 99750 4·687 1·2048 0·010 3·542 61·79 0·3401 744-100665 3·136 1·1023 0·002 3·269 62·93 0·3372 730- 96780 3'721 0·7529 0·005 3·006 64·05 0·2505 768- 970
system K2W207(I)-K2Mo207(II)20 4·985 1·5525 0'008 3'510 74'4ó U·442.3 ïD- ':JFö35 4·595 1·3256 0·004 3·336 74·40 0·3974 672- 99650 4·268 1·2360 0·005 3·094 75·96 0·3995 730-100465 3·966 1·1475 0·002 2·876 77·13 0·3990 756- 99280 3·603 0·9390 . 0·006 2·711 '76'96 0·3464 741- 999-

- 62-
V950
(cm3 grat-I)
70 I---..~ié---=-...,c:_-I
9950(gcm-3)
t
t
]I-Mole %]I
Fig. 4.5. Isotherms of density (e), molar volume (v) and thermal-expansion coefficient (cc)at 950 oe for the molten systems
Naz Wz07(1)-Kz Wz07(II) (x)and NazMoz07(I)-KzMoz07(II) (0)
figs 4.5 and 4.6 it is seen that this conclusion also applies to the four "mixed"systems examined.
We will discuss the effects provoked by the mixing of alkali and thoseprovoked by the mixing of tungstate and molybdate separately.
Ca)Mixed-alkali systemsFrom the previous chapters and from the discussion of density values ofbinary molten alkali-tungstate and -molybdate systems it can be concludedthat the structure of these systems is probably not changed essentially bythe substitution of one alkali species for another, although such a substitu-tion may certainly influence the degree of dissociation or disproportiona-tion. In a mixed-alkali system the different alkali ions will be distributedthroughout the melt, but this distribution is not liable to affect the molarvolume to the extent that a distinct departure from linearity is observed.This is supported by the review article by Isard on the mixed-alkali effectin glasses 4-21). The molar volume appears to be the property which isaffected least by a partial substitution of one alkali species for another.A property which is generally affected to a greater extent is the thermal-expansion coefficient. The value of ct normally shows a positive departure

- 63-
0·55
()(950.103 0·45(Oe)
t0·35
0·25
v950 80{crnè grot-I)
70
60
9950 4·5(g cm-3)
t4·0
3·5
3·0
2·5
v- ""'_-,[::7"- -6" ~,\~'1
l'---+-+-- l---+I
__jk
r-,"'~~"<.',~~, I
I 50 J[
- Mole % JIFig. 4.6. Isotherms of density (e), molar volume (v) and thermal-expansion coefficient (oe)at 950 oe for the molten systems
Na2W 207(I)-Na2Mo207(II) (.6.)and K2W207(I)-K2Mo207(II) (+)
o
. ° ~° l(
~'" .~'\)(./ t~
I
Systems:+1
Llv950 .(cm3 gr at-I) 0
1-1
+1A Na2 W207-Na2Mo207+ K2 ~ 07 -K2Mo207
+2
-1
-2I 50 ]I
-Mole%]IFig. 4.7. Departure from linearity (Llv) of molar-volume isotherms for molten mixed alkali-dimolybdatejalkali-ditungstate systems at 950 oe.
- 64-
from linearity 4-21). In figs4.5 and 4.6 it is seen that this positive departureis indeed found in the systems under consideration.
(b) Mixed ditungstate{dimolybdate systemsIf the structure of corresponding ditungstate and dimolybdate melts weresimilar, the molar-volume isotherms of the mixed systems would probablybe linear.
However, if the structures of corresponding ditungstate and dimolybdatemelts are essentially different, as was suggested in the previous chapters andin sec. 4.3.2, the mixing may affect the value of the molar volume in manydifferent ways, and a non-linear behaviour is to be expected.
For instance, the smaller tungstate anions may occupy large interstices inthe molybdate structure, thus reducing the molar volume. On the other hand,on the addition of dimolybdate to a ditungstate melt, part of theW atoms mayassume higher coordinations and form common complex anions with the
, dimolybdate. This would raise the molar volume. The opposite effect is ob-served if part of the Mo atoms assumes a strictly tetrahedral coordination.Further, one effect may dominate in one composition region, while anothereffect may dominate in another composition region.It appears to be impossible to discuss the results of these effectsin terms of
molar volume. Nevertheless, a non-linear behaviour ofthe molar-volume iso-therms in mixed ditungstate{dimolybdate systems appears to be connectedwith differences between the structures ofthe components, rather than withsimilarities between these structures.
REFERENCES4--1) E. F. Ri eb l in g, J. Am. ceram. Soc. SI, 143-149, 1968.4--2) F. M. Jaeger, Z. anorg. allgem. Chem. 101, 1-214, 1917.4--3) F. M. Jaeger and B. Kapma, Z. anorg. allgem. Chem. 113,27-58, 1920.4-4) V. Spitzin and A. Tscherepneff, Z. anorg. allgem. Chem. 198, 276-286, 1931.4-5) A. Kvist and A. Lundén, Z. Naturforsch. 20a, 102-104, 1965.4-6) K. B. Morris, M. I. Cook, C. Z. Sykes and M. B. Templeman, J. Am. chem.
Soc. 77, 851-854, 1955.4-7) K. B. Morris and P. L. Robinson, J. phys, Chem. 68, 1195-1205,1964.4-8) K. B. Morris and P. L. Robinson, J. chem. eng. Data 9, 444-445, 1964.4-9) J. C. Th. G. M. van der Wielen, H. N. Stein and J. M. Stevels, J. non-cryst.
Solids 1, 18-28, 1968.4--10) J. C. Th. G. M. van der Wielen, unpublished results.
H. N. Stein, personal communication.4-11) J. D. Mackenzie, Rev. sei. Instr. 27, 297-299, 1956. .4-12) H. Esser and H. Eusterbrock, Arch. Eisenhüttenw. 14, 341-355, 1941.4-13) L. Shartsis and S. Spinner, J. Res. nat. Bur. Stand. 46,176-194,1951.4-14) E. F. Ri eb lin g, Rev. sci. Instr. 34, 568-572, 1963.4-15) W. Volk, Applied statistics for engineers, McGraw-Hill, New York, 1958, p. 237.4-16) I. Lindqvist, Acta chem. Scand. 4, 1066-1074, 1950.
. 4--17) B. M. Gatehouse and P. Leyerett, J. chem. Soc. CA) 1398-1405, 1968.4-18) B. M. Gatehouse and P. Leverett, J. chem. Soc. CA)849-854, 1969.4--19) R. W. G. Wyckoff, Crystal structures, Interseience Publishers, New York, 2nd ed.,
1964/1965, Vols. 2 and 3. .4--20) A. Navrotsky and O. J. Kleppa, Inorg. Chem. 6, 2119-2121, 1967.4-21) J. O. Isar d, J. non-cryst. Solids 1, 235-261, 1969.

- 65-
5. SURFACE TENSION OF MOLTEl'j" ALKALI TUNGSTATESAND MOL YBDATES *)
5.1. IntroduetionWhilst the density of a.melt is related to the arrangement of atoms and com-
plexes, the surface tension may give useful information on the strength of theinterpartiele bonds in the surface layer of the melt. The surface tension beinga property related to a certain unit surface area, its value is not only determinedby the strength of the interpartiele bonds but also by the number of particlesper unit area, and therefore by the dimensions of the particles.The restrietion should be made that the surface tension is a property of a
very thin layer, the composition of which may differ considerably from thatinside the melt. For instance, in a binary system of components which neitherform complexes on mixing nor undergo constitutional changes, the componentwhich in the pure state has the lower surface tension, will be preferentiallyadsorbed in the surface layer. Likewise, when complex ions ofvarious types arepresent in the liquid, those havin'g the highest surface activity will accumulatein the surface layer. As will be seen in sec. 5.3.2, the occurrence or absence ofadsorption may be used as evidence for the presence or absence of surface-active complex ions in the liquid.
Surface-tension values of molten alkali tungstates and molybdates have beenreported only by Jaeger 5-1), who determined the 'surface tensions of moltenNa2W04, Na2Mo04' K2W04 and K2Mo04, using the maximum-bubble-pressure method.In the present chapter the determination will be described of the surface
tensions of molten Li-, Na- and K-tungstate and -molybdate systems as wellas the surface tensions of four molten mixed alkali-tungstatejmolybdate sys-tems, the density measurements of which were described in chapter 4.
5.2. Experimental methodAlkali-tungstate and -molybdate samples were prepared from alkali car-
bonates, W03 and Mo03, by the method described in sec. 2.1.2.Surface tensions were measured by the ring method, involving determination
of the pull necessary to detach a platinum ring from the surfa~e of the melt.The melt was held in a platinum dish (diameter 8·5 cm, height 3·5 cm),
which was placed in an electric furnace.The maximum pull was measured by means of a torsion balance, which
*) Part ofthe contents of chapters 4 and 5 have been published previously by R. G. Gossink,H. N. Stein and J. M. Stevels, Silic. indo 35,245-252,1970; R. G. Gossink and J. M.Stevels, J. non-cryst. Solids 5,217-236, 1971.
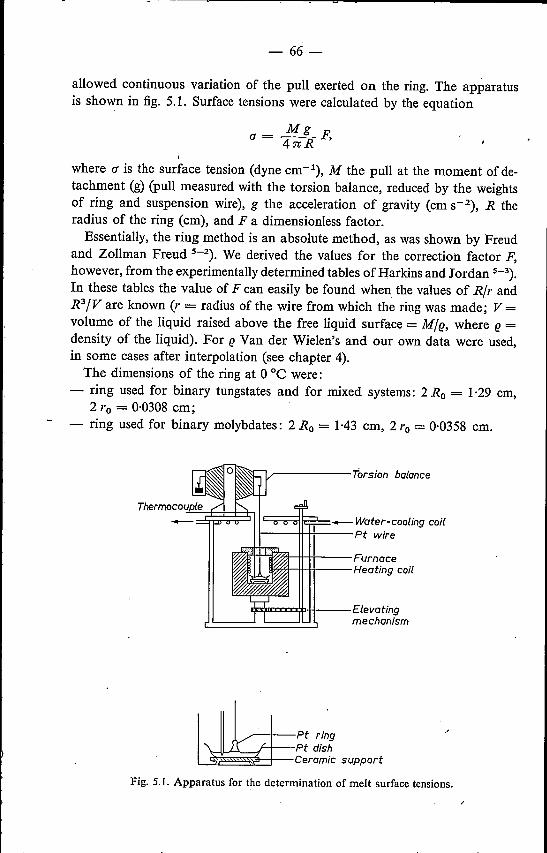
- 66-
allowed continuous variation of the pull exerted on the ring. The apparatusis shown in fig. 5.1. Surface tensions were calculated by the equation
Mg(1 = --- F,4nR
where (1 is the surface tension (dyne cm-I), M the pull at the moment of de-tachment (g) (pull measured with the torsion balance, reduced by the weightsof ring and suspension wire), g the acceleration of gravity (cm S-2), R theradius of the ring (cm), and Fa dimensionless factor.
Essentially, the ring method is an absolute method, as was shown by Freudand Zollman Freud 5-2). We derived the values for the correction factor F,however, from the experimentally determined tables of Harkins and Jordan 5-3).In these tables the value of F can easily be found when the values of Rlr andR31Vare known (r = radius of the wire from which the ring was made; V =volume of the liquid raised above the free liquid surface = Mie, where e =density of the liquid). For e Van der Wielen's and our own data were used,in some cases after interpolation (see chapter 4).
The dimensions of the ring at 0 °C were:- ring used for binary tungstates and for mixed systems: 2 Ro = 1·29 cm,
2 ro = 0·0308 cm;- ring used for binary molybdates: 2 Ro = 1·43 cm, 2 ro = 0·0358 cm.
~----- Torsion balance
'===-- Water-coolingcoilI-----tt-H---Pt wire
~F'H~ï'0I---H-I+--Furnace~7l-H--tiI---Heating coil
1Fj~a:x:<»ii--- Elevatingmechanism
Pt ringPt dishCeramic support
Fig. 5.1. Apparatus for the determination of melt surface tensions.
- 67-
The values of Rand r were corrected for thermal expansion by the formulaof Esser and Eusterbrock 5--4)for the linear expansion of Pt:
It = 10 (1+ 898·77 .10-4 t + 0.10652.10-8 t2 + 0.1256.10-12 t3).
Temperatures were measured in the melt by means of a calibratèd thermo-couple (pt/5 %Rh-Pt/20 %Rh).By far the most important error may be introduced when the plane of the
ring is not horizontal 5-3). According to Harkins and Jordan a deviation of~° from horizontal position reduces the value of a by 0·45%, and a deviationof 2·1° reduces a by 1·57%.As the angle between horizontal and plane of the ring could not be deter-
mined, the shape and correct position of the ring were verified between meas-urements on two successive samples by determining the surface tensions ofpure water and benzene at ambient temperature. When the departure fromliterature values 5-5) remained within ± 0·5%, we assumed that the planeof the ring was sufficiently horizontal.As a further verification of the accuracy of the method the surface tension
of an NaCI melt was determined (850-1050 "C). The maximum departure fromliterature values 5-1.6) observed was +0'5 %.
Temperature ranges throughout ~ere at least 150°C, while for each sampleat least 5 different temperatures were chosen.
5.3. Binary alkali tungstates and molybdates
5.3.1. ResultsFor all compositions measured the relation between surface tension and
temperature can be represented satisfactorily by the linear equation
a=p-qt,
where a is the surface tension (dyne cm-1), pand q are constants (> 0), q =da/dt, and t is the temperature COC).The values of pand q for each composition measured, calculated by the
method of least squares, as well as the standard deviations of estimate of theleast-squares lines (s(a» are included in tables 5-1 and 5-1I. These tables alsocontain the values of the surface tension at 950°C (a950), and the molar freesurface energy at 950°C (E950), as well as the temperature ranges for which theequations are valid. A comparison of our results for the sodium and potas-sium monomolybdates and monotungstates with those obtained by Jaeger 5-1),is' shown in table 5-lIl. Our results are considerably lower than Jaeger's values.This is in accordance with the conclusion of Janz et al.5-6) that most of Jaeger'ssurface-tension values are 2-8 % (and even more) higher than those obtainedby more recent determinations.
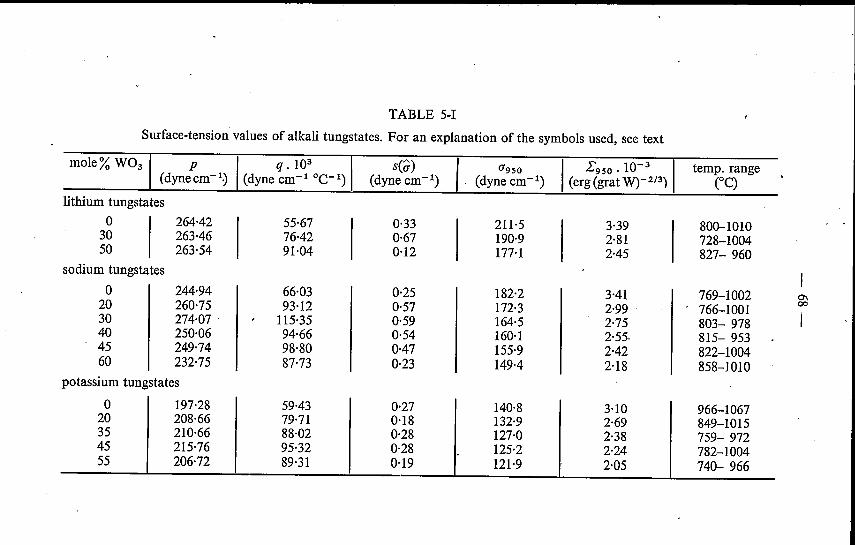
0 197·28 59·43 0·27 140·8 3·10 966-106720 208·66 79·71 0'18 132·9 2·69 849-101535 210·66 88·02 0·28 127·0 2·38 759- 97245 215·76 95·32 0·28 125·2 2·24 782-100455 206'72 89·31 0·19 121·9 2·05 740- 966
TABLE 5-I
Surface-tension' values of alkali tungstates. For an explanation of the symbols used, see text
mole% W03 I p Iq. 103 sea) 0'950 I £950' 10-3 I temp. range
(dynecmr<) (dyne cm"! °C-1) (dyne cm=') (dyne cnr ') (erg (grat W)-2/3) COC)lithium tungstates
0 264·42 55·67 0'33 211·5 3'39 800-101030 263·46 76'42 0·67 190·9 2·81 728-100450 263·54 91·04 0·12 177'1 2·45 827- 960
sodium tungstates0 244·94 66·03 0·25 182·2 3·41 769-1002 0\
20 260·75 93·12 0·57 172·3 2·99 766-1001 00
30 274·07 , 115·35 0·59 164·5 2·75 803- 97840 250·06 94·66 0·54 160·1 2·55- 815- 95345 249'74 98·80 0·47 155·9 2·42 822-100460 232·75 87·73 0·23 149·4 2·18 858-1010
potassium tungstates
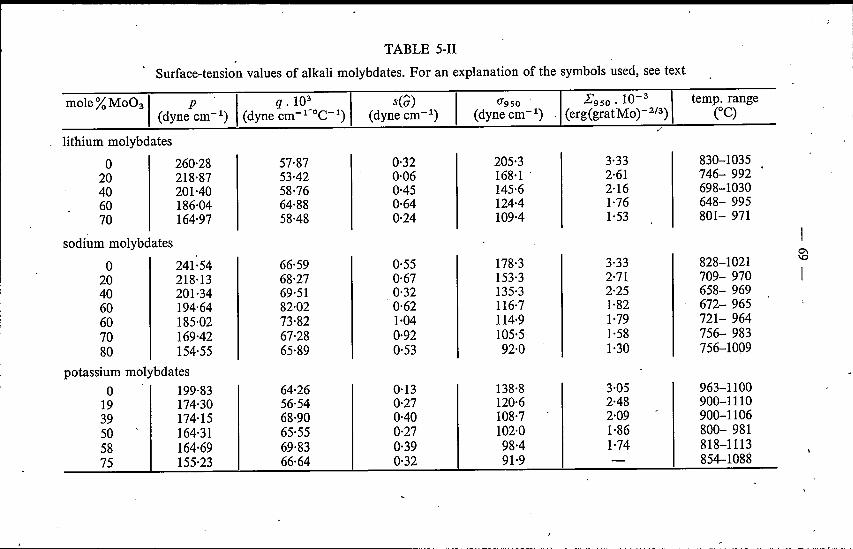
TABLE 5-II
Surface-tension values of alkali molybdates. For an explanation of the symbols used, see text
mOle%Mo031 p -I - q. 103 I sea) I 0'950 E950·1O-3 I temp. range(dyne cm-1) (dyne cm-1-OC-1) (dyne crn-') (dyne cm-1) (erg(gratMo)-2/3) COC)
lithium molybdates
0 260·28 57·87 0·32 205·3 3·33 830-103520 218·87 53·42 0·06 168·1 . 2·61 746- 99240 201·40 58·76 0·45 145·6 2·16 698-103060 186·04 64·88 0·64 124·4 1·76 648- 99570 164·97 58·48 0·24 109·4 1·53 801- 971
sodium molybdates0\
0 241·54 66·59 0·55 178·3 3·33 828-1021 \0
20 218·13 68·27 0·67 153·3 2·71 709- 97040 201·34 69·51 0·32 135·3 2·25 658- 96960 194·64 82·02 0·62 116·7 1·82 672- 96560 185·02 73·82 1·04 114·9 1·79 721- 96470 169·42 67·28 0·92 105·5 1·58 756- 98380 154·55 65·89 0·53 92·0 1·30 756-1009
potassium molybdates0 199·83 64·26 0·13 138·8 3·05 963-110019 174·30 56·54 0·27 120·6 2·48 900-111039 174·15 68·90 0·40 108·7 2·09 - 900-110650 164·31 65·55 0·27 102·0 1·86 800- 98158 164·69 69·83 0·39 98·4 1·74 818-111375 155·23 66·64 0·32 91·9 - 854-1088
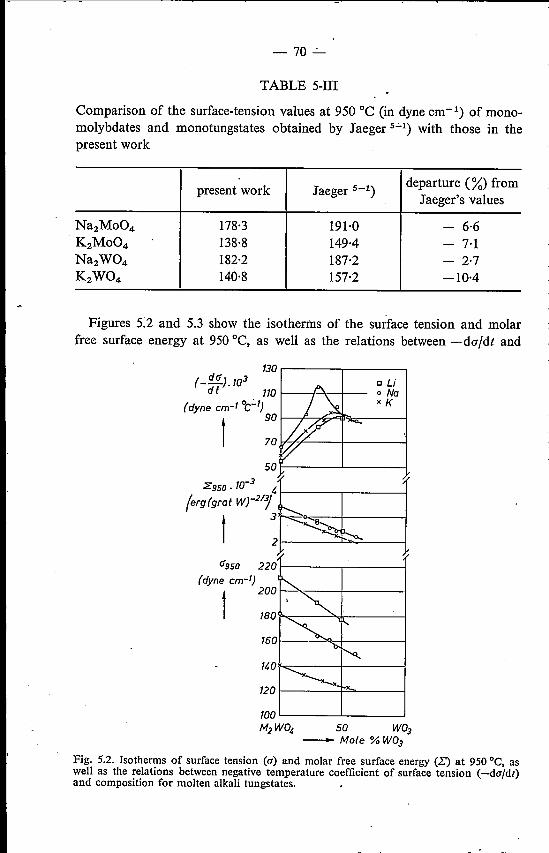
-70 ....:.._
TABLE 5-111
Comparison of the surface-tension values at 950°C (in dyne cm-I) of mono-molybdates and monotungstates obtained by Jaeger 5-'-1) with those in thepresent work
present work Jaeger 5-1)departure (%) from
Jaeger's values
Na2Mo04 178·3 191·0 - 6·6K2Mo04 138·8 149·4 - 7·1Na2W04 182·2 187·2 - 2·7K2W04 140·8 157·2 -10·4
Figures 5.2 and 5.3 show the isotherms of the surface tension and molarfree surface energy at 950°C, as well as the relations between -da/dt and
130,------,-----,cUo NaxK
(/950
(dyne cm-I)
t 200~~-~r---~
100'---__ ----l __J
M2WO" SO W03- Mole %W03
Fig. 5.2. Isotherms of surface tension (u) and molar free surface energy (.E) at 950oC, aswell as the relations between negative temperature coefficient of surface tension (-duldt)and composition for molten alkali tungstates.

(_ d(/ ).103d t 80 I------l-.<L._---I
( dyne cm-1°C-I)
t 60
~O~------L_--~~
-71
(/950 0 Li(dyne cm-I) 180 1-+----1--- 0 Na
xKt 160 I-~-"<---+-----I
1~0 *--~M.-I-----I
80~~~~~-L~~M2MoO, 50 M003
- Mole %Mo03Fig: 5.3. Isotherms of surface tension (a) and molar free surface energy (E) at 950 oe, aswell as the relations between negative temperature coefficient of surface tension (-da/dt)and composition for molten alkali molybdates.
composition. As was the case for the density isotherms (cf. sec. 4.3.1), theaspect of the surface-tension isotherms is not essentially changed by selectinga temperature 100 or 200 oe lower; however, the composition range coveredis then considerably reduced.The surface-tension isotherms are smooth curves. The surface tensions of the
monomolybdates are approximately equal to those of the corresponding mono-tungstates, As the trioxide content is increased, the surface tension is reduced,more rapidly in the case of the molybdate systems than in that of the corre-sponding tungstate systems.The above-mentioned molar free surface energy is defined as
E= (JV2/3,
where v is the molar volume, and E represents the free surface energy of oneside of a cube with volume v. Taking our definition of v into account (cf. sec.4.3.1) this means that such a cube will always contain 1 gramatom Wor Mo.
Figure 5.2 shows that the relation between E950 and the trioxide content isa linear one in the case of the tungstate systems.
-72-
For the molybdate systems (see fig. 5.3) this relation is non-linear. (It shouldbe noted that the accuracy estimated for E is ± 1'3%.) Moreover, it is sur-prising that, whereàs both surface tension and molar volume strongly dependon the alkali species present, this dependence is practically absent in the caseof the molar free surface energy.The value of -duldt for the molybdate systems hardly depends on the com-
position, whereas for the tungstate systems -duldt shows a maximum. Forboth groups of systems -duldt increases at constant trioxide content in thedirection Li -+ K -+ Na.
5.3.2. Discussion
In the preceding section it was observed that the surface-tension values of amonotungstate and its corresponding monomolybdate (e.g. Li2W04 andLi2Mo04) are approximately equal. The same applies to the values of themolar free surface energy. However, when trioxide is added the values of uand E show a stronger decrease for the molybdate melts than for the tungstatemelts.
Especially in the case of surface tensions, a pronounced difference is seen.As comparison on a molar basis, however, appears to be more correct, we willrestrict ourselves to the discussion of the E isotherms.The decrease of E occurring on the addition of trioxide can be explained by
the fact that the sizes of the complex ions increase while their valencies remainconstant. Taking the tungstate systems as an example and comparing the mono-tungstate and ditungstate compositions, in the former c~se W042- units arefound, and in the latter case W20l- units (irrespective of whether theseunits are part of larger groups or are separate ions). It is apparent that in themonotungstate structure the electrostatic attraction between alkali ions andcomplex ions will be stronger than in the ditungstate structure.
The structures of a molten monotungstate and its cortesponding monomo-lybdate are identical; these structures contain both alkali ions and isolatedtetrahedra (W042- and M0042- respectively). From the fact that the Evaluesof a monotungstate and its corresponding monomolybdate are equal, it is seenthat substitution of a molybdate polyhedron for a tungstate polyhedron, andvice versa, does not in itself influence the value of E.
Therefore, the differences occurring between the E values of correspondingtungstate and molybdate melts at higher trioxide content, are probably causedby differences between the structures of the surface layers, i.e. the presence ofdifferent types of complex ions in the surface layers. ,In chapter 4 the structures of molten alkali tungstates and molybdates were
assumed to be situated bet~een two extreme possibilities, viz., A. a structure corresponding with that of the crystalline compounds; the addi-
tion of trioxide to a monotungstate or inonomolybdate gives rise to the. .

-,
-73
formation of large groups containing polyhedra with coordination numbershigher than 4;
B. a structure containing exclusively W04 or Mo04 tetrahedra which formaveragely short chains.
The question to be answered is: What is the effect of possibilities A and Bon the value of E? (To answer this question the analogous case of the surface tension of certain
molten metasilicates containing bivalent cations (MnH, Mg2+, Ca2+) 5-7)will be considered. In metasilicates the Si04 tetrahedra share two corners withadjacent tetrahedra. The silicate anion, therefore, either is of the infinite-chaintype, or it forms rings.
Contrary to most other liquids the surface tension of these silicates increasesI
when the temperature is raised. This abnormal behaviour is attributed byKing 5-7) to a breakdown mechanism by which at high temperatures largerions break down to a large number of smaller ions.
According to this conception à large number of smaller ions gives rise to ahigher surface-tension value than a 'small number of larger ions. Thus, thesmall groups existing in the case of possibility B will cause a higher value of Ethan the large groups existing in the case of possibility A. As the addition oftrioxide reduces E in the molybdate systems to a higher extent than in the tung-state systems, it may be expected that the structure of the surface layer of amolybdate melt is closer to A, involving the occurrence of more large groups, .than is the structure of the surface layer of the corresponding tungstate melt.This is in accordance with the conclusions 'derived from the density measure-ments (cf. sec. 4.3.2).The fact that the surface layer of a molybdate melt contains a relatively high
proportion of large groups does not necessarily mean that inside the melt smallgroups are absent. When large and small groups are simultaneously present inthe melt, an adsorption mechanism will give rise to a comparatively high con-centration of large groups in the surface layer.The fact that the surface layer of a tungstate melt contains a relatively low
proportion of large groups, however, does imply that inside the melt likewiserelatively few large groups .are found. ,In the previous chapters the question whether Na2W207 dissociates on
melting either into Na+, W042- and W030 (as assumed by Kordes and Nolte,cf. sec. 1.4) or into a mixture of short chains of W04 tetrahedra (as assumedby Gelsing et al. 5-8» could not be answered definitely. It seems likely, however,that these two types of dissociation would have quite different effects on thevalue of E. If both bivalent tetrahedra and neutral trioxide particles werepresent in the melt, the latter would undoubtedly accumulate in the surface,layer, thus reducing the value of .E. In this case a linear relation between Eand composition (as found for the tungstate systems, cf. fig. 5~})would be
-74-
highly improbable. If, on the contrary, the melt contained exclusively shortchains of tetrahedra, an adsorption mechanism would only slightly affect thevalue of L:, and a linear relationship between L: and composition would certainlybe possible.
In sec. 5.3.1 it was seen that the value of -duldt in tungstate systems attainsa maximum, which in the molybdate systems is absent (cf. figs 5.2 and 5.3).The structure of the tungstate melt, outlined above, can be used to give a ten-tative explanation for this phenomenon.When W03 is added to molten monotungstate, chains of W04 tetrahedra
are formed according to the reaction -"
W042- +W03 -+ W20l-.
Gelsing et a1.5-8) (cf. sec. 1.4) assumed the chain length, e.g. at the compositionM2W207, to be non-uniform, since disproportionation reactions may occur ofthe type
On the basis of thermodynamic considerations it was thought likely that thedegree of disproportionation increases with temperature, i.e. that at high tem-peratures a relatively high proportion of longer chains occurs 5-8).In the surface layer the concentration of longer chains will be relatively high,
giving rise to a lower}; value. When at high temperatures the proportion oflonger chains increases, the }; value will show an additional decrease, super-imposed on the decrease brought about by thermal expansion, and, there-fore, -da/dt will show an additional increase.In molybdate melts an analogous effect is absent, as in these melts even at
lower temperatures larger groups will be present in the surface layer.
5.4. Mixed alkali tungstates and molybdates
For all compositions measured the relation between surface tension and tem-perature can again be represented satisfactorily by a linear equation. The resultsare represented in table 5-V. In this table the symbols used are the same asthose in the analogous tables 5-1 and 5-II.Isotherms of surface tension and molar free surface energy at 950 oe as well
as the relations between -duldt and composition are shown in figs 5.4 and 5.5.From fig. 5.4 it is seen that the a and }; isotherms for the system
Na2W207-K2 W207 are non-linear and suggest the occurrence of an adsorp-tion mechanism. Possible explanations for these phenomena appear to be thefollowing:(a) In the surface layer a relatively high concentration of K+ ions and con-
sequently a relatively low concentration of Na+ ions is found.

Surface-tension values of mixed alkali-ditungstate/alkali-dimolybdate systems, For an explanation of the symbols used, seetext; * = interpolated value
. composition p q _103 I s(û) I (1950 I £950 _ 10-3 I temp, range(mole% II) (dyne cm-I) (dyne cm-IOC-I) (dyne cm-I) (dyne cm-I) (erg grat-2/3) COC)
system Na2 W207(I)-K2 W207(11)0 - 92-0 * - 154-4* 2-36*
20 229-15 91-52 0-52 142-2 2-23
I734- 970
50 224-16 98-01 0-49 131-1 2-14 712-101180 205-42 84-99 0-70 124-7 2-12 708-1004
100 - 92-0 * - 123-0* 2-16system Na2Mo207(I)-K2Mo20iII)
0 - 72-0 * - 122-5* 1-96*20 .. 183-39 68-65 0-24 118-2 1-95 729-103250 176-70 69:65 0-44· 110-5 1-90 786-101280 167-91 66-19 0-34 105-0 1-87
,765-1020
100 164-31 65-55 0-27 102-0 1-86 800- 981 -..lUI
system Na2W207(I)-Na2Mo2OiII)
0 - 92-0 * - 154-4* 2-36*20 226-65 85-75 0-79 145-2 2-27 724-101535 220-30 83-90 0-21 140-6 2-19 753-102650 208-18 77-05 0-22 135-0 2-11 773- 96265 203-88 75-74 ' 0-63' 131-9 2-09 752- 98780 200-56 75-95 0-55 128-4 2-06 738-1027100 - 72-0 * - 122-5* 1-96*
system K2W207(I)-K2Mo207(11)0 92-0 * - 123-0* 2-16* -
20' 199-83 88-11 0-50 116-1 2-06 732- 95350 186·67 80-60 0-71 110-1 1-98 662-102165 175-97 72-13 0-53 107-4 1-95 776-105980 170-94 67-56 0·54 106-8 1-93 740-1018 .80 177-38 76-75 0-98 104-5 1-89 770-1000100 164-31 65-55 0-27 102-0 1-86 800- 981

- '76 -:-
(_ do) 103 100dt .
(dyne cm-I °C-I)BO
t 60
x0
X
"-x ~ ---,....____.,_
<,~ .___
_u__
...___.....,_
Systems:.No2 W20;(1)-
K21120?fIf)oNo2M02 °7(I)-
K2 M0207(1I)
2·4I950.10-3
(erg (grot}-213}2.2
t 2·0
I·B
°950 160(dyne cm-I)
t140
120
100
I 50-Mole %If
If
Fig. 5.4. Isotherms of surface tension (0') and molar free surface energy (E) at 950 oe, aswell as the relations between negative temperature coefficient of surface tension (-duldt)and composition for the molten systems
Na2W207(1)-K2W207(1I) (x)and Na2Mo207(O-K2Mo207(IO (0)
(b) Molten K2W207 contains a higher proportion of large anionic groups thanmolten Na,WZ07' These groups accumulate in the surface layer.
For the mixed-alkali system NazMoz07-KzMoz07 (fig.5.4) the values ofsurfacetension and molar free surface energy of the two components show only smalldifferences. Therefore, the drawing of conclusions from the isotherms is dif-ficult.
For the mixed ditungstatejdimolybdate systems Na,Wz07-NazMoz07 andKZWZ07-KzMoz07 (fig. 5.5) both surface-tension and molar-free-surface-energy isotherms show negative departures from linearity. These departuresare to be expected, as the larger molybdate groups will accumulate in the sur-face layer.The results, however, do not allow any further conclusions regarding the
structures of the melts involved.
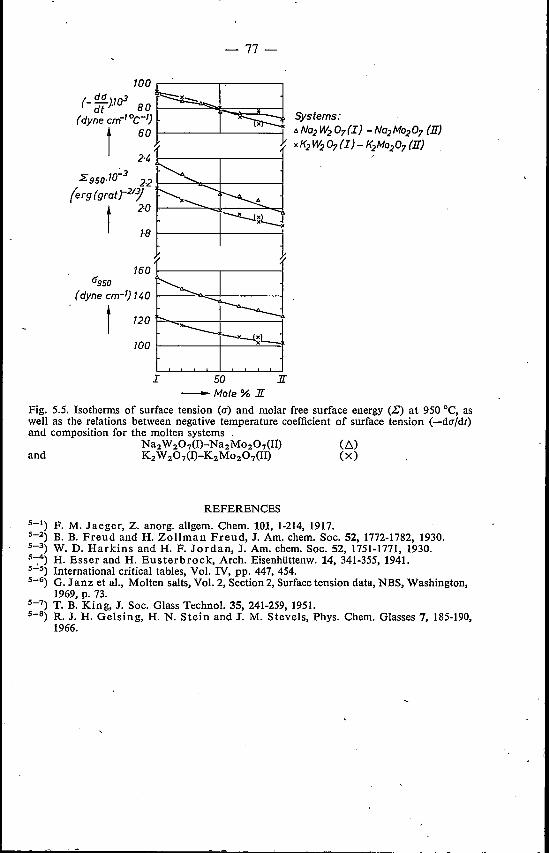
-Mo(e% ][
Fig. 5.5. Isotherms of surface tension (a) and molar free surface energy (L') at 950°C, aswell as the relations between negative temperature coefficient of surface tension (-duldt)and composition for the molten systems .
Na2W207(I)-Na2Mo207(II) (.6.)and K2W207(I)-K2Mo207(I1) (x)
REFERENCES5-1) F. M. Jaeger, Z. anorg. allgem. Chem. 101, 1-214, 1917.5-2) B. B. Freud and H. ZoIIman Freud, J. Am. chem. Soc. 52, 1772-1782, 1930.5-3) W. D. Harkins and H. F. Jordan, J. Am. chem. Soc. 52, 1751-1771, 1930.5-;4) H. Esser and H. Eusterbrock, Arch. Eisenhüttenw. 14, 341-355, 1941.5-5) International critical tables, Vol. IV, pp. 447, 454.5-6) G. Janz et aI., Molten salts, Vol. 2, Section 2, Surface tension data, NBS, Washington,
1969, p. 73.5-7) T. B. King, J. Soc. Glass Technol. 35, 241-259, 1951.5-8) R. J. H. Gelsing, H. N. Stein and J. M. Stevels, Phys. Chem. Glasses 7, 185-190,
1966.
77 -
160
~,~..._ <,
~~~l_j
~-.,~-"---l--- -"-.I.~L..:
rf950(dyne cm-I) 140
t 120
100
I 50 ][

-78 -
6. VISCOSITY OF MOLTEN ALKALI TUNGSTATES ANDMOLYBDATES
6.1. Introduetion
The value of viscosity is related to the strength of the interpartiele bonds andthe dimensions of the flow units in the liquid. As required by electrical neutralityviscous flow involves the migration of both anions and cations. According toFrenkel v") this migration is limited by the ions with smaller mobility. Inmolten alkali tungstates and molybdates these ions will be the relatively largeanions. In many cases it is useful to compare the values of viscosity with thoseof electrical conductivity, as the latter property also involves the migration ofions. However, electrical conductance only requires the transport of electricallycharged particles of one sign, viz. those for which the activation energy ofmigration has the smallest value. These are usually the cations.
No viscosity values of alkali tungstates and molybdates have been reportedin the literature. The only indication has been given by Van der Wielen etal. 6-2), this stating that alkali-molybdate melts have viscosities of the orderof 1 cP, which lies below the range of the falling-sphere method.
More attention has been paid to electrical-conductivity measurements ofmolten tungstates and molybdates. Jaeger and Kapma 6-3) determined theelectrical conductivities ofNa,W04 and Na2Mo04.Spitzin and Tscherepnefî'?")reported the electrical conductivities of several compositions in the systemNa2W04-W03. Morris et al.6-5) measured the electrical conductivity in thesystem Na2Mo04-Mo03' while Morris and Robinson 6-6,7) worked on thesystems Li2Mo04-Mo03 and K2Mo04-Mo03 as well as the Li-, Na- andK-tungstate systems. Finally, Kvist and Lundén 6-8) reported the electricalconductivity of Li2Mo04, at the same time criticizing the accuracy of Morrisarid Robinson's measurements on this compound.In the present chapter viscosity measurements will be described of the binary
tungstate and molybdate systems, the density and surface-tension values ofwhich have been reported in chapters 4 and 5 respectively. Furthermore, acomparison will be made of the viscosity values obtained and the electrical-conductivity values evaluated from the literature data mentioned above.In addition to this, the viscosity values ofthe systems Na2W207-Na2M0207
and Na2W207-K2W207 will be reported.
6.2. Experimental method
Alkali-tungstate and -molybdate samples were prepared from alkali car-bonates, W03 and Mo03 by the method described in sec. 2.1.2. The methodused for the determination ofviscosity values was that ofthe oscillating hollowcylinder. The melt is contained in a cylindrical crucible, which is suspended by
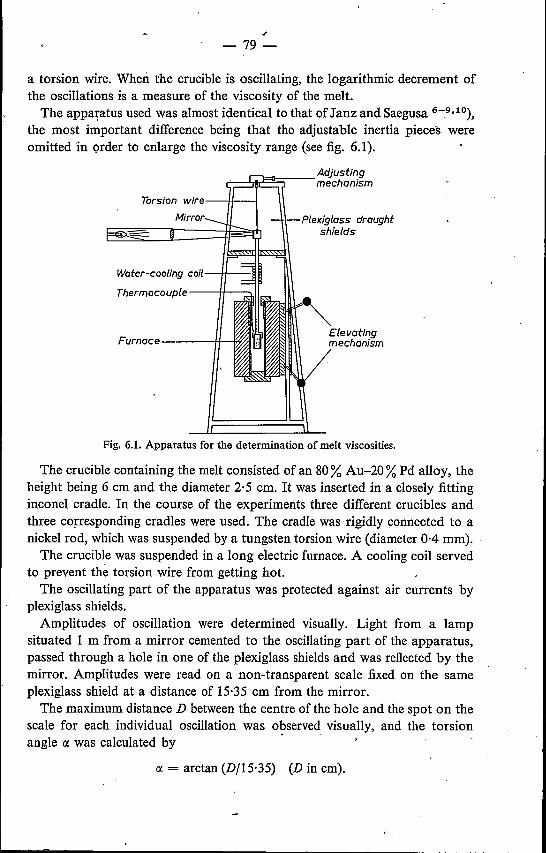
-79 -
a torsion wire. When the crucible is oscillating, the logarithmic decrement ofthe oscillations is a measure of the viscosity of the melt.The apparatus used was almost identical to that of Janz and Saegusa 6-9,10),
the most important difference being that the adjustable inertia pieces wereomitted in order to enlarge the viscosity range (see fig. 6.1).
r;;::=::~~;=;J-- Adjusting
mechanism
Water-cooling coil--/-I---!l
Thermocouple -----<1-1-----..
Fig. 6.1. Apparatus for the determination of melt viscosities.
The crucible containing the melt consisted of an 80% Au-20 % Pd alloy, theheight being 6 cm and the diameter 2·5 cm. Itwas inserted in a closely fittinginconel cradle. In the course of the experiments three different crucibles andthree corresponding cradles were used. The cradle was rigidly connected to anickel rod, which was suspended by a tungsten torsion wire (diameter 0·4 mm).The crucible was suspended in a long electric furnace. A cooling coil served
to prevent the torsion wire from getting hot.The oscillating part of the apparatus was protected against air currents by
plexiglass shields.Amplitudes of oscillation were determined visually. Light from a lamp
situated 1 m from a mirror cemented to the oscillating part of the apparatus,passed through a hole in one of the plexiglass shields and was reflected by themirror. Amplitudes were read on a non-transparent scale fixed on the sameplexiglass shield at a distance of 15·35 cm from the mirror.The maximum distance D between the centre of the hole and the spot on the
scale for each individual oscillation was observed visually, and the torsionangle a was calculated by .
rx = arctan (D{15'35) (D in cm).
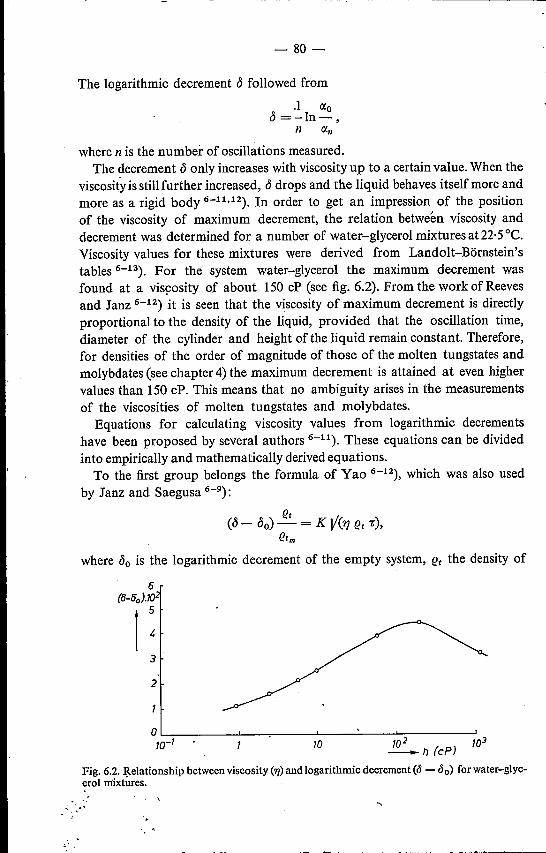
- 80-
The logarithmic decrement ~ followed from
.1 <Xo~= -In-
n <Xnwhere n is the number of oscillations measured.
The decrement ~ only increases with viscosityup to a certain value. When theviscosity is still further increased, ~ drops and the liquid behaves itself more andmore as a rigid body 6-11.12). In order to get an impression of the positionof the viscosity of maximum decrement, the relation between viscosity anddecrement was determined for a number of water-glycerol mixturesat22·5°C.Viscosity values for these mixtures were derived from Landolt-Börnstein'stables 6-13). For the system water-glycerol the maximum decrement wasfound at a viscosity of about 150 cP (see fig. 6.2). From the work of Reevesand Janz 6-12) it is seen that the viscosity of maximum decrement is directlyproportional to the density of the liquid, provided that the oscillation time,diameter of the cylinder and height of the liquid remain constant. Therefore,for densities of the order of magnitude of those of the molten tungstates andmolybdates (see chapter 4) the maximum decrement is attained at even highervalues than 150 cP. This means that no ambiguity arises in the measurementsof the viscosities of molten tungstates and molybdates.
Equations for calculating viscosity values from logarithmic decrementshave been proposed by several authors 6-11). These equations can be dividedinto empirically and mathematically derived equations.To the first group belongs the formula of Yao 6-12), which was also used
by Janz and Saegusa 6-9):
where ~o is the logarithmic decrement of the empty system, et the density of
6(B-50).
I :2
3
o~ ~ __~ ~ ~ __~ ~10-1 10 102 103
_.. f) (cp)
Fig. 6.2. Relationship between viscosity (rJ) and logarithmic decrement (0 - 00) for water-glyc-erol mixtures.
" '.lt.
- 81-
the liquid at temperature t, (}tm the density of the liquid at melting tempera-ture tn" K an apparatus constant, and -cthe oscillation time.Hopkins and Toye's formula 6-14) was based on a mathematical analysis
of the motion of the system:
(
-C2). (n -c)3
(0-00) -2+1 =An-c+BV(n(!.)+Cy'--,-Co . (}.
where -Co is the oscillation time of the empty system, and A, Band C are ap-paratus constants.
Reeves and Janz's objection 6-11) to this formula is that the apparatus"constants" A, Band C are actually functions of the diameter of the crucibleand the height of the liquid, both of which may vary appreciably with tem-perature. Reeves and Janz propose
[(0- 00) (::2 + 1) = 2 n3/2 a3 (c + 0·2246a) V(n e -c)+
3 V:n; 1/(n-c)3- :n;a2 (3 c+ 1-844a) n r + --a cV--,'
8 (}where a is the radius of the cylinder, c the height of the liquid, and [ the mo-ment of inertia of the oscillating part of the system.They point out that Yao's empirical equation is only valid for liquids ofviscosities of less than about 1 cP.In our case the logarithmic decrement 0 and the oscillation time -Co of the
empty system were about 0·6. 10-2 and 2·5 s respectively; both values re-mained unchanged when the temperature in the furnace was raised to 900 oe,but showed some variation with the crucible and corresponding cradle used.Application of Reeves and Janz's equation to the systems and samples useddemonstrated that the third term of the right-hand side of the equation wasless than 0·1 % of the second term, this again being about 10% of the first.Therefore, the third term could be neglected. The resulting equation is a quad-ratic expression in V n.To calculate viscosity values, the moment of inertia [ must be known.
Although the equation permit~ an absolute determination of viscosity, [wasevaluated from measurements of the logarithmic decrements of liquids ofknown viscosity. The liquids used were water (distilled 2x), toluene (Merckp.a.) and chloroform (Merck p.a.) at ambient temperatures, and KN03 (Merckp.a.) and LiN03 at elevated temperatures (the latter compound was obtainedby adding Li2C03 to HN03 (1 : 1), after which the water and excess of HN03were evaporated; m.p. 255°C). Viscosity and density values used, were derivedfrom International Critical Tables, Janz and Saegusa 6-9), and Murgulescuand Zuca 6-15). The resulting values for the moment of inertia [varied with, .

- 82-
the three Au-Pd crucibles and corresponding inconel cradles used, being 498,524 and 547 g cmê respectively. Temperatures were measured by a calibrated(Pt-5 %RhfPt-20 %Rh) thermocouple placed directly above the crucible.
6.3. Binary alkali tungstates and molybdates; a comparison with electrical-con-ductivity data
6.3.1. Results
In tables 6-1and 6-11the viscosity values of the alkali-tungstate and -molyb-date samples measured are given. These tables also contain the values for theactivation energies E~,calculated by the Arrhenius equation
E~'fJ=Aexp-,
RTwhere A is a pre-exponential factor, R the gas constant, and T the tempera-ture (K).
Figures 6.3 and 6.4 show the relations between log 'fJand liT for tungstatesand molybdates. For most compositions examined the Arrhenius equationproves to be obeyed satisfactorily. In cases where considerable departures fromlinear relationship are observed, these departures should be attributed to ex-perimental errors rather than to properties of the melt. In the latter case asystematic behaviour of the departures would appear likely, which is in factabsent.
Figures 6.5 and 6.6 give viscosity isotherms for the six systems examined.Consideration of the results summarised in these figures leads to the followingconclusions:(a) The value of the viscosity is dependent on the alkali species present. For
both tungstate and molybdate systems the viscosity increases in the direc-tion K -+ Na -)0 Li.
(b) Viscosity values of tungstate systems are higher than those of the corre-sponding molybdate systems.
(c) On first addition of W03 to a monotungstate melt the viscosity value re-mains constant. However, the addition of more than 30mole% W03 raisesthe viscosity; the increase observed is stronger' in the order K -). Na -+ Li.
(d) On the addition of Mo03· to a monomolybdate melt the value of theviscosity is somewhat decreased. At very high Mo03 contents the oppositeeffect is observed.
(e)' The conclusion of Van der Wielen et aI.6-2) that the viscosity of molyb-date melts is of the order of 1 cP is confirmed by our experiments. Theviscosities of the tungstate melts, though higher, are of the same order ofmagnitude, being surprisingly low for glass-forming systems.

"-
- 83-
TABLE 6-1.)
Viscosity values of alkali tungstates
mole% W03 act. en. Efl temp. viscosity(kcal mole=") COC) (cP)
system Li2W04-W03
0 12·0 843 8·13891 6·42942 5·27
15 10·5 725 13·25783 9·42824 7·49880 6·63
30 11·5 752 13·52787 10·15849 8·11894 6·51948 5·39982 4·56
40 14·7 800 14·48846 11·71888 8·80929 7·39958 5·91
50 14·4 915 10·22944 8·67982 7·251024 6·11
system Na2 W04-W03
0 9·2 772 6·80808 5·71850 5·13890 4·44940 3·64985 3·20
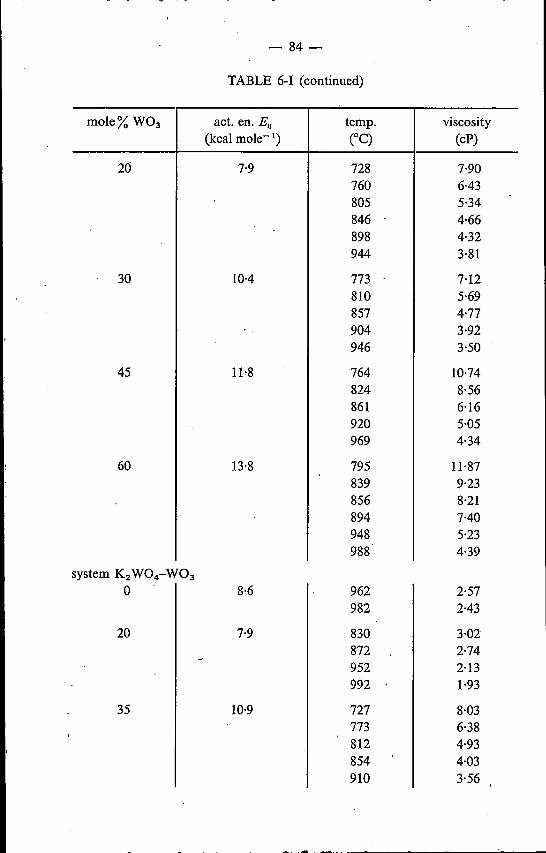
- 84-
TABLE 6-1 (continued)
mole% W03 act. en. E; temp. viscosity(kcal mole=") COC) (cP)
20 7·9 728 7·90760 6·43805 5·34846 4·66898 4·32944 3·81
30 10·4 773 7·12810 5·69857 4·77904 3·92946 3·50
45 11·8 764 10·74824 8·56861 6·16920 5·05969 4·34
60 13-8 795 11·87839 9·23856 8'21894 7·40948 5·23988 4·39
system K2W04-W030 8·6 962 2·57
982 2·43
20 7·9 830 3·02872 2·74952 2·13992 1·93
35 10·9 727 8·03773 6·38812 4·93854 4·03910 3·56
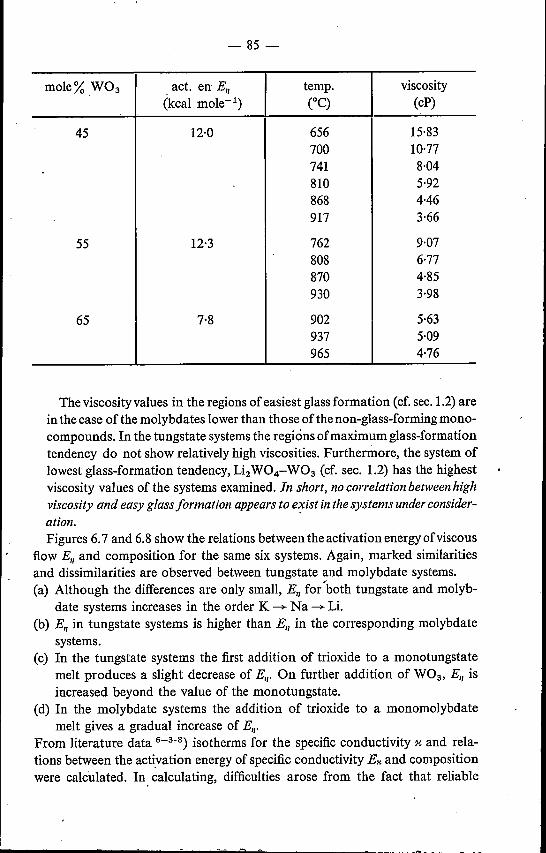
- 85-
mole% W03 act. en E" temp. viscosity(kcal mole-1) CC) (cP)
45 12·0 656 15·83700 10·77741 8·04810 5·92868 4·46917 3·66
55 12·3 762 9·07808 6·77870 4·85930 3·98
65 7·8 902 5·63937 5·09965 4·76
Theviscosityvalues in the regions of easiest glass formation (cf. sec.1.2) arein the case of the molybdates lower than those ofthe non-glass-forming mono-compounds. In the tungstate systems the regions of'maximum glass-formationtendency do not show relatively high viscosities. Furthermore, the system oflowest glass-formation tendency, Li2W04-W03 (cf. sec. 1.2) has the highestviscosity values of the systems examined. In short, no correlation between highviscosity and easy glass formation appears to e::yistin the systems under consider-ation.Figures 6.7 and 6.8 show the relations between the activation energy ofviscous
flow Ell and composition for the same six systems. Again, marked similaritiesand dissimilarities are observed between tungstate and molybdate systems.(a) Although the differences are only small, E" fo/both tungstate and molyb-
date systems increases in the order K ~ Na -+ Li.(b) E" in tungstate systems is higher than E" in the corresponding molybdate
systems.(c) In the tungstate systems the first addition of trioxide to a monotungstate
melt produces a slight decrease of E", On further addition of W03, E" isincreased beyond the value of the monotungstate.
(d) In the molybdate systems the addition of trioxide to a monomolybdatemelt gives a gradual increase of E",
From literature data 6-3-8) isotherms for the specific conductivity ~ and rela-tions between the activation energy of specific conductivity E« and compositionwere calculated. In. calculating, difficulties arose from the fact that reliable

-86-
TABLE 6-II
Viscosity values of alkali molybdates
mole% Mo03 act. en. Ell temp. viscosity(kcal male-i) COC) (cP)
system Li2Mo04-Mo030 7·0 723 7·48
804 6·01846 5·23886 4·70936 3·98
20 7·9 758 5·45880 3·46937 3·11
40 9·6 662 7·80742 4·96792 4·79848 3·53911 2·46
60 9·1 674 7·52761 4·71852 3·51934 2·62
70 10·2 686 7·77745 5·38802 4·33856 3·44
system Na2Mo04-Mo030 6·8 756 4·95
786 4·40832 3·76882 3·29926 3·13
20 8·3 674 5·90709 4·80764 3·70816 3·08903 2·51
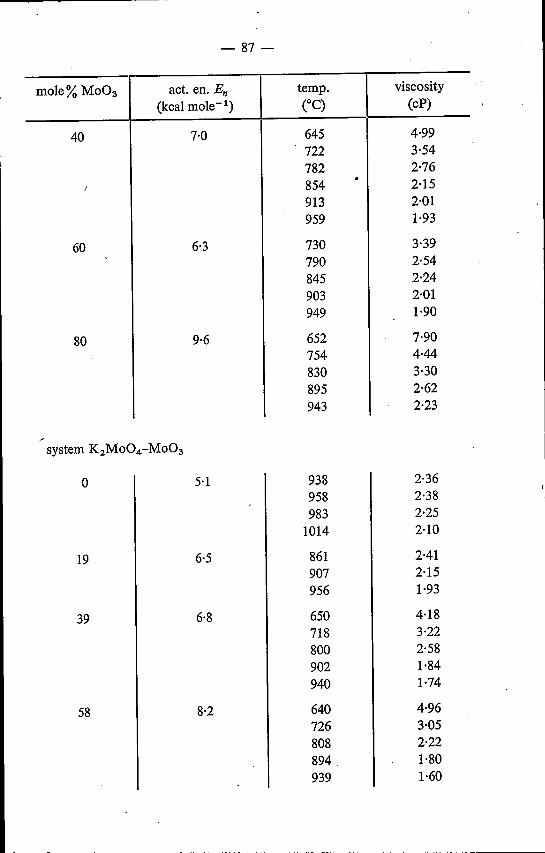
- 87-
mole% Mo03 act. en. En temp. viscosity(kcal mole-I) COC) (cP)
40 7·0 645 4·99722 3·54782 2·76854 2·15913 2·01959 1·93
60 6·3 730 3·39790 2·54845 2·24903 2·01949 1·90
80 9·6 652 7·90754 4·44830 3·30895 2·62943 2·23
system K2Mo04-Mo03
0 5·1 938 2·36958 2·38983 2·251014 2·10
19 6·5 861 2·41907 2·15956 1·93
39 6·8 650 4·18718 3·22800 2·58902 1·84940 1·74
58 8·2 640 4·96726 3·05808 2·22894 1·80939 1·60

- 88-
TABLE 6-II (continued)
mole% Mo03 act. en E; temp. viscosity(kcal mole=") eC) (cP)
70 8·9 650 5·55731 3·74832 2·50928 1·82
isotherms could not be obtained for all systems, this because the temperatureranges valid for the various compositions measured do not always overlapsufficiently. Further, large departures were observed between the results ob-tained by different authors. For the molten systemNa2 W04-W03 the electrical-conductivity values of Spitzin and Tscherepneff 6-4) are considerably higherthan those of Morris and Robinson 6-7) in the regions of high W03 contents.In this case Morris and Robinson's data were used, as these better correspondto the results found for the systems Li2W04-W03 and K2WOCW03• In thecase of Li2Mo04, however, Morris and Robinson report improbably high
Fig. 6.3. Viscosities of molten alkalitungstates (systems M2WÛ4-WÛ3)'
8 U"'"dViscosity 7(cP) 6
t5
~M:"'M'O'4o 0
3 ~ x 20o 40
0 IJ. 60v 702
0'8 0·9 1'06 Sodium molybdates
/54
~~O'3
~ 00x 202 o 40
IJ. 60V 80
4 0·8 0·9 1·0Potassium molybdafes
3
2 Mole r.Mo03o 0x 19
1·5 0 39IJ. 58v 70
0'8 0·9 1'0- 101r
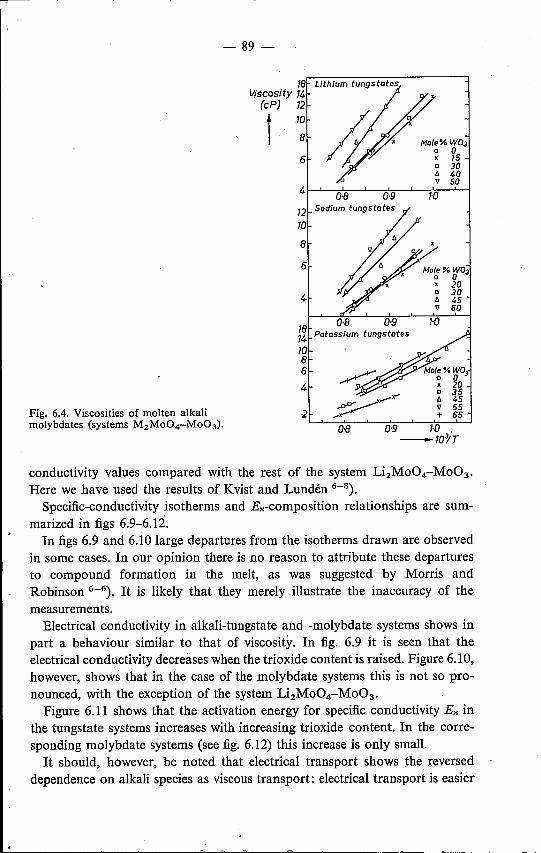
- 89-
18Viscosity 14
(cP) 12
tla8 Mole% W03
o 0x 15o 30/:; 40v 50
4~--0~'8~J-~OBn-J-~rO--~
6
12 Sodium tungstates
la I}: M:le%W03
o 0x 20
4 ~ igv 60
0·8 0·9 1·0:~ Potassium tungstates
la864
2Fig. 6.4. Viscosities of molten alkalimolybdates (systems M2Mo04-Mo03). 0·9 l·O.
-lOrT
conductivity values compared with the rest of the system Li2MoOcMo03'Here we have used the results of Kvist and Lundén 6-8).
Specific-conductivity isotherms and E,,-composition relationships are sum-marized in figs 6.9-6.12.In figs 6.9 and 6.10 large departures from the isotherms drawn are observed
in some cases. In our opinion there is no reason to attribute these departuresto compound formation in the melt, as was suggested by Morris andRobinson 6-6). It is likely that they merely illustrate the inaccuracy of themeasurements.Electrical conductivity in alkali-tungstate and -molybdate systems shows in
part a behaviour similar to that of viscosity. In fig. 6.9 it is seen that theelectrical conductivity decreases when the trioxide content is raised. Figure 6.10,however, shows that in the case of the molybdate systems this is not so pro-nounced, with the exception of the system Li2Mo04-Mo03.Figure 6.11 shows that the activation energy for specific conductivity E" in
the tungstate systems increases with increasing trioxide content. In the corre-sponding molybdate systems (see fig. 6.12) this increase is only small.It should, however, be noted that electrical transport shows the reversed
dependence on alkali species as viscous transport: electrical transport is easier
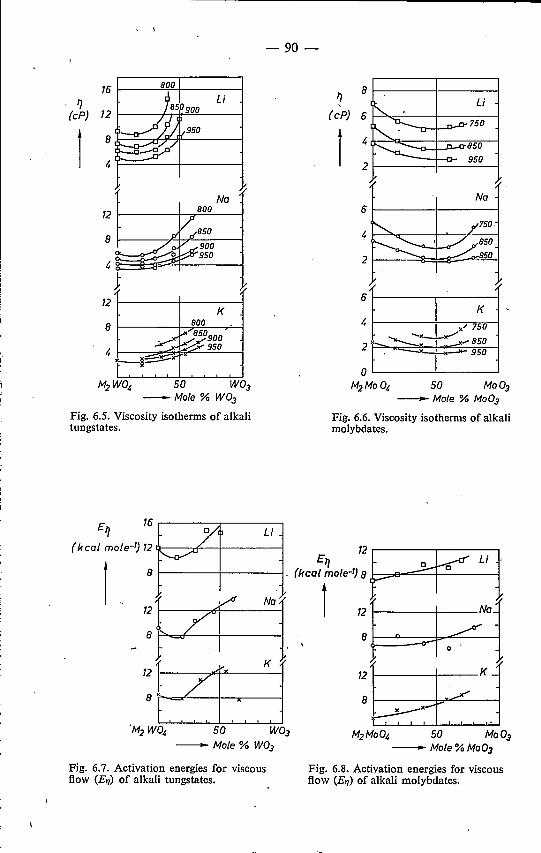
-90-
16 8IJ Li fJ«n 12 (cp) 6
950 I8 4
4 2
Na
12 800 6
850 48900950 24
112 6
K8 4
2
0M2WO~ 50 W03
-Mole% W03Fig. 6.5. Viscosity isotherms of alkalitungstates.
M2MoO~ 50 Mo03-Mole % Mo03
Fig. 6.6. Viscosity isotherms of alkalimolybdates.
~ Li.'o...._ ~...o-7S0
Î'.,_' -u-
~n~8S0
950
Na
r-, 7750.
~~::1
K
x/ 750
s-, ----:~V~....8S0--..,. 950
1
M2MoO~ 50 Mo03-Mole%Mo03
Fig. 6.8. Activation energies for viscousflow (E'1) of alkali molybdates.
-Mole% W03
Fig. 6.7. Activation energies for viscousflow (E'1) of alkali tungstates.
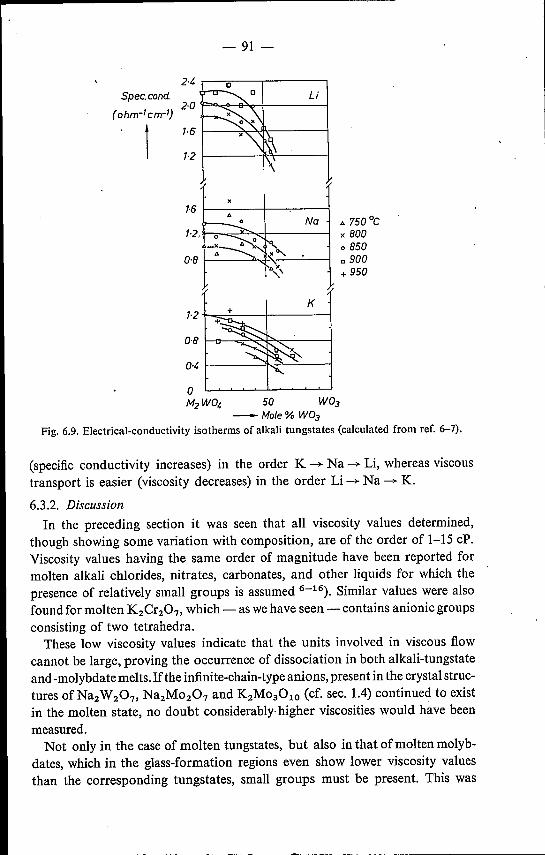
Spec.cond2·0 y:="""".......a~+------...I
(ohm-I cm-I)
1
Li
- 91-
1·6Na '" 750 oe
x 8000850
0·8 0900+ 950
K1·2
0·8
0·1,
oM2WO, 50 W03
-Mole%W03Fig. 6.9. Electrical-conductivity isotherms of alkali tungstates (calculated from ref. 6-7).
(specific conductivity increases) in the order K -)- Na -)- Li, whereas viscoustransport is easier (viscosity decreases) in the order Li -)- Na -)- K.
6.3.2. DiscussionIn the preceding section it was seen that all viscosity values determined,
though showing some variation with composition, are of the order of 1-15cP.Viscosity values having the same order of magnitude have been reported formolten alkali chlorides, nitrates, carbonates, and other liquids for which thepresence of relatively small groups is assumed 6-16). Similar values were alsofound for molten K2Cr207, which - as wehave seen - contains anionic groupsconsisting of two tetrahedra.These low viscosity values indicate that the units involved in viscous flow
cannot be large, proving the occurrence of dissociation in both alkali-tungstateand -molybdatemelts. Ifthe infinite-chain-type anions, present in the crystal struc-tures of Na2W207, Na2M0207 and K2M03010 (cf. sec. 1.4) continued to existin the molten state, no doubt considerably higher viscosities would have beenmeasured.Not only in the case of molten tungstates, but also in that ofmolten molyb-
dates, which in the glass-formation regions even show lower viscosity valuesthan the corresponding tungstates, small groups must be present. This was
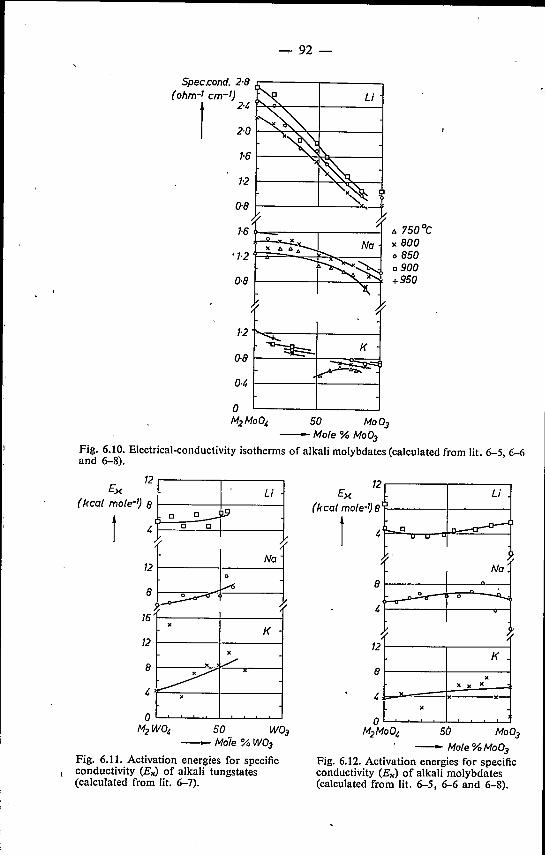
--:- 92 -
Spec.cond. 2·8 .r-----,-------,(ohm-I cm-I)
t 2·ti t-~~","f-----;
50 Mo03-Mo/e%Mo03
Fig. 6.10. Electrical-conductivity isotherms of alkali molybdates (calculated from lit. 6-5, 6-6and 6-8).
12 ,-----,--------,
(krolT~):l c 0 cJ LI 1Na
0
~l~
xK
xv ,/
~"
x
12
8
16
12
8
A 750°Cx 80008500900+950
12Ex
(kcal mo/e-Q 8
t
Li
ti .D.~u u
Na
~ 0 .....
K
xx x x
x
8
12
8
50 W03-Mo7e%W03
Fig. 6.11. Activation energies for specificI conductivity (E,,) of alkali tungstates
(calculated from lit. 6-7).
50- Mo/e%Mo03
Fig. 6.12. Activation energies for specificconductivity (E,,) of alkali molybdates(calculated from lit. 6-5, 6-6 and 6-8).
- 93-
already assumed in the discussion ofundercooling phenomena (see sec. 2.3.2).The fact that, although in both cases viscous transport depends on the migra-
tion of relatively small anionic groups, the viscosities of molten molybdates arelower than those of molten tungstates may perhaps be attributed to higherdeformability of the molybdate polyhedra. This higher deformability wasalready assumed by Van der Wielen et a1.6-2) in discussing glass formation inalkali-molybdate systems. The low viscosity values of molten alkali molybdatesin the glass regions do not appear to contradiet our previous assumption ofthe simultaneous presence of larger groups comprising polyhedra with coordi-nation numbers higher than 4. For viscous flow it appears to be sufficientthat alkali ions together with anionic groups for which the activation energyof migration is smallest take part in the transport mechanism.In the preceding section it was observed that electrical conductivity increases
in the order K -+ Na --+ Li. In this order the radius of the alkali ion decreasesand as a consequence its field strength is raised. A small radius as such gives riseto a higher electrical conductivity, whereas it also involves a higher field strength,giving rise to stronger cation-anion attractions. The fact that electrical con-ductivity is increased by the presence of small cations indicates that the effectfavouring electrical transport (smaller radius) dominates the effect hamperingit (higher field strength).
In chapter 1 (sec 1.5) the theories of Turnbull 6-17) and Sarjeant andRoy 6-18) were mentioned, which, on the basis of theoretical considerations ofnucleation and crystal growth, try to predict glass formation.Turnbull distinguishes between low- and high-viscosity liquids. The former
have a viscosity of the order of 1 cP above the liquidus. Crystallisation canonly be prevented in this type of liquid when nucleation is suppressed com-pletely. This is in accordance with the phenomena observed during cooling oftungstate and molybdate melts: once a nucleus has been formed, crystal growthoccurs almost instantaneously (cf. sec. 2.3.2).In a simplified form 6-19) the equation governing the nucleation frequency I
(number of nuclei per ern" and per s) is -
-NW* -LIG'1= n vexp exp-
RT RT '
where n is the number of atoms per cm", 'V the vibrational frequency of theatoms at the nucleus-liquid interface, N Avogadro's number, R the gas constantand T the temperature (K).
Exp (-NW*{RT) gives the probability at temperature T of a nucleus largerthan the critical size being formed; W* is called by Turnbull and Cohen 6-20)
the "thermodynamic barrier to nucleation". Exp(-LJG'{RT) governs therate at which the structure of the material can be changed during the formation

- 94-
of a nucleus. This may require a diffusion process and/or some kind of reorien-tation. LIG', according to Turnbull and Cohen the "kinetic barrier to nuclea-tion", is the activation energy associated with this rearrangement process.To ensure that no temperature exists at which I reaches the value of
1 cm"? s-\ then, according to the views of Turnbull and Cohen, the condi-tion must be fulfilled that LIG' ~ 40 R Tm (Tm = melting temperature). Fore.g. Na2W207' which has a melting temperature of approximately 1000K(see sec. 1.3), LIG' must have a value higher than 80 kcal mole-I.
An estimate of LIG' can only be made when the mechanism ofnucleation isconsidered in more detail. Turnbull and Cohen discern two types of nucleation,viz. (a) nonreconstructive and (b) reconstructive nucleation.(a) Non-reconstructive nucleation occurs when the structural units in the
nucleus to be formed are identical to those in the liquid. It does not requirethe breaking of strong interatomie bonds. The value of LIG' is likely to beof the same order as the activation energy for viscous flow En- In the caseof molten tungstates and molybdates the values of E" are considerablylower than 40 R T,w If a non-reconstructive rearrangement process occurredduring nucleation, according to the theory of Turnbull and Cohen no glassformation would be found. The fact that glass formation is found, there-fore, suggests that the process of nucleation is reconstructive.
(b) Reconstructive nucleation requires the breaking of strong interatomiebonds. It occurs when the liquid has a random-network structure, or whenthe liquid contains structural units which differ from those in the nucleusto be formed. In this case the value of LIG'(and for network liquids likewisethe value of E,,) is likely to be of the order of bond strength of the strong in-teratomie bonds (for the systems under consideration these are the w-o andMo-O bonds). When the structures oftungstate and molybdate melts, outlin-ed in the previous chapters and the present section, are correct, the processof nucleation will undoubtedly be reconstructive. When relatively smallgroups, or a mixture of small and larger groups form a nucleus containinginfinite-chain-type anions in which part of the polyhedra have undergonea coordinational change, the breaking of w-o and Mo-O bonds isinevitable. The bond strengths of the W-O and Mo-O bonds are 103 and92 kcal mole-l respectively 6-21), higher than 40 R Til" which explains theglass formation found.
The value of this result, however, is doubtful, as Turnbull and Cohen'stheory presupposes the occurrence of homogeneous nucleation. In fact, it ishighly improbable that the liquid will be free of extraneous nuclei.As has been observed in sec. 1.2 the value of the critical cooling rate forms
a quantitative measure of the glass-formation tendency of a melt. From thepoint of view of glass theory it would be an ideal situation if an expressioncould be found by which the value of the critical cooling rate could be cal-
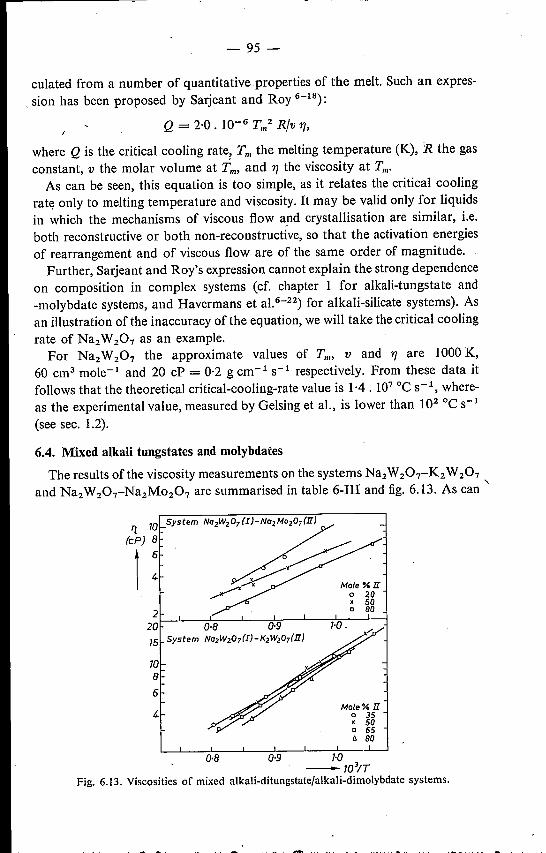
- 95-
culated from a number of quantitative properties of the melt. Such an expres-, sion has been proposed by Sarjeant and Roy 6-18):
Q = 2·0. 10-6 T,,.2 Rjv 1],
where Q is the critical cooling rate, Tm the melting temperature (K), ':R the gasconstant, v the molar volume at T"" and 1] the viscosity at Tm·
As can be seen, this equation is too simple, as it relates the critical coolingrate only to melting temperature and viscosity. It may be valid only for liquidsin which the mechanisms of viscous flow and crystallisation are similar, i.e.both reconstructive or both non-reconstructive, so that the activation energiesof rearrangement and of viscous flow are of the same order of magnitude.
Further, Sarjeant and Roy's expression cannot explain the strong dependenceon composition in complex systems (cf. chapter 1 for alkali-tungstate and-molybdate systems, and Havermans et aI.6-22) for alkali-silicate systems). Asan illustration of the inaccuracy of the equation, we will take the critical coolingrate of Na2 W 207 as an example.
For Na2 W207 the approximate values of Tm, v and 17 are 1000 K,60 cm ' mole-1 and 20 cP = 0·2 g cm-1 S-1 respectively. From these data itfollows that the theoretical critical-cooling-rate value is 1·4 . 107 oe S-I, where-as the experimental value, measured by Gelsing et al., is lower than 102 oe S-1
(see sec. 1.2).
6.4. Mixed alkali tungstates and molybdates
The results of the viscosity measurements on the systems Na2W207-K2 W 207and Na2W207-Na2Mo207 are summarised in table 6-II1 and fig..6.13. As can '\
'I la(cP) 8
1 :
1086
4.Mole% II
o 35x 50o 65IJ. 80
0·8 0·9 1·0-103fT
Fig. 6.13. Viscosities of mixed alkali-ditungstate/alkali-dimolybdate systems.

- 96-
TABLE 6-II1
Viscosity values of mixed alkali-tungstate/alkali-molybdate systems
mole% II activation energy E" temperature viscosity(kcal mole-1) COC) (cP)
system Na2 W207(I)-K2 W207(II)
35 12·8 731 11·34794 7·61790 7·66856 5·44927 3·82972 3·30
50 14·4 685 17·11752 10·22775 9·19814 6·61872 5·00912. 4·01
65 13·9 672 17·34724 11·04804 6·16868 4·65908 3'77960 3·06
80 15·2 708 12·36768 7·48827 5·36885 3·69
system Na2 W207(I)-Na2Mo207(II)
20 13'1 746 9·44818 5·64860 4·66920 3·67
50 9·2 741 6·32809 4·65879 3·44883 3·79

- 97-
mole% II activation energy E'l temperature viscosity(kcal mole-1) COC) (cP)
908 3·22950 2·93
80 10·3 676 7·10751 4·74840 3·25894 2·47936 2·24
be seen from fig. 6.13, in which the viscosity axis is logarithmic, the viscosityvalues of all compositions examined obey satisfactorily the Arrhenius equation.Viscosity isotherms and relations between the activation energy for viscous flowand composition are given in fig. 6.14. For both systems investigated theviscosity isotherms show negative departures from linearity. In the case of themixed-alkali system Na2 W 207-K2 W 207 this complies with the behaviour ofmixed-alkali glasses 6-23). It is pointed out by lsard 6-23) that up till !!OW no
141-----1-----1E1] .
(kcal mole-t)10 I-----r:::""-'="'--j Na2W207(I)-
t N02 M02 07 (Il)6 1-----1-----1
41-.::::g. .........=--p",,__;::;:;,,~
OL_---~""'-'!<-___J
o '------'-----'I 50 E
- Mole % EFig. 6.14. Viscosity isotherms and activation energies for viscous flow of mixed alkali-di-tungstate/alkali-dimolybdate systems.

- 98
satisfactory explanation has been given for the mimmum observed in theviscosity/composition relationship for mixed-alkali systems. From the viscositydata it is clear that the considerable increase of glass formation found in NaKtungstates and Na molybdotungstates (see sec. 2.2) cannot be attributed to anincrease of viscosity.
REFERENCES6-1) J. Frenkel, Kinetic theory of liquids, Dover Publications, New York, 1956, p. 440:6-2) J. C. Th. G. M. van der Wielen, H. N. Stein andJ. M. Stevels, J. non-cryst.
Solids 1, 18-28, 1968., 6-3) F. M. Jaeger and B. Kapma, Z. anorg. allgem. Chem. 113,27-58, 1920.
6-4) V. Spitzin and A. Tscherepneff, Z. anorg. allgem. Chem. 198,276-286,1931.6-5) K. B. Morris, M. I. Cook, C. Z. Sykes and M. B. Templeman, J. Am. chem.
Soc. 77, 851-854, 1955.6-6) K. B. Morris and P. L. Robinson, J. phys, Chem. 68,1194-1205,1964.6-') K. B. Morris and P. L. Robinson, J. chem. eng. Data 9, 444-445, 1964.6-8) A. Kvist and A. Lundén, Z. Naturforsch. 20a, 102-104, 1965.6-9) G. J. Janz and F. Saegusa, J. electrochem. Soc. 110, 452-456, 1963.6-10) R. D. Reeves and G. J. Janz, Rev. sci. Instr. 36, 1124-1129, 1965.6-11) R. D. Reeves and G. J. Janz, Trans. Faraday Soc. 61, 2300-2304, 1965.6-12) T. P. Yao, Giesserei Techn. wissensch. Beihefte, Heft 16, 837-851, 1956.6-13) Landolt-Börnstein, Zahlenwerte und Funktionen, 6th ed., Band IV, Vol. I,
o Springer, Berlin, 1955, p. 600.6-14) M. R. Hopkins and T. C. Toye, Proc. phys. Soc. B 63, 773-782, 1950.6-15) I. G. Murgulescu and S. Zuca, Electrochim. Acta 11, 1383-1389, 1966.6-16) G. J. Janz et al., Molten salts, Vol. 1, Electrical conductance, density and viscosity
data, NBS, Washington, 1968.6-1') D. Turnbull, Contemp. Phys. 10,473-488, 1969.6-18) P. T. Sarjeant and R. Roy, Mat. Res. Bull. 3,265-280,1968.6-19) H. Rawson, Inorganic glass-forming systems, Academic Press, London, 1967,p. 32.6-20) D. Turnbull and M. H. Cohen, J. chem. Phys. 29, 1049-1054, 1958.6-21) H. Rawson, Trav. du IVe congr. intern at. du verre (Paris 1956), Imprimerie Chaix,
Paris, 1957, pp. 62-69.6-22) A. C. J. Havermans, H. N. Stein and J. M. Stevels, J. non-cryst. Solids 5,66-69,
1970.6-23) J. O. Isard, J. non-cryst. Solids 1, 235-261, 1969.
- 99-
7. CONCLUSIONS AND REMARKS
7.1. The structures of vitreous and molten alkali tungstates and molybdates
In chapter 1 it was observed that the structure of a glass is seldom under-stood when the investigation is restricted to one method of approach. There-fore, in the preceding chapters an attempt was made to study the structure ofalkali-molybdate and -tungstate glasses from a number of different angles, viz.from literature data, crystallisation phenomena, infrared spectroscopy, and thedetermination of densities, surface tensions and viscosities of the melts. It isthe purpose ofthe present section to come to a synthesis ofthe results obtained.This synthesis will be summarised in three "main" conclusions, which theresults enable us to draw. After each conclusion the evidence supporting it willbe briefly discussed.
(a) The large anionic groups in crystalline alkali tungstates and molybdatesoccurring in the regions of glass formation, dissociate on melting into a largenumber of smaller groups.
The crystalline compounds in the region of glass formation of which thestructures have been determined, contain anionic groups of the infinite-chaintype (cf. the structures Na2W207, Na2M0207, K2M03010, Rb2M0301o andCs2M03010, which have been discussed in sec. l.3). Evidence for the fact thatthese large groups are not maintained in the molten and vitreous state can bederived from the following:_ Kordes and Nolte 7-1) (see sec. 1.4) concluded from cryometric studies that
Na2 W207 undergoes complete dissociation into Na+ and W042- ions,and W030 particles. However, in our opinion, any dissociation schemeinvolving the presence of considerable amounts of W042- ions can accountfor the experimental data. Such a scheme may be a dissociation accordingto the ideas of Gelsing et aI.7-2) comprising a mixture of averagely shortchains of W04 tetrahedra subject to disproportionation by reactions ofthe type
On the basis of mixing-enthalpy determinations Navrotsky and Kleppa 7-3)(see sec. 1.4) assume alkali dimolybdates also to undergo dissociation onmelting, the dissociation being incomplete and increasing In the orderK->-Na->-Li.
_ The observation of crystallisation phenomena (see sec. 2.3) showed that inthe systems under study, nucleation is the limiting step in crystallisation.Once a nucleus has been formed, crystallisation occurs instantaneously
_,. 100 -
(this already suggests low melt viscosities). It was observed that the tem-perature at which crystallisation sets in on cooling (tCM) decreases when,trioxide is added to either monotungstate or monomolybdate. This decreaseof tCM generally continues beyond the eutectic composition, which can beexplained by the assumption that even beyond, eutectic composition mono-tungstate or monomolybdate nuclei start crystallisation. This, however,implies the presence of considerable amounts of WO/- and Mo042- ionsrespectively, which can only be expected when the large anionic groupsundergo dissociation on melting.
- The infrared spectra of vitreous alkali tungstates in the frequency region1200-300 cm-1 (see sec. 3.3.2) show a great mutual similarity, irrespectiveof trioxide content and alkali species present, a similarity which is not foundin the case of the corresponding crystalline tungstates. This suggests thatthe structures of all alkali-tungstate glasses are essentially the same, Whichcan be explained by the occurrence of dissociation, either according to theideas of Kordes and Nolte 7-1) or to those of Gelsing et aJ.1-2). Thespectra which can be synthesized from those of crystalline Na2 W04,Na2 W207 and W03 considering several values of the degree of dissociation,do not show a satisfactory resemblance to the spectrum ofvitreous Na2 W207'A comparison with the spectrum obtained when Gelsing's dissociationscheme is valid, is not possible, since the absorption maxima produced bythe W-O-W bond èannot be predicted. (It should be noted here that theconclusions drawn from infrared-spectroscopic results are highly tentative,as the absence of long-range order in the vitreous samples strongly affectsthe form of the absorption maxima.)
- Both alkali-tungstate and alkali-molybdate melts are low-viscous, havingviscosities of 1-20 cP and activation energies for viscous flow of 5-15kcal mole-I. This implies that the flow units in these melts cannot be large,and that no breaking of strong bonds (W-O and Mo-O) is involved.
(b) In addition to isolated tetrahedra, vitreous alkali molybdates and their meltscontain larger groups in which the Mo atoms have coordination numbershigher than 4; in the cortesponding tungstates, these larger groups are absent.
- From a survey of phase diagrams of alkali-molybdate and -tungstate systems(see sec. 1.3) it is seen that crystalline molybdates with compositions situatedin the regions of glass formation (viz. di-, tri-, tetramolybdates, etc.) appearmore frequently and have higher thermal stabilities than the correspondingtungstates. Further, crystal-structure data (see sec. 1.3) suggest that theMo atom is more liable to assume distorted coordination than the Watom.Therefore, it is likely that molybdate melts in the regions of glass formationcontain more remnants of the groups found in crystal structures than dothe corresponding tungstate melts.
- 101 -
_ The great mutual similarity shown by the infrared spectra of vitreous alkalitungstates is absent in the case of the corresponding molybdates (see sec.3.4.2). The spectra are dependent on Mo03 contentand also on the natureof the alkali ion, provided that the Mo03 content is not extremely high.Moreover, the infrared spectra of the molybdate glasses show certain simi-larities with the spectra of the crystalline molybdates of equal composition.All this suggests that in the molybdate glasses remnants of the large groupsfound in crystals are still present, involving Mo atoms having coordinationnumbers higher than 4. (Again, the restrietion must be made that the absenceof long-range order in the glasses strongly affects the aspects of the spectra,so that only tentative conclusions can be drawn.)
- The linearity of the ,molar-volume isotherms of molten alkali-tungstatesystems can be correlated with a melt structure containing a mixture ofaveragely short chains oftetrahedra, in accordance with the viewsof Gelsinget a1.7-2). The departures from linearity shown by the isotherms of thecorresponding molybdate systems can be attributed to the occurrence ofpolyhedra with coordination numbers higher than 4 in the glass-formationregions. It should be stressed that the occurrence of these polyhedra impliesthe formation of larger groups.
_ Surface-tension and molar-free-surface-energy values of alkali tungstates inthe glass-formation regions are higher than those of the correspondingmolybdates (see sec. 5.3). Comparison with the surface t~nsions of moltenalkali metasilicates demonstrates that large anionic groups cause lower sur-face-tension values than do small groups. Moreover, when both large andsmall groups are present in the melt, the larger groups will accumulate inthe surface layer as a result of the mechanism of adsorption, thus reducingthe value of surface tension. Therefore, the relatively low surface-tensionvalues shown by alkali-molybdate melts in the glass-formation regions againstrongly suggest the presence of large groups in these melts. At the sametime, the high surface-tension values of the corresponding tungstate meltssuggest the absence of such groups.
(c) The relatively small groups occurring in vitreous and molten alkali tungstatesare subject to disproportienation
From the evidence supporting conclusion Ca)it is seen that tungstate glassesand their melts contain small, anionic groups, while conclusion (b) implies thatthere cannot be relatively large groups present in these glasses and melts, atleast not groups that are liable to raise molar volume and reduce surface ten-sion. The absence of larger groups means that the average coordination numberof the W atoms must be approximately 4. Taking the ditungstate compositionas an example, glass and melt will consist, on average, of dimers W 2ül-·However, as was already mentioned above, Gelsing et a1.7-2) assume the

- 102-
occurrence of disproportionation, this giving rise to a mixture of monomers,dimers, trimers, etc. (see sec. 1.4). '
In the case of phosphate glasses of high alkali content a similar situationexists. Sodium-pyrophosphate glass (Na4P207), for instance, consists, onaverage, of dimers P2074-. However, Westman 7-4) using a paper-chromato-graphic technique, demonstrated unambiguously that these dimers undergosignificant disproportionation, giving rise to a mixture of monomers up to pen-tamers.
Evidence that considerable amounts ofW042- are present in alkali-tungstateglasses and their melts can be derived from the following:- The cryometric phenomena observed by Kordes and Nolte 7-1) can only
be accounted for by the assumption that an Na2 W207 melt contains W042-monomers.
- As was observed above, crystallisation-temperature determinations (seesec. 2.3) suggest that monotungstate nuclei generally start crystallisationeven beyond the eutectic composition. This is only possible when the meltsstill contain considerable amounts of isolated WO/- tetrahedra.
When isolated W042- tetrahedra occur in melts of approximately the di-tungstate composition, then, for stoichiometrie reasons, higher polymers suchas trimers, involving the existence of a disproportionation equilibrium, mustalso be present.
7.2. Glass formation
Having understood to a certain degree the structures of alkali-molybdateand -tungstate glasses and their melts, we will now consider the reasons whyglass formation is found and why it is dependent on the trioxide content andthe nature of the alkali ion.
From the crystallisation phenomena observed it was seen that in the systemsunder consideration nucleation is the limiting step for crystallisation. Accordingto Havermans et al. 7-5) the formation of a nucleus can be separated into twosuccessive steps:(a) the formation of a domain of certain critical dimensions having the corn-
position of the crystal to be formed (formation of a protonucleus);(b) the ordering of such a domain (formation of a nucleus).
When trioxide is added to a melt of the monornolybdate or monotungstatecomposition, the statistical probability of the formation of a monomolybdateor monotungstate protonucleus gradually decreases. Consequently, the chanceof by-passing crystallisation and thus glass formation is increased. The initialformation of ditungstate or dimolybdate nuclei is highly improbable as this islimited by step (b): formation of these nuclei requires a reconstructive processin which the breaking of strong W-O or Mo-O bonds is inevitable (see sec.6.3.2).
- 103-
However, when considerable amounts of trioxide have been added, thenumber of larger groups is raised more and more. Formation of larger groupsimplies an increase in the tendency of Wand Mo atoms to assume highercoordination numbers than 4, corresponding to the situation in crystalline di-,tri- and higher tungstates and molybdates. The process of nucleation needs nolonger be reconstructive and, therefore, the tendency to crystallisation isincreased.On this line of reasoning, the presence in the molybdate melts of large groups
containing polyhedra with coordination numbers higher than 4 may accountfor the fact that the glass-formation tendency in molybdate systems generallyis lower than that in tungstate systems.The nature of the alkali ion may influence the glass-formation tendency in at
. least three different ways:(a) As its radius decreases and its field strength increases, the alkali ion is
likely to have a stronger distorting effect on the complex anion, thusfavouring glass formation. Molybdate polyhedra are probably more sen-sitive to this effect than tungstate polyhedra, as Mo atoms are assumed tohave more different coordination possibilities (see sec. 1.3).
(b) The relative numbers of smaller and larger groups (in molybdate melts:degree of dissociation; in tungstate melts: degree of disproportionation)are likely to be dependent on the nature of the alkali ion. Navrotsky andKleppa 7-3) already assumed that M2M0207 on melting undergoesstronger dissociation in the order K ---+ Na ---+ Li. Likewise, Lindqvist 7-6)and Seleborg 7-7) assumed that smaller alkali ions, having higher fieldstrengths, tend to reduce the size of the anionic groups in molybdate melts.In tungstate melts, which contain chains of W04 tetrahedra, theaverage chain length is determined by the trioxide content. However, theposition of the disproportionation equilibrium may be dependent on thenature ofthe alkali ion. For instance, small ions having a high field strengthand a tendency to assume low coordination numbers with respect to oxygen,may surround themselves by a number of W042- monomers, which possessa high field strength compared with larger anionic groups. In that way thedegree of disproportienation will be raised.This dependence of disproportionation on the nature of the alkali ion canalso be observed in the work of Westman 7-4), who determined the chain-length distribution in alkali-phosphate glasses. For example, with an averagechain length of 4, the proportion of P atoms occurring in tetramers is 20 %in lithium phosphates, 27% in sodium phosphates, and 30% in potassiumphosphates.Both a higher degree of dissociation and a higher degree of disproportiona-tion may favour glass formation.
(c) When the tendency of small alkali ions to create a surrounding of isolated

104 -I
tetrahedra is very strong, submicroscopical phase separation may occur.Domains containing relatively high proportions of monomers and alkaliions will be formed next to domains containing relatively low proportionsof alkali ions and high proportions of larger groups. This tendency willfavour nucleation and, therefore, will counteract glass formation.It can be seen from the results obtained by Gelsing et aI.7-2) and Van der
Wielen et aJ.1-S) (see sec. 1.2 and fig. 1.1) that, generally, the glass-formationtendency in alkali-tungstate and -molybdate systems increases with decreasingradius of the alkali ion. This indicates that effects (a) and (b) generally dominateeffect (c). The only exception to this rule is formed by the Li-tungstate system,suggesting that in this case effect (c) is predominant.The fact that a similar behaviour is not found in the case of the corresponding
molybdate system may be attributed to either (i) effect (a) being stronger inmolybdate systems than in'tungstate systems, or (ii) the proportion of isolatedtetrahedra in molybdate melts being relatively low.In chapter 1 it was observed that the structures proposed by Gelsing et aI.7-2)
and Van der Wielen et aI.7-S) for alkali-tungstate and -molybdate glasses andtheir melts, being based on a limited amount of experimental data, were highlytentative. It is certainly remarkable that our own ideas on these structuresnevertheless correspond to a high degree with those expressed by the above-mentioned authors, the difference being that we have emphasized the presenceof large groups in the melts of vitreous alkali molybdates.
7.3. A comparison with similar glasses
For a long time it was thought that the existence of large groups in the melt,giving rise to a high viscosity, was a necessary condition for glass formation.Although the presence of large, irregular groups in the melt certainly favoursglass formation, it is becoming more and more clear that even melts containingexclusively small ions can form a glass.In sec. 2.2.2 the existence of vitreous nitrates has been mentioned. In these
systems no large anionic groups are found. It should be noted, however, thatDavis et al.7-9) assume the occurrence of association complexes (e.g. Na2N03 +and Na(N03h - ions) in alkali-nitrate melts. These may favour glass formation.Glasses containing exclusively small anionic groups can also be prepared in
the alkali-silicate systems. When the number of bridging oxygen ions per Si04tetrahedron (= Y in the nomenclature of Stevels 7-10)) is considerably lowerthan 2, a mixture of relatively small chains of tetrahedra is formed. From thework of Havermans et al.7-5) it is seen that in the K- and NaK-silicate systemsglass formation is possible up to compositions approaching that of the ortho-silicates, involving Y values hardly higher than o.The glasses which are probably most interesting in this context are alkali-
phosphate glasses of high alkali content 7-4), the existence ofwhich has already
105 -
been 'mentioned above. In these glasses the P atoms are tetrahedrally coor-dinated by oxygen. Glass formation is again possible in regions where only amixture of relatively short chains is present. By means of'paper-chrornatographictechniques Westman 7-4) was able to determine the chain-length distribution.It was already remarked that from the results o~tained it can be seen that the. chains are subject to stronger disproportionation in the order K -+ Na --+ Li.
Vitreous alkali tungstates and molybdates, therefore, are 'not unique becauseof the relatively small anions they contain. They are, however, unparalleledbecause of the phenomenon that, in the vitreous and molten state, coordinationsare found which are essentially different from those observed in the crystallinestate.
7.4. Final remarks
In sec. 1.5 a number of general glass-formation theories were discussed, noneof which, however, appears to have general validity. The reason for this is thatthe authors of these theories, without exception, try to reduce the problem ofglass formation to a matter involving merely one or two simple properties ofthe glass-forming systems.It is more likely, however, that a complex of properties influences the tendency
to glass formation, the property preventing crystallisation varying from case tocase.
Moreover, it may be doubted whether a classification of materials in twogroups, the one capable of forming glasses and the other incapable in doing so,is of value until such time as all glass-formation tendencies have been measuredquantitatively. In fact, every liquid can form a glass when it is cooled sufficientlyrapidly to a sufficiently low temperature.
The first section of this thesis was devoted to a short survey of applicationsand possible applications of glasses containing appreciable amounts of W03and/or Mo03• After that section, we restricted ourselves to the investigationof vitreous alkali tungstates and molybdates. Obviously, these glasses are notof commercial interest because of their high critical cooling rates. Perhaps thesecritical cooling rates can be satisfactorily reduced by a combination of W03and Mo03 together with various alkali and alkaline-earth oxides. Indicationsfor this can be found in the increased glass-formation tendencies in mixedalkali-tungstate/alkali-molybdate systems, the commercial glasses based onMo03, W03, MgO and BaO 7-11) (see sec. 1.1), and the comparable mixedalkali/alkaline-earth nitrate 7-12), carbonate 7-12), and silicate (invert) glasses7-13).
REFERENCES7-1) E. Kordes and G. No l te, Z. anorg. allgem. Chem. 371, 156-171,1969.7-2) R. J. H. Gelsing, H. N. Stein and J. M. Stevels;Phys. Chern, Glasses 7, 185-190,
1966.
- 106-
7-3) A. Navrotsky and O. J. Kleppa, Inorg. Chem. 6, 2119-2121,1967.7-4) A. E. R. Westman, in: J. D. Mackenzie (ed.), Modern aspects ofthe vitreous state,
Butterworths, London, 1960, Vol. 1, pp. 63-92.7-5) A. C. J. Havermans, H. N. Stein and J. M. Stevels, J. non-cryst, Solids 5,66-69,
1970.7-6) I. Lindqvist, Nov. Acta. reg. Soc. scient. Uppsaliensis, Ser. IV, Vol. 15, No. I, 1950.7-7) M. Seleborg, Acta chem. Scand. 21, 499-504, 1967.7-8) J. C. Th: G. M. van der Wielen, H. N. Stein and J. M. Stevels, J. non-cryst.
Solids 1, 18-28, 1968.7-9) W. J. Davis, S. E. Rogers and A. R. Ubbelohde, Proc. Roy. Soc. A 220, 14-24,
1953.7-10) J. M. Stevels, Glass Tnd. 35, 657-662, 1964.'7-11) Brit. Pat. Spec. 1,444,153; No. 23872/66.7-12) H. Rawson, Inorganic glass-forming systems, Academic Press, London, 1967.7-13) H. J. L. Trap and J. M. Stevels, Glastechn. Ber. 32K, VI, 31-52, 1959.