philippa howden-chapman new zealand’s housing
TRANSCRIPT
Alan Johnson Philippa Howden-ChapmanShamubeel EaqubA Stocktake of
New Zealand’s Housing— FEBRUARY 2018 —
ACKNOWLEDGEMENTS
The authors would like to thank the many analysts in the Ministry of Business, Innovation and Employment, Ministry of Social Development, Statistics NZ, Ministry of Health, Housing NZ, Treasury, Te Puni Kōkiri, emergency housing providers and researchers in He Kainga Oranga/Housing and Health Research Programme, University of Otago, Wellington for the data they have provided.
Disclaimer
The views, opinions, findings, and conclusions expressed by the authors – Alan Johnson, Philippa Howden-Chapman and Shamubeel Eaqub – in this report do not necessarily reflect the views of the NZ Government, the Ministry of Business, Innovation and Employment (MBIE) or any other government agency.
MBIE has made every effort to ensure that the information contained in this report is reliable, but does not guarantee its accuracy or completeness and does not accept any liability for any errors.
Crown Copyright © 2018
Unless otherwise indicated, this work is protected by copyright owned by the Crown.
This work is licensed for re-use under a Creative Commons Attribution 4.0 International Licence. In essence, you are free to copy, distribute and adapt the material, as long as you attribute the work to the Crown and abide by other licence terms. To view a copy of this licence, visit https://creativecommons.org/licenses/by/4.0/. Please note that no departmental or governmental emblem, logo or Coat of Arms may be used in any way which infringes any provision of the Flags, Emblems, and Names Protection Act 1981. Attribution to the Crown should be in written format and not by reproduction of any such emblem, logo or Coat of Arms.
Copyright in the photographs used in this publication is not owned or licensed to you by the Crown. You cannot copy, distribute or adapt any photograph without the agreement of the copyright owner.
ISBN 978-1-98-853554-8 (online)
A Stocktake of New Zealand’s Housing – February 2018
TABLE OF CONTENTS
FOREWORD – HOUSING STOCKTAKE 2
INTRODUCTION 3
1. MARKET RENTING 7
2. HOME OWNERSHIP 13
3. NEW HOUSING 19
4. STATE AND OTHER SOCIAL HOUSING 26
5. HOUSING ASSISTANCE 31
6. HOMELESSNESS AND EMERGENCY HOUSING 35
7. SECURITY OF TENURE 38
8. THE SOCIAL COSTS AND BENEFITS OF HOUSING QUALITY 42
REFERENCES 47
APPENDICES 53
1
A Stocktake of New Zealand’s Housing – February 2018
Foreword – Housing Stocktake
There was a time, in the not-so distant past, when housing was affordable and buying a house to raise your family was not the unobtainable dream it is today.
With homeownership now at a 60-year low and families forced to live in overcrowded houses, it is clear New Zealand’s housing system is failing too many people. That an unknown number of children are living in cars and thousands more are admitted to hospital every year with preventable illnesses caused by poor housing, is nothing short of a tragedy.
This Government is committed to fixing New Zealand’s housing crisis.
But to understand how to fix the crisis, we must first understand the extent of the problems. This requires a “warts and all” look at the entire housing continuum from homelessness, to the rising demand for state houses, through to the state of the real estate market.
For this reason, the Government commissioned independent experts Alan Johnson, Philippa Howden-Chapman and Shamubeel Eaqub to report on the state of housing in New Zealand.
This report is an important building block that will help the Government make policy decisions. It assesses the key parts of our housing system; examining market renting, homeownership, new housing, state and social housing, housing assistance, homelessness and emergency housing, security of tenure and the social costs and benefits of housing quality.
We must acknowledge the harsh effects the housing crisis has had on Māori. They have borne the brunt of rapidly rising house prices and skyrocketing rents. A crucial part of Government policy must help more Māori into their own homes, and there are great opportunities to partner with Māori organisations to do this.
All New Zealanders deserve to have a secure and healthy home. That is the foundation which allows us all to build happy and successful lives.
It is time to take bold action to stop the stress and disruption the housing crisis is causing our people, and especially our kids.
HON PHIL TWYFORDMinister of Housing and Urban Development
February 2018
2
A Stocktake of New Zealand’s Housing – February 2018
This stocktake report was commissioned by the Minister of Housing and Urban Development the Hon Phil Twyford in November 2017. Its main purpose is to provide the New Zealand public with a broad overview of the current state of housing markets and the housing system in New Zealand. This overview takes the form of a series of brief reviews of various housing outcomes and policy areas and backs these with extensive data and additional references.
The brevity of this overview alongside the complexity of the topics it grapples with means that this stocktake is high level and intentionally so. Such a perspective has allowed the authors to identify the key issues facing New Zealand in the housing and social policy spaces. However, although the project brief was to produce a report which is quite descriptive and avoids commenting on policy, this direction has proved difficult to follow completely. This is in part because many of the outcomes identified here are a consequence of policy – the high levels of children’s hospitalisations as a result of poor quality housing is one such example.
The approach taken here is to limit commentary on policy to just the identification of areas where either additional work should be done or where a re-focus might be useful. Based on this approach the following is offered as a summary of this stocktake.
Response to homelessness inadequate
In mid-2016 the previous National Government began to appreciate the extent of the growing shortage in affordable good quality rental housing and commenced an emergency housing programme with some urgency. This programme has expanded the number of places available for families without secure housing from 643 in September 2016 to 1,663 in September 2017 with a target of 2,155 places by the end of 20171 and introduced the Emergency Housing Special Needs Grant (EHSNG). Over the same period the numbers of households categorised as Priority A on the social housing waiting list and living in insecure housing almost doubled from 1,139 to 2,168. Evidence on the size and trends in homelessness is always difficult to gather on account of the diverse nature of the problem and the difficulty in measuring it because of privacy and often secrecy around it. From the limited primary data gathering able to be done in the preparation of this report there is no evidence available to suggest that the homelessness problem – in its many guises – is easing, but it may be stabilising. The suggestion by Ministry of Business Innovation and Employment (MBIE) in its briefing to the Minister of Housing and Urban Development that Auckland’s housing shortage has reached almost 45,000 units and grew by about 8,000 in the past year suggests that the most recent response may still not be adequate.
Introduction
3
A Stocktake of New Zealand’s Housing – February 2018
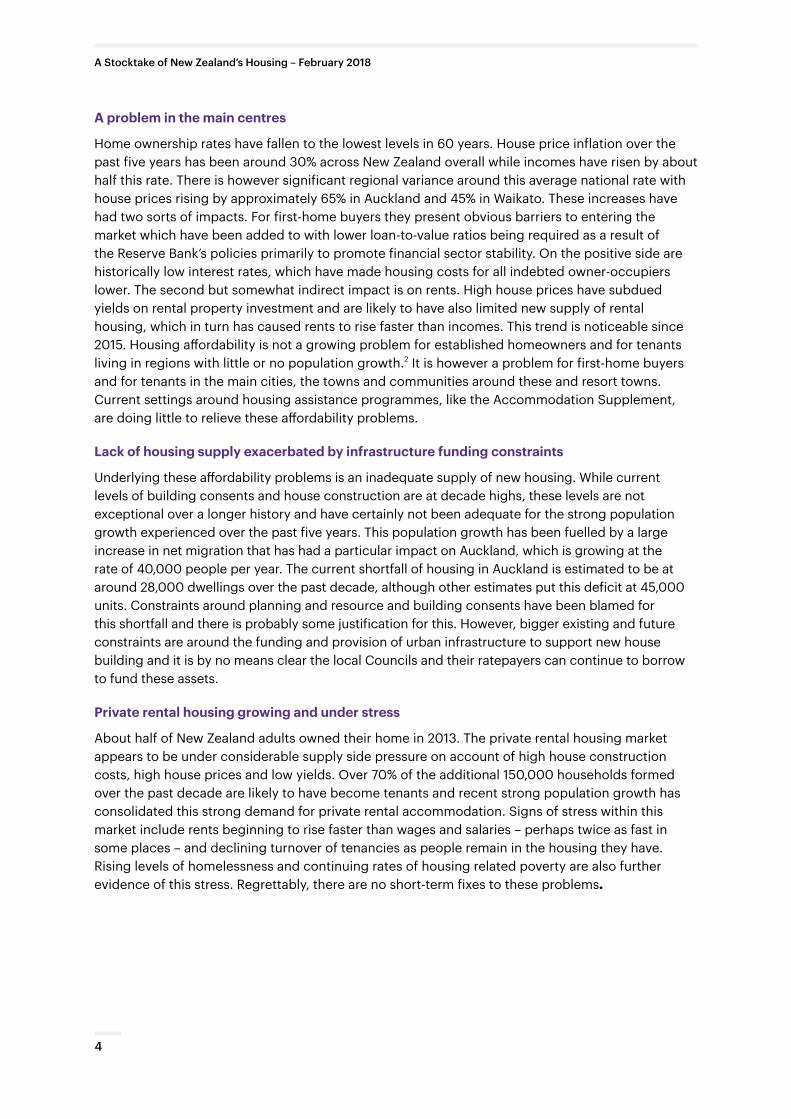
A problem in the main centres
Home ownership rates have fallen to the lowest levels in 60 years. House price inflation over the past five years has been around 30% across New Zealand overall while incomes have risen by about half this rate. There is however significant regional variance around this average national rate with house prices rising by approximately 65% in Auckland and 45% in Waikato. These increases have had two sorts of impacts. For first-home buyers they present obvious barriers to entering the market which have been added to with lower loan-to-value ratios being required as a result of the Reserve Bank’s policies primarily to promote financial sector stability. On the positive side are historically low interest rates, which have made housing costs for all indebted owner-occupiers lower. The second but somewhat indirect impact is on rents. High house prices have subdued yields on rental property investment and are likely to have also limited new supply of rental housing, which in turn has caused rents to rise faster than incomes. This trend is noticeable since 2015. Housing affordability is not a growing problem for established homeowners and for tenants living in regions with little or no population growth.2 It is however a problem for first-home buyers and for tenants in the main cities, the towns and communities around these and resort towns. Current settings around housing assistance programmes, like the Accommodation Supplement, are doing little to relieve these affordability problems.
Lack of housing supply exacerbated by infrastructure funding constraints
Underlying these affordability problems is an inadequate supply of new housing. While current levels of building consents and house construction are at decade highs, these levels are not exceptional over a longer history and have certainly not been adequate for the strong population growth experienced over the past five years. This population growth has been fuelled by a large increase in net migration that has had a particular impact on Auckland, which is growing at the rate of 40,000 people per year. The current shortfall of housing in Auckland is estimated to be at around 28,000 dwellings over the past decade, although other estimates put this deficit at 45,000 units. Constraints around planning and resource and building consents have been blamed for this shortfall and there is probably some justification for this. However, bigger existing and future constraints are around the funding and provision of urban infrastructure to support new house building and it is by no means clear the local Councils and their ratepayers can continue to borrow to fund these assets.
Private rental housing growing and under stress
About half of New Zealand adults owned their home in 2013. The private rental housing market appears to be under considerable supply side pressure on account of high house construction costs, high house prices and low yields. Over 70% of the additional 150,000 households formed over the past decade are likely to have become tenants and recent strong population growth has consolidated this strong demand for private rental accommodation. Signs of stress within this market include rents beginning to rise faster than wages and salaries – perhaps twice as fast in some places – and declining turnover of tenancies as people remain in the housing they have. Rising levels of homelessness and continuing rates of housing related poverty are also further evidence of this stress. Regrettably, there are no short-term fixes to these problems.
4
A Stocktake of New Zealand’s Housing – February 2018
Housing insecurity increases for Māori and Pacific peoples
Recent housing policies have failed to address the housing problems of Māori and Pacific peoples. Rising housing costs have contributed to declining home ownership rates, greater housing instability, and Māori and Pacific peoples living in poor quality housing. By 2013, Māori and Pacific homeownership rates had declined relatively rapidly to 28% for Māori and 19% for Pacific peoples, compared with 57% for Europeans.
Māori landowners have a range of spiritual, cultural and economic aspirations for their whenua including housing. Despite the apparent availability of land owned by Māori, there are challenges related to achieving the right to build on multiply owned land, the provision of infrastructure, access to finance, and central and local planning rules.3,4 Reductions in the number of state houses have led to major shifts in tenure patterns for those on low incomes. In the renting population, between 1986 and 2013, the proportion of Māori renting state housing dropped by 29 percentage points compared to 16 points overall. As state housing has become less available, unaffordable rentals in the private market have become the only option available for many families. Again in the renting population, the proportion renting in the private sector rose rapidly from 1986, but for Māori, the percentage increased from 41% to 77%. In 1986, around half of Māori children lived in an owner-occupied dwelling, but by 2013, the proportion was only 39%.5
These trends are also clear for Pacific peoples. Between 1986 and 2013, the proportion of Pacific peoples renting state housing dropped 27 percentage points and the proportion renting in the private sector increased from 27% to 56%. The proportion of Pacific children who lived in an owner-occupied dwelling dropped from around half in 1986 to 28% in 2013.
Private rental tenants generally pay a much higher proportion of their disposable household income on housing than owner-occupiers or social housing tenants. Because rising housing costs are increasingly impoverishing low-income households, one response to these costs is household crowding, which adds to the serious risks of infectious diseases and hospitalisation, and another is increased rates of homelessness. Concerted effective policy action is needed to increase home ownership and rental security for Māori and Pacific households.5
The future of the Accommodation Supplement
The previous Government’s decision to increase maximum payments under the Accommodation Supplement (AS) programme was overdue and the present Government’s decision to press ahead with these increases, in April 2018, is sensible under the circumstances of rising rents and increasing levels of housing-related poverty. However, such policy adjustments are unlikely to offer much relief and cannot be seen as a medium-term solution to the clear limitations of the AS as one of the main housing affordability policy instruments. The announced changes will eventually put a further $500 million annually into the AS programme and more than $400 million into private rental housing markets. The extent to which the AS is effectively a tenants’ or landlords’ subsidy is unclear, but will be partly determined by the available rental supply and will be tested by changes in rents during mid-2018 as this increased expenditure feeds through. The supply side pressure in private rental housing markets suggests that much of this increase will be soaked up in even higher rents. If this is the case then the need for a radical review of the AS will become apparent.
5
A Stocktake of New Zealand’s Housing – February 2018
Tenants’ rights need strengthening
Private rental housing tends to be of poorer quality and the tenure of such housing is more tenuous than home ownership. In the absence of any regulatory enforcement and as demand has out-stripped supply, there have been few incentives for landlords to maintain or improve the quality of their rental houses, which on average are of poorer quality than owner-occupied homes. The social and economic costs of these poor housing conditions and of insecure tenure are well documented in this paper. Tenant households tend to have higher housing costs relative to their income and to suffer poorer health outcomes. In addition, children from tenant households are more mobile and are at greater risk of not succeeding at school. In the current market there are few incentives for landlords to have fixed-term tenancy agreements longer than 12 months, which precludes rent increases for the duration of the tenancy (unless otherwise agreed). This leaves most tenants with little security of tenure and no effective protection against frequent six-monthly rent increases.6 Private rental housing will feature prominently in our future housing landscape, regardless of what is achieved in building more social housing and in extending home ownership options for first time home buyers. The authors see a fundamental review of tenancy law, which provides greater security of tenure for tenants and encourages professional landlordism, as being an important and overdue social policy challenge.
Older people facing increasing housing-related poverty
The falling rates of homeownership over the past 25 years is now feeding through into the housing options for retiring Baby Boomers. The numbers of people receiving both New Zealand Superannuation and an Accommodation Supplement payment is growing by 2,000 per year. While the historic basis for current retirement income policy settings is unclear these were developed in a time where most people retired with debt-free home ownership and when there was adequate provision of social housing to cater for those who had not achieved this. These conditions are long gone and increasing numbers of retired people will need to gain housing in the private rental market. Their limited income – even with the Accommodation Supplement – may make this difficult and there is a growing risk that we will see more and more older people living in housing-related poverty.
6
A Stocktake of New Zealand’s Housing – February 2018
Renting can give flexibility, but can also cause instability. While renting is a good option for many, for others, especially those with young children or those who are retired, the lack of control of housing costs and dislocation can have far-reaching consequences discussed later. Though current rental laws do not preclude long-term rentals, the market pattern is commonly a one-year fixed tenancy with an average relatively short term of about two-years. Without a fixed-term tenancy, a landlord is only required to give tenants 90-days’ notice.
Renting is becoming less affordable than it was in the 1980s, with a pattern of an increasing number of crowded households and number of people living in them and ongoing state assistance. Growing demand, when there is already an inadequate supply of housing, combined with the sale of public housing, is creating intense pressures. The rental stock is less likely to turn over and tenancies are gradually becoming longer – consistent with a tighter rental market.
1.1 Demand and supply of rental housing
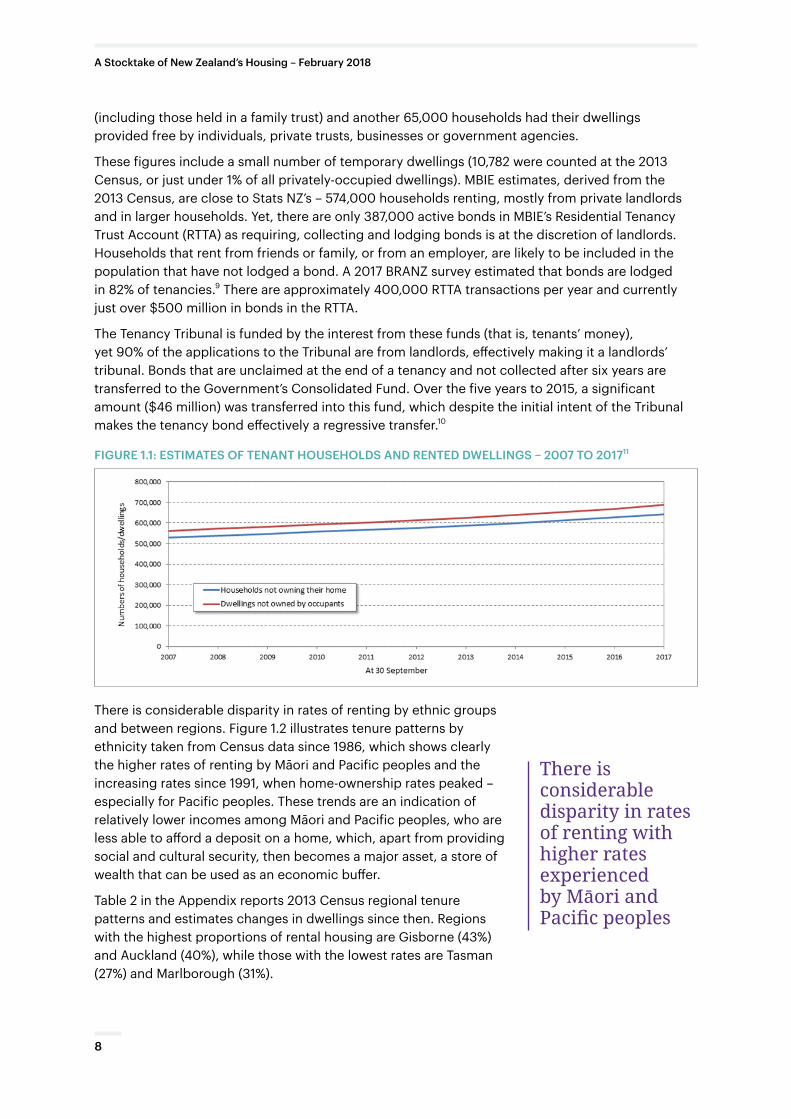
In the 2013 Census, only about half New Zealand adults owned their home.7 In official statistics, housing tenure is measured in two main ways – the tenure of the household and the tenure of all New Zealand adults (15+).8 In the 2013 Census, 33% of people in households lived in a rented dwelling. A further 3% lived in a rent-free dwelling. As at 30 September 2017, Stats NZ estimates of households and dwellings by tenure show that the number of dwellings either rented or provided rent-free to occupants grew almost 23% between 2007 and 2017, while the total number of dwellings grew just 11% (see Figure 1.1 and Appendix Table 1). This means that nearly 70% of the additional dwellings were occupied by tenants. In turn, this indicates that the proportion of dwellings tenanted rose from 34% in late 2007 to 37% in late 2017. These estimates assume a continuation of recent trends in household tenure, until definitive results from the 2018 census are available.
Quarterly Stats NZ dwelling and household estimates indicate that there are around 581,000 renting households at 31 December 2017. A further 1,735,000 households were ‘owner-occupied’
Market Renting
1.
581,000 of households in New Zealand are renters
581k7
A Stocktake of New Zealand’s Housing – February 2018
(including those held in a family trust) and another 65,000 households had their dwellings provided free by individuals, private trusts, businesses or government agencies.
These figures include a small number of temporary dwellings (10,782 were counted at the 2013 Census, or just under 1% of all privately-occupied dwellings). MBIE estimates, derived from the 2013 Census, are close to Stats NZ’s – 574,000 households renting, mostly from private landlords and in larger households. Yet, there are only 387,000 active bonds in MBIE’s Residential Tenancy Trust Account (RTTA) as requiring, collecting and lodging bonds is at the discretion of landlords. Households that rent from friends or family, or from an employer, are likely to be included in the population that have not lodged a bond. A 2017 BRANZ survey estimated that bonds are lodged in 82% of tenancies.9 There are approximately 400,000 RTTA transactions per year and currently just over $500 million in bonds in the RTTA.
The Tenancy Tribunal is funded by the interest from these funds (that is, tenants’ money), yet 90% of the applications to the Tribunal are from landlords, effectively making it a landlords’ tribunal. Bonds that are unclaimed at the end of a tenancy and not collected after six years are transferred to the Government’s Consolidated Fund. Over the five years to 2015, a significant amount ($46 million) was transferred into this fund, which despite the initial intent of the Tribunal makes the tenancy bond effectively a regressive transfer.10
FIGURE 1.1: ESTIMATES OF TENANT HOUSEHOLDS AND RENTED DWELLINGS – 2007 TO 201711
There is considerable disparity in rates of renting by ethnic groups and between regions. Figure 1.2 illustrates tenure patterns by ethnicity taken from Census data since 1986, which shows clearly the higher rates of renting by Māori and Pacific peoples and the increasing rates since 1991, when home-ownership rates peaked – especially for Pacific peoples. These trends are an indication of relatively lower incomes among Māori and Pacific peoples, who are less able to afford a deposit on a home, which, apart from providing social and cultural security, then becomes a major asset, a store of wealth that can be used as an economic buffer.
Table 2 in the Appendix reports 2013 Census regional tenure patterns and estimates changes in dwellings since then. Regions with the highest proportions of rental housing are Gisborne (43%) and Auckland (40%), while those with the lowest rates are Tasman (27%) and Marlborough (31%).
There is considerable disparity in rates of renting with higher rates experienced by Māori and Pacific peoples
8
A Stocktake of New Zealand’s Housing – February 2018
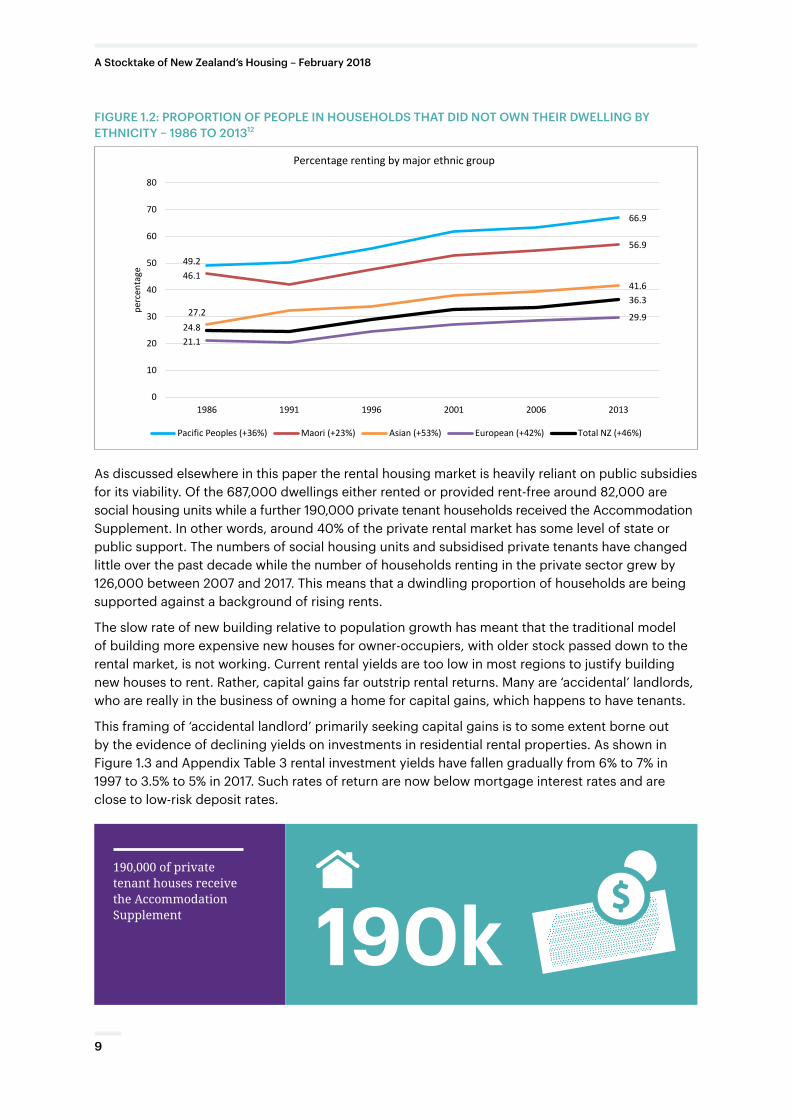
FIGURE 1.2: PROPORTION OF PEOPLE IN HOUSEHOLDS THAT DID NOT OWN THEIR DWELLING BY ETHNICITY – 1986 TO 201312
49.2
66.9
46.1
56.9
27.2
41.6
21.1
29.9 24.8
36.3
0
10
20
30
40
50
60
70
80
1986 1991 1996 2001 2006 2013
perc
enta
ge
Percentage renting by major ethnic group
Pacific Peoples (+36%) Maori (+23%) Asian (+53%) European (+42%) Total NZ (+46%)
As discussed elsewhere in this paper the rental housing market is heavily reliant on public subsidies for its viability. Of the 687,000 dwellings either rented or provided rent-free around 82,000 are social housing units while a further 190,000 private tenant households received the Accommodation Supplement. In other words, around 40% of the private rental market has some level of state or public support. The numbers of social housing units and subsidised private tenants have changed little over the past decade while the number of households renting in the private sector grew by 126,000 between 2007 and 2017. This means that a dwindling proportion of households are being supported against a background of rising rents.
The slow rate of new building relative to population growth has meant that the traditional model of building more expensive new houses for owner-occupiers, with older stock passed down to the rental market, is not working. Current rental yields are too low in most regions to justify building new houses to rent. Rather, capital gains far outstrip rental returns. Many are ‘accidental’ landlords, who are really in the business of owning a home for capital gains, which happens to have tenants.
This framing of ‘accidental landlord’ primarily seeking capital gains is to some extent borne out by the evidence of declining yields on investments in residential rental properties. As shown in Figure 1.3 and Appendix Table 3 rental investment yields have fallen gradually from 6% to 7% in 1997 to 3.5% to 5% in 2017. Such rates of return are now below mortgage interest rates and are close to low-risk deposit rates.
190,000 of private tenant houses receive the Accommodation Supplement 190k
9
A Stocktake of New Zealand’s Housing – February 2018
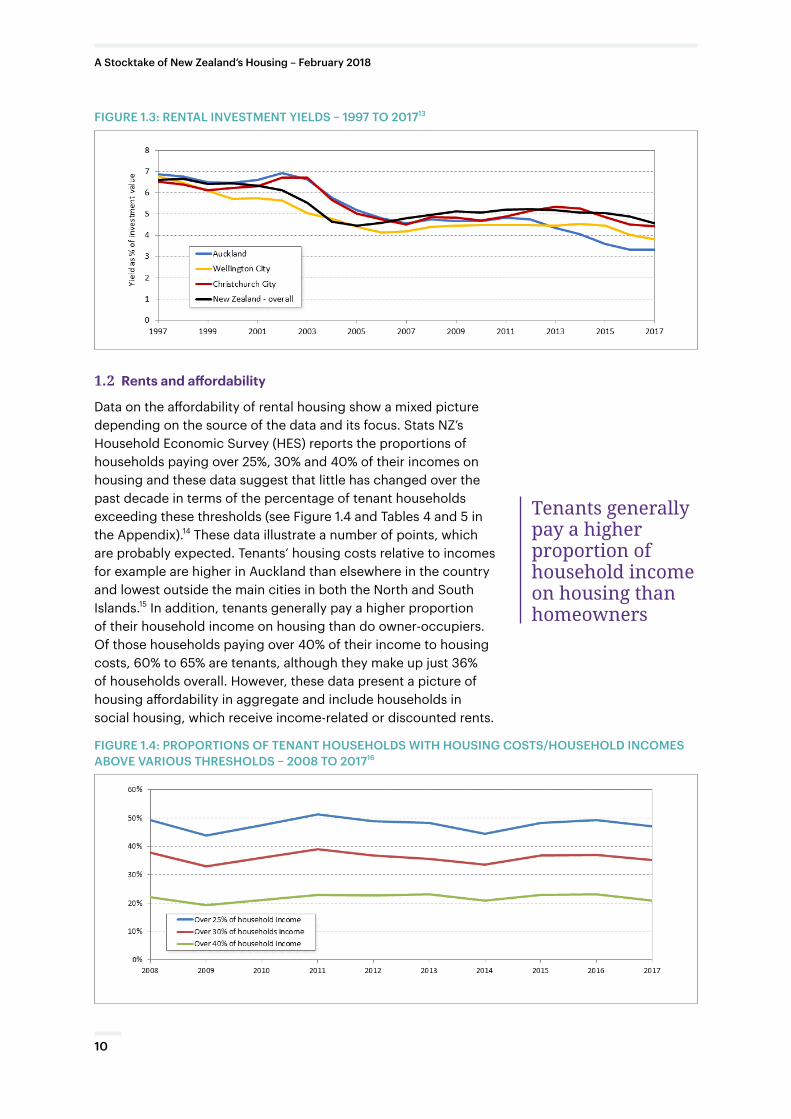
FIGURE 1.3: RENTAL INVESTMENT YIELDS – 1997 TO 201713
1.2 Rents and affordability
Data on the affordability of rental housing show a mixed picture depending on the source of the data and its focus. Stats NZ’s Household Economic Survey (HES) reports the proportions of households paying over 25%, 30% and 40% of their incomes on housing and these data suggest that little has changed over the past decade in terms of the percentage of tenant households exceeding these thresholds (see Figure 1.4 and Tables 4 and 5 in the Appendix).14 These data illustrate a number of points, which are probably expected. Tenants’ housing costs relative to incomes for example are higher in Auckland than elsewhere in the country and lowest outside the main cities in both the North and South Islands.15 In addition, tenants generally pay a higher proportion of their household income on housing than do owner-occupiers. Of those households paying over 40% of their income to housing costs, 60% to 65% are tenants, although they make up just 36% of households overall. However, these data present a picture of housing affordability in aggregate and include households in social housing, which receive income-related or discounted rents.
FIGURE 1.4: PROPORTIONS OF TENANT HOUSEHOLDS WITH HOUSING COSTS/HOUSEHOLD INCOMES ABOVE VARIOUS THRESHOLDS – 2008 TO 201716
Tenants generally pay a higher proportion of household income on housing than homeowners
10
A Stocktake of New Zealand’s Housing – February 2018
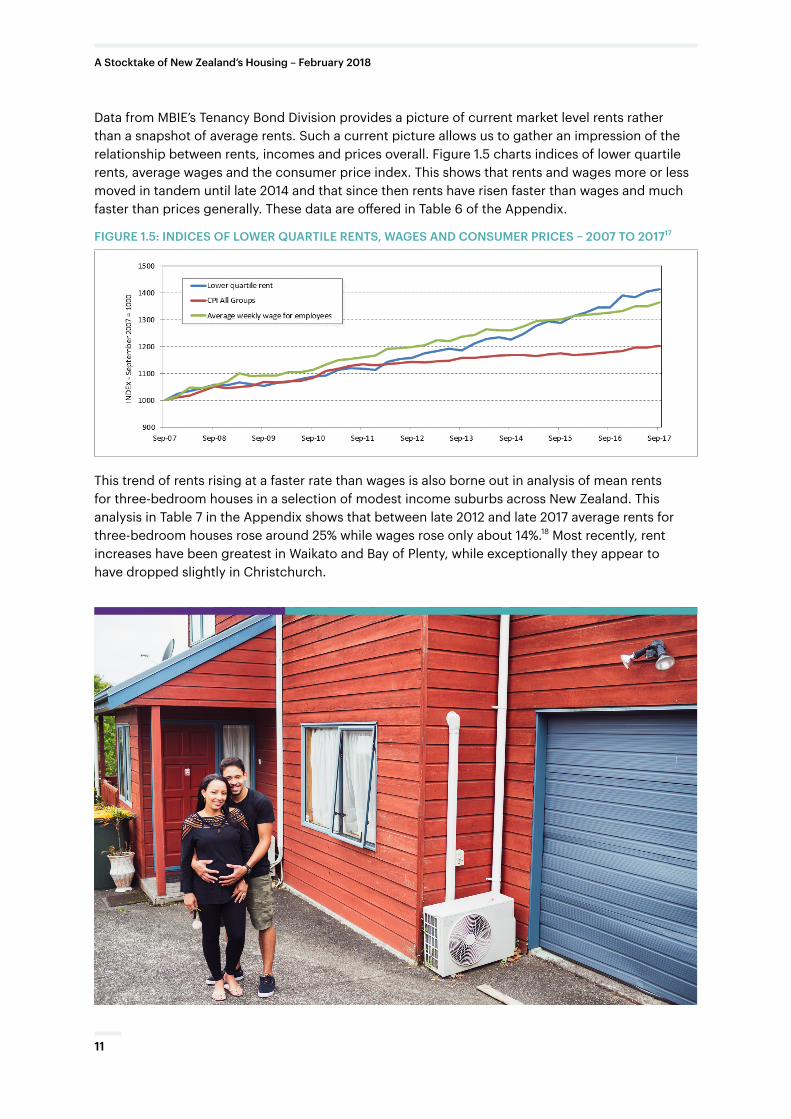
Data from MBIE’s Tenancy Bond Division provides a picture of current market level rents rather than a snapshot of average rents. Such a current picture allows us to gather an impression of the relationship between rents, incomes and prices overall. Figure 1.5 charts indices of lower quartile rents, average wages and the consumer price index. This shows that rents and wages more or less moved in tandem until late 2014 and that since then rents have risen faster than wages and much faster than prices generally. These data are offered in Table 6 of the Appendix.
FIGURE 1.5: INDICES OF LOWER QUARTILE RENTS, WAGES AND CONSUMER PRICES – 2007 TO 201717
This trend of rents rising at a faster rate than wages is also borne out in analysis of mean rents for three-bedroom houses in a selection of modest income suburbs across New Zealand. This analysis in Table 7 in the Appendix shows that between late 2012 and late 2017 average rents for three-bedroom houses rose around 25% while wages rose only about 14%.18 Most recently, rent increases have been greatest in Waikato and Bay of Plenty, while exceptionally they appear to have dropped slightly in Christchurch.
11
A Stocktake of New Zealand’s Housing – February 2018
1.3 Availability of rental housing
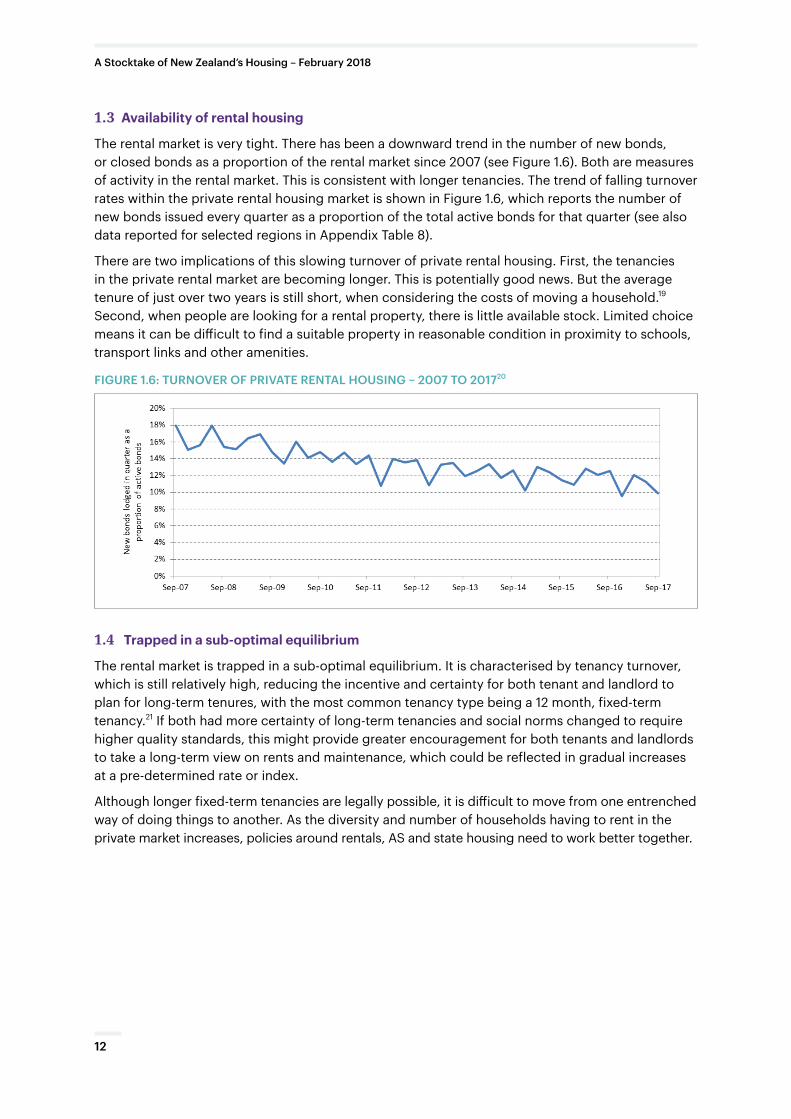
The rental market is very tight. There has been a downward trend in the number of new bonds, or closed bonds as a proportion of the rental market since 2007 (see Figure 1.6). Both are measures of activity in the rental market. This is consistent with longer tenancies. The trend of falling turnover rates within the private rental housing market is shown in Figure 1.6, which reports the number of new bonds issued every quarter as a proportion of the total active bonds for that quarter (see also data reported for selected regions in Appendix Table 8).
There are two implications of this slowing turnover of private rental housing. First, the tenancies in the private rental market are becoming longer. This is potentially good news. But the average tenure of just over two years is still short, when considering the costs of moving a household.19 Second, when people are looking for a rental property, there is little available stock. Limited choice means it can be difficult to find a suitable property in reasonable condition in proximity to schools, transport links and other amenities.
FIGURE 1.6: TURNOVER OF PRIVATE RENTAL HOUSING – 2007 TO 201720
1.4 Trapped in a sub-optimal equilibrium
The rental market is trapped in a sub-optimal equilibrium. It is characterised by tenancy turnover, which is still relatively high, reducing the incentive and certainty for both tenant and landlord to plan for long-term tenures, with the most common tenancy type being a 12 month, fixed-term tenancy.21 If both had more certainty of long-term tenancies and social norms changed to require higher quality standards, this might provide greater encouragement for both tenants and landlords to take a long-term view on rents and maintenance, which could be reflected in gradual increases at a pre-determined rate or index.
Although longer fixed-term tenancies are legally possible, it is difficult to move from one entrenched way of doing things to another. As the diversity and number of households having to rent in the private market increases, policies around rentals, AS and state housing need to work better together.
12
A Stocktake of New Zealand’s Housing – February 2018
The past 25 years have seen the gradual demise of the so-called Kiwi Dream – a place where home ownership and the economic independence which this offers, was within reach of most working families. Home ownership rates have fallen to a 60-year low and could fall further. These falls have been alongside rapid house price inflation in many parts of New Zealand and, with this, deteriorating affordability. We are quickly becoming a society divided by the ownership of housing and its related wealth and recent housing and tax policy settings appear to have exacerbated this division.
2.1 Declining homeownership
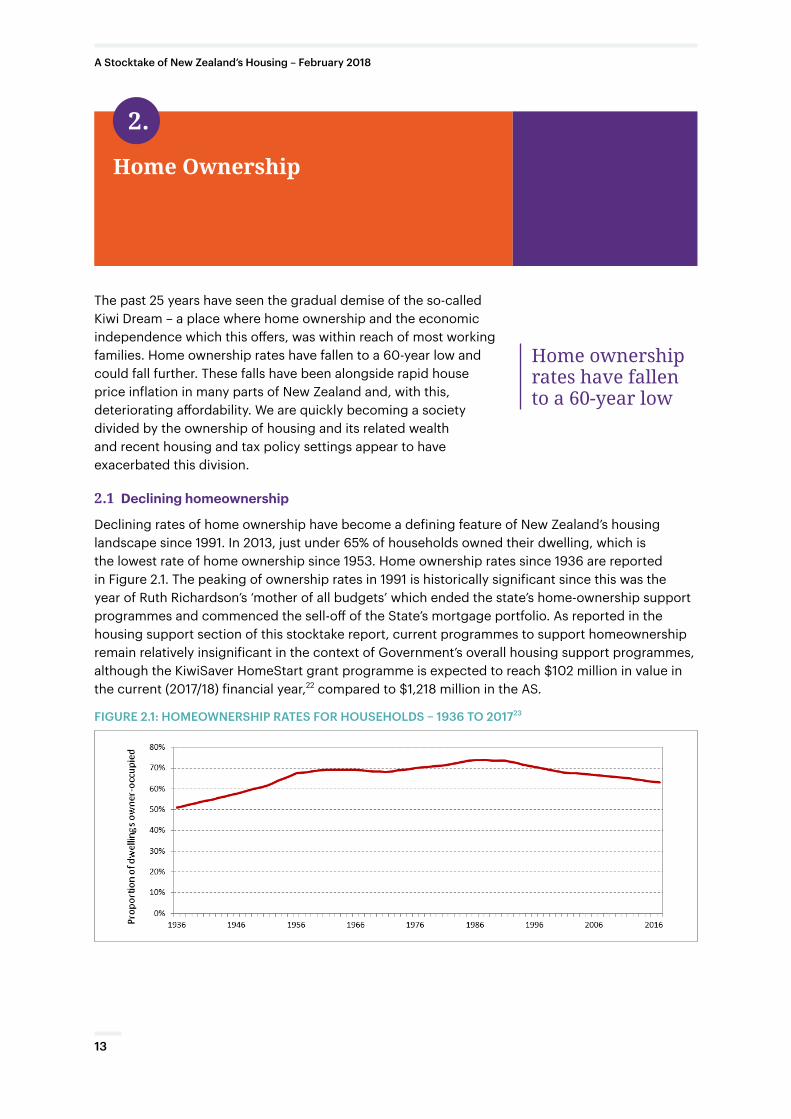
Declining rates of home ownership have become a defining feature of New Zealand’s housing landscape since 1991. In 2013, just under 65% of households owned their dwelling, which is the lowest rate of home ownership since 1953. Home ownership rates since 1936 are reported in Figure 2.1. The peaking of ownership rates in 1991 is historically significant since this was the year of Ruth Richardson’s ‘mother of all budgets’ which ended the state’s home-ownership support programmes and commenced the sell-off of the State’s mortgage portfolio. As reported in the housing support section of this stocktake report, current programmes to support homeownership remain relatively insignificant in the context of Government’s overall housing support programmes, although the KiwiSaver HomeStart grant programme is expected to reach $102 million in value in the current (2017/18) financial year,22 compared to $1,218 million in the AS.
FIGURE 2.1: HOMEOWNERSHIP RATES FOR HOUSEHOLDS – 1936 TO 201723
Home Ownership
2.
Home ownership rates have fallen to a 60-year low
13
A Stocktake of New Zealand’s Housing – February 2018
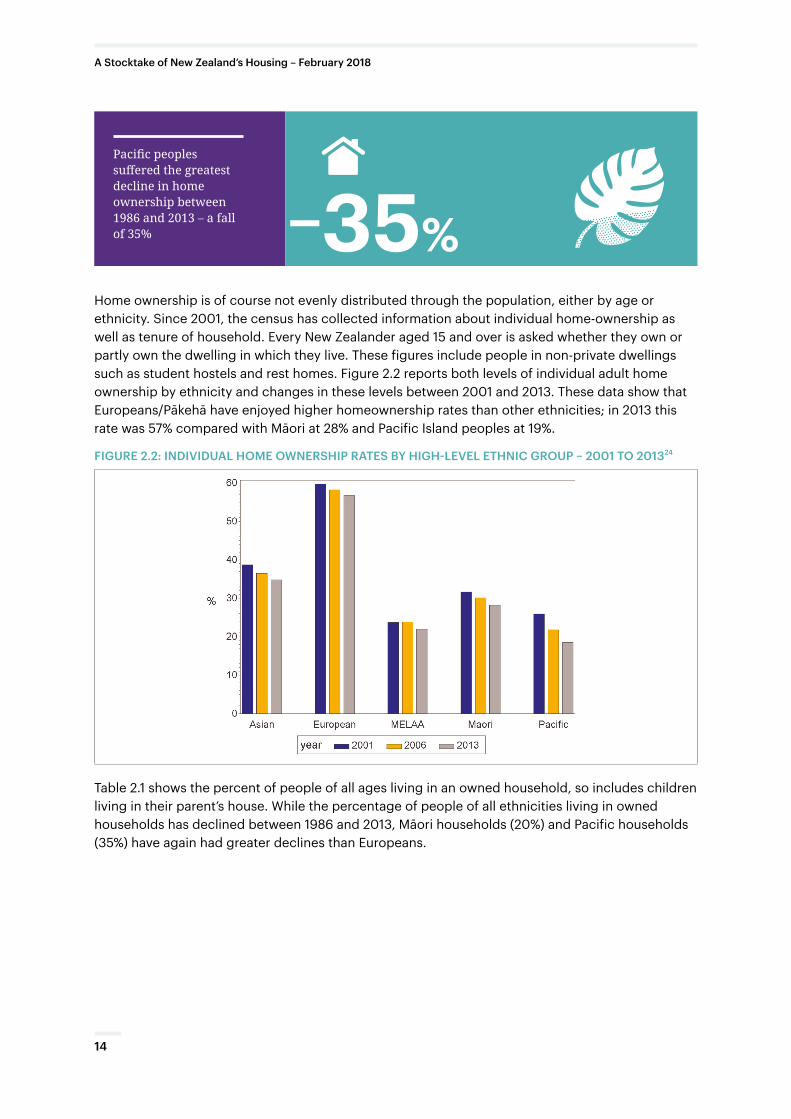
Home ownership is of course not evenly distributed through the population, either by age or ethnicity. Since 2001, the census has collected information about individual home-ownership as well as tenure of household. Every New Zealander aged 15 and over is asked whether they own or partly own the dwelling in which they live. These figures include people in non-private dwellings such as student hostels and rest homes. Figure 2.2 reports both levels of individual adult home ownership by ethnicity and changes in these levels between 2001 and 2013. These data show that Europeans/Pākehā have enjoyed higher homeownership rates than other ethnicities; in 2013 this rate was 57% compared with Māori at 28% and Pacific Island peoples at 19%.
FIGURE 2.2: INDIVIDUAL HOME OWNERSHIP RATES BY HIGH-LEVEL ETHNIC GROUP – 2001 TO 201324
Table 2.1 shows the percent of people of all ages living in an owned household, so includes children living in their parent’s house. While the percentage of people of all ethnicities living in owned households has declined between 1986 and 2013, Māori households (20%) and Pacific households (35%) have again had greater declines than Europeans.
Pacific peoples suffered the greatest decline in home ownership between 1986 and 2013 – a fall of 35% –35%
14
A Stocktake of New Zealand’s Housing – February 2018
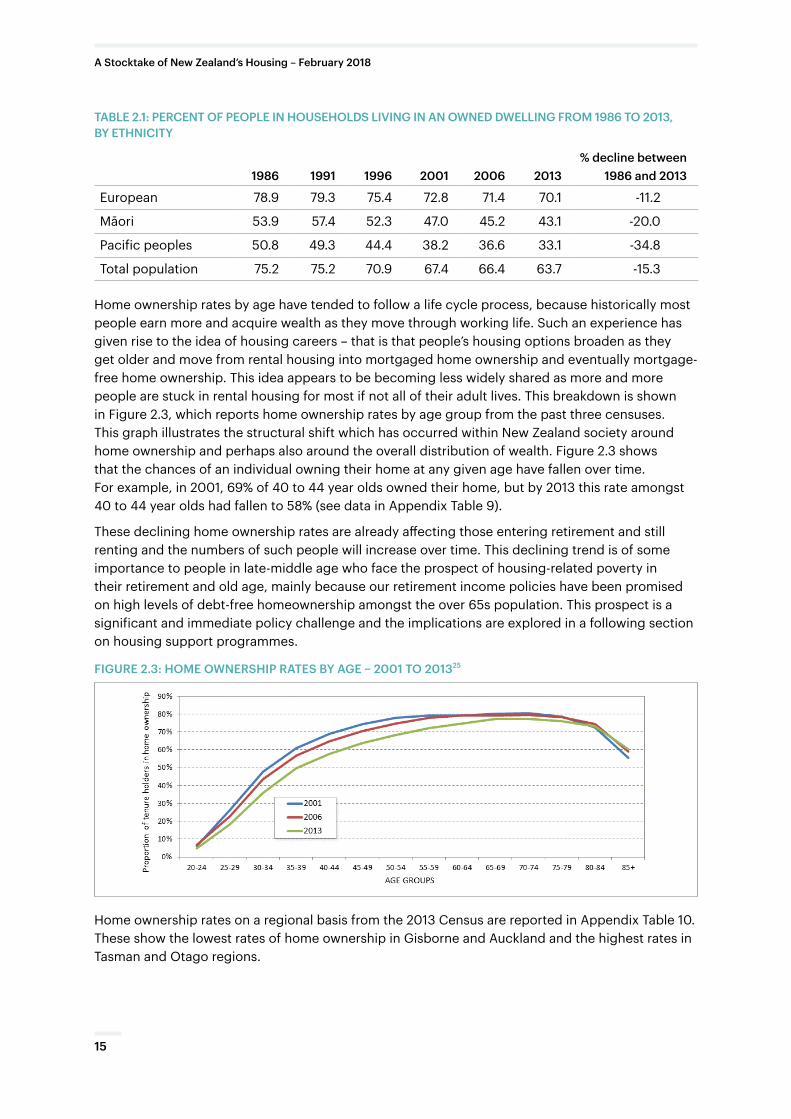
TABLE 2.1: PERCENT OF PEOPLE IN HOUSEHOLDS LIVING IN AN OWNED DWELLING FROM 1986 TO 2013, BY ETHNICITY
1986 1991 1996 2001 2006 2013% decline between
1986 and 2013
European 78.9 79.3 75.4 72.8 71.4 70.1 -11.2
Māori 53.9 57.4 52.3 47.0 45.2 43.1 -20.0
Pacific peoples 50.8 49.3 44.4 38.2 36.6 33.1 -34.8
Total population 75.2 75.2 70.9 67.4 66.4 63.7 -15.3
Home ownership rates by age have tended to follow a life cycle process, because historically most people earn more and acquire wealth as they move through working life. Such an experience has given rise to the idea of housing careers – that is that people’s housing options broaden as they get older and move from rental housing into mortgaged home ownership and eventually mortgage-free home ownership. This idea appears to be becoming less widely shared as more and more people are stuck in rental housing for most if not all of their adult lives. This breakdown is shown in Figure 2.3, which reports home ownership rates by age group from the past three censuses. This graph illustrates the structural shift which has occurred within New Zealand society around home ownership and perhaps also around the overall distribution of wealth. Figure 2.3 shows that the chances of an individual owning their home at any given age have fallen over time. For example, in 2001, 69% of 40 to 44 year olds owned their home, but by 2013 this rate amongst 40 to 44 year olds had fallen to 58% (see data in Appendix Table 9).
These declining home ownership rates are already affecting those entering retirement and still renting and the numbers of such people will increase over time. This declining trend is of some importance to people in late-middle age who face the prospect of housing-related poverty in their retirement and old age, mainly because our retirement income policies have been promised on high levels of debt-free homeownership amongst the over 65s population. This prospect is a significant and immediate policy challenge and the implications are explored in a following section on housing support programmes.
FIGURE 2.3: HOME OWNERSHIP RATES BY AGE – 2001 TO 201325
Home ownership rates on a regional basis from the 2013 Census are reported in Appendix Table 10. These show the lowest rates of home ownership in Gisborne and Auckland and the highest rates in Tasman and Otago regions.
15
A Stocktake of New Zealand’s Housing – February 2018
While there is a long-term trend in declining home-ownership across all age groups there is emerging evidence that first-time home buyers are faring slightly better in the mortgage stakes. This may be due to the assistance offered through the KiwiSaver HomeStart grants scheme. Data published by the Reserve Bank on new lending on mortgages by type of lender point to first home buyers gaining a greater share of such lending at the expense of investors. Volumes remain modest however at around $2 billion per quarter. This trend has only emerged recently (see Appendix Table 11).
2.2 House prices and affordability
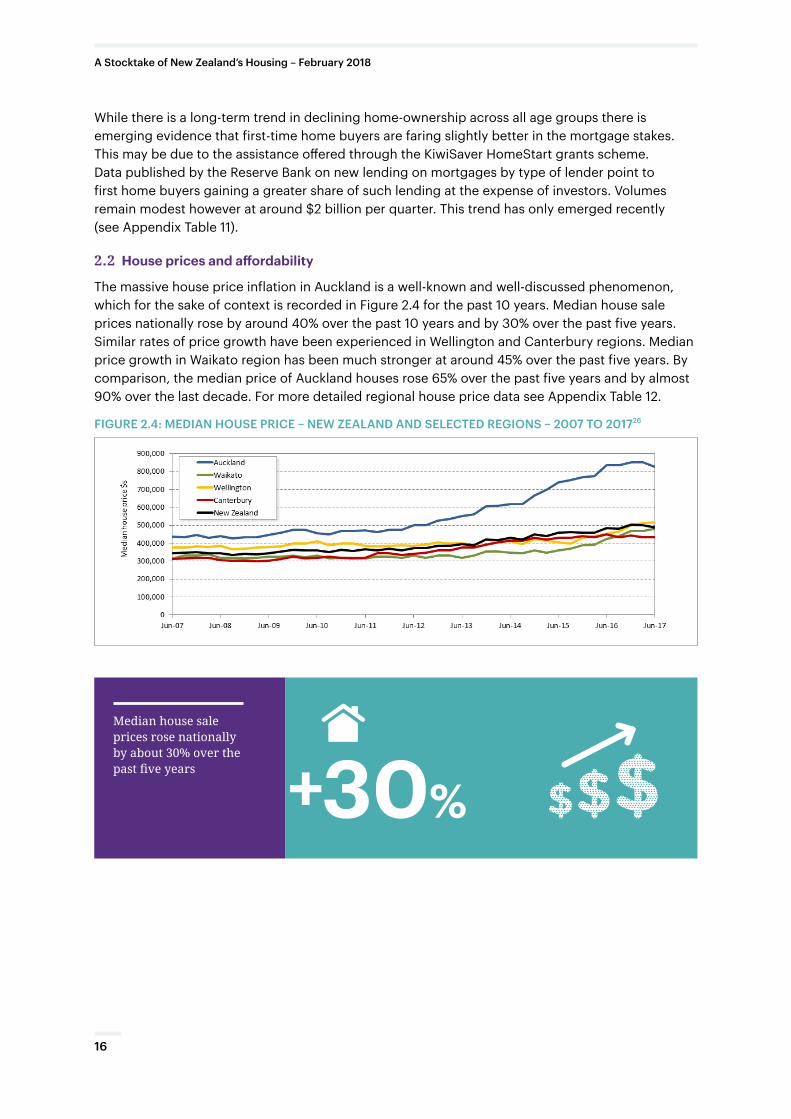
The massive house price inflation in Auckland is a well-known and well-discussed phenomenon, which for the sake of context is recorded in Figure 2.4 for the past 10 years. Median house sale prices nationally rose by around 40% over the past 10 years and by 30% over the past five years. Similar rates of price growth have been experienced in Wellington and Canterbury regions. Median price growth in Waikato region has been much stronger at around 45% over the past five years. By comparison, the median price of Auckland houses rose 65% over the past five years and by almost 90% over the last decade. For more detailed regional house price data see Appendix Table 12.
FIGURE 2.4: MEDIAN HOUSE PRICE – NEW ZEALAND AND SELECTED REGIONS – 2007 TO 201726
Median house sale prices rose nationally by about 30% over the past five years 30%+
16
A Stocktake of New Zealand’s Housing – February 2018
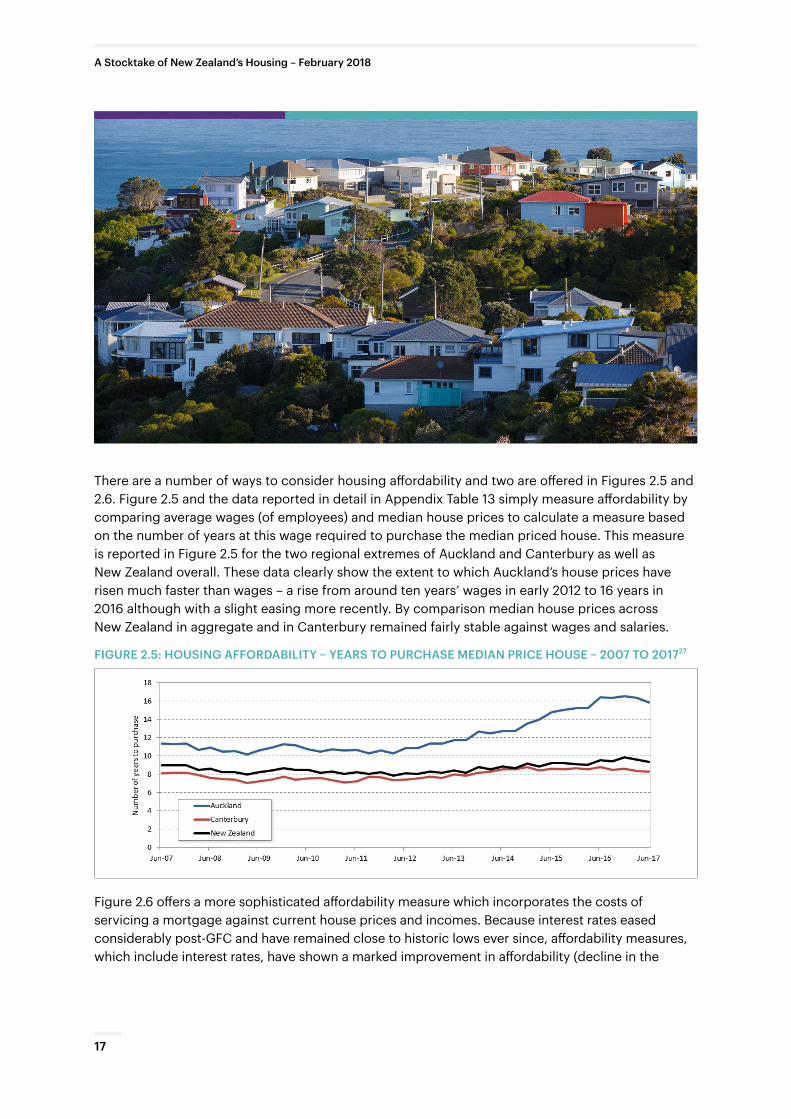
There are a number of ways to consider housing affordability and two are offered in Figures 2.5 and 2.6. Figure 2.5 and the data reported in detail in Appendix Table 13 simply measure affordability by comparing average wages (of employees) and median house prices to calculate a measure based on the number of years at this wage required to purchase the median priced house. This measure is reported in Figure 2.5 for the two regional extremes of Auckland and Canterbury as well as New Zealand overall. These data clearly show the extent to which Auckland’s house prices have risen much faster than wages – a rise from around ten years’ wages in early 2012 to 16 years in 2016 although with a slight easing more recently. By comparison median house prices across New Zealand in aggregate and in Canterbury remained fairly stable against wages and salaries.
FIGURE 2.5: HOUSING AFFORDABILITY – YEARS TO PURCHASE MEDIAN PRICE HOUSE – 2007 TO 201727
Figure 2.6 offers a more sophisticated affordability measure which incorporates the costs of servicing a mortgage against current house prices and incomes. Because interest rates eased considerably post-GFC and have remained close to historic lows ever since, affordability measures, which include interest rates, have shown a marked improvement in affordability (decline in the
17
A Stocktake of New Zealand’s Housing – February 2018
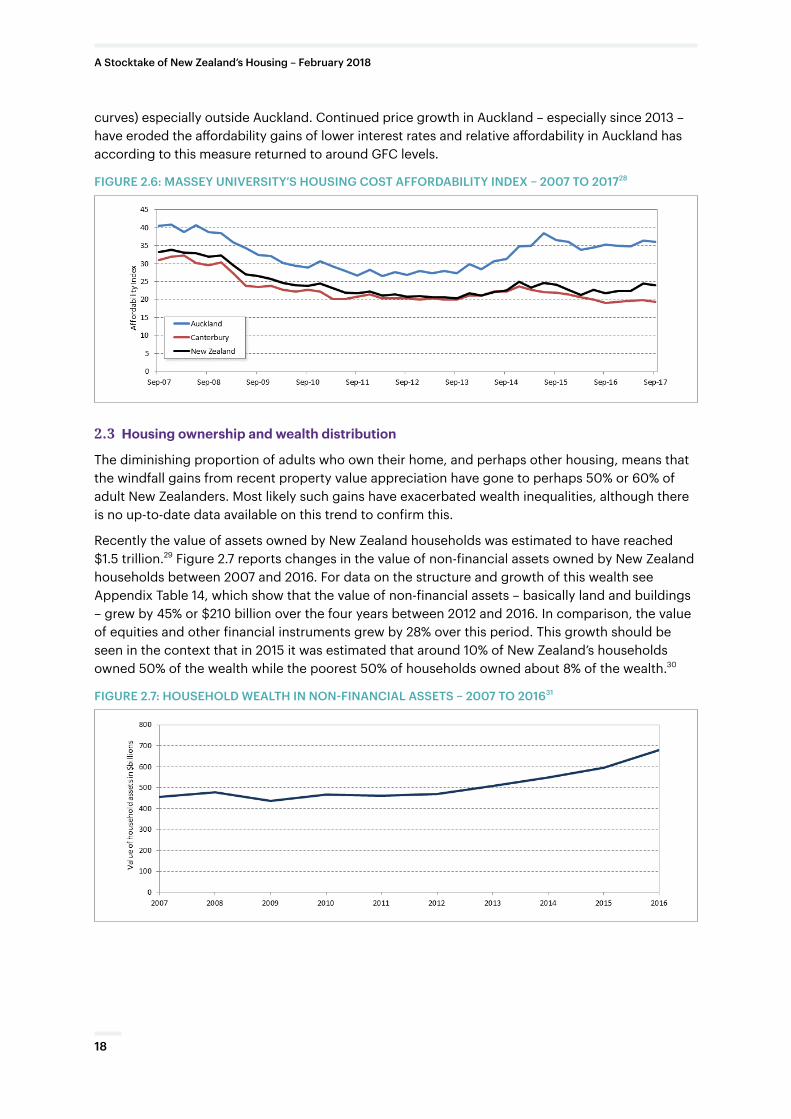
curves) especially outside Auckland. Continued price growth in Auckland – especially since 2013 –have eroded the affordability gains of lower interest rates and relative affordability in Auckland has according to this measure returned to around GFC levels.
FIGURE 2.6: MASSEY UNIVERSITY’S HOUSING COST AFFORDABILITY INDEX – 2007 TO 201728
2.3 Housing ownership and wealth distribution
The diminishing proportion of adults who own their home, and perhaps other housing, means that the windfall gains from recent property value appreciation have gone to perhaps 50% or 60% of adult New Zealanders. Most likely such gains have exacerbated wealth inequalities, although there is no up-to-date data available on this trend to confirm this.
Recently the value of assets owned by New Zealand households was estimated to have reached $1.5 trillion.29 Figure 2.7 reports changes in the value of non-financial assets owned by New Zealand households between 2007 and 2016. For data on the structure and growth of this wealth see Appendix Table 14, which show that the value of non-financial assets – basically land and buildings – grew by 45% or $210 billion over the four years between 2012 and 2016. In comparison, the value of equities and other financial instruments grew by 28% over this period. This growth should be seen in the context that in 2015 it was estimated that around 10% of New Zealand’s households owned 50% of the wealth while the poorest 50% of households owned about 8% of the wealth.30
FIGURE 2.7: HOUSEHOLD WEALTH IN NON-FINANCIAL ASSETS – 2007 TO 201631
18
A Stocktake of New Zealand’s Housing – February 2018
The construction industry and the land development sectors have a major impact on New Zealand’s housing landscape, both in terms of their capacity and performance. These sectors have not served the cause of affordable housing well although this poor service can partly be attributed to misguided or indifferent public policy. Such settings have meant that over the past five years house building has not kept pace with population growth – especially in Auckland, and that the housing being produced is becoming more and more expensive.
3.1 Population and housing stock changes
There were just over 1.9 million private dwellings in New Zealand in December 2017, which provide housing for 4.9 million New Zealanders meaning an average occupancy rate of 2.6 people per dwelling. The growth in this housing stock has been reasonably uniform over the past 20 years as illustrated in Figure 3.1. Over this 20-year period the national housing stock has grown by just under 30% while the national population has expanded by almost 27% meaning of course that the average occupancy of our housing has fallen slightly from 2.66 people per dwelling in 1997 to 2.60 people per dwelling in 2017 (see Appendix Table 15). Such a decline in the average occupancy rate has been predicted as part of New Zealand’s falling birth rates and its aging population.32
New Housing
3.
There are now more than 1.9 million private dwellings in New Zealand 1.9m
19
A Stocktake of New Zealand’s Housing – February 2018
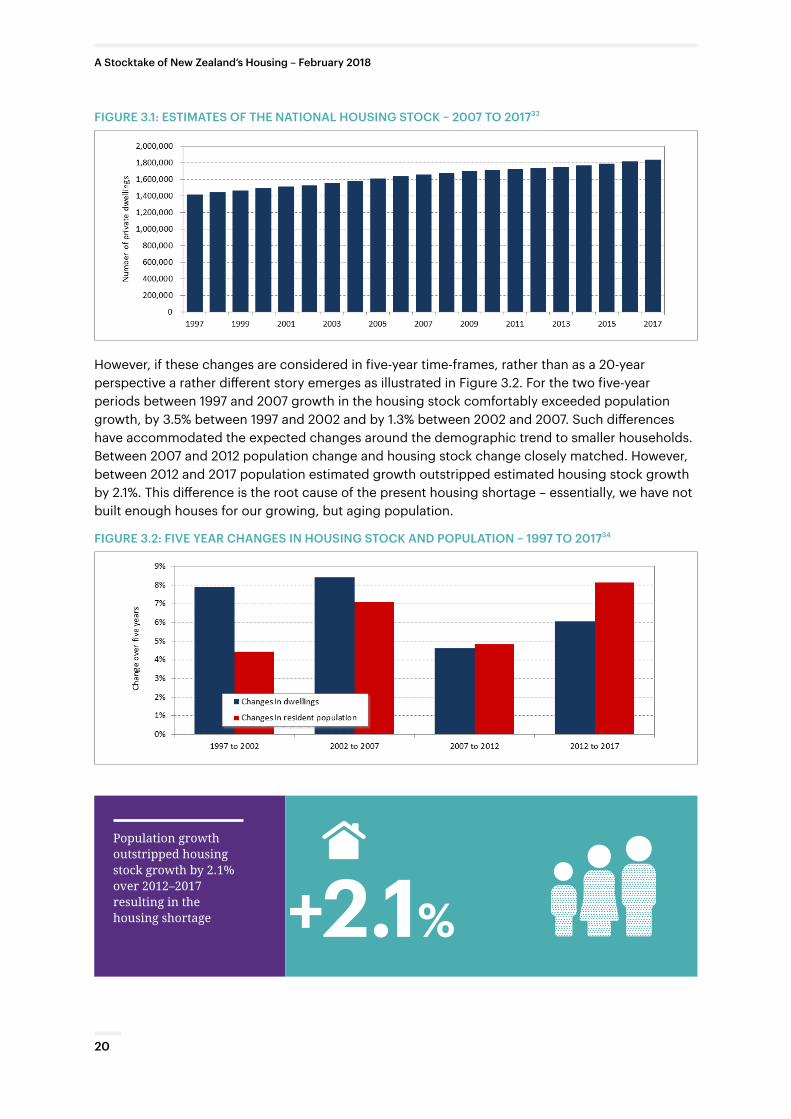
FIGURE 3.1: ESTIMATES OF THE NATIONAL HOUSING STOCK – 2007 TO 201733
However, if these changes are considered in five-year time-frames, rather than as a 20-year perspective a rather different story emerges as illustrated in Figure 3.2. For the two five-year periods between 1997 and 2007 growth in the housing stock comfortably exceeded population growth, by 3.5% between 1997 and 2002 and by 1.3% between 2002 and 2007. Such differences have accommodated the expected changes around the demographic trend to smaller households. Between 2007 and 2012 population change and housing stock change closely matched. However, between 2012 and 2017 population estimated growth outstripped estimated housing stock growth by 2.1%. This difference is the root cause of the present housing shortage – essentially, we have not built enough houses for our growing, but aging population.
FIGURE 3.2: FIVE YEAR CHANGES IN HOUSING STOCK AND POPULATION – 1997 TO 201734
Population growth outstripped housing stock growth by 2.1% over 2012–2017 resulting in the housing shortage 2.1%+
20
A Stocktake of New Zealand’s Housing – February 2018
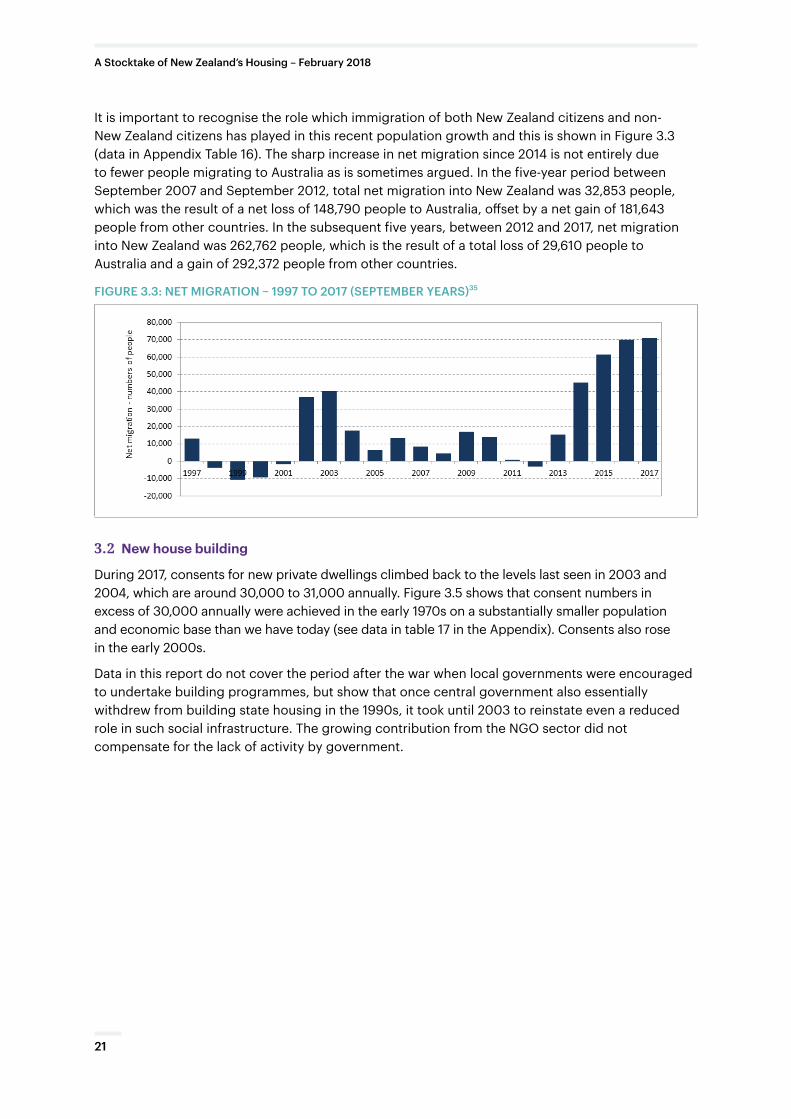
It is important to recognise the role which immigration of both New Zealand citizens and non-New Zealand citizens has played in this recent population growth and this is shown in Figure 3.3 (data in Appendix Table 16). The sharp increase in net migration since 2014 is not entirely due to fewer people migrating to Australia as is sometimes argued. In the five-year period between September 2007 and September 2012, total net migration into New Zealand was 32,853 people, which was the result of a net loss of 148,790 people to Australia, offset by a net gain of 181,643 people from other countries. In the subsequent five years, between 2012 and 2017, net migration into New Zealand was 262,762 people, which is the result of a total loss of 29,610 people to Australia and a gain of 292,372 people from other countries.
FIGURE 3.3: NET MIGRATION – 1997 TO 2017 (SEPTEMBER YEARS)35
3.2 New house building
During 2017, consents for new private dwellings climbed back to the levels last seen in 2003 and 2004, which are around 30,000 to 31,000 annually. Figure 3.5 shows that consent numbers in excess of 30,000 annually were achieved in the early 1970s on a substantially smaller population and economic base than we have today (see data in table 17 in the Appendix). Consents also rose in the early 2000s.
Data in this report do not cover the period after the war when local governments were encouraged to undertake building programmes, but show that once central government also essentially withdrew from building state housing in the 1990s, it took until 2003 to reinstate even a reduced role in such social infrastructure. The growing contribution from the NGO sector did not compensate for the lack of activity by government.
21
A Stocktake of New Zealand’s Housing – February 2018
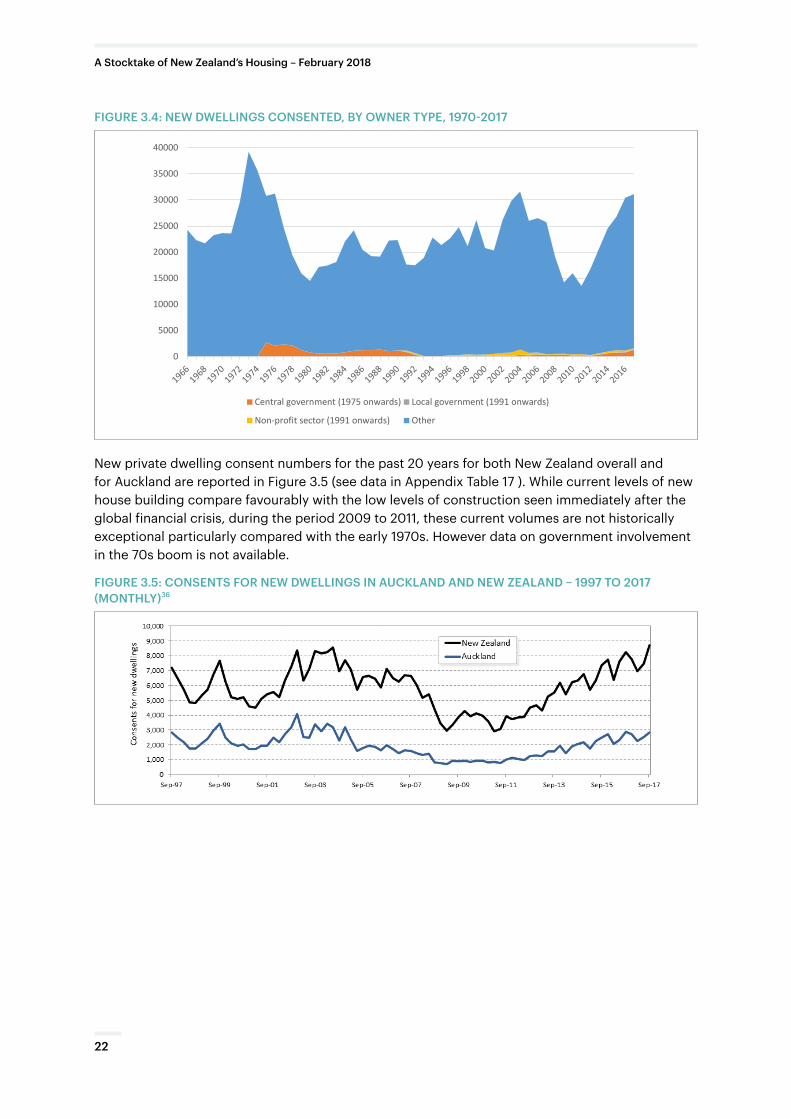
FIGURE 3.4: NEW DWELLINGS CONSENTED, BY OWNER TYPE, 1970-2017
0
5000
10000
15000
20000
25000
30000
35000
40000
New dwellings consented, by owner type, year ended November
Central government (1975 onwards) Local government (1991 onwards)
Non-profit sector (1991 onwards) Other
New private dwelling consent numbers for the past 20 years for both New Zealand overall and for Auckland are reported in Figure 3.5 (see data in Appendix Table 17 ). While current levels of new house building compare favourably with the low levels of construction seen immediately after the global financial crisis, during the period 2009 to 2011, these current volumes are not historically exceptional particularly compared with the early 1970s. However data on government involvement in the 70s boom is not available.
FIGURE 3.5: CONSENTS FOR NEW DWELLINGS IN AUCKLAND AND NEW ZEALAND – 1997 TO 2017 (MONTHLY)36
22
A Stocktake of New Zealand’s Housing – February 2018
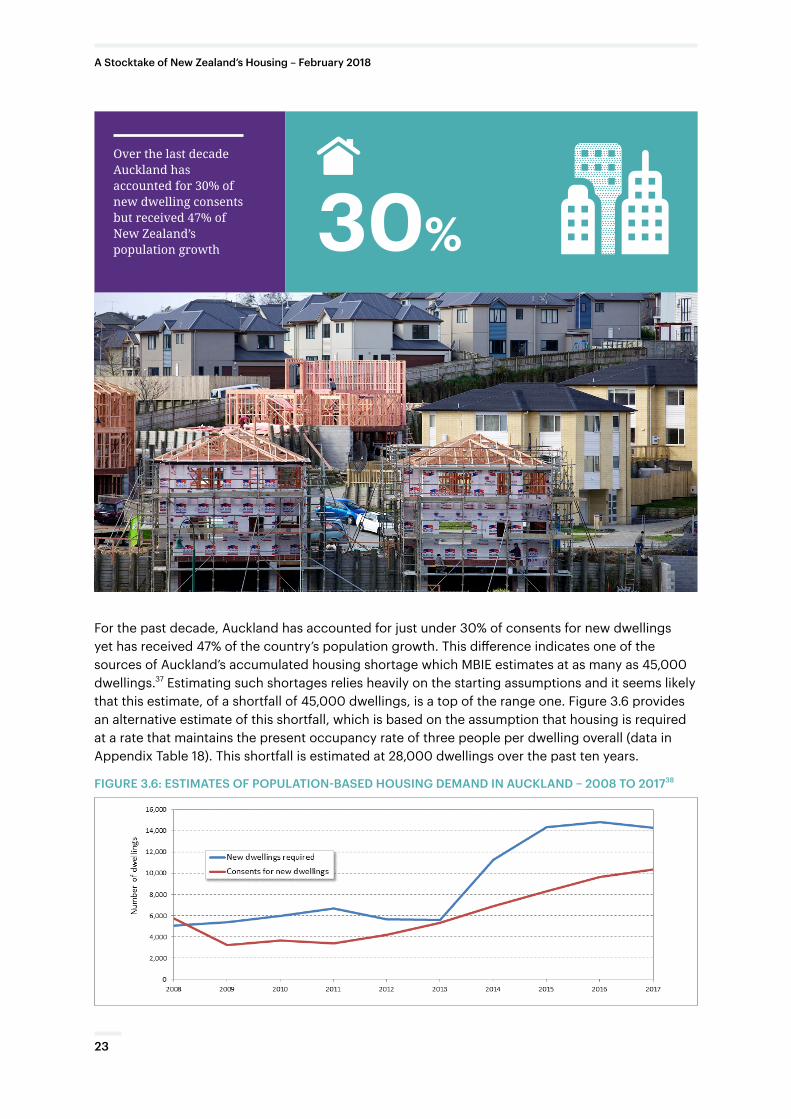
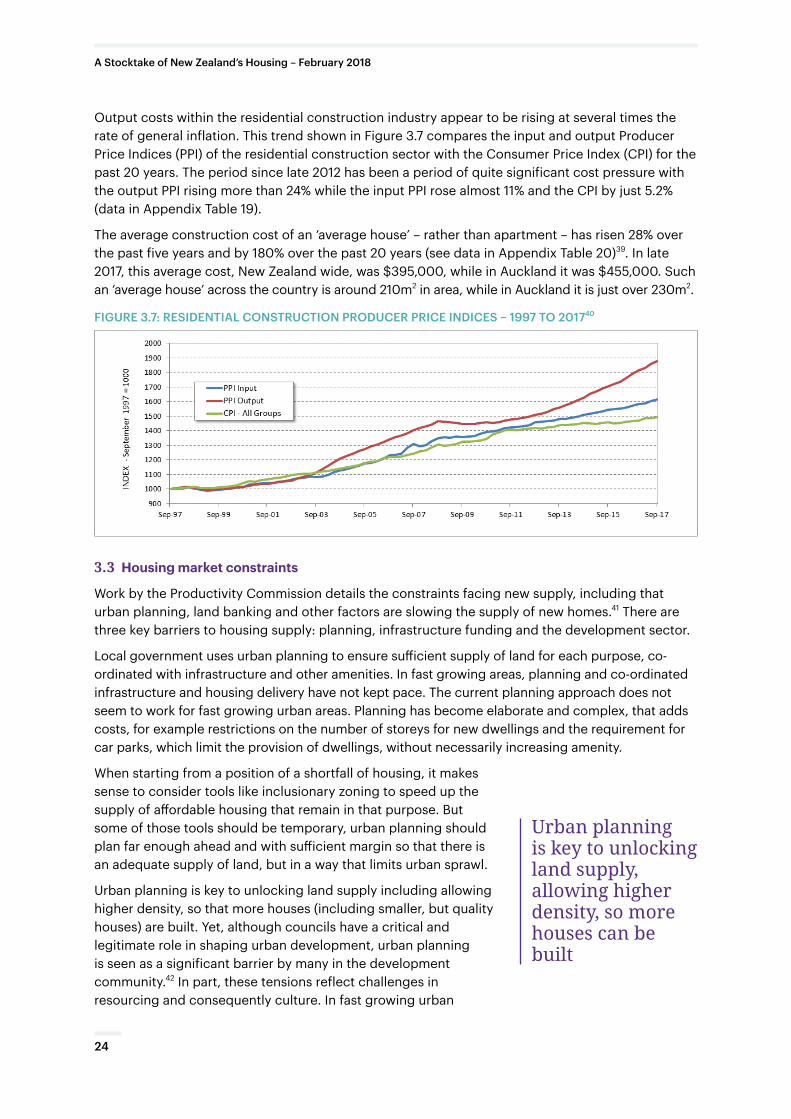
For the past decade, Auckland has accounted for just under 30% of consents for new dwellings yet has received 47% of the country’s population growth. This difference indicates one of the sources of Auckland’s accumulated housing shortage which MBIE estimates at as many as 45,000 dwellings.37 Estimating such shortages relies heavily on the starting assumptions and it seems likely that this estimate, of a shortfall of 45,000 dwellings, is a top of the range one. Figure 3.6 provides an alternative estimate of this shortfall, which is based on the assumption that housing is required at a rate that maintains the present occupancy rate of three people per dwelling overall (data in Appendix Table 18). This shortfall is estimated at 28,000 dwellings over the past ten years.
FIGURE 3.6: ESTIMATES OF POPULATION-BASED HOUSING DEMAND IN AUCKLAND – 2008 TO 201738
Over the last decade Auckland has accounted for 30% of new dwelling consents but received 47% of New Zealand’s population growth 30%
23
A Stocktake of New Zealand’s Housing – February 2018
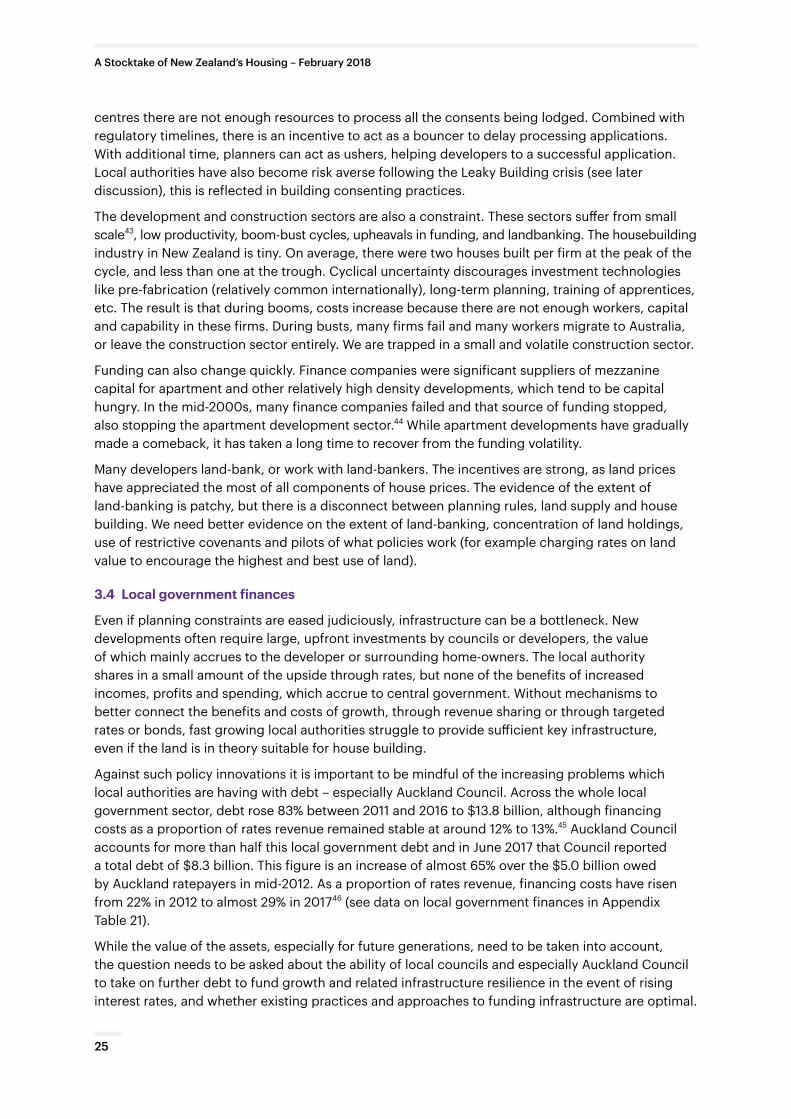
Output costs within the residential construction industry appear to be rising at several times the rate of general inflation. This trend shown in Figure 3.7 compares the input and output Producer Price Indices (PPI) of the residential construction sector with the Consumer Price Index (CPI) for the past 20 years. The period since late 2012 has been a period of quite significant cost pressure with the output PPI rising more than 24% while the input PPI rose almost 11% and the CPI by just 5.2% (data in Appendix Table 19).
The average construction cost of an ‘average house’ – rather than apartment – has risen 28% over the past five years and by 180% over the past 20 years (see data in Appendix Table 20)39. In late 2017, this average cost, New Zealand wide, was $395,000, while in Auckland it was $455,000. Such an ‘average house’ across the country is around 210m2 in area, while in Auckland it is just over 230m2.
FIGURE 3.7: RESIDENTIAL CONSTRUCTION PRODUCER PRICE INDICES – 1997 TO 201740
3.3 Housing market constraints
Work by the Productivity Commission details the constraints facing new supply, including that urban planning, land banking and other factors are slowing the supply of new homes.41 There are three key barriers to housing supply: planning, infrastructure funding and the development sector.
Local government uses urban planning to ensure sufficient supply of land for each purpose, co-ordinated with infrastructure and other amenities. In fast growing areas, planning and co-ordinated infrastructure and housing delivery have not kept pace. The current planning approach does not seem to work for fast growing urban areas. Planning has become elaborate and complex, that adds costs, for example restrictions on the number of storeys for new dwellings and the requirement for car parks, which limit the provision of dwellings, without necessarily increasing amenity.
When starting from a position of a shortfall of housing, it makes sense to consider tools like inclusionary zoning to speed up the supply of affordable housing that remain in that purpose. But some of those tools should be temporary, urban planning should plan far enough ahead and with sufficient margin so that there is an adequate supply of land, but in a way that limits urban sprawl.
Urban planning is key to unlocking land supply including allowing higher density, so that more houses (including smaller, but quality houses) are built. Yet, although councils have a critical and legitimate role in shaping urban development, urban planning is seen as a significant barrier by many in the development community.42 In part, these tensions reflect challenges in resourcing and consequently culture. In fast growing urban
Urban planning is key to unlocking land supply, allowing higher density, so more houses can be built
24
A Stocktake of New Zealand’s Housing – February 2018
centres there are not enough resources to process all the consents being lodged. Combined with regulatory timelines, there is an incentive to act as a bouncer to delay processing applications. With additional time, planners can act as ushers, helping developers to a successful application. Local authorities have also become risk averse following the Leaky Building crisis (see later discussion), this is reflected in building consenting practices.
The development and construction sectors are also a constraint. These sectors suffer from small scale43, low productivity, boom-bust cycles, upheavals in funding, and landbanking. The housebuilding industry in New Zealand is tiny. On average, there were two houses built per firm at the peak of the cycle, and less than one at the trough. Cyclical uncertainty discourages investment technologies like pre-fabrication (relatively common internationally), long-term planning, training of apprentices, etc. The result is that during booms, costs increase because there are not enough workers, capital and capability in these firms. During busts, many firms fail and many workers migrate to Australia, or leave the construction sector entirely. We are trapped in a small and volatile construction sector.
Funding can also change quickly. Finance companies were significant suppliers of mezzanine capital for apartment and other relatively high density developments, which tend to be capital hungry. In the mid-2000s, many finance companies failed and that source of funding stopped, also stopping the apartment development sector.44 While apartment developments have gradually made a comeback, it has taken a long time to recover from the funding volatility.
Many developers land-bank, or work with land-bankers. The incentives are strong, as land prices have appreciated the most of all components of house prices. The evidence of the extent of land-banking is patchy, but there is a disconnect between planning rules, land supply and house building. We need better evidence on the extent of land-banking, concentration of land holdings, use of restrictive covenants and pilots of what policies work (for example charging rates on land value to encourage the highest and best use of land).
3.4 Local government finances
Even if planning constraints are eased judiciously, infrastructure can be a bottleneck. New developments often require large, upfront investments by councils or developers, the value of which mainly accrues to the developer or surrounding home-owners. The local authority shares in a small amount of the upside through rates, but none of the benefits of increased incomes, profits and spending, which accrue to central government. Without mechanisms to better connect the benefits and costs of growth, through revenue sharing or through targeted rates or bonds, fast growing local authorities struggle to provide sufficient key infrastructure, even if the land is in theory suitable for house building.
Against such policy innovations it is important to be mindful of the increasing problems which local authorities are having with debt – especially Auckland Council. Across the whole local government sector, debt rose 83% between 2011 and 2016 to $13.8 billion, although financing costs as a proportion of rates revenue remained stable at around 12% to 13%.45 Auckland Council accounts for more than half this local government debt and in June 2017 that Council reported a total debt of $8.3 billion. This figure is an increase of almost 65% over the $5.0 billion owed by Auckland ratepayers in mid-2012. As a proportion of rates revenue, financing costs have risen from 22% in 2012 to almost 29% in 201746 (see data on local government finances in Appendix Table 21).
While the value of the assets, especially for future generations, need to be taken into account, the question needs to be asked about the ability of local councils and especially Auckland Council to take on further debt to fund growth and related infrastructure resilience in the event of rising interest rates, and whether existing practices and approaches to funding infrastructure are optimal.
25
A Stocktake of New Zealand’s Housing – February 2018
There remains some contention around the use of the term social housing to describe state housing or housing which is owned by Housing New Zealand (Housing NZ) on behalf of the Crown. Social housing can be described as housing which is affordable and allocated on the basis of need by registered housing providers within a regulated framework.47 The contention here is not that social housing is necessarily state housing, but that the previous Government adopted the term social housing, somewhat ambiguously, to describe a wide range of housing provision. These included private for-profit investors alongside state, local government and NGO providers. For clarity in this chapter state housing is treated separately from other social housing models.
4.1 The social housing stock in New Zealand
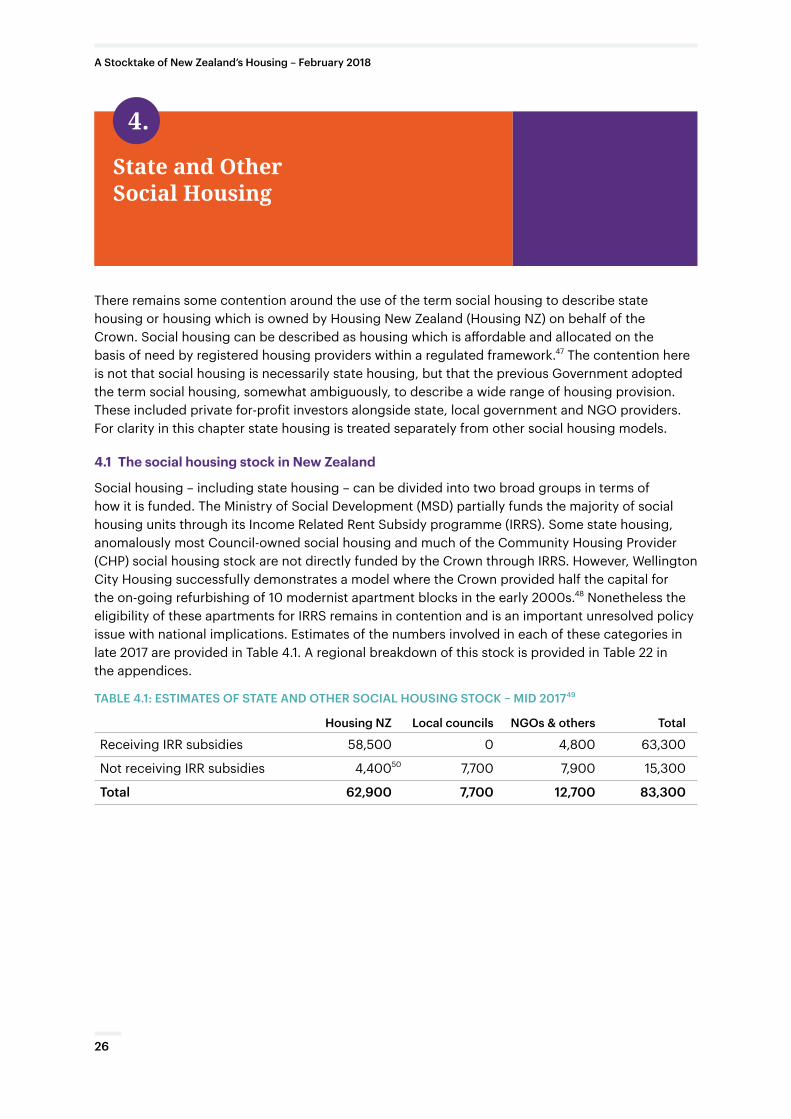
Social housing – including state housing – can be divided into two broad groups in terms of how it is funded. The Ministry of Social Development (MSD) partially funds the majority of social housing units through its Income Related Rent Subsidy programme (IRRS). Some state housing, anomalously most Council-owned social housing and much of the Community Housing Provider (CHP) social housing stock are not directly funded by the Crown through IRRS. However, Wellington City Housing successfully demonstrates a model where the Crown provided half the capital for the on-going refurbishing of 10 modernist apartment blocks in the early 2000s.48 Nonetheless the eligibility of these apartments for IRRS remains in contention and is an important unresolved policy issue with national implications. Estimates of the numbers involved in each of these categories in late 2017 are provided in Table 4.1. A regional breakdown of this stock is provided in Table 22 in the appendices.
TABLE 4.1: ESTIMATES OF STATE AND OTHER SOCIAL HOUSING STOCK – MID 2017 49
Housing NZ Local councils NGOs & others Total
Receiving IRR subsidies 58,500 0 4,800 63,300
Not receiving IRR subsidies 4,40050 7,700 7,900 15,300
Total 62,900 7,700 12,700 83,300
State and Other Social Housing
4.
26
A Stocktake of New Zealand’s Housing – February 2018
4.2 Changes in state housing stock
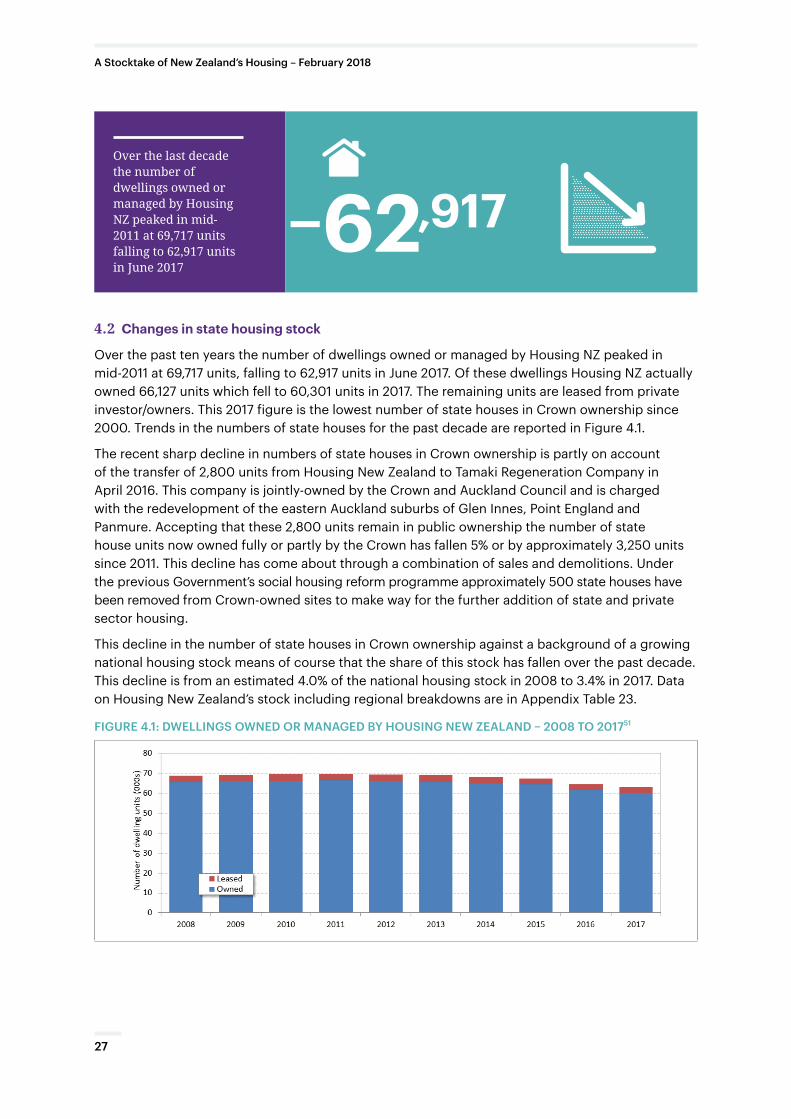
Over the past ten years the number of dwellings owned or managed by Housing NZ peaked in mid-2011 at 69,717 units, falling to 62,917 units in June 2017. Of these dwellings Housing NZ actually owned 66,127 units which fell to 60,301 units in 2017. The remaining units are leased from private investor/owners. This 2017 figure is the lowest number of state houses in Crown ownership since 2000. Trends in the numbers of state houses for the past decade are reported in Figure 4.1.
The recent sharp decline in numbers of state houses in Crown ownership is partly on account of the transfer of 2,800 units from Housing New Zealand to Tamaki Regeneration Company in April 2016. This company is jointly-owned by the Crown and Auckland Council and is charged with the redevelopment of the eastern Auckland suburbs of Glen Innes, Point England and Panmure. Accepting that these 2,800 units remain in public ownership the number of state house units now owned fully or partly by the Crown has fallen 5% or by approximately 3,250 units since 2011. This decline has come about through a combination of sales and demolitions. Under the previous Government’s social housing reform programme approximately 500 state houses have been removed from Crown-owned sites to make way for the further addition of state and private sector housing.
This decline in the number of state houses in Crown ownership against a background of a growing national housing stock means of course that the share of this stock has fallen over the past decade. This decline is from an estimated 4.0% of the national housing stock in 2008 to 3.4% in 2017. Data on Housing New Zealand’s stock including regional breakdowns are in Appendix Table 23.
FIGURE 4.1: DWELLINGS OWNED OR MANAGED BY HOUSING NEW ZEALAND – 2008 TO 201751
Over the last decade the number of dwellings owned or managed by Housing NZ peaked in mid-2011 at 69,717 units falling to 62,917 units in June 2017
62,917–
27
A Stocktake of New Zealand’s Housing – February 2018
4.3 Changes in the stock of other social housing
The stock of social housing owned and provided by non-Crown agencies including local government and NGOs rose quickly between 2015 and 2017 mainly as a result of the previous Government’s policy on social housing. An estimate from early 2017 suggested that there were just under 20,000 social housing units outside Crown ownership of which around 12,000 were owned by NGOs and just under 8,000 units by local councils.52 Community Housing Aotearoa estimated that in late 2017 12,651 units were owned by community housing providers.
The numbers of social housing units in NGO ownership has grown rapidly over the past two years due to major transfers or sales. These include:
• The sale of 344 units by Hamilton City Council to Accessible Properties in March 2016.
• The transfer in April 2016 of 2800 units from Housing NZ to the Tamaki Regeneration Company, which is a joint venture between the Crown and Auckland Council.
• The long-term leasing of 2,250 units by Christchurch City Council to a Council owned entity – Otautahi Community Housing Trust in October 2016.
• The sale of 1,138 Housing New Zealand units in Tauranga to Accessible Properties in April 2017.
• The long-term leasing in July 2017 by Auckland Council of 1,452 units to a limited partnership venture with the Selwyn Foundation – the partnership is known as Haumaru Housing.
4.4 Demand for social housing
Actual demand for social housing is difficult to measure accurately. In part, this is because such measurement relies on the administration of an application and review process, which might, intentionally or unintentionally, have barriers or biases to recognising all unmet housing need.
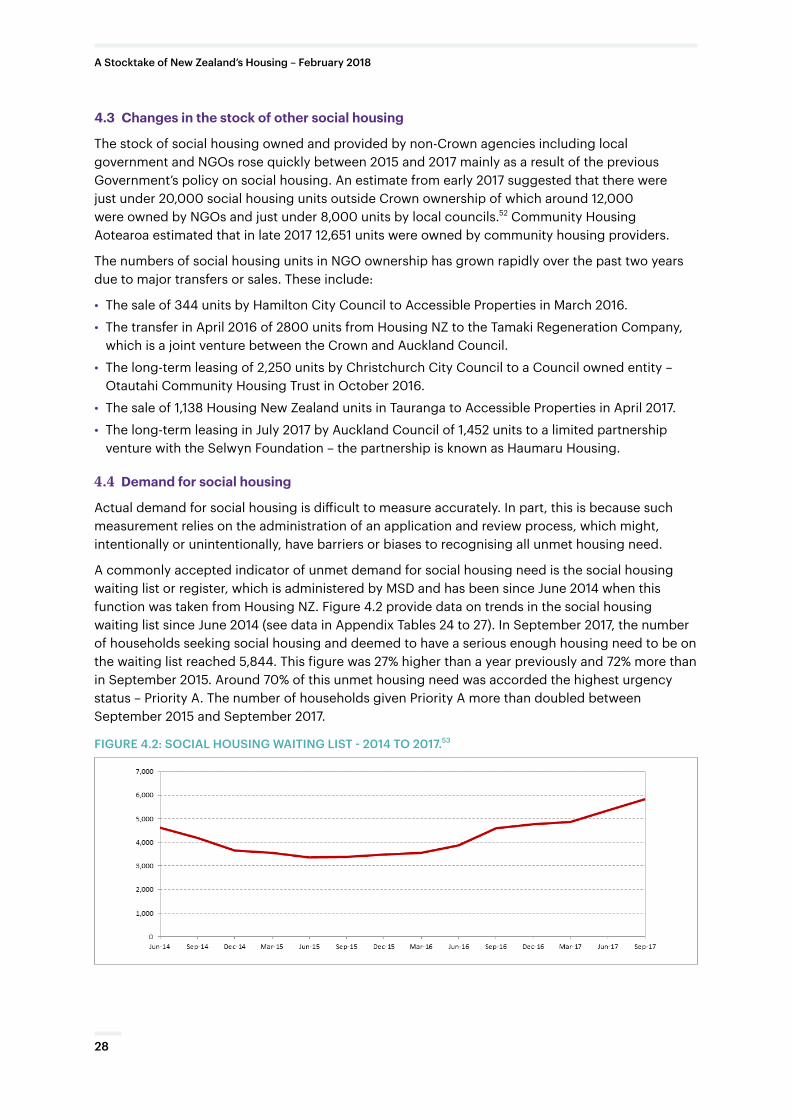
A commonly accepted indicator of unmet demand for social housing need is the social housing waiting list or register, which is administered by MSD and has been since June 2014 when this function was taken from Housing NZ. Figure 4.2 provide data on trends in the social housing waiting list since June 2014 (see data in Appendix Tables 24 to 27). In September 2017, the number of households seeking social housing and deemed to have a serious enough housing need to be on the waiting list reached 5,844. This figure was 27% higher than a year previously and 72% more than in September 2015. Around 70% of this unmet housing need was accorded the highest urgency status – Priority A. The number of households given Priority A more than doubled between September 2015 and September 2017.
FIGURE 4.2: SOCIAL HOUSING WAITING LIST - 2014 TO 2017.53
28
A Stocktake of New Zealand’s Housing – February 2018
The sharp increase since mid-2016 in the numbers of households put on the social housing waiting list is difficult to explain on the facts available. Part of the answer is likely to be the big up-turn in general housing demand with the rise in migration. However, at this time there was no nation-wide shock in housing markets, which would cause unmet housing need to rise by more than 50% nation-wide and by more in housing markets as diverse as those in Waikato, Wellington and Hawkes Bay.
MSD does however appear to have changed the way it administers the social housing application process. Somewhat curiously MSD does not record the numbers of initial enquiries it receives for housing assistance, although it does count the numbers of assessments completed once people get past an initial vetting process. Between March 2016 and March 2017 the numbers of assessments and the numbers of households placed on the social housing register or waiting list rose 40% and 58% respectively (see data on a regional basis in Appendix Tables 28 and 29).
4.5 Future provision of social housing
MSD have published their social housing purchasing intentions through to 2020 and an analysis of these is provided in the Appendix Table 30. Between 2017 and 2020 the Ministry plans to increase the numbers of residential units receiving an income-related rent by 3,790 of which half will be in Auckland. Of these additional units approximately 2,600 have been identified, while 1,200 have still to be found. However the bulk of the identified additional units (1,300 approximately) have been transferred from local council stock into stand-alone entities in order to receive an IRR subsidy. A further 500 units, approximately, are existing Community Housing Provider (CHP) owned social housing units, which have been brought into the IRR programme. It appears from the information available in MSD’s purchasing strategy that of the 2,600 additional IRR subsidised units, which have been identified, less than 10%, or just 226 are actual new builds. However, additional new units identified in the so-called ‘supply pipeline’ may have eventuated since then, raising this number to as many 690.
29
A Stocktake of New Zealand’s Housing – February 2018
4.6 The financial performance of Housing New Zealand
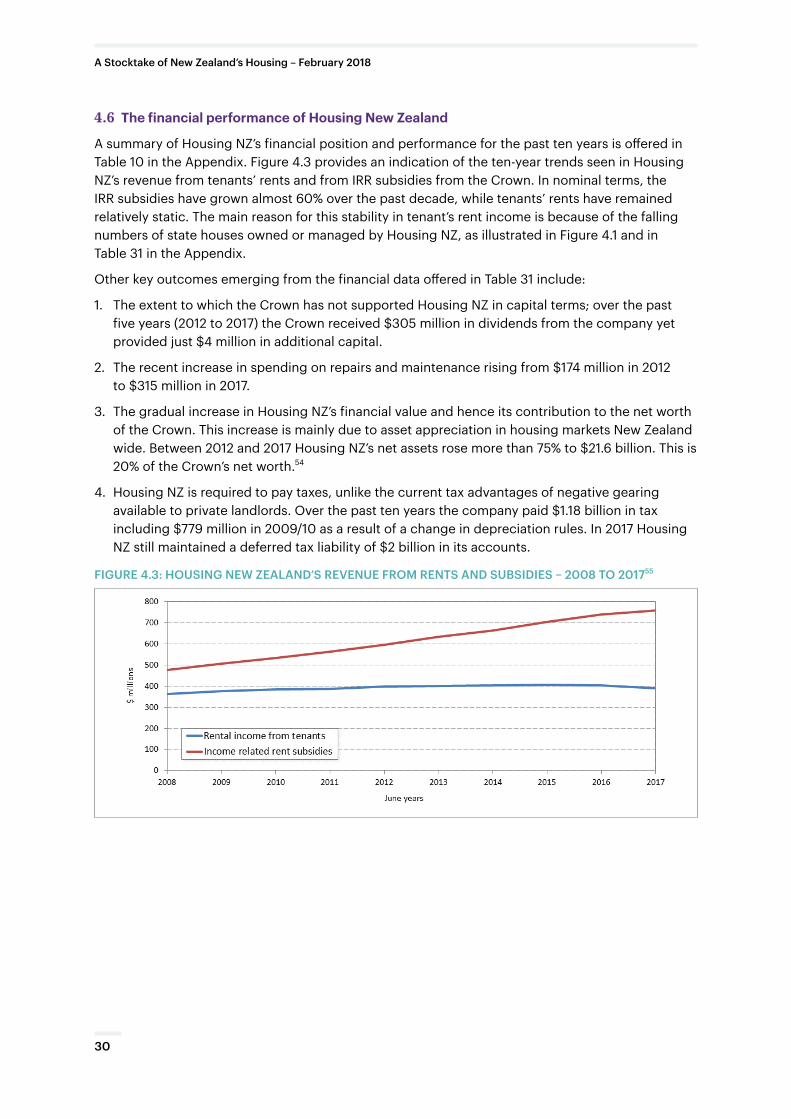
A summary of Housing NZ’s financial position and performance for the past ten years is offered in Table 10 in the Appendix. Figure 4.3 provides an indication of the ten-year trends seen in Housing NZ’s revenue from tenants’ rents and from IRR subsidies from the Crown. In nominal terms, the IRR subsidies have grown almost 60% over the past decade, while tenants’ rents have remained relatively static. The main reason for this stability in tenant’s rent income is because of the falling numbers of state houses owned or managed by Housing NZ, as illustrated in Figure 4.1 and in Table 31 in the Appendix.
Other key outcomes emerging from the financial data offered in Table 31 include:
1. The extent to which the Crown has not supported Housing NZ in capital terms; over the past five years (2012 to 2017) the Crown received $305 million in dividends from the company yet provided just $4 million in additional capital.
2. The recent increase in spending on repairs and maintenance rising from $174 million in 2012 to $315 million in 2017.
3. The gradual increase in Housing NZ’s financial value and hence its contribution to the net worth of the Crown. This increase is mainly due to asset appreciation in housing markets New Zealand wide. Between 2012 and 2017 Housing NZ’s net assets rose more than 75% to $21.6 billion. This is 20% of the Crown’s net worth.54
4. Housing NZ is required to pay taxes, unlike the current tax advantages of negative gearing available to private landlords. Over the past ten years the company paid $1.18 billion in tax including $779 million in 2009/10 as a result of a change in depreciation rules. In 2017 Housing NZ still maintained a deferred tax liability of $2 billion in its accounts.
FIGURE 4.3: HOUSING NEW ZEALAND’S REVENUE FROM RENTS AND SUBSIDIES – 2008 TO 201755
30
A Stocktake of New Zealand’s Housing – February 2018

Government housing assistance is provided through a number of programmes, which are forms of both demand subsidies, those going directly to the household or person being supported, or supply subsidies which are paid to the provider of affordable housing. These subsidies mainly support rental housing through the Accommodation Supplement (AS) and the Income-Related Rent (IRR) programme, which are administered by MSD. Subsidies also support homeownership partly through the AS and partly through the Homestart grant programme. A recent extension of Government’s housing assistance programme has been the roll out of supply and demand subsidies for emergency housing.
5.1 Housing assistance budgets
In the current financial year, the Government has budgeted to spend $2.3 billion on various forms of housing subsidies. On top of these subsidies is a budget of approximately $50 million, which supports the administration of these programmes. Estimates of the cost of the various programmes are provided in Appendix Table 3A for the 2017-18 financial year. Table 5.1 reports the value of housing subsidies over the past decade. Since 2008, housing assistance budgets have grown by $695 million in nominal terms, or by just over 50%.
Most of this increase is due to the growing cost of the IRR subsidies, which support around 65,000 households in social housing. The annual cost of this programme grew by almost 80% or by $374 million between 2008 and 2017 to $848 million. However, the number of social housing units supported in 2017 was similar to that supported in 2008.
Annual budgets for the AS grew by 27% in nominal terms or by $238 million between 2008 and 2017. In the 2016-17 financial year Government spent $1.13 billion on the AS programme and made payments to 290,000 households or individuals.
Background data for Table 5.1 and Figure 5.1 are provided in Table 32 in the Appendix.
TABLE 5.1: HOUSING ASSISTANCE BUDGETS IN $ MILLIONS – 2017/1856
Supply subsidies Demand subsides Total
Emergency housing 49 40 89
Renting 900 1,128 2,028
Homeownership 192 192
Total 949 1,360 2,309
Housing Assistance
5.
31
A Stocktake of New Zealand’s Housing – February 2018
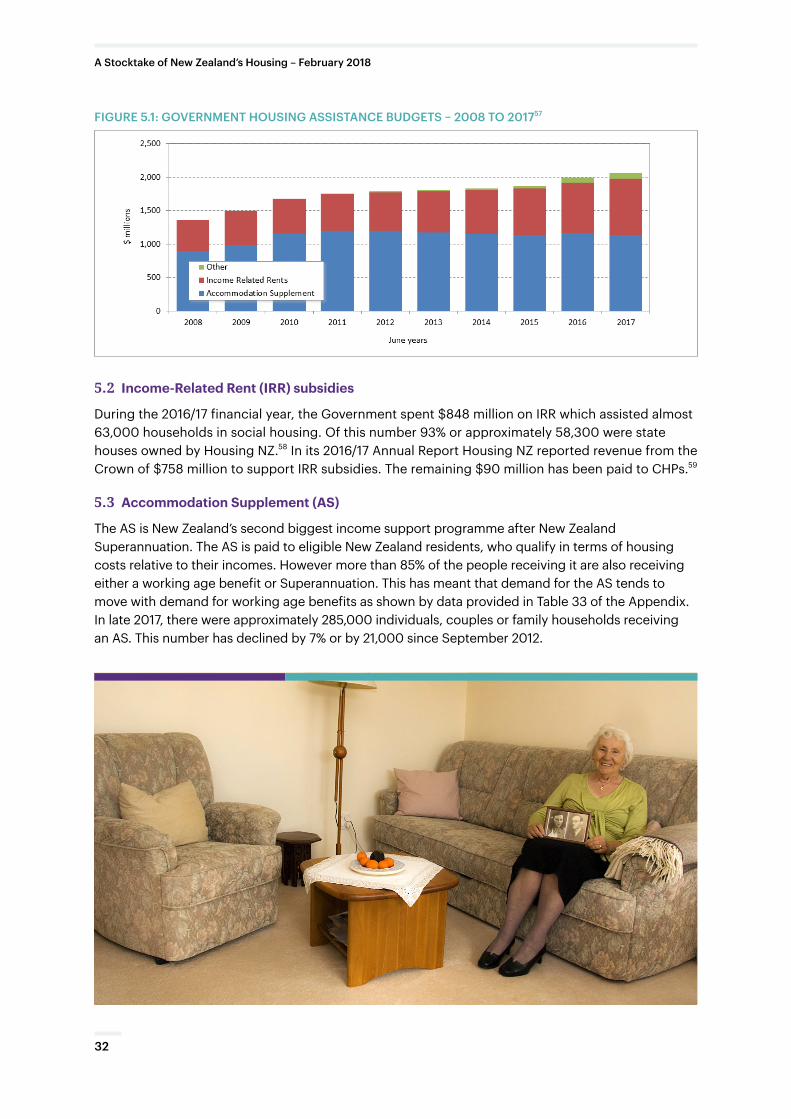
FIGURE 5.1: GOVERNMENT HOUSING ASSISTANCE BUDGETS – 2008 TO 201757
5.2 Income-Related Rent (IRR) subsidies
During the 2016/17 financial year, the Government spent $848 million on IRR which assisted almost 63,000 households in social housing. Of this number 93% or approximately 58,300 were state houses owned by Housing NZ.58 In its 2016/17 Annual Report Housing NZ reported revenue from the Crown of $758 million to support IRR subsidies. The remaining $90 million has been paid to CHPs.59
5.3 Accommodation Supplement (AS)
The AS is New Zealand’s second biggest income support programme after New Zealand Superannuation. The AS is paid to eligible New Zealand residents, who qualify in terms of housing costs relative to their incomes. However more than 85% of the people receiving it are also receiving either a working age benefit or Superannuation. This has meant that demand for the AS tends to move with demand for working age benefits as shown by data provided in Table 33 of the Appendix. In late 2017, there were approximately 285,000 individuals, couples or family households receiving an AS. This number has declined by 7% or by 21,000 since September 2012.
32
A Stocktake of New Zealand’s Housing – February 2018
Two-thirds of recipients of the AS or around 189,000 households are private sector tenants and collectively they receive 75% to 80% of the total spent on the Supplement. For the 2016/17 financial year this spend amounted to approximately $870 million. Households renting and receiving the AS make up 27% to 28% of all tenant households (see Appendix Table 34 for regional estimates of the rental housing stock and AS payments).
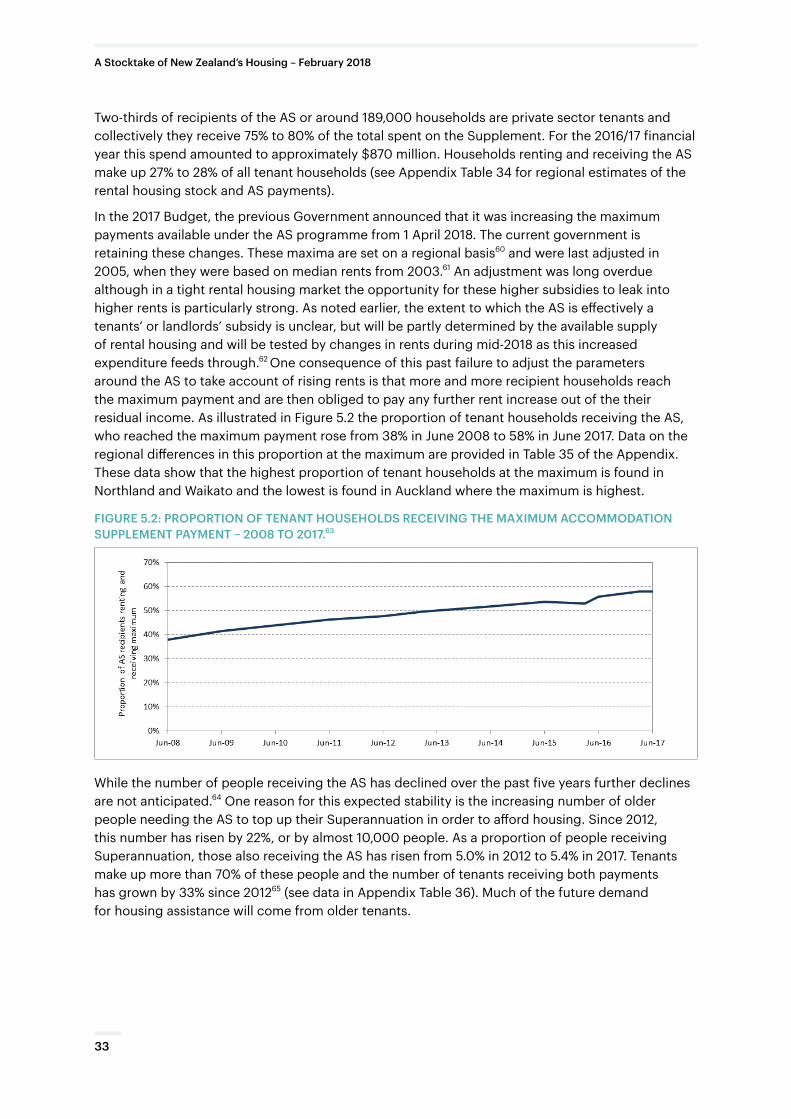
In the 2017 Budget, the previous Government announced that it was increasing the maximum payments available under the AS programme from 1 April 2018. The current government is retaining these changes. These maxima are set on a regional basis60 and were last adjusted in 2005, when they were based on median rents from 2003.61 An adjustment was long overdue although in a tight rental housing market the opportunity for these higher subsidies to leak into higher rents is particularly strong. As noted earlier, the extent to which the AS is effectively a tenants’ or landlords’ subsidy is unclear, but will be partly determined by the available supply of rental housing and will be tested by changes in rents during mid-2018 as this increased expenditure feeds through.62 One consequence of this past failure to adjust the parameters around the AS to take account of rising rents is that more and more recipient households reach the maximum payment and are then obliged to pay any further rent increase out of the their residual income. As illustrated in Figure 5.2 the proportion of tenant households receiving the AS, who reached the maximum payment rose from 38% in June 2008 to 58% in June 2017. Data on the regional differences in this proportion at the maximum are provided in Table 35 of the Appendix. These data show that the highest proportion of tenant households at the maximum is found in Northland and Waikato and the lowest is found in Auckland where the maximum is highest.
FIGURE 5.2: PROPORTION OF TENANT HOUSEHOLDS RECEIVING THE MAXIMUM ACCOMMODATION SUPPLEMENT PAYMENT – 2008 TO 2017.63
While the number of people receiving the AS has declined over the past five years further declines are not anticipated.64 One reason for this expected stability is the increasing number of older people needing the AS to top up their Superannuation in order to afford housing. Since 2012, this number has risen by 22%, or by almost 10,000 people. As a proportion of people receiving Superannuation, those also receiving the AS has risen from 5.0% in 2012 to 5.4% in 2017. Tenants make up more than 70% of these people and the number of tenants receiving both payments has grown by 33% since 201265 (see data in Appendix Table 36). Much of the future demand for housing assistance will come from older tenants.
33
A Stocktake of New Zealand’s Housing – February 2018
5.4 Other housing support programmes
Two other notable housing assistance programmes are the emergency housing programme and the Homestart Grant Scheme for first time homebuyers. Financial details of these programmes are provided in Table 32 of the Appendix and the volumes associated with the emergency housing programme are dealt with in a separate section to this stocktake report.
Volumes of applications and approvals for Homestart grants are reported in Appendix Table 37 for the three-year period July 2014 to June 2017. Over this period, 74,100 applications were received and 55,600 were approved. Since the scheme actually began pay-outs in April 2015, a total $148 million has been granted.66 Consistent with Māori and Pacific peoples’ lower than average home-ownership rates these ethnic groups have a lower take-up of Government backed home-ownership assistance programmes, although the gaps are not as wide as for home-ownership overall. Between July 2012 and June 2016 Māori, who in 2013 constituted 16% of the population, make up 14.3% of those being paid a Kiwisaver deposit subsidy, or a Homestart grant. While Pacific Island people, who constituted 8% of the population in 2013, were just 4.4% of the recipients of these home ownership subsidies.67
5.5 Future budgets
The 2017 Budget made forecasts of significant increases in housing assistance budgets. These forecasts are offered in Table 5.2 for the period through to June 2021. Over the next four years allowance has been made to expand housing assistance budgets by $500 million per year.
TABLE 5.2: FORECASTS FOR HOUSING ASSISTANCE BUDGETS IN $ MILLIONS – 2017 TO 202168
Year ending 30 June 2017 2018 2019 2020 2021
Accommodation Supplement 1,129 1,218 1,488 1,497 1,515
Income related rent subsidies 848 900 985 1,048 1,105
Totals 1,977 2,118 2,473 2,545 2,620
34
A Stocktake of New Zealand’s Housing – February 2018
Homelessness has become a key concern for New Zealanders, and is a key indicator as to whether the housing system is working. Despite allocation of $43 million to emergency housing, there is no systematic recording or monitoring of homelessness on a month-by-month or year-by-year basis. There are no data on the ‘floating population’ – homeless people who do not, or cannot, access government housing assistance, or are turned away from community agencies because they have no capacity to provide help. MSD acknowledge that there are a significant number of homeless households, who are not on the social housing waiting list, but the scale of this problem is unknown. Apart from Census data, we currently have no reliable way of knowing whether the homelessness problem is improving or deteriorating, and whether funding put into homelessness services is actually working to reduce homelessness.
6.1 Census information on homelessness
There was a significant rise in the level of homelessness (or ‘severe housing deprivation’) between the 2006 and 2013 Censuses, with at least one in 100 people homeless in 2013 compared to one in 120 in 2006.64 This was an estimated 4,197 people without habitable accommodation and 37,010 in temporary accommodation, or sharing in severe overcrowding in 2013.70
6.2 Assessments of recent changes in homelessness
Data from a sample of community emergency housing providers, collected from agencies for this report in December 2017, showed that the level of homelessness far outstrips the current level of available assistance. Over 2017, the ‘turnaway rate’ for these providers ranged from 82% to 91% – that is, for every 10 homeless people who approached them, requiring housing, only 1 to 2 people could be accommodated. The data from these providers paint a picture of both desperate families and workers from a range of government agencies going through a laborious process of calling around, looking for emergency housing. The need for a more modern, coordinated system is clear.
Table 6.1 shows the limited extent of up-to-date knowledge about the scale of homelessness. With better systems, the homeless population could be regularly measured and monitored, as a first step towards better support.
Homelessness and Emergency Housing
6.
Significant increase in homelessness between 2006 and 2013
35
A Stocktake of New Zealand’s Housing – February 2018
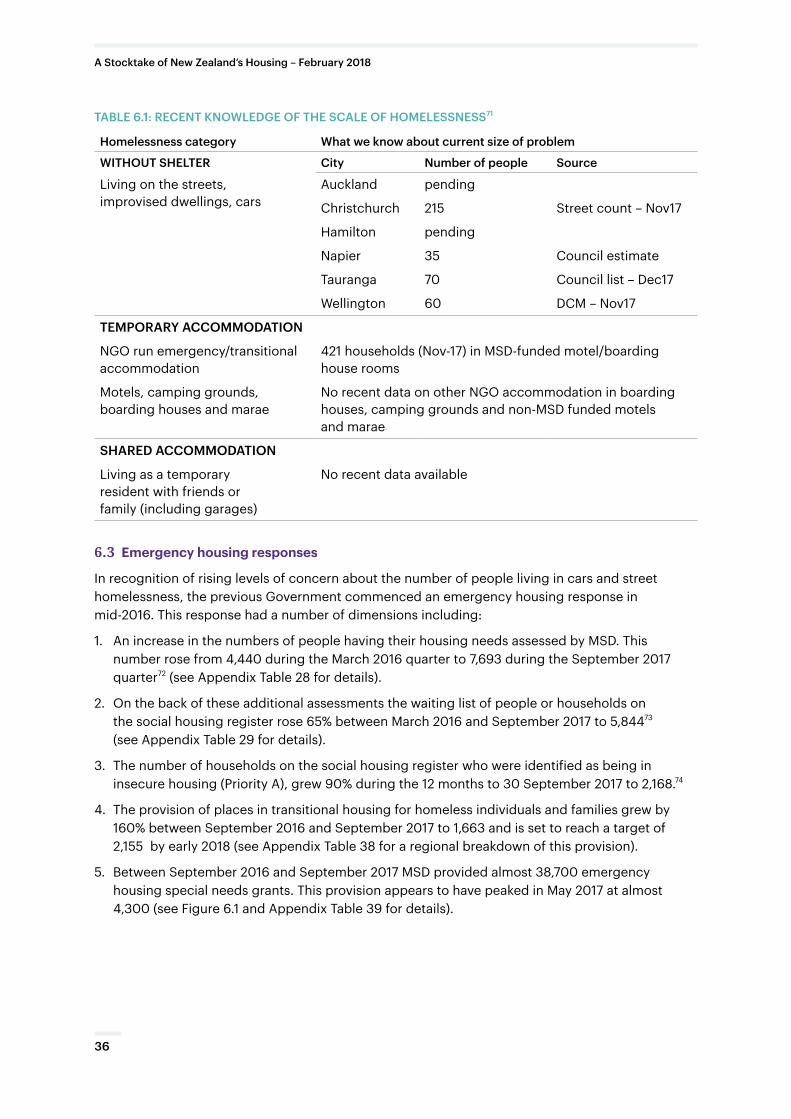
TABLE 6.1: RECENT KNOWLEDGE OF THE SCALE OF HOMELESSNESS71
Homelessness category What we know about current size of problem
WITHOUT SHELTER City Number of people Source
Living on the streets, improvised dwellings, cars
Auckland pending
Christchurch 215 Street count – Nov17
Hamilton pending
Napier 35 Council estimate
Tauranga 70 Council list – Dec17
Wellington 60 DCM – Nov17
TEMPORARY ACCOMMODATION
NGO run emergency/transitional accommodation
421 households (Nov-17) in MSD-funded motel/boarding house rooms
Motels, camping grounds, boarding houses and marae
No recent data on other NGO accommodation in boarding houses, camping grounds and non-MSD funded motels and marae
SHARED ACCOMMODATION
Living as a temporary resident with friends or family (including garages)
No recent data available
6.3 Emergency housing responses
In recognition of rising levels of concern about the number of people living in cars and street homelessness, the previous Government commenced an emergency housing response in mid-2016. This response had a number of dimensions including:
1. An increase in the numbers of people having their housing needs assessed by MSD. This number rose from 4,440 during the March 2016 quarter to 7,693 during the September 2017 quarter72 (see Appendix Table 28 for details).
2. On the back of these additional assessments the waiting list of people or households on the social housing register rose 65% between March 2016 and September 2017 to 5,84473 (see Appendix Table 29 for details).
3. The number of households on the social housing register who were identified as being in insecure housing (Priority A), grew 90% during the 12 months to 30 September 2017 to 2,168.74
4. The provision of places in transitional housing for homeless individuals and families grew by 160% between September 2016 and September 2017 to 1,663 and is set to reach a target of 2,155 by early 2018 (see Appendix Table 38 for a regional breakdown of this provision).
5. Between September 2016 and September 2017 MSD provided almost 38,700 emergency housing special needs grants. This provision appears to have peaked in May 2017 at almost 4,300 (see Figure 6.1 and Appendix Table 39 for details).
36
A Stocktake of New Zealand’s Housing – February 2018
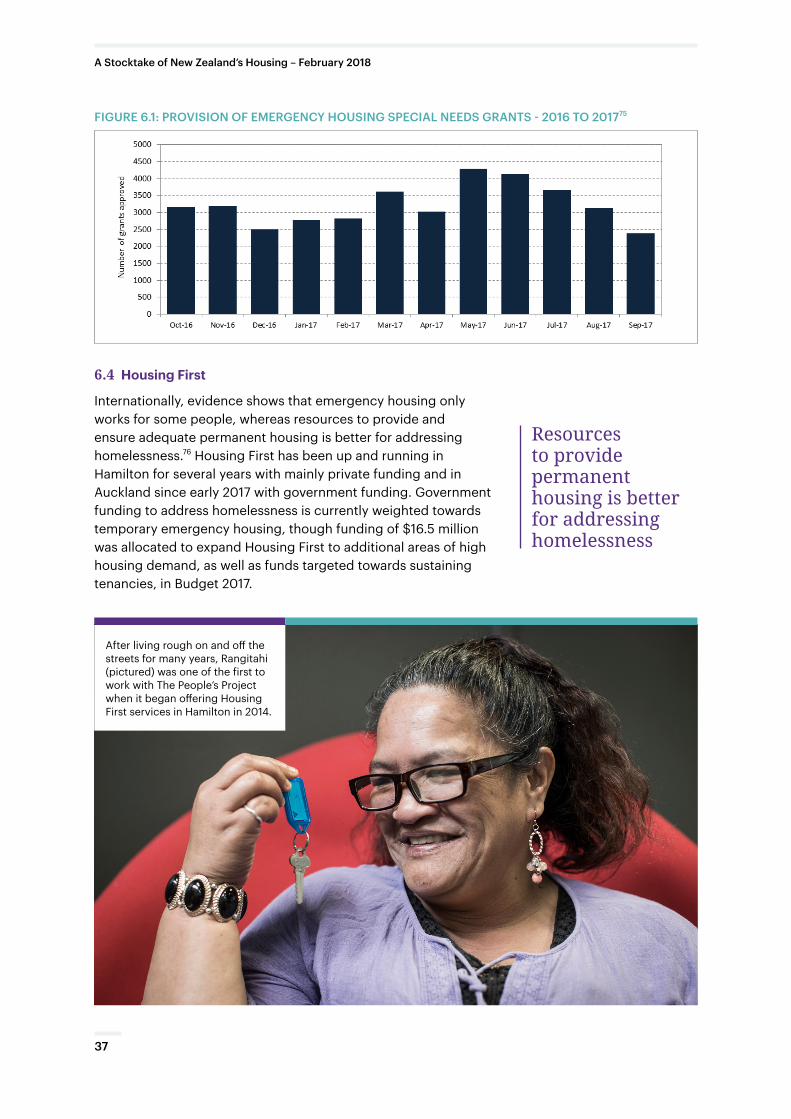
FIGURE 6.1: PROVISION OF EMERGENCY HOUSING SPECIAL NEEDS GRANTS - 2016 TO 201775
6.4 Housing First
Internationally, evidence shows that emergency housing only works for some people, whereas resources to provide and ensure adequate permanent housing is better for addressing homelessness.76 Housing First has been up and running in Hamilton for several years with mainly private funding and in Auckland since early 2017 with government funding. Government funding to address homelessness is currently weighted towards temporary emergency housing, though funding of $16.5 million was allocated to expand Housing First to additional areas of high housing demand, as well as funds targeted towards sustaining tenancies, in Budget 2017.
Resources to provide permanent housing is better for addressing homelessness
After living rough on and off the streets for many years, Rangitahi (pictured) was one of the first to work with The People’s Project when it began offering Housing First services in Hamilton in 2014.
37
A Stocktake of New Zealand’s Housing – February 2018
7.1 Security of tenure in rental housing
Security of tenure in the rental market has been declining in both private and state rental housing. The proportion of people in state housing compared with private rentals has changed significantly between 1991 and 2013. The proportion of renting households who did not own their home and rented in the private sector rose from 60% to 83%. For Māori, the proportion of households renting privately increased from 41% to 77% and for Pacific peoples increased from 27% to 56%. This rise in households renting privately appears to be fuelled by the decline in the state housing stock (which is also under-counted in the Census): in the same period, the proportion of people renting state housing dropped by 16 percentage points for the total renting population, by 29 percentage points for Māori, and 27 percentage points for Pacific peoples.77
The sale of state houses has been accompanied by the tightening of inclusion rules and the introduction of ‘reviewable tenancies’, which has led to increased household movement, or ‘churn’ within state housing. Over the past four years, 42,512 state tenants have left Housing NZ properties, including people who left because they went to a rest home, hospital, prison or died. The homes of 3,715 of these tenants were transferred to two other providers (Tamaki Regeneration Company and Accessible Properties Tauranga). According to data supplied by Housing NZ, 5,739 tenants left when Housing NZ (informed by MSD, which has been responsible for tenancy eligibility, managing the housing register, calculating IRR and conducting tenancy reviews since 2015) initiated a termination. Tenancy termination may occur for a variety of reasons, including becoming ineligible because household income crosses a threshold, rent arrears, or damaging the dwelling.
When a state tenancy is terminated the consequences can be serious. Losing a home can be devastating to health, education and other outcomes.78 79 Having been in arrears, in debt, or having a household member or associates who damage property (which may occur due to issues such as addiction and domestic violence) are all indicators that former state tenants are likely to find it difficult to find a home in the private sector, and may be at risk of homelessness. Recent work to support state tenants to retain tenancies may reduce this risk and could be beneficial for tenant well-being.80 This support could also be extended to private tenants, who are also likely to be at risk of homelessness when they experience eviction.81
As a consequence of the rise in residential property values, there appears to have been an increase in private rental house sales for owner occupation, adding to the shortage of private rental properties, so that as mentioned previously average rents have risen faster than average incomes (with the exception of Christchurch).82 For the most common ‘periodic’ tenancies, section 51(1)(d) of the RTA allows landlords to give 90 days’ notice without reason (tenants can give 21 days’ notice without reason). However, fixed-term tenancies can only be ended early by mutual agreement or on application to the Tenancy Tribunal (see section 50 of the Residential Tenancies Act). While 12 month, fixed-term tenancies are the most common type of tenancy recorded on rental agreements, at the completion of the 12 month term, many of these become periodic.83
Security of Tenure
7.
38
A Stocktake of New Zealand’s Housing – February 2018
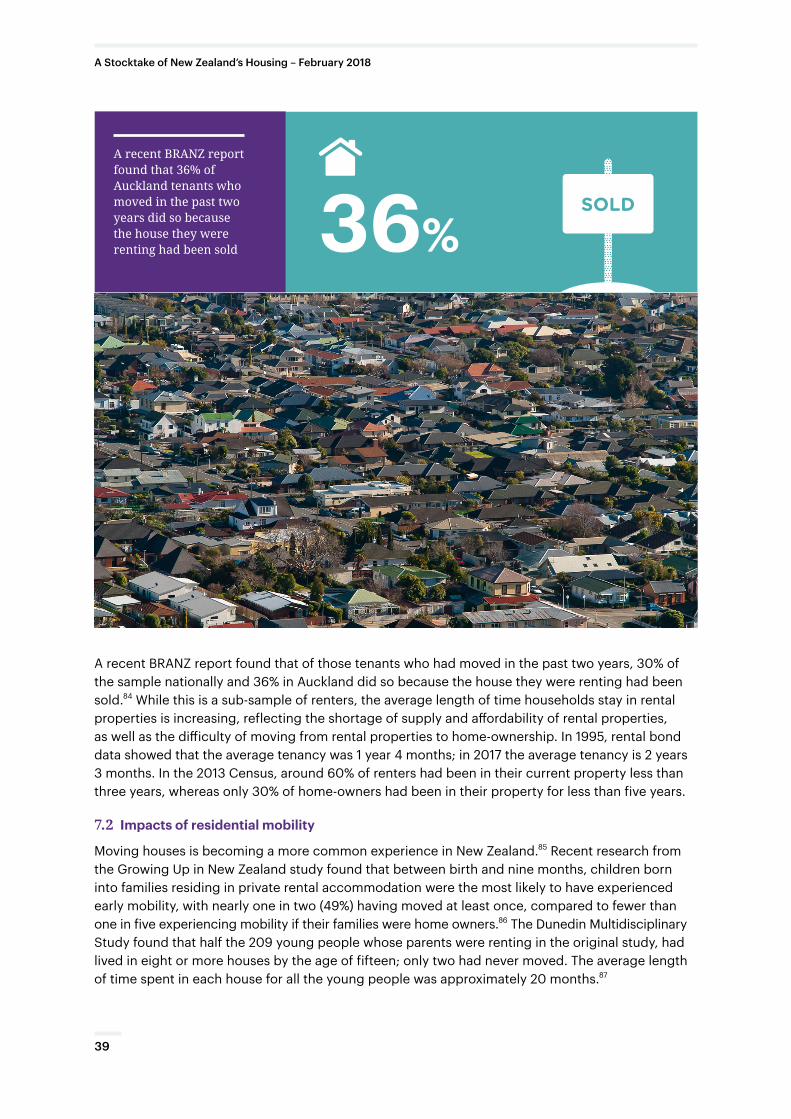
A recent BRANZ report found that of those tenants who had moved in the past two years, 30% of the sample nationally and 36% in Auckland did so because the house they were renting had been sold.84 While this is a sub-sample of renters, the average length of time households stay in rental properties is increasing, reflecting the shortage of supply and affordability of rental properties, as well as the difficulty of moving from rental properties to home-ownership. In 1995, rental bond data showed that the average tenancy was 1 year 4 months; in 2017 the average tenancy is 2 years 3 months. In the 2013 Census, around 60% of renters had been in their current property less than three years, whereas only 30% of home-owners had been in their property for less than five years.
7.2 Impacts of residential mobility
Moving houses is becoming a more common experience in New Zealand.85 Recent research from the Growing Up in New Zealand study found that between birth and nine months, children born into families residing in private rental accommodation were the most likely to have experienced early mobility, with nearly one in two (49%) having moved at least once, compared to fewer than one in five experiencing mobility if their families were home owners.86 The Dunedin Multidisciplinary Study found that half the 209 young people whose parents were renting in the original study, had lived in eight or more houses by the age of fifteen; only two had never moved. The average length of time spent in each house for all the young people was approximately 20 months.87
A recent BRANZ report found that 36% of Auckland tenants who moved in the past two years did so because the house they were renting had been sold 36%
SOLD
39
A Stocktake of New Zealand’s Housing – February 2018
Household movement has a number of major health, educational and social costs, which appear to have been neglected as important housing policy ‘spill-over’ effects. The consequences of frequent moves can be myriad. People who move often are less likely to be affiliated with a primary health care provider (doctor, nurse or medical centre).88 Research carried out by the NZ Council for Educational Research89 and Ministry of Education shows that residential mobility is often associated with a change of school, increasing the disruption to children’s lives. School enrolment data for the cohort of students born in 2000 showed that almost half (48%) of school changes (aside from ones from primary to intermediate to secondary schools) were associated with a change of residential address for the child’s mother. As of March 2015, while 51,000 students had attended fewer than five schools, 6,000 mobile students had attended 5-7 schools and 1,000 very mobile students had attended eight or more schools.
There is international evidence that the negative impacts of moving are greatest when children move both residence and school, and indeed mobile and very mobile students were more likely to receive special education services and show up in truancy data. Compared with other students in the 2000 birth cohort, mobile and very mobile students were more likely to have had a justice intervention by their 15th birthday. Among very mobile students: 11% had at least one youth justice referral, compared with 0.8% of students in the cohort as a whole; 5% had at least one youth justice placement, compared with 0.2% of students in the cohort as a whole; 30% had at least one police proceeding, compared with 5% of students in the cohort as a whole.90
7.3 Tenure changes for households with children
When the regulation and enforcement of rental quality is weak and landlords favour periodic or relatively short-term fixed tenancies, declining home ownership particularly affects children. The proportion of children younger than 15 living in rental dwellings increased even more than for the total population between 1986 and 2013, from 26% of children to 43% (up 65%). This increase in children in rental properties occurred at a time when the proportion of children in the population fell from around one-quarter to just over one-fifth of the population.
Falling home-ownership rates have had most effect among young children in Māori and Pacific people populations. In 1986, around half of Pacific people and Māori children lived in owner-occupied dwellings, but by 2013 only 39% of Māori children and 28% of Pacific children lived in a dwelling the household owned. Rates were even lower for children younger than 1 year, with just
Falling home-ownership rates have had most effect among young children in Māori and Pacific people populations
The proportion of children younger than 15 living in rental accommodation increased from 26% of children to 43% (up 65%) 65%+
40
A Stocktake of New Zealand’s Housing – February 2018
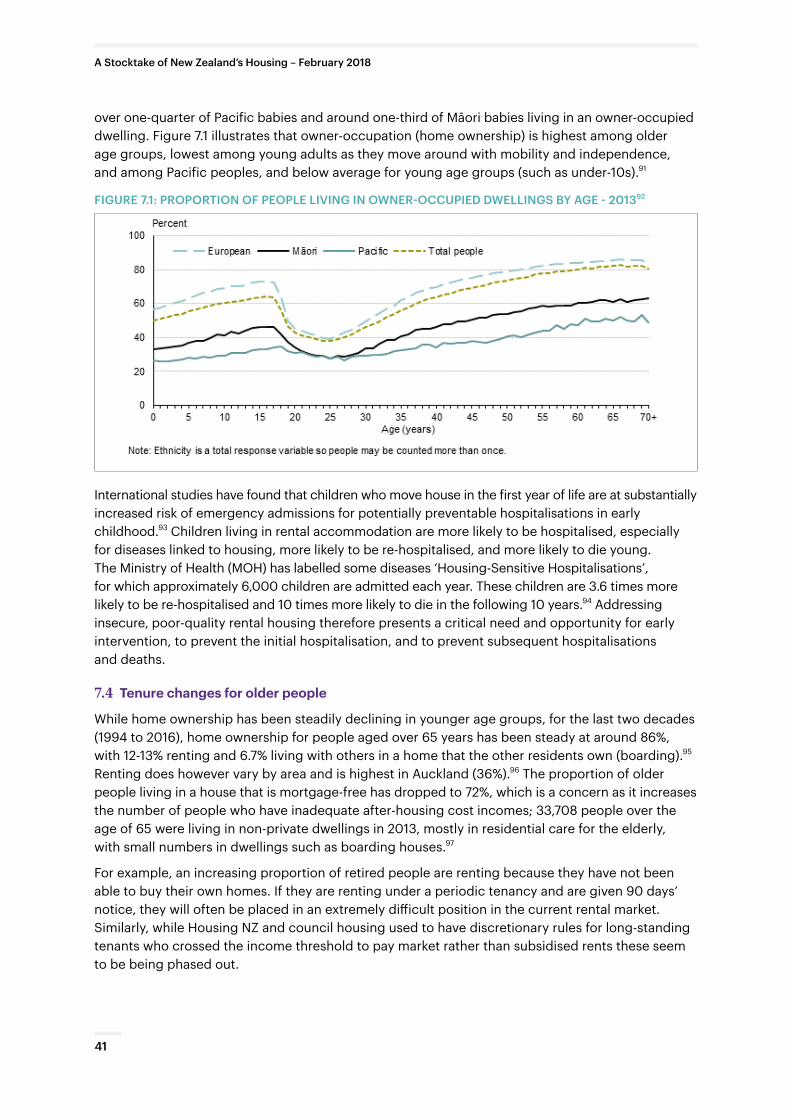
over one-quarter of Pacific babies and around one-third of Māori babies living in an owner-occupied dwelling. Figure 7.1 illustrates that owner-occupation (home ownership) is highest among older age groups, lowest among young adults as they move around with mobility and independence, and among Pacific peoples, and below average for young age groups (such as under-10s).91
FIGURE 7.1: PROPORTION OF PEOPLE LIVING IN OWNER-OCCUPIED DWELLINGS BY AGE - 201392
International studies have found that children who move house in the first year of life are at substantially increased risk of emergency admissions for potentially preventable hospitalisations in early childhood.93 Children living in rental accommodation are more likely to be hospitalised, especially for diseases linked to housing, more likely to be re-hospitalised, and more likely to die young. The Ministry of Health (MOH) has labelled some diseases ‘Housing-Sensitive Hospitalisations’, for which approximately 6,000 children are admitted each year. These children are 3.6 times more likely to be re-hospitalised and 10 times more likely to die in the following 10 years.94 Addressing insecure, poor-quality rental housing therefore presents a critical need and opportunity for early intervention, to prevent the initial hospitalisation, and to prevent subsequent hospitalisations and deaths.
7.4 Tenure changes for older people
While home ownership has been steadily declining in younger age groups, for the last two decades (1994 to 2016), home ownership for people aged over 65 years has been steady at around 86%, with 12-13% renting and 6.7% living with others in a home that the other residents own (boarding).95 Renting does however vary by area and is highest in Auckland (36%).96 The proportion of older people living in a house that is mortgage-free has dropped to 72%, which is a concern as it increases the number of people who have inadequate after-housing cost incomes; 33,708 people over the age of 65 were living in non-private dwellings in 2013, mostly in residential care for the elderly, with small numbers in dwellings such as boarding houses.97
For example, an increasing proportion of retired people are renting because they have not been able to buy their own homes. If they are renting under a periodic tenancy and are given 90 days’ notice, they will often be placed in an extremely difficult position in the current rental market. Similarly, while Housing NZ and council housing used to have discretionary rules for long-standing tenants who crossed the income threshold to pay market rather than subsidised rents these seem to be being phased out.
41
A Stocktake of New Zealand’s Housing – February 2018
Housing quality is not just an aspect of market value. Variations in housing costs do not necessarily correspond to variations in quality, particularly for rental housing. We spend most of our time indoors in our houses98, so the quality of our housing and the indoor environment is important to our health and well-being. As in a number of countries with temperate climates, dwellings in New Zealand have poorer thermal efficiency, which makes them harder to heat than well-insulated houses in more extreme climates. The thermal efficiency of our houses, as well as socio-economic factors and energy affordability, play important roles in determining whether a dwelling is sufficiently warm to keep the occupants healthy.99
As estimated by BRANZ and noted by the OECD100, only around two-thirds of New Zealand houses are even partially insulated, which makes the remainder cold, less energy efficient and more costly to heat, which has a direct effect on the health of occupants.101 The recent BRANZ House Condition Survey based on independent assessments indicated that whilst just over half (53%) of houses had inadequate retrofitted insulation in the roof space and/or subfloor, the proportion was higher in rented homes.102
In winter, 5% of households did not usually heat living areas at all and almost half did not usually heat any occupied bedrooms. Owner-occupied households had access to more cost-effective heaters, such as heat pumps, low-emission wood burners and flued gas heaters, than did renting households, who, despite the risks to health and risks of fire, typically rely on more expensive and less effective heaters, such as unflued gas heaters, which were used to heat 17% of living areas and 6% of bedrooms.103 More effective home heating has been shown to reduce school absences.104
A recent Statistics New Zealand Report on Energy Hardship replicated earlier research,105 106 showing that using a variety of different measures, up to a third (29%) of New Zealand households struggled to afford their power bills, spent a larger part of their income on power, or often felt cold. Around two-thirds of low-income households experienced one or more energy hardship indicators and were three times more likely than all households to have three or more energy hardship
The Social Costs and Benefits of Housing Quality
8.
29% of New Zealand households struggled to afford their power bills, spent a larger part of their income on power, or often felt cold 29%
42
A Stocktake of New Zealand’s Housing – February 2018
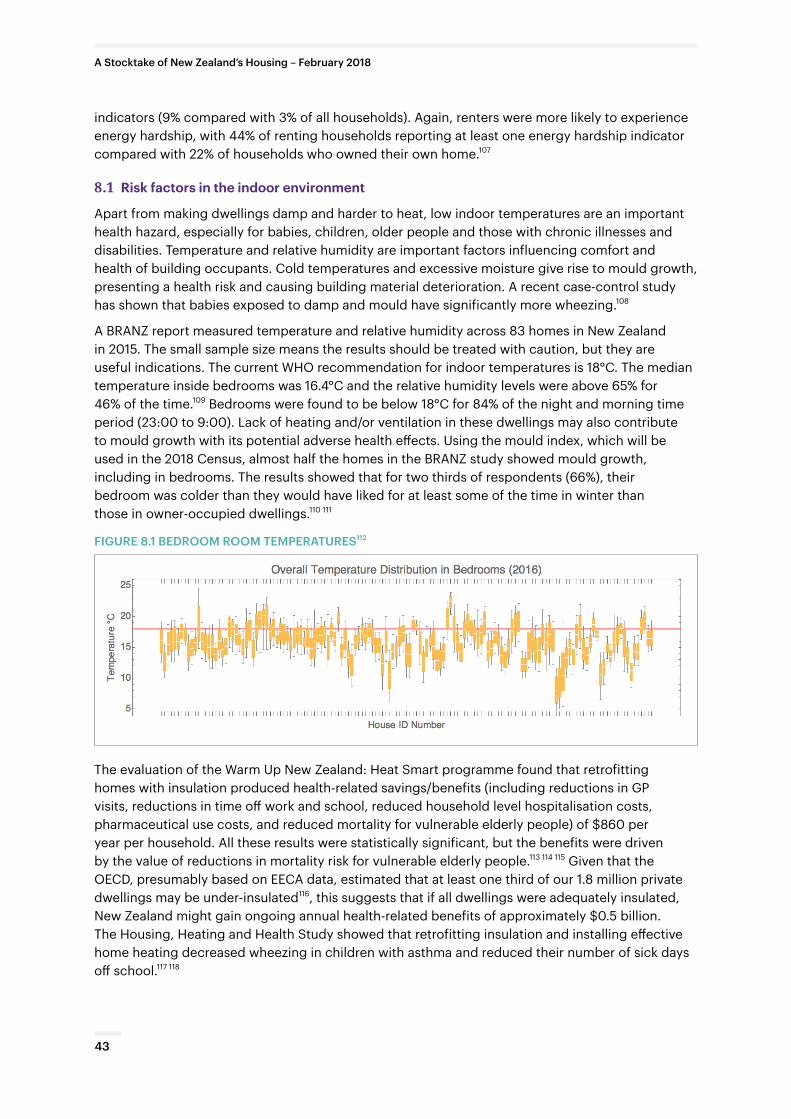
indicators (9% compared with 3% of all households). Again, renters were more likely to experience energy hardship, with 44% of renting households reporting at least one energy hardship indicator compared with 22% of households who owned their own home.107
8.1 Risk factors in the indoor environment
Apart from making dwellings damp and harder to heat, low indoor temperatures are an important health hazard, especially for babies, children, older people and those with chronic illnesses and disabilities. Temperature and relative humidity are important factors influencing comfort and health of building occupants. Cold temperatures and excessive moisture give rise to mould growth, presenting a health risk and causing building material deterioration. A recent case-control study has shown that babies exposed to damp and mould have significantly more wheezing.108
A BRANZ report measured temperature and relative humidity across 83 homes in New Zealand in 2015. The small sample size means the results should be treated with caution, but they are useful indications. The current WHO recommendation for indoor temperatures is 18°C. The median temperature inside bedrooms was 16.4°C and the relative humidity levels were above 65% for 46% of the time.109 Bedrooms were found to be below 18°C for 84% of the night and morning time period (23:00 to 9:00). Lack of heating and/or ventilation in these dwellings may also contribute to mould growth with its potential adverse health effects. Using the mould index, which will be used in the 2018 Census, almost half the homes in the BRANZ study showed mould growth, including in bedrooms. The results showed that for two thirds of respondents (66%), their bedroom was colder than they would have liked for at least some of the time in winter than those in owner-occupied dwellings.110 111
FIGURE 8.1 BEDROOM ROOM TEMPERATURES112
The evaluation of the Warm Up New Zealand: Heat Smart programme found that retrofitting homes with insulation produced health-related savings/benefits (including reductions in GP visits, reductions in time off work and school, reduced household level hospitalisation costs, pharmaceutical use costs, and reduced mortality for vulnerable elderly people) of $860 per year per household. All these results were statistically significant, but the benefits were driven by the value of reductions in mortality risk for vulnerable elderly people.113 114 115 Given that the OECD, presumably based on EECA data, estimated that at least one third of our 1.8 million private dwellings may be under-insulated116, this suggests that if all dwellings were adequately insulated, New Zealand might gain ongoing annual health-related benefits of approximately $0.5 billion. The Housing, Heating and Health Study showed that retrofitting insulation and installing effective home heating decreased wheezing in children with asthma and reduced their number of sick days off school.117 118
43
A Stocktake of New Zealand’s Housing – February 2018
8.2 Crowding and other risks
Crowding is increased by social and economic factors, such as the decline of affordable housing, the rising level of rents in most cities and the lack of security of tenure in the private rental market, which leads to many households ‘doubling up’ to reduce per-person rents.
Data from the 2013 Census shows a mixed picture of crowding. The proportion of people living in crowded households and the proportion of crowded households has dropped, but the number of households and number of people living in them has risen.119 Data from the 2013 Census using a variety of crowding measures showed that around 10% of people live in crowded conditions, with the highest proportion in Counties Manukau DHB region (22%), followed by Auckland (16%) and then Tairawhiti (15%). Children are over represented in crowded households, with over half of crowded households having two or more children living in them. Two in five Pacific people (38%) and one in five Māori (20%) and Asian (18%) people live in crowded households, compared to 1 in 25 Europeans (4%). There is an income gradient with 9% of those people living in crowded households not using any form of heating in their houses.120
People in some low-income households endure crowding as a way to keep warm and this is likely to be one of the main drivers of our high rates of close-contact infectious diseases, especially among children and particularly Pacific and Māori children, where the rates of hospitalisation are double those for European children.121 Tuberculosis acquired in New Zealand is significantly associated with household crowding.122 Approximately 10% of hospital admissions per year for diseases such as pneumonia, meningococcal disease and tuberculosis are attributable to household crowding; for Māori and Pacific people, the number is 20% of hospitalisations.123
While use of administrative data can give an estimate of the maximum extent of the impact of housing on hospitalisations, it is important to note that these are indicative figures and do not necessarily establish causation. Data from the MOH, using their classification of potentially avoidable housing-related hospitalisations, estimate the cost for children aged 0-14 was around $96 million in 2016/17. Using a slightly wider list of diagnostic codes, hospitalisation costs for all age groups in 2016/17 was almost $350 million. However, the MOH classification are indicative only, as they mainly include respiratory data, but do not include cardiovascular or home injury data, both of which are increased by home hazards.
Other studies, which have included mortality as well as hospitalisation, suggest that the true total cost of poor housing is much greater. In 2013, the minimum cost of childhood asthma in New Zealand was $58.3 million. Some $37.8 million of that came from mortality (years of life lost). Adult asthma minimum costs were $264.3 million ($198.7 million mortality). Minimum total asthma costs, which included some costs not able to be disaggregated by age, were $858.2 million ($236.4 million mortality). For all respiratory disease, the total cost was at least $6.2 billion ($4.4 billion mortality). These are minimum, direct costs, and do not include indirect costs such as the long-term impact of interrupted schooling and mental health costs.124
The extent of the under-estimation of overall housing-related health costs can also be gauged from another recent study, which analysed national NZ hospital discharge data (2000-2014) using the Integrated Data Infrastructure to compare different measures of housing related hospitalisation. Using the MOH measure of Potentially Avoidable Hospitalisations, 619,667 hospitalisations affecting 390,220 children and 1,469 deaths occurred. Children with Potentially Avoidable Hospitalisations had twice the risk of re-hospitalisation and three times the risk of death than children hospitalised for diseases not related to housing, after adjusting for age, sex, ethnicity and deprivation.125
44
A Stocktake of New Zealand’s Housing – February 2018
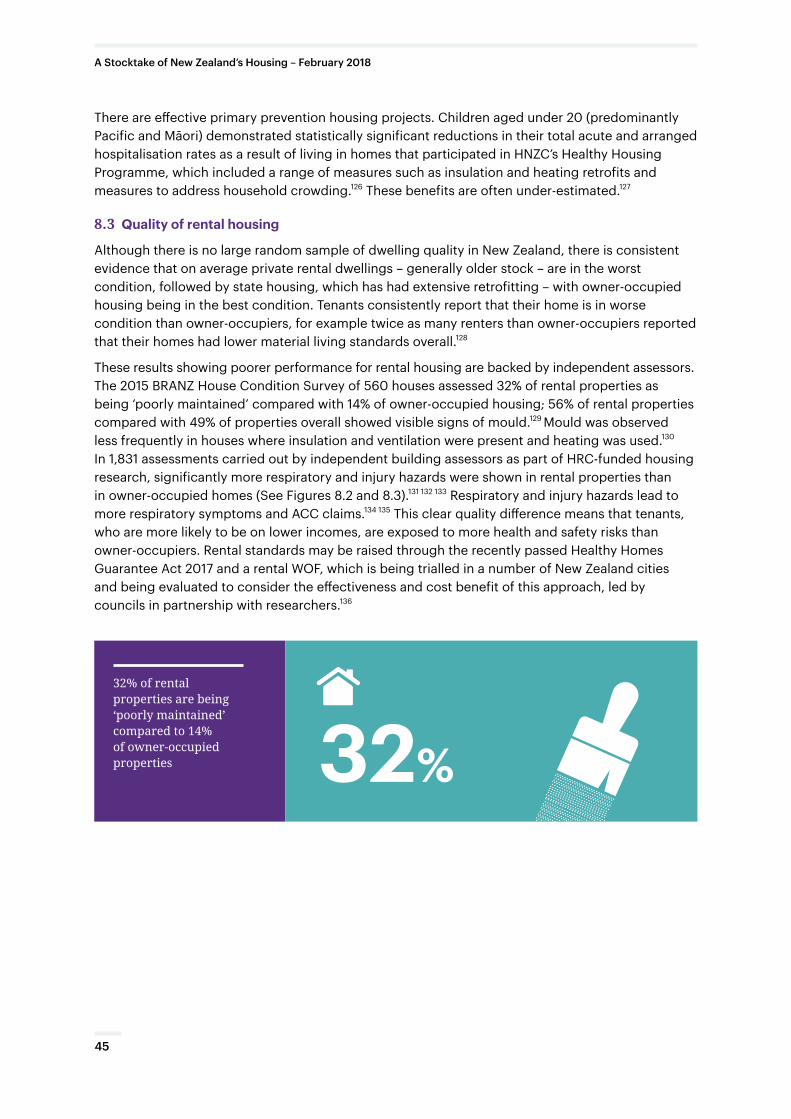
There are effective primary prevention housing projects. Children aged under 20 (predominantly Pacific and Māori) demonstrated statistically significant reductions in their total acute and arranged hospitalisation rates as a result of living in homes that participated in HNZC’s Healthy Housing Programme, which included a range of measures such as insulation and heating retrofits and measures to address household crowding.126 These benefits are often under-estimated.127
8.3 Quality of rental housing
Although there is no large random sample of dwelling quality in New Zealand, there is consistent evidence that on average private rental dwellings – generally older stock – are in the worst condition, followed by state housing, which has had extensive retrofitting – with owner-occupied housing being in the best condition. Tenants consistently report that their home is in worse condition than owner-occupiers, for example twice as many renters than owner-occupiers reported that their homes had lower material living standards overall.128
These results showing poorer performance for rental housing are backed by independent assessors. The 2015 BRANZ House Condition Survey of 560 houses assessed 32% of rental properties as being ‘poorly maintained’ compared with 14% of owner-occupied housing; 56% of rental properties compared with 49% of properties overall showed visible signs of mould.129 Mould was observed less frequently in houses where insulation and ventilation were present and heating was used.130 In 1,831 assessments carried out by independent building assessors as part of HRC-funded housing research, significantly more respiratory and injury hazards were shown in rental properties than in owner-occupied homes (See Figures 8.2 and 8.3).131 132 133 Respiratory and injury hazards lead to more respiratory symptoms and ACC claims.134 135 This clear quality difference means that tenants, who are more likely to be on lower incomes, are exposed to more health and safety risks than owner-occupiers. Rental standards may be raised through the recently passed Healthy Homes Guarantee Act 2017 and a rental WOF, which is being trialled in a number of New Zealand cities and being evaluated to consider the effectiveness and cost benefit of this approach, led by councils in partnership with researchers.136
32% of rental properties are being ‘poorly maintained’ compared to 14% of owner-occupied properties 32%
45
A Stocktake of New Zealand’s Housing – February 2018
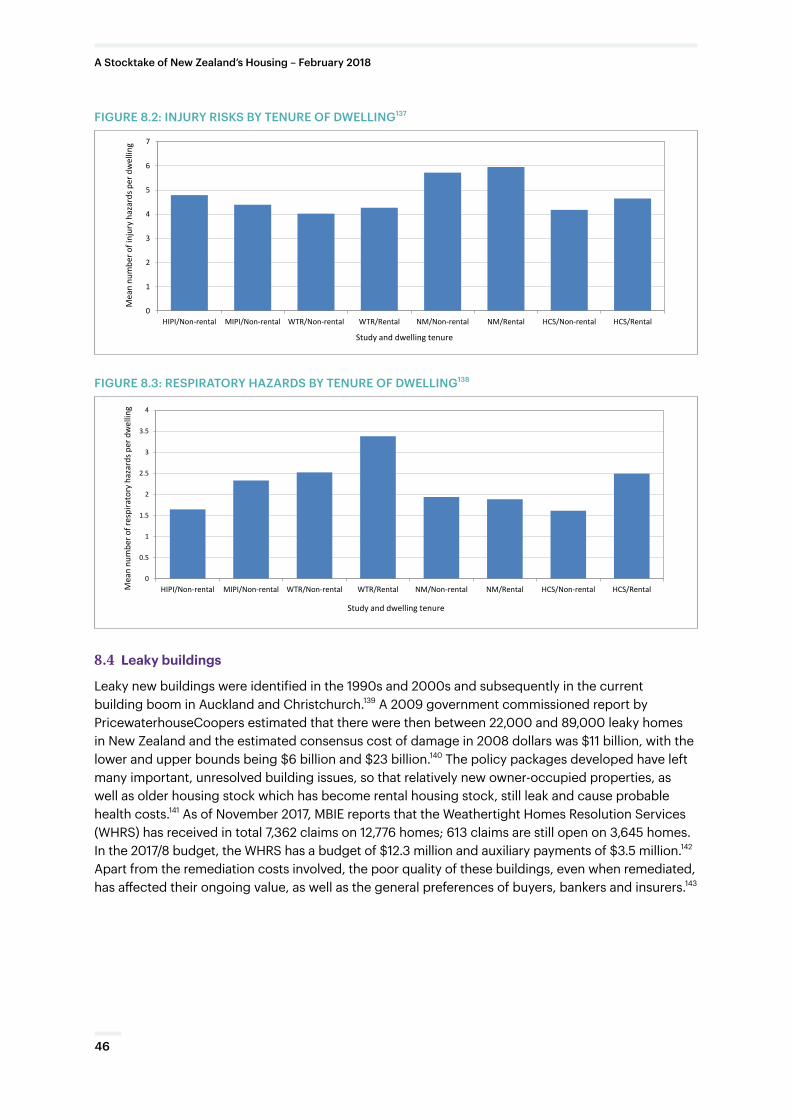
FIGURE 8.2: INJURY RISKS BY TENURE OF DWELLING137
0
1
2
3
4
5
6
7
HIPI/Non-rental MIPI/Non-rental WTR/Non-rental WTR/Rental NM/Non-rental NM/Rental HCS/Non-rental HCS/Rental
Mea
n nu
mbe
r of i
njur
y ha
zard
s per
dw
ellin
g
Study and dwelling tenure
FIGURE 8.3: RESPIRATORY HAZARDS BY TENURE OF DWELLING138
0
0.5
1
1.5
2
2.5
3
3.5
4
HIPI/Non-rental MIPI/Non-rental WTR/Non-rental WTR/Rental NM/Non-rental NM/Rental HCS/Non-rental HCS/RentalMea
n nu
mbe
r of r
espi
rato
ry h
azar
ds p
er d
wel
ling
Study and dwelling tenure
8.4 Leaky buildings
Leaky new buildings were identified in the 1990s and 2000s and subsequently in the current building boom in Auckland and Christchurch.139 A 2009 government commissioned report by PricewaterhouseCoopers estimated that there were then between 22,000 and 89,000 leaky homes in New Zealand and the estimated consensus cost of damage in 2008 dollars was $11 billion, with the lower and upper bounds being $6 billion and $23 billion.140 The policy packages developed have left many important, unresolved building issues, so that relatively new owner-occupied properties, as well as older housing stock which has become rental housing stock, still leak and cause probable health costs.141 As of November 2017, MBIE reports that the Weathertight Homes Resolution Services (WHRS) has received in total 7,362 claims on 12,776 homes; 613 claims are still open on 3,645 homes. In the 2017/8 budget, the WHRS has a budget of $12.3 million and auxiliary payments of $3.5 million.142 Apart from the remediation costs involved, the poor quality of these buildings, even when remediated, has affected their ongoing value, as well as the general preferences of buyers, bankers and insurers.143
46
A Stocktake of New Zealand’s Housing – February 2018
References1 MSD reported that in the three months ending 30 Sept 2017 the total number of Emergency Housing SNGs granted
declined by 20% over the previous quarter, however, this in part reflects the growth in the number of transitional housing places available. The number of new clients presenting to Work and Income with an emergency housing need remained relatively stable over the past 12 months with between 100-150 new clients receiving an EHSNG each week.
2 Recent house price growth has however tended to be in smaller cities and provincial towns. For example in 2016 prices in Auckland (4.3%) or Wellington (7.6%) have risen slower that in some regional towns (Marlborough 17.3%, Horowhenua 15.3%, Wanganui 15.1%, Queenstown-Lakes 13.7%, Rotorua 11.5%, Tasman 11.2%, Napier 10.2%, Nelson 10.2%. The overall price of housing in these smaller cities and towns, except for Queenstown-Lakes remains significantly less than in Auckland and Wellington however.
3 Controller and Auditor General (2011). Government planning and support for housing on Māori land. Wellington: Office of the Controller and Auditor General.
4 Controller and Auditor General (2014). Government planning and support for housing on Māori land Progress in responding to the Auditor-General’s recommendations. Wellington: Office of Controller and Auditor General.
5 Statistics New Zealand (2016). Changes in home-ownership patterns 1986–2013: Focus on Māori and Pacific people. Wellington: Statistics New Zealand.
6 See Residential Tenancy Act s24(1)(d),(e), and (g): http://www.legislation.govt.nz/act/public/1986/0120/52.0/DLM95057.html
7 http://archive.stats.govt.nz/Census/2013-census/profile-and-summary-reports/quickstats-about-housing/home-ownership-individuals.aspx
8 In census statistics, a household consists of one person usually residing alone, or two or more people usually residing together in a private dwelling, therefore visitors are excluded.
9 BRANZ. (2017) The New Zealand Rental Sector Report ER22. Wellington: BRANZ.
10 Stewart A. Bonds worth millions forfeited to Crown. The Dominion Post 10 July 2015:A8.
11 Source: Statistics New Zealand Dwelling and Household Estimates at https://www.stats.govt.nz/information-releases/dwelling-and-household-estimates-september-2017-quarter.
12 Note: Technically these figures are where the dwelling is not owned, as renting only refers to households where they pay rents.
13 Source: Corelogic
14 http://archive.stats.govt.nz/browse_for_stats/people_and_communities/Households/household-economic-survey-info-releases.aspx
15 Over the decade 2008 to 2017 the average proportion of household income spent on housing in Auckland was 18.3% compared with 15.1% in provincial North Island and 13.6% in provincial South Island – see Table 1 in appendices for details
16 Source: Statistics New Zealand – Household Economic Survey – see also Perry, B. Household Incomes in New Zealand; Trends in indicators of inequality and hardship 1982 to 2016
17 Sources: Ministry of Business Innovation and Employment – Tenancy Bond’s database, Statistics New Zealand Quarterly Employment Survey and Consumer Price Index
18 This estimate is based on average weekly wages for employees reported in the Quarterly Employment Survey.
19 The 2015/16 Household Economic Survey reported on moving costs. Average annual expenditure for people who moved (includes renters and owners) was $2,601).
20 Source: Ministry of Business Innovation and Employment Tenancy Bond Division data base: http://www.mbie.govt.nz/info-services/housing-property/sector-information-and-statistics/rental-bond-data.
21 https://www.branz.co.nz/cms_show_download.php?id=606738ff7cb47451e094ad80f39cc912fa18f7a8
22 See Vote Building and Housing in Government’s Estimates & Appropriations 2017/18 p.8.
23 Source: New Zealand Year Books and Statistics New Zealand Dwelling and Household Estimates.
24 Source: http://nzdotstat.stats.govt.nz/wbos/Index.aspx?_ga=2.181434535.165777961.1516222762-1025093187.1510003368
25 Source: Customised data provided by Statistics New Zealand from 2001, 2006 and 2013 Censuses. See http://nzdotstat.stats.govt.nz
26 Data source CoreLogic
47
A Stocktake of New Zealand’s Housing – February 2018
27 Sources: Ministry of Business Innovation and Employment – Tenancy Bond’s database, Statistics New Zealand Quarterly Employment Survey
28 Massey University Real Estate Analysis Unit available at http://www.massey.ac.nz/massey/learning/colleges/college-business/school-of-economics-and-finance/research/mureau/mureau_home.cfm
29 https://www.stats.govt.nz/news/new-zealands-net-wealth-passes-1-5-trillion
30 https://www.stats.govt.nz/news/top-10-percent-of-households-have-half-of-total-net-worth
31 Source: Statistics New Zealand Annual Balance Sheets 2016 (Provisional)
32 See for example Statistics New Zealand’s most recent subnational family and household projections at https://www.stats.govt.nz/news/empty-nesters-a-growing-part-of-the-flock.
33 Source: Statistics New Zealand Dwelling and Household Estimates at https://www.stats.govt.nz/information-releases/dwelling-and-household-estimates-september-2017-quarter.
34 Source: Statistics New Zealand National Population Estimates and Dwelling and Household Estimates.
35 Source: Statistics New Zealand International Travel and Migration data set available at http://archive.stats.govt.nz/infoshare/?url=/infoshare/.
36 Statistics New Zealand Building Consents series from the Infos database
37 Ministry of Business Innovation and Employment (2017) Briefing for the Incoming Minister of Housing and Urban Development; p.14.
38 These estimates are based on Statistics New Zealand’s Sub-National Population Estimates and Building Consents series. They assume that the ideal house building rate is the same as the average dwelling occupancy rate of three people per dwelling.
39 The average size of a house in New Zealand, based on floor area, is 149 square metres. This has generally increased over time, with houses built recently being over 50% larger than houses built in 1900. Based on the decade built, houses had an average floor area of just under 132 square metres in 1900, while houses built since 2010 are on average 205 square metres. QV notes that average sizes of new builds increased from 166.4 metres in 1990 to 205.3 square metres in 2010 onwards. Construction companies believe this is where the greatest demand is (and margins) https://www.qv.co.nz/property-insights-blog/average-house-size-by-age/62. See also http://www.mbie.govt.nz/publications-research/research/construction-sector-productivity/national-construction-pipeline-report-2017.pdf
Work by Viggers and colleagues has also shown that because of increasing house sizes, households in modern houses also use more energy than old state houses (Viggers, H., Keall, M., Wickens, K., Howden-Chapman, P. Increased house size cancels out the effect of improved insulation on overall heating energy requirements, Energy Policy, 2017, 107, 248-257).
40 Statistics New Zealand Producer Price Indices and Consumer Price Indices
41 See the Productivity Commission’s 2017 report Better Urban Planning at https://www.productivity.govt.nz/sites/default/files/MASTER%20COMPILED%20Better%20urban%20planning%20with%20corrections%20May%202017.pdf
42 For an extended discussion of this shift see Howden-Chapman, P., Early, L., Ombler, J. (Eds) Cities in New Zealand: Preferences, patterns and possibilities Wellington, Steele Roberts Aotearoa, 2017.
43 For example, in 2015 there were 2,760 enterprises operating in the Land Development and Site Preparation Sector, but this appears to disguise the true extent of competition amongst developers as:a) the number of enterprises has been decreasing since 2000 (when the total no of enterprises was 3,546);b) 70% of enterprises have fewer than five employees; and c) only six enterprises employed more than 100 people.
44 For a short history of these failures see http://www.parliament.nz/resource/en-nz/49DBSCH_SCR5335_1/0d9cfef1280ab5ba97f9569c8f965bfd7374305f and more recently https://www.interest.co.nz/saving/deep-freeze-list
45 Statistics New Zealand Local Government Financial Statistics
46 Source: Auckland Council’s Annual Reports – 2010/11 to 2016/17
47 This is a definition adopted by UK housing charity Shelter’s. See http://england.shelter.org.uk/campaigns_/why_we_campaign/Improving_social_housing/what_is_social_housing
See also definitions in Howden-Chapman, P. Housing Standards: a glossary of housing and health. Journal of Epidemiology and Community Health, 2004, 58, 162-168.
48 Bierre S, Howden-Chapman P, Early L. (Eds) Homes People Can Afford. Wellington: Steele Roberts; 2013.
49 Source: Ministry of Social Development (2017) Social Housing Update – September 2017. Customised data supplied by Housing New Zealand. Johnson, A (2017) Taking Stock: The Demand for Social Housing in New Zealand. Table 3 p.9.
48
A Stocktake of New Zealand’s Housing – February 2018
50 This figure includes a combination of tenants paying market rent because a quarter of their household income is higher than local market rents, houses funded through appropriations for Community Group Housing, and vacant Housing NZ stock
51 Source: Housing New Zealand Annual reports and data provided by Housing New Zealand.
52 Johnson, A (2017)
53 Source: Ministry of Social Development Social Housing Updates
54 This estimate is based on Treasury forecasts contained in the 2017 Budget Economic and Fiscal Update.
55 Source: Housing New Zealand Annual reports
56 Source: Treasury Budget Economic and Fiscal Update 2017 and Estimates of Appropriations 2017/18. The estimate for demand subsidies for emergency housing is based on Ministry of Social Development’s Benefit Factsheets and is from reports on supplementary benefits paid for the June 2017 and September 2017 quarters.
57 Ibid
58 Ministry of Social Development (2017) Social Housing Quarterly Report – June 2017.
59 Housing New Zealand Annual Report 2017 p.56.
60 See Schedule 18 of the Social Security Act 1964.
61 Johnson, A. (2013) Give Me Shelter: An assessment of New Zealand’s Housing Assistance Policies; p.54.
62 Current advice from Government agencies is that there is little evidence of landlord capture. See for example Treasury’s assessment at http://www.treasury.govt.nz/downloads/pdfs/b17-info/b17-3664879.pdf, http://www.msd.govt.nz/documents/about-msd-and-our-work/work-programmes/family-incomes-package/10-march-aide-memoire-risk-of-landlord-capture-from-increases-to-the-accommodati....pdf
63 From customised data supplied by Ministry of Social Development
64 Treasury (2017) Budget Economic and Fiscal Update 2017 and Estimates of Appropriations 2017/18, p.124
65 From customised data supplied by Ministry of Social Development
66 Housing New Zealand Financial Products Quarterly Reports
67 From customised data supplied by Ministry of Social Development
68 Source: Treasury (2017) Budget Economic and Fiscal Update 2017 and Estimates of Appropriations 2017/18.
69 Amore K. (2016) Severe housing deprivation in Aotearoa/New Zealand. He Kainga Oranga/Housing & Health Research Programme, University of Otago, Wellington
70 Ministry of Business Innovation and Employment (2017). Briefing for the Incoming Minister of Housing & Urban Development 25 October. Wellington: MBIE.
71 Special data collection following the method used in the 2013 Census carried out by Drs Kate Amore and Christina Severinsen.
72 Customised data provided by Ministry of Social Development
73 These figures are for households on the social housing waiting list and do not include social housing tenants seeking a transfer of their tenancy.
74 Source: Data supplied by Ministry of Social Development. (Number of household on social housing register who were identified as being in insecure housing (Priority A) grew 90%)
75 Customised data provided by Ministry of Social Development
76 See Tsemberis, Sam, Housing First: The Pathways Model to End Homelessness for People with Mental Illness and Addiction, Hazelden, 2010 and Pleace, N & Bretherton, J, “The Case for Housing First in the European Union: A Critical Evaluation of Concerns about Effectiveness” in European Journal of Homelessness, 2:7, 2013.
77 Note that there was a large undercount of housing New Zealand properties in 2006 and 2013. See 2013 Census information by variable. Available from www.stats.govt.nz
78 Desmond M. (2012) Eviction and the reproduction of urban poverty. American Journal of Sociology 2012;118(1):88-133
79 Fowler KA, Gladden RM, Vagi KJ, Barnes J, Frazier L. (2015) Increase in suicides associated with home eviction and foreclosure during the US Housing Crisis. American Journal of Public Health 2015;105 (2):311-16.
80 Source: https://www.msd.govt.nz/about-msd-and-our-work/work-programmes/housing/initiatives/better-housing-outcomes-sustaining-tenancies.html
81 Source: https://www.ahuri.edu.au/research/final-reports/259
49
A Stocktake of New Zealand’s Housing – February 2018
82 Ministry of Business Innovation and Employment (2017). Briefing for the Incoming Minister of Housing & Urban Development 25 October. Wellington: MBIE.
83 Source: https://www.branz.co.nz/cms_show_download.php?id=606738ff7cb47451e094ad80f39cc912fa18f7a8
84 Source: https://www.branz.co.nz/cms_show_download.php?id=606738ff7cb47451e094ad80f39cc912fa18f7a8
85 Statistics New Zealand. QuickStats About Population Mobility: 2006 Census.
86 Morton SMB, Atatoa Carr PE, Berry SD, Grant CC, Bandara DK, Mohal J, et al. (2014) Growing Up in New Zealand: A longitudinal study of New Zealand children and their families. Residential Mobility Report 1: Moving house in the first 1000 days. Auckland: Growing Up in New Zealand.
87 Sligo J, McAnally H, Tansley J, Baxter J, Bolton A, Skillander K, et al. (2017) The dynamic, complex and diverse living and care arrangements of young New Zealanders: implications for policy. Kōtuitui: New Zealand Journal of Social Sciences Online. 12(1):41-55, DOI: 10.1080/1177083X.2016.96715
88 Jatrana S, Richardson K, Crampton P. (2013) The association of residential mobility with affiliation to primary care providers. New Zealand Population Review 2013;39:101-20
89 Gilbert J. (2005) Educational Issues for Communities Affected by Transience and Residential Mobility: Report on Phase 1 (2003-2004). Wellington: New Zealand Council for Educational Research.
90 Customised data from Ministry of Business, Innovation and Employment analysis of IDI data. September 2017
91 Statistics New Zealand (2016). Changes in home-ownership patterns 1986–2013: Focus on Māori and Pacific people.
92 Statistics New Zealand – 2013 Census
93 Hutchings HA, Evans A, Barnes P, Demmler JC, Heaven M, Healy MA, et al.(2016) Residential Moving and Preventable Hospitalizations. Pediatrics. 2016;138.
94 Oliver J, Foster T, Kvalsvig A, Williamson DA, Baker MG, Pierse N. (2017) Risk of rehospitalisation and death for vulnerable New Zealand children. Archives of Diseases in Childhood: doi: 10.1136/archdischild-2017-312671.
95 Perry B. Household incomes in New Zealand: Trends in indicators of inequality and hardship 1982 to 2016. Wellington: Ministry of Social Development; 2017.
96 Saville-Smith K, Jackson N. (2017).
97 Source: http://archive.stats.govt.nz/Census/2013-census/profile-and-summary-reports/quickstats-65-plus.aspx
98 Baker M, Keall M, Lyn Au E, Howden-Chapman P. (2007) Home is where the heart is – most of the time. New Zealand Medical Journal. 2007;120:1264.
99 Telfar-Barnard L. (2015) Report of the systematic review on indoor cold for the WHO Housing and Health Guidelines. Geneva: World Health Organization.
100 OECD. (2017) OECD Environmental Performance Reviews: New Zealand 2017. Paris: OECD.
101 Telfar-Barnard L. (2015) Report of the systematic review on insulation against cold for the WHO Housing and Health Guidelines. Geneva: World Health Organization.
102 White V, Jones M. (2017) Warm, dry, healthy? Insights from the 2015 House Condition Survey on insulation, ventilation, heating and mould in New Zealand houses. Judgeford: BRANZ.
103 White V, Jones M. (2017) Warm, dry, healthy? Insights from the 2015 House Condition Survey on insulation, ventilation, heating and mould in New Zealand houses. Judgeford: BRANZ.
104 Free S, Howden-Chapman P, Pierse N, Viggers H, (2010) Housing Heating and Health Study Research Team Study Team. Does more effective home heating reduce school absences for children with asthma? Journal of Epidemiology and Community Health. 2010; 64:379-86
105 Howden-Chapman P, Viggers H, Chapman R, O’Dea D, Free S, O’Sullivan K. (2009) Warm homes: drivers of the demand for heating in the residential sector in New Zealand. Energy Policy. 2009;37(9):3387-99
106 Howden-Chapman P, Viggers H, Chapman R, O’Sullivan K, Telfar Barnard L, Lloyd B. (2012) Tackling cold housing and fuel poverty in New Zealand: A review of policies, research, and health impacts. Energy Policy. 2012;49:134–42
107 Statistics New Zealand (2017). Investigating different measures of energy hardship in New Zealand. Wellington: Statistics NZ; 2017
108 Shorter C, Crane J, Pierse N, Barnes P, Kang J, Wickens K, et al. (2017) Indoor visible mold and mold odour are associated with new-onset childhood wheeze in a dose dependent manner. Indoor Air. 2017;Aug 4(doi: 10.1111/ina.12413.).
109 See Howden-Chapman, P., Roebbel, N., Chisholm, E. Setting housing standards to improve global health, International Journal of Environmental Research and Public Health, 2017, 4.
50
A Stocktake of New Zealand’s Housing – February 2018
110 Plagmann M, White V, McDowall P. (2017) Indoor Climate in New Zealand Homes: Draft report. Judgeford: BRANZ.
111 White V, Jones M. (2017) Warm, dry, healthy? Insights from the 2015 House Condition Survey on insulation, ventilation, heating and mould in New Zealand houses. Judgeford: BRANZ.
112 Ibid
113 Preval N. (2015) Statistical and policy evaluation of large-scale public health interventions. Dunedin: University of Otago.
114 Preval N, Keall M, Telfar-Barnard L, Grimes A, Howden-Chapman P. (2017) Impact of improved insulation and heating on mortality risk of older cohort members with prior cardiovascular or respiratory hospitalisations. BMJ open. 2017;7(11):e018079.
115 Telfar Barnard L, Preval N, Howden-Chapman P, Arnold R, Young C, Grimes A, et al. (2011) The impact of retrofitted insulation and new heaters on health services utilisation and costs, pharmaceutical costs and mortality: Evaluation of Warm Up New Zealand: Heat Smart.
116 OECD. (2017) OECD Environmental Performance Reviews: New Zealand 2017. Paris: OECD.
117 Howden-Chapman P, Pierse N, Nicholls S, Gillespie-Bennett J, Viggers H, Cunningham M, et al. (2008) Effects of improved home heating on asthma in community dwelling children: randomised community study. British Medical Journal. 2008;337:852-5.
118 Free S, Howden-Chapman P, Pierse N, Viggers H, (2010) Housing Heating and Health Study Research Team Study Team. Does more effective home heating reduce school absences for children with asthma? Journal of Epidemiology and Community Health. 2010; 64:379-86.
119 Note: There has been a slight decrease in occupancy rate in severely crowded households from 7.1 people per household to 7 people, but the rate of crowded households, where one more bedroom is needed to prevent crowding, has stayed the same at 4.8 people. https://www.health.govt.nz/publication/analysis-household-crowding-based-census-2013-data.
120 Statistics New Zealand. (2014) Analysis of Household Crowding Based on Census 2013 data. Wellington: Statistics New Zealand.
121 Baker M, Telfar Barnard L, Kvalsvig A, Verrall A, Zhang J, Keall M, et al. (2012) Increasing incidence of serious infectious diseases and inequalities in New Zealand: a national epidemiological study. The Lancet. 2012;379:1112-19
122 Baker M, Das D, Venugopal K, Howden-Chapman P. (2008) Tuberculosis associated with household crowding in a developed country. Journal of Epidemiology and Community Health. 2008;62:715-21.
123 Baker MG, McDonald A, Zhang J, Howden-Chapman P. (2013) Infectious Diseases Attributable to Household Crowding in New Zealand: A Systematic Review and Burden of Disease Estimate. Wellington: He Kainga Oranga / Housing and Health Research Programme, University of Otago, Wellington.
124 Telfar Barnard L, Zhang J. (2017) The Impact of Respiratory Disease in New Zealand: 2016 update Auckland: Asthma and Respiratory Foundation NZ.
125 Oliver J, Foster T, Kvalsvig A, Williamson DA, Baker MG, Pierse N. (2017) Risk of rehospitalisation and death for vulnerable New Zealand children. Archives of Diseases in Childhood;doi: 10.1136/archdischild-2017-312671
126 Baker M, Zhang J, Keall M, Howden-Chapman P. (2011) Health Impacts of the Healthy Housing Programme on Housing New Zealand Tenants: 2004-2008. Wellington: He Kainga Oranga/Housing and Health Research Programme, University of Otago.
127 Howden-Chapman, P., Chapman, R., Baker, M.G. (2013) Invited editorial: Valuing social housing needs to take a broader view, Journal of Epidemiology and Community Health, 2013, 67, 10, 803-804.
128 Statistics New Zealand (2015). Perceptions of housing quality in 2014/15. Wellington: Statistics New Zealand.
129 White V, Jones M, Cowan V, Chun S. (2017) BRANZ 2015 House Condition Survey: Comparison of house condition by tenure SR370. Judgeford: BRANZ.
130 White V, Jones M. (2017).
131 Keall MD, Crane J, Baker MG, Wickens K, Howden-Chapman P, Cunningham M. (2012) A measure for quantifying the impact of housing quality on respiratory health: a cross-sectional study. Environmental Health 2012;11.
132 Keall M, Baker M, Howden-Chapman P, Cunningham C. (2008) Association between the number of home injury hazards and home injury. Accident Analysis and Prevention. 2008;40 (3):887-93.
133 Keall MD, Howden-Chapman P, Baker MG, Kamalesh V, Cunningham M, Cunningham C, et al. (2013) Formulating a programme of repairs to structural home injury hazards in New Zealand. Accident Analysis & Prevention. 2013;57(0):124-30.
51
A Stocktake of New Zealand’s Housing – February 2018
134 Keall MD, Guria J, Howden-Chapman P, Baker MG. (2011) Estimation of the social costs of home injury: a comparison with estimates for road injury Accident Analysis and Prevention. 2011;43(3):998-1002.
135 Keall M, Pierse N, Howden-Chapman P, Guria J, Cunningham C, Baker M. (2014) Reduction in fall injury rates achieved by home modification: a cluster randomised controlled trial. The Lancet. 2014;284(9949):1159-236.
136 Telfar-Barnard L, Bennett J, Howden-Chapman P, Jacobs DE, Ormandy D, Cutler-Welsh M, et al. (2017) Measuring the Effect of Housing Quality Interventions: The Case of the New Zealand “Rental Warrant of Fitness”. International Journal of Environmental Research and Public Health. 2017;4.
137 Sources: HIPI: Keall MD, Pierse N, Howden-Chapman P. et al Home modifications to reduce injuries from falls in the Home Injury Prevention Intervention (HIPI) study: a cluster-randomised controlled trial. The Lancet 2015; 385: 231–38. MHIPI: https://www.anzctr.org.au/Trial/Registration/TrialReview.aspx?id=363525&isReview=trueWhiti Te Ra WTR: http://www.otago.ac.nz/news/news/otago020889.pdf Te Hoe Nuku Roa NR: http://www.massey.ac.nz/~wwpubafs/2004/Massey_News/feb/feb23/stories/11-02-04.html HCS: Buckett NR, Jones MS, Marston NJ. BRANZ 2010 House Condition Survey: condition comparison by tenure: BRANZ; 2011.
138 Ibid
139 Howden-Chapman P, Ruthe C, Crichton S. (2011) Habitable houses: lessons learned? The Leaky Building Crisis: Understanding the issues. Wellington: Thomson Reuters; 2011. p. 303-15.
140 Department of Building and Housing (2009). Weathertightness – Estimating the Cost. July 2009.
141 Douwes J, Howden-Chapman P. (2011) An overview of possible health effects from exposure to “leaky buildings”. The Leaky Building Crisis: Understanding the issues. Wellington: Thomson Reuters; 2011. p. 71-84.
142 Ministry of Business Innovation and Employment (2017). Briefing for the Incoming Minister of Housing & Urban Development 25 October. Wellington: MBIE.
143 Shi S, McCarthy I, Mai U.(2017) Leaky building stigma: Can it be eliminated by remediation? Evidence from New Zealand. International Journal of Housing Markets and Analysis. 2017;10(3):328-51. https://doi.org/10.1108/IJHMA-06-2016-0043
52
A Stocktake of New Zealand’s Housing – February 2018
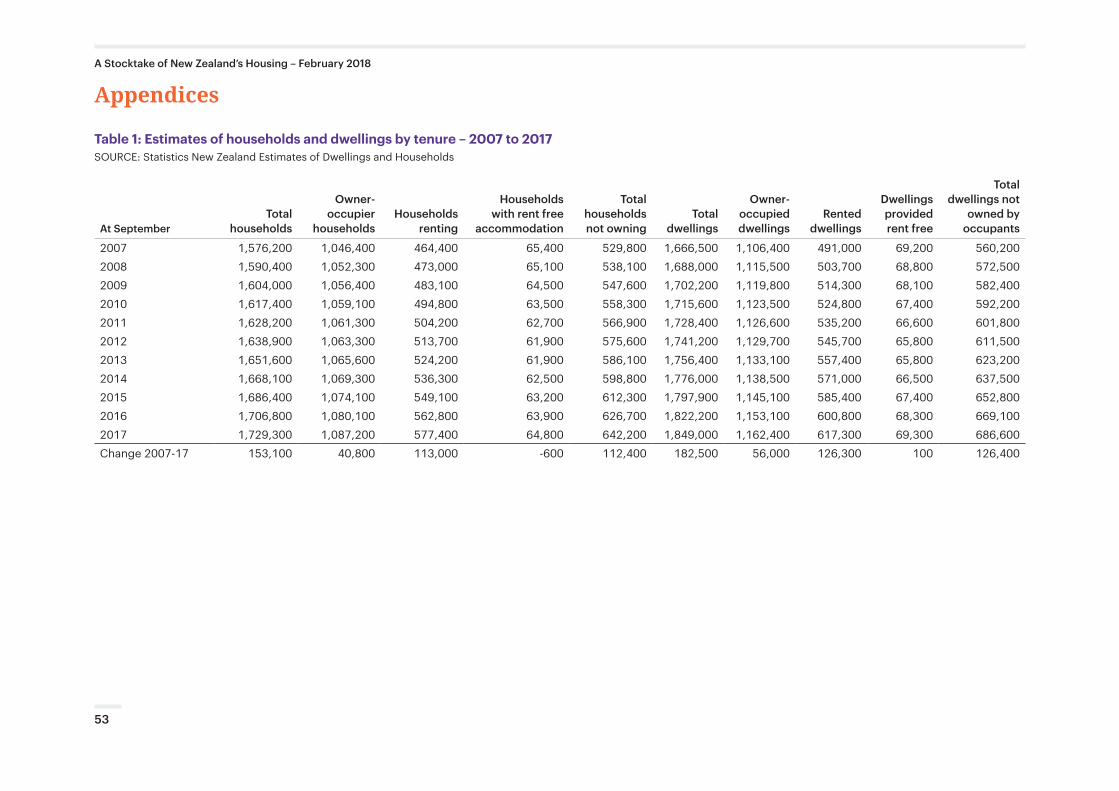
Appendices
Table 1: Estimates of households and dwellings by tenure – 2007 to 2017SOURCE: Statistics New Zealand Estimates of Dwellings and Households
At September Total
households
Owner-occupier
householdsHouseholds
renting
Households with rent free
accommodation
Total households not owning
Total dwellings
Owner-occupied dwellings
Rented dwellings
Dwellings provided rent free
Total dwellings not
owned by occupants
2007 1,576,200 1,046,400 464,400 65,400 529,800 1,666,500 1,106,400 491,000 69,200 560,2002008 1,590,400 1,052,300 473,000 65,100 538,100 1,688,000 1,115,500 503,700 68,800 572,5002009 1,604,000 1,056,400 483,100 64,500 547,600 1,702,200 1,119,800 514,300 68,100 582,4002010 1,617,400 1,059,100 494,800 63,500 558,300 1,715,600 1,123,500 524,800 67,400 592,2002011 1,628,200 1,061,300 504,200 62,700 566,900 1,728,400 1,126,600 535,200 66,600 601,8002012 1,638,900 1,063,300 513,700 61,900 575,600 1,741,200 1,129,700 545,700 65,800 611,5002013 1,651,600 1,065,600 524,200 61,900 586,100 1,756,400 1,133,100 557,400 65,800 623,2002014 1,668,100 1,069,300 536,300 62,500 598,800 1,776,000 1,138,500 571,000 66,500 637,5002015 1,686,400 1,074,100 549,100 63,200 612,300 1,797,900 1,145,100 585,400 67,400 652,8002016 1,706,800 1,080,100 562,800 63,900 626,700 1,822,200 1,153,100 600,800 68,300 669,1002017 1,729,300 1,087,200 577,400 64,800 642,200 1,849,000 1,162,400 617,300 69,300 686,600Change 2007-17 153,100 40,800 113,000 -600 112,400 182,500 56,000 126,300 100 126,400
53
A Stocktake of New Zealand’s Housing – February 2018
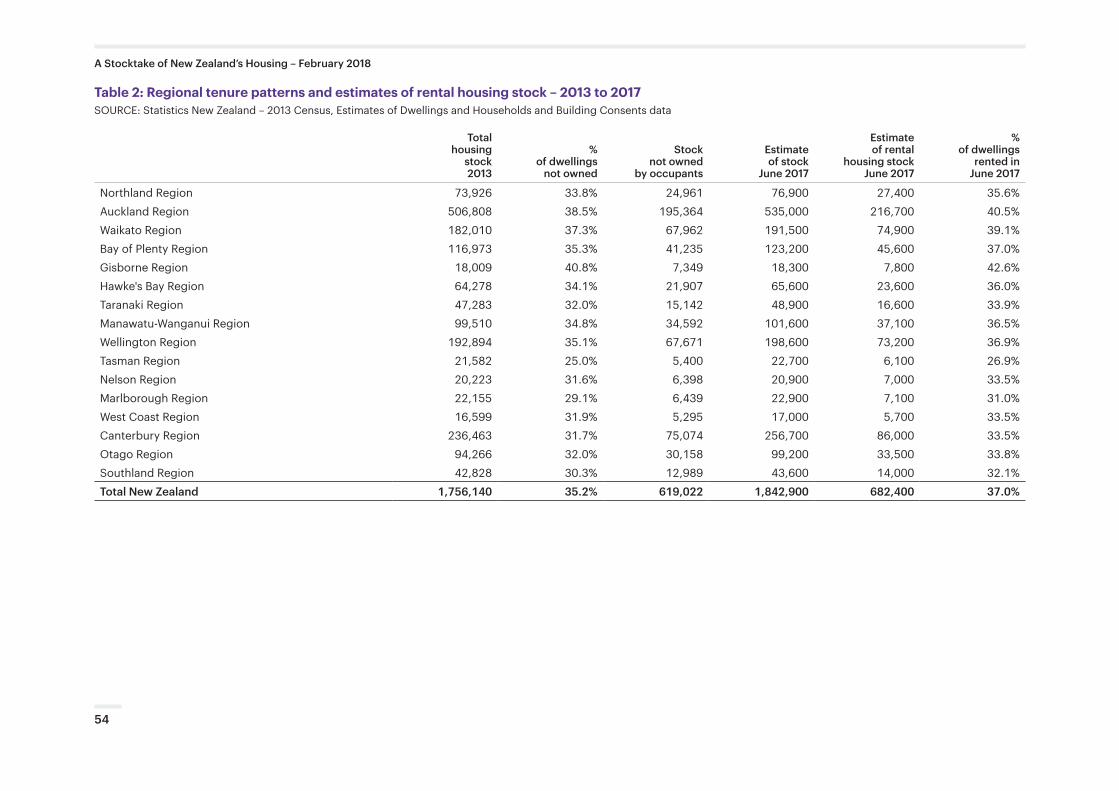
Table 2: Regional tenure patterns and estimates of rental housing stock – 2013 to 2017SOURCE: Statistics New Zealand – 2013 Census, Estimates of Dwellings and Households and Building Consents data
Total housing
stock2013
% of dwellings
not owned
Stock not owned
by occupants
Estimate of stock
June 2017
Estimate of rental
housing stock June 2017
% of dwellings
rented in June 2017
Northland Region 73,926 33.8% 24,961 76,900 27,400 35.6%Auckland Region 506,808 38.5% 195,364 535,000 216,700 40.5%Waikato Region 182,010 37.3% 67,962 191,500 74,900 39.1%Bay of Plenty Region 116,973 35.3% 41,235 123,200 45,600 37.0%Gisborne Region 18,009 40.8% 7,349 18,300 7,800 42.6%Hawke's Bay Region 64,278 34.1% 21,907 65,600 23,600 36.0%Taranaki Region 47,283 32.0% 15,142 48,900 16,600 33.9%Manawatu-Wanganui Region 99,510 34.8% 34,592 101,600 37,100 36.5%Wellington Region 192,894 35.1% 67,671 198,600 73,200 36.9%Tasman Region 21,582 25.0% 5,400 22,700 6,100 26.9%Nelson Region 20,223 31.6% 6,398 20,900 7,000 33.5%Marlborough Region 22,155 29.1% 6,439 22,900 7,100 31.0%West Coast Region 16,599 31.9% 5,295 17,000 5,700 33.5%Canterbury Region 236,463 31.7% 75,074 256,700 86,000 33.5%Otago Region 94,266 32.0% 30,158 99,200 33,500 33.8%Southland Region 42,828 30.3% 12,989 43,600 14,000 32.1%Total New Zealand 1,756,140 35.2% 619,022 1,842,900 682,400 37.0%
54
A Stocktake of New Zealand’s Housing – February 2018
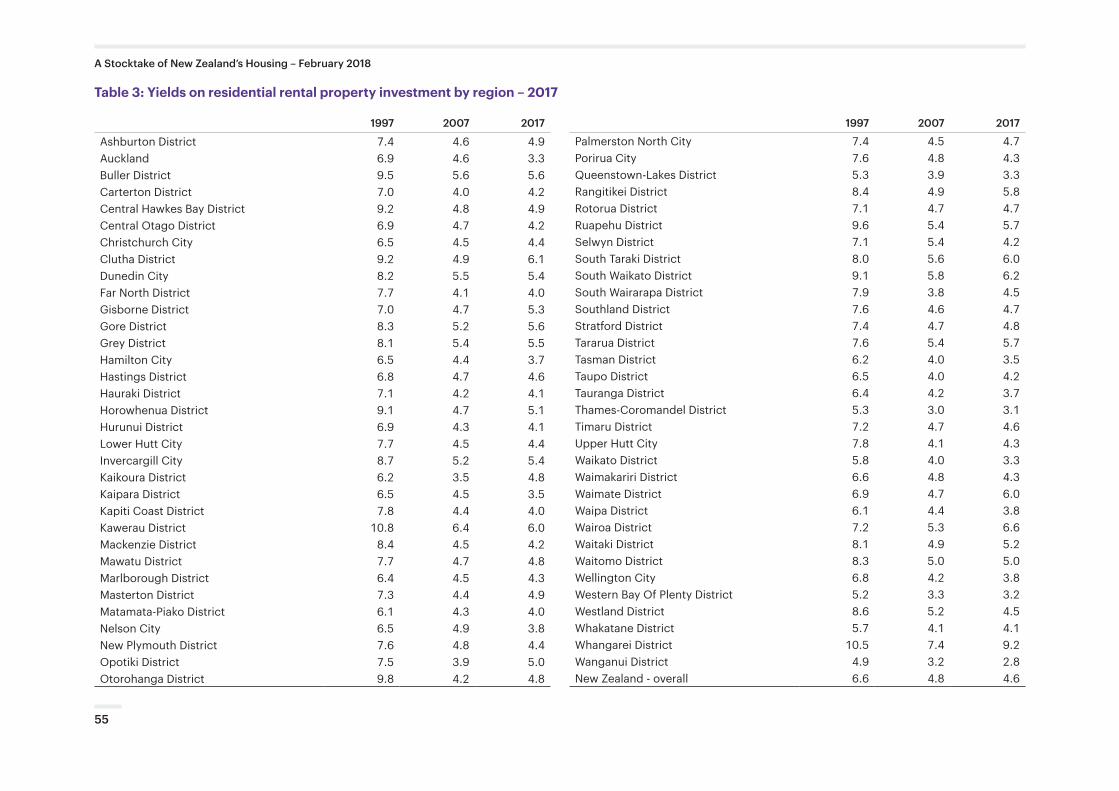
Table 3: Yields on residential rental property investment by region – 2017
1997 2007 2017
Ashburton District 7.4 4.6 4.9Auckland 6.9 4.6 3.3Buller District 9.5 5.6 5.6Carterton District 7.0 4.0 4.2Central Hawkes Bay District 9.2 4.8 4.9Central Otago District 6.9 4.7 4.2Christchurch City 6.5 4.5 4.4Clutha District 9.2 4.9 6.1Dunedin City 8.2 5.5 5.4Far North District 7.7 4.1 4.0Gisborne District 7.0 4.7 5.3Gore District 8.3 5.2 5.6Grey District 8.1 5.4 5.5Hamilton City 6.5 4.4 3.7Hastings District 6.8 4.7 4.6Hauraki District 7.1 4.2 4.1Horowhenua District 9.1 4.7 5.1Hurunui District 6.9 4.3 4.1Lower Hutt City 7.7 4.5 4.4Invercargill City 8.7 5.2 5.4Kaikoura District 6.2 3.5 4.8Kaipara District 6.5 4.5 3.5Kapiti Coast District 7.8 4.4 4.0Kawerau District 10.8 6.4 6.0Mackenzie District 8.4 4.5 4.2Mawatu District 7.7 4.7 4.8Marlborough District 6.4 4.5 4.3Masterton District 7.3 4.4 4.9Matamata-Piako District 6.1 4.3 4.0Nelson City 6.5 4.9 3.8New Plymouth District 7.6 4.8 4.4Opotiki District 7.5 3.9 5.0Otorohanga District 9.8 4.2 4.8
1997 2007 2017
Palmerston North City 7.4 4.5 4.7Porirua City 7.6 4.8 4.3Queenstown-Lakes District 5.3 3.9 3.3Rangitikei District 8.4 4.9 5.8Rotorua District 7.1 4.7 4.7Ruapehu District 9.6 5.4 5.7Selwyn District 7.1 5.4 4.2South Taraki District 8.0 5.6 6.0South Waikato District 9.1 5.8 6.2South Wairarapa District 7.9 3.8 4.5Southland District 7.6 4.6 4.7Stratford District 7.4 4.7 4.8Tararua District 7.6 5.4 5.7Tasman District 6.2 4.0 3.5Taupo District 6.5 4.0 4.2Tauranga District 6.4 4.2 3.7Thames-Coromandel District 5.3 3.0 3.1Timaru District 7.2 4.7 4.6Upper Hutt City 7.8 4.1 4.3Waikato District 5.8 4.0 3.3Waimakariri District 6.6 4.8 4.3Waimate District 6.9 4.7 6.0Waipa District 6.1 4.4 3.8Wairoa District 7.2 5.3 6.6Waitaki District 8.1 4.9 5.2Waitomo District 8.3 5.0 5.0Wellington City 6.8 4.2 3.8Western Bay Of Plenty District 5.2 3.3 3.2Westland District 8.6 5.2 4.5Whakatane District 5.7 4.1 4.1Whangarei District 10.5 7.4 9.2Wanganui District 4.9 3.2 2.8New Zealand - overall 6.6 4.8 4.6
55
A Stocktake of New Zealand’s Housing – February 2018
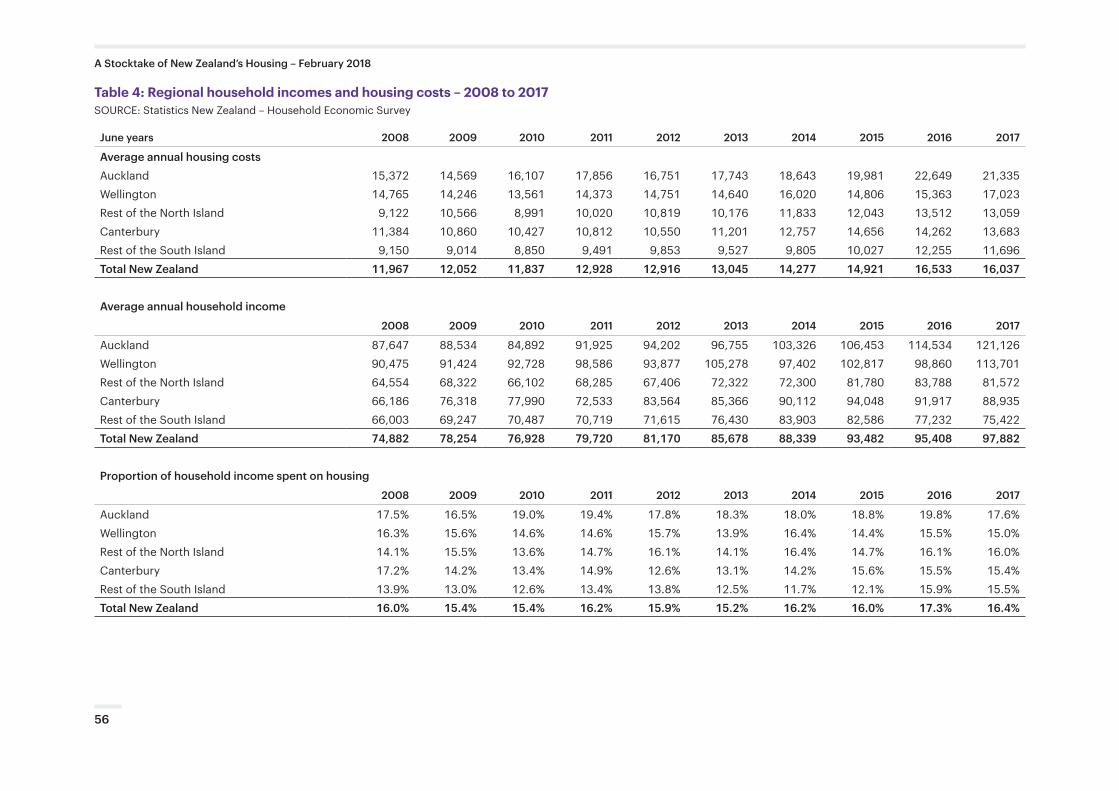
Table 4: Regional household incomes and housing costs – 2008 to 2017SOURCE: Statistics New Zealand – Household Economic Survey
June years 2008 2009 2010 2011 2012 2013 2014 2015 2016 2017
Average annual housing costsAuckland 15,372 14,569 16,107 17,856 16,751 17,743 18,643 19,981 22,649 21,335Wellington 14,765 14,246 13,561 14,373 14,751 14,640 16,020 14,806 15,363 17,023Rest of the North Island 9,122 10,566 8,991 10,020 10,819 10,176 11,833 12,043 13,512 13,059Canterbury 11,384 10,860 10,427 10,812 10,550 11,201 12,757 14,656 14,262 13,683Rest of the South Island 9,150 9,014 8,850 9,491 9,853 9,527 9,805 10,027 12,255 11,696Total New Zealand 11,967 12,052 11,837 12,928 12,916 13,045 14,277 14,921 16,533 16,037
Average annual household income
2008 2009 2010 2011 2012 2013 2014 2015 2016 2017
Auckland 87,647 88,534 84,892 91,925 94,202 96,755 103,326 106,453 114,534 121,126Wellington 90,475 91,424 92,728 98,586 93,877 105,278 97,402 102,817 98,860 113,701Rest of the North Island 64,554 68,322 66,102 68,285 67,406 72,322 72,300 81,780 83,788 81,572Canterbury 66,186 76,318 77,990 72,533 83,564 85,366 90,112 94,048 91,917 88,935Rest of the South Island 66,003 69,247 70,487 70,719 71,615 76,430 83,903 82,586 77,232 75,422Total New Zealand 74,882 78,254 76,928 79,720 81,170 85,678 88,339 93,482 95,408 97,882
Proportion of household income spent on housing
2008 2009 2010 2011 2012 2013 2014 2015 2016 2017
Auckland 17.5% 16.5% 19.0% 19.4% 17.8% 18.3% 18.0% 18.8% 19.8% 17.6%Wellington 16.3% 15.6% 14.6% 14.6% 15.7% 13.9% 16.4% 14.4% 15.5% 15.0%Rest of the North Island 14.1% 15.5% 13.6% 14.7% 16.1% 14.1% 16.4% 14.7% 16.1% 16.0%Canterbury 17.2% 14.2% 13.4% 14.9% 12.6% 13.1% 14.2% 15.6% 15.5% 15.4%Rest of the South Island 13.9% 13.0% 12.6% 13.4% 13.8% 12.5% 11.7% 12.1% 15.9% 15.5%Total New Zealand 16.0% 15.4% 15.4% 16.2% 15.9% 15.2% 16.2% 16.0% 17.3% 16.4%
56
A Stocktake of New Zealand’s Housing – February 2018
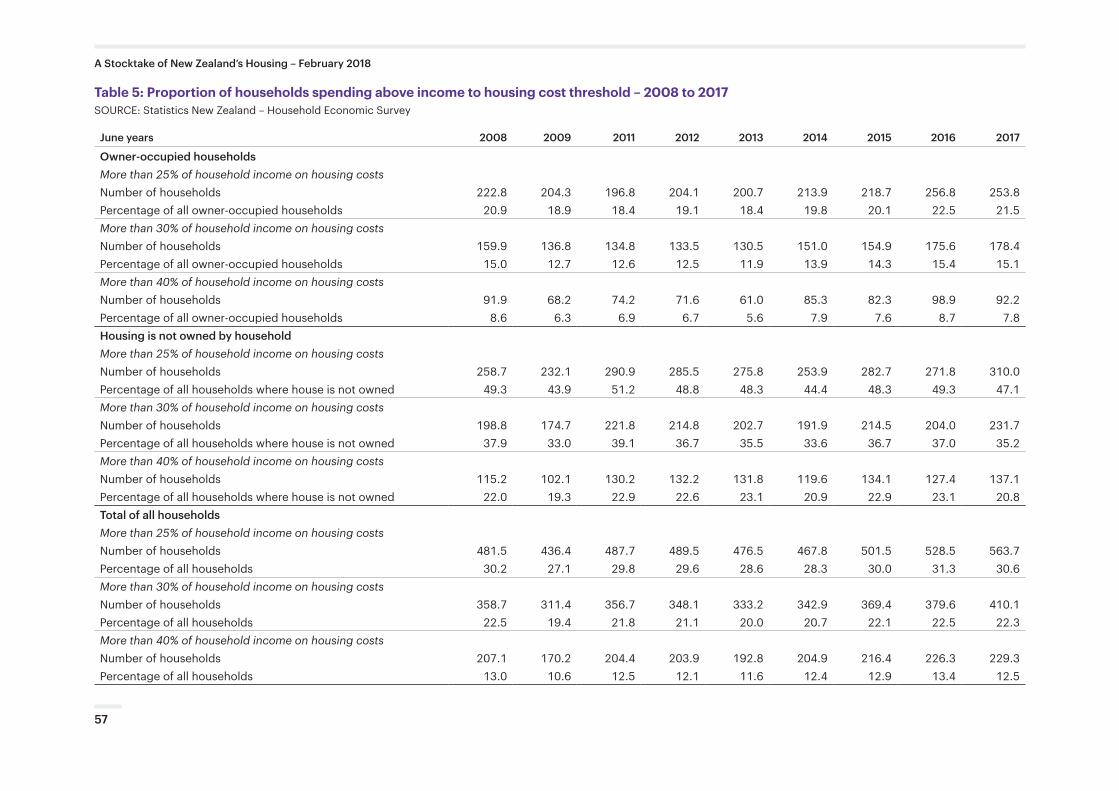
Table 5: Proportion of households spending above income to housing cost threshold – 2008 to 2017SOURCE: Statistics New Zealand – Household Economic Survey
June years 2008 2009 2011 2012 2013 2014 2015 2016 2017
Owner-occupied householdsMore than 25% of household income on housing costsNumber of households 222.8 204.3 196.8 204.1 200.7 213.9 218.7 256.8 253.8Percentage of all owner-occupied households 20.9 18.9 18.4 19.1 18.4 19.8 20.1 22.5 21.5More than 30% of household income on housing costsNumber of households 159.9 136.8 134.8 133.5 130.5 151.0 154.9 175.6 178.4Percentage of all owner-occupied households 15.0 12.7 12.6 12.5 11.9 13.9 14.3 15.4 15.1More than 40% of household income on housing costsNumber of households 91.9 68.2 74.2 71.6 61.0 85.3 82.3 98.9 92.2Percentage of all owner-occupied households 8.6 6.3 6.9 6.7 5.6 7.9 7.6 8.7 7.8Housing is not owned by householdMore than 25% of household income on housing costsNumber of households 258.7 232.1 290.9 285.5 275.8 253.9 282.7 271.8 310.0Percentage of all households where house is not owned 49.3 43.9 51.2 48.8 48.3 44.4 48.3 49.3 47.1More than 30% of household income on housing costsNumber of households 198.8 174.7 221.8 214.8 202.7 191.9 214.5 204.0 231.7Percentage of all households where house is not owned 37.9 33.0 39.1 36.7 35.5 33.6 36.7 37.0 35.2More than 40% of household income on housing costsNumber of households 115.2 102.1 130.2 132.2 131.8 119.6 134.1 127.4 137.1Percentage of all households where house is not owned 22.0 19.3 22.9 22.6 23.1 20.9 22.9 23.1 20.8Total of all householdsMore than 25% of household income on housing costsNumber of households 481.5 436.4 487.7 489.5 476.5 467.8 501.5 528.5 563.7Percentage of all households 30.2 27.1 29.8 29.6 28.6 28.3 30.0 31.3 30.6More than 30% of household income on housing costsNumber of households 358.7 311.4 356.7 348.1 333.2 342.9 369.4 379.6 410.1Percentage of all households 22.5 19.4 21.8 21.1 20.0 20.7 22.1 22.5 22.3More than 40% of household income on housing costsNumber of households 207.1 170.2 204.4 203.9 192.8 204.9 216.4 226.3 229.3Percentage of all households 13.0 10.6 12.5 12.1 11.6 12.4 12.9 13.4 12.5
57
A Stocktake of New Zealand’s Housing – February 2018
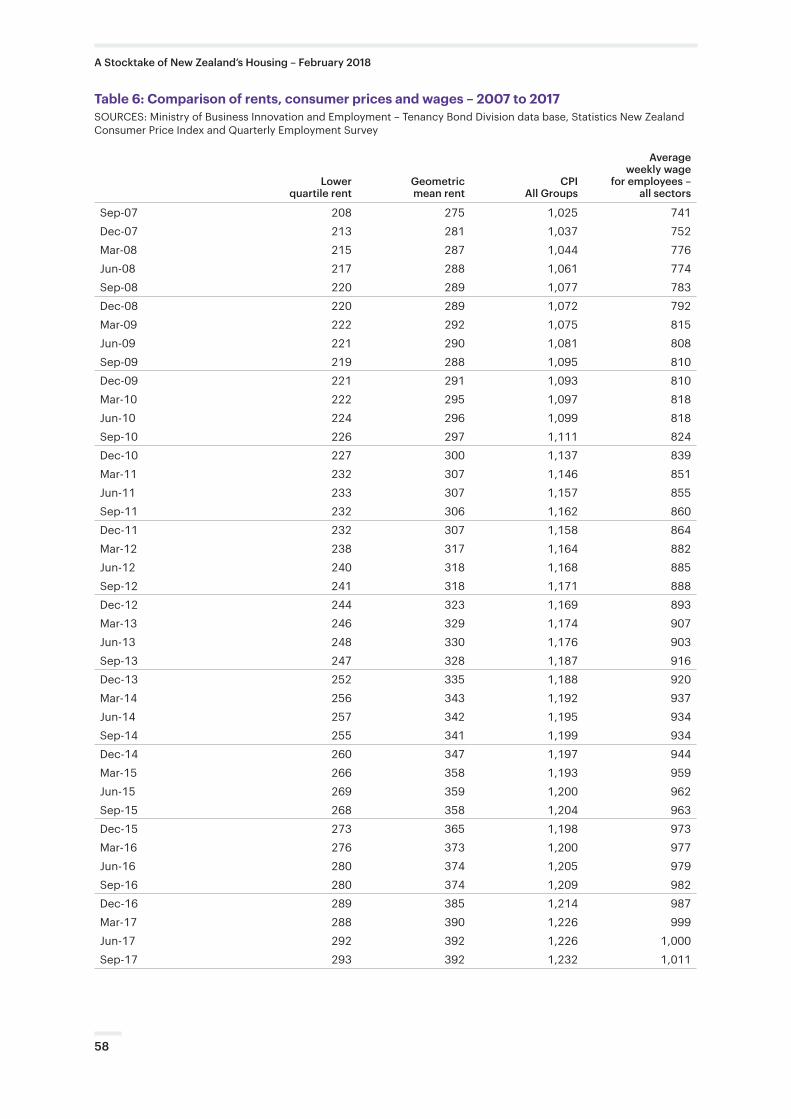
Table 6: Comparison of rents, consumer prices and wages – 2007 to 2017SOURCES: Ministry of Business Innovation and Employment – Tenancy Bond Division data base, Statistics New Zealand Consumer Price Index and Quarterly Employment Survey
Lower quartile rent
Geometric mean rent
CPI All Groups
Average weekly wage
for employees – all sectors
Sep-07 208 275 1,025 741Dec-07 213 281 1,037 752Mar-08 215 287 1,044 776Jun-08 217 288 1,061 774Sep-08 220 289 1,077 783Dec-08 220 289 1,072 792Mar-09 222 292 1,075 815Jun-09 221 290 1,081 808Sep-09 219 288 1,095 810Dec-09 221 291 1,093 810Mar-10 222 295 1,097 818Jun-10 224 296 1,099 818Sep-10 226 297 1,111 824Dec-10 227 300 1,137 839Mar-11 232 307 1,146 851Jun-11 233 307 1,157 855Sep-11 232 306 1,162 860Dec-11 232 307 1,158 864Mar-12 238 317 1,164 882Jun-12 240 318 1,168 885Sep-12 241 318 1,171 888Dec-12 244 323 1,169 893Mar-13 246 329 1,174 907Jun-13 248 330 1,176 903Sep-13 247 328 1,187 916Dec-13 252 335 1,188 920Mar-14 256 343 1,192 937Jun-14 257 342 1,195 934Sep-14 255 341 1,199 934Dec-14 260 347 1,197 944Mar-15 266 358 1,193 959Jun-15 269 359 1,200 962Sep-15 268 358 1,204 963Dec-15 273 365 1,198 973Mar-16 276 373 1,200 977Jun-16 280 374 1,205 979Sep-16 280 374 1,209 982Dec-16 289 385 1,214 987Mar-17 288 390 1,226 999Jun-17 292 392 1,226 1,000Sep-17 293 392 1,232 1,011
58
A Stocktake of New Zealand’s Housing – February 2018
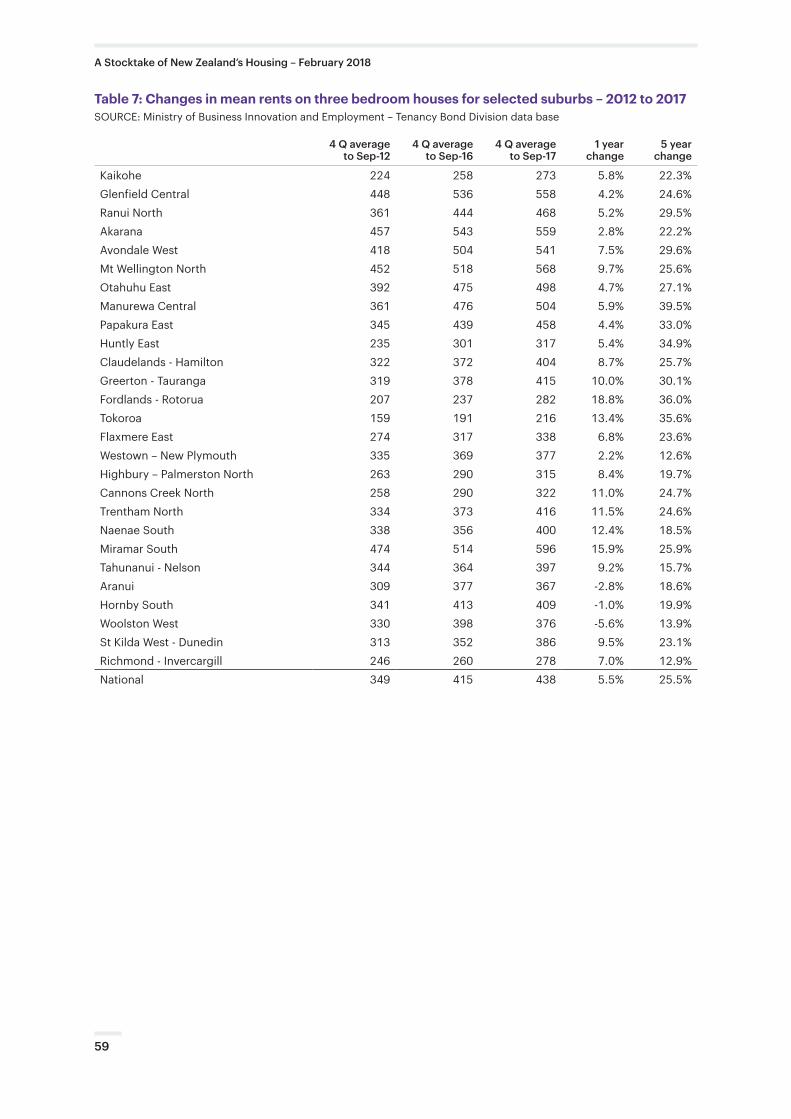
Table 7: Changes in mean rents on three bedroom houses for selected suburbs – 2012 to 2017SOURCE: Ministry of Business Innovation and Employment – Tenancy Bond Division data base
4 Q average to Sep-12
4 Q average to Sep-16
4 Q average to Sep-17
1 year change
5 year change
Kaikohe 224 258 273 5.8% 22.3%Glenfield Central 448 536 558 4.2% 24.6%Ranui North 361 444 468 5.2% 29.5%Akarana 457 543 559 2.8% 22.2%Avondale West 418 504 541 7.5% 29.6%Mt Wellington North 452 518 568 9.7% 25.6%Otahuhu East 392 475 498 4.7% 27.1%Manurewa Central 361 476 504 5.9% 39.5%Papakura East 345 439 458 4.4% 33.0%Huntly East 235 301 317 5.4% 34.9%Claudelands - Hamilton 322 372 404 8.7% 25.7%Greerton - Tauranga 319 378 415 10.0% 30.1%Fordlands - Rotorua 207 237 282 18.8% 36.0%Tokoroa 159 191 216 13.4% 35.6%Flaxmere East 274 317 338 6.8% 23.6%Westown – New Plymouth 335 369 377 2.2% 12.6%Highbury – Palmerston North 263 290 315 8.4% 19.7%Cannons Creek North 258 290 322 11.0% 24.7%Trentham North 334 373 416 11.5% 24.6%Naenae South 338 356 400 12.4% 18.5%Miramar South 474 514 596 15.9% 25.9%Tahunanui - Nelson 344 364 397 9.2% 15.7%Aranui 309 377 367 -2.8% 18.6%Hornby South 341 413 409 -1.0% 19.9%Woolston West 330 398 376 -5.6% 13.9%St Kilda West - Dunedin 313 352 386 9.5% 23.1%Richmond - Invercargill 246 260 278 7.0% 12.9%National 349 415 438 5.5% 25.5%
59
A Stocktake of New Zealand’s Housing – February 2018
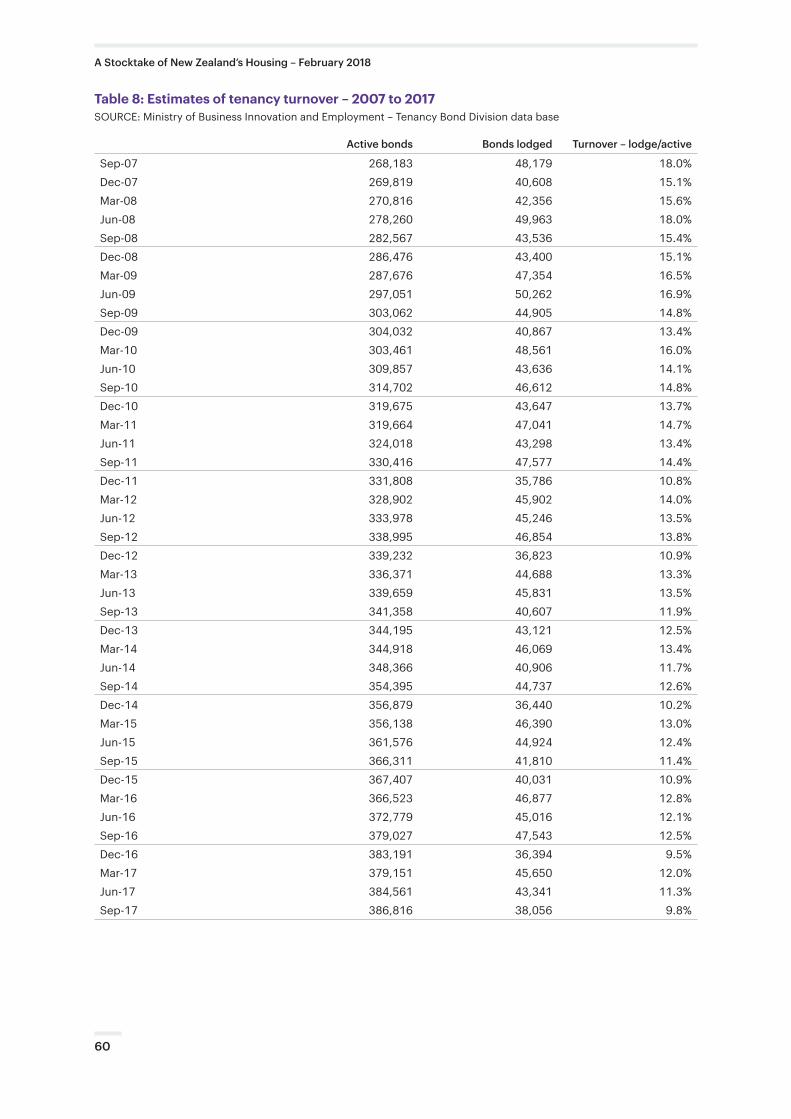
Table 8: Estimates of tenancy turnover – 2007 to 2017SOURCE: Ministry of Business Innovation and Employment – Tenancy Bond Division data base
Active bonds Bonds lodged Turnover – lodge/active
Sep-07 268,183 48,179 18.0%Dec-07 269,819 40,608 15.1%Mar-08 270,816 42,356 15.6%Jun-08 278,260 49,963 18.0%Sep-08 282,567 43,536 15.4%Dec-08 286,476 43,400 15.1%Mar-09 287,676 47,354 16.5%Jun-09 297,051 50,262 16.9%Sep-09 303,062 44,905 14.8%Dec-09 304,032 40,867 13.4%Mar-10 303,461 48,561 16.0%Jun-10 309,857 43,636 14.1%Sep-10 314,702 46,612 14.8%Dec-10 319,675 43,647 13.7%Mar-11 319,664 47,041 14.7%Jun-11 324,018 43,298 13.4%Sep-11 330,416 47,577 14.4%Dec-11 331,808 35,786 10.8%Mar-12 328,902 45,902 14.0%Jun-12 333,978 45,246 13.5%Sep-12 338,995 46,854 13.8%Dec-12 339,232 36,823 10.9%Mar-13 336,371 44,688 13.3%Jun-13 339,659 45,831 13.5%Sep-13 341,358 40,607 11.9%Dec-13 344,195 43,121 12.5%Mar-14 344,918 46,069 13.4%Jun-14 348,366 40,906 11.7%Sep-14 354,395 44,737 12.6%Dec-14 356,879 36,440 10.2%Mar-15 356,138 46,390 13.0%Jun-15 361,576 44,924 12.4%Sep-15 366,311 41,810 11.4%Dec-15 367,407 40,031 10.9%Mar-16 366,523 46,877 12.8%Jun-16 372,779 45,016 12.1%Sep-16 379,027 47,543 12.5%Dec-16 383,191 36,394 9.5%Mar-17 379,151 45,650 12.0%Jun-17 384,561 43,341 11.3%Sep-17 386,816 38,056 9.8%
60
A Stocktake of New Zealand’s Housing – February 2018
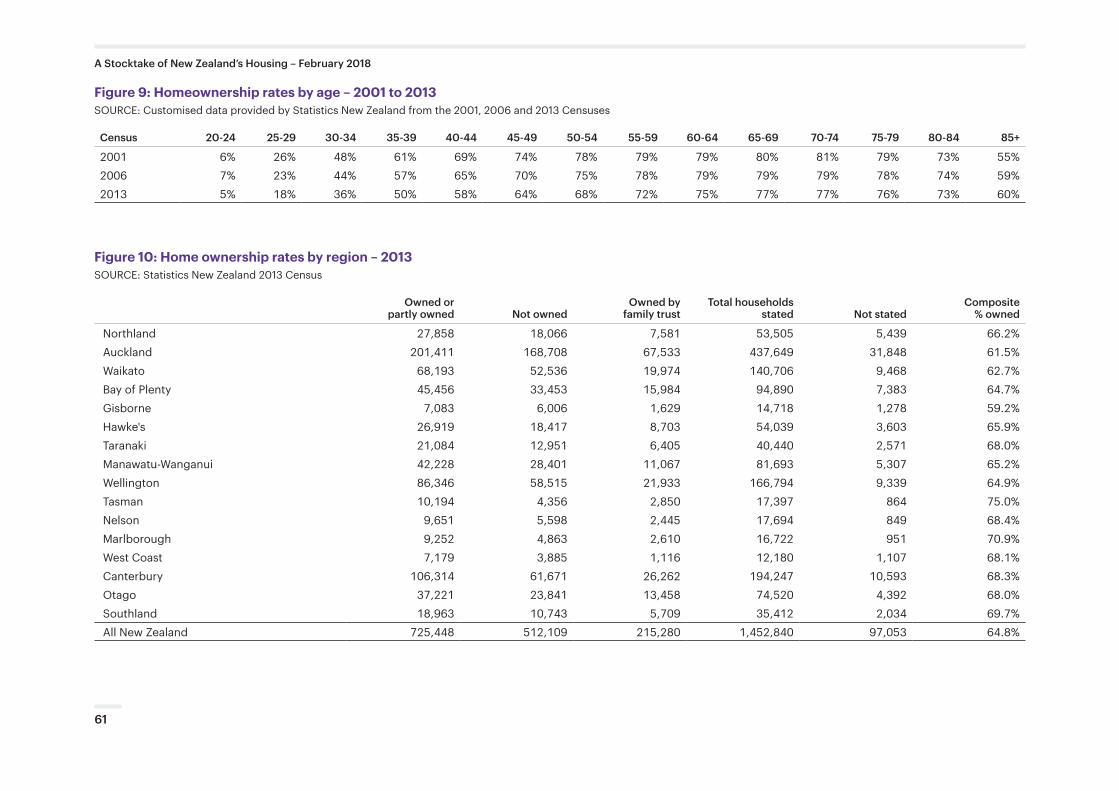
Figure 9: Homeownership rates by age – 2001 to 2013SOURCE: Customised data provided by Statistics New Zealand from the 2001, 2006 and 2013 Censuses
Census 20-24 25-29 30-34 35-39 40-44 45-49 50-54 55-59 60-64 65-69 70-74 75-79 80-84 85+
2001 6% 26% 48% 61% 69% 74% 78% 79% 79% 80% 81% 79% 73% 55%2006 7% 23% 44% 57% 65% 70% 75% 78% 79% 79% 79% 78% 74% 59%2013 5% 18% 36% 50% 58% 64% 68% 72% 75% 77% 77% 76% 73% 60%
Figure 10: Home ownership rates by region – 2013SOURCE: Statistics New Zealand 2013 Census
Owned or partly owned Not owned
Owned by family trust
Total households stated Not stated
Composite % owned
Northland 27,858 18,066 7,581 53,505 5,439 66.2% Auckland 201,411 168,708 67,533 437,649 31,848 61.5% Waikato 68,193 52,536 19,974 140,706 9,468 62.7% Bay of Plenty 45,456 33,453 15,984 94,890 7,383 64.7% Gisborne 7,083 6,006 1,629 14,718 1,278 59.2% Hawke's 26,919 18,417 8,703 54,039 3,603 65.9% Taranaki 21,084 12,951 6,405 40,440 2,571 68.0% Manawatu-Wanganui 42,228 28,401 11,067 81,693 5,307 65.2% Wellington 86,346 58,515 21,933 166,794 9,339 64.9% Tasman 10,194 4,356 2,850 17,397 864 75.0% Nelson 9,651 5,598 2,445 17,694 849 68.4% Marlborough 9,252 4,863 2,610 16,722 951 70.9% West Coast 7,179 3,885 1,116 12,180 1,107 68.1% Canterbury 106,314 61,671 26,262 194,247 10,593 68.3% Otago 37,221 23,841 13,458 74,520 4,392 68.0% Southland 18,963 10,743 5,709 35,412 2,034 69.7% All New Zealand 725,448 512,109 215,280 1,452,840 97,053 64.8%
61
A Stocktake of New Zealand’s Housing – February 2018
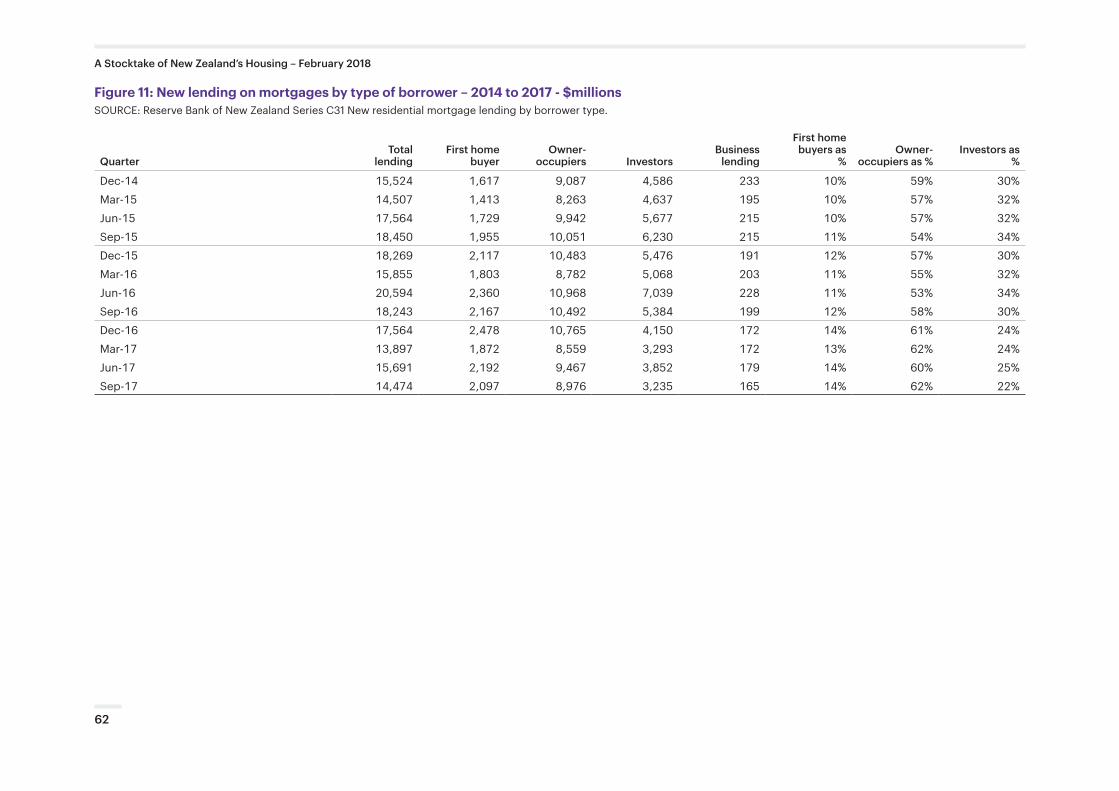
Figure 11: New lending on mortgages by type of borrower – 2014 to 2017 - $millionsSOURCE: Reserve Bank of New Zealand Series C31 New residential mortgage lending by borrower type.
QuarterTotal
lendingFirst home
buyerOwner-
occupiers InvestorsBusiness
lending
First home buyers as
%Owner-
occupiers as % Investors as
%
Dec-14 15,524 1,617 9,087 4,586 233 10% 59% 30%Mar-15 14,507 1,413 8,263 4,637 195 10% 57% 32%Jun-15 17,564 1,729 9,942 5,677 215 10% 57% 32%Sep-15 18,450 1,955 10,051 6,230 215 11% 54% 34%Dec-15 18,269 2,117 10,483 5,476 191 12% 57% 30%Mar-16 15,855 1,803 8,782 5,068 203 11% 55% 32%Jun-16 20,594 2,360 10,968 7,039 228 11% 53% 34%Sep-16 18,243 2,167 10,492 5,384 199 12% 58% 30%Dec-16 17,564 2,478 10,765 4,150 172 14% 61% 24%Mar-17 13,897 1,872 8,559 3,293 172 13% 62% 24%Jun-17 15,691 2,192 9,467 3,852 179 14% 60% 25%Sep-17 14,474 2,097 8,976 3,235 165 14% 62% 22%
62
A Stocktake of New Zealand’s Housing – February 2018
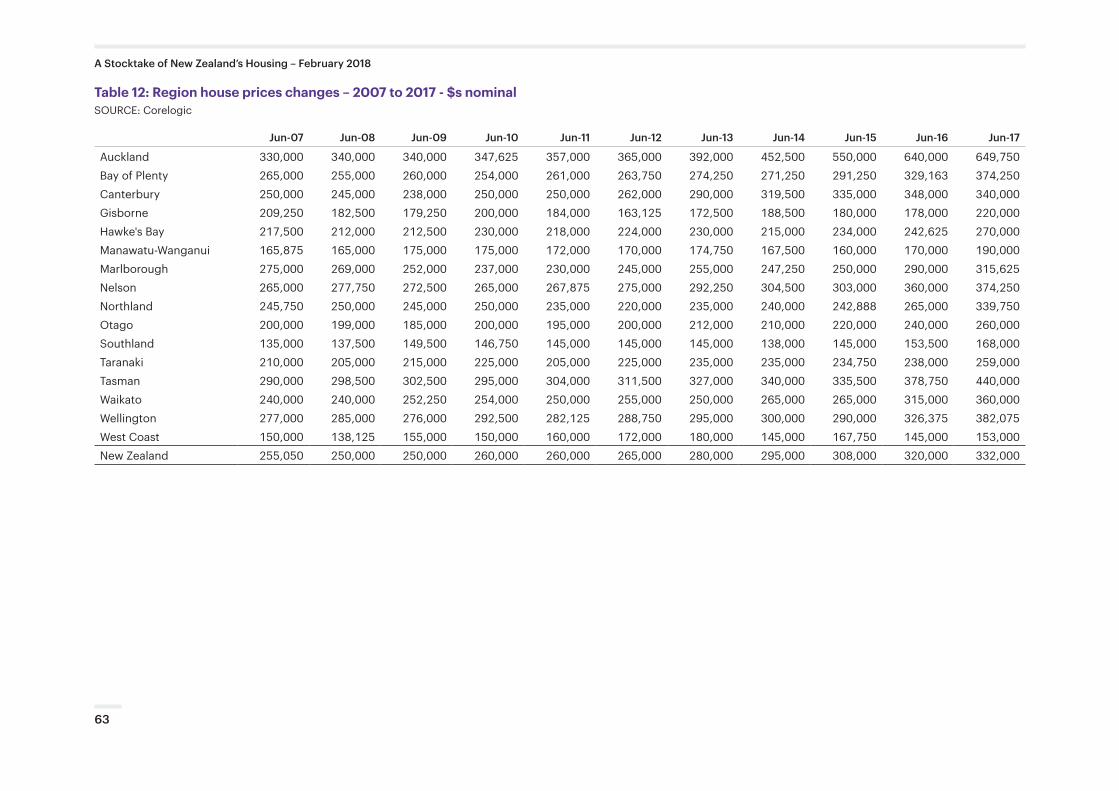
Table 12: Region house prices changes – 2007 to 2017 - $s nominalSOURCE: Corelogic
Jun-07 Jun-08 Jun-09 Jun-10 Jun-11 Jun-12 Jun-13 Jun-14 Jun-15 Jun-16 Jun-17
Auckland 330,000 340,000 340,000 347,625 357,000 365,000 392,000 452,500 550,000 640,000 649,750Bay of Plenty 265,000 255,000 260,000 254,000 261,000 263,750 274,250 271,250 291,250 329,163 374,250Canterbury 250,000 245,000 238,000 250,000 250,000 262,000 290,000 319,500 335,000 348,000 340,000Gisborne 209,250 182,500 179,250 200,000 184,000 163,125 172,500 188,500 180,000 178,000 220,000Hawke's Bay 217,500 212,000 212,500 230,000 218,000 224,000 230,000 215,000 234,000 242,625 270,000Manawatu-Wanganui 165,875 165,000 175,000 175,000 172,000 170,000 174,750 167,500 160,000 170,000 190,000Marlborough 275,000 269,000 252,000 237,000 230,000 245,000 255,000 247,250 250,000 290,000 315,625Nelson 265,000 277,750 272,500 265,000 267,875 275,000 292,250 304,500 303,000 360,000 374,250Northland 245,750 250,000 245,000 250,000 235,000 220,000 235,000 240,000 242,888 265,000 339,750Otago 200,000 199,000 185,000 200,000 195,000 200,000 212,000 210,000 220,000 240,000 260,000Southland 135,000 137,500 149,500 146,750 145,000 145,000 145,000 138,000 145,000 153,500 168,000Taranaki 210,000 205,000 215,000 225,000 205,000 225,000 235,000 235,000 234,750 238,000 259,000Tasman 290,000 298,500 302,500 295,000 304,000 311,500 327,000 340,000 335,500 378,750 440,000Waikato 240,000 240,000 252,250 254,000 250,000 255,000 250,000 265,000 265,000 315,000 360,000Wellington 277,000 285,000 276,000 292,500 282,125 288,750 295,000 300,000 290,000 326,375 382,075West Coast 150,000 138,125 155,000 150,000 160,000 172,000 180,000 145,000 167,750 145,000 153,000New Zealand 255,050 250,000 250,000 260,000 260,000 265,000 280,000 295,000 308,000 320,000 332,000
63
A Stocktake of New Zealand’s Housing – February 2018
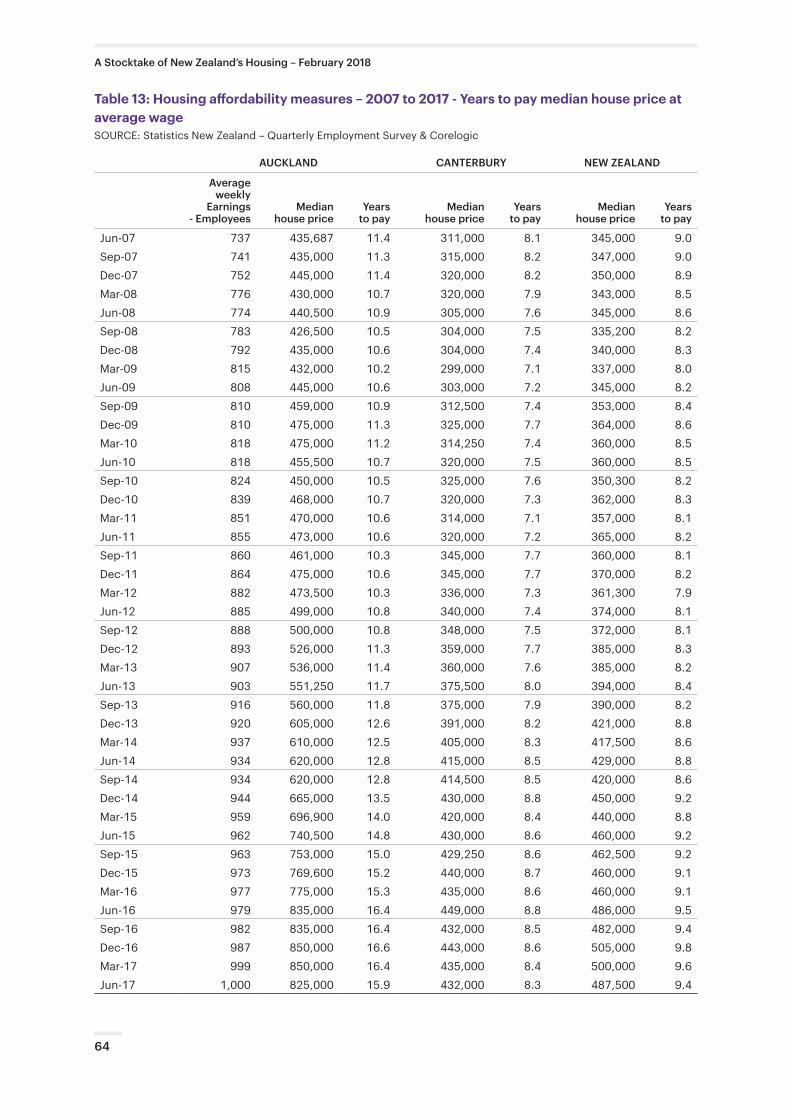
Table 13: Housing affordability measures – 2007 to 2017 - Years to pay median house price at average wageSOURCE: Statistics New Zealand – Quarterly Employment Survey & Corelogic
AUCKLAND CANTERBURY NEW ZEALAND
Average weekly
Earnings - Employees
Median house price
Years to pay
Median house price
Years to pay
Median house price
Years to pay
Jun-07 737 435,687 11.4 311,000 8.1 345,000 9.0Sep-07 741 435,000 11.3 315,000 8.2 347,000 9.0Dec-07 752 445,000 11.4 320,000 8.2 350,000 8.9Mar-08 776 430,000 10.7 320,000 7.9 343,000 8.5Jun-08 774 440,500 10.9 305,000 7.6 345,000 8.6Sep-08 783 426,500 10.5 304,000 7.5 335,200 8.2Dec-08 792 435,000 10.6 304,000 7.4 340,000 8.3Mar-09 815 432,000 10.2 299,000 7.1 337,000 8.0Jun-09 808 445,000 10.6 303,000 7.2 345,000 8.2Sep-09 810 459,000 10.9 312,500 7.4 353,000 8.4Dec-09 810 475,000 11.3 325,000 7.7 364,000 8.6Mar-10 818 475,000 11.2 314,250 7.4 360,000 8.5Jun-10 818 455,500 10.7 320,000 7.5 360,000 8.5Sep-10 824 450,000 10.5 325,000 7.6 350,300 8.2Dec-10 839 468,000 10.7 320,000 7.3 362,000 8.3Mar-11 851 470,000 10.6 314,000 7.1 357,000 8.1Jun-11 855 473,000 10.6 320,000 7.2 365,000 8.2Sep-11 860 461,000 10.3 345,000 7.7 360,000 8.1Dec-11 864 475,000 10.6 345,000 7.7 370,000 8.2Mar-12 882 473,500 10.3 336,000 7.3 361,300 7.9Jun-12 885 499,000 10.8 340,000 7.4 374,000 8.1Sep-12 888 500,000 10.8 348,000 7.5 372,000 8.1Dec-12 893 526,000 11.3 359,000 7.7 385,000 8.3Mar-13 907 536,000 11.4 360,000 7.6 385,000 8.2Jun-13 903 551,250 11.7 375,500 8.0 394,000 8.4Sep-13 916 560,000 11.8 375,000 7.9 390,000 8.2Dec-13 920 605,000 12.6 391,000 8.2 421,000 8.8Mar-14 937 610,000 12.5 405,000 8.3 417,500 8.6Jun-14 934 620,000 12.8 415,000 8.5 429,000 8.8Sep-14 934 620,000 12.8 414,500 8.5 420,000 8.6Dec-14 944 665,000 13.5 430,000 8.8 450,000 9.2Mar-15 959 696,900 14.0 420,000 8.4 440,000 8.8Jun-15 962 740,500 14.8 430,000 8.6 460,000 9.2Sep-15 963 753,000 15.0 429,250 8.6 462,500 9.2Dec-15 973 769,600 15.2 440,000 8.7 460,000 9.1Mar-16 977 775,000 15.3 435,000 8.6 460,000 9.1Jun-16 979 835,000 16.4 449,000 8.8 486,000 9.5Sep-16 982 835,000 16.4 432,000 8.5 482,000 9.4Dec-16 987 850,000 16.6 443,000 8.6 505,000 9.8Mar-17 999 850,000 16.4 435,000 8.4 500,000 9.6Jun-17 1,000 825,000 15.9 432,000 8.3 487,500 9.4
64
A Stocktake of New Zealand’s Housing – February 2018
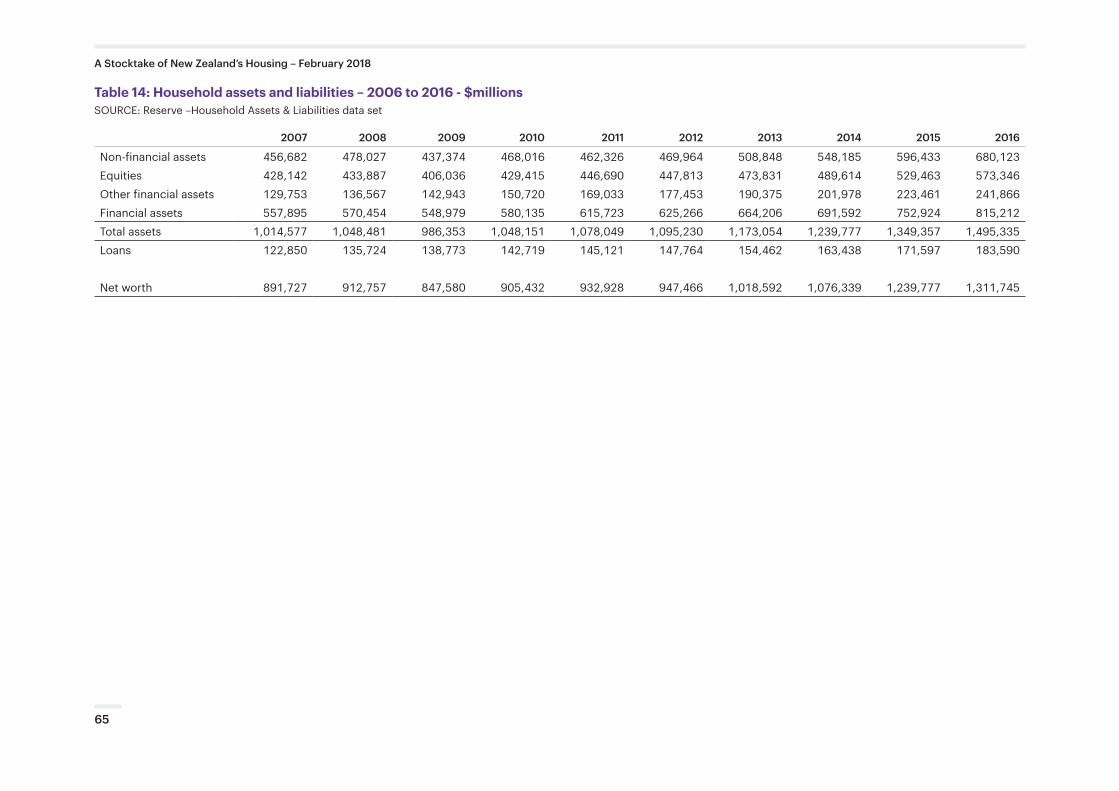
Table 14: Household assets and liabilities – 2006 to 2016 - $millionsSOURCE: Reserve –Household Assets & Liabilities data set
2007 2008 2009 2010 2011 2012 2013 2014 2015 2016
Non-financial assets 456,682 478,027 437,374 468,016 462,326 469,964 508,848 548,185 596,433 680,123Equities 428,142 433,887 406,036 429,415 446,690 447,813 473,831 489,614 529,463 573,346Other financial assets 129,753 136,567 142,943 150,720 169,033 177,453 190,375 201,978 223,461 241,866Financial assets 557,895 570,454 548,979 580,135 615,723 625,266 664,206 691,592 752,924 815,212Total assets 1,014,577 1,048,481 986,353 1,048,151 1,078,049 1,095,230 1,173,054 1,239,777 1,349,357 1,495,335Loans 122,850 135,724 138,773 142,719 145,121 147,764 154,462 163,438 171,597 183,590
Net worth 891,727 912,757 847,580 905,432 932,928 947,466 1,018,592 1,076,339 1,239,777 1,311,745
65
A Stocktake of New Zealand’s Housing – February 2018
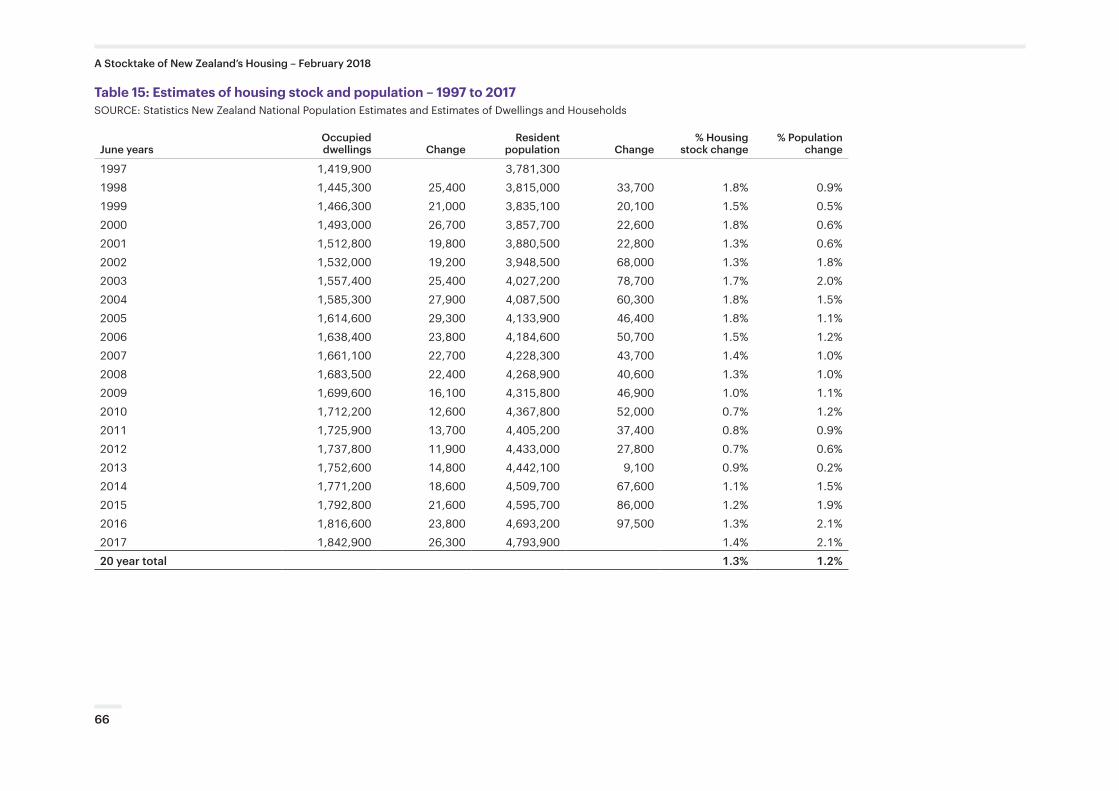
Table 15: Estimates of housing stock and population – 1997 to 2017SOURCE: Statistics New Zealand National Population Estimates and Estimates of Dwellings and Households
June yearsOccupied dwellings Change
Resident population Change
% Housing stock change
% Population change
1997 1,419,900 3,781,3001998 1,445,300 25,400 3,815,000 33,700 1.8% 0.9%1999 1,466,300 21,000 3,835,100 20,100 1.5% 0.5%2000 1,493,000 26,700 3,857,700 22,600 1.8% 0.6%2001 1,512,800 19,800 3,880,500 22,800 1.3% 0.6%2002 1,532,000 19,200 3,948,500 68,000 1.3% 1.8%2003 1,557,400 25,400 4,027,200 78,700 1.7% 2.0%2004 1,585,300 27,900 4,087,500 60,300 1.8% 1.5%2005 1,614,600 29,300 4,133,900 46,400 1.8% 1.1%2006 1,638,400 23,800 4,184,600 50,700 1.5% 1.2%2007 1,661,100 22,700 4,228,300 43,700 1.4% 1.0%2008 1,683,500 22,400 4,268,900 40,600 1.3% 1.0%2009 1,699,600 16,100 4,315,800 46,900 1.0% 1.1%2010 1,712,200 12,600 4,367,800 52,000 0.7% 1.2%2011 1,725,900 13,700 4,405,200 37,400 0.8% 0.9%2012 1,737,800 11,900 4,433,000 27,800 0.7% 0.6%2013 1,752,600 14,800 4,442,100 9,100 0.9% 0.2%2014 1,771,200 18,600 4,509,700 67,600 1.1% 1.5%2015 1,792,800 21,600 4,595,700 86,000 1.2% 1.9%2016 1,816,600 23,800 4,693,200 97,500 1.3% 2.1%2017 1,842,900 26,300 4,793,900 1.4% 2.1%20 year total 1.3% 1.2%
66
A Stocktake of New Zealand’s Housing – February 2018
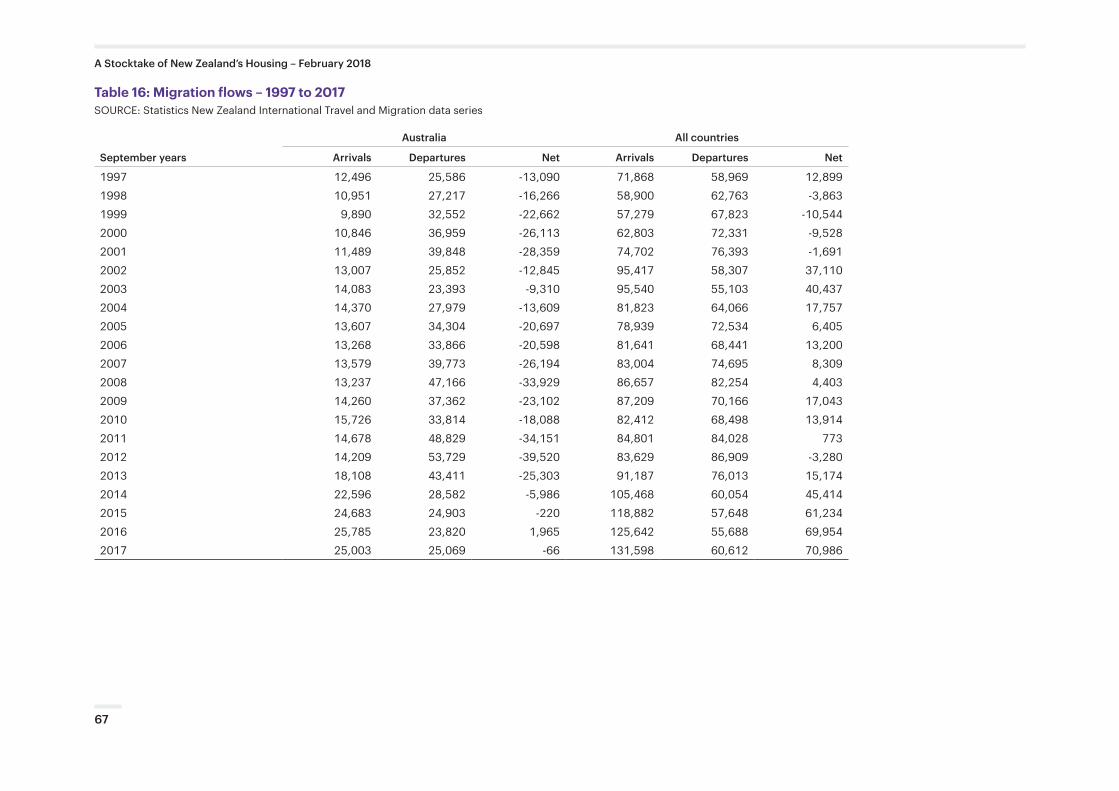
Table 16: Migration flows – 1997 to 2017SOURCE: Statistics New Zealand International Travel and Migration data series
September years
Australia All countries
Arrivals Departures Net Arrivals Departures Net
1997 12,496 25,586 -13,090 71,868 58,969 12,8991998 10,951 27,217 -16,266 58,900 62,763 -3,8631999 9,890 32,552 -22,662 57,279 67,823 -10,5442000 10,846 36,959 -26,113 62,803 72,331 -9,5282001 11,489 39,848 -28,359 74,702 76,393 -1,6912002 13,007 25,852 -12,845 95,417 58,307 37,1102003 14,083 23,393 -9,310 95,540 55,103 40,4372004 14,370 27,979 -13,609 81,823 64,066 17,7572005 13,607 34,304 -20,697 78,939 72,534 6,4052006 13,268 33,866 -20,598 81,641 68,441 13,2002007 13,579 39,773 -26,194 83,004 74,695 8,3092008 13,237 47,166 -33,929 86,657 82,254 4,4032009 14,260 37,362 -23,102 87,209 70,166 17,0432010 15,726 33,814 -18,088 82,412 68,498 13,9142011 14,678 48,829 -34,151 84,801 84,028 7732012 14,209 53,729 -39,520 83,629 86,909 -3,2802013 18,108 43,411 -25,303 91,187 76,013 15,1742014 22,596 28,582 -5,986 105,468 60,054 45,4142015 24,683 24,903 -220 118,882 57,648 61,2342016 25,785 23,820 1,965 125,642 55,688 69,9542017 25,003 25,069 -66 131,598 60,612 70,986
67
A Stocktake of New Zealand’s Housing – February 2018
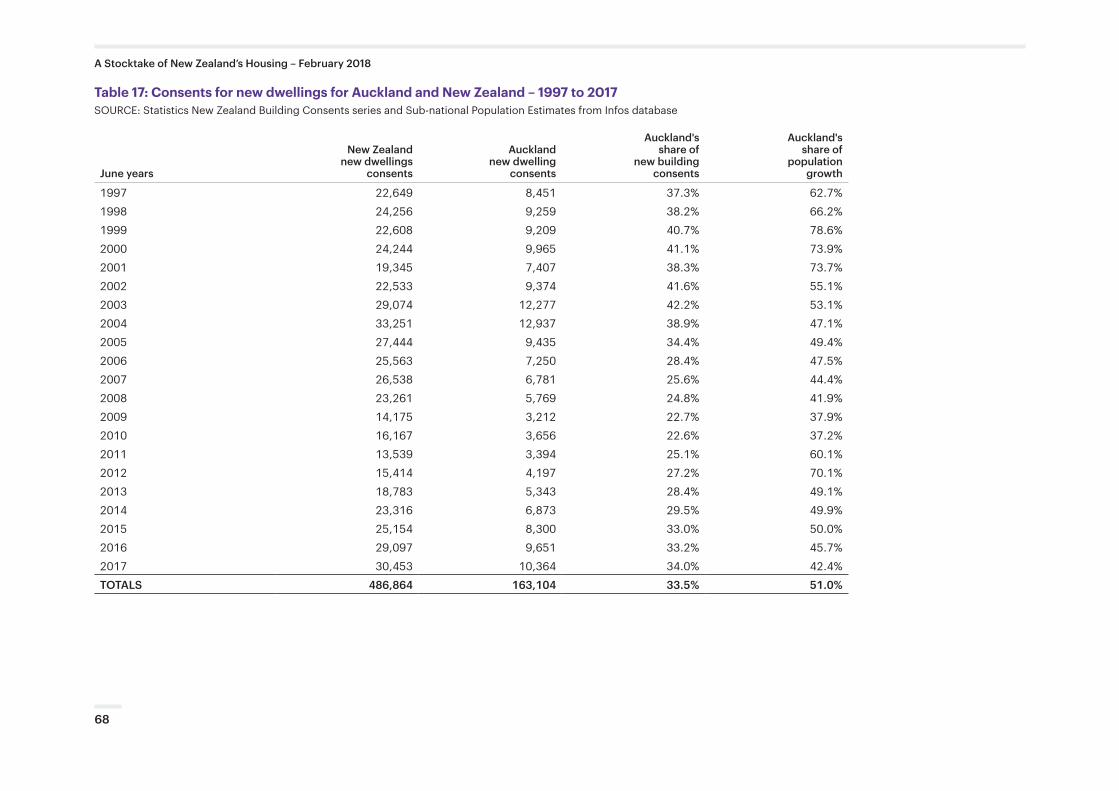
Table 17: Consents for new dwellings for Auckland and New Zealand – 1997 to 2017SOURCE: Statistics New Zealand Building Consents series and Sub-national Population Estimates from Infos database
June years
New Zealand new dwellings
consents
Auckland new dwelling
consents
Auckland's share of
new building consents
Auckland's share of
population growth
1997 22,649 8,451 37.3% 62.7%1998 24,256 9,259 38.2% 66.2%1999 22,608 9,209 40.7% 78.6%2000 24,244 9,965 41.1% 73.9%2001 19,345 7,407 38.3% 73.7%2002 22,533 9,374 41.6% 55.1%2003 29,074 12,277 42.2% 53.1%2004 33,251 12,937 38.9% 47.1%2005 27,444 9,435 34.4% 49.4%2006 25,563 7,250 28.4% 47.5%2007 26,538 6,781 25.6% 44.4%2008 23,261 5,769 24.8% 41.9%2009 14,175 3,212 22.7% 37.9%2010 16,167 3,656 22.6% 37.2%2011 13,539 3,394 25.1% 60.1%2012 15,414 4,197 27.2% 70.1%2013 18,783 5,343 28.4% 49.1%2014 23,316 6,873 29.5% 49.9%2015 25,154 8,300 33.0% 50.0%2016 29,097 9,651 33.2% 45.7%2017 30,453 10,364 34.0% 42.4%TOTALS 486,864 163,104 33.5% 51.0%
68
A Stocktake of New Zealand’s Housing – February 2018
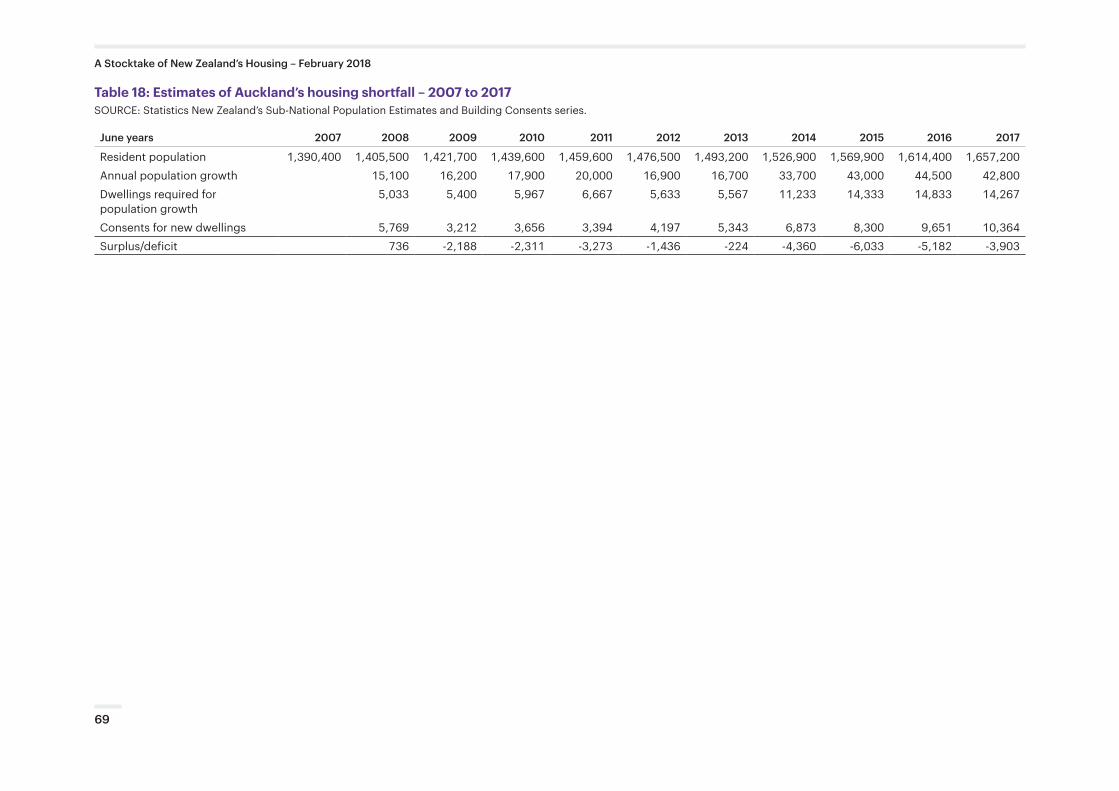
Table 18: Estimates of Auckland’s housing shortfall – 2007 to 2017SOURCE: Statistics New Zealand’s Sub-National Population Estimates and Building Consents series.
June years 2007 2008 2009 2010 2011 2012 2013 2014 2015 2016 2017
Resident population 1,390,400 1,405,500 1,421,700 1,439,600 1,459,600 1,476,500 1,493,200 1,526,900 1,569,900 1,614,400 1,657,200 Annual population growth 15,100 16,200 17,900 20,000 16,900 16,700 33,700 43,000 44,500 42,800Dwellings required for population growth
5,033 5,400 5,967 6,667 5,633 5,567 11,233 14,333 14,833 14,267
Consents for new dwellings 5,769 3,212 3,656 3,394 4,197 5,343 6,873 8,300 9,651 10,364Surplus/deficit 736 -2,188 -2,311 -3,273 -1,436 -224 -4,360 -6,033 -5,182 -3,903
69
A Stocktake of New Zealand’s Housing – February 2018
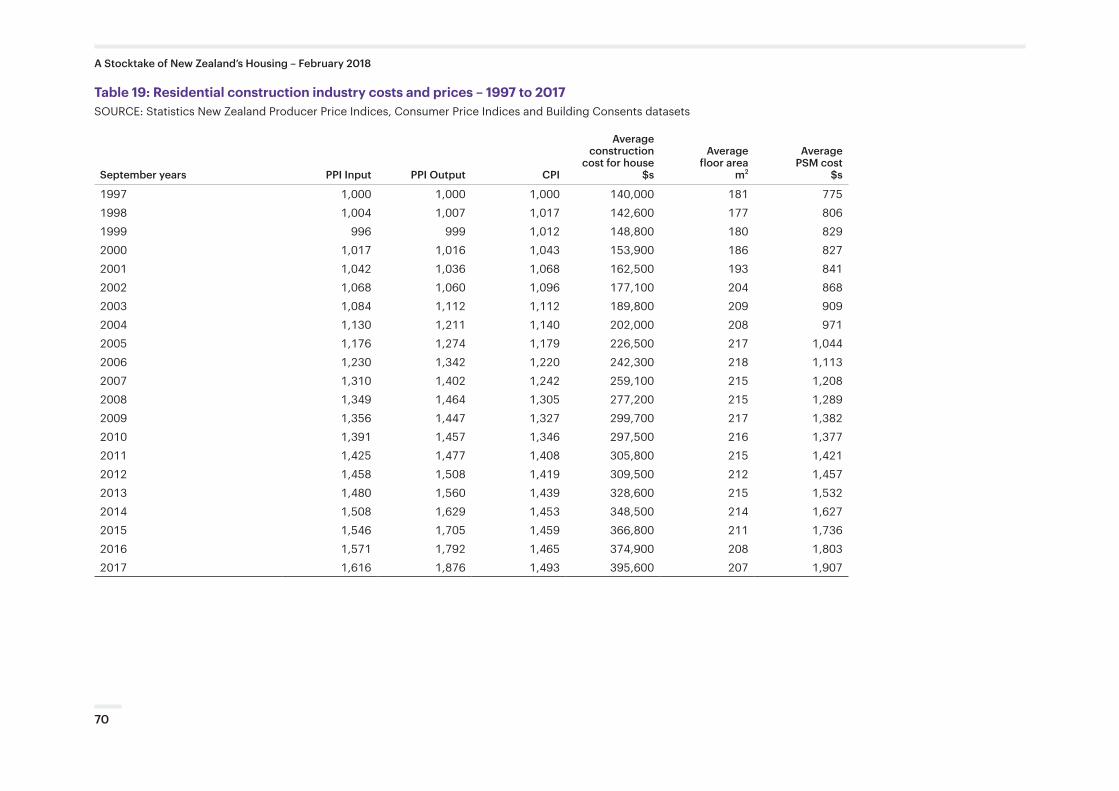
Table 19: Residential construction industry costs and prices – 1997 to 2017SOURCE: Statistics New Zealand Producer Price Indices, Consumer Price Indices and Building Consents datasets
September years PPI Input PPI Output CPI
Average construction
cost for house $s
Average floor area
m2
Average PSM cost
$s
1997 1,000 1,000 1,000 140,000 181 7751998 1,004 1,007 1,017 142,600 177 8061999 996 999 1,012 148,800 180 8292000 1,017 1,016 1,043 153,900 186 8272001 1,042 1,036 1,068 162,500 193 8412002 1,068 1,060 1,096 177,100 204 8682003 1,084 1,112 1,112 189,800 209 9092004 1,130 1,211 1,140 202,000 208 9712005 1,176 1,274 1,179 226,500 217 1,0442006 1,230 1,342 1,220 242,300 218 1,1132007 1,310 1,402 1,242 259,100 215 1,2082008 1,349 1,464 1,305 277,200 215 1,2892009 1,356 1,447 1,327 299,700 217 1,3822010 1,391 1,457 1,346 297,500 216 1,3772011 1,425 1,477 1,408 305,800 215 1,4212012 1,458 1,508 1,419 309,500 212 1,4572013 1,480 1,560 1,439 328,600 215 1,5322014 1,508 1,629 1,453 348,500 214 1,6272015 1,546 1,705 1,459 366,800 211 1,7362016 1,571 1,792 1,465 374,900 208 1,8032017 1,616 1,876 1,493 395,600 207 1,907
70
A Stocktake of New Zealand’s Housing – February 2018
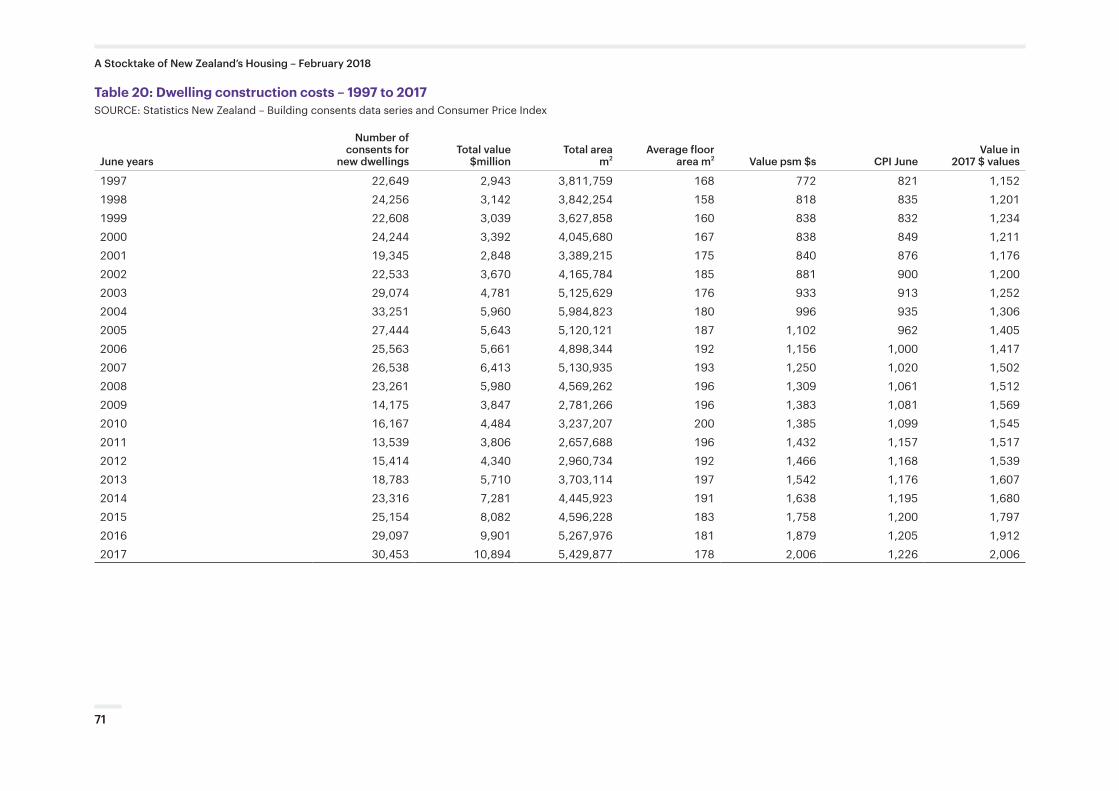
Table 20: Dwelling construction costs – 1997 to 2017SOURCE: Statistics New Zealand – Building consents data series and Consumer Price Index
June years
Number of consents for
new dwellingsTotal value
$millionTotal area
m2Average floor
area m2 Value psm $s CPI JuneValue in
2017 $ values
1997 22,649 2,943 3,811,759 168 772 821 1,1521998 24,256 3,142 3,842,254 158 818 835 1,2011999 22,608 3,039 3,627,858 160 838 832 1,2342000 24,244 3,392 4,045,680 167 838 849 1,2112001 19,345 2,848 3,389,215 175 840 876 1,1762002 22,533 3,670 4,165,784 185 881 900 1,2002003 29,074 4,781 5,125,629 176 933 913 1,2522004 33,251 5,960 5,984,823 180 996 935 1,3062005 27,444 5,643 5,120,121 187 1,102 962 1,4052006 25,563 5,661 4,898,344 192 1,156 1,000 1,4172007 26,538 6,413 5,130,935 193 1,250 1,020 1,5022008 23,261 5,980 4,569,262 196 1,309 1,061 1,5122009 14,175 3,847 2,781,266 196 1,383 1,081 1,5692010 16,167 4,484 3,237,207 200 1,385 1,099 1,5452011 13,539 3,806 2,657,688 196 1,432 1,157 1,5172012 15,414 4,340 2,960,734 192 1,466 1,168 1,5392013 18,783 5,710 3,703,114 197 1,542 1,176 1,6072014 23,316 7,281 4,445,923 191 1,638 1,195 1,6802015 25,154 8,082 4,596,228 183 1,758 1,200 1,7972016 29,097 9,901 5,267,976 181 1,879 1,205 1,9122017 30,453 10,894 5,429,877 178 2,006 1,226 2,006
71
A Stocktake of New Zealand’s Housing – February 2018
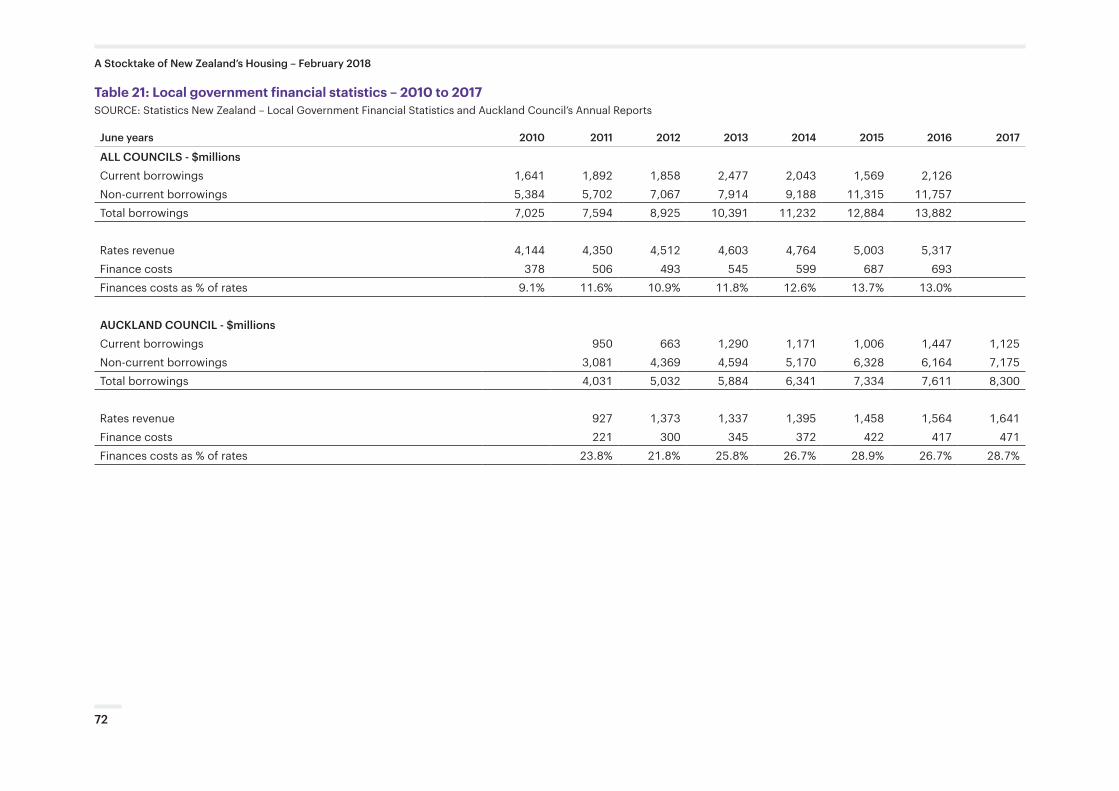
Table 21: Local government financial statistics – 2010 to 2017SOURCE: Statistics New Zealand – Local Government Financial Statistics and Auckland Council’s Annual Reports
June years 2010 2011 2012 2013 2014 2015 2016 2017
ALL COUNCILS - $millionsCurrent borrowings 1,641 1,892 1,858 2,477 2,043 1,569 2,126Non-current borrowings 5,384 5,702 7,067 7,914 9,188 11,315 11,757Total borrowings 7,025 7,594 8,925 10,391 11,232 12,884 13,882
Rates revenue 4,144 4,350 4,512 4,603 4,764 5,003 5,317Finance costs 378 506 493 545 599 687 693Finances costs as % of rates 9.1% 11.6% 10.9% 11.8% 12.6% 13.7% 13.0%
AUCKLAND COUNCIL - $millionsCurrent borrowings 950 663 1,290 1,171 1,006 1,447 1,125Non-current borrowings 3,081 4,369 4,594 5,170 6,328 6,164 7,175Total borrowings 4,031 5,032 5,884 6,341 7,334 7,611 8,300
Rates revenue 927 1,373 1,337 1,395 1,458 1,564 1,641Finance costs 221 300 345 372 422 417 471Finances costs as % of rates 23.8% 21.8% 25.8% 26.7% 28.9% 26.7% 28.7%
72
A Stocktake of New Zealand’s Housing – February 2018
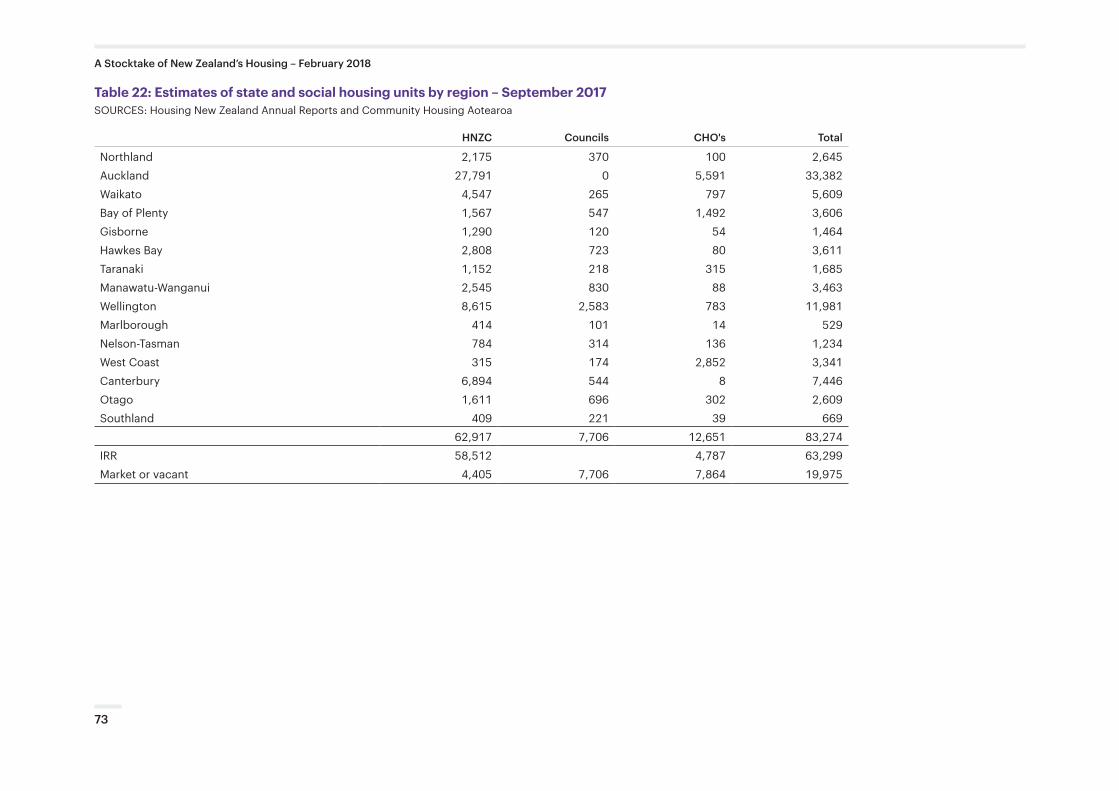
Table 22: Estimates of state and social housing units by region – September 2017SOURCES: Housing New Zealand Annual Reports and Community Housing Aotearoa
HNZC Councils CHO's Total
Northland 2,175 370 100 2,645Auckland 27,791 0 5,591 33,382Waikato 4,547 265 797 5,609Bay of Plenty 1,567 547 1,492 3,606Gisborne 1,290 120 54 1,464Hawkes Bay 2,808 723 80 3,611Taranaki 1,152 218 315 1,685Manawatu-Wanganui 2,545 830 88 3,463Wellington 8,615 2,583 783 11,981Marlborough 414 101 14 529Nelson-Tasman 784 314 136 1,234West Coast 315 174 2,852 3,341Canterbury 6,894 544 8 7,446Otago 1,611 696 302 2,609Southland 409 221 39 669
62,917 7,706 12,651 83,274IRR 58,512 4,787 63,299Market or vacant 4,405 7,706 7,864 19,975
73
A Stocktake of New Zealand’s Housing – February 2018
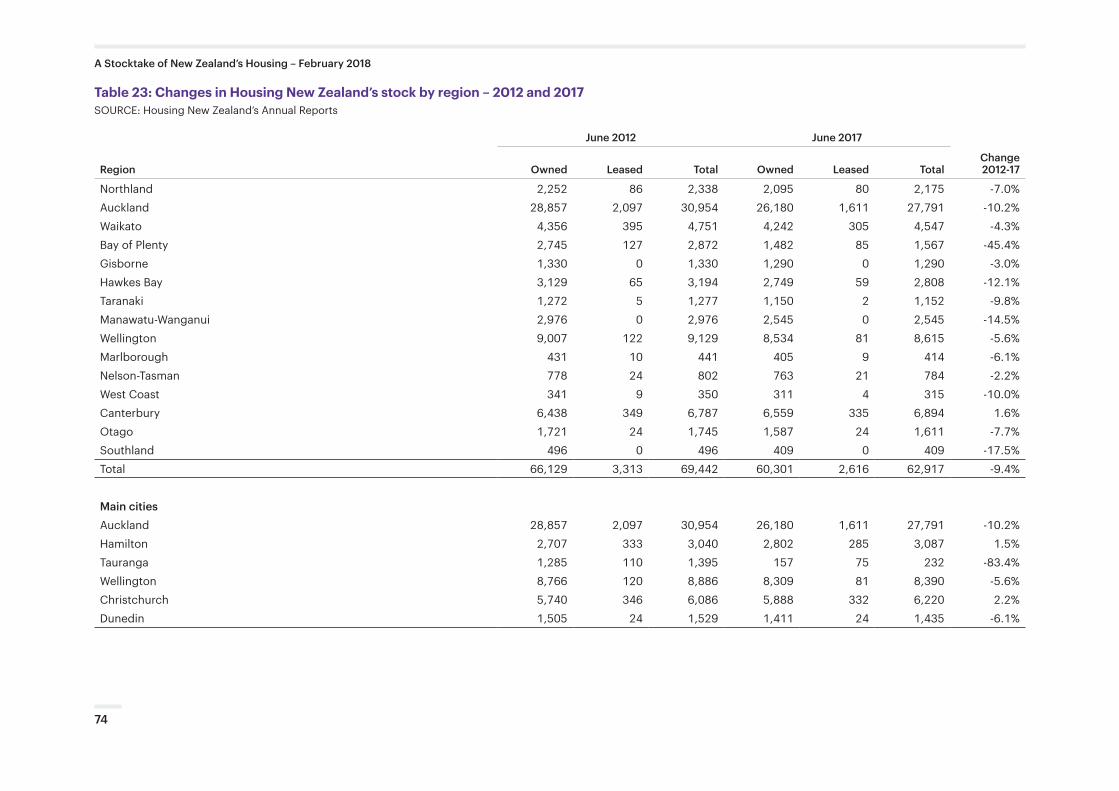
Table 23: Changes in Housing New Zealand’s stock by region – 2012 and 2017SOURCE: Housing New Zealand’s Annual Reports
June 2012 June 2017
Region Owned Leased Total Owned Leased TotalChange 2012-17
Northland 2,252 86 2,338 2,095 80 2,175 -7.0%Auckland 28,857 2,097 30,954 26,180 1,611 27,791 -10.2%Waikato 4,356 395 4,751 4,242 305 4,547 -4.3%Bay of Plenty 2,745 127 2,872 1,482 85 1,567 -45.4%Gisborne 1,330 0 1,330 1,290 0 1,290 -3.0%Hawkes Bay 3,129 65 3,194 2,749 59 2,808 -12.1%Taranaki 1,272 5 1,277 1,150 2 1,152 -9.8%Manawatu-Wanganui 2,976 0 2,976 2,545 0 2,545 -14.5%Wellington 9,007 122 9,129 8,534 81 8,615 -5.6%Marlborough 431 10 441 405 9 414 -6.1%Nelson-Tasman 778 24 802 763 21 784 -2.2%West Coast 341 9 350 311 4 315 -10.0%Canterbury 6,438 349 6,787 6,559 335 6,894 1.6%Otago 1,721 24 1,745 1,587 24 1,611 -7.7%Southland 496 0 496 409 0 409 -17.5%Total 66,129 3,313 69,442 60,301 2,616 62,917 -9.4%
Main citiesAuckland 28,857 2,097 30,954 26,180 1,611 27,791 -10.2%Hamilton 2,707 333 3,040 2,802 285 3,087 1.5%Tauranga 1,285 110 1,395 157 75 232 -83.4%Wellington 8,766 120 8,886 8,309 81 8,390 -5.6%Christchurch 5,740 346 6,086 5,888 332 6,220 2.2%Dunedin 1,505 24 1,529 1,411 24 1,435 -6.1%
74
A Stocktake of New Zealand’s Housing – February 2018
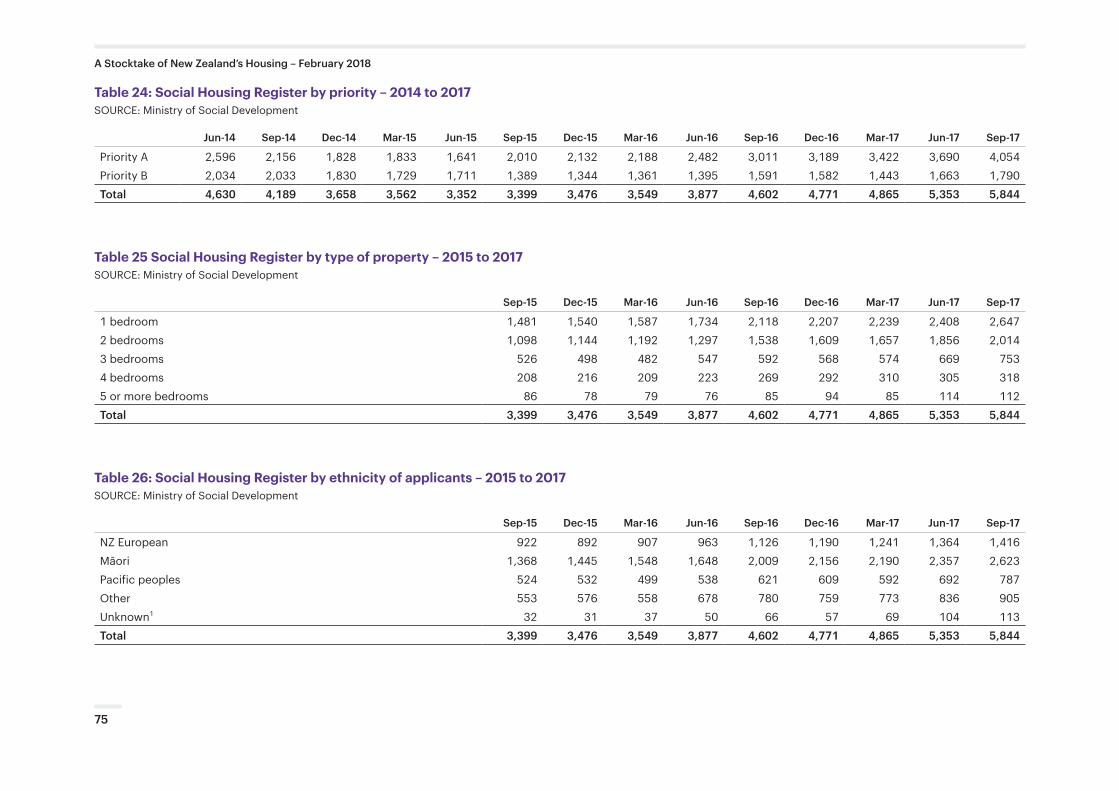
Table 24: Social Housing Register by priority – 2014 to 2017SOURCE: Ministry of Social Development
Jun-14 Sep-14 Dec-14 Mar-15 Jun-15 Sep-15 Dec-15 Mar-16 Jun-16 Sep-16 Dec-16 Mar-17 Jun-17 Sep-17
Priority A 2,596 2,156 1,828 1,833 1,641 2,010 2,132 2,188 2,482 3,011 3,189 3,422 3,690 4,054Priority B 2,034 2,033 1,830 1,729 1,711 1,389 1,344 1,361 1,395 1,591 1,582 1,443 1,663 1,790Total 4,630 4,189 3,658 3,562 3,352 3,399 3,476 3,549 3,877 4,602 4,771 4,865 5,353 5,844
Table 25 Social Housing Register by type of property – 2015 to 2017SOURCE: Ministry of Social Development
Sep-15 Dec-15 Mar-16 Jun-16 Sep-16 Dec-16 Mar-17 Jun-17 Sep-17
1 bedroom 1,481 1,540 1,587 1,734 2,118 2,207 2,239 2,408 2,6472 bedrooms 1,098 1,144 1,192 1,297 1,538 1,609 1,657 1,856 2,0143 bedrooms 526 498 482 547 592 568 574 669 7534 bedrooms 208 216 209 223 269 292 310 305 3185 or more bedrooms 86 78 79 76 85 94 85 114 112Total 3,399 3,476 3,549 3,877 4,602 4,771 4,865 5,353 5,844
Table 26: Social Housing Register by ethnicity of applicants – 2015 to 2017SOURCE: Ministry of Social Development
Sep-15 Dec-15 Mar-16 Jun-16 Sep-16 Dec-16 Mar-17 Jun-17 Sep-17
NZ European 922 892 907 963 1,126 1,190 1,241 1,364 1,416Māori 1,368 1,445 1,548 1,648 2,009 2,156 2,190 2,357 2,623Pacific peoples 524 532 499 538 621 609 592 692 787Other 553 576 558 678 780 759 773 836 905Unknown1 32 31 37 50 66 57 69 104 113Total 3,399 3,476 3,549 3,877 4,602 4,771 4,865 5,353 5,844
75
A Stocktake of New Zealand’s Housing – February 2018
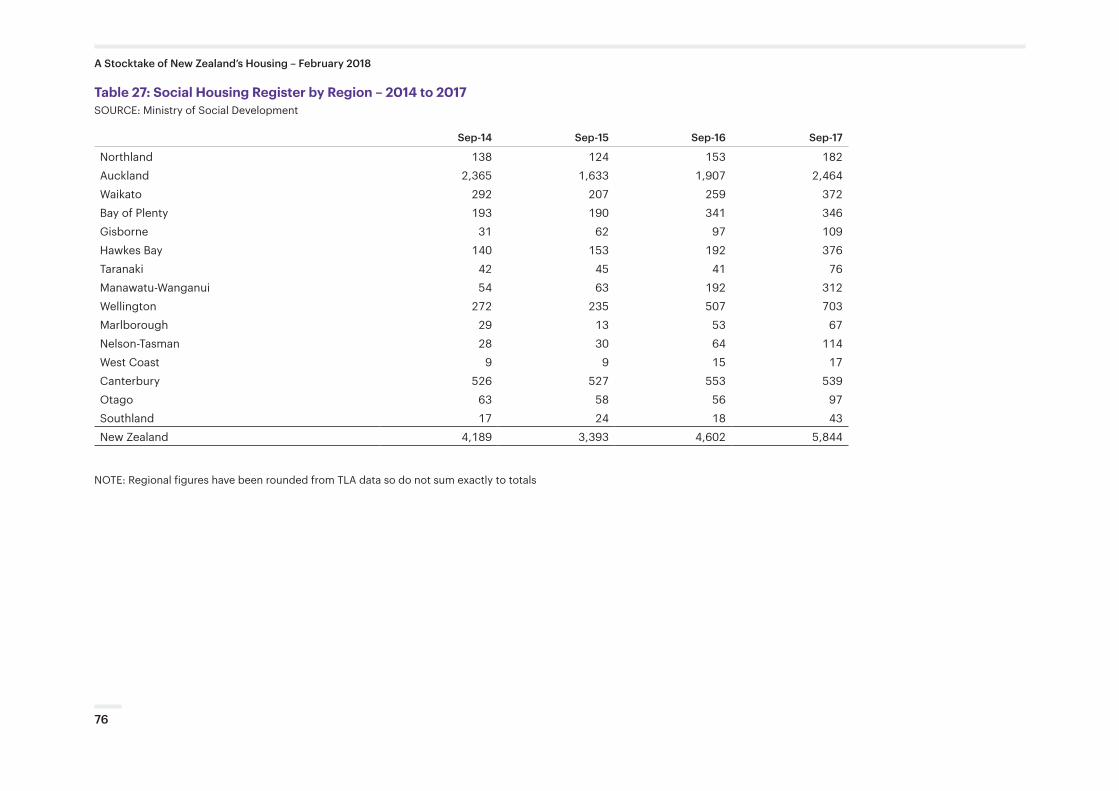
Table 27: Social Housing Register by Region – 2014 to 2017SOURCE: Ministry of Social Development
Sep-14 Sep-15 Sep-16 Sep-17
Northland 138 124 153 182Auckland 2,365 1,633 1,907 2,464Waikato 292 207 259 372Bay of Plenty 193 190 341 346Gisborne 31 62 97 109Hawkes Bay 140 153 192 376Taranaki 42 45 41 76Manawatu-Wanganui 54 63 192 312Wellington 272 235 507 703Marlborough 29 13 53 67Nelson-Tasman 28 30 64 114West Coast 9 9 15 17Canterbury 526 527 553 539Otago 63 58 56 97Southland 17 24 18 43New Zealand 4,189 3,393 4,602 5,844
NOTE: Regional figures have been rounded from TLA data so do not sum exactly to totals
76
A Stocktake of New Zealand’s Housing – February 2018
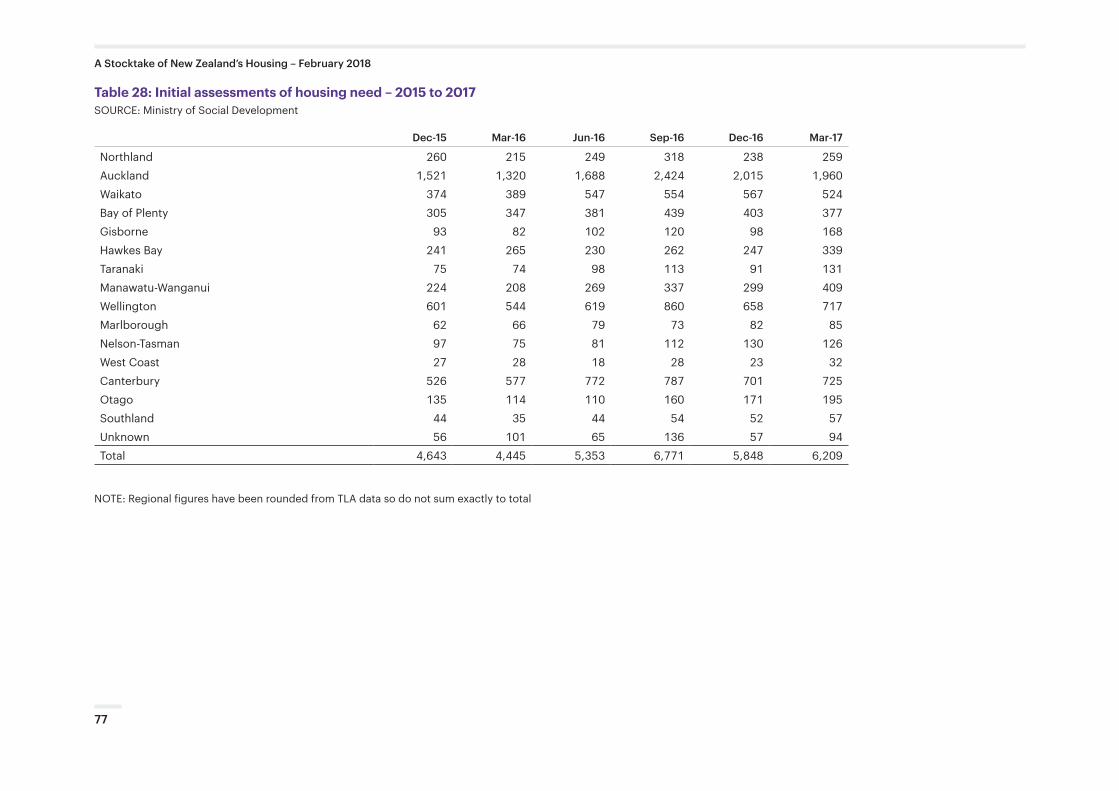
Table 28: Initial assessments of housing need – 2015 to 2017SOURCE: Ministry of Social Development
Dec-15 Mar-16 Jun-16 Sep-16 Dec-16 Mar-17
Northland 260 215 249 318 238 259Auckland 1,521 1,320 1,688 2,424 2,015 1,960Waikato 374 389 547 554 567 524Bay of Plenty 305 347 381 439 403 377Gisborne 93 82 102 120 98 168Hawkes Bay 241 265 230 262 247 339Taranaki 75 74 98 113 91 131Manawatu-Wanganui 224 208 269 337 299 409Wellington 601 544 619 860 658 717Marlborough 62 66 79 73 82 85Nelson-Tasman 97 75 81 112 130 126West Coast 27 28 18 28 23 32Canterbury 526 577 772 787 701 725Otago 135 114 110 160 171 195Southland 44 35 44 54 52 57Unknown 56 101 65 136 57 94Total 4,643 4,445 5,353 6,771 5,848 6,209
NOTE: Regional figures have been rounded from TLA data so do not sum exactly to total
77
A Stocktake of New Zealand’s Housing – February 2018
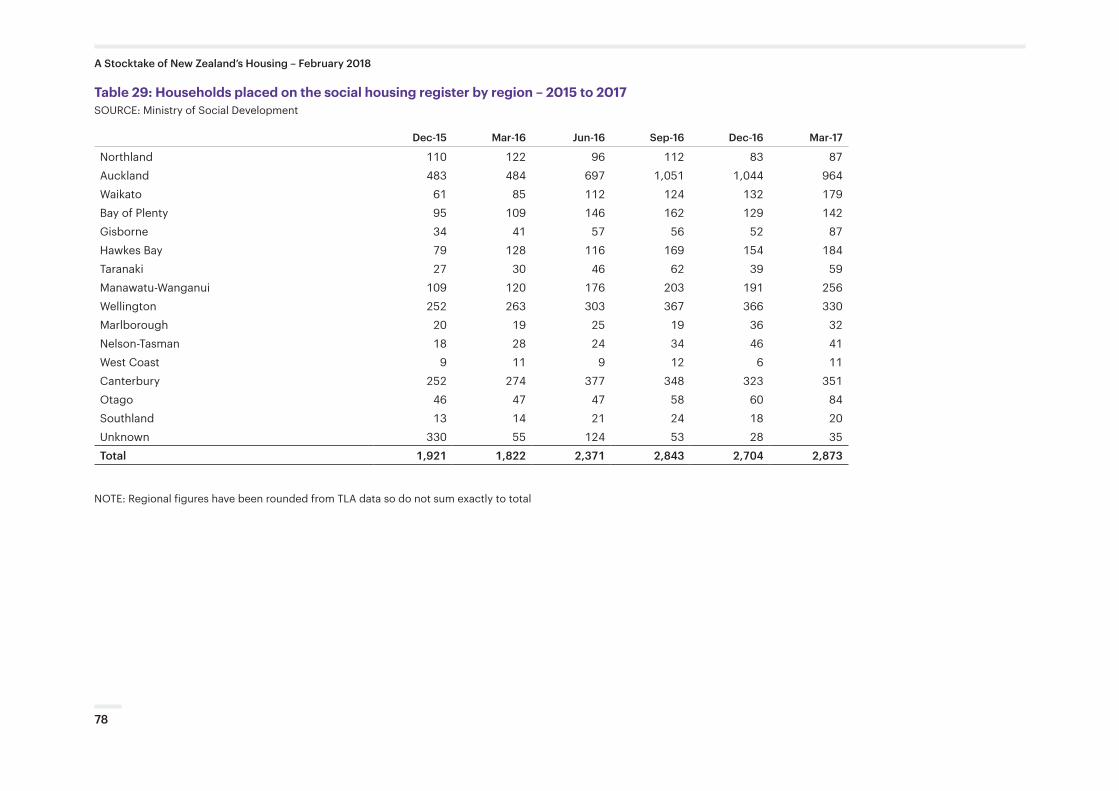
Table 29: Households placed on the social housing register by region – 2015 to 2017SOURCE: Ministry of Social Development
Dec-15 Mar-16 Jun-16 Sep-16 Dec-16 Mar-17
Northland 110 122 96 112 83 87Auckland 483 484 697 1,051 1,044 964Waikato 61 85 112 124 132 179Bay of Plenty 95 109 146 162 129 142Gisborne 34 41 57 56 52 87Hawkes Bay 79 128 116 169 154 184Taranaki 27 30 46 62 39 59Manawatu-Wanganui 109 120 176 203 191 256Wellington 252 263 303 367 366 330Marlborough 20 19 25 19 36 32Nelson-Tasman 18 28 24 34 46 41West Coast 9 11 9 12 6 11Canterbury 252 274 377 348 323 351Otago 46 47 47 58 60 84Southland 13 14 21 24 18 20Unknown 330 55 124 53 28 35Total 1,921 1,822 2,371 2,843 2,704 2,873
NOTE: Regional figures have been rounded from TLA data so do not sum exactly to total
78
A Stocktake of New Zealand’s Housing – February 2018
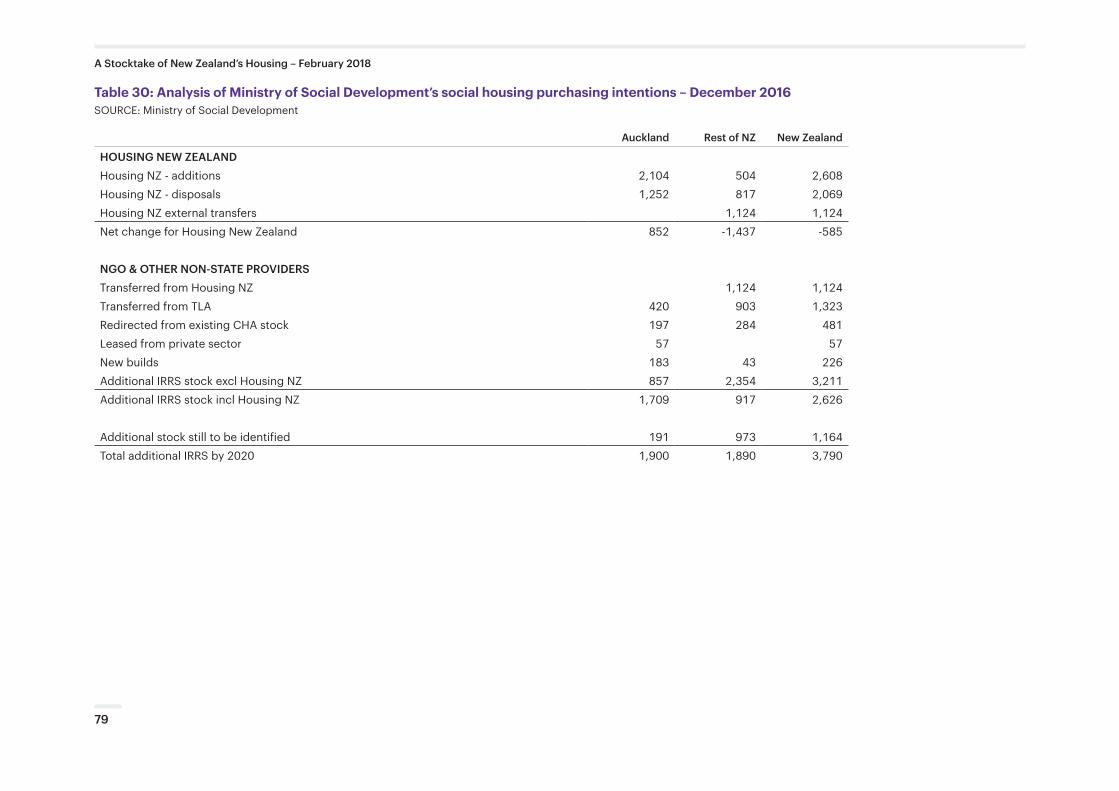
Table 30: Analysis of Ministry of Social Development’s social housing purchasing intentions – December 2016SOURCE: Ministry of Social Development
Auckland Rest of NZ New Zealand
HOUSING NEW ZEALANDHousing NZ - additions 2,104 504 2,608Housing NZ - disposals 1,252 817 2,069Housing NZ external transfers 1,124 1,124Net change for Housing New Zealand 852 -1,437 -585
NGO & OTHER NON-STATE PROVIDERSTransferred from Housing NZ 1,124 1,124Transferred from TLA 420 903 1,323Redirected from existing CHA stock 197 284 481Leased from private sector 57 57New builds 183 43 226Additional IRRS stock excl Housing NZ 857 2,354 3,211Additional IRRS stock incl Housing NZ 1,709 917 2,626
Additional stock still to be identified 191 973 1,164Total additional IRRS by 2020 1,900 1,890 3,790
79
A Stocktake of New Zealand’s Housing – February 2018
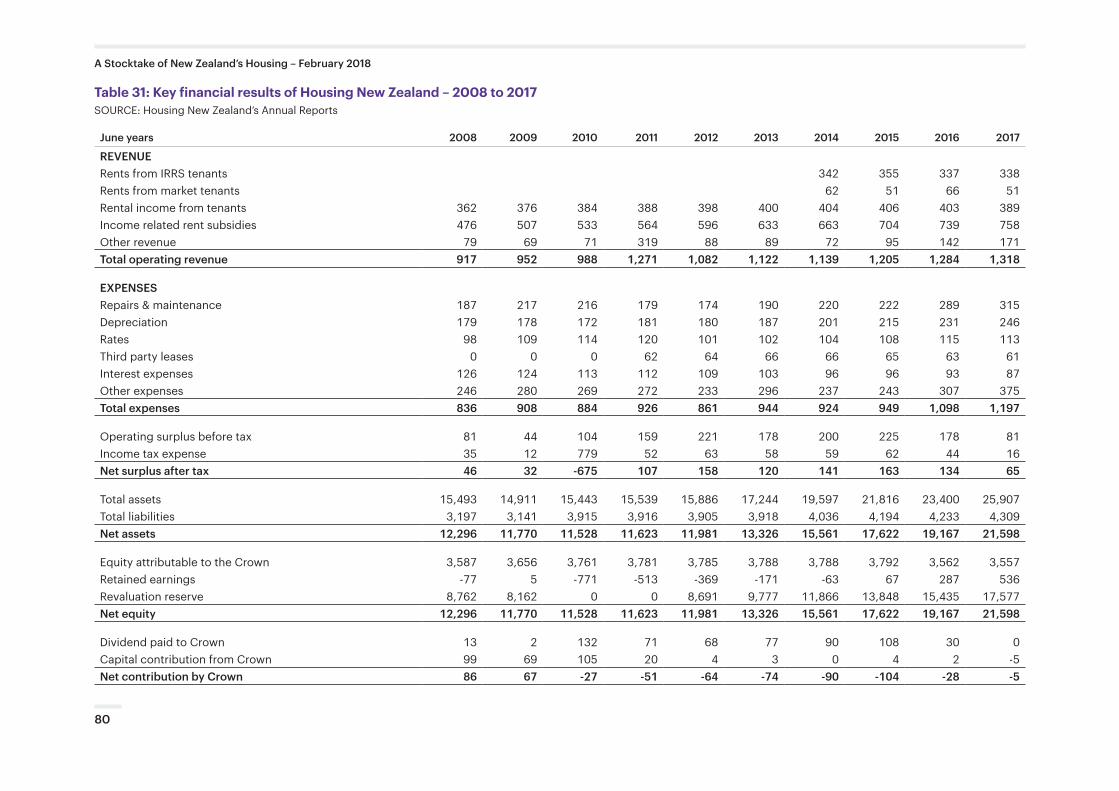
Table 31: Key financial results of Housing New Zealand – 2008 to 2017SOURCE: Housing New Zealand’s Annual Reports
June years 2008 2009 2010 2011 2012 2013 2014 2015 2016 2017
REVENUERents from IRRS tenants 342 355 337 338Rents from market tenants 62 51 66 51Rental income from tenants 362 376 384 388 398 400 404 406 403 389Income related rent subsidies 476 507 533 564 596 633 663 704 739 758Other revenue 79 69 71 319 88 89 72 95 142 171Total operating revenue 917 952 988 1,271 1,082 1,122 1,139 1,205 1,284 1,318
EXPENSESRepairs & maintenance 187 217 216 179 174 190 220 222 289 315Depreciation 179 178 172 181 180 187 201 215 231 246Rates 98 109 114 120 101 102 104 108 115 113Third party leases 0 0 0 62 64 66 66 65 63 61Interest expenses 126 124 113 112 109 103 96 96 93 87Other expenses 246 280 269 272 233 296 237 243 307 375Total expenses 836 908 884 926 861 944 924 949 1,098 1,197
Operating surplus before tax 81 44 104 159 221 178 200 225 178 81Income tax expense 35 12 779 52 63 58 59 62 44 16Net surplus after tax 46 32 -675 107 158 120 141 163 134 65
Total assets 15,493 14,911 15,443 15,539 15,886 17,244 19,597 21,816 23,400 25,907Total liabilities 3,197 3,141 3,915 3,916 3,905 3,918 4,036 4,194 4,233 4,309Net assets 12,296 11,770 11,528 11,623 11,981 13,326 15,561 17,622 19,167 21,598
Equity attributable to the Crown 3,587 3,656 3,761 3,781 3,785 3,788 3,788 3,792 3,562 3,557Retained earnings -77 5 -771 -513 -369 -171 -63 67 287 536Revaluation reserve 8,762 8,162 0 0 8,691 9,777 11,866 13,848 15,435 17,577Net equity 12,296 11,770 11,528 11,623 11,981 13,326 15,561 17,622 19,167 21,598
Dividend paid to Crown 13 2 132 71 68 77 90 108 30 0Capital contribution from Crown 99 69 105 20 4 3 0 4 2 -5Net contribution by Crown 86 67 -27 -51 -64 -74 -90 -104 -28 -5
80
A Stocktake of New Zealand’s Housing – February 2018
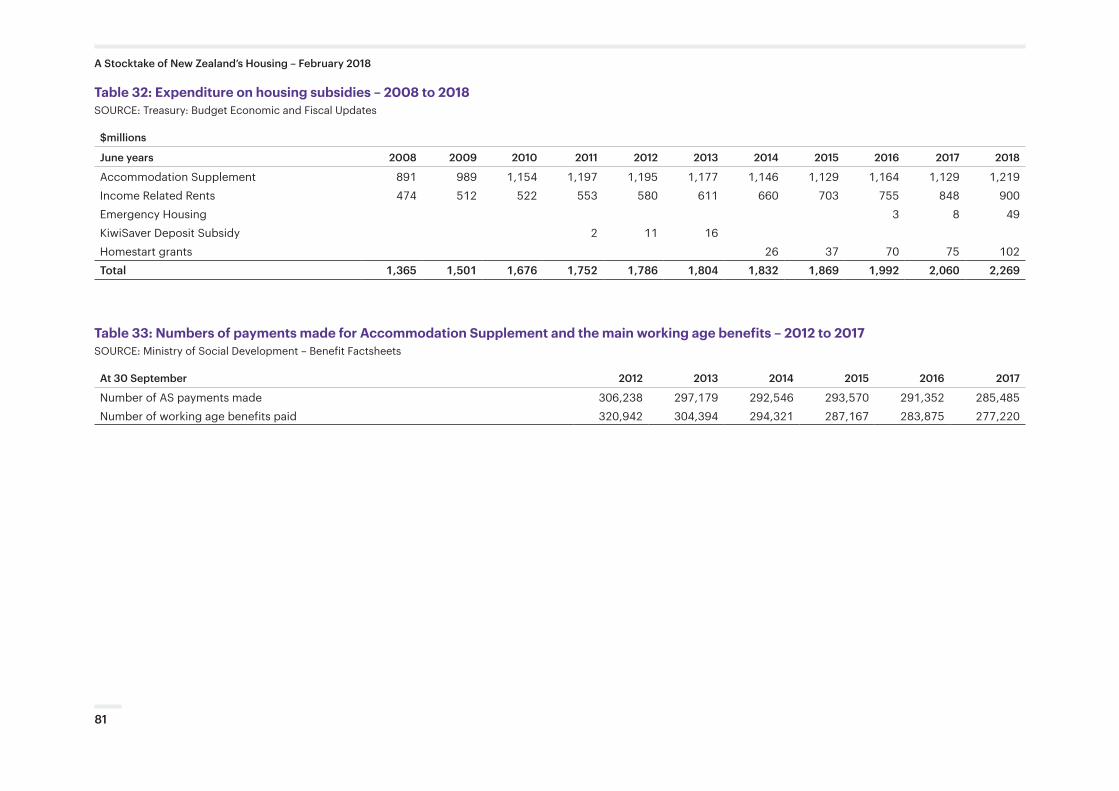
Table 32: Expenditure on housing subsidies – 2008 to 2018SOURCE: Treasury: Budget Economic and Fiscal Updates
$millions
June years 2008 2009 2010 2011 2012 2013 2014 2015 2016 2017 2018
Accommodation Supplement 891 989 1,154 1,197 1,195 1,177 1,146 1,129 1,164 1,129 1,219Income Related Rents 474 512 522 553 580 611 660 703 755 848 900Emergency Housing 3 8 49KiwiSaver Deposit Subsidy 2 11 16Homestart grants 26 37 70 75 102Total 1,365 1,501 1,676 1,752 1,786 1,804 1,832 1,869 1,992 2,060 2,269
Table 33: Numbers of payments made for Accommodation Supplement and the main working age benefits – 2012 to 2017SOURCE: Ministry of Social Development – Benefit Factsheets
At 30 September 2012 2013 2014 2015 2016 2017
Number of AS payments made 306,238 297,179 292,546 293,570 291,352 285,485Number of working age benefits paid 320,942 304,394 294,321 287,167 283,875 277,220
81
A Stocktake of New Zealand’s Housing – February 2018
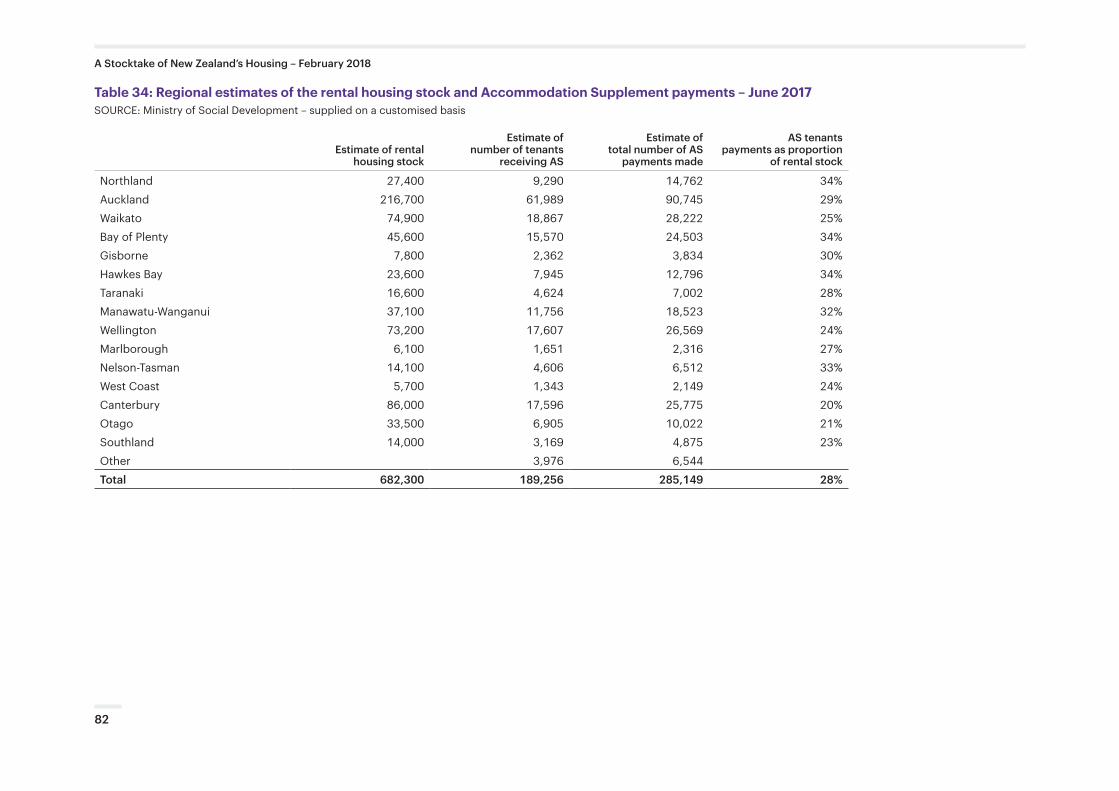
Table 34: Regional estimates of the rental housing stock and Accommodation Supplement payments – June 2017SOURCE: Ministry of Social Development – supplied on a customised basis
Estimate of rental housing stock
Estimate of number of tenants
receiving AS
Estimate of total number of AS
payments made
AS tenants payments as proportion
of rental stock
Northland 27,400 9,290 14,762 34%Auckland 216,700 61,989 90,745 29%Waikato 74,900 18,867 28,222 25%Bay of Plenty 45,600 15,570 24,503 34%Gisborne 7,800 2,362 3,834 30%Hawkes Bay 23,600 7,945 12,796 34%Taranaki 16,600 4,624 7,002 28%Manawatu-Wanganui 37,100 11,756 18,523 32%Wellington 73,200 17,607 26,569 24%Marlborough 6,100 1,651 2,316 27%Nelson-Tasman 14,100 4,606 6,512 33%West Coast 5,700 1,343 2,149 24%Canterbury 86,000 17,596 25,775 20%Otago 33,500 6,905 10,022 21%Southland 14,000 3,169 4,875 23%Other 3,976 6,544Total 682,300 189,256 285,149 28%
82
A Stocktake of New Zealand’s Housing – February 2018
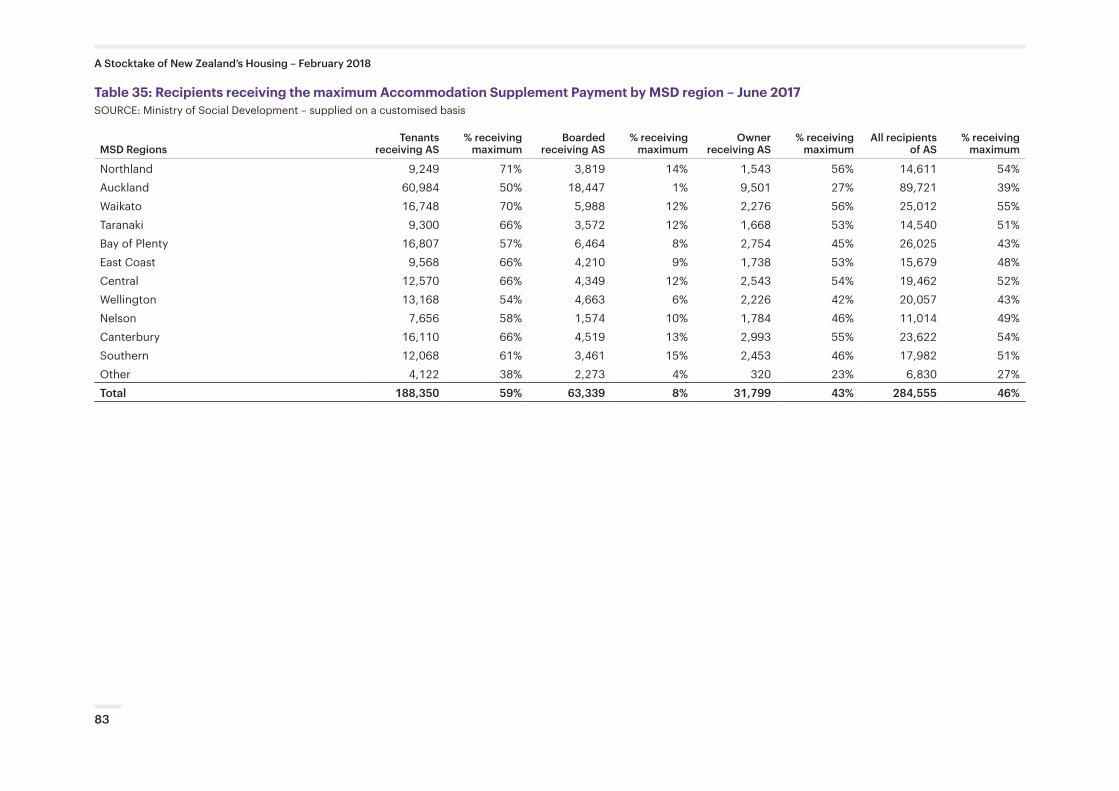
Table 35: Recipients receiving the maximum Accommodation Supplement Payment by MSD region – June 2017SOURCE: Ministry of Social Development – supplied on a customised basis
MSD RegionsTenants
receiving AS% receiving
maximumBoarded
receiving AS% receiving
maximumOwner
receiving AS% receiving
maximumAll recipients
of AS% receiving
maximum
Northland 9,249 71% 3,819 14% 1,543 56% 14,611 54%Auckland 60,984 50% 18,447 1% 9,501 27% 89,721 39%Waikato 16,748 70% 5,988 12% 2,276 56% 25,012 55%Taranaki 9,300 66% 3,572 12% 1,668 53% 14,540 51%Bay of Plenty 16,807 57% 6,464 8% 2,754 45% 26,025 43%East Coast 9,568 66% 4,210 9% 1,738 53% 15,679 48%Central 12,570 66% 4,349 12% 2,543 54% 19,462 52%Wellington 13,168 54% 4,663 6% 2,226 42% 20,057 43%Nelson 7,656 58% 1,574 10% 1,784 46% 11,014 49%Canterbury 16,110 66% 4,519 13% 2,993 55% 23,622 54%Southern 12,068 61% 3,461 15% 2,453 46% 17,982 51%Other 4,122 38% 2,273 4% 320 23% 6,830 27%Total 188,350 59% 63,339 8% 31,799 43% 284,555 46%
83
A Stocktake of New Zealand’s Housing – February 2018
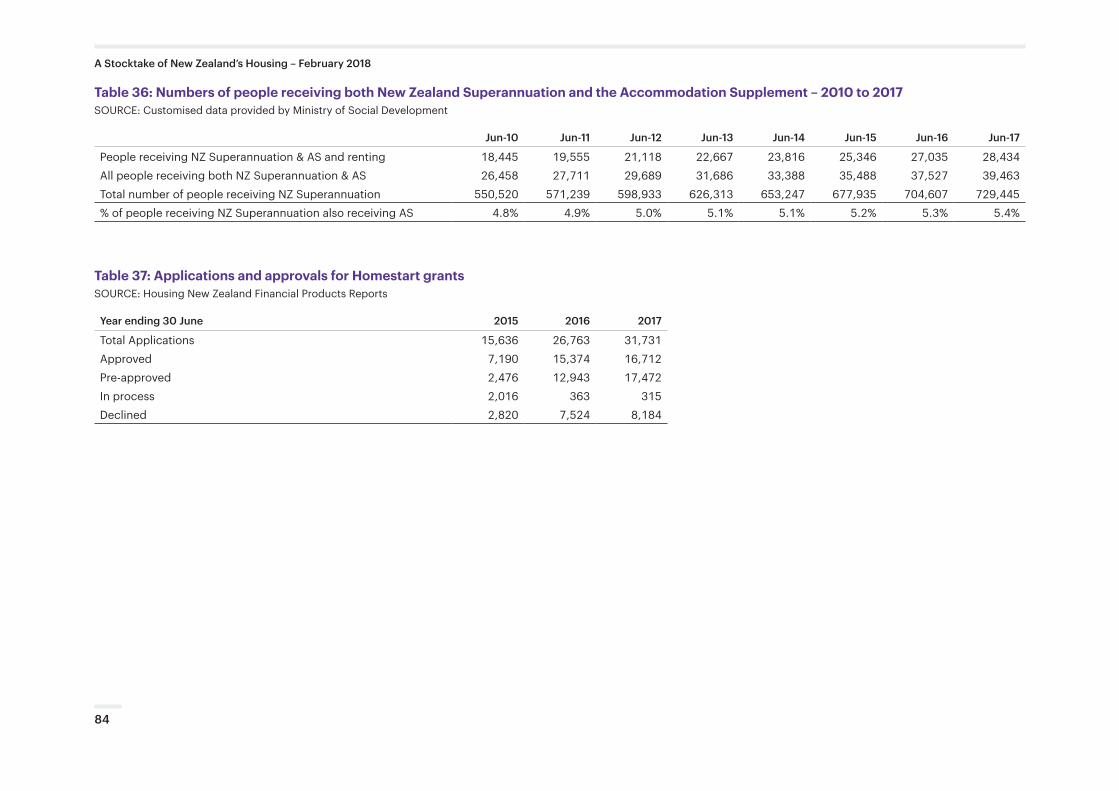
Table 36: Numbers of people receiving both New Zealand Superannuation and the Accommodation Supplement – 2010 to 2017SOURCE: Customised data provided by Ministry of Social Development
Jun-10 Jun-11 Jun-12 Jun-13 Jun-14 Jun-15 Jun-16 Jun-17
People receiving NZ Superannuation & AS and renting 18,445 19,555 21,118 22,667 23,816 25,346 27,035 28,434All people receiving both NZ Superannuation & AS 26,458 27,711 29,689 31,686 33,388 35,488 37,527 39,463Total number of people receiving NZ Superannuation 550,520 571,239 598,933 626,313 653,247 677,935 704,607 729,445% of people receiving NZ Superannuation also receiving AS 4.8% 4.9% 5.0% 5.1% 5.1% 5.2% 5.3% 5.4%
Table 37: Applications and approvals for Homestart grantsSOURCE: Housing New Zealand Financial Products Reports
Year ending 30 June 2015 2016 2017
Total Applications 15,636 26,763 31,731Approved 7,190 15,374 16,712Pre-approved 2,476 12,943 17,472In process 2,016 363 315Declined 2,820 7,524 8,184
84
A Stocktake of New Zealand’s Housing – February 2018
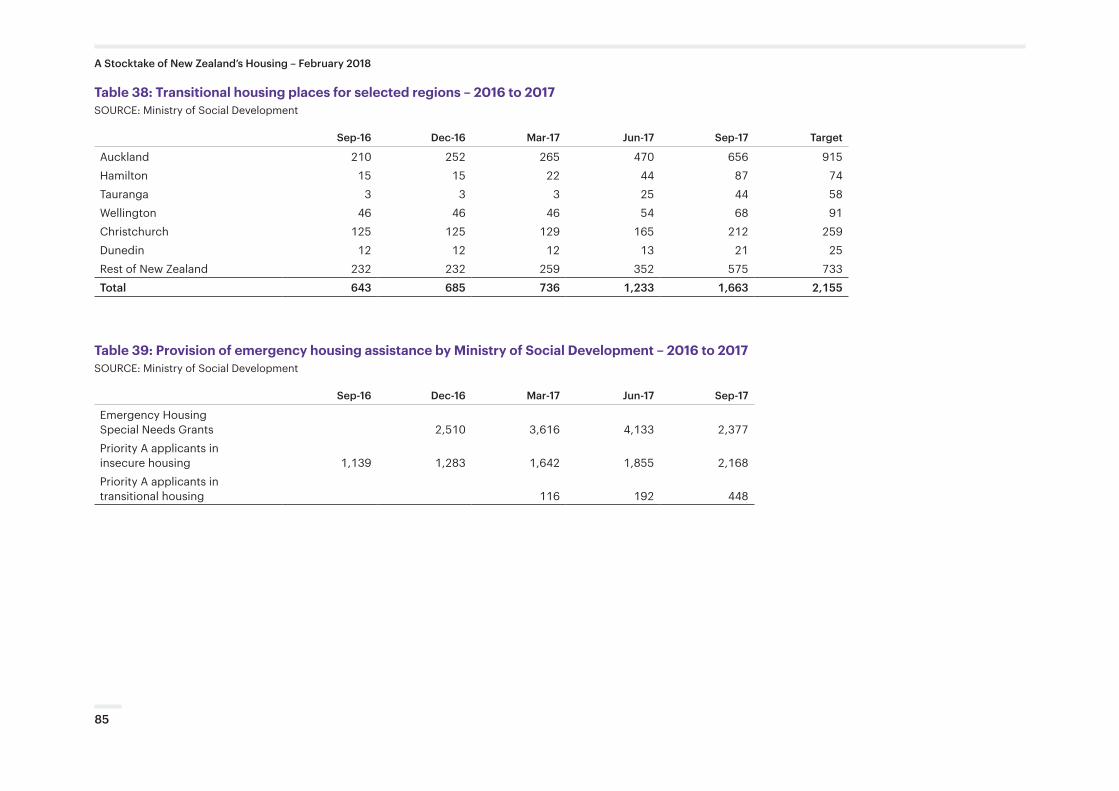
Table 38: Transitional housing places for selected regions – 2016 to 2017SOURCE: Ministry of Social Development
Sep-16 Dec-16 Mar-17 Jun-17 Sep-17 Target
Auckland 210 252 265 470 656 915Hamilton 15 15 22 44 87 74Tauranga 3 3 3 25 44 58Wellington 46 46 46 54 68 91Christchurch 125 125 129 165 212 259Dunedin 12 12 12 13 21 25Rest of New Zealand 232 232 259 352 575 733Total 643 685 736 1,233 1,663 2,155
Table 39: Provision of emergency housing assistance by Ministry of Social Development – 2016 to 2017SOURCE: Ministry of Social Development
Sep-16 Dec-16 Mar-17 Jun-17 Sep-17
Emergency Housing Special Needs Grants 2,510 3,616 4,133 2,377Priority A applicants in insecure housing 1,139 1,283 1,642 1,855 2,168Priority A applicants in transitional housing 116 192 448
85
A Stocktake of New Zealand’s Housing – February 2018