philippine stock exchange - geri
TRANSCRIPT

24 June 2013 PHILIPPINE STOCK EXCHANGE 3/F Philippine Stock Exchange Plaza Ayala Triangle, Ayala Avenue Makati City
Attention : Ms. Janet A. Encarnacion Head, Disclosure Department Dear Ms. Encarnacion: In compliance with the Rule on Additional Listing of Shares, Global-Estate Resorts, Inc. (GERI) hereby submits the attached Comprehensive Corporate Disclosure in relation to a private placement transaction signed on 21 June 2013. Thank you. Very truly yours,
Dominic V. Isberto Corporate Secretary

2
COMPREHENSIVE CORPORATE DISCLOSURE
IN CONNECTION WITH THE SUBSCRIPTION AGREEMENT
BETWEEN GLOBAL-ESTATE RESORTS, INC.
AND MEGAWORLD CORPORATION
The transaction as described below is made pursuant to the resolution of the
Board of Directors of Global-Estate Resorts, Inc. (hereinafter the “Company”)
in a special meeting held on 21 June 2013 to implement the increase in
authorized capital stock as approved in the Special Meeting of the
Shareholders on 08 November 2011.
a. Name of the Listed Company
Global-Estate Resorts, Inc.
b. Description of the transaction including timetable
for implementation and related regulatory
requirements
The Company has an authorized capital stock of Ten Billion Pesos
(Php10,000,000,000) divided into Ten Billion (10,000,000,000) common
shares with a par value of One Peso (Php1.00) per share. On 08
November 2011, the shareholders of the Company approved an increase
in authorized capital stock to Twenty Billion Pesos (Php20,000,000,000)
divided into Twenty Billion (20,000,000,000) common shares with a par
value of One Peso (Php1.00) per share.
On 21 June 2013, the Board of Directors of the Company resolved to
implement the increase in capital and approved the subscription by
Megaworld Corporation to Two Billion Five Hundred Million
(2,500,000,000) common shares of the increase in capital (hereinafter,
the “Shares”), at the price per share of Two Pesos and Twenty-six
Centavos (Php2.26), or a total subscription price of Five Billion Six
Hundred Fifty Million Pesos (Php5,650,000,000.00).
The planned increase in capital will be submitted to the Securities and
Exchange Commission (SEC) for approval through an application for
amendment of Article Seven of the Company’s Amended Articles of
Incorporation.
The subscription to the increase in capital is exempt from registration
with the SEC, it being an exempt transaction by express provision of
Section 10.1 (i) of the Securities Regulations Code (SRC). No notice of
exemption or fee is required for the transaction pursuant to SRC Rule

3
10.1(2). Nevertheless, the Company will file SEC Form 10.1 (Notice of
Exemption).
The Shares will be applied for listing with the Philippine Stock Exchange
as soon as practicable. To comply with the listing requirements of the
PSE, the Company will present the transaction for ratification by the
shareholders at the Annual Meeting of Shareholders scheduled on
30 July 2013.
c. Rationale for the transaction
The subscription by Megaworld allows the Company to raise equity funds
in a most expeditious and efficient manner, at the least cost to the
Company, to finance the development of its various projects, for land
acquisition, and general corporate purposes.
d. Aggregate value of the consideration
The total subscription price for the Subscribed Shares is Five Billion Six
Hundred Fifty Million Pesos (Php5,650,000,000.00). Twenty-five percent
(25%) of the total subscription price shall be paid on 26 June 2013 and
the balance within ten (10) business days after approval by the SEC of
the increase in capital stock, grant of PSE exemption from the rights or
public offer requirement, and approval by the Company’s shareholders of
the subscription.
e. Basis upon which the consideration or the issue value was
determined
The subscription price represents a premium of 5% over the thirty (30)
trading-day volume weighted average price (VWAP) of the common
shares of the Company immediately preceding the date of the
subscription.
f. Detailed work program of the application of the proceeds
The proceeds of the transaction will be used for funding of the
development of the Company’s projects, namely:
Boracay Newcoast in Boracay Island, Aklan;
Twin Lakes in Batangas; and,
Sta Barbara Heights in Iloilo;
and for land acquisition and general corporate purposes.

4
g. Identity of the beneficial owners of the Shares
Name of Subscriber : Megaworld Corporation (“Subscriber”)
Date of incorporation: 24 August 1989
Nature of business : The Subscriber is one of the leading
property developers in the Philippines and is primarily engaged in the
development in Metro Manila of large-scale mixed-use planned
communities, or community townships, that integrate residential,
commercial, educational/training, leisure and entertainment
components. The Subscriber’s real estate portfolio includes residential
condominium units, subdivision lots and townhouses, as well as office
projects and retail space. The Company has three primary business
segments: (i) real estate sales of residential and office developments, (ii)
leasing of office space, primarily to business process outsourcing (“BPO”)
enterprises, and retail space, and (iii) management of hotel operations.
Major projects and investments of the Subscriber : Among
the Subscriber’s main projects and investments are:
Eastwood City which is a mixed-use project on approximately 18
hectares of land in Quezon City that integrates corporate,
residential, education/training, leisure and entertainment
components;
Forbes Town Center which is located on 5 hectares of land in
Bonifacio Global City, Taguig, which, upon completion, will
consist of residential, retail, and entertainment properties;
McKinley Hill which is a community township located on
approximately 50 hectares of land in Fort Bonifacio, Taguig and
consists of office, residential, retail, educational, entertainment,
and recreational center;
Newport City which is also a community township located on 25
hectares of land at the Villamor Air Base in Pasay City which
integrates the live-work-play concept of Eastwood City and which,
upon completion, will comprise a residential zone, a corporate
zone, a leisure and entertainment zone, and a hotel zone
including the Marriott Hotel, Maxims Hotel, Remington Hotel,
Belmont Luxury Hotel, and Savoy Hotel;
5
Manhattan Garden City which is a residential development
project consisting of 20 residential towers on a 5.7 hectare-land
at the Araneta Center in Quezon City;
Cityplace which a mixed-use project under development on a 2.5
hectare-lot in Binondo, Manila;
Uptown Bonifacio which is located on an approximately 15.4-
hectare property in Fort Bonifacio in Taguig City and is comprised
of a residential portion in the northern part of Fort Bonifacio, and
a portion for mixed-use (office and retail space) on a parcel of land
owned by Napolcom, under joint venture arrangements with
BCDA and Napolcom;
McKinley West which is a mixed-use project, under joint venture
with BCDA, located on an approximately 34.5-hectare portion of
the JUSMAG property owned by BCDA and located across
McKinley Hill in Taguig;
The Mactan Newtown which is an expected mixed-use township
development on a 25-hectare property near Shangri-La’s Mactan
Resort and Spa in Mactan, Cebu;
Iloilo Business Park which is a mixed-planned community in a
54.5-hectare property in Mandurriao, Iloilo, site of the old Iloilo
airport, and which, upon completion, will have BPO office
buildings, boutique hotels, a convention center, retail centers,
and a lifestyle center.
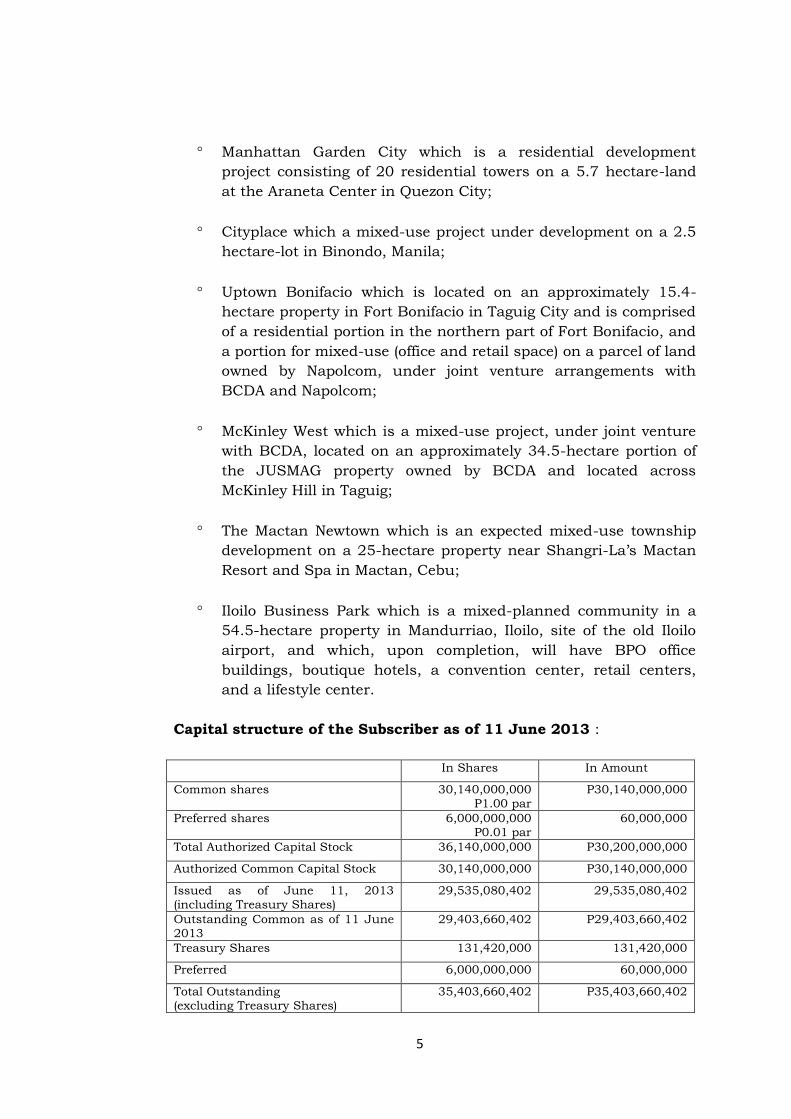
Capital structure of the Subscriber as of 11 June 2013 :
In Shares In Amount
Common shares 30,140,000,000 P1.00 par
P30,140,000,000
Preferred shares 6,000,000,000 P0.01 par
60,000,000
Total Authorized Capital Stock 36,140,000,000 P30,200,000,000
Authorized Common Capital Stock 30,140,000,000 P30,140,000,000
Issued as of June 11, 2013 (including Treasury Shares)
29,535,080,402 29,535,080,402
Outstanding Common as of 11 June 2013
29,403,660,402 P29,403,660,402
Treasury Shares 131,420,000 131,420,000
Preferred 6,000,000,000 60,000,000
Total Outstanding (excluding Treasury Shares)
35,403,660,402 P35,403,660,402

6
Audited Financial Statements for the last three (3) fiscal years :
Please refer to Annexes “1,” “2,” and “3.”
List of subsidiaries and affiliates of the Subscriber :
Subsidiaries
Megaworld Land, Inc.
Prestige Hotels & Resorts, Inc.
Mactan Oceanview Properties and Holding, Inc.
Megaworld Cayman Islands, Inc.
Richmonde Hotel Group International Limited
Eastwood Cyber One Corporation
Forbes Town Properties & Holdings, Inc.
Megaworld Newport Property Holdings, Inc.
Oceantown Properties, Inc.
Piedmont Property Ventures, Inc.
Stonehaven Land, Inc.
Streamwood Property, Inc.
Suntrust Properties, Inc.
Empire East Land Holdings, Inc.
Megaworld Central Properties, Inc.
Megaworld-Daewoo Corporation
Manila Bayshore Property Holdngs, Inc.
Megaworld Resort Estates, Inc.
Megaworld-Globus Asia, Inc.
Philippine International Properties, Inc.
Townsquare Development Inc.
Associates
Suntrust Home Developers, Inc.
Megaworld-Global Estate, Inc.
Palm Tree Holdings & Development Corporation
Alliance Global Properties Limited
Gilmore Property Marketing Associates, Inc.
Twin Lakes Corporation
Travellers International Hotel Group, Inc.

7
Board of directors of the Subscriber :
Andrew L. Tan Chairman Katherine L. Tan Director Kingson U. Sian Director Enrique Santos L. Sy Director Miguel B. Varela Independent Director Gerardo C. Garcia Independent Director Roberto S. Guevarra Independent Director
Principal officers of the Subscriber :
Andrew L. Tan Chairman and President Kingson U. Sian SVP and Executive Director Lourdes T. Gutierrez Chief Operating Officer Francisco C. Canuto SVP, Treasurer, Compliance Officer,
and Chief Information Officer Philipps C. Cando SVP for Operations Monica T. Salomon First Vice-President for Corporate
Management Garry V. de Guzman First Vice-President for Legal Affairs Maria Victoria M. Acosta Managing Director for International
Sales Kimberly Hazel A. Sta. Maria AVP for Corporate Communications
and Advertising Edwin B. Maquinto Corporate Secretary Rolando D. Siatela Assistant Corporate Secretary
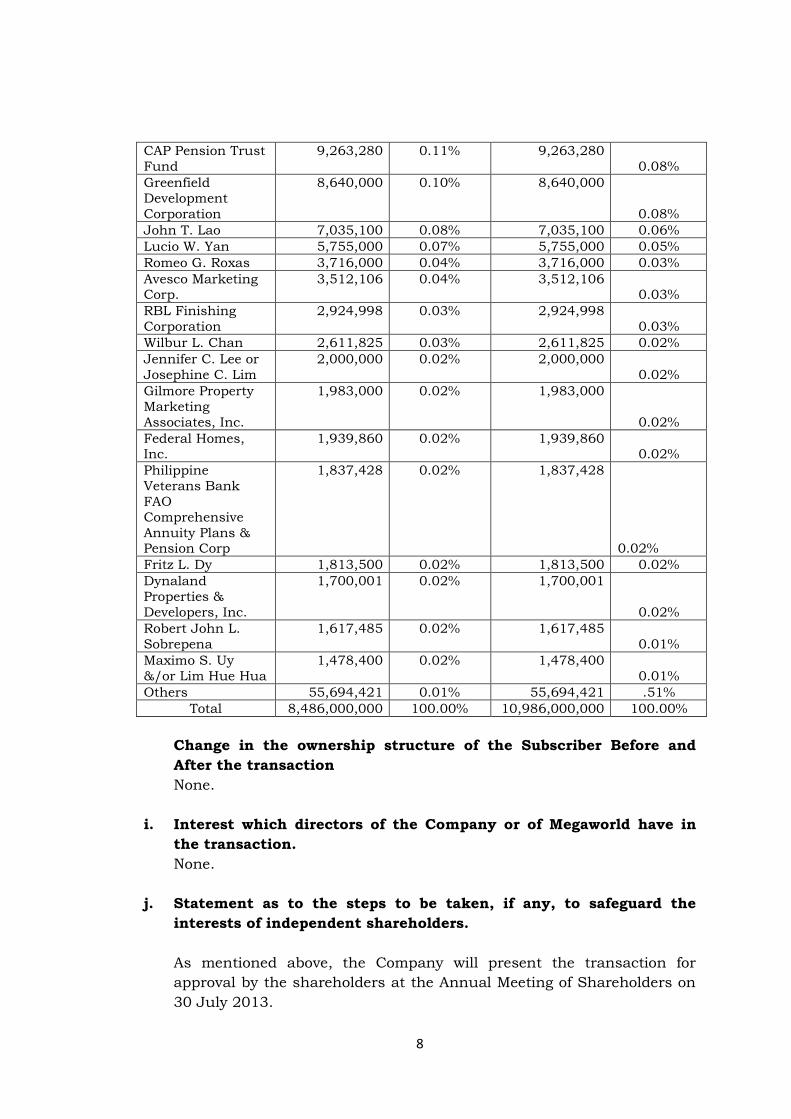
h. Change in the ownership structure of the
Company Before and After the transaction
Name of
Shareholders of
GERI
Before the Subscription
(As of 21 June 2013)
After the Subscription
No. of Shares % of
Ownership
No. of Shares % of
Ownership
Alliance Global
Group, Inc.
5,405,000,000 63.69% 5,405,000,000
49.20%
Megaworld Corporation
0 0 2,500,000,000 22.76%
PCD Nominee
Corporation
(Filipino)
1,443,824,630 17.01% 1,443,824,630
13.14%
Fil-Estate
Management, Inc.
1,065,774,606 12.56% 1,065,774,606
9.70%
PCD Nominee
Corporation (Foreign)
457,878,360 5.40% 457,878,360
4.17%
8
CAP Pension Trust
Fund
9,263,280 0.11% 9,263,280
0.08%
Greenfield
Development
Corporation
8,640,000 0.10% 8,640,000
0.08%
John T. Lao 7,035,100 0.08% 7,035,100 0.06%
Lucio W. Yan 5,755,000 0.07% 5,755,000 0.05%
Romeo G. Roxas 3,716,000 0.04% 3,716,000 0.03%
Avesco Marketing Corp.
3,512,106 0.04% 3,512,106 0.03%
RBL Finishing
Corporation
2,924,998 0.03% 2,924,998
0.03%
Wilbur L. Chan 2,611,825 0.03% 2,611,825 0.02%
Jennifer C. Lee or
Josephine C. Lim
2,000,000 0.02% 2,000,000
0.02%
Gilmore Property
Marketing
Associates, Inc.
1,983,000 0.02% 1,983,000
0.02%
Federal Homes, Inc.
1,939,860 0.02% 1,939,860 0.02%
Philippine
Veterans Bank
FAO
Comprehensive
Annuity Plans & Pension Corp
1,837,428 0.02% 1,837,428
0.02%
Fritz L. Dy 1,813,500 0.02% 1,813,500 0.02%
Dynaland
Properties &
Developers, Inc.
1,700,001 0.02% 1,700,001
0.02%
Robert John L.
Sobrepena
1,617,485 0.02% 1,617,485
0.01%
Maximo S. Uy
&/or Lim Hue Hua
1,478,400 0.02% 1,478,400
0.01%
Others 55,694,421 0.01% 55,694,421 .51%
Total 8,486,000,000 100.00% 10,986,000,000 100.00%
Change in the ownership structure of the Subscriber Before and
After the transaction
None.
i. Interest which directors of the Company or of Megaworld have in
the transaction.
None.
j. Statement as to the steps to be taken, if any, to safeguard the
interests of independent shareholders.
As mentioned above, the Company will present the transaction for
approval by the shareholders at the Annual Meeting of Shareholders on
30 July 2013.

9
Attached is a copy of the Subscription Agreement dated 21 June 2013.
GLOBAL-ESTATES RESORTS, INC. 24 June 2013 Issuer
By:
DOMINIC V. ISBERTO
Corporate Secretary


Notes 2010 2009 2008
A S S E T S
CURRENT ASSETS
Cash and cash equivalents 5 22,031,584,943 P 20,876,005,473 P 12,325,333,064 P
Trade and other receivables - net 6 14,133,801,384 10,749,643,934 11,420,125,379
Subscriptions receivable 24 - 2,272,642,649 -
Financial assets at fair value through profit or loss 7 125,000,000 41,500,000 17,400,000
Residential and condominium units for sale 3 6,286,477,215 5,719,854,891 5,847,104,417
Property development costs 3 3,798,108,537 3,720,702,927 2,821,399,894
Prepayments and other current assets - net 437,227,590 367,756,457 390,067,827
Total Current Assets 46,812,199,669 43,748,106,331 32,821,430,581
NON-CURRENT ASSETS
Trade and other receivables 6 15,617,214,463 13,534,302,355 6,661,850,041
Advances to landowners and joint ventures 9 2,708,026,497 1,208,026,496 335,048,101
Land for future development 2 1,482,561,015 1,269,561,000 1,809,743,589
Investments in available-for-sale securities 8 6,211,184,496 2,926,531,713 4,350,224,672
Investments in and advances to associates and other
related parties 10 13,671,332,490 12,665,714,849 10,982,670,783
Investment property - net 11 9,716,530,045 9,105,785,069 7,140,319,564
Property and equipment - net 12 360,518,201 381,176,983 430,180,785
Deferred tax assets - net 22 7,860,539 7,887,713 2,418,273
Other non-current assets 13 442,095,396 406,679,936 367,389,073
Total Non-current Assets 50,217,323,142 41,505,666,114 32,079,844,881
TOTAL ASSETS 97,029,522,811 P 85,253,772,445 P 64,901,275,462 P
MEGAWORLD CORPORATION AND SUBSIDIARIES
CONSOLIDATED STATEMENTS OF FINANCIAL POSITION
DECEMBER 31, 2010, 2009 AND 2008
(Amounts in Philippine Pesos)

Notes 2010 2009 2008
LIABILITIES AND EQUITY
CURRENT LIABILITIES
Interest-bearing loans and borrowings 14 1,311,354,897 P 850,744,029 P 348,831,327 P
Bonds payable 15 3,416,062,159 - -
Trade and other payables 16 4,037,713,348 3,662,373,258 2,689,022,672
Customers' deposits 2 1,013,053,489 960,106,021 1,024,881,409
Income tax payable 29,061,975 50,108,777 10,816,032
Reserve for property development 2 3,640,068,354 2,468,349,023 2,078,799,883
Deferred income on real estate sales 2 2,220,540,650 1,515,687,720 1,180,849,892
Other current liabilities 17 1,741,665,060 1,347,443,261 931,751,599
Total Current Liabilities 17,409,519,932 10,854,812,089 8,264,952,814
NON-CURRENT LIABILITIES
Interest-bearing loans and borrowings 14 6,128,583,476 7,449,057,858 5,906,746,354
Bonds payable 15 5,000,000,000 8,608,407,826 3,696,290,569
Customers' deposits 2 1,222,422,709 892,800,498 969,510,257
Reserve for property development 2 2,487,557,735 2,023,028,273 1,743,300,891
Deferred income on real estate sales 2 1,588,240,851 1,217,863,024 1,014,902,786
Deferred tax liabilities - net 22 3,249,030,654 2,641,563,555 1,843,353,761
Advances from other related parties 23 289,868,257 625,936,481 836,258,246
Retirement benefit obligation 21 116,039,185 90,767,520 81,219,560
Other non-current liabilities 17 1,019,123,375 1,013,818,761 851,789,377
Total Non-current Liabilities 21,100,866,242 24,563,243,796 16,943,371,801
Total Liabilities 38,510,386,174 35,418,055,885 25,208,324,615
EQUITY 24
Total equity attributable to
parent company's shareholders 57,776,023,630 49,111,847,183 38,980,292,755
Non-controlling interest 743,113,007 723,869,377 712,658,092
Total Equity 58,519,136,637 49,835,716,560 39,692,950,847
TOTAL LIABILITIES AND EQUITY 97,029,522,811 P 85,253,772,445 P 64,901,275,462 P
See Notes to Consolidated Financial Statements.
-2-

Notes 2010 2009 2008
REVENUES
Real estate sales 6 13,110,567,020 P 12,574,801,962 P 12,430,321,088 P
Interest income on real estate sales 6 933,424,160 714,213,230 612,320,924
Realized gross profit on prior years' sales 2 1,355,982,007 1,277,434,472 752,681,262
Rental income 11 2,694,310,554 2,000,477,427 1,300,910,039
Hotel operations 2 232,757,023 216,143,646 246,919,573
Equity in net earnings of associates,
interest and other income - net 19 2,214,742,331 975,587,944 1,954,942,770
20,541,783,095 17,758,658,681 17,298,095,656
COSTS AND EXPENSES
Real estate sales 2 8,606,699,164 7,940,756,662 8,082,125,043
Deferred gross profit 2 2,431,379,388 1,815,065,914 1,624,410,655
Operating expenses 18 2,140,225,634 1,808,120,886 1,744,978,492
Interest and other charges - net 20 544,401,114 587,544,169 990,784,498
Hotel operations 2 124,463,666 103,017,443 110,169,420
Tax expense 22 1,609,101,525 1,437,541,131 951,101,304
15,456,270,491 13,692,046,205 13,503,569,412
NET PROFIT FOR THE YEAR 5,085,512,604 P 4,066,612,476 P 3,794,526,244 P
Net profit attributable to:
Parent company's shareholders 5,026,180,575 P 4,055,401,191 P 3,771,127,007 P
Non-controlling interest 59,332,029 11,211,285 23,399,237
5,085,512,604 P 4,066,612,476 P 3,794,526,244 P
Earnings per Share
Basic and Diluted 25 0.200 P 0.176 P 0.187 P
MEGAWORLD CORPORATION AND SUBSIDIARIES
CONSOLIDATED STATEMENTS OF INCOME
FOR THE YEARS ENDED DECEMBER 31, 2010, 2009 AND 2008
(Amounts in Philippine Pesos)
See Notes to Consolidated Financial Statements.

Notes 2010 2009 2008
NET PROFIT FOR THE YEAR 5,085,512,604 P 4,066,612,476 P 3,794,526,244 P
OTHER COMPREHENSIVE INCOME (LOSS)
Net unrealized gains (losses) on
available-for-sale (AFS) financial assets 8 4,031,843,227 1,211,879,519 1,250,778,389 )(
Reversal of unrealized losses on AFS financial
assets of a deconsolidated subsidiary 63,656,553 - -
Reclassification adjustments for gains (losses)
of disposed AFS financial assets
included in profit or loss 8 473,319,584 )( 276,543,393 51,926,367 )(
Share in other comprehensive income
of associates 71,176,649 - -
3,693,356,845 1,488,422,912 1,302,704,756 )(
Translation adjustments 186,558,030 )( 86,806,621 )( 410,292,926
Less related tax 22, 2.4 55,967,408 26,041,986 11,728,077 )(
130,590,622 )( 60,764,635 )( 398,564,849
3,562,766,223 1,427,658,277 904,139,907 )(
TOTAL COMPREHENSIVE INCOME
FOR THE YEAR 8,648,278,827 P 5,494,270,753 P 2,890,386,337 P
Total comprehensive income attributable to:
Parent company's shareholders 8,588,946,798 P 5,483,059,468 P 2,866,987,100 P
Non-controlling interest 59,332,029 11,211,285 23,399,237
8,648,278,827 P 5,494,270,753 P 2,890,386,337 P
MEGAWORLD CORPORATION AND SUBSIDIARIES
CONSOLIDATED STATEMENTS OF COMPREHENSIVE INCOME
FOR THE YEARS ENDED DECEMBER 31, 2010, 2009 AND 2008
(Amounts in Philippine Pesos)
See Notes to Consolidated Financial Statements.

Notes 2010 2009 2008
CAPITAL STOCK 24
Balance at beginning of year 25,829,203,626 P 20,701,646,901 P 20,701,646,901 P
Additional issuance during the year - 5,127,556,725 -
Balance at end of year 25,829,203,626 25,829,203,626 20,701,646,901
ADDITIONAL PAID-IN CAPITAL 24 8,432,990,413 8,432,990,413 8,432,990,413
TREASURY STOCK - at cost 24
Balance at beginning of year 1,188,836,744 )( 1,188,836,744 )( 871,543,094 )(
Reduction representing the shares
held by a deconsolidated subsidiary 555,115,114 - -
Additions during the year - - 317,293,650 )(
Balance at end of year 633,721,630 )( 1,188,836,744 )( 1,188,836,744 )(
NET UNREALIZED GAINS (LOSSES) ON
AVAILABLE-FOR-SALE FINANCIAL ASSETS 8
Balance at beginning of year 116,256,567 1,372,166,345 )( 69,461,589 )(
Other comprehensive income (loss) for the year 3,693,356,845 1,488,422,912 1,302,704,756 )(
Balance at end of year 3,809,613,412 116,256,567 1,372,166,345 )(
ACCUMULATED TRANSLATION
ADJUSTMENTS 2.4
Balance at beginning of year 121,744,648 )( 60,980,013 )( 459,544,862 )(
Other comprehensive income (loss) for the year, net of tax 130,590,622 )( 60,764,635 )( 398,564,849
Balance at end of year 252,335,270 )( 121,744,648 )( 60,980,013 )(
RETAINED EARNINGS
Balance at beginning of year 16,043,977,969 12,467,638,543 9,098,865,349
Net profit attributable to parent company's shareholders 5,026,180,575 4,055,401,191 3,771,127,007
Cash dividends 24 479,885,465 )( 479,061,765 )( 402,353,813 )(
Balance at end of year 20,590,273,079 16,043,977,969 12,467,638,543
Total Equity Attributable to
Parent Company's Shareholders 57,776,023,630 49,111,847,183 38,980,292,755
NON-CONTROLLING INTEREST
Balance at beginning of year 723,869,377 712,658,092 772,956,023
Deductions 40,088,399 )( - 83,697,168 )(
Net profit attributable to non-controlling interest 59,332,029 11,211,285 23,399,237
Balance at end of year 743,113,007 723,869,377 712,658,092
TOTAL EQUITY 58,519,136,637 P 49,835,716,560 P 39,692,950,847 P
MEGAWORLD CORPORATION AND SUBSIDIARIES
CONSOLIDATED STATEMENTS OF CHANGES IN EQUITY
FOR THE YEARS ENDED DECEMBER 31, 2010, 2009 AND 2008
(Amounts in Philippine Pesos)
See Notes to Consolidated Financial Statements.

Notes 2010 2009 2008
CASH FLOWS FROM OPERATING ACTIVITIES
Profit before tax 6,694,614,129 P 5,504,153,607 P 4,745,627,548 P
Adjustments for:
Interest income 19 835,944,617 )( 690,238,144 )( 1,486,040,236 )(
Finance costs 20 516,440,321 556,326,705 766,416,111
Depreciation and amortization 18 443,203,639 365,795,590 238,834,323
Equity in net earnings of associates 10, 19 442,281,307 )( 157,958,213 )( 109,464,838 )(
Fair value losses (gains) - net 19, 20 83,500,000 )( 24,100,000 )( 42,653,717
Dividend income 19 40,630,134 )( 44,247,127 )( 48,880,085 )(
Operating profit before working capital changes 6,251,902,031 5,509,732,418 4,149,146,540
Increase in trade and other receivables 5,467,069,558 )( 6,201,387,858 )( 5,394,041,435 )(
Decrease (increase) in residential and
condominium units for sale 412,044,886 127,249,526 37,609,566 )(
Decrease (increase) in property development costs 77,405,610 )( 112,428,459 557,922,101
Decrease (increase) in prepayments and other current assets 69,471,133 )( 22,311,370 104,566,830
Increase in advances to landowners and
joint ventures 1,500,000,001 )( 872,978,395 )( 165,664,462 )(
Increase (decrease) in trade and other payables 204,094,188 854,376,714 222,761,682 )(
Increase (decrease) in customers' deposits 382,569,679 141,485,147 )( 397,825,551 )(
Increase in deferred income on real estate sales 1,075,230,757 537,798,066 871,380,840
Increase in reserve for property development 1,636,248,793 669,276,522 1,228,583,888
Increase in other liabilities 424,798,078 415,691,663 283,434,290
Cash generated from operations 3,272,942,110 1,033,013,338 977,131,793
Cash paid for income taxes 946,782,440 )( 559,614,717 )( 568,856,191 )(
Net Cash From Operating Activities 2,326,159,670 473,398,621 408,275,602
CASH FLOWS FROM INVESTING ACTIVITIES
Additions to:
Investment property 11 991,266,588 )( 2,261,263,607 )( 1,759,545,786 )(
Land for future development 213,000,015 )( - 204,162,180 )(
Property and equipment 12 62,373,098 )( 33,162,257 )( 64,209,436 )(
Interest received 835,944,617 689,655,133 1,228,937,506
Net decrease (increase) in other non-current assets 221,527,843 )( 17,607,943 19,963,210 )(
Net decrease (increase) in available-for-sale securities 472,360,615 2,912,115,871 1,237,996,955 )(
Net increase in investments in and advances
to associates and other related parties 408,034,396 )( 238,527,057 )( 2,631,219,346 )(
Dividends received 19 40,630,134 44,247,127 48,880,085
Payments made for the subscribed common stock of an associate 10 - 1,583,687,182 )( 1,967,194,514 )(
Proceeds from disposals of property and equipment - - 341,384
Proceeds from sale of investments in subsidiaries and associate - - 1,205,107,503
Net decrease in financial assets at fair value through profit or loss - - 1,016,639,571
Payments made for the acquisitions of new subsidiaries - - 140,725,295 )(
Net Cash Used in Investing Activities 547,266,574 )( 453,014,029 )( 4,525,110,673 )(
CASH FLOWS FROM FINANCING ACTIVITIES
Proceeds from exercise of stock rights 24 2,272,642,649 2,854,914,076 -
Interest paid 1,323,861,629 )( 896,733,166 )( 519,186,181 )(
Payments of long-term liabilities 1,052,209,181 )( 348,831,328 )( 457,345,854 )(
Cash dividends paid 24 519,885,465 )( 479,061,765 )( 402,353,813 )(
Proceeds from long-term liabilities 14 - 7,400,000,000 4,500,000,000
Acquisition of treasury stock 24 - - 317,293,650 )(
Net Cash From (Used in) Financing Activities 623,313,626 )( 8,530,287,817 2,803,820,502
NET INCREASE (DECREASE) IN CASH
AND CASH EQUIVALENTS 1,155,579,470 8,550,672,409 1,313,014,569 )(
CASH AND CASH EQUIVALENTS
AT BEGINNING OF YEAR 20,876,005,473 12,325,333,064 13,638,347,633
CASH AND CASH EQUIVALENTS
AT END OF YEAR 22,031,584,943 P 20,876,005,473 P 12,325,333,064 P
Supplemental Information on Non-cash Investing and Financing Activities
MEGAWORLD CORPORATION AND SUBSIDIARIES
CONSOLIDATED STATEMENTS OF CASH FLOWS
FOR THE YEARS ENDED DECEMBER 31, 2010, 2009 AND 2008
(Amounts in Philippine Pesos)
See Notes to Consolidated Financial Statements.
In the normal course of business, the Group enters into non-cash transactions such as exchanges or purchases on account of real estate and other assets. Other non-cash transactions include transfers of property from Land for Future Development to Property Development Costs or Investment Property as the property goes through its various stages of development. These non-cash activities are not reflected in the consolidated statements of cash flows (see Notes 9 and 11) .

MEGAWORLD CORPORATION AND SUBSIDIARIES NOTES TO CONSOLIDATED FINANCIAL STATEMENTS
DECEMBER 31, 2010, 2009 AND 2008 (Amounts in Philippine Pesos)
1. CORPORATE INFORMATION Megaworld Corporation (the Company or parent company) was incorporated in the
Philippines on August 24, 1989, primarily to engage in the development of large scale mixed-use planned communities or townships that integrate residential, commercial, leisure and entertainment components. The Company is presently engaged in property-related activities, such as, project design, construction and property management. The Company’s real estate portfolio includes residential condominium units, subdivision lots and townhouses, as well as office projects and retail space.
All of the Company’s common shares of stock are listed at the Philippine Stock
Exchange (PSE).
The registered office of the Company, which is also its principal place of business, is located at the 28th Floor, The World Centre Building, Sen. Gil Puyat Avenue, Makati City.
Alliance Global Group, Inc. (AGI), also a publicly listed company in the Philippines, is the Group’s ultimate parent company. AGI is a holding company and also presently engaged in the food and beverage business, real estate and quick service restaurant. AGI’s registered office, which is also its primary place of business, is located at the 1880 Eastwood Avenue, Eastwood City CyberPark, 188 E. Rodriguez Jr. Avenue, Quezon City.
The Company holds interests in the following subsidiaries and associates: Explanatory Percentage of Ownership
Subsidiaries/Associates Notes 2010 2009 2008
Subsidiaries:
Megaworld Land, Inc. (MLI) 100% 100% 100%
Prestige Hotels and Resorts, Inc. (PHRI) (a) 100% 100% 100%
Mactan Oceanview Properties
and Holdings, Inc. (MOPHI) 100% 100% 100%
Megaworld Cayman Islands, Inc. (MCII) 100% 100% 100%
Richmonde Hotel Group International (RHGI) 100% 100% 100%
Eastwood Cyber One Corporation (ECOC) 100% 100% 100%
Forbes Town Properties and Holdings, Inc. (FTPHI) 100% 100% 100%
Megaworld Newport Property
Holdings, Inc. (MNPHI) 100% 100% 100%
Oceantown Properties, Inc. (OPI) 100% 100% 100%
Piedmont Property Ventures, Inc. (PPVI) (b) 100% 100% 100%
Stonehaven Land, Inc. (SLI) (b) 100% 100% 100%
Streamwood Property, Inc. (SPI) (b) 100% 100% 100%
Megaworld-Daewoo Corporation (MDC) 60% 60% 60%
Megaworld Central Properties, Inc. (MCPI) 51% 51% 51%
Megaworld Resort Estates, Inc. (MREI) (c) 51% 51% 51%
Megaworld Globus Asia, Inc. (MGAI) 50% 50% 50%
Philippine International Properties, Inc. (PIPI) (d) 50% 50% 50%
Townsquare Development, Inc. (TDI) (e) 31% 31% 31%

- 2 -
Explanatory Percentage of Ownership
Subsidiaries/Associates Notes 2010 2009 2008
Associates:
Empire East Land Holdings, Inc. (EELHI) 48.38% 48.38% 48.38%
Suntrust Home Developers, Inc. (SHDI) 42.48% 42.48% 42.48%
Palm Tree Holdings and Development
Corporation (PTHDC) 40% 40% 40%
Gilmore Property Marketing Associates, Inc. (GPMAI) (f) 39.83% 31% 31%
Alliance Global Properties Ltd. (AGPL) (g) 39.44% 44.34% -
Travellers International Hotel Group, Inc. (TIHGI) (h) 10% 10% 10%
Explanatory Notes:
(a) Wholly owned subsidiary of MLI.
(b) Acquired subsidiaries in 2008 but have not yet started commercial operations as of
December 31, 2010. (c) Subsidiary was incorporated in 2007. MREI owns 100% of TDI and GPMAI as of December 31, 2007. In
June 2008, MREI’s ownership in TDI and GPMAI decreased to 60% which resulted in the Company’s
indirect interest of 31% as of December 31, 2009 and 2008. MREI has not yet started commercial
operations as of December 31, 2010. (d) Subsidiary was incorporated in 2002 and acquired by the Company in 2006; has not yet started commercial
operations as of December 31, 2010.
(e) Subsidiary was incorporated in 2006. In September 2007, the Company’s 100% ownership in TDI was
acquired by MREI which resulted in the Company’s indirect interest of 51% as of December 31, 2007. In
June 2008, TDI issued additional shares of stock which resulted in a decrease in MREI’s ownership in TDI
to 60%. In this regard, the Company has indirect interest in TDI of 31% as of December 31, 2010, 2009 and
2008.
(f) In November 2007, MREI acquired 100% ownership in GPMAI which resulted in the Company’s indirect
interest of 51% as of December 31, 2007. In 2008, MREI’s ownership in GPMAI decreased to 60%; it
further decreased to 28.85% in 2010. GPMAI was consolidated starting 2007 up to 2009; in 2010, it was
deconsolidated and treated as an associate of the Group. As of December 31, 2010, the Company has
39.83% indirect interest in GPMAI. (g) In February 2009, RHGI acquired 44.34% ownership in AGPL, which resulted in the Company’s indirect
interest of 44.34% as of December 31, 2009. In October 2010, AGPL issued additional shares of stock
which resulted in the decrease in RHGI’s ownership in AGPL to 39.44%. AGPL is considered as an
associate due to the Company’s significant influence, but not control, on AGPL.
(h) The associate was incorporated in 2003 and started commercial operations in August 2009. In 2008, the
Company acquired 10% ownership in TIHGI through a share swap agreement. In August 2010, the
Company’s investment in TIHGI was converted to 10.0 million common shares and 990.0 million preferred
shares of TIHGI. Subsequently, in November 2010, TIHGI redeemed the 430.0 million preferred shares
held by the Company. The conversion of common shares and the redemption of preferred shares did not
change the Company’s ownership in TIHGI. Although the Company’s percentage ownership is only 10%,
TIHGI was classified as an associate due to the Company’s significant influence on TIHGI.
Except for MCII, RHGI and AGPL, all the subsidiaries and associates were incorporated in the Philippines and operate within the country. MCII and AGPL were incorporated and operate in the Cayman Islands while RHGI was incorporated and operates in the British Virgin Islands.
The Company and its subsidiaries (the Group), except for MREI, PIPI, PPVI, SLI
and SPI which are not yet in commercial operations as of December 31, 2010, are presently engaged in the real estate business, hotel operations and marketing services.
EELHI and SHDI are publicly listed companies in the Philippines.

- 3 -
The consolidated financial statements of the Group for the year ended December 31, 2010 (including the comparatives for the years ended December 31, 2009 and 2008) were authorized for issue by the Company’s Board of Directors (BOD) on March 15, 2011.
2. SUMMARY OF SIGNIFICANT ACCOUNTING POLICIES
The significant accounting policies that have been used in the preparation of these consolidated financial statements are summarized below. The policies have been consistently applied to all the years presented, unless otherwise stated. 2.1 Basis of Preparation of Consolidated Financial Statements
(a) Statement of Compliance with Philippine Financial Reporting Standards
The consolidated financial statements of the Group have been prepared in accordance with Philippine Financial Reporting Standards (PFRS). PFRS are adopted by the Financial Reporting Standards Council (FRSC), from the pronouncements issued by the International Accounting Standards Board. The consolidated financial statements have been prepared using the measurement basis specified by PFRS for each type of asset, liability, income and expense. The measurement bases are more fully described in the accounting policies that follow.
(b) Presentation of Consolidated Financial Statements
The consolidated financial statements are presented in accordance with Philippine Accounting Standard (PAS 1) (Revised 2007), Presentation of Financial Statements. The Group presents all items of income and expense in two statements: a consolidated statement of income and a consolidated statement of comprehensive income. Two comparative periods are presented for the consolidated statement of financial position when the Group applies an accounting policy retrospectively or makes a retrospective restatement of items in its consolidated financial statements, or reclassifies items in the consolidated financial statements. The Group has opted to present two comparative periods for the consolidated statement of financial position even when it is not required to do so.
(c) Functional and Presentation Currency
These consolidated financial statements are presented in Philippine pesos, the Company’s presentation and functional currency, and all values represent absolute amounts except when otherwise indicated. Items included in the consolidated financial statements of the Group are measured using the Company’s functional currency. Functional currency is the currency of the primary economic environment in which an entity operates.

- 4 -
2.2 Adoption of New Interpretations, Revisions and Amendments to PFRS
(a) Effective in 2010 that are Relevant to the Group
In 2010, the Group adopted the following revisions, interpretations and annual improvements to existing PFRS that are relevant to the Group and effective for its consolidated financial statements for the annual period beginning on or after January 1, 2010.
PAS 27 (Revised) : Consolidated and Separate Financial
Statements PFRS 3 (Revised 2008) : Business Combinations Philippine Interpretation International Financial Reporting Interpretations Committee (IFRIC) 17 : Distribution of Non-cash Assets to
Owners Various Standards : 2009 Annual Improvements to PFRS
Below is a discussion of the impact of these accounting standards. (i) PAS 27 (Revised 2008), Consolidated and Separate Financial Statements (effective
from July 1, 2009). The revised standard requires the effects of all transactions with non-controlling interests to be recorded in equity if there is no change in control and these transactions will no longer result in goodwill or gains and losses. The standard also specifies the accounting when control is lost. Any remaining interest in the entity is re-measured to fair value and a gain or loss is recognized in profit or loss. The adoption of the standard did not result in any adjustment to the financial statements as there was no gain or loss recognized from the changes in the Group’s ownership interests in GPMAI and AGPL.
(ii) PFRS 3 (Revised 2008), Business Combinations (effective from July 1, 2009). The revised standard continues to apply the acquisition method to business combination with significant changes. For example, all payments to purchase a business are to be recorded at fair value at the acquisition date, with contingent payments classified as debt subsequently re-measured through the profit or loss. There is a choice on an acquisition-by-acquisition basis to measure the non-controlling interest in the acquiree either at fair value or at the non-controlling interest’s proportionate share in the acquiree’s identifiable assets. All acquisition-related costs should be expensed. The adoption of the revised standard has no significant effect on the 2010 consolidated financial statements as the Group did not have any business acquisition during the year.

- 5 -
(iii) Philippine Interpretation IFRIC 17, Distribution of Non-cash Assets to Owners
(effective from July 1, 2009). IFRIC 17 clarifies that dividend payable should be recognized when the dividend is appropriately authorized and is no longer at the discretion of the entity. Also, an entity should measure the dividend payable at the fair value of the net assets to be distributed and the difference between the dividend paid and the carrying amount of the net assets distributed should be recognized in profit or loss. The Group’s adoption of this interpretation did not have a material impact on the financial statements because the Group did not distribute non-cash assets to stockholders during the year.
(iv) 2009 Annual Improvements to PFRS. The FRSC has adopted the
Improvements to PFRS 2009. Most of these amendments became effective for annual periods beginning on or after July 1, 2009, or January 1, 2010. Among those improvements, only the following amendments were identified to be relevant to the Group’s consolidated financial statements but which did not also have any material impact on its consolidated financial statements:
PAS 1 (Amendment), Presentation of Financial Statements (effective from January 1, 2010). The amendment clarifies the current and non-current classification of a liability that can, at the option of the counterparty, be settled by the issue of the entity’s equity instruments.
PAS 7 (Amendment), Statement of Cash Flows (effective from January 1, 2010). The amendment clarifies that only an expenditure that results in a recognized asset can be classified as a cash flow from investing activities. Under its current policies, only recognized assets are classified by the Group as cash flows from investing activities.
PAS 17 (Amendment), Leases (effective from January 1, 2010). The amendment clarifies that when a lease includes both land and building elements, an entity assesses the classification of each element as finance or an operating lease separately in accordance with the general guidance on lease classification set out in PAS 17. The Group currently has no lease agreements that include both land and building.
PAS 18 (Amendment), Revenue (effective from January 1, 2010). The amendment provides guidance on determining whether an entity is acting as a principal or as an agent. Presently, the Group is the principal in all of its business undertakings.
PAS 36 (Amendment), Impairment of Assets (effective from January 1, 2010). PAS 36 clarifies that the largest unit permitted for the purpose of allocating goodwill to cash-generating units for goodwill impairment is the operating segment level defined in PFRS 8 before aggregation.
PAS 38 (Amendment), Intangible Assets (effective from July 1, 2009). The amendment clarifies the description of valuation techniques commonly used by entities when measuring the fair value of intangible assets acquired in a business combination that are not traded in active markets.

- 6 -
PFRS 8 (Amendment), Operating Segments (effective from January 1, 2010). It clarifies that a measure of segment assets should be disclosed only if the amount is regularly provided to the chief operating decision maker (CODM). The Company reports total assets for each of its reportable segments as they are regularly provided to the CODM, hence, does not have any significant effect on the Company’s segment reporting.
(b) Effective in 2010 that are not Relevant to the Group
The following amendment and interpretations to published standards are mandatory for accounting periods beginning on or after January 1, 2010 but are not relevant to the Group’s consolidated financial statements:
PAS 39 (Amendment) : Financial Instruments: Recognition and
Measurement – Eligible Hedged Items PFRS 1 (Amendment) : Additional Exemptions for First-time
Adopters PFRS 2 (Amendment) : Group Cash-settled Shared-based
Payment Transactions Philippine Interpretations IFRIC 9 : Embedded Derivatives – Amendments
to IFRIC 9 and PAS 39 IFRIC 18 : Transfers of Assets from Customers
(c) Effective Subsequent to 2010
There are new PFRS and revisions, amendments, annual improvements and interpretations to existing standards that are effective for periods subsequent to 2010. Management has initially determined the following pronouncements, which the Group will apply in accordance with their transitional provisions, to be relevant to its consolidated financial statements: (i) PAS 12 (Amendment), Income Taxes (effective from January 1, 2012). An
entity is required to measure the deferred tax relating to an asset depending on whether the entity expects to recover the carrying amount of the asset through use or sale. However, when the asset is measured using the fair value model in PAS 40, Investment Property, it can be difficult and subjective to assess whether recovery will be through use or through sale; accordingly, an amendment to PAS 12 was made. As a practical solution to the problem, the amendment introduces a presumption that recovery of the carrying amount will be or normally be through sale. Consequently, Standing Interpretations Committee (SIC) - 21 Income Taxes – Recovery of Revalued Non-Depreciable Assets would no longer apply to investment properties carried at fair value. The amendments also incorporate into PAS 12 the remaining guidance previously contained in SIC-21, which is accordingly withdrawn.

- 7 -
Since the amendment is related to the issuance of PFRS 9 in 2009, management is still evaluating the effect of this amendment to the Company’s financial statements in conjunction with its adoption of PFRS 9 in 2013 (see PFRS 9 below).
(ii) PAS 24 (Revised), Related Party Disclosures (effective from January 1, 2011). Earlier application of the standard, in whole or in part, is permitted but the Group opted not to early adopt the standard. The revised standard clarifies and simplifies the definition of a related party and removes the requirement for government-related entities to disclose details of all transactions with the government and other government-related entities. The Group is currently reviewing the impact of the standard on its related party disclosures in time for its adoption of the revised standard in 2011.
(iii) PAS 32 (Amendment), Financial Instruments: Presentation – Classification of Rights Issues (effective from February 1, 2010). The amendment addresses the accounting for rights issues (rights, options or warrants) that are denominated in a currency other than the functional currency of the issuer. In particular, when the amendment is applied, rights (and similar derivatives) to acquire a fixed number of an entity’s own equity instruments for a fixed price stated in a currency other than the entity’s functional currency, would be equity instruments, provided the entity offers the rights pro rata to all of its existing owners of the same class of its own non-derivative equity instruments. The adoption of this amendment is not expected to have a significant effect on the Group’s financial statements as it does not frequently issue rights that are denominated in currency other than its functional currency.
(iv) Philippine Interpretation IFRIC 14, Prepayments of a Minimum Funding Requirement – Amendment to IFRIC 14 (effective from January 1, 2011). This interpretation addresses unintended consequences that can arise from the previous requirements when an entity prepays future contributions into a defined benefit pension plan. It sets out guidance on when an entity recognizes an asset in relation to a PAS 19, Employee Benefits, surplus for defined benefit plans that are subject to a minimum funding requirement. Management does not expect that its future adoption of the amendment will have a material effect on its consolidated financial statements because it does not usually make substantial advance contributions to its retirement fund.
(v) Philippine Interpretation IFRIC 15, Agreements for Construction of Real Estate,
(effective from January 1, 2012). This interpretation provides guidance on how to determine whether an agreement for the construction of real estate is within the scope of PAS 11, Construction Contracts, or PAS 18, Revenue, and accordingly, when revenue from the construction should be recognized. The main expected change in practice is a shift from recognizing revenue using the percentage-of-completion method (i.e., as a construction progresses, by reference to the stage of completion of the development) to recognizing revenue at a single time (i.e., at completion upon or after delivery). The Group will adopt this interpretation in 2012 and is currently evaluating the impact of such adoption in the consolidated financial statements.

- 8 -
(vi) Philippine Interpretation IFRIC 19, Extinguishing Financial Liabilities with Equity
Instruments (effective from July 1, 2010). It addresses accounting by an entity when the terms of a financial liability are renegotiated and result in the entity issuing equity instruments to a creditor to extinguish all or part of the financial liability. These transactions are sometimes referred to as “debt for equity” exchanges or swaps. The interpretation requires the debtor to account for a financial liability which is extinguished by equity instruments as follows:
the issue of equity instruments to a creditor to extinguish all or part of a financial liability is consideration paid in accordance with PAS 39, Financial Instruments: Recognition and Measurement;
the entity measures the equity instruments issued at fair value, unless this cannot be reliably measured;
if the fair value of the equity instruments cannot be reliably measured, then the fair value of the financial liability extinguished is used; and,
the difference between the carrying amount of the financial liability extinguished and the consideration paid is recognized in profit or loss.
Management has determined that the adoption of the interpretation will not have a material effect on its consolidated financial statements as management does not anticipate to extinguish financial liabilities through equity swap in the subsequent periods.
(vii) PFRS 7 (Amendment), Financial Instruments: Disclosures (effective for annual periods beginning on or after July 1, 2011). The amendments will allow users of financial statements to improve their understanding of transfer transactions of financial assets (e.g., securitizations), including understanding the possible effects of any risks that may remain with the entity that transferred the assets. The amendments also require additional disclosures if a disproportionate amount of transfer transactions are undertaken at the end of a reporting period. The Group believes that adoption of the amendments in 2012 will not have any significant effect on its consolidated financial statements as they only affect disclosures and the Group usually provides adequate information in its financial statements in compliance with disclosure requirements.
(viii) PFRS 9, Financial Instruments (effective from January 1, 2013). PAS 39 will be
replaced by PFRS 9 in its entirety which is being issued in phases. The main phases are (with a separate project dealing with derecognition):
Phase 1: Classification and Measurement
Phase 2: Impairment Methodology
Phase 3: Hedge Accounting To date, the chapters dealing with recognition, classification, measurement and derecognition of financial assets and liabilities have been issued. These chapters are effective for annual periods beginning January 1, 2013. Other chapters dealing with impairment methodology and hedge accounting are still being finalized.

- 9 -
Management is yet to assess the impact that this amendment is likely to have on the consolidated financial statements of the Group. However, it does not expect to implement the amendments until all chapters of PFRS 9 have been published at which time the Group expects it can comprehensively assess the impact of the revised standard.
(ix) 2010 Annual Improvements to PFRS. The FRSC has adopted the Improvements to PFRS 2010 (the 2010 Improvements). Most of these amendments became effective for annual periods beginning on or after July 1, 2010, or January 1, 2011. The 2010 Improvements amend certain provisions of PFRS 3 (Revised 2008), clarify presentation of the reconciliation of each of the components of other comprehensive income and clarify certain disclosure requirements for financial instruments. The Group’s preliminary assessments indicate that the 2010 Improvements will not have a material impact on its consolidated financial statements.
2.3 Basis of Consolidation The Company obtains and exercises control through voting rights. The Group’s consolidated financial statements comprise the accounts of the Company and its subsidiaries as enumerated in Note 1, after the elimination of material intercompany transactions. All intercompany balances and transactions with subsidiaries, including income, expenses, and dividends and unrealized profits and losses from intercompany transactions that are recognized in assets are also eliminated in full. Unrealized profits and losses from intercompany transactions that are recognized in assets are also eliminated in full. In addition, shares of stock of the Company held by the subsidiaries are recognized as treasury stock and these are presented as deduction in the consolidated statement of changes in equity. Any changes in the market values of such shares as recognized separately by the subsidiaries are likewise eliminated in full. Intercompany losses that indicate impairment are recognized in the consolidated financial statements.
The financial statements of subsidiaries are prepared for the same reporting period as the Company, using consistent accounting policies. Adjustments are made to bring into line any dissimilar accounting policies that may exist. The Company accounts for its investments in subsidiaries, associates, interests in jointly controlled operations and non-controlling interest (previously called “minority interest”) as follows: (a) Investments in Subsidiaries
Subsidiaries are all entities over which the Company has the power to control the financial and operating policies generally accompanying a shareholding of more than one half of the voting rights. The existence and effect of potential voting rights that are currently exercisable or convertible are considered when assessing whether the Company controls another entity. Subsidiaries are consolidated from the date the Company obtains control, direct or indirect, until such time that such control ceases.

- 10 -
The acquisition method is applied to account for acquired subsidiaries. This requires recognizing and measuring the identifiable assets acquired, the liabilities assumed and any non-controlling interest in the acquiree. The consideration transferred for the acquisition of a subsidiary is the fair values of the assets transferred, the liabilities incurred and the equity interests issued by the Company, if any. The consideration transferred also includes the fair value of any asset or liability resulting from a contingent consideration arrangement. Acquisition-related costs are expensed as incurred and subsequent change in the fair value of contingent consideration is recognized directly in profit or loss. Identifiable assets acquired and liabilities and contingent liabilities assumed in a business combination are measured initially at their fair values at the acquisition date. On an acquisition-by-acquisition basis, the Group recognizes any non-controlling interest in the acquiree either at fair value or at the non-controlling interest’s proportionate share of the acquiree’s net assets. The excess of the consideration transferred, the amount of any non-controlling interest in the acquiree and the acquisition-date fair value of any previous equity interest in the acquiree over the fair value of the group’s share of the identifiable net assets acquired is recognized as goodwill (see also Note 2.10). If this is less than the fair value of the net assets of the subsidiary acquired in the case of a bargain purchase, the difference is recognized directly in profit or loss as gain.
(b) Investments in Associates
Associates are those entities over which the Company is able to exert significant influence but not control and are neither subsidiaries nor interests in a joint venture. Investments in associates are initially recognized at cost and subsequently accounted for in the consolidated financial statements using the equity method. Acquired investments in associates are also subject to purchase accounting. However, any goodwill or fair value adjustment attributable to the share in the associate is included in the amount recognized as Investment in Associates. All subsequent changes to the share of interest in the equity of the associate are recognized in the Group’s carrying amount of the investment. Changes resulting from the profit or loss generated by the associate are shown as part of Equity in Net Earnings of Associates, Interest and Other Income - net in the Group’s consolidated statement of income and, therefore, affect the net results of the Group. Changes resulting from other comprehensive income of the associates or items recognized directly in the associates’ equity are recognized in other comprehensive income or equity of the Group, as applicable. When the Group’s share of losses in an associate equals or exceeds its interest in the associate, including any other unsecured receivables, the Group does not recognize further losses, unless it has commitments, has incurred obligations or made payments on behalf of the associate.

- 11 -
Unrealized gains on transactions between the Group and its associates are eliminated to the extent of the Group’s interest in the associates. Unrealized losses are also eliminated unless the transaction provides evidence of an impairment of the assets transferred. Accounting policies of associates have been changed where necessary to ensure consistency with the policies adopted by the Group.
(c) Interests in Jointly Controlled Operations
For interests in jointly controlled operations, the Group recognized in its consolidated financial statements the assets that it controls, the liabilities and the expenses that it incurs and its share in the income from the sale of goods or services by the joint venture. The amounts of these related accounts are presented as part of the regular asset and liability accounts and income and expense accounts of the Group.
No adjustment or other consolidation procedures are required for the assets, liabilities, income and expenses of the joint venture that are recognized in the separate financial statements of the venturers.
(d) Transactions with Non-controlling Interest
The Group applies a policy of treating transactions with non-controlling interest as transactions with equity owners of the Group. Any difference between any consideration paid and the relevant share acquired of the carrying value of the net assets of the subsidiary is recognized in equity. Disposals of equity investments to non-controlling interests result in gains and losses that are also recognized in equity. When the Company ceases to have control over a subsidiary, any retained interest in the entity is remeasured to its fair value, with the change in carrying amount recognized in profit or loss. The fair value is the initial carrying amount for the purposes of subsequently accounting for the retained interest as an associate, joint venture or financial asset. In addition, any amounts previously recognized in other comprehensive income in respect of that entity are accounted for as if the Company had directly disposed of the related assets or liabilities. This may mean that amounts previously recognized in other comprehensive income are reclassified to profit or loss. Upon adoption in 2010 of PAS 27 (Revised 2008), Consolidated and Separate Financial Statements, the Group has changed its accounting policy for transactions with non-controlling interests and the accounting for loss of control or significant influence. It has applied the new policy prospectively as required by the standards beginning January 1, 2010. As a result, no adjustments were necessary to any of the amounts previously recognized and reported in the consolidated financial statements. Before the adoption of the revised PAS 27, transactions with non-controlling interests were treated as transactions with parties external to the Group. As such, disposals resulted in gains or losses in profit or loss and purchases resulted in the recognition of goodwill. On disposal or partial disposal, a proportionate interest in reserves attributable to the subsidiary was reclassified to profit or loss or directly to retained earnings.

- 12 -
Also previously, when the Group ceased to have control or significant influence over an entity, the carrying amount of the investment at the date control or significant influence was lost became its cost for the purposes of subsequently accounting for the retained interests as associates, jointly controlled entity or financial assets.
2.4 Foreign Currency Transactions
(a) Functional and Presentation Currency
Except for MCII, RHGI and AGPL, which use the U.S. dollars as their functional currency, the accounting records of the Group are maintained in Philippine pesos. Items included in the consolidated financial statements of the Group are measured using the currency of the primary economic environment in which the Company operates (the functional currency). The consolidated financial statements are presented in Philippine pesos, which is the Company’s functional and presentation currency.
(b) Transactions and Balances
Foreign currency transactions during the year are translated into the functional currency at exchange rates which approximate those prevailing on transaction dates. Foreign currency gains and losses resulting from the settlement of such transactions and from the translation at year-end exchange rates of monetary assets and liabilities denominated in foreign currencies are recognized under Interest and Other Charges – net in the consolidated statement of income.
(c) Translation of Financial Statements of Foreign Subsidiaries and an Associate
The operating results and financial position of MCII and RHGI, which are measured using the U.S. dollars, their functional currency, are translated to Philippine pesos, the Company’s functional currency, as follows:
(i) Assets and liabilities for each statement of financial position presented are
translated at the closing rate at the reporting date;
(ii) Income and expenses for each profit or loss account are translated at the annual average exchange rates (unless this average is not a reasonable approximation of the cumulative effect of the rates prevailing on the transaction dates, in which case income and expenses are translated at the dates of the transactions); and,
(iii) All resulting exchange differences are recognized as a separate component of
equity. On consolidation, exchange differences arising from the translation of the net investment in MCII and RHGI are recognized as Translation Adjustments in the consolidated statement of comprehensive income. As these entities are wholly owned subsidiaries, the translation adjustments are fully allocated to the parent company’s shareholders.
Goodwill arising on the acquisition of a foreign entity is treated as an asset of the foreign entity and translated at the closing rate.

- 13 -
The translation of the financial statements into Philippine pesos should not be construed as a representation that the U.S. dollar amounts could be converted into Philippine peso amounts at the translation rates or at any other rates of exchange.
The Company’s equity in net earnings or loss of AGPL, which is also measured in U.S. dollars, is translated to Philippine pesos using the annual average exchange rates.
2.5 Financial Assets Financial assets are recognized when the Group becomes a party to the contractual terms of the financial instruments. Financial assets other than those designated and effective as hedging instruments are classified into the following categories: financial assets at fair value through profit or loss (FVTPL), loans and receivables, held-to-maturity investments and available-for-sale (AFS) financial assets. Financial assets are assigned to the different categories by management on initial recognition, depending on the purpose for which the investments were acquired. Regular purchases and sales of financial assets are recognized on their trade date. All financial assets that are not classified as at fair value through profit or loss are initially recognized at fair value plus any directly attributable transaction costs. Financial assets carried at fair value through profit or loss are initially recorded at fair value and transaction costs related to it are recognized in profit or loss. The Group’s financial instruments are currently lodged in the following classifications: (a) Financial Assets at FVTPL
This category includes financial assets that are either classified as held for trading or that meet certain conditions and are designated by the entity to be carried at fair value through profit or loss upon initial recognition. All derivatives fall into this category, except for those designated and effective as hedging instruments. Assets in this category are classified as current assets if they are either held for trading or are expected to be realized within 12 months from the end of the reporting period.
Financial assets at FVTPL are measured at fair value, and changes therein are recognized in profit or loss. Financial assets (except derivatives and financial instruments originally designated as financial assets at FVTPL) may be reclassified out of FVTPL category if they are no longer held for the purpose of being sold or repurchased in the near term.
(b) Loans and Receivables
Loans and receivables are non-derivative financial assets with fixed or determinable payments that are not quoted in an active market. They arise when the Group provides money, goods or services directly to a debtor with no intention of trading the receivables. These are included in current assets, except for maturities greater than 12 months after the reporting period which are classified as non-current assets.

- 14 -
Loans and receivables are subsequently measured at amortized cost using the
effective interest method, less impairment losses. Any change in their value is recognized in profit or loss. Impairment loss is provided when there is objective evidence that the Group will not be able to collect all amounts due to it in accordance with the original terms of the receivables. The amount of the impairment loss is determined as the difference between the assets’ carrying amount and the present value of estimated cash flows.
Loans and receivables are presented as Cash and Cash Equivalents, Trade and Other Receivables, and Advances to Associates and Other Related Parties in the consolidated statement of financial position. Cash and cash equivalents are defined as cash on hand, demand deposits and short-term, highly liquid investments readily convertible to known amounts of cash and which are subject to insignificant risk of changes in value. Trade receivables, which generally have one-year to five-year terms, are noninterest-bearing instruments recognized initially at fair value and subsequently stated at amortized cost using the effective interest method, less accumulated impairment losses, if any. An impairment loss is provided when there is objective evidence that the Group will not be able to collect all amounts due according to the original terms of receivables. Significant financial difficulties of the debtor, probability that the debtor will enter bankruptcy or financial reorganization, and default or delinquency in payments are considered indicators that the trade receivable is impaired.
(c) AFS Financial Assets
This includes non-derivative financial assets that are either designated to this category or do not qualify for inclusion in any of the other categories of financial assets. They are included as Investments in Available-for-Sale Securities under non-current assets section in the consolidated statement of financial position unless management intends to dispose of the investment within 12 months of the reporting period.
All AFS financial assets are measured at fair value, unless otherwise disclosed, with changes in value recognized in other comprehensive income, net of any effects arising from income taxes. When the asset is disposed of or is determined to be impaired, the cumulative gain or loss recognized in other comprehensive income is reclassified from Net Unrealized Gains (Losses) on AFS Financial Assets to profit or loss and presented as reclassification adjustment within other comprehensive income.
Reversal of impairment loss is recognized in other comprehensive income, except for financial assets that are debt securities which are recognized in profit or loss only if the reversal can be objectively related to an event occurring after the impairment loss was recognized.
All income and expenses, including impairment losses, relating to financial assets that are recognized in profit or loss are presented as part of Equity in Net Earnings of Associates, Interest and Other Income - net and Interest and Other Charges – net accounts in the consolidated statement of income.

- 15 -
For investments that are actively traded in organized financial markets, fair value is determined by reference to stock exchange-quoted market bid prices at the close of business on the reporting period. For investments where there is no quoted market price, fair value is determined by reference to the current market value of another instrument which is substantially the same or is calculated based on the expected cash flows of the underlying net asset base of the investment.
A financial asset is presented net of a financial liability when the Group: (a) currently has a legally enforceable right to set off the recognized amounts; and (b) intends either to settle on a net basis, or to realize the asset and settle the liability simultaneously.
Non-compounding interest, dividend income and other cash flows resulting from holding financial assets are recognized in profit or loss when earned, regardless of how the related carrying amount of financial assets is measured. Derecognition of financial assets occurs when the rights to receive cash flows from the financial instruments expire or are transferred and substantially all of the risks and rewards of ownership have been transferred.
2.6 Real Estate Transactions
Acquisition costs of raw land intended for future development, including other costs and expenses incurred to effect the transfer of title of the property to the Group, are charged to the Land for Future Development account. These costs are reclassified to the Property Development Costs account when the development of the property starts. Related property development costs are then accumulated in this account.
Borrowing costs on certain loans incurred during the development of the real estate properties are also capitalized by the Group as part of the property development costs.
The cost of real estate property sold before completion of the development is determined based on the actual costs incurred to date plus estimated costs to complete the development of the property. The estimated expenditures for the development of sold real estate property, as determined by the project engineers, are charged to the cost of residential and condominium units sold presented in the consolidated statement of income with a corresponding credit to the liability account Reserve for Property Development account. Property Development Costs and Residential and Condominium Units for Sale are valued at the lower of cost and net realizable value. Net realizable value is the estimated selling price in the ordinary course of business, less estimated costs to complete and the estimated costs necessary to make the sale. The Group recognizes the effect of revisions in the total project cost estimates in the year in which these changes become known. Any impairment loss from a real estate project is charged to operations during the period in which the loss is determined (see also Note 2.15).

- 16 -
2.7 Investment Property Properties held for lease under operating lease agreements, which comprise mainly of land, buildings and condominium units, are classified as Investment Property, and carried at cost, net of accumulated depreciation and any impairment in value, except for land which is not subjected to depreciation, (see also Note 2.15). Depreciation of investment property is computed using the straight-line method over the estimated useful lives of the assets ranging from 5 to 25 years. Investment property is derecognized upon disposal or when permanently withdrawn from use and no future economic benefit is expected from its disposal. Any gain or loss on the retirement or disposal of an investment property is recognized in the consolidated statement of income in the year of retirement or disposal.
2.8 Property and Equipment Property and equipment are carried at acquisition or construction cost less subsequent depreciation, amortization and any impairment losses. The cost of an asset comprises its purchase price and directly attributable costs of bringing the asset to working condition for its intended use. Expenditures for additions, major improvements and renewals are capitalized; expenditures for repairs and maintenance are charged to expenses as incurred. When assets are sold, retired or otherwise disposed of, their cost and related accumulated depreciation and amortization and any impairment losses are removed from the accounts and any resulting gain or loss is reflected in income for the period. Depreciation is computed on the straight-line basis over the estimated useful lives of the assets. Amortization of office and land improvements is recognized over the estimated useful lives of improvements or the term of the lease, whichever is shorter. The depreciation and amortization periods for property and equipment, based on the above policies, are as follows:
Condominium units 10-25 years Office and land improvements 5-20 years Transportation equipment 5 years Office furniture, fixtures and equipment 3-5 years
An asset’s carrying amount is written down immediately to its recoverable amount if the asset’s carrying amount is greater than its estimated recoverable amount (see also Note 2.15). The residual values and estimated useful lives of property and equipment are reviewed, and adjusted if appropriate, at the end of each reporting period. An item of property and equipment is derecognized upon disposal or when no future economic benefits are expected to arise from the continued use of the asset. Any gain or loss arising on derecognition of the asset (calculated as the difference between the net disposal proceeds and the carrying amount of the item) is included in the profit or loss in the year the item is derecognized.

- 17 -
2.9 Financial Liabilities
Financial liabilities of the Group include Interest-bearing Loans and Borrowings, Bonds Payable, Trade and Other Payables and Advances from Other Related Parties. Financial liabilities are recognized when the Group becomes a party to the contractual terms of the instrument. All interest related charges are recognized as expense in profit or loss under the caption Interest and Other Charges – net account in the consolidated statement of comprehensive income. Interest-bearing Loans and Borrowings and Bonds Payable are raised for support of long-term funding of operations. These are recognized at proceeds received, net of direct issue costs. Finance charges, including premiums payable on settlement or redemption and direct issue costs, are charged to profit or loss on an accrual basis using the effective interest method and are added to the carrying amount of the instrument to the extent that these are not settled in the period in which they arise.
Trade and Other Payables are initially recognized at their fair value and subsequently measured at amortized cost less settlement payments. Dividend distributions to shareholders are recognized as financial liabilities when the dividends are approved by the BOD. A financial liability is presented net of a financial asset when the Group: (a) currently has a legally enforceable right to set off the recognized amounts; and (b) intends either to settle on a net basis, or to realize the asset and settle the liability simultaneously. Financial liabilities are derecognized from the consolidated statement of financial position only when the obligations are extinguished either through discharge, cancellation or expiration. 2.10 Business Combination Business acquisitions are accounted for using the acquisition method of accounting (previously called “purchase method”).
Goodwill represents the excess of the cost of an acquisition over the fair value of the Group’s share of the net identifiable assets of the acquired subsidiary at the date of acquisition. Subsequent to initial recognition, goodwill is measured at cost less any accumulated impairment losses. Goodwill is tested annually for impairment and carried at cost less accumulated impairment losses (see also Note 2.15). Impairment losses on goodwill are not reversed. Negative goodwill, which is the excess of the Company’s interest in the net fair value of net identifiable assets acquired over acquisition cost, is charged directly to income.
For the purpose of impairment testing, goodwill is allocated to cash-generating units or groups of cash-generating units that are expected to benefit from the business combination in which the goodwill arose. The cash-generating units or groups of cash-generating units are identified according to operating segment.
Gains and losses on the disposal of an interest in a subsidiary include the carrying amount of goodwill relating to it.

- 18 -
Prior to January 1, 2010, certain items are treated as follows as opposed to how they will now be treated based on the changes in accounting policy of the Group as a result of the adoption of the revised PFRS 3 and PAS 27 (see Note 2.2): (a) Transaction costs directly attributable to business acquisition previously formed part
of the acquisition costs. These costs are now required to be expensed.
(b) The non-controlling interest was previously measured at the proportionate share of the acquiree’s identifiable net assets. There is now an option to measure this at fair value.
(c) Business combinations achieved in stages were accounted for as separate steps or
acquisitions. Any additional shares acquired of interest did not affect previously recognized goodwill. Currently, business combination achieved in stages requires the acquirer to remeasure its previously held equity interest in the acquiree at its acquisition-date fair value and recognize the resulting gain or loss, if any, in profit or loss or other comprehensive income, as appropriate.
(d) Contingent consideration was recognized if, and only if, payment was probable;
i.e. the Group had a present obligation, the economic outflow was more likely than not, and a reliable estimate is determinable. Subsequent adjustment to the contingent consideration was recognized as an adjustment to goodwill. Changes in the fair value of contingent consideration as a result of additional information that existed after the acquisition date are now accounted for as follows:
(i) Contingent consideration classified as equity is not remeasured and its
subsequent settlement is accounted for within equity.
(ii) Contingent consideration classified as an asset or liability that:
is a financial instrument and is within the scope of PFRS 9 or PAS 39 is measured at fair value, with any resulting gain or loss recognized either in profit or loss or in other comprehensive income in accordance with PFRS 9 or PAS 29, as applicable.
is not within the scope of PFRS 9 or PAS 39 is accounted for in accordance with PAS 37 or other PFRSs, as appropriate.
2.11 Segment Reporting
Operating segments are reported in a manner consistent with the internal reporting provided to the Group’s Strategic Steering Committee (SSC); its chief operating decision-maker. The SSC is responsible for allocating resources and assessing performance of the operating segments. In identifying its operating segments, management generally follows the Group’s products and service lines as disclosed in Note 4, which represent the main products and services provided by the Group. Each of these operating segments is managed separately as each of these service lines requires different technologies and other resources as well as marketing approaches. All inter-segment transfers are carried out at arm’s length prices.

- 19 -
The measurement policies the Group uses for segment reporting under PFRS 8 is the same as those used in its consolidated financial statements. In addition, corporate assets which are not directly attributable to the business activities of any operating segment are not allocated to a segment. There have been no changes from prior periods in the measurement methods used to determine reported segment profit or loss.
2.12 Provisions and Contingencies
Provisions are recognized when present obligations will probably lead to an outflow of economic resources and they can be estimated reliably even if the timing or amount of the outflow may still be uncertain. A present obligation arises from the presence of a legal or constructive commitment that has resulted from past events.
Provisions are measured at the estimated expenditure required to settle the present obligation, based on the most reliable evidence available at the end of the reporting period, including the risks and uncertainties associated with the present obligation. Where there are a number of similar obligations, the likelihood that an outflow will be required in settlement is determined by considering the class of obligations as a whole. When time value of money is material, long-term provisions are discounted to their present values using a pretax rate that reflects market assessments and the risks specific to the obligation. Provisions are reviewed at the end of each reporting period and adjusted to reflect the current best estimate. In those cases where the possible outflow of economic resource as a result of present obligations is considered improbable or remote, or the amount to be provided for cannot be measured reliably, no liability is recognized in the consolidated financial statements. Similarly, probable inflows of economic benefits to the Group that do not yet meet the recognition criteria of an asset are considered contingent assets, hence, are not recognized in the consolidated financial statements. On the other hand, any reimbursement that the Group can be virtually certain to collect from a third party with respect to the obligation is recognized as a separate asset not exceeding the amount of the related provision. 2.13 Revenue and Expense Recognition Revenue comprises revenue from the sale of goods and the rendering of services measured by reference to the fair value of consideration received or receivable by the Group for goods sold and services rendered, excluding value-added tax (VAT) and trade discounts. Revenue is recognized to the extent that it is probable that the economic benefits will flow to the Group and the revenue can be reliably measured. The following specific recognition criteria must also be met before revenue is recognized:
(a) Sale of residential and condominium units – For financial reporting purposes, revenues
from transactions covering sales of residential and condominium units are recognized under the percentage-of-completion method. Under this method, realization of gross profit is recognized by reference to the stage of development of the properties, i.e., revenue is recognized in the period in which the work is performed. The unrealized gross profit on a year’s sales is presented as Deferred Gross Profit in the consolidated statement of income; the cumulative unrealized gross profit as of the end of the year is shown as Deferred Income on Real Estate Sales (current and non-current liabilities) in the consolidated statement of financial position.

- 20 -
The sale is recognized when a certain percentage of the total contract price has already been collected. The amount of real estate sales recognized in the consolidated statement of income is equal to the total contract price, net of day-one loss related to the discounting of noninterest-bearing receivables. If the transaction does not yet qualify as sale, the deposit method is applied until all conditions for recording the sale are met. Pending the recognition of sale, payments received from buyers are presented under the Customers’ Deposits account in the liabilities section of the consolidated statement of financial position.
For tax reporting purposes, a modified basis of computing the taxable income for the year based on collections from sales is used by the parent company, MGAI and ECOC, while MDC report revenues for tax purposes based also on the percentage-of-completion method.
Any adjustments relative to previous years’ sales are recorded in the current year as they occur.
(b) Sale of undeveloped land – Revenues on sale of undeveloped land are recognized using
the full accrual method. Under the full accrual method, revenue is recognized when the risks and rewards of ownership on the undeveloped land have passed to the buyer and the amount of revenue can be measured reliably.
(c) Rental and hotel income – Revenue is recognized when the performance of
contractually agreed tasks has been substantially rendered. Rental income is recognized on a straight-line basis over the lease term.
Advance rentals and refundable rental deposits are recorded as deferred rental income. Deferred rental income is measured at amortized cost using the effective interest rate method.
(d) Construction contracts – Revenue is recognized when the performance of contractually
agreed tasks have been substantially rendered using the cost recovery and percentage-of-completion methods. Provisions for estimated losses on uncompleted contracts are made in the period in which such losses are determined.
(e) Interest – Revenue is recognized as the interest accrues taking into account the effective yield on the asset.
(f) Dividends – Revenue is recorded when the stockholders’ right to receive the payment
is established. Costs of residential and condominium units sold before completion of the projects include the acquisition cost of the land, development costs incurred to date, applicable borrowing costs (see Note 2.17) and estimated costs to complete the project, determined based on estimates made by the project engineers (see also Note 2.6). Operating expenses and other costs (other than costs of real estate sold) are recognized in the profit or loss upon utilization of the service or receipt of goods or at the date they are incurred.

- 21 -
2.14 Leases The Group accounts for its leases as follows: (a) Group as Lessee
Leases which do not transfer to the Group substantially all the risks and benefits of ownership of the asset are classified as operating leases. Operating lease payments are recognized as expense in the profit or loss on a straight-line basis over the lease term. Associated costs, such as repairs and maintenance and insurance, are expensed as incurred.
(b) Group as Lessor
Leases which do not transfer to the lessee substantially all the risks and benefits of ownership of the asset are classified as operating leases. Operating lease income is recognized as income in profit or loss on a straight-line basis over the lease term.
The Group determines whether an arrangement is, or contains, a lease based on the substance of the arrangement. It makes an assessment of whether the fulfillment of the arrangement is dependent on the use of a specific asset or assets and the arrangement conveys a right to use the asset. 2.15 Impairment of Non-financial Assets
The Group’s Investments in Associates, Goodwill (included as part of Other Non-current Assets), Investment Property, Land for Future Development, and Property and Equipment are subject to impairment testing. For purposes of assessing impairment, assets are grouped at the lowest levels for which there are separately identifiable cash flows (cash-generating units). As a result, assets are tested for impairment either individually or at the cash-generating unit level. Impairment loss is recognized for the amount by which the asset’s or cash-generating unit’s carrying amount exceeds its recoverable amount. The recoverable amount is the higher of fair value, reflecting market conditions less costs-to-sell, and value-in-use, based on an internal discounted cash flow evaluation. Impairment loss is charged pro-rata to other assets in the cash generating unit. All assets are subsequently reassessed for indications that an impairment loss previously recognized may no longer exist and the carrying amount of the asset is adjusted to the recoverable amount resulting in the reversal of impairment loss.

- 22 -
2.16 Employee Benefits
(a) Post-employment Benefit
Post-employment benefit is provided to employees through a defined benefit plan.
A defined benefit plan is a post-employment plan that defines an amount of post-employment benefit that an employee will receive on retirement, usually dependent on one or more factors such as age, years of service and salary. The legal obligation for any benefits from this kind of post-employment plan remains with the Group, even if plan assets for funding the defined benefit plan have been acquired. Plan assets may include assets specifically designated to a long-term benefit fund, as well as qualifying insurance policies. The Group’s post-employment defined benefit plan covers all regular full-time employees. The pension plan is tax-qualified, non-contributory and administered by a trustee.
The liability recognized in the consolidated statement of financial position for post-employment defined benefit pension plans is the present value of the defined benefit obligation (DBO) at the end of reporting period less the fair value of plan assets, together with adjustments for unrecognized actuarial gains or losses and past service costs. The DBO is calculated annually by independent actuaries using the projected unit credit method. The present value of the DBO is determined by discounting the estimated future cash outflows using interest rates of high quality corporate bonds that are denominated in the currency in which the benefits will be paid and that have terms to maturity approximating to the terms of the related post-employment liability. Actuarial gains and losses are not recognized as an income or expense unless the total unrecognized gain or loss exceeds 10% of the greater of the obligation and related plan assets. The amount exceeding this 10% corridor is charged or credited to profit or loss over the employees’ expected average remaining working lives. Actuarial gains and losses within the 10% corridor are disclosed separately. Past-service costs are recognized immediately in profit or loss, unless the changes to the post-employment plan are conditional on the employees remaining in service for a specified period of time (the vesting period). In this case, the past service costs are amortized on a straight-line basis over the vesting period.
(b) Compensated Absences Compensated absences are recognized for the number of paid leave days (including holiday entitlement) remaining at the end of the reporting period. They are included in the Trade and Other Payables account of the consolidated statement of financial position at the undiscounted amount that the Group expects to pay as a result of the unused entitlement.

- 23 -
2.17 Borrowing Costs
For financial reporting purposes, borrowing costs are recognized as expenses in the period in which they are incurred, except to the extent that they are capitalized. Borrowing costs that are attributable to the acquisition, construction or production of a qualifying asset (i.e., an asset that takes a substantial period of time to get ready for its intended use or sale) are capitalized as part of the cost of such asset. The capitalization of borrowing costs commences when expenditures for the asset are being incurred, borrowing costs are being incurred and activities that are necessary to prepare the asset for its intended use or sale are in progress. Capitalization ceases when substantially all such activities are complete. For income tax purposes, interest and other borrowing costs are charged to expense when incurred. 2.18 Income Taxes Tax expense recognized in profit or loss comprises the sum of deferred tax and current tax not recognized in other comprehensive income or directly in equity, if any. Current income tax assets or liabilities comprise those claims from, or obligations to, fiscal authorities relating to the current or prior reporting period, that are uncollected or unpaid at the reporting period. They are calculated using the tax rates and tax laws applicable to the fiscal periods to which they relate, based on the taxable profit for the year. All changes to current tax assets or liabilities are recognized as a component of tax expense in the profit or loss. Deferred tax is provided, using the liability method on temporary differences at the end of the reporting period between the tax base of assets and liabilities and their carrying amounts for financial reporting purposes. Under the liability method, with certain exceptions, deferred tax liabilities are recognized for all taxable temporary differences and deferred tax assets are recognized for all deductible temporary differences and the carry forward of unused tax losses and unused tax credits to the extent that it is probable that taxable profit will be available against which the deferred income tax asset can be utilized.
The carrying amount of deferred tax assets is reviewed at the end of each reporting period and reduced to the extent that it is probable that sufficient taxable profit will be available to allow all or part of the deferred tax asset to be utilized. Deferred tax assets and liabilities are measured at the tax rates that are expected to apply to the period when the asset is realized or the liability is settled provided such tax rates have been enacted or substantively enacted at the end of the reporting period. Most changes in deferred tax assets or liabilities are recognized as a component of tax expense in the profit or loss. Only changes in deferred tax assets or liabilities that relate to a change in value of assets or liabilities that is charged directly to equity are charged or credited directly to equity.

- 24 -
2.19 Related Party Transactions
Related party transactions are transfers of resources, services or obligations between the entities in the Group and their related parties, regardless whether a price is charged.
Parties are considered to be related if one party has the ability to control the other party or exercise significant influence over the other party in making financial and operating decisions. This includes: (a) individuals owning, directly or indirectly through one or more intermediaries, control or are controlled by, or under common control with the Company; (b) associates; and (c) individuals owning, directly or indirectly, an interest in the voting power of the Company that gives them significant influence over the Company and close members of the family of any such individual.
In considering each possible related party relationship, attention is directed to the substance of the relationship and not merely on the legal form.
2.20 Equity Capital stock is determined using the nominal value of shares that have been issued. Additional paid-in capital includes any premiums received on the issuance of capital stock. Any transaction costs associated with the issuance of shares are deducted from additional paid-in capital, net of any related income tax benefits. Treasury stock is stated at the cost of re-acquiring such shares.
Net unrealized gains (losses) on AFS financial assets represent gains or losses recognized due to changes in fair values of these assets. Accumulated translation adjustments represent the translation adjustments resulting from the conversion of foreign-currency denominated financial statements of certain subsidiaries into the Group’s functional and presentation currency. Retained earnings include all current and prior period results of operations as reported in the consolidated statement of income. 2.21 Earnings Per Share Basic earnings per share is computed by dividing consolidated net profit attributable to equity holders of the parent company by the weighted average number of shares issued and outstanding, adjusted retroactively for any stock dividend declared, stock split and reverse stock split during the current year, if any.
Diluted earnings per share is computed by adjusting the weighted average number of ordinary shares outstanding to assume conversion of potential dilutive common shares. As of December 31, 2010, 2009 and 2008, the Group does not have potential dilutive common shares.

- 25 -
3. SIGNIFICANT ACCOUNTING ESTIMATES AND JUDGMENTS
The Group’s consolidated financial statements prepared in accordance with PFRS
require management to make judgments and estimates that affect amounts reported in the consolidated financial statements and related notes. Judgments and estimates are continually evaluated and are based on historical experience and other factors, including expectations of future events that are believed to be reasonable under circumstances. Actual results may ultimately vary from these estimates.
3.1 Critical Management Judgments in Applying Accounting Policies
In the process of applying the Group’s accounting policies, management has made the
following judgments, apart from those involving estimation, which have the most significant effect on the amounts recognized in the consolidated financial statements:
(a) Impairment of AFS Securities
The determination when an investment is other-than-temporarily impaired requires significant judgment. In making this judgment, the Group evaluates, among other factors, the duration and extent to which the fair value of an investment is less than its cost; and the financial health of and near-term business outlook for the investee, including factors such as industry and sector performance, changes in technology and operational and financing cash flows. Based on the recent evaluation of information and circumstances affecting the Group’s AFS financial assets, management concluded that the assets are not impaired as of December 31, 2010, 2009 and 2008. Future changes in those information and circumstance might significantly affect the carrying amount of the assets.
(b) Distinction Between Investment Properties, Owner-Occupied Properties and Land for Future Development
The Group determines whether a property qualifies as investment property. In making its judgment, the Group considers whether the property generates cash flows largely independently of the other assets held by an entity. Owner-occupied properties generate cash flows that are attributable not only to property but also to other assets used in the production or supply process while Land for Future Development are properties intended solely for future development.
(c) Operating and Finance Leases
The Group has entered into various lease agreements. Critical judgment was exercised by management to distinguish each lease agreement as either an operating or finance lease by looking at the transfer or retention of significant risk and rewards of ownership of the properties covered by the agreements. Failure to make the right judgment will result in either overstatement or understatement of assets and liabilities.
(d) Provisions and Contingencies
Judgment is exercised by management to distinguish between provisions and contingencies. Accounting policies on recognition and disclosure of provision are discussed in Note 2.12 and relevant disclosures of contingencies are presented in Note 26.

- 26 -
3.2 Key Sources of Estimation Uncertainty The following are the key assumptions concerning the future, and other key sources of estimation uncertainty at the end of the reporting period, that have a significant risk of causing a material adjustment to the carrying amounts of assets and liabilities within the next financial year: (a) Revenue Recognition Using the Percentage-of-Completion Method
The Group uses the percentage-of-completion method in accounting for its realized gross profit on real estate sales. The use of the percentage-of-completion method requires the Group to estimate the portion completed using relevant information such as costs incurred to date as a proportion of the total budgeted cost of the project and estimates by engineers and other experts.
(b) Determining Net Realizable Value of Residential and Condominium Units for Sale and
Property Development Costs
In determining the net realizable value of residential and condominium units for sale and property development costs, management takes into account the most reliable evidence available at the times the estimates are made. The future realization of the carrying amounts of real estate for sale and property development costs is affected by price changes in the different market segments as well as the trends in the real estate industry.
These are considered key sources of estimation and uncertainty and may cause significant adjustments to the Company’s Residential and Condominium Units for Sale and Property Development Costs within the next financial year.
Considering the Group’s pricing policy, the net realizable values of real estate units for sale are higher than their related costs.
The carrying value of the Company’s Residential and Condominium Units for Sale and Property Development Costs amounted to P6.3 billion and P3.8 billion, respectively, as of December 31, 2010, P5.7 billion and P3.7 billion, respectively, as of December 31, 2009 and P5.8 billion and P2.8 billion, respectively, as of December 31, 2008.
(c) Principal Assumptions for Management’s Estimation of Fair Value
Investment Property is measured using the cost model. The fair value disclosed in Note 11 to the consolidated financial statements is determined by the Group using the discounted cash flows valuation technique since the information on current or recent prices of investment property is not available. The Group uses assumptions that are mainly based on market conditions existing at each reporting period, such as: the receipt of contractual rentals; expected future market rentals; void periods; maintenance requirements; and appropriate discount rates. These valuations are regularly compared to actual market yield data and actual transactions by the Group and those reported by the market. The expected future market rentals are determined on the basis of current market rentals for similar properties in the same location and condition.
For financial assets, fair value determination is discussed in Note 2.5.

- 27 -
(d) Useful Lives of Property and Equipment and Investment Property
The Group estimates the useful lives of property and equipment and investment property based on the period over which the assets are expected to be available for use. The estimated useful lives of property and equipment and investment property are reviewed periodically and are updated if expectations differ from previous estimates due to physical wear and tear, technical or commercial obsolescence and legal or other limits on the use of the assets. In addition, estimation of the useful lives of property and equipment and investment property is based on collective assessment of industry practice, internal technical evaluation and experience with similar assets. It is possible, however, that future results of operations could be materially affected by changes in estimates brought about by changes in the factors mentioned above. The amounts and timing of recorded expenses for any period would be affected by changes in these factors and circumstances. A reduction in the estimated useful lives of property and equipment and investment property would increase recorded operating expenses and decrease non-current assets.
Investment Property, net of accumulated depreciation, amounted to P9.7 billion, P9.1 billion and P7.1 billion as of December 31, 2010, 2009 and 2008, respectively (see Note 11). Property and equipment, net of accumulated depreciation and amortization, amounted to P360.5 million, P381.2 million and P430.2 million as of December 31, 2010, 2009 and 2008, respectively (see Note 12).
(e) Allowance for Impairment of Trade and Other Receivables
Allowance is made for specific and groups of accounts, where objective evidence of impairment exists. The Group evaluates these accounts based on available facts and circumstances, including, but not limited to, the length of the Group’s relationship with the customers, the customers’ current credit status based on third party credit reports and known market forces, average age of accounts, collection experience and historical loss experience.
Allowance for impairment on Trade and Other Receivables amounted to P3.3 million at the end of 2010, P7.9 million at the end of 2009 and P8.0 million at the end of 2008 (see Note 6).
(f) Valuation of Financial Assets Other than Trade and Other Receivables
The Group carries certain financial assets at fair value, which requires the extensive use of accounting estimates and judgment. In cases when active market quotes are not available, fair value is determined by reference to the current market value of another instrument which is substantially the same or is calculated based on the expected cash flows of the underlying net base of the instrument. The amount of changes in fair value would differ had the Group utilized different valuation methods and assumptions. Any change in fair value of these financial assets and liabilities would affect profit and loss and equity. The carrying amounts of cash and cash equivalents, financial assets at FVTPL and AFS financial assets are disclosed in Notes 5, 7 and 8, respectively.
- 28 -
(g) Realizable Amount of Deferred Tax Assets
The Group reviews its deferred tax assets at the end of each reporting period and reduces the carrying amount to the extent that it is no longer probable that sufficient taxable profit will be available to allow all or part of the deferred tax asset to be utilized.
Net deferred tax assets amounted to P7.9 million as of December 31, 2010 and 2009, and P2.4 million as of December 31, 2008 (see Note 22).
(h) Impairment of Non-financial Assets
Except for intangible assets with indefinite useful lives, PFRS requires that an impairment review be performed when certain impairment indicators are present. The Group’s policy on estimating the impairment of non-financial assets is discussed in detail in Note 2.15. Though management believes that the assumptions used in the estimation of fair values reflected in the consolidated financial statements are appropriate and reasonable, significant changes in these assumptions may materially affect the assessment of recoverable values and any resulting impairment loss could have a material adverse effect on the results of operations.
There were no impairment losses required to be recognized in 2010, 2009 and 2008 based on management’s assessment.
(i) Post-employment Benefit
The determination of the Group’s obligation and cost of post-employment benefits is dependent on the selection of certain assumptions used by actuaries in calculating such amounts. Those assumptions are described in Note 21.2 and include, among others, discount rates, expected return on plan assets and salary increase rate. In accordance with PFRS, actual results that differ from the assumptions are accumulated and amortized over future periods and, therefore, generally affect the recognized expense and recorded obligation in such future periods. The retirement benefit obligation amounted to P116.0 million, P90.8 million and P81.2 million as of December 31, 2010, 2009 and 2008, respectively (see Note 21.2).

- 29 -
4. SEGMENT INFORMATION
4.1 Business Segments
The Group’s operating businesses are organized and managed separately according to the nature of products and services provided, with each segment representing a strategic business unit that offers different products and serves different markets. The Group is engaged in the development of residential and office units including urban centers integrating office, residential and commercial components. The Real Estate segment pertains to the development and sale of residential and office developments. The Rental segment includes leasing of office and commercial spaces. The Hotel Operations segment relates to the management of hotel business operations. The Corporate and Others segment includes marketing services, general and corporate income and expense items. Segment accounting policies are the same as the policies described in Note 2.11. The Group generally accounts for intersegment sales and transfers as if the sales or transfers were to third parties at current market prices.
4.2 Segment Assets and Liabilities
Segment assets are allocated based on their physical location and use or direct association with a specific segment and they include all operating assets used by a segment and consist principally of operating cash, receivables, real estate inventories, property and equipment, and investment property, net of allowances and provisions. Similar to segment assets, segment liabilities are also allocated based on their use or direct association with a specific segment. Segment liabilities include all operating liabilities and consist principally of accounts, wages, taxes currently payable and accrued liabilities.
4.3 Intersegment Transactions
Segment revenues, expenses and performance include sales and purchases between business segments. Such sales and purchases are eliminated in consolidation.
4.4 Analysis of Segment Information
The following tables present revenue and profit information regarding industry segments for the years ended December 31, 2010, 2009 and 2008 and certain asset and liability information regarding segments at December 31, 2010, 2009 and 2008.

- 30 -
2010
Hotel Corporate Real Estate Rental Operations and Others Elimination Consolidated
TOTAL REVENUES
Sales to external customers P 15,399,973,187 P 2,694,310,554 P 232,757,023 P 808,477,515 P - P 19,135,518,279
Intersegment sales - 52,014,865 - 179,885,935 ( 231,900,800 ) -
Total revenues P 15,399,973,187 P 2,746,325,419 P 232,757,023 P 988,363,450 (P 231,900,800 ) P 19,135,518,279
RESULTS
Segment results P 3,042,478,040 P 2,062,875,628 P 38,125,649 P 752,871,759 P 25,888,854 P 5,922,239,930
Unallocated expenses ( 117,450,295)
Income from operations 5,804,789,635
Interest income - - - 835,944,617 - 835,944,617
Finance costs - - - ( 516,440,321) - ( 516,440,321)
Equity in net earnings of associates - - - 442,281,306 - 442,281,306
Fair value gains – net - - - 83,500,000 - 83,500,000
Dividend income - - - 40,630,134 - 40,630,134
Foreign currency gains – net - - - 3,908,758 - 3,908,758
Profit before tax 6,694,614,129
Tax expense ( 1,609,101,525)
Net profit before non-controlling
interest 5,085,512,604
Non-controlling interest share in
net profit ( 59,332,029)
Net profit attributable to
parent company’s shareholders P 5,026,180,575
ASSETS AND LIABILITIES
Segment assets P 63,241,644,678 P 5,919,037,407 P 178,376,810 P 13,025,093,222 P - P 82,364,152,117
Investments in and advances
to associates and other
related parties - net - - - 13,671,332,490 - 13,671,332,490
Unallocated assets - - - 994,038,204 - 994,038,204
Total assets P 63,241,644,678 P 5,919,037,407 P 178,376,810 P 27,690,463,916 P - P 97,029,522,811
Segment liabilities P 32,027,981,425 P 1,530,032,850 P 78,854,006 P 4,873,517,893 P - P 38,510,386,174
OTHER SEGMENT INFORMATION
Project and capital expenditures P 11,043,392,051 P 2,364,995,996 P 27,258,790 P 24,528,367 P - P 13,460,175,204
Depreciation and amortization 18,632,235 378,357,035 22,631,161 23,583,208 - 443,203,639

- 31 -
2009
Hotel Corporate Real Estate Rental Operations and Others Elimination Consolidated
TOTAL REVENUES
Sales to external customers P 14,566,449,663 P 2,000,477,427 P 216,143,646 P 59,044,461 P - P 16,842,115,197
Intersegment sales - 62,047,938 - 71,112,463 ( 133,160,401 ) -
Total revenues P 14,566,449,663 P 2,062,525,365 P 216,143,646 P 130,156,924 (P 133,160,401 ) P 16,842,115,197
RESULTS
Segment results P 3,721,385,850 P 1,535,784,727 P 44,321,641 P 31,021,942 P 25,888,853 P 5,358,403,013
Unallocated expenses ( 206,001,589)
Income from operations 5,152,401,424
Interest income - - - 690,238,144 - 690,238,144
Finance costs - - - ( 556,326,705) - ( 556,326,705)
Equity in net earnings of associates - - - 157,958,213 - 157,958,213
Dividend income - - - 44,247,127 - 44,247,127
Fair value gains – net - - - 24,100,000 - 24,100,000
Foreign currency loss – net - - - ( 8,464,596) - ( 8,464,596)
Profit before tax 5,504,153,607
Tax expense ( 1,437,541,131)
Net profit before non-controlling
interest 4,066,612,476
Non-controlling interest share in
net profit ( 11,211,285)
Net profit attributable to
parent company’s shareholders P 4,055,401,191
ASSETS AND LIABILITIES
Segment assets P 55,378,759,577 P 5,072,588,995 P 182,070,130 P 11,172,314,788 P - P 71,805,733,490
Investments in and advances
to associates and other
related parties - net - - - 12,665,714,849 - 12,665,714,849
Unallocated assets - - - 782,324,106 - 782,324,106
Total assets P 55,378,759,577 P 5,072,588,995 P 182,070,130 P 24,620,353,743 P - P 85,253,772,445
Segment liabilities P 28,887,111,381 P 1,102,204,707 P 51,504,125 P 5,377,235,672 P - P 35,418,055,885
OTHER SEGMENT INFORMATION
Project and capital expenditures P 8,450,184,072 P 2,212,988,366 P 36,106,669 P 1,205,765 P - P 10,700,484,872
Depreciation and amortization 13,553,509 325,257,171 7,729,572 19,255,338 - 365,795,590

- 32 -
2008 Hotel Corporate Real Estate Rental Operations and Others Elimination Consolidated
TOTAL REVENUES
Sales to external customers P 13,795,323,274 P 1,300,910,039 P 246,919,573 P 310,557,611 P - P 15,653,710,497
Intersegment sales - 76,532,769 - 76,702,719 ( 153,235,488 ) -
Total revenues P 13,795,323,274 P 1,377,442,808 P 246,919,573 P 387,260,330 (P 153,235,488 ) P 15,653,710,497
RESULTS
Segment results P 3,081,106,749 P 998,942,887 P 54,807,975 P 194,364,735 P 25,888,852 P 4,355,111,198
Unallocated expenses ( 267,810,547)
Income from operations 4,087,300,651
Interest income - - - 1,486,040,236 - 1,486,040,236
Finance costs - - - ( 766,416,111) - ( 766,416,111)
Foreign currency loss – net - - - ( 176,988,434) - ( 176,988,434)
Equity in net earnings of associates - - - 109,464,838 - 109,464,838
Dividend income - - - 48,880,085 - 48,880,085
Fair value losses – net - - - ( 42,653,717) - ( 42,653,717)
Profit before tax 4,745,627,548
Tax expense ( 951,101,304)
Net profit before non-controlling
interest 3,794,526,244
Non-controlling interest share in
Net profit ( 23,399,237)
Net profit attributable to
parent company’s shareholders P 3,771,127,007
ASSETS AND LIABILITIES
Segment assets P 40,952,630,176 P 3,013,855,655 P 167,402,312 P 9,289,609,706 P - P 53,423,497,849
Investment in and advances
to associates and other
related parties - net - - - 10,982,670,783 - 10,982,670,783
Unallocated assets - - - 495,106,830 - 495,106,830
Total assets P 40,952,630,176 P 3,013,855,655 P 167,402,312 P 20,767,387,319 P - P 64,901,275,462
Segment liabilities P 19,236,885,198 P 553,618,261 P 54,366,165 P 5,363,454,991 P - P 25,208,324,615
OTHER SEGMENT INFORMATION
Project and capital expenditures P 8,688,100,952 P 1,978,303,096 P 1,875,428 P 142,646,426 P - P 10,810,925,902
Depreciation and amortization 17,368,238 182,199,244 796,349 38,470,492 - 238,834,323

- 33 -
5. CASH AND CASH EQUIVALENTS
Cash and cash equivalents include the following components as of December 31:
2010 2009 2008
Cash on hand and in banks P 1,109,041,947 P 6,384,861,752 P 731,319,856
Short-term placements 20,922,542,996 14,491,143,721 11,594,013,208
P 22,031,584,943 P 20,876,005,473 P 12,325,333,064
Cash in banks and short-term placements generally earn interest at rates based on daily bank deposit rates. Short-term placements are made for varying periods between 15 to 30 days and earn effective interest ranging from 3.5% to 4.8% in 2010, 3.5% to 8.5% in 2009 and 3.0% to 8.5% in 2008.
6. TRADE AND OTHER RECEIVABLES
This account is composed of the following:
2010 2009 2008
Current:
Trade receivables P 12,899,356,339 P 9,938,940,019 P 11,012,739,154
Allowance for impairment ( 3,324,211) ( 7,895,021) ( 8,043,660)
12,896,032,128 9,931,044,998 11,004,695,494
Advances to contractors
and suppliers 710,223,731 570,214,061 382,752,035
Others 527,545,525 248,384,875 32,677,850
14,133,801,384 10,749,643,934 11,420,125,379
Non-current:
Trade receivables 15,617,214,463 13,533,275,932 6,660,823,617
Others - 1,026,423 1,026,424
15,617,214,463 13,534,302,355 6,661,850,041
P 29,751,015,847 P 24,283,946,289 P 18,081,975,420
A reconciliation of the allowance for impairment at the beginning and end of 2010, 2009 and 2008 is shown below.
2010 2009 2008
Balance at beginning of year P 7,895,021 P 8,043,660 P 3,502,310
Write-off of trade receivables
previously provided
with allowance ( 4,570,810) ( 937,382 ) ( 1,783,690)
Impairment loss during the year - 788,743 6,325,040
P 3,324,211 P 7,895,021 P 8,043,660

- 34 -
The installment period of sales contracts averages to five years. Trade receivables are noninterest-bearing and are remeasured at amortized cost using the effective interest rate of 10%. Interest income recognized amounted to P933.4 million in 2010, P714.2 million in 2009 and P612.3 million in 2008; these amounts are presented as Interest Income on Real Estate Sales in the consolidated statements of income.
All trade receivables are subject to credit risk exposure. However, the Group does
not identify specific concentrations of credit risk with regard to Trade and Other Receivables as the amounts recognized resemble a large number of receivables from various customers. Certain receivables from trade customers are covered by postdated checks. Certain past due accounts are not provided with allowance for impairment to the extent of the expected market value of the property sold to the customer. The title to the real estate properties remains with the Group until the receivables are fully collected.
The fair values of trade and other receivables are disclosed in Note 28.
7. FINANCIAL ASSETS AT FAIR VALUE THROUGH PROFIT OR LOSS
This account consists of investments in marketable securities which are presented at their fair values determined directly by reference to published prices quoted in an active market as of December 31, 2010, 2009 and 2008. The changes in fair values of these financial assets are presented as Fair Value Gains - net in 2010 and 2009 under Equity in Net Earnings of Associates, Interest and Other Income - net (see Note 19) and as Fair Value Losses - net in 2008 under Interest and Other Charges - net (see Note 20) in the consolidated statements of income. RHGI has sold certain marketable securities and recognized a net loss amounting to P5.3 million in 2008 which amounts are presented as part of Miscellaneous - net under the Interest and Other Charges account in the 2008 consolidated statement of income (see Note 20). In addition, RHGI entered into forward contracts covering U.S. dollars in 2007, which were settled in 2008. Foreign exchange losses on this transaction are presented as part of Foreign Currency Losses - net under Interest and Other Charges - net account in the 2008 consolidated statement of income (see Note 20).
8. INVESTMENTS IN AVAILABLE-FOR-SALE SECURITIES
AFS financial assets comprise the following as of December 31:
2010 2009 2008
Investment in equity instruments P 5,535,716,669 P 2,778,231,823 P 1,076,571,258
Investment in debt instruments 675,467,827 148,299,890 3,273,653,414
P 6,211,184,496 P 2,926,531,713 P 4,350,224,672
The fair values of AFS financial assets have been determined directly by reference to published prices in an active market.

- 35 -
The aggregate cost of AFS financial assets as of December 31, 2010, 2009 and 2008 amounted to P2.4 billion, P2.8 billion and P5.7 billion, respectively. The fair value gains/losses arising from these financial assets which significantly comprised the movements in the carrying amounts of AFS, are reported as part of Net Unrealized Gains (Losses) on AFS Financial Assets in the consolidated statements of comprehensive income.
A portion of the AFS financial assets of RHGI placed with a certain bank is covered by a set-off provision. The amount of compensating loan set-off against AFS financial assets amounted to U.S.$3.1 million (P145.8 million) and U.S.$6.9 million (P325.6 million) as of December 31, 2009 and 2008, respectively. There was no compensating loan set-off against AFS financial assets in 2010. A portion of the AFS financial assets are owned by RHGI and FTPHI, which are wholly owned subsidiaries of the Company. Hence, the movements in the AFS financial assets arising from fair value gains/losses are fully allocated to the parent company’s shareholders.
9. ADVANCES TO LANDOWNERS AND JOINT VENTURES
The Group enters into numerous joint venture agreements for the joint development of various projects. These are treated as jointly controlled operations; there were no separate entities created by these joint venture agreements. The joint venture agreements stipulate that the Group’s joint venturer shall contribute parcels of land and the Group shall be responsible for the planning, conceptualization, design, demolition of existing improvements, construction, financing and marketing of condominium to be constructed on the properties. Costs incurred by the Group for these projects are recorded under the Property Development Costs account in the consolidated statements of financial position (see Note 2.6). The amounts of other related accounts are presented as part of the regular asset and liability accounts and income and expense accounts of the Group (see Note 2.3) The Group also grants noninterest-bearing, secured cash advances to a number of landowners and joint ventures under agreements they entered into with landowners covering the development of certain parcels of land. Under the terms of the agreements, the Group, in addition to providing specified portion of total project development costs, also commits to advance mutually agreed-upon amounts to the landowners to be used for pre-development expenses such as the relocation of existing occupants.
Repayment of these advances shall be made upon completion of the project development either in the form of the developed lots corresponding to the owner’s share in saleable lots or in the form of cash to be derived from the sales of the landowner’s share in the saleable lots and residential and condominium units. Total amount of advances made by the Group less repayments, is presented as part of the Advances to Landowners and Joint Ventures account in the consolidated statements of financial position.

- 36 -
The net commitment for cash advances under the joint venture agreements amounts to:
2010 2009 2008
Total commitment for cash advances P 1,500,000,000 P 958,720,120 P 247,730,000
Total cash advances granted ( 1,500,000,000) ( 958,720,120 ) ( 247,730,000)
P - P - P -
The net commitment for construction expenditures amounts to:
2010 2009 2008
Total commitment for
construction expenditures P 7,911,278,595 P 6,999,089,356 P 6,164,100,646
Total expenditures incurred ( 5,505,759,467) ( 4,014,820,948 ) ( 3,244,787,600)
P 2,405,519,128 P 2, 984,268,408 P 2,919,313,046
The Group’s interests in jointly-controlled operations and projects range from 72% to 95% in 2010, 2009 and 2008. The listing and description of the Group’s jointly controlled projects are as follows:
McKinley Hills
Newport City
Manhattan Parkway Residences
Greenbelt Excelsior
Forbeswood Heights
Forbeswood Parklane 1 & 2
The aggregate amounts of the current assets, long-term assets, current liabilities, long-term liabilities, income and expenses as of and for the years ended December 31, 2010, 2009 and 2008 related to the Group’s interests in joint ventures are not presented as the joint ventures in which the Group is involved are not jointly-controlled entities (see Note 2.3). As of December 31, 2010 and 2009, the Group either has no other contingent liabilities with regard to these joint ventures or has assessed that the probability of loss that may arise from contingent liabilities is remote.

- 37 -
10. INVESTMENTS IN AND ADVANCES TO ASSOCIATES AND OTHER RELATED PARTIES
The details of investments in and advances to associates and other related parties, are as follows:
% Interest Held
as of End of 2010
(see Note 1) 2010 2009 2008
Investments in associates – at equity
Acquisition costs:
EELHI 48.38% P 5,726,128,415 P 5,726,128,415 P 5,726,128,415
SHDI 42.48% 875,445,000 875,445,000 875,445,000
PTHDC 40.00% 64,665,000 64,665,000 64,665,000
GPMAI 39.83% 98,806,194 - -
AGPL 39.44% 2,463,056,417 1,583,687,182 -
TIHGI 10.00% 570,000,000 1,000,000,000 1,000,000,000
9,798,101,026 9,249,925,597 7,666,238,415
Accumulated equity in comprehensive
income :
Balance at beginning of year 1,403,518,676 1,245,560,463 1,148,146,700
Dividends received from TIHGI ( 90,736,000) - -
Equity in net earnings
for the year (see Note 19) 442,281,307 157,958,213 109,464,838
Share in other comprehensive income 71,176,649 - -
Deduction due to sale of investment - - ( 12,051,075)
Balance at end of year 1,826,240,632 1,403,518,676 1,245,560,463
Advances to associates and other related parties
(see Note 23.3) 2,046,990,832 2,012,270,576 2,070,871,905
P 13,671,332,490 P 12,665,714,849 P 10,982,670,783
The shares of stock of EELHI and SHDI are listed in the PSE. The total quoted or market value of investments in these two listed associates amounted to P3.3 billion, P2.7 billion and P2.4 billion as of December 31, 2010, 2009 and 2008, respectively. Overall, the related book values of the Group’s holdings in all of its associates are substantially in excess of both the investments’ cost and market values, hence, management has assessed that the recognition of impairment losses was not deemed necessary. On April 30, 2008, AGI, TIHGI and the Company entered into a Deed of Exchange to swap certain real estate properties for TIHGI’s shares of stock. The Company and AGI initially received 6.125 billion shares of TIHGI in exchange for parcels of land and the hotel and office buildings with approximate aggregate values of P6.125 billion at the time of exchange. Several transactions with other related parties covering the TIHGI’s shares held by the Company took place thereafter, and as a result of these transactions, the Company holds 1.0 billion shares or 10% ownership in TIHGI as of December 31, 2010, 2009 and 2008.

- 38 -
In August 2010, TIHGI amended its Articles of Incorporation to convert P9.9 billion or 99% of its common shares to redeemable, voting and participating preferred shares. This was approved by the Securities and Exchange Commission on October 14, 2010. Consequently, the investment of the Company in TIHGI of 1.0 billion common shares was converted to 10.0 million common shares and 990.0 million preferred shares of TIHGI. As this was just a conversion of shares and did not change the Company’s 10% ownership in TIHGI, no gain or loss from the transaction was recorded in the Company’s books. In November 2010, TIHGI redeemed 430.0 million preferred shares held by the Company at par value. There are no outstanding receivables as of December 31, 2010 arising from TIHGI’ redemption of preferred shares held by the Company. Despite of the 10% ownership, the Company considers TIHGI as an associate due to the presence of significant influence over TIHGI’s operations since two out of the five directors of TIHGI are also members of the Company’s BOD. In 2010, the Company received cash dividends from TIHGI amounting to P90.7 million. The amount received is considered a return of investment and is presented as deduction from the Accumulated Equity in Comprehensive Income shown in the previous table presented. In October 2010, AGPL issued additional 57.7 million common shares. Out of the total number of shares that AGPL issued, RHGI, a 100% owned subsidiary of the Company, subscribed to only 19.1 million shares (lesser than its proportionate share) at a cost of P20.4 million. This resulted in the decline of RHGI’s percentage ownership in AGPL to 39.44% in 2010. Also, in October 2010, GPMAI issued additional 27.0 million shares to EELHI resulting in the decline of TDI’s percentage ownership in GPMAI to 48.08% and MREI’s and the Company’s indirect ownership to 28.85% and 39.83%, respectively. Accordingly, GPMAI was deconsolidated and treated as an associate as of December 31, 2010. GPMAI’s issuance of new shares was made at book value, hence, no dilution gain or loss was recognized. The balance of the Accumulated Equity in Comprehensive Income of P1.8 billion, P1.4 billion and P1.3 billion as of December 31, 2010, 2009 and 2008, respectively, which is mainly lodged in the Group’s Retained Earnings as of those dates, is not available for declaration as dividend. The aggregated amounts of assets, liabilities and net profit (loss) of the associates are as follows:
Net Profit
Assets Liabilities Revenues (Loss)
2010:
EELHI P 27,830,579,495 P 8,313,108,199 P 2,313,768,713 P 225,222,976
SHDI 574,744,907 463,771,003 8,263,029 4,730,857
PTHDC 1,137,581,235 1,005,298,094 64,128 ( 178,157 )
GPMAI 748,619,721 157,143,964 252,107,804 165,840,133
AGPL 6,352,873,392 7,846,770 205,630,984 95,518,781
TIHGI 41,043,334,923 27,086,278,378 14,876,965,463 3,220,646,817
P 77,687,733,673 P 37,033,446,408 P 17,656,800,121 P 3,711,781,407

- 39 -
Net Profit
Assets Liabilities Revenues (Loss)
2009:
EELHI P 25,401,749,839 P 7,459,494,647 P 2,171,236,867 P 155,035,423
AGPL 2,786,358,428 8,288,592 242,641,296 182,881,935
SHDI 569,630,769 463,451,254 7,987,805 3,917,117
PTHDC 1,142,753,539 1,010,292,242 350,027 21,676
TIHGI 23,125,565,794 7,186,796,066 2,305,037,279 5,430,402
P 53,026,058,369 P 16,128,322,801 P 4,727,253,274 P 347,286,553
2008:
EELHI P 26,023,446,296 P 8,567,842,527 P 1,978,904,355 P 215,545,491
SHDI 581,036,188 478,773,790 9,716 ( 74,297,845 )
PTHDC 1,143,271,195 1,010,831,573 4,558,843 663,210
TIHGI 16,072,026,556 138,687,230 303,496,167 115,680,708
P 43,819,780,235 P 10,196,135,120 P 2,286,969,081 P 257,591,564
11. INVESTMENT PROPERTY
The gross carrying amounts and accumulated depreciation at the beginning and end of 2010, 2009 and 2008 are shown below.
Condominium
Land Buildings Units Total
December 31, 2010
Cost P 1,412,634,527 P 5,878,941,281 P 3,954,063,399 P 11,245,639,207
Accumulated depreciation - ( 930,323,176) ( 598,785,986 ) ( 1,529,109,162)
Net carrying amount P 1,412,634,527 P 4,948,618,105 P 3,355,277,413 P 9,716,530,045
December 31, 2009
Cost P 1,427,094,149 P 5,621,910,029 P 3,219,937,754 P 10,268,941,932
Accumulated depreciation - ( 724,584,211) ( 438,572,652 ) ( 1,163,156,863)
Net carrying amount P 1,427,094,149 P 4,897,325,818 P 2,781,365,102 P 9,105,785,069
December 31, 2008
Cost P 1,288,942,006 P 3,869,991,271 P 2,865,320,562 P 8,024,253,839
Accumulated depreciation - ( 581,313,122) ( 302,621,153 ) ( 883,934,275)
Net carrying amount P 1,288,942,006 P 3,288,678,149 P 2,562,699,409 P 7,140,319,564
January 1, 2008
Cost P 1,222,942,006 P 3,862,879,850 P 1,112,886,197 P 6,198,708,053
Accumulated depreciation - ( 481,146,675) ( 232,318,198 ) ( 713,464,873)
Net carrying amount P 1,222,942,006 P 3,381,733,175 P 880,567,999 P 5,485,243,180

- 40 -
A reconciliation of the carrying amounts at the beginning and end of 2010, 2009 and 2008 of investment property is shown below.
Condominium
Land Buildings Units Total
Balance at January 1, 2010, net of
accumulated depreciation P 1,427,094,149 P 4,897,325,818 P 2,781,365,102 P 9,105,785,069
Additions - 257,140,943 734,125,645 991,266,588
Transfers - ( 109,691) - ( 109,691 )
Investment property of a
deconsolidated subsidiary ( 14,459,622 ) - - ( 14,459,622 )
Depreciation charges for the year - ( 205,738,965) ( 160,213,334 ) ( 365,952,299 )
Balance at December 31, 2010,
net of accumulated depreciation P 1,412,634,527 P 4,948,618,105 P 3,355,277,413 P 9,716,530,045
Balance at January 1, 2009, net of
accumulated depreciation P 1,288,942,006 P 3,288,678,149 P 2,562,699,409 P 7,140,319,564
Additions 138,152,143 1,751,918,758 371,192,706 2,261,263,607
Transfers - - ( 12,168,571 ) ( 12,168,571)
Depreciation charges for the year - ( 143,271,089) ( 140,358,442 ) ( 283,629,531)
Balance at December 31, 2009,
net of accumulated depreciation P 1,427,094,149 P 4,897,325,818 P 2,781,365,102 P 9,105,785,069
Balance at January 1, 2008, net of
accumulated depreciation P 1,222,942,006 P 3,381,733,175 P 880,567,999 P 5,485,243,180
Additions - 7,111,421 1,752,434,365 1,759,545,786
Transfers 66,000,000 - - 66,000,000
Depreciation charges for the year - ( 100,166,447) ( 70,302,955 ) ( 170,469,402)
Balance at December 31, 2008,
net of accumulated depreciation P 1,288,942,006 P 3,288,678,149 P 2,562,699,409 P 7,140,319,564
Certain properties held for lease with a net book value of P2.0 billion as of December 31, 2007 were used as collateral for ECOC’s Interest-bearing Loan (see Note 14). In 2008, ECOC asked for the partial release of the mortgage which was approved by the creditor. As of December 31, 2010, 2009 and 2008, the carrying value of investment properties that remained as collateral to this loan amounted to P800.0 million. Rental income earned from these properties amount to P2.7 billion, P2.0 billion and P1.3 billion in 2010, 2009 and 2008, respectively, and are shown as Rental Income in the consolidated statements of income. The direct operating costs, exclusive of depreciation, incurred by the Group relating to the investment property amounted to P91.4 million in 2010, P94.7 million in 2009 and P109.7 million in 2008. The operating lease commitments of the Group as a lessor are fully disclosed in Note 26.1. The fair market values of these properties are P52.9 billion, P36.1 billion and P22.7 billion as of December 31, 2010, 2009 and 2008, respectively. These are determined by calculating the present value of the cash inflows anticipated until the end of the life of the investment property using a discount rate of 10% in 2010, 2009 and 2008.
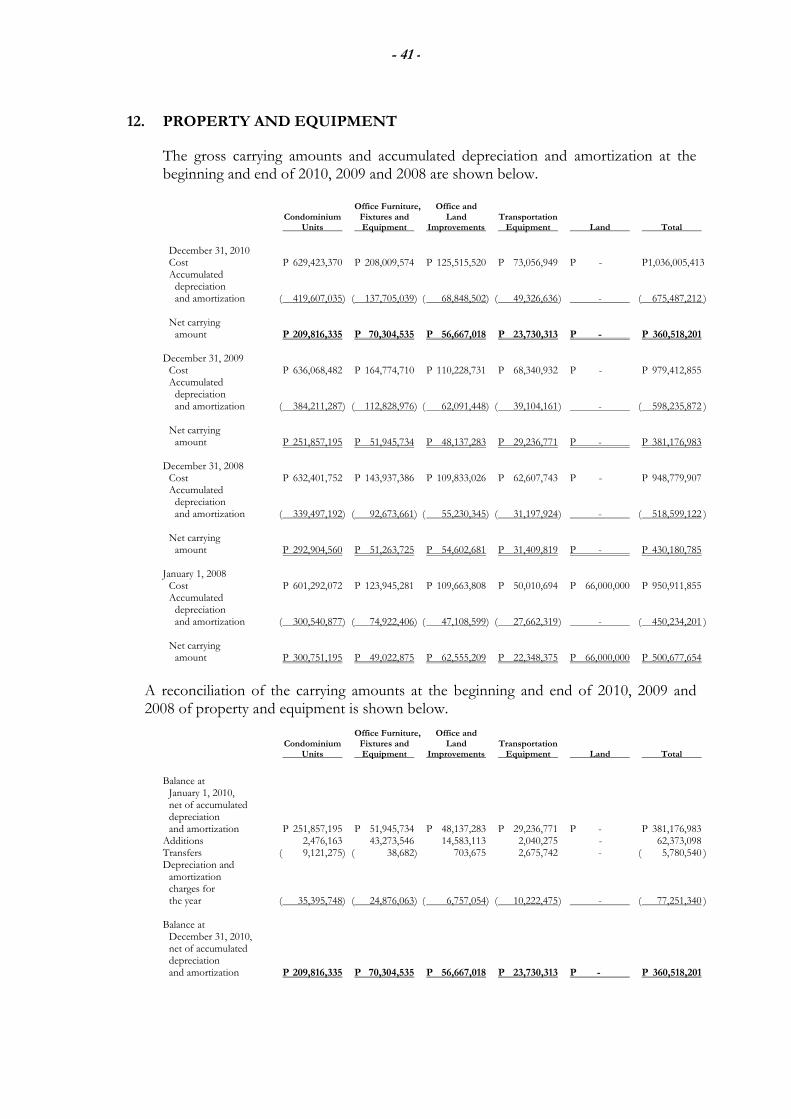
- 41 -
12. PROPERTY AND EQUIPMENT
The gross carrying amounts and accumulated depreciation and amortization at the beginning and end of 2010, 2009 and 2008 are shown below.
Office Furniture, Office and Condominium Fixtures and Land Transportation Units Equipment Improvements Equipment Land Total
December 31, 2010
Cost P 629,423,370 P 208,009,574 P 125,515,520 P 73,056,949 P - P1,036,005,413 Accumulated depreciation and amortization ( 419,607,035) ( 137,705,039) ( 68,848,502) ( 49,326,636 ) - ( 675,487,212 ) Net carrying amount P 209,816,335 P 70,304,535 P 56,667,018 P 23,730,313 P - P 360,518,201
December 31, 2009 Cost P 636,068,482 P 164,774,710 P 110,228,731 P 68,340,932 P - P 979,412,855 Accumulated depreciation and amortization ( 384,211,287) ( 112,828,976) ( 62,091,448) ( 39,104,161 ) - ( 598,235,872 ) Net carrying amount P 251,857,195 P 51,945,734 P 48,137,283 P 29,236,771 P - P 381,176,983
December 31, 2008
Cost P 632,401,752 P 143,937,386 P 109,833,026 P 62,607,743 P - P 948,779,907 Accumulated depreciation and amortization ( 339,497,192) ( 92,673,661) ( 55,230,345) ( 31,197,924 ) - ( 518,599,122 ) Net carrying amount P 292,904,560 P 51,263,725 P 54,602,681 P 31,409,819 P - P 430,180,785
January 1, 2008 Cost P 601,292,072 P 123,945,281 P 109,663,808 P 50,010,694 P 66,000,000 P 950,911,855 Accumulated depreciation and amortization ( 300,540,877) ( 74,922,406) ( 47,108,599) ( 27,662,319 ) - ( 450,234,201 ) Net carrying amount P 300,751,195 P 49,022,875 P 62,555,209 P 22,348,375 P 66,000,000 P 500,677,654
A reconciliation of the carrying amounts at the beginning and end of 2010, 2009 and 2008 of property and equipment is shown below.
Office Furniture, Office and Condominium Fixtures and Land Transportation Units Equipment Improvements Equipment Land Total
Balance at January 1, 2010, net of accumulated depreciation and amortization P 251,857,195 P 51,945,734 P 48,137,283 P 29,236,771 P - P 381,176,983 Additions 2,476,163 43,273,546 14,583,113 2,040,275 - 62,373,098 Transfers ( 9,121,275) ( 38,682) 703,675 2,675,742 - ( 5,780,540 ) Depreciation and amortization charges for the year ( 35,395,748) ( 24,876,063) ( 6,757,054) ( 10,222,475 ) - ( 77,251,340 ) Balance at December 31, 2010, net of accumulated depreciation and amortization P 209,816,335 P 70,304,535 P 56,667,018 P 23,730,313 P - P 360,518,201

- 42 -
Office Furniture, Office and Condominium Fixtures and Land Transportation Units Equipment Improvements Equipment Land Total
Balance at January 1, 2009, net of accumulated depreciation and amortization P 292,904,560 P 51,263,725 P 54,602,681 P 31,409,819 P - P 430,180,785 Additions 3,666,730 20,837,324 395,705 8,262,498 - 33,162,257 Depreciation and amortization charges for the year ( 44,714,095) ( 20,155,315) ( 6,861,103) ( 10,435,546 ) - ( 82,166,059 ) Balance at December 31, 2009 net of accumulated depreciation and amortization P 251,857,195 P 51,945,734 P 48,137,283 P 29,236,771 P - P 381,176,983
Balance at January 1, 2008, net of accumulated depreciation and amortization P 300,751,195 P 49,022,875 P 62,555,209 P 22,348,375 P 66,000,000 P 500,677,654 Additions 31,109,680 19,992,105 185,825 12,921,826 - 64,209,436 Transfers - - ( 16,607) ( 324,777 ) ( 66,000,000) ( 66,341,384 ) Depreciation and amortization charges for the year ( 38,956,315) ( 17,751,255) ( 8,121,746) ( 3,535,605 ) - ( 68,364,921 ) Balance at December 31, 2008 net of accumulated depreciation and amortization P 292,904,560 P 51,263,725 P 54,602,681 P 31,409,819 P - P 430,180,785
13. OTHER NON-CURRENT ASSETS
This account consists of:
2010 2009 2008
Goodwill P 264,768,344 P 264,768,344 P 264,768,344
Guarantee and
other deposits 174,767,810 135,516,056 99,014,532
Others 2,559,242 6,395,536 3,606,197
P 442,095,396 P 406,679,936 P 367,389,073
Goodwill is subject to impairment testing at least annually. No impairment losses were recognized in 2010, 2009 and 2008. Guarantee deposits pertain mainly to payments made for compliance with construction requirements in relation to the Group’s real estate projects.

- 43 -
14. INTEREST-BEARING LOANS AND BORROWINGS
Interest-bearing Loans and Borrowings account represents the following loans of the Group as of December 31:
2010 2009 2008
Current:
Megaworld Corporation P 1,203,380,952 P 736,690,476 P 232,000,000
ECOC 107,973,945 114,053,553 116,831,327
1,311,354,897 850,744,029 348,831,327
Non-current:
Megaworld Corporation 6,074,595,238 7,277,976,191 5,614,666,667
ECOC 53,988,238 171,081,667 292,079,687
6,128,583,476 7,449,057,858 5,906,746,354
P 7,439,938,373 P 8,299,801,887 P 6,255,577,681
In 2008, the Company signed a financing deal with local bank in which the Company may avail of a P5.0 billion unsecured loan, divided into Tranche A (P3.5 billion) and Tranche B (P1.5 billion). The Company had availed of P4.5 billion out of the P5.0 billion facility in 2008 while the remaining P500.0 million was availed of in 2009. The proceeds of the loan were used to fund the development of the Group’s various real estate projects. The loan is payable in seven years with a grace period of two years, divided into 21 consecutive equal quarterly payments. Interest is payable every quarter based on the Philippine Dealing System Treasury Fixing rate (PDSTF-R) plus a certain spread. In February 2009, the Company issued unsecured corporate notes to several financial institutions in the aggregate principal amount of P1.4 billion which will mature in seven years from the issue date. The principal repayments on this loan shall commence in February 2010 and interest shall be paid semi-annually based on a 9.0% annual interest rate. Also, in May 2009, the Company obtained an unsecured long-term loan from a local bank amounting to P500.0 million. The loan is payable for a term of seven years and interest is payable semi-annually based on a floating six-month PDSTF-R plus a certain spread, subject to semi-annual reprising. The remaining portion of the loans payable by the Company pertains to the balance of a long-term loan obtained in 2003 from a local bank with an original amount of P950.0 million which is payable in 10 years, inclusive of a three-year grace period on principal payments. Interest is payable every quarter based on 91-day treasury bill plus a certain spread. The Company also obtained an additional loan with original amount of P403.0 million in 2006 from the same local bank subject to the same terms and conditions. Collateral for the loans consisted of a mortgage over certain investment property of the Company (see Note 11).

- 44 -
The amount payable by ECOC pertains to the balance of a long-term loan facility obtained in 2002 with an original amount of U.S.$25 million (approximately P1.3 billion) from a foreign financial institution. The proceeds of the loan were used in the construction of several information technology buildings at the Eastwood CyberPark which is operated by ECOC. The drawdown from the loan facility amounting to U.S.$20 million (P1.06 billion) was made on October 15, 2002. The loan is payable in 10 years, inclusive of a two-and-a-half year grace period on principal payment. Interest is payable every six months at London Inter-bank Offer Rate plus certain spread. Collaterals for the loan consisted of a mortgage over ECOC’s certain Investment Property (see Note 11), and a full guarantee from the parent company. The Group complied with loan covenants, including maintaining certain financial ratios at the reporting date. Total finance costs attributable to these loans amounted to P620.6 million, P647.0 million, and P394.4 million in 2010, 2009 and 2008, respectively. Of these amounts, the balance of the interest is presented as part of Finance Costs under Interest and Other Charges - net in the consolidated statements of income (see Note 20). Interest charges capitalized in 2010 and 2009 amount to P384.1 million and P408.0 million, respectively. Capitalization rate used in determining the amount of interest charges qualified for capitalization is 8.29%. There were no interest charges capitalized in 2008.
15. BONDS PAYABLE
On November 18, 2009, the Group issued P5.0 billion fixed rate unsecured bonds with a term of five years and six months which bear an interest of 8.46% per annum. The bonds were issued at par and will be redeemed at 100% of the face value on maturity date. The proceeds received are intended to be used by the Group to finance its capital expenditures from 2009 until 2011 mainly for the development of its real estate projects. Interest charges capitalized arising from these bonds amounted to P423.0 million and P50.5 million in 2010 and 2009, respectively.
On August 4, 2006, the Group issued five-year term bonds totalling U.S.$100 million at a discount of U.S.$1.5 million. The bonds bear interest at 7.875% per annum payable semi-annually in arrears every February 4 and August 4 of each year, starting on February 4, 2007. The bond will mature in August 2011. Interest expense from bonds payable is presented as part of Finance Costs under Interest and Other Charges in the consolidated statements of income (see Note 20). During 2008, RHGI bought a portion of the five-year term bonds aggregating to U.S.$22.2 million (P1.1 billion) and these were classified as financial assets at FVTPL by RHGI. The bonds’ fair market value as of December 31, 2010, 2009 and 2008 amounted to U.S.$22.2 million (P972.4 million), U.S.$20.5 million (P950.3 million) and U.S.$20.5 million (P972.7 million), respectively. The effects of this transaction were eliminated in the preparation of consolidated financial statements.
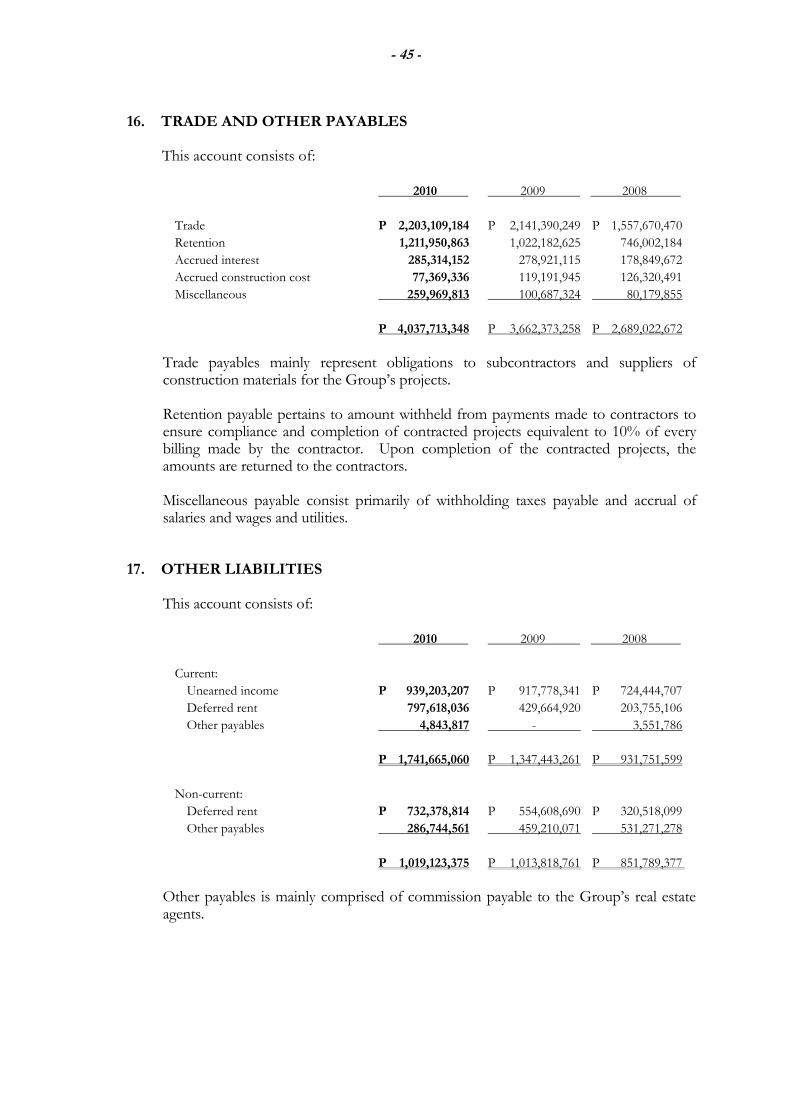
- 45 -
16. TRADE AND OTHER PAYABLES
This account consists of:
2010 2009 2008
Trade P 2,203,109,184 P 2,141,390,249 P 1,557,670,470
Retention 1,211,950,863 1,022,182,625 746,002,184
Accrued interest 285,314,152 278,921,115 178,849,672
Accrued construction cost 77,369,336 119,191,945 126,320,491
Miscellaneous 259,969,813 100,687,324 80,179,855
P 4,037,713,348 P 3,662,373,258 P 2,689,022,672
Trade payables mainly represent obligations to subcontractors and suppliers of construction materials for the Group’s projects. Retention payable pertains to amount withheld from payments made to contractors to ensure compliance and completion of contracted projects equivalent to 10% of every billing made by the contractor. Upon completion of the contracted projects, the amounts are returned to the contractors. Miscellaneous payable consist primarily of withholding taxes payable and accrual of salaries and wages and utilities.
17. OTHER LIABILITIES
This account consists of:
2010 2009 2008
Current:
Unearned income P 939,203,207 P 917,778,341 P 724,444,707
Deferred rent 797,618,036 429,664,920 203,755,106
Other payables 4,843,817 - 3,551,786
P 1,741,665,060 P 1,347,443,261 P 931,751,599
Non-current:
Deferred rent P 732,378,814 P 554,608,690 P 320,518,099
Other payables 286,744,561 459,210,071 531,271,278
P 1,019,123,375 P 1,013,818,761 P 851,789,377
Other payables is mainly comprised of commission payable to the Group’s real estate agents.

- 46 -
18. OPERATING EXPENSES
Presented below are the details of this account. Notes 2010 2009 2008
Commission P 467,977,819 P 471,837,004 P 418,549,272
Depreciation and
amortization 11, 12 443,203,639 365,795,590 238,834,323
Salaries and employee
benefits 21 437,045,219 343,257,217 310,302,336
Advertising and
promotions 189,619,585 148,996,615 147,650,445
Utilities and supplies 141,065,957 79,752,963 118,649,476
Taxes and licenses 110,188,073 134,286,970 97,278,394
Transportation 103,626,296 100,083,640 172,123,399
Professional fees and
outside services 68,426,284 28,773,878 30,601,649
Rent 60,263,992 47,103,336 94,944,445
Association dues 51,261,055 28,355,868 31,242,652
Miscellaneous 67,547,715 59,877,805 84,802,101
P 2,140,225,634 P 1,808,120,886 P 1,744,978,492
19. EQUITY IN NET EARNINGS OF ASSOCIATES, INTEREST AND OTHER INCOME – Net
Presented below are the details of this account.
Notes 2010 2009 2008
Interest income P 835,944,617 P 690,238,144 P 1,486,040,236
Gain on sale of
AFS financial
assets 646,720,788 - -
Equity in net
earnings of
associates 10 442,281,307 157,958,213 109,464,838
Construction
income – net 101,962,175 26,473,236 216,754,914
Fair value gains – net 7 83,500,000 24,100,000 -
Dividend income 40,630,134 44,247,127 48,880,085
Foreign currency
gains – net 3,908,758 - -
Miscellaneous – net 59,794,552 32,571,224 93,802,697
P 2,214,742,331 P 975,587,944 P 1,954,942,770
In 2008, RHGI entered into contracts wherein it sold certain European bond put options and knock-out put options. In consideration of these contracts, RHGI received premiums amounting to U.S.$2,094,000 (P93,129,812) in 2008, which are shown as part of Miscellaneous Income above.

- 47 -
20. INTEREST AND OTHER CHARGES - Net
Presented below are the details of this account.
Notes 2010 2009 2008
Finance costs 14, 15 P 516,440,321 P 556,326,705 P 766,416,111
Underwriting fees - 21,505,376 -
Foreign currency
losses – net 7 - 8,464,596 176,988,434
Fair value losses – net 7 - - 42,653,717
Miscellaneous – net 7 27,960,793 1,247,492 4,726,236
P 544,401,114 P 587,544,169 P 990,784,498
21. EMPLOYEE BENEFITS
21.1 Salaries and Employee Benefits Expenses recognized for salaries and employee benefits are presented below (see Note 18).
2010 2009 2008
Salaries and wages P 271,233,637 P 229,301,717 P 196,098,245
Retirement benefit expense 37,271,665 23,547,960 34,747,913
13th month and other
employee benefits 128,539,917 90,407,540 79,456,178
P 437,045,219 P 343,257,217 P 310,302,336
21.2 Post-employment Benefit
The Group maintains a funded, tax-qualified, non-contributory retirement plan that is
being administered by a trustee covering all regular full-time employees. Actuarial valuations are made annually to update the retirement benefit costs and the amount of contributions.
The amounts of retirement benefit obligation, presented as non-current liability in the
consolidated statements of financial position, are determined as follows: 2010 2009 2008
Present value of the obligation P 209,714,448 P 163,802,833 P 91,871,990
Fair value of plan assets ( 53,207,861) ( 40,427,396 ) ( 26,200,243 )
Deficiency of plan assets 156,506,587 123,375,437 65,671,747
Unrecognized actuarial
gains (losses) ( 40,467,402) ( 32,607,917) 15,547,813
P 116,039,185 P 90,767,520 P 81,219,560

- 48 -
The movements in the present value of the retirement benefit obligation recognized in the books are as follows:
2010 2009 2008
Balance at beginning of year P 163,802,833 P 91,871,990 P 128,399,196
Actuarial loss (gain) 11,732,057 47,992,843 ( 70,297,468 )
Current service costs 23,934,917 14,995,640 23,074,609
Interest costs 15,086,241 10,363,160 10,695,653
Benefits paid ( 4,841,600) ( 1,420,800) -
Balance at end of year P 209,714,448 P 163,802,833 P 91,871,990
The movements in the fair value of plan assets are presented below.
2010 2009 2008
Balance at beginning of year P 40,427,396 P 26,200,243 P 21,000,000
Expected return on plan assets 2,425,644 1,545,814 651,000
Contributions paid into the plan 12,000,000 14,000,000 9,000,000
Actuarial gain (loss) 3,196,421 102,139 ( 4,450,757 )
Benefits paid ( 4,841,600) ( 1,420,800) -
Balance at end of year P 53,207,861 P 40,427,396 P 26,200,243
The Group’s plan assets as of December 31, 2010, 2009 and 2008 are solely in the form of cash and cash equivalents which are being administered by a trustee. The contributions to the plan are made annually by the Company based on availability of funds. The amounts of retirement benefits expense recognized in the consolidated statements of income are as follows:
2010 2009 2008
Current service costs P 23,934,917 P 14,995,640 P 23,074,609
Interest costs 15,086,241 10,363,160 10,695,653
Expected return on
plan assets ( 2,425,644) ( 1,545,814 ) ( 651,000)
Net actuarial losses (gains)
recognized during
the year 676,151 ( 265,026 ) 1 ,628,651
P 37,271,665 P 23,547,960 P 34,747,913
Presented below are the historical information related to the present value of the retirement benefit obligation, fair value of plan assets and deficiency of plan assets.
2010 2009 2008 2007 2006
Present value of the obligation P 209,714,448 P 163,802,833 P 91,871,990 P 128,399,196 P 51,601,897 Fair value of plan assets ( 53,207,861) ( 40,427,396) ( 26,200,243) ( 21,000,000 ) ( 5,000,000 ) Deficiency of plan assets P 156,506,587 P 123,375,437 P 65,671,747 P 107,399,196 P 46,601,897

- 49 -
In determining the amount of retirement benefit obligation, the following actuarial assumptions were used:
2010 2009 2008
Discount rates 9.2% 11.3% 8.3%
Expected rate of return on
plan assets 6.0% 5.9% 3.1%
Expected rate of salary increase 10.0% 10.0% 10.0%
Assumptions regarding future mortality are based on published statistics and mortality tables. The average life expectancy of an individual retiring at the age of 65 is 29 for both males and females.
22. TAXES
22.1 Current and Deferred Tax
The components of tax expense (income) as reported in the consolidated statements of income and consolidated statements of comprehensive income are as follows:
2010 2009 2008
Reported in consolidated statements of income:
Current tax expense:
Regular corporate income tax
(RCIT) at 30% in 2010 and
and 2009 and 35% in 2008 P 813,802,554 P 512,512,346 P 463,489,162
Final tax at 20% and 7.5% 111,933,084 86,375,275 87,996,370
Special tax rate at 5% 19,479,041 15,866,373 14,373,247
Minimum corporate income
tax (MCIT) at 2% 425,765 26,324 97,773
945,640,444 614,780,318 565,956,552
Deferred tax expense relating to
origination and reversal of
temporary differences 663,461,081 822,760,813 385,144,752
P 1,609,101,525 P 1,437,541,131 P 951,101,304
Reported in consolidated statements of
comprehensive income –
Deferred tax expense (income)
relating to origination and reversal
of temporary differences (P 55,967,408) ( P 26,041,986) P 11,728,077

- 50 -
A reconciliation of tax on pretax profit computed at the applicable statutory rates to income tax expense reported in the consolidated statements of income is as follows:
2010 2009 2008
Tax on pretax profit at 30% in 2010 and 2009
and 35% in 2008 P 2,008,384,239 P 1,651,246,082 P 1,660,969,642
Adjustment for income subjected to
lower income tax rates ( 152,228,235 ) ( 139,778,356 ) ( 156,474,496 )
Tax effects of:
Non-taxable income ( 462,560,168 ) ( 170,042,598 ) ( 921,295,050 )
Non-deductible expenses 214,450,368 50,688,383 496,265,189
Dividend income ( 52,444,145 ) ( 1,356,764 ) ( 45,613,386 )
Non-deductible interest expense 49,245,102 38,308,284 60,251,011
Unrecognized deferred tax assets 10,225,726 3,514,346 934,000
Excess of optional standard deduction
over itemized deductions ( 5,784,318 ) ( 3,672,931 ) -
Net operating loss carry over (NOLCO) 1,000,962 8,483,984 11,121,784
Reduction in deferred tax rate - - ( 150,082,436 )
Miscellaneous ( 1,188,006 ) 150,701 ( 4,974,954 )
Tax expense P 1,609,101,525 P 1,437,541,131 P 951,101,304
The deferred tax assets and liabilities relate to the following as of December 31:
2010 2009 2008
Deferred tax assets:
NOLCO P 4,141,606 P 4,935,423 P 44,797
Retirement benefit obligation 3,186,559 2,585,319 1,987,731
Accrued rent expense 68,417 218,344 358,495
Allowance for impairment
on receivables - - 24,859
Others 463,957 148,627 2,391
P 7,860,539 P 7,887,713 P 2,418,273
Deferred tax liabilities:
Uncollected gross profit P 2,697,434,301 P 2,294,929,189 P 1,527,833,787
Capitalized interest 443,717,090 222,651,148 108,100,501
Difference between the tax
reporting base and financial
reporting base of:
Investment property 201,696,863 148,804,564 172,865,496
Property and equipment ( 19,790,916) ( 20,050,630 ) ( 19,478,257 )
Translation adjustments ( 70,281,317) ( 14,313,909 ) 11,728,077
Accrued retirement cost ( 43,301,756) ( 33,170,257 ) ( 33,095,868 )
Uncollected rental income - - 32,091,485
Others 39,556,389 42,713,450 43,308,540
P 3,249,030,654 P 2,641,563,555 P 1,843,353,761

- 51 -
The components of deferred tax expense (income) are as follows: Consolidated Consolidated Statements Statements of Income of Comprehensive Income 2010 2009 2008 2010 2009 2008 Changes in deferred tax assets: NOLCO P 793,817 ( P 4,890,626 ) ( P 231,143 ) P - P - P - Retirement benefit obligation ( 601,240 ) ( 597,588 ) ( 340,712 ) - - - Accrued rent expense 149,927 140,151 55,402 - - - Allowance for impairment losses on receivables - 24,859 947,948 - - - Depreciation expense - - ( 7,667 ) - - - Others ( 315,330) ( 146,236 ) ( 425,483 ) - - - Changes in deferred tax liabilities: Uncollected gross profit 402,504,512 767,095,402 359,278,205 - - - Capitalized interest 221,065,942 114,550,647 ( 26,071,447 ) - - - Difference between tax reporting base and financial reporting base of: - Investment property 52,892,299 ( 24,060,932 ) 32,345,673 - - - - Property and equipment 259,714 ( 572,373 ) 2,592,215 - - - Translation adjustments - - - ( 55,967,408 ) ( 26,041,986 ) 11,728,077 Accrued retirement cost ( 10,131,499 ) ( 74,389 ) ( 6,330,792 ) - - - Uncollected rental income - ( 32,091,485 ) 26,374,103 - - - Amortization of preoperating expenses - - 30,415 - - - Others ( 3,157,061 ) 3,383,383 ( 3,071,965 ) - - - Deferred Tax Expense (Income) P 663,461,081 P822,760,813 P 385,144,752 ( P 55,967,408 ) ( P 26,041,986) P11,728,077
No deferred tax liability has been recognized on the accumulated equity in net earnings of associates. The Group has no liability for tax should the amounts be declared as dividends since dividend income received from domestic corporation is not subject to income tax. Majority of the entities within the Group are subject to the MCIT which is computed at 2% of gross income, as defined under the tax regulations. The details of MCIT paid by certain subsidiaries, which can be applied as deduction from their respective future RCIT payable within three years from the year the MCIT was incurred, are shown below. Valid Subsidiary Year incurred Amount Until MNPHI 2010 P 233,530 2013 2009 230,427 2012 MLI 2010 37,479 2013 2008 83,571 2011 FTPHI 2010 7,052 2013 2009 2,386 2012 2008 1,909 2011 P 596,354 Certain subsidiaries within the Group did not recognize the deferred tax assets on their MCIT.
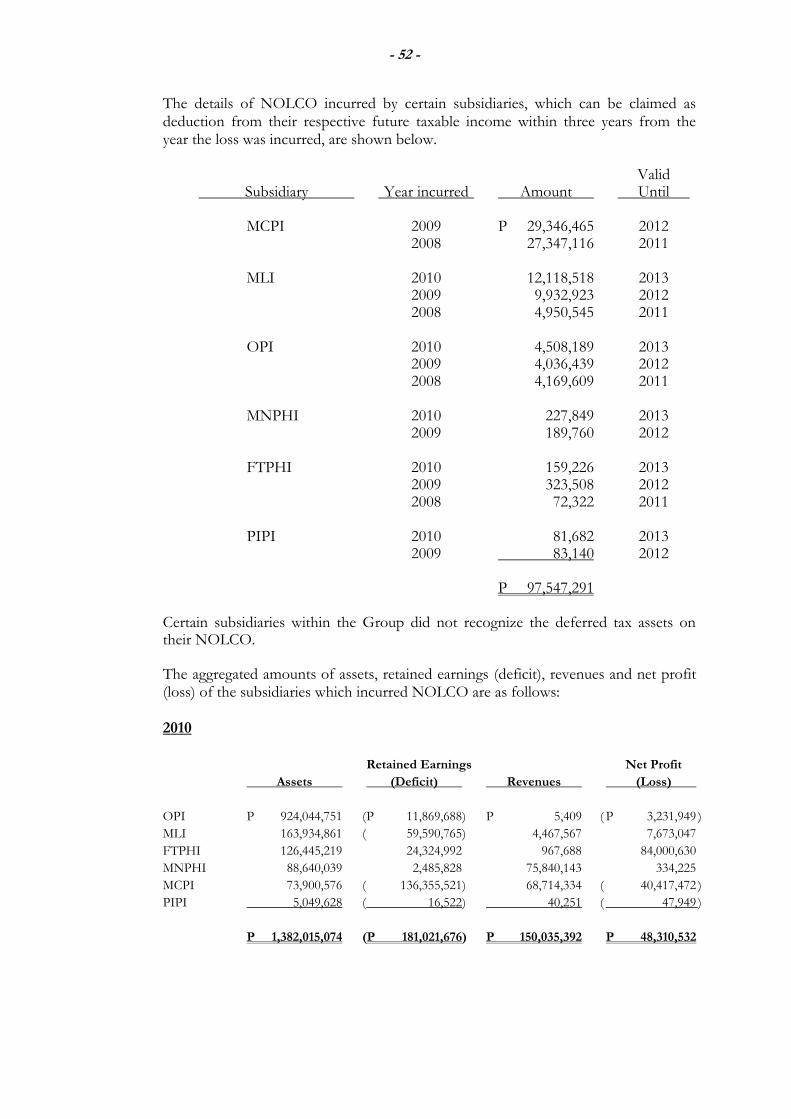
- 52 -
The details of NOLCO incurred by certain subsidiaries, which can be claimed as deduction from their respective future taxable income within three years from the year the loss was incurred, are shown below. Valid Subsidiary Year incurred Amount Until MCPI 2009 P 29,346,465 2012 2008 27,347,116 2011 MLI 2010 12,118,518 2013 2009 9,932,923 2012 2008 4,950,545 2011 OPI 2010 4,508,189 2013 2009 4,036,439 2012 2008 4,169,609 2011 MNPHI 2010 227,849 2013 2009 189,760 2012 FTPHI 2010 159,226 2013 2009 323,508 2012 2008 72,322 2011 PIPI 2010 81,682 2013 2009 83,140 2012 P 97,547,291 Certain subsidiaries within the Group did not recognize the deferred tax assets on their NOLCO. The aggregated amounts of assets, retained earnings (deficit), revenues and net profit (loss) of the subsidiaries which incurred NOLCO are as follows: 2010 Retained Earnings Net Profit
Assets (Deficit) Revenues (Loss)
OPI P 924,044,751 ( P 11,869,688) P 5,409 ( P 3,231,949 )
MLI 163,934,861 ( 59,590,765) 4,467,567 7,673,047
FTPHI 126,445,219 24,324,992 967,688 84,000,630
MNPHI 88,640,039 2,485,828 75,840,143 334,225
MCPI 73,900,576 ( 136,355,521) 68,714,334 ( 40,417,472 )
PIPI 5,049,628 ( 16,522) 40,251 ( 47,949 )
P 1,382,015,074 (P 181,021,676) P 150,035,392 P 48,310,532

- 53 -
2009
Retained Earnings Net Profit
Assets (Deficit) Revenues (Loss)
OPI P 889,329,679 (P 8,637,739 ) P 23,930 ( P 2,808,135 )
GPMAI 658,718,614 251,993,072 2,554,950 938,907
MLI 191,642,758 ( 51,917,718 ) 2,334,341 ( 12,171,355 )
MREI 63,360,474 814,274 1,345,935 1,030,840
MCPI 47,291,076 ( 96,024,989 ) 5,672,878 29,399,277
FTPHI 42,639,638 ( 59,675,638 ) 136,043 23,886,928
PIPI 5,094,427 31,427 49,960 ( 40,055 )
P 1,898,076,666 P 36,582,689 P 12,118,037 P 40,236,407
2008
GPMAI P 308,020,556 P 250,064,414 P - P 962,384
MLI 202,369,120 242,937,331 7,258,976 ( 3,355,478 )
MCPI 43,726,583 79,102,295 4,570,750 ( 27,278,908 )
PIPI 5,131,482 60,000 185,846 132,358
P 559,247,741 P 572,164,040 P 12,015,572 (P 29,539,644 )
Management has assessed that the net losses incurred, as well as the related NOLCO, can be recovered through future operations and are not significant to the overall financial condition and financial performance of the Group. 22.2 Optional Standard Deduction
Effective July 2008, Republic Act (RA) 9504 was approved giving corporate taxpayers
an option to claim itemized deductions or optional standard deduction (OSD) equivalent to 40% of gross sales. Once the option to use OSD is made, it shall be irrevocable for that particular taxable year.
In 2010, 2009 and 2008, the Group opted to continue claiming itemized deductions,
except for MDC which opted to use OSD for 2010 and 2009. 22.3 Change in Applicable Tax Rate
In accordance with RA 9337, RCIT rate was reduced from 35% to 30% and nonallowable deductions for interest expense from 42% to 33% of interest income subjected to final tax effective January 1, 2009.

- 54 -
23. RELATED PARTY TRANSACTIONS
The Group’s related parties include associates, the Group’s key management and others as described below. Transactions with related parties are also discussed below.
23.1 Rendering of Services to Related Parties and Rentals
Amount of Transactions
2010 2009 2008
Associates P 5,289,782 P 3,381,056 P 1,798,628
Other related parties 13,659,040 13,809,067 12,533,262
P 18,948,822 P 17,190,123 P 14,331,890
Services rendered are usually on a cost-plus basis, allowing a margin ranging from 10% to 20%. The related receivables from these transactions were all settled and collected as of December 31, 2010, 2009 and 2008.
23.2 Obtaining of Services from Related Parties
Amount of Outstanding
Transactions Balances
2010 2009 2008 2010 2009 2008
Associates P - P 2,286,178 P 3,048,237 P - P - P - Other related parties 126,454,782 146,626,602 152,278,332 84,088,445 81,408,167 79,678,432 P 126,454,782 P 148,912,780 P155,326,569 P 84,088,445 P 81,408,167 P 79,678,432
Services obtained are usually on a cost-plus basis, allowing a margin ranging from 10% to 20%. There are no outstanding payables for services obtained from the associates as of December 31, 2010, 2009 and 2008. The outstanding balances payable to other related parties pertain to unpaid commissions presented as part of Other Non-current Liabilities in the consolidated statements of financial position (see Note 17). 23.3 Advances to Associates and Other Related Parties
Associates and other related parties are granted noninterest-bearing, unsecured advances by the parent company and other entities in the Group for working capital purposes. The outstanding balances of Advances to Associates and Other Related Parties shown as part of Investments in and Advances to Associates and Other Related Parties in consolidated statements of financial position (see Note 10) are as follows:
2010 2009 2008
Advances to Associates
EELHI P 394,211,729 P 378,888,334 P 69,356
SHDI 338,598 - 15,813,306
PTHDC 1,004,986,820 1,009,986,216 1,009,173,481
AGPL - 211,708,104 -
1,399,537,147 1,600,582,654 1,025,056,143
Advances to other related parties 647,453,685 411,687,922 1,045,815,762
P 2,046,990,832 P 2,012,270,576 P 2,070,871,905
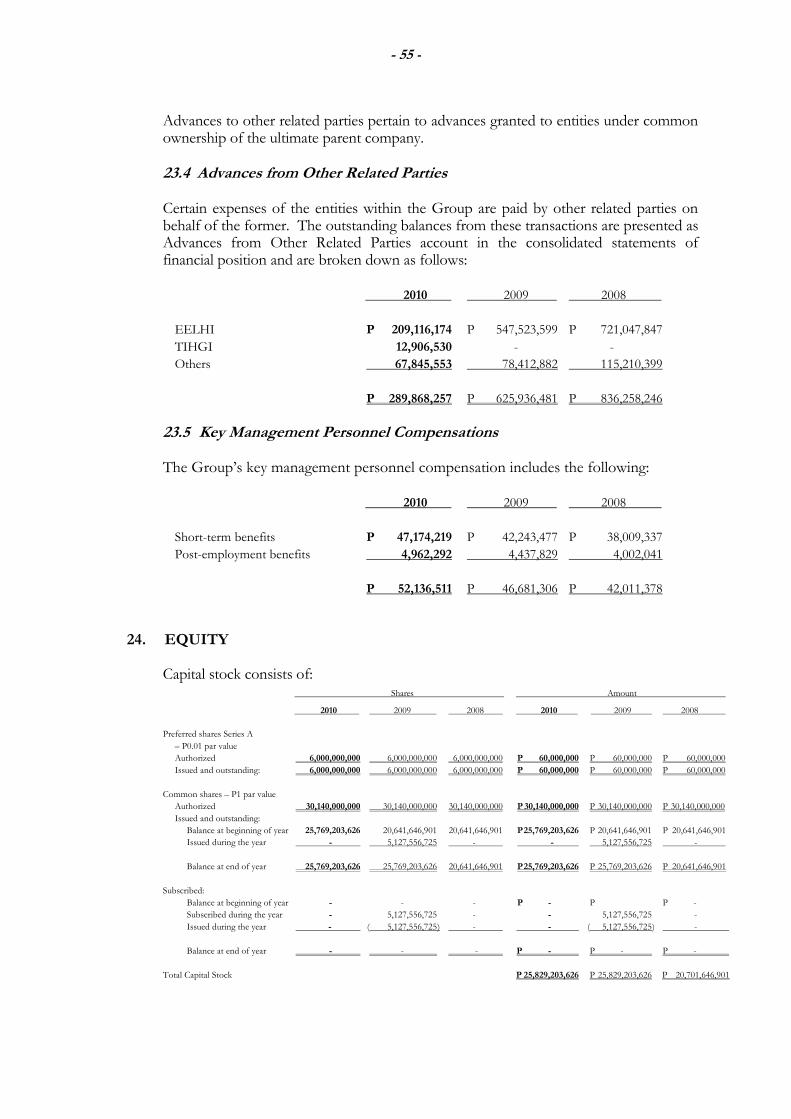
- 55 -
Advances to other related parties pertain to advances granted to entities under common ownership of the ultimate parent company.
23.4 Advances from Other Related Parties Certain expenses of the entities within the Group are paid by other related parties on behalf of the former. The outstanding balances from these transactions are presented as Advances from Other Related Parties account in the consolidated statements of financial position and are broken down as follows:
2010 2009 2008
EELHI P 209,116,174 P 547,523,599 P 721,047,847
TIHGI 12,906,530 - -
Others 67,845,553 78,412,882 115,210,399
P 289,868,257 P 625,936,481 P 836,258,246
23.5 Key Management Personnel Compensations The Group’s key management personnel compensation includes the following:
2010 2009 2008
Short-term benefits P 47,174,219 P 42,243,477 P 38,009,337
Post-employment benefits 4,962,292 4,437,829 4,002,041
P 52,136,511 P 46,681,306 P 42,011,378
24. EQUITY
Capital stock consists of: Shares Amount
2010 2009 2008 2010 2009 2008
Preferred shares Series A
– P0.01 par value
Authorized 6,000,000,000 6,000,000,000 6,000,000,000 P 60,000,000 P 60,000,000 P 60,000,000
Issued and outstanding: 6,000,000,000 6,000,000,000 6,000,000,000 P 60,000,000 P 60,000,000 P 60,000,000
Common shares – P1 par value
Authorized 30,140,000,000 30,140,000,000 30,140,000,000 P 30,140,000,000 P 30,140,000,000 P 30,140,000,000
Issued and outstanding:
Balance at beginning of year 25,769,203,626 20,641,646,901 20,641,646,901 P 25,769,203,626 P 20,641,646,901 P 20,641,646,901
Issued during the year - 5,127,556,725 - - 5,127,556,725 -
Balance at end of year 25,769,203,626 25,769,203,626 20,641,646,901 P 25,769,203,626 P 25,769,203,626 P 20,641,646,901
Subscribed:
Balance at beginning of year - - - P - P P -
Subscribed during the year - 5,127,556,725 - - 5,127,556,725 -
Issued during the year - ( 5,127,556,725 ) - - ( 5,127,556,725 ) -
Balance at end of year - - - P - P - P -
Total Capital Stock P 25,829,203,626 P 25,829,203,626 P 20,701,646,901

- 56 -
24.1 Preferred Shares Series “A”
The preferred shares are voting, cumulative, non-participating, non-convertible and non-redeemable with a par value of P0.01 per share. The shares earn dividends at 1% of par value per annum cumulative from date of issue. Dividends paid on cumulative preferred shares amounted to P600,000 in 2010, 2009 and 2008. 24.2 Common Shares On April 28, 2009, the Company offered 5,127,556,725 common shares, by way of pre-emptive stock rights offering, to eligible existing common shareholders at the rate of one right for every four common shares held as of May 4, 2009 at an exercise price of P1 per share. Moreover, shareholders were given four additional stock warrants for every five stock rights subscribed. For every stock warrant, shareholders can avail of one common share at P1 per share. As a result of the stock rights offering, 5,127,556,725 common shares were subscribed and issued on June 1, 2009. Of the total exercise price, 50% was paid as of May 31, 2009 and the remaining 50% shall be paid within one year from issue date. Unpaid subscriptions amounted to P2.3 billion as of December 31, 2009 and are presented as Subscriptions Receivable under the current assets section of the 2009 consolidated statement of financial position. The amount was fully paid by the subscribers in 2010. Relative to the issuance of pre-emptive stock rights, 4,102,045,380 stock warrants were issued and these will be exercisable beginning on the second year until five years from issue date. 24.3 Additional Paid-in Capital
The additional paid-in capital pertains to the excess of the total proceeds received from the Company’s shareholders over the total par value of the common shares. There were no movements in the Company’s Additional Paid-in Capital accounts in 2010, 2009 and 2008. 24.4 Cash Dividends
The details of the Company’s cash dividend declarations, both for preferred and common shares, are as follows:
2010 2009 2008
Declaration date / date
of approval by BOD May 18, 2010 June 19, 2009 June 5, 2008
Date of record July 6, 2010 July 17, 2009 July 4, 2008
Date paid July 30, 2010 August 12, 2009 July 30, 2008
Amounts declared and paid P 479,885,465 P 479,061,765 P 402,353,813
On May 18, 2010, MDC’s BOD approved the declaration of cash dividends amounting to P100.0 million to stockholders of record as of said date. Out of the P100.0 million dividends declared, P60.0 million was eliminated during consolidation.

- 57 -
24.5 Treasury Shares
In 2008, the Company’s BOD approved the buy-back of shares of up to P2.0 billion worth of common shares in the open market at prevailing market prices. The share buy-back program is made through the trading facilities of the PSE and the funds used for the buy-back were taken from internally-generated funds. As of December 31, 2008, the Company reacquired 131.4 million shares at a total cost of P118.6 million. This account also includes the Company’s common shares held and acquired by RHGI and GPMAI. The number of treasury common shares aggregated to 537.4 million as of December 31, 2009 and 2008. The changes in market values of these shares recognized as fair value gains (losses) by RHGI and GPMAI were eliminated in full and were not recognized in the consolidated financial statements. Accordingly, in 2010, the cost of the treasury held by GPMAI of P555.1 million was removed from the Treasury Stock account presented under equity. GPMAI was deconsolidated starting 2010 (see Note 10). A portion of the Company’s retained earnings is restricted up to the cost of treasury stock as of the end of the reporting period.
25. EARNINGS PER SHARE
Earnings per share amounts were computed as follows:
2010 2009 2008
Net profit attributable to
parent company’s shareholders P 5,026,180,575 P 4,055,401,191 P 3,771,127,007
Dividends on cumulative
preferred shares series “A” ( 600,000) ( 600,000 ) ( 600,000)
Profit available to parent company’s
common shareholders P 5,025,580,575 P 4,054,801,191 P 3,770,527,007
Divided by weighted number
of outstanding common shares 25,130,015,061 23,088,192,857 20,132,817,980
Basic and diluted
earnings per share P 0.200 P 0.176 P 0.187
There were no outstanding convertible preferred shares and bonds or other stock
equivalents that may be considered as potential dilutive common shares as of December 31, 2010, 2009 and 2008.

- 58 -
26. COMMITMENTS AND CONTINGENCIES
26.1 Operating Lease Commitments – Group as Lessor The Group is a lessor under several operating leases covering real estate properties for commercial use (see Note 11). The leases have terms ranging from 3 to 20 years, with renewal options, and include annual escalation rates of 5% to 10%. The average annual rental covering these agreements amounts to about P2.7 billion for the consolidated balances. Future minimum lease payments receivable under these agreements are as follows:
2010 2009 2008
Within one year P 3,145,772,222 P 3,000,082,437 P 2,001,508,184
After one year but not
more than five years 14,998,070,516 10,809,294,660 7,582,583,273
More than five years 4,731,453,360 3,410,016,874 1,922,768,964
P 22,875,296,098 P 17,219,393,971 P 11,506,860,421
26.2 Operating Lease Commitments – Group as Lessee The Group is a lessee under several operating leases covering condominium units for administrative use. The leases have terms ranging from 1 to 11 years, with renewal options, and include a 5% to 10% annual escalation rate. The average annual rental covering these agreements amounts to about P10.0 million for the consolidated balances. The future minimum rental payables under these non-cancelable leases as of December 31, are as follows:
2010 2009 2008
Within one year P 12,247,168 P 16,891,737 P 17,583,865
After one year but not
more than five years 19,039,825 17,951,311 26,489,885
More than five years 18,908,935 23,528,646 27,886,864
P 50,195,928 P 58,371,694 P 71,960,614 26.3 Others There are commitments, guarantees and contingent liabilities that arise in the normal course of operations of the Group which are not reflected in the accompanying consolidated financial statements. The management of the Group is of the opinion that losses, if any, from these items will not have any material effect on its consolidated financial statements.

- 59 -
27. RISK MANAGEMENT OBJECTIVES AND POLICIES
The Group has various financial instruments such as cash and cash equivalents, financial assets at FVTPL, AFS securities, bank loans, bonds, trade receivables and payables which arise directly from the Group’s business operations. The financial liabilities were issued to raise funds for the Group’s capital expenditures. The Group does not actively engage in the trading of financial assets for speculative purposes. 27.1 Foreign Currency Sensitivity
Most of the Group’s transactions are carried out in Philippine pesos, its functional currency. Exposures to currency exchange rates arise mainly from the Group’s U.S. dollar-denominated cash and cash equivalents, and bonds payable which have been used to fund new projects. Foreign currency-denominated financial assets and liabilities, translated into Philippine pesos at the closing rate are as follows:
2010 2009 2008 U.S. Dollars Pesos U.S. Dollars Pesos U.S. Dollars Pesos Financial assets $ 245,812,793 P10,790,198,346 $ 186,778,590 P 8,658,308,333 $ 138,542,551 P 6,578,693,016 Financial liabilities ( 7,098,646) ( 311,602,166) ( 87,449,638 ) ( 4,053,815,436) ( 90,043,539 ) ( 4,275,717,458 ) $ 238,714,147 P10,478,596,180 $ 99,328,952 P 4,604,492,897 $ 48,499,012 P 2,302,975,558
The following table illustrates the sensitivity of the consolidated net results for the year in regards to the Group’s financial assets and financial liabilities as shown previously and the U.S. dollar – Philippine peso exchange rate:
Increase (decrease) Effect on consolidated profit before tax
in exchange rate 2010 2009 2008
P1 P 238,714,147 P 99,328,952 P 48,499,011
(P1) ( 238,714,147) ( 99,328,952 ) ( 48,499,011)
Exposures to foreign exchange rates vary during the year depending on the volume of overseas transactions and only affect consolidated profit or loss of the Group. There are no exposures on foreign exchange rate that affect the Group’s other comprehensive income (loss). Nonetheless, the analysis above is considered to be representative of the Group’s currency risk. 27.2 Interest Rate Sensitivity The Group interest risk management policy is to minimize interest rate cash flow risk exposures to changes in interest rates. The Group maintains a debt portfolio unit of both fixed and floating interest rates. These long-term borrowings and all other financial assets and liabilities are subject to variable interest rates.
The Group’s ratio of fixed to floating rate debt stood at 88.12, 87.13 and 86.14 as of December 31, 2010, 2009 and 2009, respectively.

- 60 -
The following table illustrates the sensitivity of the consolidated net result for the year and consolidated equity to a reasonably possible change in interest rates of +1% and –1% in 2010, 2009 and 2008. The calculations are based on the Group’s financial instruments held at each reporting date. All other variables are held constant.
2010 2009 2008 +1% -1% +1% -1% +1% -1% Consolidated net results for the year (P 15,873,037) P 15,873,037 (P 23,850,402) P 23,850,402 ( P 30,111,330 ) P 30,111,330 Consolidated equity ( 11,111,126) 11,111,126 ( 16,695,282) 16,695,282 ( 19,572,364 ) 19,572,364
27.3 Credit Risk Generally, the Group’s credit risk is attributable to trade receivables, rental receivables and other financial assets. The Group maintains defined credit policies and continuously monitors defaults of customers and other counterparties, identified either individually or by group, and incorporate this information into its credit risk controls. Where available at a reasonable cost, external credit ratings and/or reports on customers and other counterparties are obtained and used. The Group’s policy is to deal only with creditworthy counterparties. In addition, for a significant proportion of sales, advance payments are received to mitigate credit risk. Generally, the maximum credit risk exposure of financial assets is the carrying amount of the financial assets as shown in the consolidated statements of financial position (or in the detailed analysis provided in the notes to consolidated financial statements), as summarized below.
Notes 2010 2009 2008
Cash and cash
equivalents 5 P 22,031,584,943 P 20,876,005,473 P 12,325,333,064
Trade and other
receivables 6 29,040,792,116 23,713,732,228 17,699,223,385
Advances to associates
and other related
parties 10, 23.3 2,046,990,832 2,012,270,576 2,070,871,905
AFS financial assets 8 675,467,827 148,299,890 3,273,653,414
P 53,794,835,718 P 46,750,308,167 P 35,369,081,768
(a) Cash and Cash Equivalents
The credit risk for cash and cash equivalents is considered negligible since the counterparties are reputable banks with high quality external credit ratings.
(b) Trade and Other Receivables
All trade receivables are subject to credit risk exposure. However, the Group does not identify specific concentrations of credit risk with regard to Trade and Other Receivables as the amounts recognized resemble a large number of receivables from various customers. Certain receivables from trade customers are covered by post-dated checks. Certain past due accounts are not provided with allowance for impairment to the extent of the expected market value of the property sold to the customer. The title to the real estate properties remains with the Group until the receivables are fully collected.

- 61 -
27.4 Liquidity Risk The Group manages its liquidity needs by carefully monitoring scheduled debt servicing payments for long-term financial liabilities as well as cash outflows due in a day-to-day business. Liquidity needs are monitored in various time bands, on a day-to-day and week-to-week, as well as on the basis of a rolling 30-day projection. Long-term needs for a six-month and one-year period are identified monthly. The Group maintains cash to meet its liquidity requirements for up to 60-day periods. Excess cash is invested in time deposits or short-term marketable securities. Funding for long-term liquidity needs is additionally secured by an adequate amount of committed credit facilities and the ability to sell long-term financial assets.
As at December 31, 2010, 2009 and 2008, the Group’s financial liabilities have contractual maturities which are presented below.
2010
Current Non-current
Within 6 to 12 1 to 5 Later
6 Months Months Years 5 Years
Interest-bearing loans and borrowings P 655,677,449 P 655,677,448 P 6,128,583,476 P - Bonds payable - 3,416,062,159 5,000,000,000 -
Trade and other payables 1,847,488,610 2,190,224,738 - -
Advances from other related parties - - 289,868,257 -
P2,503,166,059 P 6,261,964,345 P 11,418,451,733 P -
2009
Current Non-current
Within 6 to 12 1 to 5 Later
6 Months Months Years 5 Years
Interest-bearing loans and borrowings P 192,026,776 P 658,717,253 P 5,672,557,858 P 1,776,500,000 Bonds payable - - 8,608,407,826 -
Trade and other payables 1,474,550,021 2,187,823,237 - -
Advances from other related parties - - 625,936,481 -
P1,666,576,797 P 2,846,540,490 P14,906,902,165 P 1,776,500,000
2008
Current Non-current
Within 6 to 12 1 to 5 Later
6 Months Months Years 5 Years
Interest-bearing loans and borrowings P 174,415,663 P 174,415,664 P 5,257,857,465 P 648,888,889 Bonds payable - - 3,696,290,569 -
Trade and other payables 1,227,141,699 1,461,880,973 - -
Advances from other related parties - - 836,258,246 -
P1,401,557,362 P 1,636,296,637 P 9,790,406,280 P 648,888,889
The above contractual maturities reflect the gross cash flows, which may differ from the carrying values of the liabilities at the reporting dates.

- 62 -
27.5 Other Price Risk Sensitivity
The Group’s market price risk arises from its investments carried at fair value (financial assets classified as financial assets at FVTPL and AFS financial assets). It manages its risk arising from changes in market price by monitoring the changes in the market price of the investments. For corporate bonds and equity securities listed in other countries, an average volatility of 105%, 71% and 107% has been observed during 2010, 2009 and 2008, respectively. If quoted price for these securities increased or decreased by that amount, profit before tax would have changed by P2.7 billion, P14.6 million, P21.7 million in 2010, 2009 and 2008, respectively.
For equity securities listed in the Philippines, the observed volatility rates of the fair values of the Group’s investments held at fair value and their impact on the Group’s consolidated net profit in 2010 and consolidated equity as of December 31, 2010 are summarized as follows:
Observed Volatility Rates Impact of Increase Impact on Decrease Increase Decrease Net Profit Equity Net Profit Equity Investment in equity securities in: Holding company +51.53% -51.53% P 64,414,912 P 2,073,193,927 ( P 64,414,912 ) ( P 2,073,193,927 ) Property company +51.54% -51.54% - 71,024,936 - ( 71,024,936 ) P 64,414,912 P 2,144,218,863 ( P 64,414,912 ) (P2,144,218,863 )
This compares with the following volatility rates and impact on consolidated net profit in 2009 and 2008: 2009
Observed Volatility Rates Impact of Increase Impact on Decrease Increase Decrease Net Profit Equity Net Profit Equity Investment in equity securities in: Holding company +50.32% -50.32% P 20,883,283 P 900,762,327 ( P 20,883,283 ) (P 900,762,327) Property company +61.55% -61.55% - 85,613,014 - - P 20,883,283 P 986,375,341 ( P 20,883,283 ) (P 900,762,327 )
2008 Observed Volatility Rates Impact of Increase Impact on Decrease Increase Decrease Net Profit Equity Net Profit Equity Investment in equity securities in: Holding company +78.04% -78.04% P 240,225 P 426,127,945 ( P 240,225 ) (P 426,127,945 ) Property company +106.24% -106.24% - 145,010,939 - ( 145,010,939 ) Bank +111.21% -111.21% - 324,464 - ( 324,464 ) P 240,225 P 571,463,348 ( P 240,225 ) (P 571,463,348 )
The investments in listed equity securities are considered long-term strategic investments. In accordance with the Group’s policies, no specific hedging activities are undertaken in relation to these investments. The investments are continuously monitored and voting rights arising from these equity instruments are utilized in the Group’s favour.

- 63 -
28. CATEGORIES AND FAIR VALUES OF FINANCIAL ASSETS AND
LIABILITIES
28.1 Comparison of Carrying Amounts and Fair Values
The carrying amounts and fair values of the categories of financial assets and liabilities presented in the consolidated statements of financial position are shown below.
2010 2009 2008 Carrying Fair Carrying Fair Carrying Fair Values Values Values Values Values Values Financial Assets Loans and receivables: Cash and cash equivalents P 22,031,584,943 P 22,031,584,943 P 20,876,005,473 P 20,876,005,473 P 12,325,333,064 P 12,325,333,064 Trade and other receivables – net 29,040,792,116 29,040,792,116 23,713,732,228 23,713,732,228 17,699,223,385 17,699,223,385 Advances to associates and other related parties 2,046,990,832 2,046,990,832 2,012,270,576 2,012,270,576 2,070,871,905 2,070,871,905 P 53,119,367,891 P 53,119,367,891 P 46,602,008,277 P 46,602,008,277 P 32,095,428,354 P 32,095,428,354 Financial assets at FVTPL P 125,000,000 P 125,000,000 P 41,500,000 P 41,500,000 P 17,400,000 P 17,400,000 AFS financial assets: Equity instruments P 5,535,716,669 P 5,535,716,669 P 2,778,231,823 P 2,778,231,823 P 1,076,571,258 P 1,076,571,258 Debt instruments 675,467,827 675,467,827 148,299,890 148,299,890 3,273,653,414 3,273,653,414 P 6,211,184,496 P 6,211,184,496 P 2,926,531,713 P 2,926,531,713 P 4,350,224,672 P 4,350,224,672 Financial Liabilities Financial liabilities at amortized cost Interest-bearing loans and borrowings P 7,439,938,373 P 7,439,938,373 P 8,299,801,887 P 8,299,801,887 P 6,255,577,681 P 6,255,577,681 Bonds payable 8,416,062,159 8,416,062,159 8,608,407,826 8,608,407,826 3,696,290,569 3,696,290,569 Trade and other payables 4,037,713,348 4,037,713,348 3,662,373,258 3,662,373,258 2,689,022,672 2,689,022,672 Advances from other related parties 289,868,257 289,868,257 625,936,481 625,936,481 836,258,246 836,258,246 P 20,183,582,137 P 20,183,582,137 P 21,196,519,452 P 21,196,519,452 P 13,477,149,168 P 13,477,149,168
See Notes 2.5 and 2.9 for a description of the accounting policies for each category of financial instrument. A description of the Group’s risk management objectives and policies for financial instruments is provided in Note 27.
28.2 Fair Value Hierarchy
The Group’s investments in financial assets at FVTPL and AFS financial assets are comprised of equity and debt instruments listed in foreign and local stocks exchange. Fair value measurements of these financial assets were determined directly by reference to published prices quoted in an active market (Level 1 of the fair value hierarchy).

- 64 -
29. CAPITAL MANAGEMENT OBJECTIVES, POLICIES AND
PROCEDURES
The Group’s capital management objective is to ensure its ability to continue as a going concern and to provide an adequate return to shareholders by pricing products and services commensurately with the level of risk. The Group manages its capital structure and makes adjustments to it, in the light of changes in economic conditions. It monitors capital using the debt-to-equity ratio.
2010 2009 2008 Interest-bearing loans and
borrowings P 7,439,938,373 P 8,299,801,887 P 6,255,577,681
Bonds payable 8,416,062,159 8,608,407,826 3,696,290,569
P 15,856,000,532 P 16,908,209,713 P 9,951,868,250
Equity attributable to parent
company’s shareholders P 57,776,023,630 P 49,111,847,183 P 38,980,292,755
Debt-to-equity ratio 0.27 : 1 0.34 : 1 0.26 : 1
The Group has complied with its covenant obligations, including maintaining the required debt-to-equity ratio for the years presented above.
30. OTHER MATTERS
30.1 Registration with Philippine Economic Zone Authority (PEZA) ECOC, as operator of the Eastwood City CyberPark, is registered with PEZA. As a PEZA registered entity, it is entitled to a preferential tax rate of 5% on gross income earned from its PEZA registered activities, in lieu of all local and national taxes, and to other tax privileges. 30.2 International Organization for Standardization (ISO) Certification The parent company was awarded a Certificate of Registration ISO 9001:1994 effective November 26, 1999 by Certification International Philippines, Inc. Effective November 21, 2002, the parent company has upgraded its Certification to ISO 9001:2000 series. The scope of the certification covers all areas of the parent company’s operations, which include planning, design, project management and customer service for its real estate business. Among others, the parent company is required to undergo surveillance audits every six months.

- 65 -
30.3 Awards As a testament to the Company’s industry leadership, the Company was recognized by various award-giving bodies in 2009 and 2008 as follows: 2009
Best Investor Relations by Finance Asia
Best Managed Philippine Company by Finance Asia
Asia’s Best Managed Company by Finance Asia
2008
Small Cap Corporate of the Year by Asia Money Polls
Best in Investor Relations by Finance Asia
Best Managed Philippine Company by Finance Asia

MEGAWORLD CORPORATION
28/F The World Centre, 330 Sen. Gil Puyat Avenue, Makati City 1200, Philippines Tels: (632) 867-8826 to 40
www. megaworldcorp.com • E-mail: [email protected]
STATEMENT OF MANAGEMENT'S RESPONSIBILITY FOR FINANCIAL STATEMENTS
The management of Megaworld Corporation and Subsidiaries, is responsible for the preparation and fair presentation of the financial statements for the years ended December 31, 2011 and 2010, in accordance with Philippine Financial Reporting Standards (PFRS), including the following additional supplemental information filed separately from the basic financial s ta tern en ts:
a. Supplementary Schedules Required under Annex 68-E of the Securities Regulation Code Rule 68
b. Reconciliation of Retained Earnings Available for Dividend Declaration c. Schedule ofPFRS Effective as of December 31, 2011 d. Schedule of fiinancial Indicators for December 31, 2011 and 2010 e. ['vfap Showing the Relationship Between and Among the Company and its Related Entities
Management responsibility on the financial statements includes designing and implementing internal controls relevant to the preparation and fair presentation of financial statements that are free from material rnisstatement, whether due to fraud or error, selecting and applying appropriate accounting policies, and making accounting estimates that are reasonable in the circumstances.
The Board of Directors reviews and approves the financial statements, and the additional supplementary information, and submits the same to the stockholders.
Punongbayan & Araullo, the independent auditors appointed by the stockholders, has examined the financial statements of the Company in accordance with Philippine Standards on Auditing and, and in its report to the Board of Directors and stockholders, has expressed its opinion on the fairness of presentation upon completion of such ex
C:h~1in:~1 ~Ie ---ANDREW L. TAN Chief Executive Officer n#_! .. or"-___ -Fl NCISCO C. CANUTO S\rp -Treasurer
ISO 9001 2008 SERIES CERTIFIED CIP/2652/99/11/168

I
, --..
~ APR 0 3 201Z SUBSCRIBED AND SWORN to before me on this-- day of at--------Philippines affiants exhibiting to me their Community Tax Certificate Nos. as follows:
Andrew L. Tan Francisco C. Canuto
Doc. No. -~?1{_ Page No._--=-1"' __ Book No. ~~I' Series of2012
03208915 06982391
January 09, 2012 January 04, 2012
Quezon City Makati City
R~::i'K,...,..~,.-&.~ ..... I _l ' s ' .. NOTARY PU8L. ,
UNTIL DEC. 31, 2013 PTR NO. 318•sas. MAKATI C!I '( ·~~ ftO. 867717 PAStG c•rv .
A~~OU'4tMEMT NO- M-24S (2012.-20l.ll ~t&..E EXEiMPTIOM N0.1.0030fll
ROLL~.4375

The Board of Directors and Stockholders Megaworld Corporation and Subsidiaries 281
h Floor, The World Centre Building Sen. Gil Puyat Avenue, Makati City
T +63 2 886 5511 F +63 2 886 5506; +63 2 886 5507 www.punongbayan-araullo.com
We have audited the accompanying consolidated financial statements of Megaworld Corporation and Subsidiaries (the Group), which comprise the consolidated statements of financial position as at December 31, 2011 and 2010, and the consolidated statements of income, consolidated statements of comprehensive income, consolidated statements of changes in equity and consolidated statements of cash flows for each of the three years in the period ended December 31, 2011, and a summary of significant accounting policies and other explanatory information.
Management's Responsibility for the Consolidated Financial Statements
Management is responsible for the preparation and fair presentation of these consolidated financial statements in accordance with Philippine Financial Reporting Standards, and for such internal control as management determines is necessary to enable the preparation of consolidated financial statements that are free from material misstatement, whether due to fraud or error.
-I . -_, ~ --
--.... ......_ ,. --Certified Public Accountants - _,....

Punongbayan &...Araullo -2-
Auditors' Responsibility
Our responsibility is to express an opinion on these consolidated financial statements based on our audits. We conducted our audits in accordance with Philippine Standards on Auditing. Those standards require that we comply with ethical requirements and plan and perform the audit to obtain reasonable assurance about whether the consolidated financial statements are free from material misstatement.
An audit involves performing procedures to obtain audit evidence about the amounts and disclosures in the consolidated financial statements. The procedures selected depend on the auditor's judgment, including the assessment of the risks of material misstatement of the consolidated financial statements, whether due to fraud or error. In making those risk assessments, the· auditor considers internal control relevant to the entity's preparation and fair presentation of the consolidated financial statements in order to design audit procedures that are appropriate in the circumstances, but not for the purpose of expressing an opinion on the effectiveness of the entity's internal control. An audit also includes evaluating the appropriateness of accounting policies used and the reasonableness of accounting estimates made by management, as well as evaluating the overall presentation of the consolidated financial statements.
We believe that the audit evidence we have obtained is sufficient and appropriate to provide a basis for our audit opinion.
"/
.-' . ---
_,..

Punongbayan &.Araullo -3-
Opinion
In our opinion, the consolidated financial statements present fairly, in all material respects, the consolidated financial position of Megaworld Corporation and Subsidiaries as at December 31, 2011 and 2010, and their consolidated financial performance and their consolidated cash flows for each of the three years in the period ended December 31, 2011 in accordance with Philippine Financial Reporting Standards.
PUNONGBAYAN & ARAULLO
~L/d · ;. ~Di;uo
Partner
CPA Reg. No. 0097048 TIN 201-771-632 PTR No. 3174906,January 2, 2012, Makati City SEC Group A Accreditation
Partner- No. 1036-A (until Sept. 29, 2013) Firm- No. 0002-FR-3 (until Jan. 18, 2015)
BIR AN 08-002511-32-2011 (until Feb. 3, 2014) Firm's BOA/ PRC Cert. of Reg. No. 0002 (until Dec. 31, 2012)
March 26, 2012
---~. -- -- ---~.
. - -· . ,.. -,..

Notes 2011 2010
A S S E T S
CURRENT ASSETSCash and cash equivalents 5 30,324,479,180 P 22,031,584,943 P Trade and other receivables - net 6 17,178,451,090 14,133,801,384 Financial assets at fair value through profit or loss 7 109,203,260 125,000,000 Residential and condominium units for sale 3 19,497,662,902 6,286,477,215 Property development costs 3 8,753,452,084 3,798,108,537 Prepayments and other current assets - net 1,801,123,705 437,227,590
Total Current Assets 77,664,372,221 46,812,199,669
NON-CURRENT ASSETS
Trade and other receivables 6 20,209,042,452 15,617,214,463 Advances to landowners and joint ventures 9 3,888,345,313 2,708,026,497 Land for future development 2 4,366,523,063 1,482,561,015 Investments in available-for-sale securities 8 2,591,747,678 6,211,184,496 Investments in and advances to associates and other
related parties 10 6,745,964,129 13,671,332,490 Investment property - net 11 12,372,290,665 9,716,530,045 Property and equipment - net 12 540,859,730 360,518,201 Deferred tax assets - net 22 7,333,579 7,860,539 Other non-current assets 13 609,047,834 442,095,396
Total Non-current Assets 51,331,154,443 50,217,323,142
TOTAL ASSETS 128,995,526,664 P 97,029,522,811 P
MEGAWORLD CORPORATION AND SUBSIDIARIESCONSOLIDATED STATEMENTS OF FINANCIAL POSITION
DECEMBER 31, 2011 AND 2010(Amounts in Philippine Pesos)

Notes 2011 2010
LIABILITIES AND EQUITY
CURRENT LIABILITIESInterest-bearing loans and borrowings 14 1,879,292,646 P 1,311,354,897 P Bonds payable 15 - 3,416,062,159 Trade and other payables 16 7,296,966,494 4,037,713,348 Customers' deposits 2 3,610,212,295 1,013,053,489 Income tax payable 36,897,538 29,061,975 Reserve for property development 2 5,107,725,787 3,640,068,354 Deferred income on real estate sales 2 3,446,835,596 2,220,540,650 Other current liabilities 17 1,778,496,717 1,741,665,060
Total Current Liabilities 23,156,427,073 17,409,519,932
NON-CURRENT LIABILITIESInterest-bearing loans and borrowings 14 5,288,591,409 6,128,583,476 Bonds payable 15 13,538,914,490 5,000,000,000 Customers' deposits 2 456,003,854 1,222,422,709 Reserve for property development 2 3,719,081,747 2,487,557,735
Deferred income on real estate sales 2 1,809,305,117 1,588,240,851 Deferred tax liabilities - net 22 5,112,895,527 3,249,030,654 Advances from other related parties 23 210,242,443 289,868,257 Retirement benefit obligation 21 285,421,740 116,039,185 Other non-current liabilities 17 2,646,537,985 1,019,123,375
Total Non-current Liabilities 33,066,994,312 21,100,866,242
Total Liabilities 56,223,421,385 38,510,386,174
EQUITY 24
Total equity attributable to parent company's shareholders 60,956,151,542 57,776,023,630
Non-controlling interests 11,815,953,737 743,113,007
Total Equity 72,772,105,279 58,519,136,637
TOTAL LIABILITIES AND EQUITY 128,995,526,664 P 97,029,522,811 P
-2-
See Notes to Consolidated Financial Statements.

Notes 2011 2010 2009
REVENUESReal estate sales 6 15,887,590,800 P 13,110,567,020 P 12,574,801,962 P Interest income on real estate sales 6 1,218,788,823 933,424,160 714,213,230 Realized gross profit on prior years' sales 2 1,970,174,052 1,355,982,007 1,277,434,472 Rental income 11 3,826,341,215 2,694,310,554 2,000,477,427 Hotel operations 2 392,171,105 232,757,023 216,143,646 Equity in net earnings of associates,
interest and other income - net 19 5,330,031,746 2,214,742,331 975,587,944
28,625,097,741 20,541,783,095 17,758,658,681
COSTS AND EXPENSESReal estate sales 2 10,157,277,262 8,606,699,164 7,940,756,662 Operating expenses 18 4,116,225,061 2,140,225,634 1,808,120,886 Deferred gross profit 2 3,055,851,217 2,431,379,388 1,815,065,914 Interest and other charges - net 20 903,526,435 544,401,114 587,544,169 Hotel operations 2 223,731,697 124,463,666 103,017,443 Tax expense 22 1,995,469,148 1,609,101,525 1,437,541,131
20,452,080,820 15,456,270,491 13,692,046,205
PROFIT FOR THE YEARBEFORE PREACQUISITION INCOME 8,173,016,921 5,085,512,604 4,066,612,476
PREACQUISITION INCOME
MEGAWORLD CORPORATION AND SUBSIDIARIESCONSOLIDATED STATEMENTS OF INCOME
FOR THE YEARS ENDED DECEMBER 31, 2011, 2010 AND 2009(Amounts in Philippine Pesos)
QOF SUBSIDIARIES 1, 10 17,326,952)( - -
NET PROFIT FOR THE YEAR 8,155,689,969 P 5,085,512,604 P 4,066,612,476 P
Net profit attributable to:Parent company's shareholders 8,031,884,511 P 5,026,180,575 P 4,055,401,191 P Non-controlling interests 123,805,458 59,332,029 11,211,285
8,155,689,969 P 5,085,512,604 P 4,066,612,476 P
Earnings per ShareBasic and Diluted 25 0.319 P 0.200 P 0.176 P
See Notes to Consolidated Financial Statements.

Notes 2011 2010 2009
NET PROFIT FOR THE YEAR 8,155,689,969 P 5,085,512,604 P 4,066,612,476 P
OTHER COMPREHENSIVE INCOME (LOSS)Net unrealized gains (losses) on
available-for-sale (AFS) securities 8 690,525,167 )( 4,031,843,227 1,211,879,519 Reclassification adjustments for gains (losses)
on disposed AFS financial securitiesincluded in profit or loss 8 2,997,737,000 )( 473,319,584 )( 276,543,393
Reversal of unrealized losses on AFS securities of a deconsolidated subsidiary - 63,656,553 -
Share in other comprehensive income (loss)of associates 10 147,365 )( 71,176,649 -
3,688,409,532 )( 3,693,356,845 1,488,422,912
Translation adjustments 12,808,786 )( 186,558,030 )( 86,806,621 )( Less related tax 22, 2.4 3,842,636 55,967,408 26,041,986
8,966,150 )( 130,590,622 )( 60,764,635 )(
3,697,375,682 )( 3,562,766,223 1,427,658,277
TOTAL COMPREHENSIVE INCOME
FOR THE YEAR 4 458 314 287P 8 648 278 827P 5 494 270 753P
MEGAWORLD CORPORATION AND SUBSIDIARIESCONSOLIDATED STATEMENTS OF COMPREHENSIVE INCOME
FOR THE YEARS ENDED DECEMBER 31, 2011, 2010 AND 2009(Amounts in Philippine Pesos)
FOR THE YEAR 4,458,314,287 P 8,648,278,827 P 5,494,270,753 P
Total comprehensive income attributable to:Parent company's shareholders 4,334,508,829 P 8,588,946,798 P 5,483,059,468 P Non-controlling interests 123,805,458 59,332,029 11,211,285
4,458,314,287 P 8,648,278,827 P 5,494,270,753 P
See Notes to Consolidated Financial Statements.
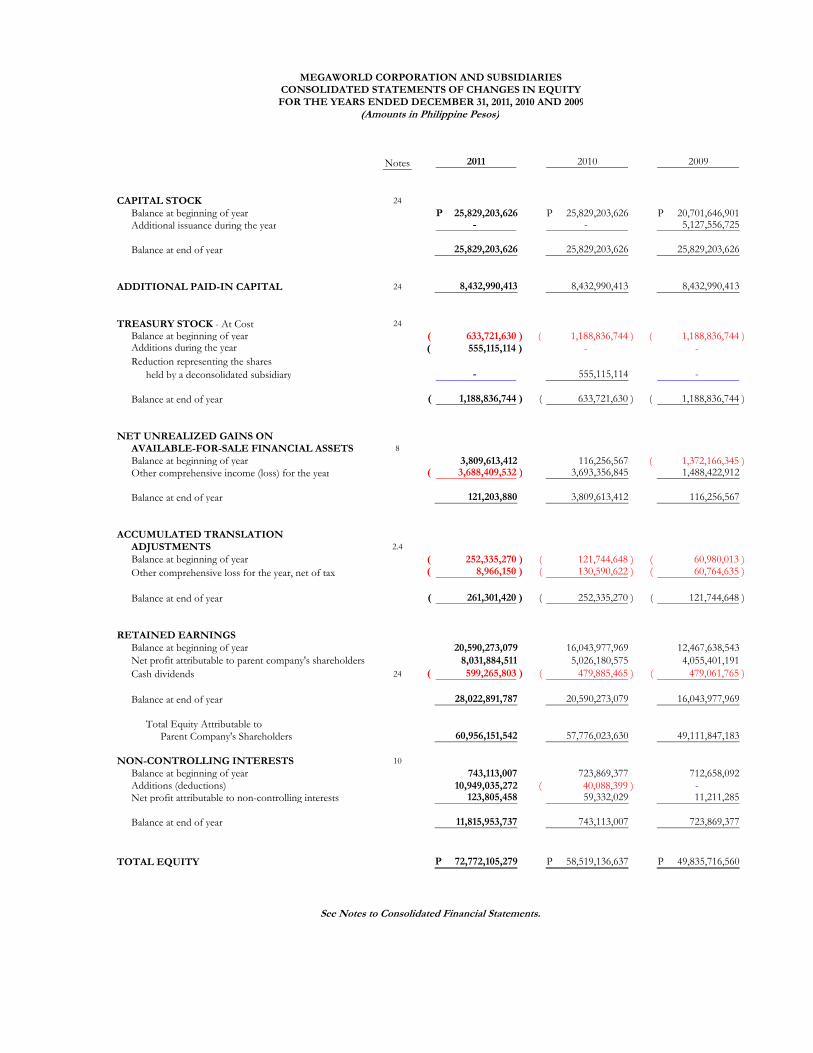
Notes 2011 2010 2009
CAPITAL STOCK 24
Balance at beginning of year 25,829,203,626 P 25,829,203,626 P 20,701,646,901 P Additional issuance during the year - - 5,127,556,725
Balance at end of year 25,829,203,626 25,829,203,626 25,829,203,626
ADDITIONAL PAID-IN CAPITAL 24 8,432,990,413 8,432,990,413 8,432,990,413
TREASURY STOCK - At Cost 24
Balance at beginning of year 633,721,630 )( 1,188,836,744 )( 1,188,836,744 )( Additions during the year 555,115,114 )( - - Reduction representing the shares
held by a deconsolidated subsidiary - 555,115,114 -
Balance at end of year 1,188,836,744 )( 633,721,630 )( 1,188,836,744 )(
NET UNREALIZED GAINS ONAVAILABLE-FOR-SALE FINANCIAL ASSETS 8
Balance at beginning of year 3,809,613,412 116,256,567 1,372,166,345 )( Other comprehensive income (loss) for the year 3,688,409,532 )( 3,693,356,845 1,488,422,912
Balance at end of year 121,203,880 3,809,613,412 116,256,567
ACCUMULATED TRANSLATIONADJUSTMENTS 2.4
Balance at beginning of year 252,335,270 )( 121,744,648 )( 60,980,013 )( Other comprehensive loss for the year, net of tax 8,966,150 )( 130,590,622 )( 60,764,635 )(
Balance at end of year 261,301,420 )( 252,335,270 )( 121,744,648 )(
RETAINED EARNINGSBalance at beginning of year 20,590,273,079 16,043,977,969 12,467,638,543 Net profit attributable to parent company's shareholders 8,031,884,511 5,026,180,575 4,055,401,191 Cash dividends 24 599,265,803 )( 479,885,465 )( 479,061,765 )(
Balance at end of year 28,022,891,787 20,590,273,079 16,043,977,969
Total Equity Attributable to Parent Company's Shareholders 60,956,151,542 57,776,023,630 49,111,847,183
NON-CONTROLLING INTERESTS 10
Balance at beginning of year 743,113,007 723,869,377 712,658,092 Additions (deductions) 10,949,035,272 40,088,399 )( - Net profit attributable to non-controlling interests 123,805,458 59,332,029 11,211,285
Balance at end of year 11,815,953,737 743,113,007 723,869,377
TOTAL EQUITY 72,772,105,279 P 58,519,136,637 P 49,835,716,560 P
See Notes to Consolidated Financial Statements.
MEGAWORLD CORPORATION AND SUBSIDIARIESCONSOLIDATED STATEMENTS OF CHANGES IN EQUITYFOR THE YEARS ENDED DECEMBER 31, 2011, 2010 AND 2009
(Amounts in Philippine Pesos)

Notes 2011 2010 2009
CASH FLOWS FROM OPERATING ACTIVITIESProfit before tax 10,151,159,117 P 6,694,614,129 P 5,504,153,607 P
Adjustments for:Gain on sale of investments in available-for-sale
securities 8 2,178,458,080 )( - - Interest income 19 1,618,727,549 )( 835,944,617 )( 690,238,144 )( Finance costs 20 884,058,862 516,440,321 556,326,705 Equity in net earnings of associates 10, 19 597,834,536 )( 442,281,307 )( 157,958,213 )( Depreciation and amortization 18 566,641,137 443,203,639 365,795,590 Dividend income 19 32,661,662 )( 40,630,134 )( 44,247,127 )( Fair value losses (gains) - net 19 7,851,631 83,500,000 )( 24,100,000 )(
Operating profit before working capital changes 7,182,028,920 6,251,902,031 5,509,732,418 Increase in trade and other receivables 2,332,556,852 )( 5,467,069,558 )( 6,201,387,858 )( Decrease (increase) in residential and
condominium units for sale 1,056,701,557 )( 412,044,886 127,249,526 Decrease (increase) in property development costs 236,023,249 )( 77,405,610 )( 112,428,459 Decrease (increase) in prepayments and other current assets 660,103,590 )( 69,471,133 )( 22,311,370 Decrease (increase) in advances to landowners and
joint ventures 698,482,342 1,500,000,001 )( 872,978,395 )( Increase in trade and other payables 2,461,337,793 204,094,188 854,376,714 Increase (decrease) in customers' deposits 543,697,574 )( 382,569,679 141,485,147 )( Increase in deferred income on real estate sales 1,195,329,212 1,075,230,757 537,798,066 Increase in reserve for property development 1,535,423,535 1,636,248,793 669,276,522 Increase in other liabilities 149,045,609 424,798,078 415,691,663
Cash generated from operations 8,392,564,589 3,272,942,110 1,033,013,338 Cash paid for income taxes 1,259,507,902 )( 946,782,440 )( 559,614,717 )(
Net Cash From Operating Activities 7,133,056,687 2,326,159,670 473,398,621
CASH FLOWS FROM INVESTING ACTIVITIESAdditions to:
Investment property 11 2,874,137,207 )( 991,266,588 )( 2,261,263,607 )(
MEGAWORLD CORPORATION AND SUBSIDIARIESCONSOLIDATED STATEMENTS OF CASH FLOWS
FOR THE YEARS ENDED DECEMBER 31, 2011, 2010 AND 2009(Amounts in Philippine Pesos)
p p y )( )( )(Land for future development 2,803,899,896 )( 213,000,015 )( - Property and equipment 12 87,466,426 )( 62,373,098 )( 33,162,257 )(
Net increase in investments in and advancesto associates and other related parties 2,049,692,784 )( 408,034,396 )( 238,527,057 )(
Net decrease in investment in available-for-sale securities 3,880,528,366 472,360,615 2,912,115,871 Interest received 1,618,727,549 835,944,617 689,655,133 Net decrease (increase) in other non-current assets 179,971,650 )( 221,527,843 )( 17,607,943 Dividends received 19 32,661,662 40,630,134 44,247,127 Payments made for the subscribed common stock of an associate 10 - - 1,583,687,182 )(
Net Cash Used in Investing Activities 2,463,250,386 )( 547,266,574 )( 453,014,029 )(
CASH FLOWS FROM FINANCING ACTIVITIESProceeds from long-term liabilities 14, 15 9,013,788,580 - 7,400,000,000 Payments of long-term liabilities 4,934,748,567 )( 1,052,209,181 )( 348,831,328 )( Interest paid 884,058,862 )( 1,323,861,629 )( 896,733,166 )( Cash dividends paid 24 599,265,803 )( 519,885,465 )( 479,061,765 )( Proceeds from exercise of stock rights 24 - 2,272,642,649 2,854,914,076
Net Cash From (Used in) Financing Activities 2,595,715,348 623,313,626 )( 8,530,287,817
NET INCREASE IN CASH AND CASH EQUIVALENTS 7,265,521,649 1,155,579,470 8,550,672,409
BEGINNING BALANCE OF CASH AND CASH EQUIVALENTS OF ACQUIRED SUBSIDIARIES 1,624,146,150 - -
PREACQUISITION CHANGES IN CASH AND CASHEQUIVALENTS OF ACQUIRED SUBSIDIARIES 596,773,562 )( - -
CASH AND CASH EQUIVALENTS
AT BEGINNING OF YEAR 22,031,584,943 20,876,005,473 12,325,333,064
CASH AND CASH EQUIVALENTS
AT END OF YEAR 30,324,479,180 P 22,031,584,943 P 20,876,005,473 P
Supplemental Information on Non-cash Investing and Financing Activities
In the normal course of business, the Group enters into non-cash transactions such as exchanges or purchases on account of real estate and other assets. Other non-cash transactions include transfers of property from Land for Future Development to Property Development Costs or Investment Property as the property goes through its various stages of development. These non-cash activities are not reflected in the consolidated statements of cash flows (see Notes 9 and 11) .

MEGAWORLD CORPORATION AND SUBSIDIARIES NOTES TO CONSOLIDATED FINANCIAL STATEMENTS
DECEMBER 31, 2011, 2010 AND 2009 (Amounts in Philippine Pesos)
1. CORPORATE INFORMATION Megaworld Corporation (the Company or parent company) was incorporated in the
Philippines on August 24, 1989, primarily to engage in the development of large scale mixed-use planned communities or townships that integrate residential, commercial, leisure and entertainment components. The Company is presently engaged in property-related activities, such as, project design, construction and property management. The Company’s real estate portfolio includes residential condominium units, subdivision lots and townhouses, as well as office projects and retail spaces.
All of the Company’s common shares of stock are listed at the Philippine Stock
Exchange (PSE).
The registered office of the Company, which is also its principal place of business, is located at the 28th Floor, The World Centre Building, Sen. Gil Puyat Avenue, Makati City.
Alliance Global Group, Inc. (AGI), also a publicly listed company in the Philippines, is the Group’s ultimate parent company. AGI is a holding company and is presently engaged in the food and beverage business, real estate, quick service restaurant and tourism-oriented businesses. AGI’s registered office, which is also its primary place of business, is located at the 7th Floor, 1880 Eastwood Avenue, Eastwood City CyberPark, 188 E. Rodriguez Jr. Avenue, Quezon City.
The Company holds interests in the following subsidiaries and associates: Explanatory Percentage of Ownership
Subsidiaries/Associates Notes 2011 2010 2009
Subsidiaries:
Megaworld Land, Inc. (MLI) 100% 100% 100%
Prestige Hotels and Resorts, Inc. (PHRI) (a) 100% 100% 100%
MactanOceanview Properties
and Holdings, Inc. (MOPHI) 100% 100% 100%
Megaworld Cayman Islands, Inc. (MCII) 100% 100% 100%
Richmonde Hotel Group International (RHGI) 100% 100% 100%
Eastwood Cyber One Corporation (ECOC) 100% 100% 100%
Forbes Town Properties and Holdings, Inc. (FTPHI) 100% 100% 100%
Megaworld Newport Property
Holdings, Inc. (MNPHI) 100% 100% 100%
Oceantown Properties, Inc. (OPI) 100% 100% 100%
Piedmont Property Ventures, Inc. (PPVI) (b) 100% 100% 100%
Stonehaven Land, Inc. (SLI) (b) 100% 100% 100%
Streamwood Property, Inc. (SP) (b) 100% 100% 100%
Suntrust Properties, Inc. (SPI) (c) 82.45% - -
Empire East Land Holdings, Inc. and
Subsidiaries (EELHI) (d) 61.13% - -
Megaworld-Daewoo Corporation (MDC) 60% 60% 60%
Manila Bayshore Property Holdings, Inc. (MBPHI) (e) 55% - -
Megaworld Central Properties, Inc. (MCPI) 51% 51% 51%
Megaworld Resort Estates, Inc. (MREI) (f) 51% 51% 51%

- 2 -
Explanatory Percentage of Ownership
Subsidiaries/Associates Notes 2011 2010 2009
Subsidiaries:
Megaworld Globus Asia, Inc. (MGAI) 50% 50% 50%
Philippine International Properties, Inc. (PIPI) (g) 50% 50% 50%
Gilmore Property Marketing Associates, Inc. (GPMAI) (h) 46.45% - 31%
Townsquare Development, Inc. (TDI) (i) 31% 31% 31%
Associates:
Suntrust Home Developers, Inc. (SHDI) 42.48% 42.48% 42.48%
Palm Tree Holdings and Development
Corporation (PTHDC) 40% 40% 40%
MegaworldGlobal Estates, Inc. (MGEI) (l) 40% - -
Alliance Global Properties Ltd. (AGPL) (j) 39.44% 39.44% 44.34%
Travellers International Hotel Group, Inc. (TIHGI) (k) 10% 10% 10%
EELHI (d) - 48.38% 48.38%
GPMAI (h) - 39.83% -
Explanatory Notes:
(a) Wholly owned subsidiary of MLI.
(b) Acquired subsidiaries in 2008 but have not yet started commercial operations as of
December 31, 2011. (c) In March 2011, the Company acquired 59% ownership in SPI. On December 31, 2011, the Company held a
42.48% share in SHDI and a 61.13% share in EELHI. However, since SHDI and EELHI in turn own 8%
and 33% of SPI, respectively, this results to an additional indirect ownership of 23.5%. As a result, the
Company owns SPI by 82.45%.
(d) On various dates in2011,the Company acquired an additional 12.75% ownership in EELHI, thereby making
EELHI a subsidiary of the Company.As of December 31, 2011, the Company’s ownership in EELHI stands
at 61.13%. (e) MBPHI was incorporated in October 2011 and has not yet started commercial operations as of December
31, 2011. MBPHI is also 50% owned by TIHGI, thereby increasing the Company’s ownership to 55%.
TIHGI is 10% owned by the Company. (f) MREI was incorporated in 2007. MREI owns 60% of TDI as of December 31, 2011 resulting in the
Company’s indirect interest of 31% of TDI. (g) PIPI was incorporated in 2002 and acquired by the Company in 2006; has not yet started commercial
operations as of December 31, 2011.
(h) In November 2007, MREI acquired 100% ownership in GPMAI which resulted in the Company’s indirect
interest of 51% as of December 31, 2007. In 2008, MREI’s ownership in GPMAI decreased to 60%; it
further decreased to 28.85% in 2010. GPMAI was consolidated starting 2007 up to 2009; in 2010, it was
deconsolidated and treated as an associate of the Group. As of December 31, 2011, EELHI has a 51.92%
ownership in GPMAI bringing the Company’s indirect ownership to 46.45%. Consequently, GPMAI
became a subsidiary of the Company through EELHI, its intermediate parent company. (i) TDI was incorporated in 2006 and is owned by MREI at 60%. In this regard, the Company has indirect
interest in TDI of 31%.
(j) In February 2009, RHGI acquired 44.34% ownership in AGPL, which resulted in the Company’s indirect
interest of 44.34% as of December 31, 2009. In October 2010, AGPL issued additional shares of stock
which resulted in the decrease in RHGI’s ownership in AGPL to 39.44%. AGPL is considered as an
associate due to the Company’s significant influence, but not control, on AGPL.
(k) TIHGI was incorporated in 2003 and started commercial operations in August 2009. In 2008, the Company
acquired 10% ownership in TIHGI through a share swap agreement. In August 2010, the Company’s
investment in TIHGI was converted to 10.0 million common shares and 990.0 million preferred shares of
TIHGI. Subsequently, in November 2010, TIHGI redeemed the 430.0 million preferred shares held by the
Company. The conversion of common shares and the redemption of preferred shares did not change the
Company’s ownership in TIHGI. Although the Company’s percentage ownership is only 10%, TIHGI was
considered as an associate due to the Company’s significant influence on TIHGI.

- 3 -
(l) MGEI was registered with the Securities and Exchange Commission on March 14, 2011 and has not yet
started commercial operations as of December 31, 2011.
Except for MCII, RHGI and AGPL, all the subsidiaries and associates were incorporated in the Philippines and operate within the country. MCII and AGPL were incorporated and operate in the Cayman Islands while RHGI was incorporated and operates in the British Virgin Islands.
The Company and its subsidiaries collectively, except for MBPHI, MGEI, PIPI, PPVI, SLI and SP, which are not yet in commercial operations as of December 31, 2011, are presently engaged in the real estate business, hotel operations and marketing services.
EELHI and SHDI are publicly listed companies in the Philippines.
The consolidated financial statements of the Group for the year ended December 31, 2011 (including the comparatives for the years ended December 31, 2010and 2009) were authorized for issue by the Company’s Board of Directors (BOD) on March 26, 2012.
2. SUMMARY OF SIGNIFICANT ACCOUNTING POLICIES
The significant accounting policies that have been used in the preparation of these consolidated financial statements are summarized below. The policies have been consistently applied to all the years presented, unless otherwise stated. 2.1 Basis of Preparation of Consolidated Financial Statements
(a) Statement of Compliance with Philippine Financial Reporting Standards
The consolidated financial statements of the Group have been prepared in accordance with Philippine Financial Reporting Standards (PFRS). PFRS are adopted by the Financial Reporting Standards Council (FRSC), from the pronouncements issued by the International Accounting Standards Board. The consolidated financial statements have been prepared using the measurement bases specified by PFRS for each type of asset, liability, income and expense. These consolidated financial statements have been prepared on the historical cost basis, except for the revaluation of certain financial assets. The measurement bases are more fully described in the accounting policies that follow.
(b) Presentation of Consolidated Financial Statements
The consolidated financial statements are presented in accordance with Philippine Accounting Standard (PAS 1), Presentation of Financial Statements. The Group presents all items of income and expense in two statements: a consolidated statement of income and a consolidated statement of comprehensive income. Two comparative periods are presented for the consolidated statement of financial position when the Group applies an accounting policy retrospectively or makes a retrospective restatement of items in its consolidated financial statements, or reclassifies items in the consolidated financial statements.

- 4 -
(c) Functional and Presentation Currency These consolidated financial statements are presented in Philippine pesos, the Company’s presentation and functional currency, and all values represent absolute amounts except when otherwise indicated. Items included in the consolidated financial statements of the Group are measured using the Company’s functional currency. Functional currency is the currency of the primary economic environment in which an entity operates.
2.2 Adoption of New and Amended PFRS
(a) Effective in 2011 that are Relevant to the Group
In 2011, the Group adopted the following amendments, revisions, interpretations and annual improvements to existing PFRS that are relevant to the Group and effective for its consolidated financial statements for the annual period beginning on or after July 1, 2010 or January 1, 2011.
PAS 24 (Amendment) : Related Party Disclosures
PAS 32 (Amendment) : Financial Instruments: Presentation – Classification of Rights Issue
Philippine Interpretation International Financial Reporting Interpretations Committee (IFRIC) 14 (Amendment) : Prepayment of a Minimum Funding
Requirement IFRIC 19 : Extinguishing Financial Liabilities with
Equity Instruments Various Standards : 2010 Annual Improvements to PFRS
Below is a discussion of the impact of these accounting standards. (i) PAS 24 (Amendment), Related Party Disclosures (effective from January 1, 2011).
The amendment simplifies and clarifies the definition of a related party by eliminating inconsistencies in determining related party relationships. The amendment also provides partial exemption from the disclosure requirements for government-related entities to disclose details of all transactions with the government and other government-related entities. The adoption of this amendment did not result in any significant change on the Group’s disclosures of related parties in its consolidated financial statements.
(ii) PAS 32 (Amendment), Financial Instruments: Presentation – Classification of Rights Issues (effective from February 1, 2010). The amendment addresses the accounting for rights issues (e.g., rights, options or warrants) that are denominated in a currency other than the functional currency of the issuer. In particular, rights (and similar derivatives) to acquire a fixed number of an entity’s own equity instruments for a fixed price stated in a currency other than the entity’s functional currency, would be classified as equity instruments, provided the entity offers the rights pro rata to all of its existing owners of the same class of its own non-derivative equity instruments. The amendment has no effect on the consolidated financial statements as the Group has no rights issues denominated in a currency other than the Group’s functional currency.

- 5 -
(iii) Philippine Interpretation IFRIC 14 (Amendment), Prepayments of a Minimum Funding Requirement (effective from January 1, 2011). This interpretation addresses unintended consequences that can arise from the previous requirements when an entity prepays future contributions into a defined benefit pension plan. It sets out guidance on when an entity recognizes an asset in relation to a surplus for defined benefit plans based on PAS 19, Employee Benefits that are subject to a minimum funding requirement. The adoption to the amendment did not have a material effect on its consolidated financial statements because it does not usually make substantial advance contributions to its retirement fund and the Group is not subject to a minimum funding requirement.
(iv) Philippine Interpretation IFRIC 19, Extinguishing Financial Liabilities with Equity
Instruments (effective from July 1, 2010). This interpretation clarifies the accounting when an entity renegotiates the terms of a financial liability through issuance of equity instruments to extinguish all or part of the financial liability. These transactions are sometimes referred to as “debt for equity” exchanges or swaps. The interpretation requires the debtor to account for a financial liability which is extinguished by equity instruments as follows: the issue of equity instruments to a creditor to extinguish all or part of a
financial liability is consideration paid in accordance with PAS 39, Financial Instruments: Recognition and Measurement;
the entity measures the equity instruments issued at fair value, unless this cannot be reliably measured;
if the fair value of the equity instruments cannot be reliably measured,
then the fair value of the financial liability extinguished is used; and, the difference between the carrying amount of the financial liability
extinguished and the consideration paid is recognized in profit or loss. The adoption of the interpretation did not have a material effect on the Group’s consolidated financial statements as it did not extinguish financial liabilities through equity swap during the year.
(v) 2010 Annual Improvements to PFRS. The FRSC has adopted the 2010 Improvements to PFRS. Most of these amendments became effective for annual periods beginning on or after July 1, 2010 or January 1, 2011. Among those improvements, only the following amendments were identified to be relevant to the consolidated financial statements which did not have any material impact: PAS 1 (Amendment), Presentation of Financial Statements: Clarification of
Statement of Changes in Equity (effective from July 1, 2010). The amendment clarifies that, for each component of equity, an entity may present an analysis of other comprehensive income either in the statement of changes in equity or in the notes to the financial statements. The Group opted to continue to present other comprehensive income in the statement of comprehensive income.
- 6 -
PAS 27 (Amendment), Consolidated and Separate Financial Statements (effective from July 1, 2010). This amendment clarifies that the consequential amendments made to PAS 21, The Effect of Changes in Foreign Exchange Rates, PAS 28, Investment in Associate, and, PAS 31, Investment in Joint Ventures, arising from the PAS 27 (2008) amendments apply prospectively, to be consistent with the related PAS 27 transition requirements.
PAS 34 (Amendment), Interim Financial Reporting – Significant Event and
Transactions (effective from January 1, 2011). The amendment provides further guidance to illustrate how to apply disclosure principles under PAS 34 for significant events and transactions to improve interim financial reporting. It requires additional disclosure covering significant changes to fair value measurement and classification of financial instruments, and to update relevant information from the most recent annual report.
PFRS 3 (Amendments), Business Combinations (effective from
July 1, 2010). The amendment clarifies that contingent consideration arrangement and balances arising from business combinations with acquisition dates prior to the entity’s date of adoption of PFRS 3 (Revised 2008) shall not be adjusted on the adoption date. It also provides guidance on the subsequent accounting for such balances. It further clarifies that the choice of measuring non-controlling interest (NCI) at fair value or at the proportionate share in the recognized amounts of an acquiree’s identifiable net assets, applies only to instruments that represent present ownership interests and entitle their holders to a proportionate share of the acquiree’s net assets in the event of liquidation. All other components of NCI are measured at fair value unless PFRS requires another measurement basis. This amendment also clarifies accounting for all share-based payment transactions that are part of a business combination, including unreplaced and voluntary replaced share-based payment awards. Specifically, this provides guidance for situations where the acquirer does not have an obligation to replace an award but replaces an existing acquiree award that would otherwise have continued unchanged after the acquisition, thus resulting to the accounting for these awards being the same as for the awards that the acquirer is obliged to replace.
PFRS 7 (Amendment), Financial Instruments: Clarification of Disclosures
(effective from January 1, 2011). The amendment clarifies the disclosure requirements which emphasize the interaction between quantitative and qualitative disclosures about the nature and extent of risks arising from financial instruments. It also amends the required disclosure of financial assets including the financial effect of collateral held as security.
- 7 -
(b) Effective in 2011 that are not Relevant to the Group
The following amendments and interpretations to published standards are mandatory for accounting periods beginning on or after January 1, 2010 but are not relevant to the Group’s consolidated financial statements:
PFRS 1 (Amendment) : First-Time Adoption of PFRS –
Financial Instruments Disclosures 2010 Annual Improvements
PFRS 1 (Amendment) : First-Time Adoption of PFRS IFRIC 13 (Amendment) : Customer Loyalty Programmes – Fair
Value Awards Credits
(c) Effective Subsequent to 2011 but not Adopted Early
There are new PFRS, amendments and annual improvements to existing standards that are effective for periods subsequent to 2011. Management has initially determined the following pronouncements, which the Group will apply in accordance with their transitional provisions, to be relevant to its consolidated financial statements: (i) PFRS 7 (Amendment), Financial Instruments: Disclosures – Transfers of Financial
Assets (effective from July 1, 2011). The amendment requires additional disclosures that will allow users of financial statements to understand the relationship between transferred financial assets that are not derecognized in their entirety and the associated liabilities; and, to evaluate the nature of, and risk associated with any continuing involvement of the reporting entity in financial assets that are derecognized in their entirety. The Group does not usually enter into this type of arrangement with regard to transfer of financial assets, hence, the amendment may not significantly change the Group’s disclosures in its consolidated financial statements.
(ii) PFRS 13, Fair Value Measurement (effective from January 1, 2013). This standard aims to improve consistency and reduce complexity by providing a precise definition of fair value and a single source of fair value measurement and disclosure requirements for use across PFRS. The requirements do not extend the use of fair value accounting but provide guidance on how it should be applied where its use is already required or permitted by other standards. The Group is yet to assess the impact of this new standard.

- 8 -
(iii) Philippine Interpretation IFRIC 15, Agreements for Construction of Real Estate. This Philippine interpretation is based on IFRIC interpretation issued by the IASB in July 2008 effective for annual periods beginning on or after January 1, 2009. The adoption of this interpretation in the Philippines, however, was deferred by the FRSC and the Philippine Securities and Exchange Commission after giving due considerations on various application issues and the implication on this interpretation of the IASB's on-going revision of the Revenue Recognition standard. This interpretation provides guidance on how to determine whether an agreement for the construction of real estate is within the scope of PAS 11, Construction Contracts, or PAS 18, Revenue, and accordingly, when revenue from the construction should be recognized. The main expected change in practice is a shift from recognizing revenue using the percentage of completion method (i.e., as a construction progresses, by reference to the stage of completion of the development) to recognizing revenue upon completion or after delivery. The Company is currently evaluating the impact of this interpretation on its financial statements in preparation for its adoption when this becomes mandatorily effective in the Philippines.
(iv) PFRS 9, Financial Instruments: Classification and Measurement (effective
January 1, 2015). This is the first part of a new standard on classification and measurement of financial assets and financial liabilities that will replace PAS 39 in its entirety. This chapter deals with two measurement categories for financial assets: amortized cost and fair value. All equity instruments will be measured at fair value while debt instruments will be measured at amortized cost only if the entity is holding it to collect contractual cash flows which represent payment of principal and interest. The accounting for embedded derivatives in host contracts that are financial assets is simplified by removing the requirement to consider whether or not they are closely related, and, in most arrangements, does not require separation from the host contract. For liabilities, the standard retains most of the PAS 39 requirements which include amortized-cost accounting for most financial liabilities, with bifurcation of embedded derivatives. The main change is that, in case where the fair value option is taken for financial liabilities, the part of a fair value change due to an entity’s own credit risk is recorded in other comprehensive income rather than in profit or loss, unless this creates an accounting mismatch.
To date, other chapters of PFRS 9 dealing with impairment methodology and hedge accounting are still being completed.
The Group does not expect to implement and adopt PFRS 9 until its effective date or until all chapters of this new standard have been published. Nevertheless, management is currently assessing the impact of PFRS 9 on the financial statements of the Group and is committed to conduct a comprehensive study of the potential impact of this standard to assess the impact of all changes.

- 9 -
(v) Consolidation Standards PFRS 10, Consolidated Financial Statements (effective from
January 1, 2013). This standard builds on existing principles of consolidation by identifying the concept of control as the determining factor in whether an entity should be included within the consolidated financial statements. The standard also provides additional guidance to assist in determining control where this is difficult to assess.
PFRS 12, Disclosure of Interest in Other Entities (effective from January 1, 2013). This standard integrates and makes consistent the disclosure requirements for all forms of interests in other entities, including joint arrangements, associate, special purpose vehicles and unconsolidated structured entities. This also introduces new disclosure requirements about the risks to which an entity is exposed from its involvement with structured entities.
PAS 27 (Revised), Separate Financial Statements (effective from
January 1, 2013). This revised standard now covers the requirements pertaining solely to separate financial statements after the relevant discussions on control and consolidated financial statements have been transferred and included in the new PFRS 10. No new major changes relating to separate financial statements have been introduced as a result of the revision.
PAS 28 (Revised), Investments in Associate and Joint Venture (effective from
January 1, 2013). This revised standard includes the requirements for joint ventures, as well as associate, to be accounted for using equity method following the issuance of PFRS 11, Joint Arrangement. The Group is currently reviewing the impact of the above consolidation standards on its financial statements in time for its adoptionin 2013.
2.3 Basis of Consolidation The Company obtains and exercises control through voting rights. The Group’s consolidated financial statements comprise the accounts of the Company and its subsidiaries as enumerated in Note 1, after the elimination of material intercompany transactions. All intercompany balances and transactions with subsidiaries, including income, expenses and dividends are eliminated in full. Unrealized profits and losses from intercompany transactions that are recognized in assets are also eliminated in full. In addition, shares of stock of the Company held by the subsidiaries are recognized as treasury stock and these are presented as deduction in the consolidated statement of changes in equity. Any changes in the market values of such shares as recognized separately by the subsidiaries are likewise eliminated in full. Intercompany losses that indicate impairment are recognized in the consolidated financial statements.
The financial statements of subsidiaries are prepared for the same reporting period as the Company, using consistent accounting policies. Adjustments are made to bring into line any dissimilar accounting policies that may exist.

- 10 -
The Company accounts for its investments in subsidiaries, associates, interests in jointly controlled operations and non-controlling interest as follows: (a) Investments in Subsidiaries
Subsidiaries are all entities over which the Company has the power to control the financial and operating policies generally accompanying a shareholding of more than one half of the voting rights. The existence and effect of potential voting rights that are currently exercisable or convertible are considered when assessing whether the Company controls another entity. Subsidiaries are consolidated from the date the Company obtains control, direct or indirect, until such time that such control ceases. The acquisition method is applied to account for acquired subsidiaries. This requires recognizing and measuring the identifiable assets acquired, the liabilities assumed and any non-controlling interest in the acquiree. The consideration transferred for the acquisition of a subsidiary is the fair values of the assets transferred, the liabilities incurred and the equity interests issued by the Company, if any. The consideration transferred also includes the fair value of any asset or liability resulting from a contingent consideration arrangement. Acquisition-related costs are expensed as incurred and subsequent change in the fair value of contingent consideration is recognized directly in profit or loss.
Identifiable assets acquired and liabilities and contingent liabilities assumed in a business combination are measured initially at their fair values at the acquisition date. On an acquisition-by-acquisition basis, the Group recognizes any non-controlling interest in the acquiree either at fair value or at the non-controlling interest’s proportionate share of the acquiree’s net assets. The excess of the consideration transferred, the amount of any non-controlling interest in the acquiree and the acquisition-date fair value of any existing equity interest in the acquiree over the acquisition-date fair value of the identifiable net assets acquired is recognized as goodwill (see also Note 2.10). If the consideration transferred is less than the fair value of the net assets of the subsidiary acquired in the case of a bargain purchase, the difference is recognized directly in profit or loss as gain.
(b) Investments in Associates
Associates are those entities over which the Company is able to exert significant influence but not control and are neither subsidiaries nor interests in a joint venture. Investments in associates are initially recognized at cost and subsequently accounted for in the consolidated financial statements using the equity method. Acquired investments in associates are also subject to purchase accounting. However, any goodwill or fair value adjustment attributable to the share in the associate is included in the amount recognized as Investment in Associates. All subsequent changes to the share of interest in the equity of the associate are recognized in the Group’s carrying amount of the investment.

- 11 -
Changes resulting from the profit or loss generated by the associate are shown as part of Equity in Net Earnings of Associates, Interest and Other Income - net in the Group’s consolidated statements of income and, therefore, affect the net results of the Group. Changes resulting from other comprehensive income of the associates or items recognized directly in the associates’ equity are recognized in other comprehensive income or equity of the Group, as applicable. When the Group’s share of losses in an associate equals or exceeds its interest in the associate, including any other unsecured receivables, the Group does not recognize further losses, unless it has commitments, has incurred obligations or made payments on behalf of the associate.
Unrealized gains on transactions between the Group and its associates are eliminated to the extent of the Group’s interest in the associates. Unrealized losses are also eliminated unless the transaction provides evidence of an impairment of the assets transferred. Accounting policies of associates have been changed where necessary to ensure consistency with the policies adopted by the Group.
(c) Interests in Jointly Controlled Operations
For interests in jointly controlled operations, the Group recognized in its consolidated financial statements the assets that it controls, the liabilities and the expenses that it incurs and its share in the income from the sale of goods or services by the joint venture. The amounts of these related accounts are presented as part of the regular asset and liability accounts and income and expense accounts of the Group. No adjustment or other consolidation procedures are required for the assets, liabilities, income and expenses of the joint venture that are recognized in the separate financial statements of the venturers.
(d) Transactions with Non-controlling Interests
The Group applies a policy of treating transactions with non-controlling interests as transactions with equity owners of the Group. Any difference between any consideration paid and the relevant share acquired of the carrying value of the net assets of the subsidiary is recognized in equity. Disposals of equity investments to non-controlling interests result in gains and losses that are also recognized in equity. When the Company ceases to have control over a subsidiary, any retained interest in the entity is remeasured to its fair value, with the change in carrying amount recognized in profit or loss. The fair value is the initial carrying amount for the purposes of subsequently accounting for the retained interest as an associate, joint venture or financial asset. In addition, any amounts previously recognized in other comprehensive income in respect of that entity are accounted for as if the Company had directly disposed of the related assets or liabilities. This may mean that amounts previously recognized in other comprehensive income are reclassified to profit or loss.

- 12 -
Upon adoption in 2010 of PAS 27 (Revised 2008), Consolidated and Separate Financial Statements, the Group has changed its accounting policy for transactions with non-controlling interests and the accounting for loss of control or significant influence. It has applied the new policy prospectively as required by the standards beginning January 1, 2010. As a result, no adjustments were necessary to any of the amounts previously recognized and reported in the consolidated financial statements. Before the adoption of the revised PAS 27 in 2010, transactions with non-controlling interests were treated as transactions with parties external to the Group. As such, disposals resulted in gains or losses in profit or loss and purchases resulted in the recognition of goodwill. On disposal or partial disposal, a proportionate interest in reserves attributable to the subsidiary was reclassified to profit or loss or directly to retained earnings.
Also prior to 2010, when the Group ceased to have control or significant influence over an entity, the carrying amount of the investment at the date control or significant influence was lost became its cost for the purposes of subsequently accounting for the retained interests as associates, jointly controlled entity or financial assets.
2.4 Foreign Currency Transactions
(a) Transactions and Balances
Except for MCII, RHGI and AGPL, which use the U.S. dollars as their functional currency, the accounting records of the Group are maintained in Philippine pesos. Foreign currency transactions during the year are translated into the functional currency at exchange rates which approximate those prevailing on transaction dates.
Foreign currency gains and losses resulting from the settlement of such transactions and from the translation at year-end exchange rates of monetary assets and liabilities denominated in foreign currencies are recognized under Interest and Other Charges – net in the consolidated statement of income.
(b) Translation of Financial Statements of Foreign Subsidiaries and an Associate
The operating results and financial position of MCII and RHGI, which are measured using the U.S. dollars, their functional currency, are translated to Philippine pesos, the Company’s functional currency, as follows:
(i) Assets and liabilities for each statement of financial position presented are
translated at the closing rate at the end reporting period;
(ii) Income and expenses for each profit or loss account are translated at the annual average exchange rates (unless this average is not a reasonable approximation of the cumulative effect of the rates prevailing on the transaction dates, in which case income and expenses are translated at the dates of the transactions); and,
(iii) All resulting exchange differences are recognized as a separate component of
equity.

- 13 -
On consolidation, exchange differences arising from the translation of the net investment in MCII and RHGI are recognized as Translation Adjustments in the consolidated statement of comprehensive income. As these entities are wholly owned subsidiaries, the translation adjustments are fully allocated to the parent company’s shareholders.
Goodwill arising on the acquisition of a foreign entity is treated as an asset of the foreign entity and translated at the closing rate.
The translation of the financial statements into Philippine pesos should not be construed as a representation that the U.S. dollar amounts could be converted into Philippine peso amounts at the translation rates or at any other rates of exchange.
The Company’s equity in net earnings or loss of AGPL, which is also measured in U.S. dollars, is translated to Philippine pesos using the annual average exchange rates.
2.5 Financial Assets Financial assets are recognized when the Group becomes a party to the contractual terms of the financial instruments. Financial assets other than those designated and effective as hedging instruments are classified into the following categories: financial assets at fair value through profit or loss (FVTPL), loans and receivables, held-to-maturity investments and available-for-sale (AFS) financial assets. Financial assets are assigned to the different categories by management on initial recognition, depending on the purpose for which the investments were acquired.
Regular purchases and sales of financial assets are recognized on their trade date. All financial assets that are not classified as at FVTPL are initially recognized at fair value plus any directly attributable transaction costs. Financial assets carried at FVTPL are initially recorded at fair value and transaction costs related to it are recognized in profit or loss.
The Group’s financial instruments are currently lodged in the following classifications: (a) Financial Assets at FVTPL
This category includes financial assets that are either classified as held for trading or that meet certain conditions and are designated by the entity to be carried at fair value through profit or loss upon initial recognition. All derivatives fall into this category, except for those designated and effective as hedging instruments. Assets in this category are classified as current if they are either held for trading or are expected to be realized within 12 months from the end of the reporting period.
Financial assets at FVTPL are measured at fair value, and changes therein are recognized in profit or loss. Financial assets (except derivatives and financial instruments originally designated as financial assets at FVTPL) may be reclassified out of FVTPL category if they are no longer held for the purpose of being sold or repurchased in the near term.

- 14 -
(b) Loans and Receivables
Loans and receivables are non-derivative financial assets with fixed or determinable payments that are not quoted in an active market. They arise when the Group provides money, goods or services directly to a debtor with no intention of trading the receivables. These are included in current assets, except for maturities greater than 12 months after the reporting period which are classified as non-current assets.
Loans and receivables are subsequently measured at amortized cost using the
effective interest method, less impairment losses. Impairment loss is provided when there is objective evidence that the Group will not be able to collect all amounts due to it in accordance with the original terms of the receivables. The amount of the impairment loss is determined as the difference between the assets’ carrying amount and the present value of estimated cash flows discounted at the effective interest rate.
Loans and receivables are presented as Cash and Cash Equivalents, Trade and Other Receivables (excluding Advances to Contractors and Suppliers), and Advances to Associates and Other Related Parties in the consolidated statement of financial position. Cash and cash equivalents are defined as cash on hand, demand deposits and short-term, highly liquid investments readily convertible to known amounts of cash and which are subject to insignificant risk of changes in value.
Trade receivables, which generally have one-year to five-year terms, are noninterest-bearing instruments recognized initially at fair value and subsequently stated at amortized cost using the effective interest method for maturities beyond one year, less accumulated impairment losses, if any. An impairment loss is provided when there is objective evidence that the Group will not be able to collect all amounts due according to the original terms of receivables. Significant financial difficulties of the debtor, probability that the debtor will enter bankruptcy or financial reorganization, and default or delinquency in payments are considered indicators that the trade receivable is impaired.
(c) AFS Financial Assets
This includes non-derivative financial assets that are either designated to this category or do not qualify for inclusion in any of the other categories of financial assets. They are included as Investments in AFS Securities under non-current assets section in the consolidated statement of financial position unless management intends to dispose of the investment within 12 months of the reporting period.
All AFS financial assets are measured at fair value, unless otherwise disclosed, with changes in value recognized in other comprehensive income, net of any effects arising from income taxes. When the asset is disposed of or is determined to be impaired, the cumulative gain or loss recognized in other comprehensive income is reclassified from Net Unrealized Gains (Losses) on AFS Financial Assets to profit or loss and presented as reclassification adjustment within other comprehensive income. Reversal of impairment loss is recognized in other comprehensive income, except for financial assets that are debt securities which are recognized in profit or loss only if the reversal can be objectively related to an event occurring after the impairment loss was recognized.

- 15 -
All income and expenses, including impairment losses, relating to financial assets that are recognized in profit or loss are presented as part of Equity in Net Earnings of Associates, Interest and Other Income - net and Interest and Other Charges – net accounts in the consolidated statement of income.
For investments that are actively traded in organized financial markets, fair value is determined by reference to stock exchange-quoted market bid prices at the close of business on the reporting period. For investments where there is no quoted market price, fair value is determined by reference to the current market value of another instrument which is substantially the same or is calculated based on the expected cash flows of the underlying net asset base of the investment. A financial asset is presented net of a financial liability when the Group: (a) currently has a legally enforceable right to set off the recognized amounts; and (b) intends either to settle on a net basis, or to realize the asset and settle the liability simultaneously.
Non-compounding interest, dividend income and other cash flows resulting from holding financial assets are recognized in profit or loss when earned, regardless of how the related carrying amount of financial assets is measured. Derecognition of financial assets occurs when the contractual rights to receive cash flows from the financial instruments expire or are transferred and substantially all of the risks and rewards of ownership have been transferred.
2.6 Real Estate Transactions Acquisition costs of raw land intended for future development, including other costs and expenses incurred to effect the transfer of title of the property to the Company, are charged to the Land for Future Development account. These costs are reclassified to Property Development Costs account when the development of the property starts. Related property development costs are then accumulated in this account. Borrowing costs on certain loans incurred during the development of the real estate properties are also capitalized by the Company as part of the property development costs. Once a revenue transaction occurred, on a per project basis, up to the stage the unit is sold, the related property development costs are reclassified to Residential and Condominium Units for Sale. The cost of real estate property sold before completion of the development is determined based on the actual costs incurred to date plus estimated costs to complete the development of the property. The estimated expenditures for the development of sold real estate property, as determined by the project engineers, are charged to the cost of residential and condominium units sold presented in the statement of income with a corresponding credit to the liability account, Reserve for Property Development account. Property Development Costs and Residential and Condominium Units for Sale are valued at the lower of cost and net realizable value. Net realizable value is the estimated selling price in the ordinary course of business, less estimated costs to complete and the estimated costs necessary to make the sale.
The Group recognizes the effect of revisions in the total project cost estimates in the year in which these changes become known. Any impairment loss from a real estate project is charged to operations during the period in which the loss is determined (see also Note 2.15).

- 16 -
2.7 Investment Property Properties held for lease under operating lease agreements, which comprise mainly of land, buildings and condominium units, are classified as Investment Property, and carried at cost, net of accumulated depreciation and any impairment in value, except for land which is not subjected to depreciation. Depreciation of investment property is computed using the straight-line method over the estimated useful lives of the assets ranging from 5 to 25 years. Investment property is derecognized upon disposal or when permanently withdrawn from use and no future economic benefit is expected from its disposal. Any gain or loss on the retirement or disposal of an investment property is recognized in the consolidated statement of income in the year of retirement or disposal.
2.8 Property and Equipment Property and equipment are carried at acquisition or construction cost less subsequent depreciation, amortization and any impairment losses.
The cost of an asset comprises its purchase price and directly attributable costs of bringing the asset to working condition for its intended use. Expenditures for additions, major improvements and renewals are capitalized; expenditures for repairs and maintenance are charged to expenses as incurred.
Depreciation is computed on the straight-line basis over the estimated useful lives of the assets. Amortization of office and land improvements is recognized over the estimated useful lives of improvements or the term of the lease, whichever is shorter. The depreciation and amortization periods for property and equipment, based on the above policies, are as follows:
Condominium units 10-25 years Office and land improvements 5-20 years Transportation equipment 5 years Office furniture, fixtures and equipment 3-5 years
Construction in progress represents properties under construction and is stated at cost. This includes cost of construction, applicable borrowing costs (see Note 2.17) and other direct costs. The account is not depreciated until such time that the assets are completed and available for use. An asset’s carrying amount is written down immediately to its recoverable amount if the asset’s carrying amount is greater than its estimated recoverable amount (see also Note 2.15). The residual values and estimated useful lives of property and equipment are reviewed, and adjusted if appropriate, at the end of each reporting period. An item of property and equipment is derecognized upon disposal or when no future economic benefits are expected to arise from the continued use of the asset. When assets are sold, retired or otherwise disposed of, their cost and related accumulated depreciation and amortization and any impairment losses are removed from the accounts. Any gain or loss arising on derecognition of the asset (calculated as the difference between the net disposal proceeds and the carrying amount of the item) is included in the profit or loss in the year the item is derecognized.

- 17 -
2.9 Financial Liabilities
Financial liabilities of the Group include Interest-bearing Loans and Borrowings, Bonds Payable, Trade and Other Payables [excluding value-added tax (VAT)] and Advances from Other Related Parties. Financial liabilities are recognized when the Group becomes a party to the contractual terms of the instrument. All interest related charges are recognized as expense in profit or loss under the caption Interest and Other Charges – net account in the consolidated statement of comprehensive income. Interest-bearing Loans and Borrowings and Bonds Payable are raised for support of long-term funding of operations. These are recognized at proceeds received, net of direct issue costs. Finance charges, including premiums payable on settlement or redemption and direct issue costs, are charged to profit or loss except for capitalized borrowing cost, on an accrual basis using the effective interest method and are added to the carrying amount of the instrument to the extent that these are not settled in the period in which they arise.
Trade and Other Payables are initially recognized at their fair value and subsequently measured at amortized cost using effective interest method for maturities beyond one year, less settlement payments. Dividend distributions to shareholders are recognized as financial liabilities when the dividends are approved by the BOD. A financial liability is presented net of a financial asset when the Group: (a) currently has a legally enforceable right to set off the recognized amounts; and (b) intends either to settle on a net basis, or to realize the asset and settle the liability simultaneously. Financial liabilities are classified as current liabilities if payment is due to be settled within one year or less after the reporting period (or in the normal operating cycle of the business, if longer), or the Company does not have an unconditional right to defer settlement of the liability for atleast twelve months after the reporting period. Otherwise, these are presented as non-current liabilities.
Financial liabilities are derecognized from the consolidated statement of financial position only when the obligations are extinguished either through discharge, cancellation or expiration. 2.10 Business Combination Business acquisitions are accounted for using the acquisition method of accounting (previously called “purchase method”).
Goodwill represents the excess of the cost of an acquisition over the fair value of the Group’s share of the net identifiable assets of the acquired subsidiary at the date of acquisition. Subsequent to initial recognition, goodwill is measured at cost less any accumulated impairment losses. Goodwill is tested annually for impairment and carried at cost less accumulated impairment losses (see also Note 2.15). Impairment losses on goodwill are not reversed. Negative goodwill, which is the excess of the Company’s interest in the net fair value of net identifiable assets acquired over acquisition cost, is charged directly to income.
- 18 -
For the purpose of impairment testing, goodwill is allocated to cash-generating units or groups of cash-generating units that are expected to benefit from the business combination in which the goodwill arose. The cash-generating units or groups of cash-generating units are identified according to operating segment.
Gains and losses on the disposal of an interest in a subsidiary include the carrying amount of goodwill relating to it.
If the business combination is achieved in stages, the acquirer is required to remeasure its previously held equity interest in the acquiree at its acquisition-date fair value and recognize the resulting gain or loss, if any, in the profit or loss or other comprehensive income, as appropriate. Any contingent consideration to be transferred by the Group is recognized at fair value at the acquisition date. Subsequent changes to the fair value of the contingent consideration that is deemed to be an asset or liability is recognized in accordance with PAS 37 either in profit or loss or as a change to other comprehensive income. Contingent consideration that is classified as equity is not remeasured, and its subsequent settlement is accountedfor within equity.
2.11 Segment Reporting
Operating segments are reported in a manner consistent with the internal reporting provided to the Group’s Strategic Steering Committee (SSC), its chief operating decision-maker. The SSC is responsible for allocating resources and assessing performance of the operating segments.
In identifying its operating segments, management generally follows the Group’s products and service lines as disclosed in Note 4, which represent the main products and services provided by the Group. Each of these operating segments is managed separately as each of these service lines requires different technologies and other resources as well as marketing approaches. All inter-segment transfers are carried out at arm’s length prices.
The measurement policies the Group uses for segment reporting under PFRS 8 are the same as those used in its financial statements, except that the following are not included in arriving at the operating profit of the operating segments: • post-employment benefit expenses; • expenses relating to share-based payments; • research costs relating to new business activities; and, • revenue, costs and fair value gains from investment property. In addition, corporate assets which are not directly attributable to the business activities of any operating segment are not allocated to a segment. There have been no changes from prior periods in the measurement methods used to determine reported segment profit or loss.
2.12 Provisions and Contingencies
Provisions are recognized when present obligations will probably lead to an outflow of economic resources and they can be estimated reliably even if the timing or amount of the outflow may still be uncertain. A present obligation arises from the presence of a legal or constructive commitment that has resulted from past events.

- 19 -
Provisions are measured at the estimated expenditure required to settle the present obligation, based on the most reliable evidence available at the end of the reporting period, including the risks and uncertainties associated with the present obligation. Where there are a number of similar obligations, the likelihood that an outflow will be required in settlement is determined by considering the class of obligations as a whole. When time value of money is material, long-term provisions are discounted to their present values using a pretax rate that reflects market assessments and the risks specific to the obligation. The increase in the provision due to passage of time is recognized as interest expense. Provisions are reviewed at the end of each reporting period and adjusted to reflect the current best estimate.
In those cases where the possible outflow of economic resource as a result of present obligations is considered improbable or remote, or the amount to be provided for cannot be measured reliably, no liability is recognized in the consolidated financial statements. Similarly, probable inflows of economic benefits to the Group that do not yet meet the recognition criteria of an asset are considered contingent assets, hence, are not recognized in the consolidated financial statements. On the other hand, any reimbursement that the Group can be virtually certain to collect from a third party with respect to the obligation is recognized as a separate asset not exceeding the amount of the related provision. 2.13 Revenue and Expense Recognition Revenue comprises revenue from the sale of goods and the rendering of services measured by reference to the fair value of consideration received or receivable by the Group for goods sold and services rendered, excluding VAT and trade discounts.
Revenue is recognized to the extent that it is probable that the economic benefits will flow to the Group and the revenue can be reliably measured. The following specific recognition criteria must also be met before revenue is recognized:
(a) Sale of residential and condominium units – For financial reporting purposes, revenues
from transactions covering sales of residential and condominium units are recognized under the percentage-of-completion method. Under this method, realization of gross profit is recognized by reference to the stage of development of the properties, i.e., revenue is recognized in the period in which the work is performed. The unrealized gross profit on a year’s sales is presented as Deferred Gross Profit in the consolidated statement of income; the cumulative unrealized gross profit as of the end of the year is shown as Deferred Income on Real Estate Sales (current and non-current liabilities) in the consolidated statement of financial position.
The sale is recognized when a certain percentage of the total contract price has already been collected. The amount of real estate sales recognized in the consolidated statement of income is equal to the total contract price, net of day-one loss related to the discounting of noninterest-bearing receivables. If the transaction does not yet qualify as sale, the deposit method is applied until all conditions for recording the sale are met. Pending the recognition of sale, payments received from buyers are presented under the Customers’ Deposits account in the liabilities section of the consolidated statement of financial position.
For tax reporting purposes, a modified basis of computing the taxable income for the year based on collections from sales is used by the parent company, MGAI, EELHI and ECOC, while MDC reports revenues for tax purposes based also on the percentage-of-completion method.

- 20 -
Any adjustments relative to previous years’ sales are recorded in the current year as they occur.
(b) Sale of undeveloped land – Revenues on sale of undeveloped land are recognized using the full accrual method. Under the full accrual method, revenue is recognized when the risks and rewards of ownership on the undeveloped land have passed to the buyer and the amount of revenue can be measured reliably.
(c) Rental and hotel income – Revenue is recognized when the performance of
contractually agreed tasks has been substantially rendered. Rental income is recognized on a straight-line basis over the lease term.
Advance rentals and refundable rental deposits are recorded as deferred rental income. Deferred rental income is measured at amortized cost using the effective interest rate method.
(d) Construction contracts – Revenue is recognized when the performance of contractually
agreed tasks have been substantially rendered using the cost recovery and percentage-of-completion methods. Provisions for estimated losses on uncompleted contracts are made in the period in which such losses are determined.
(e) Interest – Revenue is recognized as the interest accrues taking into account the effective yield on the asset.
(f) Dividends – Revenue is recorded when the stockholders’ right to receive the payment
is established.
Costs of residential and condominium units sold before completion of the projects include the acquisition cost of the land, development costs incurred to date, applicable borrowing costs (see Note 2.17) and estimated costs to complete the project, determined based on estimates made by the project engineers (see also Note 2.6). Operating expenses and other costs (other than costs of real estate sold) are recognized in the profit or loss upon utilization of the service or receipt of goods or at the date they are incurred.
2.14 Leases The Group accounts for its leases as follows: (a) Group as Lessee
Leases which do not transfer to the Group substantially all the risks and benefits of ownership of the asset are classified as operating leases. Operating lease payments (net of any incentives received from the lessor) are recognized as expense in the profit or loss on a straight-line basis over the lease term. Associated costs, such as repairs and maintenance and insurance, are expensed as incurred.
(b) Group as Lessor
Leases which do not transfer to the lessee substantially all the risks and benefits of ownership of the asset are classified as operating leases. Operating lease income is recognized as income in profit or loss on a straight-line basis over the lease term.

- 21 -
The Group determines whether an arrangement is, or contains, a lease based on the substance of the arrangement. It makes an assessment of whether the fulfillment of the arrangement is dependent on the use of a specific asset or assets and the arrangement conveys a right to use the asset. 2.15 Impairment of Non-financial Assets
The Group’s Investments in Associates, Goodwill (included as part of Other Non-current Assets), Investment Property, Land for Future Development, and Property and Equipment are subject to impairment testing. All other individual assets are tested for impairment whenever events or changes in circumstances indicate that the carrying amount may not be recoverable. For purposes of assessing impairment, assets are grouped at the lowest levels for which there are separately identifiable cash flows (cash-generating units). As a result, assets are tested for impairment either individually or at the cash-generating unit level.
Impairment loss is recognized for the amount by which the asset’s or cash-generating unit’s carrying amount exceeds its recoverable amount, which is the higher of its fair value less costs-to-sell, and its value in use. In determining value in use, management estimates the expected future cash flows from each cash-generating unit and determines the suitable interest rate in order to calculate the present value of those cash flows. All assets are subsequently reassessed for indications that an impairment loss previously recognized may no longer exist and the carrying amount of the asset is adjusted to the recoverable amount resulting in the reversal of impairment loss.
2.16 Employee Benefits (a) Post-employment Benefit
Post-employment benefit is provided to employees through a defined benefit plan.
A defined benefit plan is a post-employment plan that defines an amount of post-employment benefit that an employee will receive on retirement, usually dependent on one or more factors such as age, years of service and salary. The legal obligation for any benefits from this kind of post-employment plan remains with the Group, even if plan assets for funding the defined benefit plan have been acquired. Plan assets may include assets specifically designated to a long-term benefit fund, as well as qualifying insurance policies. The Group’s post-employment defined benefit plan covers all regular full-time employees. The pension plan is tax-qualified, non-contributory and administered by a trustee.

- 22 -
The liability recognized in the consolidated statement of financial position for post-employment defined benefit pension plans is the present value of the defined benefit obligation (DBO) at the end of reporting period less the fair value of plan assets, together with adjustments for unrecognized actuarial gains or losses and past service costs. The DBO is calculated annually by independent actuaries using the projected unit credit method. The present value of the DBO is determined by discounting the estimated future cash outflows using interest rates of high quality corporate bonds that are denominated in the currency in which the benefits will be paid and that have terms to maturity approximating to the terms of the related post-employment liability.
Actuarial gains and losses are not recognized as an income or expense unless the total unrecognized gain or loss exceeds 10% of the greater of the obligation and related plan assets. The amount exceeding this 10% corridor is charged or credited to profit or loss over the employees’ expected average remaining working lives. Actuarial gains and losses within the 10% corridor are disclosed separately. Past-service costs are recognized immediately in profit or loss, unless the changes to the post-employment plan are conditional on the employees remaining in service for a specified period of time (the vesting period). In this case, the past service costs are amortized on a straight-line basis over the vesting period.
(b) Compensated Absences
Compensated absences are recognized for the number of paid leave days (including holiday entitlement) remaining at the end of the reporting period. They are included in the Trade and Other Payables account of the consolidated statement of financial position at the undiscounted amount that the Group expects to pay as a result of the unused entitlement.
2.17 Borrowing Costs For financial reporting purposes, borrowing costs are recognized as expenses in the period in which they are incurred, except to the extent that they are capitalized. Borrowing costs that are directly attributable to the acquisition, construction or production of a qualifying asset (i.e., an asset that takes a substantial period of time to get ready for its intended use or sale) are capitalized as part of the cost of such asset. The capitalization of borrowing costs commences when expenditures for the asset are being incurred, borrowing costs are being incurred and activities that are necessary to prepare the asset for its intended use or sale are in progress. Capitalization ceases when substantially all such activities are complete. For income tax purposes, interest and other borrowing costs are charged to expense when incurred. 2.18 Income Taxes Tax expense recognized in profit or loss comprises the sum of deferred tax and current tax not recognized in other comprehensive income or directly in equity, if any. Current tax assets or liabilities comprise those claims from, or obligations to, fiscal authorities relating to the current or prior reporting period, that are uncollected or unpaid at the reporting period. They are calculated using the tax rates and tax laws applicable to the fiscal periods to which they relate, based on the taxable profit for the year. All changes to current tax assets or liabilities are recognized as a component of tax expense in the profit or loss.

- 23 -
Deferred tax is provided, using the liability method on temporary differences at the end of the reporting period between the tax base of assets and liabilities and their carrying amounts for financial reporting purposes. Under the liability method, with certain exceptions, deferred tax liabilities are recognized for all taxable temporary differences and deferred tax assets are recognized for all deductible temporary differences and the carry forward of unused tax losses and unused tax credits to the extent that it is probable that taxable profit will be available against which the deferred income tax asset can be utilized.
The carrying amount of deferred tax assets is reviewed at the end of each reporting period and reduced to the extent that it is probable that sufficient taxable profit will be available to allow all or part of the deferred tax asset to be utilized. Deferred tax assets and liabilities are measured at the tax rates that are expected to apply to the period when the asset is realized or the liability is settled provided such tax rates have been enacted or substantively enacted at the end of the reporting period. Most changes in deferred tax assets or liabilities are recognized as a component of tax expense in the profit or loss. Only changes in deferred tax assets or liabilities that relate to items recognized in other comprehensive income or directly in equity are recognized in other comprehensive income or directly in equity. 2.19 Related Party Transactions
Related party transactions are transfers of resources, services or obligations between the entities in the Group and their related parties, regardless whether a price is charged.
Parties are considered to be related if one party has the ability to control the other party or exercise significant influence over the other party in making financial and operating decisions. Related parties include: (a) individuals owning, directly or indirectly through one or more intermediaries, control or are controlled by, or under common control with the Company; (b) associates; and, (c) individuals owning, directly or indirectly, an interest in the voting power of the Company that gives them significant influence over the Company and close members of the family of any such individual.
In considering each possible related party relationship, attention is directed to the substance of the relationship and not merely on the legal form.
2.20 Equity Capital stock is determined using the nominal value of shares that have been issued. Additional paid-in capital (APIC) includes any premiums received on the issuance of capital stock. Any transaction costs associated with the issuance of shares are deducted from APIC, net of any related income tax benefits. Treasury stock is stated at the cost of re-acquiring such shares.
Net unrealized gains (losses) on AFS securities represent gains or losses recognized due to changes in fair values of these assets. Accumulated translation adjustments represent the translation adjustments resulting from the conversion of foreign-currency denominated financial statements of certain subsidiaries into the Group’s functional and presentation currency.

- 24 -
Retained earnings include all current and prior period results of operations as reported in the consolidated statement of income. 2.21 Earnings Per Share Basic earnings per share (EPS) is computed by dividing consolidated net profit attributable to equity holders of the parent company by the weighted average number of shares issued and outstanding, adjusted retroactively for any stock dividend, stock split and reverse stock split during the current year, if any.
Diluted EPS is computed by adjusting the weighted average number of ordinary shares outstanding to assume conversion of potential dilutive common shares. As of December 31, 2011 and 2010, the Group does not have potential dilutive common shares. 2.22 Events after the Reporting Period
Any post-year-end event that provides additional information about the Group’s financial position at the end of the reporting period (adjusting event) is reflected in the consolidated financial statements. Post-year-end events that are not adjusting events, if any, are disclosed when material to the financial statements.
3. SIGNIFICANT ACCOUNTING ESTIMATES AND JUDGMENTS
The Group’s consolidated financial statements prepared in accordance with PFRS require management to make judgments and estimates that affect amounts reported in the consolidated financial statements and related notes. Judgments and estimates are continually evaluated and are based on historical experience and other factors, including expectations of future events that are believed to be reasonable under the circumstances. Actual results may ultimately vary from these estimates.
3.1 Critical Management Judgments in Applying Accounting Policies
In the process of applying the Group’s accounting policies, management has made the
following judgments, apart from those involving estimation, which have the most significant effect on the amounts recognized in the consolidated financial statements:
(a) Impairment of Investments in AFS Securities
The determination when an investment is other-than-temporarily impaired requires significant judgment. In making this judgment, the Group evaluates, among other factors, the duration and extent to which the fair value of an investment is less than its cost; and the financial health of and near-term business outlook for the investee, including factors such as industry and sector performance, changes in technology and in operational and financing cash flows. Based on the recent evaluation of information and circumstances affecting the Group’s investments in AFS securities, management concluded that the assets are not impaired as of December 31, 2011 and 2010. Future changes in such information and circumstance might significantly affect the carrying amount of the assets.

- 25 -
(b) Distinction Between Investment Properties, Owner-Occupied Properties and Land for Future Development
The Group determines whether a property qualifies as investment property. In making its judgment, the Group considers whether the property generates cash flows largely independently of the other assets held by an entity. Owner-occupied properties generate cash flows that are attributable not only to property but also to other assets used in the production or supply process while Land for Future Development are properties intended solely for future development.
(c) Operating and Finance Leases
The Group has entered into various lease agreements. Critical judgment was exercised by management to distinguish each lease agreement as either an operating or finance lease by looking at the transfer or retention of significant risk and rewards of ownership of the properties covered by the agreements. Failure to make the right judgment will result in either overstatement or understatement of assets and liabilities.
(d) Provisions and Contingencies
Judgment is exercised by management to distinguish between provisions and contingencies. Accounting policies on recognition and disclosure of provision are discussed in Note 2.12 and relevant disclosures of contingencies are presented in Note 26.
3.2 Key Sources of Estimation Uncertainty The following are the key assumptions concerning the future, and other key sources of estimation uncertainty at the end of the reporting period, that have a significant risk of causing a material adjustment to the carrying amounts of assets and liabilities within the next financial year: (a) Revenue Recognition Using the Percentage-of-Completion Method
The Group uses the percentage-of-completion method in accounting for its realized gross profit on real estate sales. The use of the percentage-of-completion method requires the Group to estimate the portion completed using relevant information such as costs incurred to date as a proportion of the total budgeted cost of the project and estimates by engineers and other experts.
(b) Determining Net Realizable Value of Residential and Condominium Units for Sale and
Property Development Costs
In determining the net realizable value of residential and condominium units for sale and property development costs, management takes into account the most reliable evidence available at the times the estimates are made. The future realization of the carrying amounts of real estate for sale and property development costs is affected by price changes in the different market segments as well as the trends in the real estate industry. These are considered key sources of estimation and uncertainty and may cause significant adjustments to the Group’s Residential and Condominium Units for Sale and Property Development Costs within the next financial year.
Considering the Group’s pricing policy, the net realizable values of real estate units for sale are higher than their related costs.

- 26 -
The carrying values of the Company’s Residential and Condominium Units for Sale and Property Development Costs amounted to P19.5 billion and P8.8 billion, respectively, as of December 31, 2011 andP6.3 billion and P3.8 billion, respectively, as of December 31, 2010.
(c) Principal Assumptions for Management’s Estimation of Fair Value
Investment Property is measured using the cost model. The fair value disclosed in Note 11 to the consolidated financial statements is determined by the Group using the discounted cash flows valuation technique since the information on current or recent prices of investment property is not available. The Group uses assumptions that are mainly based on market conditions existing at each reporting period, such as: the receipt of contractual rentals; expected future market rentals; void periods; maintenance requirements; and appropriate discount rates. These valuations are regularly compared to actual market yield data and actual transactions by the Group and those reported by the market. The expected future market rentals are determined on the basis of current market rentals for similar properties in the same location and condition. For financial assets, fair value determination is discussed in Note 2.5.
(d) Useful Lives of Property and Equipment and Investment Property
The Group estimates the useful lives of property and equipment and investment property based on the period over which the assets are expected to be available for use. The estimated useful lives of property and equipment and investment property are reviewed periodically and are updated if expectations differ from previous estimates due to physical wear and tear, technical or commercial obsolescence and legal or other limits on the use of the assets. In addition, estimation of the useful lives of property and equipment and investment property is based on collective assessment of industry practice, internal technical evaluation and experience with similar assets. It is possible, however, that future results of operations could be materially affected by changes in estimates brought about by changes in the factors mentioned above. The amounts and timing of recorded expenses for any period would be affected by changes in these factors and circumstances. A reduction in the estimated useful lives of property and equipment and investment property would increase recorded operating expenses and decrease non-current assets.
The carrying amounts of investment property and property and equipment are disclosed in Notes 11 and 12, respectively.
(e) Allowance for Impairment of Trade and Other Receivables
Allowance is made for specific and groups of accounts, where an objective evidence of impairment exists. The Group evaluates these accounts based on available facts and circumstances, including, but not limited to, the length of the Group’s relationship with the customers, the customers’ current credit status based on third party credit reports and known market forces, average age of accounts, collection experience and historical loss experience.
The carrying value of trade and other receivables and the analysis of allowance for impairment on such financial assets are shown in Note 6.

- 27 -
(f) Valuation of Financial Assets Other than Trade and Other Receivables
The Group carries certain financial assets at fair value, which requires the extensive use of accounting estimates and judgment. In cases when active market quotes are not available, fair value is determined by reference to the current market value of another instrument which is substantially the same or is calculated based on the expected cash flows of the underlying net base of the instrument. The amount of changes in fair value would differ had the Group utilized different valuation methods and assumptions. Any change in fair value of these financial assets and liabilities would affect profit and loss and equity. The carrying amounts of cash and cash equivalents, financial assets at FVTPL and AFS financial assets are disclosed in Notes 5, 7 and 8, respectively.
(g) Realizable Amount of Deferred Tax Assets
The Group reviews its deferred tax assets at the end of each reporting period and reduces the carrying amount to the extent that it is no longer probable that sufficient taxable profit will be available to allow all or part of the deferred tax asset to be utilized. Management assessed that the balance of deferred tax assets as at December 31, 2011 and 2010 will be utilized within the next two to three years.
The carrying amount of the net deferred tax assets as of December 31, 2011 and 2010 is disclosed in Note 22.
(h) Impairment of Non-financial Assets
The Group’s policy on estimating the impairment of non-financial assets is discussed in detail in Note 2.15. Though management believes that the assumptions used in the estimation of fair values reflected in the consolidated financial statements are appropriate and reasonable, significant changes in these assumptions may materially affect the assessment of recoverable values and any resulting impairment loss could have a material adverse effect on the results of operations.
There were no impairment losses required to be recognized in 2011and 2010 based on management’s assessment.
(i) Post-employment Benefit
The determination of the Group’s obligation and cost of post-employment benefits is dependent on the selection of certain assumptions used by actuaries in calculating such amounts. Those assumptions are described in Note 21.2 and include, among others, discount rates, expected return on plan assets and salary increase rate. In accordance with PFRS, actual results that differ from the assumptions are accumulated and amortized over future periods and, therefore, generally affect the recognized expense and recorded obligation in such future periods. The amounts of retirement benefit obligation and expense and an analysis of the movements in the estimated present value of retirement benefit obligation are presented in Note 21.2.

- 28 -
4. SEGMENT INFORMATION
4.1 Business Segments
The Group’s operating businesses are organized and managed separately according to the nature of products and services provided, with each segment representing a strategic business unit that offers different products and serves different markets. The Group is engaged in the development of residential and office units including urban centers integrating office, residential and commercial components. The Real Estate segment pertains to the development and sale of residential and office developments. The Rental segment includes leasing of office and commercial spaces. The Hotel Operations segment relates to the management of hotel business operations. The Corporate and Others segment includes marketing services, general and corporate income and expense items. Segment accounting policies are the same as the policies described in Note 2.11. The Group generally accounts for intersegment sales and transfers as if the sales or transfers were to third parties at current market prices.
4.2 Segment Assets and Liabilities
Segment assets are allocated based on their physical location and use or direct association with a specific segment and they include all operating assets used by a segment and consist principally of operating cash, receivables, real estate inventories, property and equipment, and investment property, net of allowances and provisions. Similar to segment assets, segment liabilities are also allocated based on their use or direct association with a specific segment. Segment liabilities include all operating liabilities and consist principally of accounts, wages, taxes currently payable and accrued liabilities.
4.3 Intersegment Transactions
Segment revenues, expenses and performance include sales and purchases between business segments. Such sales and purchases are eliminated in consolidation.
4.4 Analysis of Segment Information
The following tables present revenue and profit information regarding industry segments for the years ended December 31, 2011, 2010 and 2009 and certain asset and liability information regarding segments at December 31, 2011, 2010 and 2009.

- 29 -
2011 Hotel Corporate Real Estate Rental Operations and Others Elimination Consolidated
TOTAL REVENUES Sales to external customers P 19,076,553,675 P 3,826,341,215 P 392,171,105 P 3,023,156,092 P - P 26,318,222,087
Intersegment sales - 53,969,793 - 166,500,934 ( 220,470,727 ) -
Total revenues P 19,076,553,675 P 3,880,311,008 P 392,171,105 P 3,189,657,026 (P 220,470,727 ) P 26,318,222,087
RESULTS
Segment results P 3,532,707,027 P 2,903,020,448 P 99,220,101 P 2,384,111,424 P 25,888,853 P 8,944,947,853
Unallocated expenses ( 199,278,575 )
Income from operations 8,745,669,278
Interest income - - - 1,618,727,549 - 1,618,727,549
Finance costs - - - ( 884,058,862) - ( 884,058,862 )
Equity in net earnings of associates - - - 597,834,536 - 597,834,536
Foreign currency gains – net - - - 65,503,537 - 65,503,537
Dividend income - - - 32,661,662 - 32,661,662
Fair value gains (losses) – net - - - ( 7,851,631) - ( 7,851,631 )
Profit before tax 10,168,486,069
Tax expense ( 1,995,469,148 )
Net profit before non-controlling
interests and preacquisition income 8,173,016,921
Preacquisition income of a subsidiary ( 17,326,952 )
Non-controlling interests’ share in
net profit ( 123,805,458 )
Net profit attributable to
parent company’s shareholders P 8,031,884,511
ASSETS AND LIABILITIES
Segment assets P 93,027,684,188 P 13,098,763,945 P 261,591,040 P 13,444,018,245 P - P119,832,057,418
Investments in and advances
to associates and other
related parties - net - - - 6,745,964,129 - 6,745,964,129
Unallocated assets - - - 2,417,505,117 - 2,417,505,117
Total assets P 93,027,684,188 P 13,098,763,945 P 261,591,040 P 22,607,487,491 P - P 128,995,526,664
Segment liabilities P 46,802,707,496 P 1,853,118,305 P 111,753,205 P 7,455,842,379 P - P 56,223,421,385
OTHER SEGMENT INFORMATION
Project and capital expenditures P 19,825,843,992

- 30 -
2010 Hotel Corporate Real Estate Rental Operations and Others Elimination Consolidated
TOTAL REVENUES Sales to external customers P 15,399,973,187 P 2,694,310,554 P 232,757,023 P 808,477,515 P - P 19,135,518,279
Intersegment sales - 52,014,865 - 179,885,935 ( 231,900,800 ) -
Total revenues P 15,399,973,187 P 2,746,325,419 P 232,757,023 P 988,363,450 (P 231,900,800 ) P 19,135,518,279
RESULTS
Segment results P 3,042,478,040 P 2,062,875,628 P 38,125,649 P 752,871,759 P 25,888,853 P 5,922,239,929
Unallocated expenses ( 117,450,295)
Income from operations 5,804,789,634
Interest income - - - 835,944,617 - 835,944,617
Finance costs - - - ( 516,440,321) - ( 516,440,321)
Equity in net earnings of associates - - - 442,281,307 - 442,281,307
Fair value gains – net - - - 83,500,000 - 83,500,000
Dividend income - - - 40,630,134 - 40,630,134
Foreign currency gains – net - - - 3,908,758 - 3,908,758
Profit before tax 6,694,614,129
Tax expense ( 1,609,101,525)
Net profit before non-controlling
interests 5,085,512,604
Non-controlling interests’ share in
net profit ( 59,332,029)
Net profit attributable to
parent company’s shareholders P 5,026,180,575
ASSETS AND LIABILITIES
Segment assets P 63,241,644,678 P 5,919,037,407 P 178,376,810 P 13,025,093,222 P - P 82,364,152,117
Investments in and advances
to associates and other
related parties - net - - - 13,671,332,490 - 13,671,332,490
Unallocated assets - - - 994,038,204 - 994,038,204
Total assets P 63,241,644,678 P 5,919,037,407 P 178,376,810 P 27,690,463,916 P - P 97,029,522,811
Segment liabilities P 32,027,981,425 P 1,530,032,850 P 78,854,006 P 4,873,517,893 P - P 38,510,386,174
OTHER SEGMENT INFORMATION
Project and capital expenditures P 13,460,175,204

- 31 -
2009 Hotel Corporate Real Estate Rental Operations and Others Elimination Consolidated
TOTAL REVENUES Sales to external customers P 14,566,449,663 P 2,000,477,427 P 216,143,646 P 59,044,461 P - P 16,842,115,197
Intersegment sales - 62,047,938 - 71,112,463 ( 133,160,401 ) -
Total revenues P 14,566,449,663 P 2,062,525,365 P 216,143,646 P 130,156,924 (P 133,160,401 ) P 16,842,115,197
RESULTS
Segment results P 3,721,385,850 P 1,535,784,727 P 44,321,641 P 31,021,942 P 25,888,853 P 5,358,403,013
Unallocated expenses ( 206,001,589)
Income from operations 5,152,401,424
Interest income - - - 690,238,144 - 690,238,144
Finance costs - - - ( 556,326,705) - ( 556,326,705)
Equity in net earnings of associates - - - 157,958,213 - 157,958,213
Dividend income - - - 44,247,127 - 44,247,127
Fair value gains – net - - - 24,100,000 - 24,100,000
Foreign currency loss – net - - - ( 8,464,596) - ( 8,464,596)
Profit before tax 5,504,153,607
Tax expense ( 1,437,541,131)
Net profit before non-controlling
interests 4,066,612,476
Non-controlling interests’ share in
net profit ( 11,211,285)
Net profit attributable to
parent company’s shareholders P 4,055,401,191
ASSETS AND LIABILITIES
Segment assets P 55,378,759,577 P 5,072,588,995 P 182,070,130 P 11,172,314,788 P - P 71,805,733,490
Investments in and advances
to associates and other
related parties - net - - - 12,665,714,849 - 12,665,714,849
Unallocated assets - - - 782,324,106 - 782,324,106
Total assets P 55,378,759,577 P 5,072,588,995 P 182,070,130 P 24,620,353,743 P - P 85,253,772,445
Segment liabilities P 28,887,111,381 P 1,102,204,707 P 51,504,125 P 5,377,235,672 P - P 35,418,055,885
OTHER SEGMENT INFORMATION
Project and capital expenditures P 10,700,484,872

- 32 -
5. CASH AND CASH EQUIVALENTS
Cash and cash equivalents include the following components as of December 31:
2011 2010 Cash on hand and in banks P 2,049,865,776 P 1,109,041,947 Short-term placements 28,274,613,404 20,922,542,996
P 30,324,479,180 P22,031,584,943 Cash in banks generally earn interest at rates based on daily bank deposit rates. Short-term placements are made for varying periods between 15 to 30 days and earn effective interest ranging from 3.5% to 4.9% in 2011and 3.5% to 4.8% in 2010(see Note 19).
6. TRADE AND OTHER RECEIVABLES
This account is composed of the following: 2011 2010 Current: Trade P 15,414,359,792 P 12,899,356,339 Allowance for impairment ( 18,458,087) ( 3,324,211 ) 15,395,901,705 12,896,032,128 Advances to contractors and suppliers 1,173,135,782 710,223,731 Others 609,413,603 527,545,525 17,178,451,090 14,133,801,384
Non-current: Trade 20,207,201,820 15,617,214,463 Allowance for impairment ( 12,224,936) - 20,194,976,884 15,617,214,463 Others 14,065,568 - 20,209,042,452 15,617,214,463 P 37,387,493,542 P 29,751,015,847
A reconciliation of the allowance for impairment at the beginning and end of 2011 and 2010 is shown below. 2011 2010 Balance at beginning of year P 3,324,211 P 7,895,021 Allowance carried from new subsidiaries (EELHI and SPI) 26,302,376 - Impairment loss during the year 1,139,783 -
Write-off of trade receivables previously provided with allowance ( 83,347) ( 4,570,810 )
Balance at end of year P 30,683,023 P 3,324,211

- 33 -
The installment period of sales contracts averages to five years. Trade receivables are noninterest-bearing and are remeasured at amortized cost using the effective interest rate of 10%. Interest income recognized amounted to P1.2 billion in 2011, P933.4 million in 2010 and P714.2 million in 2009; these amounts are presented as Interest Income on Real Estate Sales in the consolidated statements of income.
All trade receivables are subject to credit risk exposure. However, the Group does
not identify specific concentrations of credit risk with regard to Trade and Other Receivables as the amounts recognized resemble a large number of receivables from various customers. Certain receivables from trade customers are covered by postdated checks. Certain past due accounts are not provided with allowance for impairment to the extent of the expected market value of the property sold to the customer. The title to the real estate properties remains with the Group until the receivables are fully collected.
The fair values of trade and other receivables are disclosed in Note 28.
7. FINANCIAL ASSETS AT FAIR VALUE THROUGH PROFIT OR LOSS This account consists of investments in marketable securities which are presented at their fair values determined directly by reference to published prices quoted in an active market as of December 31, 2011 and 2010. The changes in fair values of these financial assets are presented as Fair Value Gains - net in 2011 and 2010 under Equity in Net Earnings of Associates, Interest and Other Income - net (see Note 19).
8. INVESTMENTS IN AVAILABLE-FOR-SALE SECURITIES
AFS securities comprise the following as of December 31:
2011 2010
Investments in equity instruments P2,030,052,709 P 5,535,716,669 Investments in debt instruments 561,694,969 675,467,827 P2,591,747,678 P 6,211,184,496
The fair values of AFS financial assets have been determined directly by reference to published prices in an active market.
The aggregate cost of AFS financial assets as of December 31, 2011 and 2010 amounted to P2.5 billion andP2.4 billion, respectively. The fair value gains/losses arising from these financial assets which comprised the movements in the carrying amounts of AFS, are reported as part of Net Unrealized Gains (Losses) on AFS Financial Assets in the consolidated statements of comprehensive income. The decrease in the carrying amount of AFS securities resulted from the disposal of investments during the year. The resulting gain is presented as Gain on Sale of AFS securities under Equity in Net Earnings account in the 2011 statement of income (see Note 19).
A portion of the AFS securities are owned by RHGI and EELHI, which are subsidiaries of the Company. Hence, the movements in the AFS financial assets arising from fair value gains/losses are fully allocated to the parent company’s shareholders.

- 34 -
9. ADVANCES TO LANDOWNERS AND JOINT VENTURES
The Group enters into numerous joint venture agreements for the joint development of various projects. These are treated as jointly controlled operations; there were no separate entities created by these joint venture agreements. The joint venture agreements stipulate that the Group’s joint venturer shall contribute parcels of land and the Group shall be responsible for the planning, conceptualization, design, demolition of existing improvements, construction, financing and marketing of condominium to be constructed on the properties. Costs incurred by the Group for these projects are recorded under the Property Development Costs account in the consolidated statements of financial position (see Note 2.6). The amounts of other related accounts are presented as part of the regular asset and liability accounts and income and expense accounts of the Group (see Note 2.3). The Group also grants noninterest-bearing, secured cash advances to a number of landowners and joint ventures under agreements they entered into with landowners covering the development of certain parcels of land. Under the terms of the agreements, the Group, in addition to providing specified portion of total project development costs, also commits to advance mutually agreed-upon amounts to the landowners to be used for pre-development expenses such as the relocation of existing occupants.
Repayment of these advances shall be made upon completion of the project development either in the form of the developed lots corresponding to the owner’s share in saleable lots or in the form of cash to be derived from the sales of the landowner’s share in the saleable lots and residential and condominium units. Total amount of advances made by the Group less repayments, is presented as part of the Advances to Landowners and Joint Ventures account in the consolidated statements of financial position.
The net commitment for cash advances under the joint venture agreements amounts to:
2011 2010 Total commitment for cash advances P 20,000,000 P 1,500,000,000 Total cash advances granted ( 20,000,000) ( 1,500,000,000) Net Commitment P - P -
The net commitment for construction expenditures amounts to:
2011 2010 Total commitment for construction expenditures P 7,973,154,005 P 7,911,278,595 Total expenditures incurred ( 5,732,041,177) ( 5,505,759,467) Net commitment P 2,241,112,828 P 2,405,519,128

- 35 -
The Group’s interests in jointly-controlled operations and projects range from 72% to 95% in 2011 and 2010. The listing and description of the Group’s jointly controlled projects are as follows: Parent company: McKinley Hills Newport City Manhattan Parkway Residences Greenbelt Excelsior Forbeswood Heights ForbeswoodParklane 1 & 2 The Noble Place
EELHI:
Pioneer Woodlands San Lorenzo Place Governor Hills Sta. Rosa Heights Various Metro Manila and Calabarzon projects
The aggregate amounts of the current assets, long-term assets, current liabilities, long-term liabilities, income and expenses as of and for the years ended December 31, 2011, 2010 and 2009related to the Group’s interests in joint ventures are not presented as the joint ventures in which the Group is involved are not jointly-controlled entities (see Note 2.3). As of December 31, 2011 and 2010,the Group either has no other contingent liabilities with regard to these joint ventures or has assessed that the probability of loss that may arise from contingent liabilities is remote.

- 36 -
10. INVESTMENTS IN AND ADVANCES TO ASSOCIATES AND OTHER RELATED PARTIES
10.1 Breakdown of Carrying Values
The details of investments in and advances to associates and other related parties, are
as follows: % Interest Held
(see Note 1) 2011 2010 Investments in associates – at equity
Acquisition costs: SHDI 42.48% P 875,445,000 P 875,445,000 PTHDC 40.00% 64,665,000 64,665,000 MGEI 40.00% 5,000,000 - AGPL 39.44% 2,463,056,417 2,463,056,417 TIHGI 10.00% 570,000,000 570,000,000 EELHI - - 5,726,128,415 GPMAI - - 98,806,194
3,978,166,417 9,798,101,026
Accumulated equity in net (losses) earnings:
Balance at beginning of year 1,826,240,632 1,403,518,676 Reversal resulting from the consolidation of EELHI and GPMAI ( 2,216,306,527 ) - Equity share in net earnings for the year (see Note 19) 597,834,536 442,281,307 Share in other comprehensive income(loss) ( 147,365 ) 71,176,649 Dividends received from TIHGI - ( 90,736,000 ) Balance at end of year 207,621,276 1,826,240,632
Advances to associates and other related parties (see Note 23.3) 2,560,176,436 2,046,990,832
P 6,745,964,129 P13,671,332,490
In 2011, EELHI and GPMAI became subsidiaries of the Company (see Note 1). The shares of stock of SHDI are listed in the PSE. The total quoted or market value of investments in this associate amounted to P498.0 million and P439.4million as of December 31, 2011 and 2010, respectively. Overall, the related book values of the Group’s holdings in all of its associates are in excess of both the investments’ cost and market values, hence, management has assessed that the recognition of impairment losses was not deemed necessary.

- 37 -
At the beginning of 2010, the Company held 1.0 billion shares of TIHGI which represents 10% ownership interest. In August 2010, TIHGI amended its Articles of Incorporation to convert P9.9 billion or 99% of its common shares to redeemable, voting and participating preferred shares. This was approved by the Securities and Exchange Commission (SEC) on October 14, 2010. Consequently, the investment of the Company in TIHGI of 1.0 billion common shares was converted to 10.0 million common shares and 990.0 million preferred shares of TIHGI. As this was just a conversion of shares and did not change the Company’s 10% ownership in TIHGI, no gain or loss from the transaction was recorded in the Company’s books. In November 2010, TIHGI redeemed 430.0 million preferred shares held by the Company at par value. There are no outstanding receivables as of December 31, 2010 arising from TIHGI’s redemption of preferred shares held by the Company. Despite of the 10% ownership, the Company considers TIHGI as an associate due to the presence of significant influence over TIHGI’s operations since two out of the five directors of TIHGI are also members of the Company’s BOD.
In 2010, the Company received cash dividends from TIHGI amounting to P90.7 million. The amount received is considered a return on investment and is presented as deduction from the Accumulated Equity in Net Earnings shown in the previous table presented. No dividend was declared by TIHGI in 2011.
In October 2010, AGPL issued additional 57.7 million common shares. Out of the total number of shares that AGPL issued, RHGI, a 100% owned subsidiary of the Company, subscribed to only 19.1 million shares (lesser than its proportionate share) at a cost of P20.4 million. This resulted in the decline of RHGI’s percentage ownership in AGPL to 39.44% in 2010. No additional shares was issued by AGPL in 2011. Also, in October 2010, GPMAI issued additional 27.0 million shares to EELHI resulting in the decline of TDI’s percentage ownership in GPMAI to 48.08% and MREI’s and the Company’s indirect ownership to 28.85% and 39.83%, respectively. Accordingly, GPMAI was deconsolidated and treated as an associate as of December 31, 2010. GPMAI’s issuance of new shares was made at book value, hence, no dilution gain or loss was recognized. The increase in ownership in EELHI from 48.38% to 61.13% in 2011 resulted in the consolidation of the entity and increase in non-controlling interest and also in the presentation of the amount of preacquisition income in the statement of income. In 2011, the Company’s indirect ownership in GPMAI also increased to 46.45% through the Company’s increased ownership interest in EELHI, which has a 52% ownership in GPMAI. Consequently, GPMAI is also treated as a subsidiary of the Company in 2011. The balance of the Accumulated Equity in Net Earnings of P0.2 billion and P1.8 billion as of December 31, 2011 and 2010, respectively, which is mainly lodged in the Group’s Retained Earnings as of those dates, is not available for dividend declaration.

- 38 -
10.2 Summarized Financial Information
The aggregated amounts of assets, liabilities and net profit (loss) of the associates are as follows:
Net Profit Assets Liabilities Revenues (Loss) 2011: SHDI P 346,218,249 P 238,560,591 P 174,125,973 ( P 3,271,785 ) PTHDC 1,137,402,691 1,005,276,839 115,409 ( 157,289 ) MGEI 12,032,991 - 34,940 ( 467,014 ) AGPL 6,043,588,479 8,263,874 295,614,455 282,114,487 TIHGI 45,595,379,043 26,801,261,974 26,348,582,418 4,838,534,174 P 53,134,621,453 P 28,053,363,278 P 26,818,473,195 P 5,116,752,573
2010: EELHI P 27,802,956,436 P 8,272,469,687 P 2,252,537,377 P 250,265,682 SHDI 574,763,978 463,834,535 8,292,806 4,749,928 PTHDC 1,137,581,235 1,005,298,094 64,128 ( 178,157 ) GPMAI 749,039,928 157,143,964 185,277,507 166,260,340 AGPL 6,352,873,392 7,846,770 205,630,984 95,518,781 TIHGI 40,779,934,827 26,822,878,282 14,876,965,463 3,220,646,817 P 77,397,149,796 P 36,729,471,332 P 17,528,768,265 P 3,737,263,391
11. INVESTMENT PROPERTY
The gross carrying amounts and accumulated depreciation at the beginning and end of 2011 and 2010 are shown below.
Condominium
Land Buildings Units Total December 31, 2011 Cost P 1,412,634,527 P 7,960,842,147 P 4,977,714,772 P 14,351,191,446 Accumulated depreciation - ( 1,191,162,815) ( 787,737,966 ) ( 1,978,900,781) Net carrying amount P 1,412,634,527 P 6,769,679,332 P 4,189,976,806 P 12,372,290,665
December 31, 2010 Cost P 1,412,634,527 P 5,878,941,281 P 3,954,063,399 P 11,245,639,207 Accumulated depreciation - ( 930,323,176) ( 598,785,986 ) ( 1,529,109,162) Net carrying amount P 1,412,634,527 P 4,948,618,105 P 3,355,277,413 P 9,716,530,045 January 1, 2010 Cost P 1,427,094,149 P 5,621,910,029 P 3,219,937,754 P 10,268,941,932 Accumulated depreciation - ( 724,584,211) ( 438,572,652 ) ( 1,163,156,863) Net carrying amount P 1,427,094,149 P 4,897,325,818 P 2,781,365,102 P 9,105,785,069

- 39 -
A reconciliation of the carrying amounts at the beginning and end of 2011 and2010 of investment property is shown below.
Condominium
Land Buildings Units Total
Balance at January 1, 2011, net of accumulated depreciation P 1,412,634,527 P 4,948,618,105 P 3,355,277,413 P 9,716,530,045 Additions - 1,831,474,260 1,042,662,947 2,874,137,207 Disposals - - ( 19,011,574 ) ( 19,011,574 ) Investment property of newly-acquired subsidiaries - 250,426,606 - 250,426,606 Depreciation charges for the year - ( 260,839,639) ( 188,951,980 ) ( 449,791,619 ) Balance at December 31, 2011, net of accumulated depreciation P 1,412,634,527 P 6,769,679,332 P 4,189,976,806 P 12,372,290,665
Balance at January 1, 2010, net of accumulated depreciation P 1,427,094,149 P 4,897,325,818 P 2,781,365,102 P 9,105,785,069 Additions - 257,140,943 734,125,645 991,266,588 Transfers - ( 109,691) - ( 109,691 ) Investment property of a deconsolidated subsidiary ( 14,459,622 ) - - ( 14,459,622 ) Depreciation charges for the year - ( 205,738,965) ( 160,213,334 ) ( 365,952,299 ) Balance at December 31, 2010, net of accumulated depreciation P 1,412,634,527 P 4,948,618,105 P 3,355,277,413 P 9,716,530,045
Certain properties held for lease with appraised value of P800.0 million as of December 31, 2011 and 2010 were used as collateral for ECOC’s Interest-bearing Loan (see Note 14). Rental income earned from these properties amount to P3.8 billion, P2.7 billion and P2.0 billionin 2011, 2010 and 2009, respectively, and is shown as Rental Income in the consolidated statements of income. The direct operating costs, exclusive of depreciation, incurred by the Group relating to the investment property amounted to P135.08 million in 2011,P91.4 million in 2010 and P94.7 million in 2009. The operating lease commitments of the Group as a lessor are fully disclosed in Note 26.1. The fair market values of these properties are P73.8 billion and P52.9 billion as of December 31, 2011 and 2010, respectively. These are determined by calculating the present value of the cash inflows anticipated until the end of the life of the investment property using a discount rate of 10% in 2011 and 2010.

- 40 -
12. PROPERTY AND EQUIPMENT
The gross carrying amounts and accumulated depreciation and amortization at the beginning and end of 2011 and 2010 are shown below.
Office Furniture, Office and Condominium Fixtures and Land Transportation Units Equipment Improvements Equipment Land Total
December 31, 2011 Cost P 707,071,366 P 295,154,303 P 146,350,111 P 99,645,611 P 81,095,000 P 1,329,316,391 Accumulated depreciation and amortization ( 463,382,815) ( 180,626,286) ( 82,351,477) ( 62,096,083 ) - ( 788,456,661 ) Net carrying amount P 243,688,551 P 114,528,017 P 63,998,634 P 37,549,528 P 81,095,000 P 540,859,730
December 31, 2010 Cost P 629,423,370 P 208,009,574 P 125,515,520 P 73,056,949 P - P1,036,005,413 Accumulated depreciation and amortization ( 419,607,035) ( 137,705,039) ( 68,848,502) ( 49,326,636 ) - ( 675,487,212 ) Net carrying amount P 209,816,335 P 70,304,535 P 56,667,018 P 23,730,313 P - P 360,518,201
January 1, 2010
Cost P 636,068,482 P 164,774,710 P 110,228,731 P 68,340,932 P - P 979,412,855 Accumulated depreciation and amortization ( 384,211,287) ( 112,828,976) ( 62,091,448) ( 39,104,161 ) - ( 598,235,872 ) Net carrying amount P 251,857,195 P 51,945,734 P 48,137,283 P 29,236,771 P - P 381,176,983
A reconciliation of the carrying amounts at the beginning and end of 2011 and 2010 of property and equipment is shown below.
Office Furniture, Office and Condominium Fixtures and Land Transportation Units Equipment Improvements Equipment Land Total
Balance at January 1, 2011, net of accumulated depreciation and amortization P 209,816,335 P 70,304,535 P 56,667,018 P 23,730,313 P - P 360,518,201 Additions 21,209,000 49,572,739 6,886,910 9,797,777 - 87,466,426 Disposals - ( 3,613,201) ( 3,026,364) ( 2,383,407 ) - ( 9,022,972 ) Property andequipment of newly-acquired subsidiaries 56,783,508 41,185,190 16,974,045 22,709,850 81,095,000 218,747,593 Depreciation and amortization charges for the year ( 44,120,292) ( 42,921,246) ( 13,502,975) ( 16,305,005 ) - ( 116,849,518 ) Balance at December 31, 2011, net of accumulated depreciation and amortization P 243,688,551 P 114,528,017 P 63,998,634 P 37,549,528 P 81,095,000 P 540,859,730

- 41 -
Office Furniture, Office and Condominium Fixtures and Land Transportation Units Equipment Improvements Equipment Land Total Balance at January 1, 2010, net of accumulated depreciation and amortization P 251,857,195 P 51,945,734 P 48,137,283 P 29,236,771 P - P 381,176,983 Additions 2,476,163 43,273,546 14,583,114 2,040,275 - 62,373,098 Disposals ( 9,121,275) ( 38,682) 703,675 2,675,742 - ( 5,780,540 ) Depreciation and amortization charges for the year ( 35,395,748) ( 24,876,063) ( 6,757,054) ( 10,222,475 ) - ( 77,251,340 ) Balance at December 31, 2010 net of accumulated depreciation and amortization P 209,816,335 P 70,304,535 P 56,667,018 P 23,730,313 P - P 360,518,201
13. OTHER NON-CURRENT ASSETS This account consists of:
2011 2010 Goodwill P 345,053,732 P 264,768,344 Guarantee and other deposits 260,906,603 174,767,810 Others 3,087,499 2,559,242 P 609,047,834 P 442,095,396
Goodwill is subject to impairment testing at least annually. No impairment losses were recognized in 2011 and 2010. Guarantee deposits pertain mainly to payments made for compliance with construction requirements in relation to the Group’s real estate projects.
14. INTEREST-BEARING LOANS AND BORROWINGS Interest-bearing Loans and Borrowings account represents the following loans of the Group as of December 31: 2011 2010 Current: Megaworld Corporation P 1,203,380,952 P 1,203,380,952 SPI 400,000,000 - EELHI 221,870,556 - ECOC 54,041,138 107,973,945 Balance brought forward P 1,879,292,646 P 1,311,354,897

- 42 -
2011 2010 Balance forwarded P 1,879,292,646 P 1,311,354,897 Non-current:
Megaworld Corporation 4,871,214,286 6,074,595,238 EELHI 417,377,123 - ECOC - 53,988,238
5,288,591,409 6,128,583,476 P 7,167,884,055 P7,439,938,373
14.1 Megaworld Corporation In 2008, the Company signed a financing deal with a local bank under which the Company may avail of a P5.0 billion unsecured loan, divided into Tranche A (P3.5 billion) and Tranche B (P1.5 billion). The Company had availed of P4.5 billion out of the P5.0 billion facility in 2008 while the remaining P500.0 million was availed of in 2009. The proceeds of the loan were used to fund the development of the Group’s various real estate projects. The loan is payable in seven years with a grace period of two years, divided into 21 consecutive equal quarterly payments. Interest is payable every quarter based on the Philippine Dealing System Treasury Fixing rate (PDSTF-R) plus a certain spread. In February 2009, the Company issued unsecured corporate notes to several financial institutions in the aggregate principal amount of P1.4 billion which will mature in seven years from the issue date. The principal repayments on this loan shall commence in February 2010 and interest shall be paid semi-annually based on a 9.0% annual interest rate. Also, in May 2009, the Company obtained an unsecured long-term loan from a local bank amounting to P500.0 million. The loan is payable for a term of seven years and interest is payable semi-annually based on a floating six-month PDSTF-R plus a certain spread, subject to semi-annual reprising. The remaining portion of the loans payable by the Company pertains to the balance of a long-term loan obtained in 2003 from a local bank with an original amount of P950.0 million which is payable in 10 years, inclusive of a three-year grace period on principal payments. Interest is payable every quarter based on 91-day treasury bill plus a certain spread. The Company also obtained an additional loan with original amount of P403.0 million in 2006 from the same local bank subject to the same terms and conditions. Collateral for the loans consisted of a mortgage over certain investment property of the Company (see Note 11). 14.2 EELHI
EELHI has outstanding secured and unsecured loans from local banks. The loans bear annual interest rates ranging from9.5% to 10.5% in 2011. Certain properties with an estimated carrying value of P1.6 billion as of December 31, 2011, are used as collateral for the P639.2 million bank loan.
Bank loans also include amounts arising from trade receivables discountedon a with-recourse basis(see Note 6). Finance costs that are directly attributable to construction of the EELHI’s projects are capitalized as part of Residential and Condominium Units for Sale. The remaining interest costs are expensed outright and are presented as part of Interest and Other Charges - net in the 2011 consolidated statement of income.

- 43 -
Included also in the balance is the portion of a P400.0 million loan obtained in 2006. This loan bears annual interest of 10.5%. The principal amount is payable in seven equal annual amortization beginning March 15, 2007.
14.3 SPI In 2011, SPI availed of short-term loans from a local bank amounting to P400.0 million. This loan bears an annual interest rate of 5.5% upon maturity in 2012. 14.4 ECOC
The amount payable by ECOC pertains to the balance of a long-term loan facility obtained in 2002 with an original amount of U.S.$25 million (approximately P1.3 billion) from a foreign financial institution. The proceeds of the loan were used in the construction of several information technology buildings at the Eastwood CyberPark which is operated by ECOC. The drawdown from the loan facility amounting to U.S.$20 million (P1.0 billion) was made on October 15, 2002. The loan is payable in 10 years, inclusive of a two-and-a-half year grace period on principal payment. Interest is payable every six months at London Inter-bank Offer Rate plus certain spread. Collaterals for the loan consisted of a mortgage over ECOC’s certain Investment Property (see Note 11), and a full guarantee from the parent company. The Group complied with loan covenants, including maintaining certain financial ratios at the reporting date. Total finance costs attributable to these loans amounted to P523.4 million, P620.6 million in 2011 and 2010, respectively. Of these amounts, the balance of the interest is presented as part of Finance Costs under Interest and Other Charges - net in the consolidated statements of income (see Note 20). Interest charges capitalized in 2011 and 2010 amount to P355.6 million and P384.1 million, respectively. Capitalization rate used in determining the amount of interest charges qualified for capitalization is 8.29%.
15. BONDS PAYABLE
On April 15, 2011, the Group issued seven-year term bonds totaling U.S$200 million. The bonds bear interest at 6.75% per annum payable semi-annually in arrears every April 15 and October 15 each year starting October 15, 2011. The bond will mature on April 15, 2018. On November 18, 2009, the Group issued P5.0 billion fixed rate unsecured bonds with a term of five years and six months which bear an interest of 8.46% per annum. The bonds were issued at par and will be redeemed at 100% of the face value on maturity date. The proceeds received were used by the Group to finance its capital expenditures from 2009 until 2011 mainly for the development of its real estate projects.Interest charges capitalized arising from these bonds amounted to P423.0 million in 2011 and 2010.
- 44 -
On August 4, 2006, the Group issued five-year term bonds totaling U.S.$100 million at a discount of U.S.$1.5 million. The bonds bear interest at 7.875% per annum payable semi-annually in arrears every February 4 and August 4 of each year, starting on February 4, 2007.The bond matured in August 2011. Interest expense from bonds payable is presented as part of Finance Costs under Interest and Other Charges in the consolidated statements of income (see Note 20). During 2008, RHGI bought a portion of the five-year term bonds aggregating to U.S.$22.2 million (P1.1 billion) and these were classified as financial assets at FVTPL by RHGI. The bonds’ fair market value as of December 31, 2010 amounted to U.S.$22.2 million (P972.4 million). The effects of this transaction were eliminated in the preparation of consolidated financial statements.
16. TRADE AND OTHER PAYABLES
This account consists of:
2011 2010 Trade payables P5,241,397,638 P2,203,109,184 Retention payable 1,349,444,587 1,211,950,863 Accrued interest 303,706,055 285,314,152 Accrued construction cost 64,837,800 77,369,336 Miscellaneous 337,580,414 259,969,813
P7,296,966,494 P4,037,713,348
Trade payables mainly represent obligations to subcontractors and suppliers of construction materials for the Group’s projects. Retention payable pertains to amount withheld from payments made to contractors to ensure compliance and completion of contracted projects equivalent to 10% of every billing made by the contractor. Upon completion of the contracted projects, the amounts are returned to the contractors. Miscellaneous payable consist primarily of withholding taxes payable and accrual of salaries and wages and utilities.
17. OTHER LIABILITIES
This account consists of: 2011 2010
Current: Unearned income P 1,513,744,516 P 939,203,207 Deferred rent 27,698,235 797,618,036 Other payables 237,053,966 4,843,817 P 1,778,496,717 P1,741,665,060 Non-current: Deferred rent – net P 1,943,654,006 P 732,378,814 Other payables 702,883,979 286,744,561
P 2,646,537,985 P 1,019,123,375 Other payables mainly comprised of commission payable to the Group’s real estate agents and SPI’s liability on assigned receivables.

- 45 -
18. OPERATING EXPENSES Presented below are the details of this account. Notes 2011 2010 2009 Commission P 934,748,085 P 467,977,819 P 471,837,004 Salaries and employee benefits 21 775,558,589 437,045,219 343,257,217 Advertising and promotions 572,052,650 189,619,585 148,996,615 Depreciation and amortization 11, 12 566,641,137 443,203,639 365,795,590 Utilities and supplies 215,840,286 141,065,957 79,752,963 Taxes and licenses 196,304,569 110,188,073 134,286,970 Professional fees and outside services 176,664,004 68,426,284 28,773,878 Rent 163,714,850 60,263,992 47,103,336 Transportation 142,590,321 103,626,296 100,083,640 Association dues 103,023,327 51,261,055 28,355,868 Miscellaneous 269,087,243 67,547,715 59,877,805 P 4,116,225,061 P 2,140,225,634 P 1,808,120,886
19. EQUITY IN NET EARNINGS OF ASSOCIATES, INTEREST AND OTHER INCOME
Presented below are the details of this account.
Notes 2011 2010 2009 Gain on sale of available-for-sale securities P 2,242,526,309 P 646,720,788 P - Interest income 1,618,727,549 835,944,617 690,238,144 Equity in net earnings of associates 10 597,834,536 442,281,307 157,958,213 Construction income – net 138,492,457 101,962,175 26,473,236 Foreign currency gains – net 65,503,537 3,908,758 - Dividend income 32,661,662 40,630,134 44,247,127 Fair value gains (losses) – net 7 ( 7,851,631) 83,500,000 24,100,000 Miscellaneous – net 642,137,327 59,794,552 32,571,224 P 5,330,031,746 P 2,214,742,331 P 975,587,944

- 46 -
20. INTEREST AND OTHER CHARGES
Presented below are the details of this account.
Notes 2011 2010 2009 Finance costs 14, 15 P 884,058,862 P 516,440,321 P 556,326,705 Foreign currency losses – net 7 - - 8,464,596 Underwriting fees - - 21,505,376 Miscellaneous – net 19,467,573 27,960,793 1,247,492 P 903,526,435 P 544,401,114 P 587,544,169
Finance costs pertain to interest expense incurred from the bonds payable and interest-bearing loans.
21. EMPLOYEE BENEFITS
21.1 Salaries and Employee Benefits Expenses recognized for salaries and employee benefits are presented below (see Note 18).
2011 2010 2009 Salaries and wages P 562,075,202 P 271,233,637 P 229,301,717 Retirement benefit expense 77,666,352 37,271,665 23,547,960 13th month and other employee benefits 135,817,035 128,539,917 90,407,540 P 775,558,589 P 437,045,219 P 343,257,217
21.2 Post-employment Benefit
The Group maintains a funded, tax-qualified, non-contributory retirement plan that is
being administered by a trustee covering all regular full-time employees. Actuarial valuations are made annually to update the retirement benefit costs and the amount of contributions.
The amounts of retirement benefit obligation, presented as non-current liability in the
consolidated statements of financial position, are determined as follows:
2011 2010 Present value of the obligation P 557,555,467 P 209,714,448 Fair value of plan assets ( 76,027,689) ( 53,207,861) Deficiency of plan assets 481,527,778 156,506,587 Unrecognized past service costs ( 3,656,813 ) - Unrecognized actuarial losses ( 192,449,225 ) ( 40,467,402) P 285,421,740 P 116,039,185
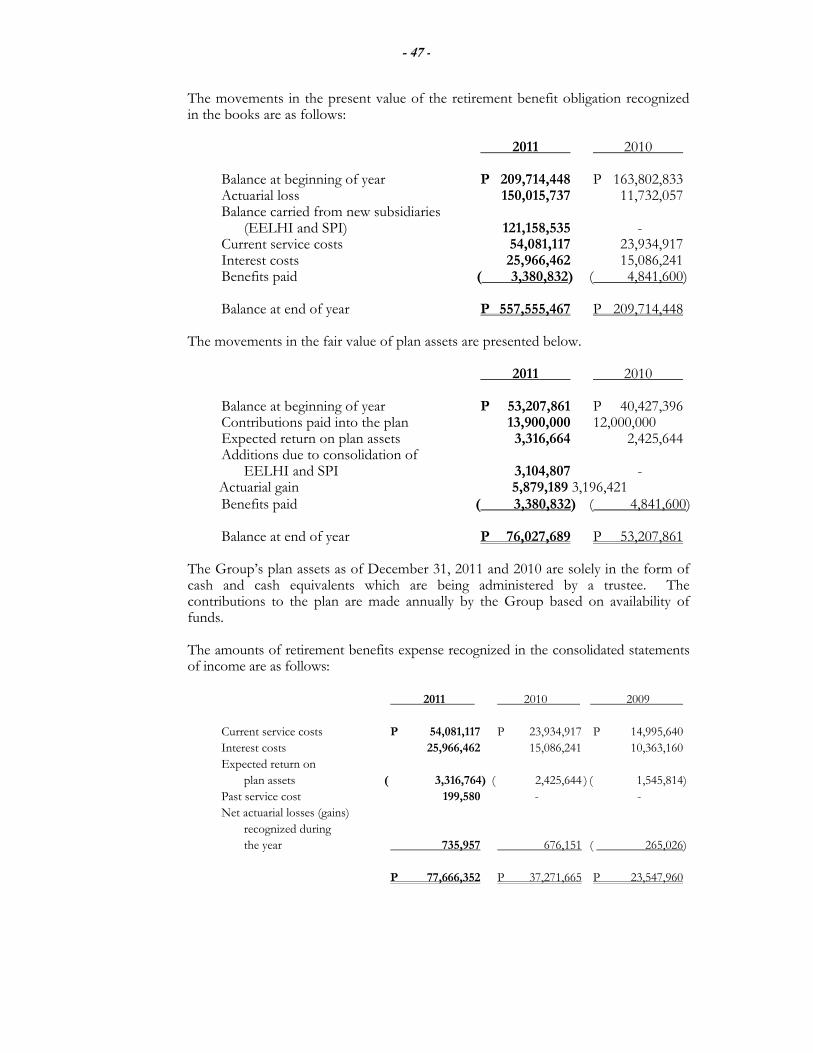
- 47 -
The movements in the present value of the retirement benefit obligation recognized in the books are as follows:
2011 2010 Balance at beginning of year P 209,714,448 P 163,802,833 Actuarial loss 150,015,737 11,732,057 Balance carried from new subsidiaries (EELHI and SPI) 121,158,535 - Current service costs 54,081,117 23,934,917 Interest costs 25,966,462 15,086,241 Benefits paid ( 3,380,832) ( 4,841,600) Balance at end of year P 557,555,467 P 209,714,448
The movements in the fair value of plan assets are presented below. 2011 2010 Balance at beginning of year P 53,207,861 P 40,427,396 Contributions paid into the plan 13,900,000 12,000,000 Expected return on plan assets 3,316,664 2,425,644 Additions due to consolidation of EELHI and SPI 3,104,807 -
Actuarial gain 5,879,189 3,196,421 Benefits paid ( 3,380,832) ( 4,841,600) Balance at end of year P 76,027,689 P 53,207,861 The Group’s plan assets as of December 31, 2011 and 2010 are solely in the form of cash and cash equivalents which are being administered by a trustee. The contributions to the plan are made annually by the Group based on availability of funds. The amounts of retirement benefits expense recognized in the consolidated statements of income are as follows:
2011 2010 2009 Current service costs P 54,081,117 P 23,934,917 P 14,995,640 Interest costs 25,966,462 15,086,241 10,363,160 Expected return on plan assets ( 3,316,764) ( 2,425,644 ) ( 1,545,814) Past service cost 199,580 - - Net actuarial losses (gains) recognized during the year 735,957 676,151 ( 265,026) P 77,666,352 P 37,271,665 P 23,547,960

- 48 -
Presented below are the historical information related to the present value of the retirement benefit obligation, fair value of plan assets and deficiency of plan assets.
2011 2010 2009 2008 2007
Present value of the obligation P 557,555,467 P209,714,448 P 163,802,833 P 91,871,990 P 128,399,196 Fair value of plan assets ( 76,027,689) ( 53,207,861) ( 40,427,396) ( 26,200,243 ) ( 21,000,000 ) Deficiency of plan assets P 481,527,778 P 156,506,587 P 123,375,437 P 65,671,747 P 107,399,196
In determining the amount of retirement benefit obligation, the following actuarial assumptions were used: 2011 2010 Discount rates 8.0% 9.2% Expected rate of return on plan assets 6.0% 6.0% Expected rate of salary increases 10.0% 10.0% Assumptions regarding future mortality are based on published statistics and mortality tables. The average life expectancy of an individual retiring at the age of 65 is 29 for both males and females.
22. CURRENT AND DEFERRED TAXES
The components of tax expense as reported in the consolidated statements of income and consolidated statements of comprehensive income are as follows:
2011 2010 2009 Reported in consolidated statements of income: Current tax expense: Regular corporate income tax (RCIT) at 30% P 1,054,538,463 P 813,802,554 P 512,512,346 Final tax at 20% and 7.5% 181,904,031 111,933,084 86,375,275 Special tax rate at 5% 18,802,816 19,479,041 15,866,373 Minimum corporate income tax (MCIT) at 2% 1,029,759 425,765 26,324 1,256,275,069 945,640,444 614,780,318 Deferred tax expense relating to origination and reversal of temporary differences 739,194,079 663,461,081 822,760,813 P 1,995,469,148 P 1,609,101,525 P1,437,541,131
Reported in consolidated statements of comprehensive income – Deferred tax income relating to origination and reversal of temporary differences ( P 3,842,636) ( P 55,967,408) ( P 26,041,986)
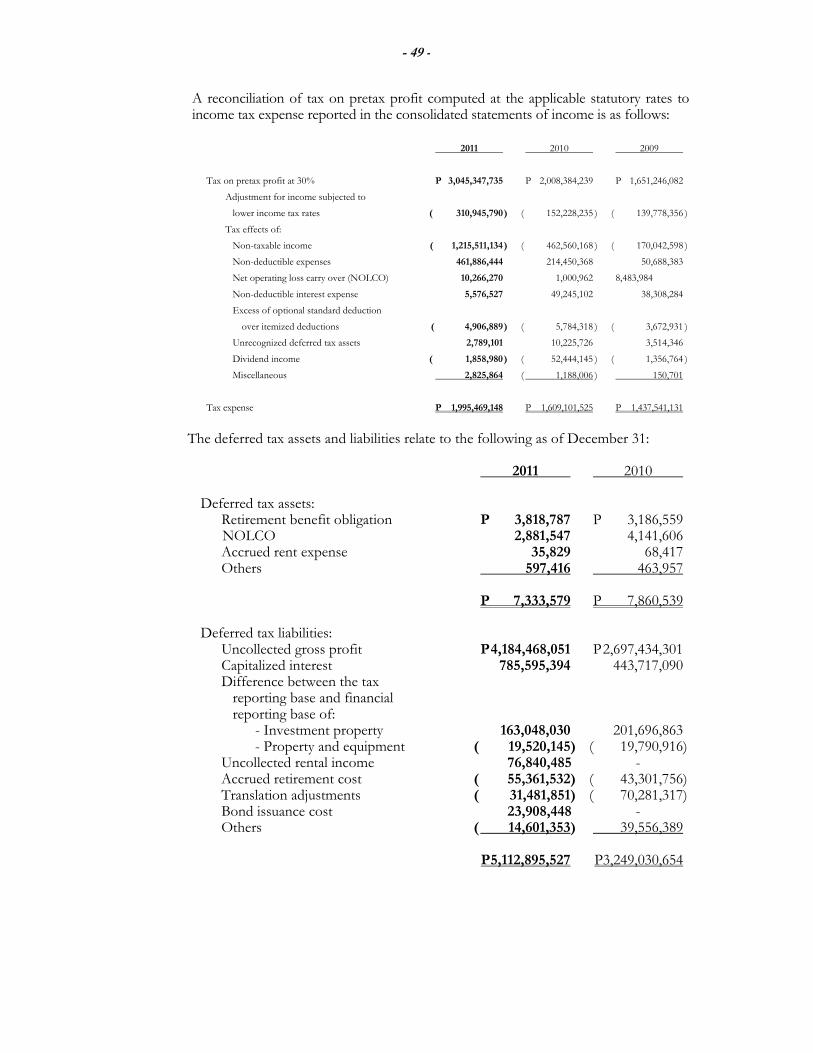
- 49 -
A reconciliation of tax on pretax profit computed at the applicable statutory rates to income tax expense reported in the consolidated statements of income is as follows:
2011 2010 2009
Tax on pretax profit at 30% P 3,045,347,735 P 2,008,384,239 P 1,651,246,082
Adjustment for income subjected to
lower income tax rates ( 310,945,790 ) ( 152,228,235 ) ( 139,778,356 )
Tax effects of:
Non-taxable income ( 1,215,511,134 ) ( 462,560,168 ) ( 170,042,598 )
Non-deductible expenses 461,886,444 214,450,368 50,688,383
Net operating loss carry over (NOLCO) 10,266,270 1,000,962 8,483,984
Non-deductible interest expense 5,576,527 49,245,102 38,308,284
Excess of optional standard deduction
over itemized deductions ( 4,906,889 ) ( 5,784,318 ) ( 3,672,931 )
Unrecognized deferred tax assets 2,789,101 10,225,726 3,514,346
Dividend income ( 1,858,980 ) ( 52,444,145 ) ( 1,356,764 )
Miscellaneous 2,825,864 ( 1,188,006 ) 150,701
Tax expense P 1,995,469,148 P 1,609,101,525 P 1,437,541,131
The deferred tax assets and liabilities relate to the following as of December 31:
2011 2010 Deferred tax assets: Retirement benefit obligation P 3,818,787 P 3,186,559 NOLCO 2,881,547 4,141,606 Accrued rent expense 35,829 68,417 Others 597,416 463,957 P 7,333,579 P 7,860,539 Deferred tax liabilities: Uncollected gross profit P 4,184,468,051 P 2,697,434,301 Capitalized interest 785,595,394 443,717,090 Difference between the tax reporting base and financial reporting base of: - Investment property 163,048,030 201,696,863 - Property and equipment ( 19,520,145) ( 19,790,916) Uncollected rental income 76,840,485 - Accrued retirement cost ( 55,361,532) ( 43,301,756) Translation adjustments ( 31,481,851) ( 70,281,317) Bond issuance cost 23,908,448 - Others ( 14,601,353) 39,556,389 P 5,112,895,527 P3,249,030,654

- 50 -
The components of deferred tax expense (income) are as follows: Consolidated Consolidated Statements Statements of Income of Comprehensive Income 2011 2010 2009 2011 2010 2009 Changes in deferred tax assets: NOLCO P 1,260,059 P 793,817 ( P 4,890,626 ) P - P - P - Retirement benefit obligation ( 632,228 ) ( 601,240 ) ( 597,588 ) - - - Accrued rent expense 32,588 149,927 140,151 - - - Allowance for impairment losses on receivables - - 24,859 - - - Others ( 133,459) ( 315,330 ) ( 146,236 ) - - - Changes in deferred tax liabilities: Uncollected gross profit 1,487,033,750 402,504,512 767,095,402 - - - Capitalized interest 341,878,304 221,065,942 114,550,647 - - - Uncollected rental income 76,840,485 - ( 32,091,485 ) - - - Difference between tax reporting base and financial reporting base of: - Investment property ( 38,648,833 ) 52,892,299 ( 24,060,932 ) - - - - Property and equipment 270,771 259,714 ( 572,373 ) - - - Bond issuance cost 23,908,448 - - - - - Accrued retirement cost ( 12,059,776 ) ( 10,131,499 ) ( 74,389 ) - - - Translation adjustments - - - ( 3,842,636 ) ( 55,967,408 ) ( 26,041,986 ) Others ( 11,171,036 ) ( 3,157,061 ) 3,383,383 - - - 1,868,579,073 663,461,081 822,760,813 ( 3,842,636 ) ( 55,967,408 ) (P 26,041,986 ) Effect of consolidation of EELHI, SPI and GPMAI ( 1,129,384,994 ) - - - - - Deferred Tax Expense (Income) P 739,194,079 P663,461,081 P 822,760,813 ( P 3,842,636 ) ( P 55,967,408 ) (P 26,041,986 )
No deferred tax liability has been recognized on the accumulated equity in net earnings of associates. The Group has no liability for tax should the amounts be declared as dividends since dividend income received from domestic corporation is not subject to income tax.
Majority of the entities within the Group are subject to the MCIT which is computed at 2% of gross income, as defined under the tax regulations. The details of MCIT paid by certain subsidiaries, which can be applied as deduction from their respective future RCIT payable within three years from the year the MCIT was incurred, are shown below. Valid Subsidiary Year incurred Amount Until MNPHI 2011 P 133,459 2014 2010 233,530 2013 2009 230,427 2012 MLI 2011 308,076 2014 2010 37,479 2013 2009 83,571 2012 FTPHI 2011 4,556 2014 2010 7,052 2013 2009 2,386 2012 P 1,040,536 Certain subsidiaries within the Group did not recognize the deferred tax assets on their MCIT.

- 51 -
The details of NOLCO incurred by certain subsidiaries, which can be claimed as deduction from their respective future taxable income within three years from the year the loss was incurred, are shown below. Valid Subsidiary Year incurred Amount Until MCPI 2011 P 11,471,042 2014 2010 39,698,367 2013 2009 29,346,465 2012 MLI 2010 12,118,518 2013 2009 9,932,923 2012 OPI 2010 4,508,189 2013 2009 4,036,439 2012 FTPHI 2010 159,226 2013 2009 320,405 2012 PIPI 2010 81,682 2013 2009 83,140 2012 P 111,756,396 Certain subsidiaries within the Group did not recognize the deferred tax assets on their NOLCO.
The aggregated amounts of assets, retained earnings (deficit), revenues and net profit (loss) of the subsidiaries which incurred NOLCO are as follows:
Retained Earnings Net Profit Assets (Deficit) Revenues (Loss) 2011 OPI P 1,083,452,864 ( P 12,564,220) P 6,023,863 (P 718,719 ) MLI 135,872,604 ( 54,422,304) 20,304,951 5,206,285 MNPHI 115,434,685 3,263,008 102,240,730 1,052,383 MCPI 107,535,283 ( 148,029,736) 76,280,512 ( 9,690,045 ) FTPHI 106,476,993 6,389,513 3,848,171 ( 17,932,137 ) PIPI 5,113,748 42,252 178,147 58,774 P 1,553,886,177 (P 205,321,487) P 208,876,374 (P 22,023,459) 2010
OPI P 924,044,751 ( P 11,869,688) P 5,409 ( P 3,231,949 ) MLI 163,934,861 ( 59,590,765) 4,467,567 7,673,047 FTPHI 126,445,219 24,324,992 967,688 84,000,630 MNPHI 88,640,039 2,485,828 75,840,143 334,225 MCPI 73,900,576 ( 136,355,521) 68,714,334 ( 40,417,472 ) PIPI 5,049,628 ( 16,522) 40,251 ( 47,949 ) P 1,382,015,074 (P 181,021,676) P 150,035,392 P 48,310,532

- 52 -
Management has assessed that the net losses incurred, as well as the related NOLCO, can be recovered through future operations and are not significant to the overall financial condition and financial performance of the Group.
In 2011, 2010 and 2009, the Group opted to continue claiming itemized deductions,
except for MDC which opted to use OSD for 2011, 2010 and 2009.
23. RELATED PARTY TRANSACTIONS
The Group’s related parties include associates, the Group’s key management and other related parties under common ownership as described below. Transactions with related parties are also discussed below. 23.1 Sale of Goods and Rendering of Services to Related Parties
Amount of Transactions 2011 2010 2009 Associates P 1,626,503,151 P 5,289,782 P 3,381,056 Other related parties under common ownership 14,085,487 13,659,040 13,809,067 P 1,640,588,638 P 18,948,822 P 17,190,123
Sale of Goods and Services rendered are usually on a cost-plus basis, allowing a certain margin agreed upon by the parties.
23.2 Obtaining Services from Related Parties
Amount of Transactions Outstanding Balances
2011 2010 2009 2011 2010 2009 Associates P - P - P 2,286,178 P - P - P - Other related parties under common ownership 109,239,723 126,454,782 146,626,602 89,006,474 84,088,445 81,408,167 P 109,239,723 P 126,454,782 P148,912,780 P 89,006,474 P 84,088,445 P 81,408,167
Services obtained are usually on a cost-plus basis, allowing a margin ranging from 10% to 20%. There are no outstanding payables for services obtained from the associates as of December 31, 2011 and 2010. The outstanding balances of payable to other related parties pertain to unpaid commissions presented as part of Other Liabilities in the consolidated statements of financial position (see Note 17).

- 53 -
23.3 Advances to Associates and Other Related Parties
Associates and other related parties are granted noninterest-bearing, unsecured advances by the parent company and other entities in the Group for working capital purposes. The outstanding balances of Advances to Associates and Other Related Parties shown as part of Investments in and Advances to Associates and Other Related Parties in consolidated statements of financial position (see Note 10) are as follows:
2011 2010 Advances to associates: PTHDC P 1,004,987,335 P 1,004,986,820 SHDI 18,164,964 338,598 EELHI - 394,211,729 1,023,152,299 1,399,537,147 Advances to other related parties 1,537,024,137 647,453,685 P 2,560,176,436 P 2,046,990,832 The details of advances to associates and other related parties are as follows: 2011 2010 Balance at beginning of year P2,046,990,832 P 2,012,270,576 Net additions 513,185,604 34,720,256 Balance at end of year P2,560,176,436 P 2,046,990,832
Advances to other related parties pertain to advances granted to entities under common ownership of the ultimate parent company.
23.4 Advances from Other Related Parties Certain expenses of the entities within the Group are paid by other related parties on behalf of the former. The advances are non-interest bearing and unsecured. The outstanding balances from these transactions are presented as Advances from Other Related Parties account in the consolidated statements of financial position and are broken down as follows: 2011 2010 TIHGI P 3,049,847 P 12,906,530 EELHI - 209,116,174 Other related parties under common control 207,192,596 67,845,553 P 210,242,443 P 289,868,257

- 54 -
The details of advances from other related parties are as follows: 2011 2010 Balance at beginning of year P 289,868,257 P 625,936,481 Net repayments ( 79,625,814 ) ( 336,068,224 ) Balance at end of year P 210,242,443 P 289,868,257
23.5 Key Management Personnel Compensations The Group’s key management personnel compensation includes the following:
2011 2010 2009 Short-term benefits P 91,539,715 P 47,174,219 P 42,243,477 Post-employment benefits 10,793,002 4,962,292 4,437,829 P 102,332,717 P 52,136,511 P 46,681,306
24. EQUITY Capital stock consists of: Shares Amount
2011 2010 2009 2011 2010 2009 Preferred shares Series A – P0.01 par value Authorized 6,000,000,000 6,000,000,000 6,000,000,000 P 60,000,000 P 60,000,000 P 60,000,000 Issued and outstanding 6,000,000,000 6,000,000,000 6,000,000,000 P 60,000,000 P 60,000,000 P 60,000,000 Common shares – P1 par value Authorized 30,140,000,000 30,140,000,000 30,140,000,000 P 30,140,000,000 P 30,140,000,000 P 30,140,000,000 Issued and outstanding: Balance at beginning of year 25,769,203,626 25,769,203,626 20,641,646,901 P 25,769,203,626 P 25,769,203,626 P 20,641,646,901 Issued during the year - - 5,127,556,725 - - 5,127,556,725 Balance at end of year 25,769,203,626 25,769,203,626 25,769,203,626 P 25,769,203,626 P 25,769,203,626 P 25,769,203,626 Subscribed: Balance at beginning of year - - - P - P - P - Subscribed during the year - 5,127,556,725 - - 5,127,556,725 Issued during the year - - ( 5,127,556,725 ) - - ( 5,127,556,725) Balance at end of year - - - P - P - P - P 25,829,203,626 P 25,829,203,626 P 25,829,203,626
On June 15, 1994, the SEC approved the listing of the Company’s shares totaling 140,333,333. The shares were initially issued at an offer price of P4.8 per share. As of December 31, 2011, there are 2,854 holders of the listed shares, which closed at P1.7 per share as of that date.
24.1 Preferred Shares Series “A” The preferred shares are voting, cumulative, non-participating, non-convertible and non-redeemable with a par value of P0.01 per share. The shares earn dividends at 1% of par value per annum cumulative from date of issue. Dividends paid on cumulative preferred shares amounted to P600,000 in 2011 and 2010.

- 55 -
24.2 Common Shares On April 28, 2009, the Company offered 5,127,556,725 common shares, by way of pre-emptive stock rights offering, to eligible existing common shareholders at the rate of one right for every four common shares held as of May 4, 2009 at an exercise price of P1 per share. Moreover, shareholders were given four additional stock warrants for every five stock rights subscribed. For every stock warrant, shareholders can avail of one common share at P1 per share. As a result of the stock rights offering, 5,127,556,725 common shares were subscribed and issued on June 1, 2009. Of the total exercise price, 50% was paid as of May 31, 2009 and the remaining 50% shall be paid within one year from issue date. Unpaid subscriptions amounting to P2.3 million as of December 31, 2009 were fully paid by the subscribers in 2010. Relative to the issuance of pre-emptive stock rights, 4,102,045,380 stock warrants were issued and these will be exercisable beginning on the second year until the fifth year from issue date. 24.3 Additional Paid-in Capital
The additional paid-in capital pertains to the excess of the total proceeds received from the Company’s shareholders over the total par value of the common shares. There were no movements in the Company’s Additional Paid-in Capital accounts in 2011, 2010 and 2009.
24.4 Cash Dividends
The details of the Company’s cash dividend declarations, both for preferred and common shares, are as follows:
2011 2010 2009
Declaration date / date of approval by BOD June 16, 2011 May 18, 2010 June 19, 2009 Date of record July 6, 2011 July 6, 2010 July 17, 2009 Date paid July 29, 2011 July 30, 2010 August 12, 2009 Amounts declared and paid P 599,265,803 P 519,885,465 P 479,061,765
On May 18, 2010, MDC’s BOD approved the declaration of cash dividends amounting to P100.0 million to stockholders of record as of said date. Out of the P100.0 million dividends declared, P60.0 million was eliminated during consolidation.
24.5 Treasury Shares In 2008, the Company’s BOD approved the buy-back of shares of up to P2.0 billion worth of common shares in the open market at prevailing market prices. The share buy-back program is made through the trading facilities of the PSE and the funds used for the buy-back were taken from internally-generated funds. As of December 31, 2008, the Company reacquired 131.4 million shares at a total cost of P118.6 million.

- 56 -
This account also includes the Company’s common shares held and acquired by RHGI and GPMAI. The number of treasury common shares aggregated to 537.4 million as of December 31, 2009. The changes in market values of these shares recognized as fair value gains (losses) by RHGI and GPMAI were eliminated in full and were not recognized in the consolidated financial statements. GPMAI was deconsolidated starting 2010 (see Note 10). Accordingly, in 2010, the cost of the treasury held by GPMAI of P555.1 million was removed from the Treasury Stock account presented under equity. In 2011, GPMAI is consolidated back and, accordingly, the cost of the treasury held by GPMAI amounting to P555.1 million is included as part of the Treasury Stock account presented under equity. A portion of the Company’s retained earnings is restricted for dividend declaration up to the cost of treasury stock as of the end of the reporting period.
25. EARNINGS PER SHARE Earnings per share amounts were computed as follows:
2011 2010 2009
Net profit attributable to
parent company’s shareholders P 8,031,884,511 P 5,026,180,575 P 4,055,401,191
Dividends on cumulative preferred shares series “A” ( 600,000 ) ( 600,000 ) ( 600,000)
Profit available to parent company’s common shareholders P 8,031,284,511 P 5,025,580,575 P 4,054,801,191
Divided by weighted number of outstanding common shares 25,149,519,186 25,130,015,061 23,088,192,857 Basic and diluted earnings per share P 0.319 P 0.200 P 0.176 There were no outstanding convertible preferred shares and bonds or other stock
equivalents that may be considered as potential dilutive common shares as of December 31, 2011, 2010 and 2009.

- 57 -
26. COMMITMENTS AND CONTINGENCIES
26.1 Operating Lease Commitments – Group as Lessor The Group is a lessor under several operating leases covering real estate properties for commercial use (see Note 11). The leases have terms ranging from 3 to 20 years, with renewal options, and include annual escalation rates of 5% to 10%. The average annual rental covering these agreements amounts to about P3.8 billion for the consolidated balances. Future minimum lease payments receivable under these agreements are as follows:
2011 2010 2009
Within one year P 4,144,019,854 P 3,145,772,222 P 3,000,082,437 After one year but not more than five years 21,253,587,459 14,998,070,516 10,809,294,660 More than five years 6,704,886,317 4,731,453,360 3,410,016,874 P 32,102,493,630 P 22,875,296,098 P 17,219,393,971
26.2 Operating Lease Commitments – Group as Lessee The Group is a lessee under several operating leases covering condominium units for administrative use. The leases have terms ranging from 1 to 11 years, with renewal options, and include a 5% to 10% annual escalation rate. The average annual rental covering these agreements amounts to about P14.4 million for the consolidated balances. The future minimum rental payables under these non-cancelable leases as of December 31, are as follows:
2011 2010 2009 Within one year P 19,395,713 P 12,247,168 P 16,891,737 After one year but not more than five years 41,710,168 19,039,825 17,951,311 More than five years 11,093,022 18,908,935 23,528,646 P 72,198,903 P 50,195,928 P 58,371,694
26.3 Others There are commitments, guarantees and contingent liabilities that arise in the normal course of operations of the Group which are not reflected in the consolidated financial statements. The management of the Group is of the opinion that losses, if any, from these items will not have any material effect on its consolidated financial statements.
27. RISK MANAGEMENT OBJECTIVES AND POLICIES The Group has various financial instruments such as cash and cash equivalents, financial assets at FVTPL, AFS securities, bank loans, bonds, trade receivables and payables which arise directly from the Group’s business operations. The financial liabilities were issued to raise funds for the Group’s capital expenditures. The Group does not actively engage in the trading of financial assets for speculative purposes.

- 58 -
27.1 Foreign Currency Sensitivity
Most of the Group’s transactions are carried out in Philippine pesos, its functional currency. Exposures to currency exchange rates arise mainly from the Group’s U.S. dollar-denominated cash and cash equivalents, and bonds payable which have been used to fund new projects and to refinance certain indebtedness for general corporate purposes. Foreign currency-denominated financial assets and liabilities, translated into Philippine pesos at the closing rate are as follows:
2011 2010 U.S. Dollars Pesos U.S. Dollars Pesos
Financial assets $ 196,929,685 P 8,749,989,037 $ 245,812,793 P10,790,198,346 Financial liabilities ( 195,759,303) ( 8,599,314,640) ( 7,098,646) ( 311,602,166) $ 1,170,382 P 150,674,397 $ 238,714,147 P 10,478,596,180
The following table illustrates the sensitivity of the consolidated net results for the year in regards to the Group’s financial assets and financial liabilities as shown previously and the U.S. dollar – Philippine peso exchange rate:
Increase (decrease) Effect on consolidated profit before tax in exchange rate 2011 2010 P 1 P 1,170,382 P 238,714,147 (P 1) ( 1,170,382 ) ( 238,714,147 )
Exposures to foreign exchange rates vary during the year depending on the volume of overseas transactions and only affect consolidated profit or loss of the Group. There are no exposures on foreign exchange rate that affect the Group’s other comprehensive income (loss). Nonetheless, the analysis above is considered to be representative of the Group’s currency risk. 27.2 Interest Rate Sensitivity The Group interest risk management policy is to minimize interest rate cash flow risk exposures to changes in interest rates. The Group maintains a debt portfolio unit of both fixed and floating interest rates. These long-term borrowings and all other financial assets and liabilities are subject to variable interest rates.
The Group’s ratio of fixed to floating rate debt stood at 88.12 as of December 31, 2011 and 2010and 87.13 as of December 31, 2009. The following table illustrates the sensitivity of the consolidated net result for the year and consolidated equity to a reasonably possible change in interest rates of +1% and –1% in 2011, 2010 and 2009. The calculations are based on the Group’s financial instruments held at each reporting date. All other variables are held constant.
2011 2010 +1% -1% +1% -1%
Consolidated net results for the year (P 17,638,794) P 17,638,794 (P 15,873,037) P 15,873,037 Consolidated equity ( 12,347,156) 12,347,156 ( 11,111,126) 11,111,126

- 59 -
27.3 Credit Risk Generally, the Group’s credit risk is attributable to trade receivables, rental receivables and other financial assets. The Group maintains defined credit policies and continuously monitors defaults of customers and other counterparties, identified either individually or by group, and incorporate this information into its credit risk controls. Where available at a reasonable cost, external credit ratings and/or reports on customers and other counterparties are obtained and used. The Group’s policy is to deal only with creditworthy counterparties. In addition, for a significant proportion of sales, advance payments are received to mitigate credit risk. Generally, the maximum credit risk exposure of financial assets is the carrying amount of the financial assets as shown in the consolidated statements of financial position (or in the detailed analysis provided in the notes to consolidated financial statements), as summarized below.
Notes 2011 2010 Cash and cash equivalents 5 P 30,324,479,180 P 22,031,584,943 Trade and other receivables 6 36,214,357,760 29,040,792,116 Advances to subsidiaries, associates and other related parties 10, 23.3 2,560,176,436 2,046,990,832 AFS financial securities 8 561,694,969 675,467,827 P 69,660,708,345 P 53,794,835,718
(a) Cash and Cash Equivalents
The credit risk for cash and cash equivalents is considered negligible since the counterparties are reputable banks with high quality external credit ratings.
(b) Trade and Other Receivables
All trade receivables are subject to credit risk exposure. However, the Group does not identify specific concentrations of credit risk with regard to Trade and Other Receivables as the amounts recognized resemble a large number of receivables from various customers. Certain receivables from trade customers are covered by post-dated checks. Certain past due accounts are not provided with allowance for impairment to the extent of the expected market value of the property sold to the customer. The title to the real estate properties remains with the Group until the receivables are fully collected.
27.4 Liquidity Risk The Group manages its liquidity needs by carefully monitoring scheduled debt servicing payments for long-term financial liabilities as well as cash outflows due in a day-to-day business. Liquidity needs are monitored in various time bands, on a day-to-day and week-to-week, as well as on the basis of a rolling 30-day projection. Long-term needs for a six-month and one-year period are identified monthly. The Group maintains cash to meet its liquidity requirements for up to 60-day periods. Excess cash is invested in time deposits or short-term marketable securities. Funding for long-term liquidity needs is additionally secured by an adequate amount of committed credit facilities and the ability to sell long-term financial assets.

- 60 -
As at December 31, 2011 and 2010, the Group’s financial liabilities have contractual maturities which are presented below.
2011
Current Non-current
Within 6 to 12 1 to 5 Later
6 Months Months Years 5 Years
Interest-bearing loans and borrowings P 1,166,666,892 P 712,625,754 P 5,288,591,409 P - Bonds payable - - 5,000,000,000 8,538,914,490 Trade and other payables 2,590,019,174 4,706,947,320 - - Advances from other related parties - - 210,242,443 - P 3,756,686,066 P 5,419,573,074 P 10,498,833,852 P 8,538,914,490
2010
Current Non-current
Within 6 to 12 1 to 5 Later
6 Months Months Years 5 Years
Interest-bearing loans and borrowings P 655,677,449 P 655,677,448 P 6,128,583,476 P - Bonds payable - 3,416,062,159 5,000,000,000 - Trade and other payables 1,847,488,610 2,190,224,738 - - Advances from other related parties - - 289,868,257 - P 2,503,166,059 P 6,261,964,345 P 11,418,451,733 P -
The above contractual maturities reflect the gross cash flows, which may differ from the carrying values of the liabilities at the reporting dates. 27.5 Other Price Risk Sensitivity
The Group’s market price risk arises from its investments carried at fair value (financial assets classified as financial assets at FVTPL and AFS financial assets). It manages its risk arising from changes in market price by monitoring the changes in the market price of the investments. For corporate bonds and equity securities listed in other countries, an average volatility of 54%, 105% and 71% has been observed during 2011, 2010 and 2009, respectively. If quoted price for these securities increased or decreased by that amount, profit before tax would have changed by nil in 2011, P2.7billion in 2010, and P14.6 million in 2009. For equity securities listed in the Philippines, the observed volatility rates of the fair values of the Group’s investments held at fair value and their impact on the Group’s consolidated net profit in 2010 and 2009 and consolidated equity as of December 31, 2010 and 2009 are summarized as follows:
2010
Observed Volatility Rates Impact of Increase Impact on Decrease Increase Decrease Net Profit Equity Net Profit Equity Investment in equity securities in: Holding company +51.53% -51.53% P 64,414,912 P 2,073,193,927 ( P 64,414,912 ) ( P 2,073,193,927 ) Property company +51.54% -51.54% - 71,024,936 - ( 71,024,936 ) P 64,414,912 P 2,144,218,863 ( P 64,414,912 ) (P 2,144,218,863 )

- 61 -
2009 Observed Volatility Rates Impact of Increase Impact on Decrease Increase Decrease Net Profit Equity Net Profit Equity Investment in equity securities in: Holding company +50.32% -50.32% P 20,883,283 P 900,762,327 ( P 20,883,283 ) (P 900,762,327) Property company +61.55% -61.55% - 85,613,014 - - P 20,883,283 P 986,375,341 ( P 20,883,283 ) (P 900,762,327 )
There are no listed equity securities held by the Company in 2011. The investments in listed equity securities are considered long-term strategic investments. In accordance with the Group’s policies, no specific hedging activities are undertaken in relation to these investments. The investments are continuously monitored and voting rights arising from these equity instruments are utilized in the Group’s favor.
28. CATEGORIES AND FAIR VALUES OF FINANCIAL ASSETS AND LIABILITIES
28.1 Comparison of Carrying Amounts and Fair Values
The carrying amounts and fair values of the categories of financial assets and liabilities presented in the consolidated statements of financial position are shown below.
Notes 2011 2010 Carrying Values Fair Values Carrying Values Fair Values Financial Assets Loans and receivables: Cash and cash equivalents 5 P30,324,479,180 P30,324,479,180 P 22,031,584,943 P22,031,584,943 Trade and other receivables - net 6 36,214,357,760 36,214,357,760 29,040,792,116 29,040,792,116 Advances to associates and other related parties 10 2,560,176,436 2,560,176,436 2,046,990,832 2,046,990,832 P69,099,013,376 P69,099,013,376 P 53,119,367,891 P53,119,367,891 Financial assets at fair value through profit or loss 7 P 109,203,260 P 109,203,260 P 125,000,000 P 125,000,000 Available-for-sale financial securities: 8 Equity instruments P 2,030,052,709 P 2,030,052,709 P 5,535,716,669 P 5,535,716,669 Debt instruments 561,694,969 561,694,969 675,467,827 675,467,827 P 2,591,747,678 P 2,591,747,678 P 6,211,184,496 P 6,211,184,496
Financial Liabilities Financial liabilities at amortized cost: Interest-bearing loans and borrowings 14 P 7,167,884,055 P 7,167,884,055 P 7,439,938,373 P 7,439,938,373 Bonds payable 15 13,538,914,490 13,538,914,490 8,416,062,1598,416,062,159 Trade and other payables 16 7,296,966,494 7,296,966,494 4,037,713,348 4,037,713,348 Advances from other related parties 210,242,443 210,242,443 289,868,257 289,868,257 P28,214,007,482 P28,214,007,482 P 20,183,582,137 P20,183,582,137
See Notes 2.5 and 2.9 for a description of the accounting policies for each category of financial instrument. A description of the Group’s risk management objectives and policies for financial instruments is provided in Note 27.
28.2 Fair Value Hierarchy
The Group’s investments in financial assets at FVTPL and AFS financial assets are comprised of equity and debt instruments listed in foreign and local stocks exchange. Fair value measurements of these financial assets were determined directly by reference to published prices quoted in an active market (Level 1 of the fair value hierarchy).

- 62 -
29. CAPITAL MANAGEMENT OBJECTIVES, POLICIES AND PROCEDURES
The Group’s capital management objective is to ensure its ability to continue as a going concern and to provide an adequate return to shareholders by pricing products and services commensurately with the level of risk.
The Group manages its capital structure and makes adjustments to it, in the light of changes in economic conditions. It monitors capital using the debt-to-equity ratio. 2011 2010 Interest-bearing loans and borrowings P 7,167,884,055 P 7,439,938,373 Bonds payable 13,538,914,490 8,416,062,159 P20,706,798,545 P 15,856,000,532 Equity attributable to parent company’s shareholders P 60,956,151,542 P 57,776,023,630 Debt-to-equity ratio 0.34 : 1:00 0.27 : 1:00
The Group has complied with its covenant obligations, including maintaining the required debt-to-equity ratio for the years presented above.
30. OTHER MATTERS
30.1 Registration with Philippine Economic Zone Authority (PEZA) ECOC, as operator of the Eastwood City CyberPark, is registered with PEZA. As a PEZA registered entity, it is entitled to a preferential tax rate of 5% on gross income earned from its PEZA registered activities, in lieu of all local and national taxes, and to other tax privileges. 30.2 International Organization for Standardization (ISO) Certification The parent company was awarded a Certificate of Registration ISO 9001:1994 effective November 26, 1999 by Certification International Philippines, Inc. Effective November 21, 2002, the parent company has upgraded its Certification to ISO 9001:2000 series. The scope of the certification covers all areas of the parent company’s operations, which include planning, design, project management and customer service for its real estate business. Among others, the parent company is required to undergo surveillance audits every six months.

- 63 -
30.3 Awards As a testament to the Company’s industry leadership, the Company was recognized by various award-giving bodies in 2011:
Alpha Southeast Asia Most Organized Investor Relations and Strong Adherence to Corporate Governance
World HRD Congress Best Employer Asia’s Best Managed Company by Finance Asia Best in Investor Relations by Finance Asia

fa
Schedule Content Page No.
Schedules Required under Annex 68-E of the Securities Regulation Code Rule 68
A Financial Assets 1
B Amounts Receivable from Directors, Officers, Employees, Related Parties, and Principal Stockholders (Other than Related Parties)
2
C Indebtedness of Unconsolidated Subsidiaries and Affiliates 3
D Intangible Assets - Other Assets 4
E Long-term Debt 5
F Indebtedness to Related Parties N/A
G Guarantees of Securities of Other Issuers N/A
H Capital Stock 6
Summary of Philippine Financial Reporting Standards Effective as of December 31, 2011 7
Map Showing the Relationship Between the Company and its Related Entities 8
Megaworld Corporation and SubsidiariesList of Supplementary Information
December 31, 2011
Others Required Information
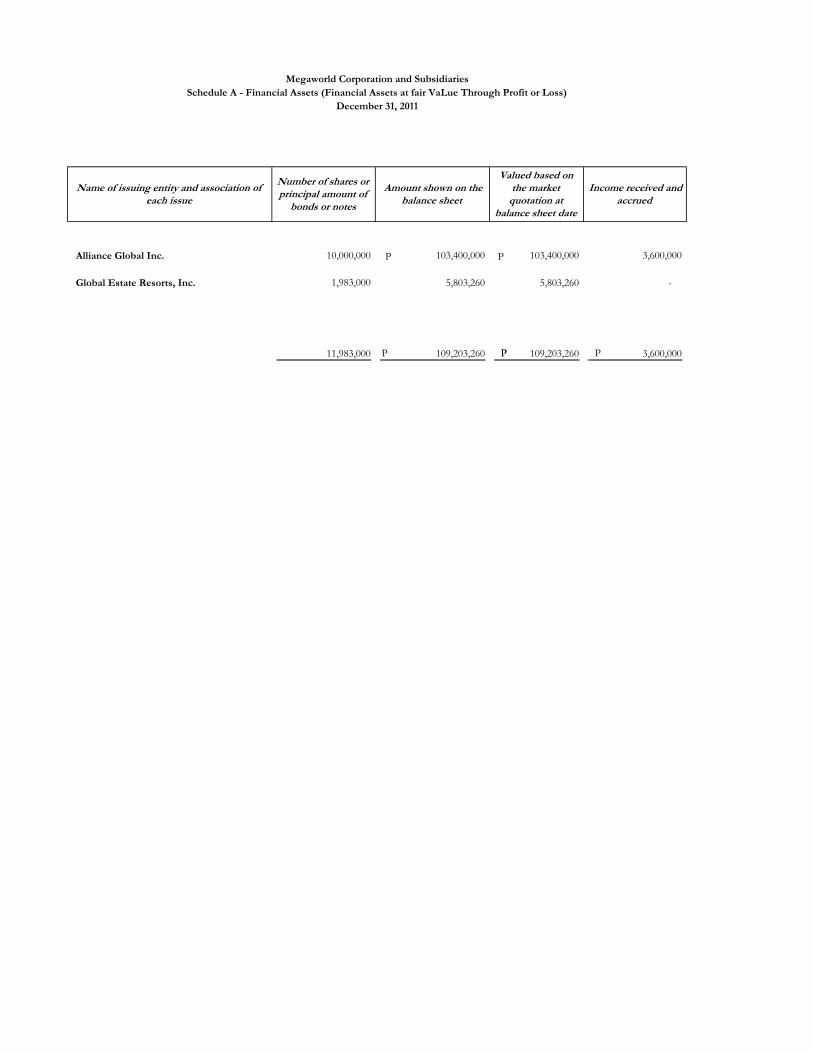
Name of issuing entity and association of each issue
Number of shares or principal amount of
bonds or notes
Amount shown on the balance sheet
Valued based on the market
quotation at balance sheet date
Income received and accrued
Alliance Global Inc. 10,000,000 103,400,000 103,400,000 3,600,000
Global Estate Resorts, Inc. 1,983,000 5,803,260 5,803,260 -
11,983,000 109,203,260 109,203,260 3,600,000
Megaworld Corporation and SubsidiariesSchedule A - Financial Assets (Financial Assets at fair VaLue Through Profit or Loss)
December 31, 2011
P
P
P
P P P

Name and designation of debtor 1 Balance at beginning of period
Additions Amounts collectedAmounts written off
Current Not currentBalance at end of
period
Advances to Officers and Employees:Philipps Cando 622,033 135,716 )( 486,317 486,317
Megaworld Corporation and SubsidiariesSchedule B - Amounts Receivable from Directors, Officers, Employees, Related Parties and Principal Stockholders (Other than Related Parties)
December 31, 2011
Deductions Ending Balance
First VP - Operations
Garry V. de Guzman 225,463 142,316 )( - 83,147 - 83,147 First VP - Legal Affairs
Monica Salomon 327,024 130,810 )( - 196,214 - 196,214
First VP - Corporate Management 1,174,520 P - 408,842 )( P - 765,678 P - 765,678 P
Loans to Directors: - - - - - - -

Name of Related PartiesBalance at beginning of
periodBalance at end of period
Unconsolidated Subsidiary:Empire East Land holdings, Inc. 394,211,729 P - Suntrust Home Developers, Inc.* 338,598 18,164,964 Palm Tree Holdings, Inc. 1,004,986,820 1,004,987,335
Other Related Parties:Suntrust Properties, Inc. 156,959,179 - Asia's Finest Cuisine, Inc. 55,028,018 111,946,376 Eastwood Cinema 7,698,925 7,717,302 First Oceanic Property Management 6,364,604 5,127,839 Eastwood Property Holdings, Inc. 124,873,829 - Eastwoood Locator 151,065 - Adams Properties, Inc. - Alliance Global Group, Inc. 54,664 213,545 Others 296,323,401 1,412,019,076
2,046,990,832P 2,560,176,437P
Megaworld Corporation and SubsidiariesSchedule C - Indebtedness of Unconsolidated Subsidiaries and Related Parties (Other than Affiliates)
December 31, 2011
*Formerly Fairmont Holdings, Inc.

Description Beginning balance Additions at costCharged to cost
and expenses
Charged to other
accounts
Other changes additions
(deductions)Ending balance
Goodwill 264,768,344 P 80,285,388 P - - - 345,053,732 P
Megaworld Corporation and SubsidiariesSchedule D - Intangible Assets - Other Assets
December 31, 2011
Deduction
P PP

Title of issue and type of obligationAmount authorized by
indenture
Amount shown under caption"Current
portion of long-term debt" in related balance sheet
Amount shown under caption"Long-Term
Debt" in related balance sheet
Long -term loan 14,679,247,679 P 1,825,251,508 10,288,591,409Foreign borrowings 9,417,474,490 54,041,138 8,538,914,490
24,096,722,169 P 1,879,292,646 P 18,827,505,899 P
Megaworld Corporation and SubsidiariesSchedule E - Long-Term Debt
December 31, 2011

Remarks
PFRS 1 First-time Adoption of Philippine Financial Reporting Standards
PFRS 2 Share-based Payment
PFRS 3 Business Combinations
PFRS 4 Insurance Contracts
PFRS 5 Non-current Assets Held for Sale and Discontinued Operations
PFRS 6 Exploration for and Evaluation of Mineral Resources
PFRS 7 Financial Instruments: Disclosures
PFRS 8 Operating Segments
PAS 1 Presentation of Financial Statements
PAS 2 Inventories
PAS 7 Statement of Cash Flows
PAS 8 Accounting Policies, Changes in Accounting Estimates and Errors
PAS 10 Events after the Reporting Period
PAS 11 Construction Contracts
PAS 12 Income Taxes
PAS 16 Property, Plant and Equipment
PAS 17 Leases
PAS 18 Revenue
PAS 19 Employee Benefits
PAS 20Accounting for Government Grants and Disclosure of Government Assistance
PAS 21 The Effects of Changes in Foreign Exchange Rates
PAS 23 Borrowing Costs
PAS 24 Related Party Disclosures
PAS 26 Accounting and Reporting by Retirement Benefit Plans
PAS 27 Consolidated and Separate Financial Statements
PAS 28 Investments in Associates
PAS 29 Financial Reporting in Hyperinflationary Economies
PAS 31 Interests in Joint Ventures
PAS 32 Financial Instruments: Presentation
PAS 33 Earnings per Share
PAS 34 Interim Financial Reporting
PAS 36 Impairment of Assets
PAS 37 Provisions, Contingent Liabilities and Contingent Assets
PAS 38 Intangible Assets
PAS 39 Financial Instruments: Recognition and Measurement
PAS 40 Investment Property
PAS 41 Agriculture
Adopted
Adopted
Adopted
Adopted
Not Applicable
Adopted
Adopted
Adopted
Adopted
Adopted
Not Applicable
Adopted
Adopted
Adopted
Philippine Accounting Standards (PAS)
Adopted
Adopted
Adopted
Adopted
Not Applicable
Adopted
Adopted
Not Applicable
Adopted
Adopted
Adopted
Adopted
Adopted
Adopted
Adopted
Adopted
Adopted
Adopted
Not Applicable
Not Applicable
Not Applicable
Adopted
Adopted
Philippine Financial Reporting Standards (PFRS)
Megaworld Corporation
Schedule of Philippine Financial Reporting Standards Effective as of December 31, 2011
Standards and Interpretations Adoption

Remarks
Megaworld Corporation
Schedule of Philippine Financial Reporting Standards Effective as of December 31, 2011
Standards and Interpretations Adoption
IFRIC 1Changes in Existing Decommissioning, Restoration and Similar Liabilities
IFRIC 2 Members' Share in Co-operative Entities and Similar Instruments
IFRIC 4 Determining Whether an Arrangement Contains a Lease
IFRIC 5Rights to Interests Arising from Decommissioning, Restoration and Environmental Rehabilitation Funds
IFRIC 6Liabilities Arising from Participating in a Specific Market - Waste Electrical and Electronic Equipment
IFRIC 7Applying the Restatement Approach under PAS 29, Financial Reporting in Hyperinflationary Economies
IFRIC 9 Reassessment of Embedded Derivatives
IFRIC 10 Interim Financial Reporting and Impairment
IFRIC 12 Service Concession Arrangements
IFRIC 13 Customer Loyalty Programmes
IFRIC 14PAS 19 - The Limit on a Defined Benefit Asset, Minimum Funding Requirements and their Interaction
IFRIC 16 Hedges of a Net Investment in a Foreign Operation
IFRIC 17 Distributions of Non-cash Assets to Owners
IFRIC 18 Transfers of Assets from Customers
IFRIC 19 Extinguishing Financial Liabilities with Equity Instruments
SIC 7 Introduction of the Euro
SIC 10Government Assistance - No Specific Relation to Operating Activities
SIC 12 Consolidation - Special Purpose Entities
SIC 13Jointly Controlled Entities - Non-Monetary Contributions by Venturers
SIC 15 Operating Leases - Incentives
SIC 21 Income Taxes - Recovery of Revalued Non-Depreciable Assets
SIC 25Income Taxes - Changes in the Tax Status of an Entity or its Shareholders
SIC 27Evaluating the Substance of Transactions Involving the Legal Form of a Lease
SIC 29 Service Concession Arrangements: Disclosures
SIC 31 Revenue - Barter Transactions Involving Advertising Services
SIC 32 Intangible Assets - Web Site Costs Not Applicable
Not Applicable
Adopted
Not Applicable
Not Applicable
Not Applicable
Adopted
Not Applicable
Adopted
Not Applicable
Not Applicable
Not Applicable
Adopted
Adopted
Not Applicable
Not Applicable
Adopted
Not Applicable
Not Applicable
Adopted
Not Applicable
Philippine Interpretations - Standing Interpretations Committee (SIC)
Not Applicable
Adopted
Not Applicable
Not Applicable
Not Applicable
Philippine Interpretations - International Financial Reporting Interpretations Committee (IFRIC)

Alliance Global Group, Inc.(Parent)
Anglo Watsons, Inc. (Subsidiary)
First Centro Inc. (Subsidiary)
Alliance Global Cayman, Inc.(Subsidiary)
Adams Properties, Inc. (Subsidiary)
Travellers Group Ltd.(Subsidiary)
Alliance Global Brands, Inc. (Subsidiary)
Venezia Universal Ltd.(Subsidiary)
Emperador Distillers, Inc.(Subsidiary)
Megaworld Corp.(Subsidiary)
Global-Estate Resorts, Inc.(Subsidiary)
McKester Pik-NikInternational Ltd.
(Subsidiary) The Bar Beverage, Inc.(Subsidiary)
Emperador International, Ltd.
(Subsidiary)
ERA Real Estate Exchange, Inc.
(Subsidiary)
Oceanic Realty Group, Int'l. Inc.
(Subsidiary)
Newtown Land Partners, Inc.(Subsidiary)
Tradewinds Estates, Inc.(Subsidiary)
Travellers International Hotel Group, Inc.
(Jointly contrilled entity)
Twin Lakes Corp.(Subsidiary)
Fil-Estate Golf Development, Inc.
(Subsidiary)
Fil-Estate Urban Development Corp.
(Subsidiary)
Oceanfront Properties, Inc.
(Associate)
Fil-Estate Network, Inc.(Associate)
Golforce, Inc.(Subsidiary)
Fil-Estate Eccocentrum, Inc.
(Subsidiary)
Novo Sierra Holdings Corp.
(Subsidiary)
Megaworld Global-Estates, Inc.(Associate)
Fil-Estate Sales, Inc.(Associate)
Fi-Estate Realty and Sales Associates, Inc.
(Associate)
Fil-Estate Realty Corp.(Associate)
Nasugbu Properties, Inc.(Associate)
BrightLeisure Management, Inc.
(Jointly controlled entity)
Grand Integrated Hotel andRecreation, Inc.
(Jointly controlled entity)
GrandServices, Inc.(Jointly controlled entity)
Apec Assets Limited(Jointly controlled entity)
GrandVenture Management Services, Inc.
(Jointly controlled entity)
Genting-Star Tourism Academy, Inc.
(Jointly controlled entity)
Manila Bayshore PropertyHoldings, Inc.
(Subsidiary)
Davao City Food
Clark Mac Enterprises,Inc.
(Subsidiary)
Advance Food Concepts Manufacturing, Inc.
(Subsidiary)
FirstGolden Laoag
Golden Arches Realty Corp.(Subsidiary)
Great American Foods, Inc.
(Subsidiary)
McKester America, Inc.(Subsidiary)
Megaworld Corporation
Travellers International Hotel Group, Inc.
Fil-Estate Properties, Inc.(Subsidiary)
Philippine Aquatic Leisure Corp.(Subsidiary)
Fil-Power Construction Equipment Leasing Corp.
(Subsidiary)
Fil-Estate Subic Development Corp.
(Subsidiary)
Blu SkyAirways, Inc.(Subsidiary)
Aklan Holdings, Inc.(Subsidiary)
Golden Sun Airways, Inc.(Subsidiary)
La Compaña De Sta. Barbara, Inc. (Subsidiary)
MCX Corp.(Subsidiary)
Pioneer L-5 Realty Corp.(Subsidiary)
Prime Airways, Inc.(Subsidiary)
Sto. Domingo PlaceDevelopment Corp.
(Subsidiary)
Fil-Power ConcreteBlocks Corp.(Subsidiary)
Fil-Estate Industrial Park,Inc.
(Subsidiary)
Sherwood Hills Development Inc.
(Subsidiary)
Eastwood Cyber One Corporation(Subsidiary)
Forbes Town Properties & Holdings, Inc.
(Subsidiary)
Mactan Oceanview Properties & Holdings,
Inc.(Subsidiary)
Megaworld Cayman Islands, Inc.(Subsidiary)
Megaworld Land, Inc.(Subsidiary)
Megaworld Newport Property Holdings, Inc.
(Subsidiary)
Empire East Land Holdings, Inc.(Subsidiary)
Megaworld Globus Asia, Inc.
(Subsidiary)
Piedmont Property Ventures, Inc.(Subsidiary)
Stonehaven Land, Inc.(Subsidiary)
Streamwood Property, Inc.
(Subsidiary)
Megaworld-Daewoo Corporation(Subsidiary)
Megaworld Central Properties, Inc.
(Subsidiary)
Philippine International Properties, Inc.
(Subsidiary)
Richmonde Hotel Group International
Megaworld Resort Estates, Inc.(Subsidiary)
Empire East Communities, Inc.
(Subsidiary)
Valle Verde Properties, Inc.
Sonoma Premier Land, Inc.
(Subdiary)
Laguna BelAir School, Inc.
(Subsidiary)
Eastwood Property Holdings, Inc.
(Subsidiary)
Sherman Oak Holdings, Inc.
(Subsidiary)
Gilmore Property Marketing Associates, Inc.
(Subsidiary)
Suntrust Properties, Inc.(Subsidiary)
Oceantown Properties, Inc.
(Subsidiary)
Suntrust Home Developers,Inc.
(Associate)
Palm Tree Holdings and Development Corp.
(Associate)
Townsquare Development, Inc.
(Subsidiary)
First Oceanic Property Management, Inc.
(Associate)
The Prestige Hotels and Resorts, Inc.
Citylink Coach Services, Inc.(Associate)
Alliance Global Properties Ltd.
(Associate)

MEGAWORLD CORPORATION
28/F The World Centre, 330 Sen. Gil Puyat Avenue, Makati City 1200, Philippines Tels: (632) 867-8826 to 40
w;pw.m,gawor/dcotp.com • E-maiL· tiy'[email protected]
STATEMENT OF MANAGEMENT'S RESPONSIBILITY FOR FINANCIAL STATEMENTS
The management of Megaworld Corporation and Subsidiaries, is responsible for the preparation and fair presentation of the consolidated financial statements for the years ended December 31, 2012 and 2011, in accordance with Philippine Financial Reporting Standards (PFRS), including the following additional supplemental information filed separately from the basic financial statements:
a. Supplementary Schedules Required under Annex 68-E of the Securities Regulation Code Rule 68
b. Reconciliation of Retained Earnings Available for Dividend Declaration c. Schedule ofPFRS Effective as of December 31,2012 d. Schedule of Financial Indicators for December 31,2012 and 2011 e. Map Showing the Relationship Between and Among the Company and its Related Entities
Management's responsibility on the consolidated financial statements includes designing and implementing internal controls relevant to the preparation and fair presentation of financial statements that are free from material misstatement, whether due to fraud or error, selecting and applying appropriate accounting policies, and making accounting estimates that are reasonable in the circumstances.
The Board of Directors reviews and approves the consolidated financial statements, and the additional supplementary information, and submits the same to the stockholders.
Punongbayan & Araullo, the independent auditors appointed by the stockholders, has examined the consolidated financial. statements of the Group in accordance with Philippine Standards on Auditing and in its report to the Board of Directors and stockholders, has expressed its opinion on the fairness of presentation upon completion of such examination.
ANDREW L~ AN / Chairman of the Board
'\.~1
ANDREW L. TAN Chief Executive Officer
FRiNCISCO C. CANUTO SVP and Treasurer (Chief Financial Officer)
Signed this 1st day of March 2013
BUREAU OF INTERNAL REVENUE LARGE TAXPAYERS SERVICE
LARGE TAXPAYERS ASSISTANCE DIVISION I
Oate APR 0 3 2013 SDS
RECEIVED E MER B. TANAY
ISO 9001 2008 SERIES CERTIFIED CIP/2652199/11/161

• t1'J 1 MAR 2013 SUBSCRIBED AND SWORN to before me on this _L_ day of Cla'Y OF MAK,ATI Philippines affiants exhibiting to me their Community Tax Certificate Nos. as follows:
AndrewL. Tan Francisco C. Canuto
Doc. No. ~ tdf ; Page No. iif , ; BookNo. ?tV
~of2013
13755402 22014326
Quezon City Makati City
~() ;['(: t:i>t'y1 (l) oakati Ut!ftiiF il\~'ee'tl!~~~v,31lv Z0,14
W P' Nib'.- &§ei ~~,Ufrtime Member MetE Clifflpft~;tett N~, fU-Otl14Ztl2
ApptliiitttH.mt NO, M~ 199-(2013· 201-4.) Pffi Ntt, ;J&f14.;UO Jan. 2, 201l
MakiHi City fioll No. 4009·1 i011dt·!Ji:H1 Av~ .• Brgy.Pro del Pilar.
Ma.kati City
F (NTERNAL REvENUE BUREAU 0 ..,_YERS SERVICE
LARGE ~AssiSTANCE DIVISION I LARGE T~A'/.P.~'A1~"""":.,:;:::~.;;..-~
Date APR 0 3 2013 SDS I
RECEIVED \ ELMER B. TA.NAY ____..~ ..


Notes 2012 2011
A S S E T S
CURRENT ASSETS
Cash and cash equivalents 5 26,826,715,439 P 30,324,479,180 P
Trade and other receivables - net 6 15,345,700,853 17,178,451,090
Financial assets at fair value through profit or loss 7 167,600,000 109,203,260
Residential and condominium units for sale 3 28,889,616,581 19,497,662,902
Property development costs 3 8,618,320,424 8,753,452,084
Prepayments and other current assets - net 2 1,884,456,257 1,801,123,705
Total Current Assets 81,732,409,554 77,664,372,221
NON-CURRENT ASSETS
Trade and other receivables 6 23,916,156,834 20,209,042,452
Advances to landowners and joint ventures 9 3,782,781,280 3,888,345,313
Land for future development 2 4,324,634,536 4,366,523,063
Investments in available-for-sale securities 8 3,256,786,619 2,591,747,678
Investments in and advances to associates and other
related parties 10 7,782,205,062 6,745,964,129
Investment property - net 11 16,632,035,663 12,372,290,665
Property and equipment - net 12 596,965,678 540,859,730
Deferred tax assets - net 22 42,259,622 7,333,579
Other non-current assets 13 657,972,598 609,047,834
Total Non-current Assets 60,991,797,892 51,331,154,443
TOTAL ASSETS 142,724,207,446 P 128,995,526,664 P
MEGAWORLD CORPORATION AND SUBSIDIARIES
CONSOLIDATED STATEMENTS OF FINANCIAL POSITION
DECEMBER 31, 2012 AND 2011
(Amounts in Philippine Pesos)
( A Subsidiary of Alliance Global Group, Inc.)

Notes 2012 2011
LIABILITIES AND EQUITY
CURRENT LIABILITIES
Interest-bearing loans and borrowings 14 1,587,594,400 P 1,950,115,400 P
Trade and other payables 16 7,900,017,312 7,296,966,494
Customers' deposits 2 4,193,247,506 3,610,212,295
Income tax payable 12,560,956 36,897,538
Reserve for property development 2 6,231,192,522 5,107,725,787
Deferred income on real estate sales 2 4,126,291,119 3,446,835,596
Other current liabilities 17 1,712,794,842 1,707,673,963
Total Current Liabilities 25,763,698,657 23,156,427,073
NON-CURRENT LIABILITIES
Interest-bearing loans and borrowings 14 4,910,569,450 5,991,475,388
Bonds payable 15 13,556,628,075 13,538,914,490
Customers' deposits 2 1,741,951,677 456,003,854
Reserve for property development 2 4,094,681,043 3,719,081,747
Deferred income on real estate sales 2 2,311,173,838 1,809,305,117
Deferred tax liabilities - net 22 5,814,797,077 5,112,895,527
Advances from other related parties 23 692,604,550 210,242,443
Retirement benefit obligation 21 390,201,956 285,421,740
Other non-current liabilities 17 2,058,307,552 1,943,654,006
Total Non-current Liabilities 35,570,915,218 33,066,994,312
Total Liabilities 61,334,613,875 56,223,421,385
EQUITY 24
Total equity attributable to
the company's shareholders 71,504,234,954 60,956,151,542
Non-controlling interests 9,885,358,617 11,815,953,737
Total Equity 81,389,593,571 72,772,105,279
TOTAL LIABILITIES AND EQUITY 142,724,207,446 P 128,995,526,664 P
See Notes to Consolidated Financial Statements.
-2-

Notes 2012 2011 2010
REVENUES AND INCOME
Real estate sales 6 18,173,071,093 P 15,887,590,800 P 13,110,567,020 P Interest income on real estate sales 6 1,327,541,711 1,218,788,823 933,424,160 Realized gross profit on prior years' sales 2 2,007,159,684 1,970,174,052 1,355,982,007 Rental income 11 4,994,769,197 3,826,341,215 2,694,310,554 Hotel operations 2 462,313,446 392,171,105 232,757,023 Equity in net earnings of associates 10 794,347,508 597,834,536 442,281,307 Interest and other income - net 19 2,792,225,642 4,732,197,210 1,772,461,024
30,551,428,281 28,625,097,741 20,541,783,095
COSTS AND EXPENSES
Real estate sales 2 11,491,174,383 10,157,277,262 8,606,699,164 Deferred gross profit 2 3,188,317,305 3,055,851,217 2,431,379,388 Hotel operations 2 235,441,633 223,731,697 124,463,666 Operating expenses 18 4,934,193,655 4,116,225,061 2,140,225,634 Interest and other charges - net 20 1,044,391,039 903,526,435 544,401,114 Tax expense 22 2,250,736,998 1,995,469,148 1,609,101,525
23,144,255,013 20,452,080,820 15,456,270,491
PROFIT FOR THE YEAR
BEFORE PREACQUISITION INCOME 7,407,173,268 8,173,016,921 5,085,512,604
PREACQUISITION INCOME OF SUBSIDIARIES 1, 10 - 17,326,952 )( -
NET PROFIT FOR THE YEAR 7,407,173,268 P 8,155,689,969 P 5,085,512,604 P
Net profit attributable to:
Company's shareholders 7,294,070,482 P 8,031,884,511 P 5,026,180,575 P Non-controlling interests 113,102,786 123,805,458 59,332,029
7,407,173,268 P 8,155,689,969 P 5,085,512,604 P
Earnings per Share: 25
Basic 0.281 P 0.319 P 0.200 P
Diluted 0.275 P 0.319 P 0.200 P
MEGAWORLD CORPORATION AND SUBSIDIARIES
CONSOLIDATED STATEMENTS OF INCOME
FOR THE YEARS ENDED DECEMBER 31, 2012, 2011 AND 2010
(Amounts in Philippine Pesos)
See Notes to Consolidated Financial Statements.
( A Subsidiary of Alliance Global Group, Inc.)

Notes 2012 2011 2010
CAPITAL STOCK 24
Balance at beginning of year 25,829,203,626 P 25,829,203,626 P 25,829,203,626 P
Additional issuances during the year 3,109,659,359 - -
Balance at end of year 28,938,862,985 25,829,203,626 25,829,203,626
ADDITIONAL PAID-IN CAPITAL 24 8,432,990,413 8,432,990,413 8,432,990,413
TREASURY STOCK - At Cost 24
Balance at beginning of year 1,188,836,744 )( 633,721,630 )( 1,188,836,744 )(
Reduction representing the shares
held by a deconsolidated subsidiary 555,115,114 - 555,115,114 Additions during the year - 555,115,114 )( -
Balance at end of year 633,721,630 )( 1,188,836,744 )( 633,721,630 )(
NET UNREALIZED GAINS ON
AVAILABLE-FOR-SALE SECURITIES 8
Balance at beginning of year 121,203,880 3,809,613,412 116,256,567
Other comprehensive income (loss) for the year 593,620,712 3,688,409,532 )( 3,693,356,845
Balance at end of year 714,824,592 121,203,880 3,809,613,412
ACCUMULATED TRANSLATION
ADJUSTMENTS 2.4
Balance at beginning of year 261,301,420 )( 252,335,270 )( 121,744,648 )(
Other comprehensive loss for the year, net of tax 165,188,492 )( 8,966,150 )( 130,590,622 )(
Balance at end of year 426,489,912 )( 261,301,420 )( 252,335,270 )(
RETAINED EARNINGS
Balance at beginning of year 28,022,891,787 20,590,273,079 16,043,977,969
Net profit attributable to the company's shareholders 7,294,070,482 8,031,884,511 5,026,180,575
Cash dividends 24 839,193,763 )( 599,265,803 )( 479,885,465 )(
Balance at end of year 34,477,768,506 28,022,891,787 20,590,273,079
Total Equity Attributable to
the Company's Shareholders 71,504,234,954 60,956,151,542 57,776,023,630
NON-CONTROLLING INTERESTS 10
Balance at beginning of year 11,815,953,737 743,113,007 723,869,377
Additions (deductions) 2,043,697,906 )( 10,949,035,272 40,088,399 )(
Net profit attributable to non-controlling interests 113,102,786 123,805,458 59,332,029
Balance at end of year 9,885,358,617 11,815,953,737 743,113,007
TOTAL EQUITY 81,389,593,571 P 72,772,105,279 P 58,519,136,637 P
MEGAWORLD CORPORATION AND SUBSIDIARIES
CONSOLIDATED STATEMENTS OF CHANGES IN EQUITY
FOR THE YEARS ENDED DECEMBER 31, 2012, 2011 AND 2010
(Amounts in Philippine Pesos)
See Notes to Consolidated Financial Statements.
( A Subsidiary of Alliance Global Group, Inc.)

Notes 2012 2011 2010
NET PROFIT FOR THE YEAR 7,407,173,268 P 8,155,689,969 P 5,085,512,604 P
OTHER COMPREHENSIVE INCOME (LOSS)
Net unrealized gains (losses) on
available-for-sale (AFS) securities 8 592,528,177 690,525,167 )( 4,031,843,227 Share in other comprehensive income (loss)
of associates 10 1,092,535 147,365 )( 71,176,649 Reclassification adjustments for gains
on disposed AFS securities included in
profit or loss 8 - 2,997,737,000 )( 473,319,584 )( Reversal of unrealized losses on AFS securities
of a deconsolidated subsidiary - - 63,656,553
593,620,712 3,688,409,532 )( 3,693,356,845
Translation adjustments 235,983,560 )( 12,808,786 )( 186,558,030 )( Less related tax 22, 2.4 70,795,068 3,842,636 55,967,408
165,188,492 )( 8,966,150 )( 130,590,622 )(
428,432,220 3,697,375,682 )( 3,562,766,223
TOTAL COMPREHENSIVE INCOME
FOR THE YEAR 7,835,605,488 P 4,458,314,287 P 8,648,278,827 P
Total comprehensive income attributable to:
Company's shareholders 7,722,502,702 P 4,334,508,829 P 8,588,946,798 P Non-controlling interests 113,102,786 123,805,458 59,332,029
7,835,605,488 P 4,458,314,287 P 8,648,278,827 P
MEGAWORLD CORPORATION AND SUBSIDIARIES
CONSOLIDATED STATEMENTS OF COMPREHENSIVE INCOME
FOR THE YEARS ENDED DECEMBER 31, 2012, 2011 AND 2010
(Amounts in Philippine Pesos)
See Notes to Consolidated Financial Statements.
( A Subsidiary of Alliance Global Group, Inc.)
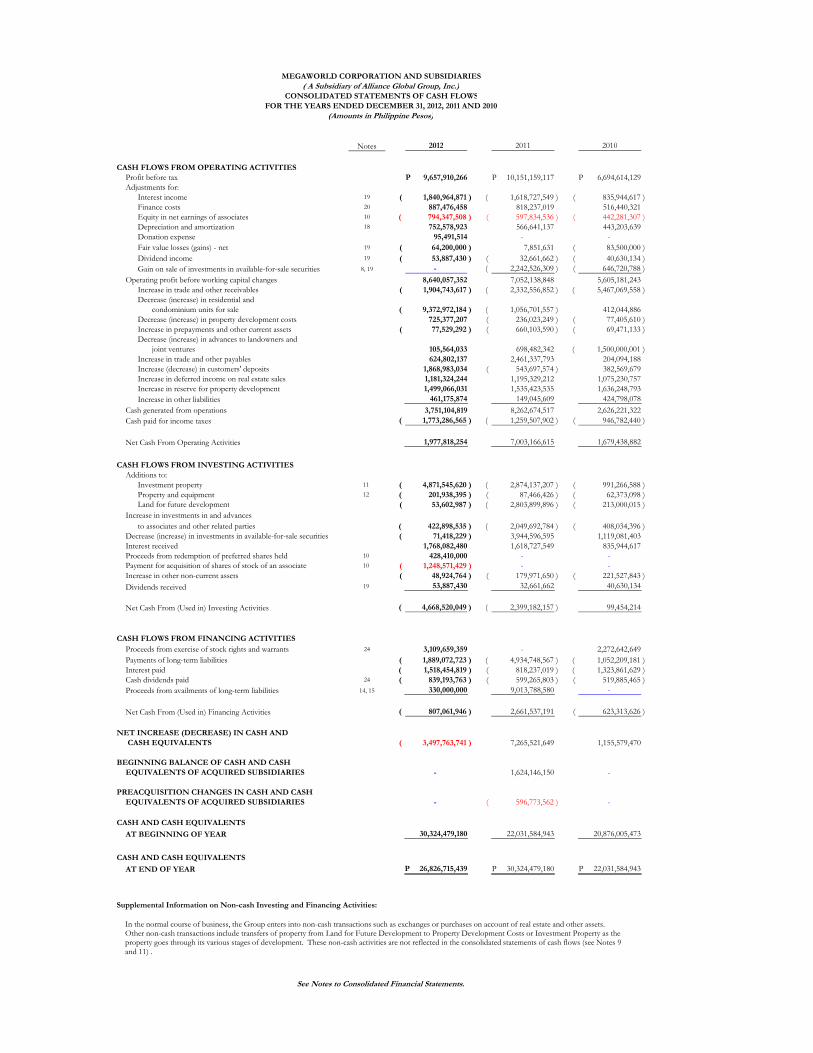
Notes 2012 2011 2010
CASH FLOWS FROM OPERATING ACTIVITIES
Profit before tax 9,657,910,266 P 10,151,159,117 P 6,694,614,129 P
Adjustments for:
Interest income 19 1,840,964,871 )( 1,618,727,549 )( 835,944,617 )(
Finance costs 20 887,476,458 818,237,019 516,440,321
Equity in net earnings of associates 10 794,347,508 )( 597,834,536 )( 442,281,307 )(
Depreciation and amortization 18 752,578,923 566,641,137 443,203,639
Donation expense 95,491,514 - -
Fair value losses (gains) - net 19 64,200,000 )( 7,851,631 83,500,000 )(
Dividend income 19 53,887,430 )( 32,661,662 )( 40,630,134 )(
Gain on sale of investments in available-for-sale securities 8, 19 - 2,242,526,309 )( 646,720,788 )(
Operating profit before working capital changes 8,640,057,352 7,052,138,848 5,605,181,243
Increase in trade and other receivables 1,904,743,617 )( 2,332,556,852 )( 5,467,069,558 )(
Decrease (increase) in residential and
condominium units for sale 9,372,972,184 )( 1,056,701,557 )( 412,044,886
Decrease (increase) in property development costs 725,377,207 236,023,249 )( 77,405,610 )(
Increase in prepayments and other current assets 77,529,292 )( 660,103,590 )( 69,471,133 )(
Decrease (increase) in advances to landowners and
joint ventures 105,564,033 698,482,342 1,500,000,001 )(
Increase in trade and other payables 624,802,137 2,461,337,793 204,094,188
Increase (decrease) in customers' deposits 1,868,983,034 543,697,574 )( 382,569,679
Increase in deferred income on real estate sales 1,181,324,244 1,195,329,212 1,075,230,757
Increase in reserve for property development 1,499,066,031 1,535,423,535 1,636,248,793
Increase in other liabilities 461,175,874 149,045,609 424,798,078
Cash generated from operations 3,751,104,819 8,262,674,517 2,626,221,322
Cash paid for income taxes 1,773,286,565 )( 1,259,507,902 )( 946,782,440 )(
Net Cash From Operating Activities 1,977,818,254 7,003,166,615 1,679,438,882
CASH FLOWS FROM INVESTING ACTIVITIES
Additions to:
Investment property 11 4,871,545,620 )( 2,874,137,207 )( 991,266,588 )(
Property and equipment 12 201,938,395 )( 87,466,426 )( 62,373,098 )(
Land for future development 53,602,987 )( 2,803,899,896 )( 213,000,015 )(
Increase in investments in and advances
to associates and other related parties 422,898,535 )( 2,049,692,784 )( 408,034,396 )(
Decrease (increase) in investments in available-for-sale securities 71,418,229 )( 3,944,596,595 1,119,081,403
Interest received 1,768,082,480 1,618,727,549 835,944,617
Proceeds from redemption of preferred shares held 10 428,410,000 - -
Payment for acquisition of shares of stock of an associate 10 1,248,571,429 )( - -
Increase in other non-current assets 48,924,764 )( 179,971,650 )( 221,527,843 )(
Dividends received 19 53,887,430 32,661,662 40,630,134
Net Cash From (Used in) Investing Activities 4,668,520,049 )( 2,399,182,157 )( 99,454,214
CASH FLOWS FROM FINANCING ACTIVITIES
Proceeds from exercise of stock rights and warrants 24 3,109,659,359 - 2,272,642,649
Payments of long-term liabilities 1,889,072,723 )( 4,934,748,567 )( 1,052,209,181 )(
Interest paid 1,518,454,819 )( 818,237,019 )( 1,323,861,629 )(
Cash dividends paid 24 839,193,763 )( 599,265,803 )( 519,885,465 )(
Proceeds from availments of long-term liabilities 14, 15 330,000,000 9,013,788,580 -
Net Cash From (Used in) Financing Activities 807,061,946 )( 2,661,537,191 623,313,626 )(
NET INCREASE (DECREASE) IN CASH AND
CASH EQUIVALENTS 3,497,763,741 )( 7,265,521,649 1,155,579,470
BEGINNING BALANCE OF CASH AND CASH
EQUIVALENTS OF ACQUIRED SUBSIDIARIES - 1,624,146,150 -
PREACQUISITION CHANGES IN CASH AND CASH
EQUIVALENTS OF ACQUIRED SUBSIDIARIES - 596,773,562 )( -
CASH AND CASH EQUIVALENTS
AT BEGINNING OF YEAR 30,324,479,180 22,031,584,943 20,876,005,473
CASH AND CASH EQUIVALENTS
AT END OF YEAR 26,826,715,439 P 30,324,479,180 P 22,031,584,943 P
Supplemental Information on Non-cash Investing and Financing Activities:
MEGAWORLD CORPORATION AND SUBSIDIARIES
CONSOLIDATED STATEMENTS OF CASH FLOWS
FOR THE YEARS ENDED DECEMBER 31, 2012, 2011 AND 2010
(Amounts in Philippine Pesos)
See Notes to Consolidated Financial Statements.
( A Subsidiary of Alliance Global Group, Inc.)
In the normal course of business, the Group enters into non-cash transactions such as exchanges or purchases on account of real estate and other assets. Other non-cash transactions include transfers of property from Land for Future Development to Property Development Costs or Investment Property as the property goes through its various stages of development. These non-cash activities are not reflected in the consolidated statements of cash flows (see Notes 9 and 11) .

.
MEGAWORLD CORPORATION AND SUBSIDIARIES (A Subsidiary of Alliance Global Group, Inc.)
NOTES TO CONSOLIDATED FINANCIAL STATEMENTS DECEMBER 31, 2012, 2011 AND 2010
(Amounts in Philippine Pesos) 1. CORPORATE INFORMATION
Megaworld Corporation (the Company) was incorporated in the Philippines on
August 24, 1989, primarily to engage in the development of large scale mixed-use planned communities or townships that integrate residential, commercial, leisure and entertainment components. The Company is presently engaged in property-related activities, such as, project design, construction and property management. The Company’s real estate portfolio includes residential condominium units, subdivision lots and townhouses, as well as office projects and retail spaces.
All of the Company’s common shares of stock are listed at the Philippine Stock
Exchange (PSE).
The registered office of the Company, which is also its principal place of business, is located at the 28th Floor, The World Centre Building, Sen. Gil Puyat Avenue, Makati City.
Alliance Global Group, Inc. (AGI or parent company), also a publicly listed company in the Philippines, is the ultimate parent company of Megaworld Corporation and its subsidiaries (the Group). AGI is a holding company and is presently engaged in the food and beverage business, real estate, quick service restaurant and tourism-oriented businesses. AGI’s registered office, which is also its primary place of business, is located at the 7th Floor, 1880 Eastwood Avenue, Eastwood City CyberPark, 188 E. Rodriguez Jr. Avenue, Quezon City.
The Company holds interests in the following subsidiaries and associates: Explanatory Percentage of Ownership
Subsidiaries/Associates Notes 2012 2011 2010
Subsidiaries:
Megaworld Land, Inc. (MLI) 100% 100% 100%
Prestige Hotels and Resorts, Inc. (PHRI) 100% 100% 100%
Mactan Oceanview Properties
and Holdings, Inc. (MOPHI) 100% 100% 100%
Megaworld Cayman Islands, Inc. (MCII) 100% 100% 100%
Richmonde Hotel Group International (RHGI) 100% 100% 100%
Eastwood Cyber One Corporation (ECOC) 100% 100% 100%
Forbes Town Properties and Holdings, Inc. (FTPHI) 100% 100% 100%
Megaworld Newport Property
Holdings, Inc. (MNPHI) 100% 100% 100%
Oceantown Properties, Inc. (OPI) 100% 100% 100%
Piedmont Property Ventures, Inc. (PPVI) (a) 100% 100% 100%
Stonehaven Land, Inc. (SLI) (a) 100% 100% 100%
Streamwood Property, Inc. (SP) (a) 100% 100% 100%

- 2 -
Explanatory Percentage of Ownership
Subsidiaries/Associates Notes 2012 2011 2010
Subsidiaries:
Suntrust Properties, Inc. (SPI) (b) 88.20% 82.45% -
Empire East Land Holdings, Inc. and
Subsidiaries (EELHI) (c) 78.59% 61.13% -
Megaworld Central Properties, Inc. (MCPI) (d) 75.90% 51% 51%
Megaworld-Daewoo Corporation (MDC) 60% 60% 60%
Manila Bayshore Property Holdings, Inc. (MBPHI) (e) 55% 55% -
Megaworld Resort Estates, Inc. (MREI) (f) 51% 51% 51%
Megaworld Globus Asia, Inc. (MGAI) 50% 50% 50%
Philippine International Properties, Inc. (PIPI) (g) 50% 50% 50%
Townsquare Development, Inc. (TDI) (f) 31% 31% 31%
Gilmore Property Marketing Associates, Inc. (GPMAI) (h) - 46.45% -
Associates:
Suntrust Home Developers, Inc. (SHDI) 42.48% 42.48% 42.48%
Megaworld Global Estates, Inc. (MGEI) (i) 40.00% 40.00% -
Palm Tree Holdings and Development
Corporation (PTHDC) 40% 40% 40%
Alliance Global Properties Ltd. (AGPL) (j) 39.44% 39.44% 39.44%
GPMAI (h) 37.23% - 39.83%
Twin Lakes Corporation (TLC) (k) 19% - -
Travellers International Hotel Group, Inc. (TIHGI) (l) 10% 10% 10%
EELHI (c) - - 48.38%
Explanatory Notes:
(a) These were acquired subsidiaries in 2008 but have not yet started commercial operations as of
December 31, 2012. (b) In March 2011, the Company acquired 58.80% direct ownership in SPI. The Company also held an indirect
ownership in SPI of 29.40% through SHDI and EELHI. In 2012, as a result of the Company’s increase in
ownership in EELHI, the Company’s ownership in SPI also increased to 88.20%.
(c) On various dates in 2011, the Company acquired additional shares of EELHI, increasing its ownership to
61.13% and thereby making EELHI a subsidiary of the Company. In 2012, the Company acquired additional
shares of EELHI, resulting in an increase in ownership interest in EELHI to 78.59% as of December 31, 2012.
(d) The Company held indirect ownership in MCPI of 51% through EELHI and GPMAI. As a result of the
Company’s increase in ownership in EELHI, the Company’s ownership in MCPI also increased to 75.90%. (e) MBPHI was incorporated in October 2011 and started commercial operations on January 1, 2012. The
Company holds 50% direct ownership in MBPHI; the latter is also 50% owned by TIHGI, thereby increasing
the Company’s ownership to 55%. (f) MREI was incorporated in 2007 while TDI was incorporated in 2006. MREI owns 60% of TDI resulting in
the Company’s indirect interest of 31% of TDI.
(g) PIPI was incorporated in 2002 and acquired by the Company in 2006 but has not yet started commercial
operations as of December 31, 2012.
(h) GPMAI was an associate of the Group in 2010. In 2011, GPMAI became a subsidiary of the Company
through EELHI, its intermediate parent company. In 2012, GPMAI was deconsolidated and treated as an
associate of both the Company and EELHI, as EELHI lost its control due to the decrease in ownership
interest, but has retained significant influence, over GPMAI. (i) MGEI was incorporated on March 14, 2011 but has not yet started commercial operation as of
December 31, 2012.
(j) In February 2009, RHGI acquired 44.34% ownership in AGPL, which resulted in the Company’s indirect
interest of 44.34% as of December 31, 2009. In October 2010, AGPL issued additional shares of stock which
resulted in the decrease in RHGI’s ownership in AGPL to 39.44%. AGPL is considered as an associate due
to the Company’s significant influence, but not control, over AGPL.

- 3 -
(k) TLC was incorporated in 2011 and has started commercial operation in June 2012. In September 2012, the
Company acquired ownership in TLC which stands at 19% as of December 31, 2012. TLC is considered as
an associate due to the Company’s significant influence over TLC.
(l) TIHGI was incorporated in 2003 and started commercial operations in August 2009. In 2008, the Company
acquired 10% ownership in TIHGI through a share swap agreement. In August 2010, the Company’s
investment in TIHGI was converted to 10.0 million common shares and 990.0 million preferred shares of
TIHGI. Subsequently, TIHGI redeemed 430.0 million in November 2010 and 428.41 million in March 2012
preferred shares held by the Company. The conversion of common shares and the redemption of preferred
shares did not change the Company’s ownership in TIHGI. Although the Company’s percentage ownership
is only 10%, TIHGI was considered as an associate due to the Company’s significant influence over TIHGI.
Except for MCII, RHGI and AGPL, all the subsidiaries and associates were incorporated in the Philippines and operate within the country. MCII and AGPL were incorporated and operate in the Cayman Islands while RHGI was incorporated and operates in the British Virgin Islands.
The Company and its subsidiaries collectively, except for entities which have not yet started commercial operations as of December 31, 2012, are presently engaged in the real estate business, hotel operations and marketing services.
EELHI and SHDI are publicly listed companies in the Philippines.
The consolidated financial statements of the Group for the year ended December 31, 2012 (including the comparatives for the years ended December 31, 2011 and 2010) were authorized for issue by the Company’s Board of Directors (BOD) on March 1, 2013.
2. SUMMARY OF SIGNIFICANT ACCOUNTING POLICIES
The significant accounting policies that have been used in the preparation of these consolidated financial statements are summarized below. The policies have been consistently applied to all the years presented, unless otherwise stated. 2.1 Basis of Preparation of Consolidated Financial Statements
(a) Statement of Compliance with Philippine Financial Reporting Standards
The consolidated financial statements of the Group have been prepared in accordance with Philippine Financial Reporting Standards (PFRS). PFRS are adopted by the Financial Reporting Standards Council (FRSC), from the pronouncements issued by the International Accounting Standards Board (IASB). The consolidated financial statements have been prepared using the measurement bases specified by PFRS for each type of asset, liability, income and expense. These consolidated financial statements have been prepared on the historical cost basis, except for the revaluation of certain financial assets. The measurement bases are more fully described in the accounting policies that follow.

- 4 -
(b) Presentation of Consolidated Financial Statements
The consolidated financial statements are presented in accordance with Philippine Accounting Standard (PAS 1), Presentation of Financial Statements. The Group presents all items of income and expense in two statements: a consolidated statement of income and a consolidated statement of comprehensive income. Two comparative periods are presented for the consolidated statement of financial position when the Group applies an accounting policy retrospectively or makes a retrospective restatement of items in its consolidated financial statements, or reclassifies items in the consolidated financial statements.
(c) Functional and Presentation Currency
These consolidated financial statements are presented in Philippine pesos, the Company’s presentation and functional currency, and all values represent absolute amounts except when otherwise indicated. Items included in the consolidated financial statements of the Group are measured using the Company’s functional currency. Functional currency is the currency of the primary economic environment in which an entity operates.
2.2 Adoption of New and Amended PFRS (a) Effective in 2012 that are Relevant to the Group
In 2012, the Group adopted the following amendments to PFRS that are relevant to the Group and effective for its consolidated financial statements for the annual period beginning on or after July 1, 2011 or January 1, 2012.
PFRS 7 (Amendment) : Financial Instruments: Disclosures – Transfers of Financial Assets PAS 12 (Amendment) : Income Taxes – Deferred Taxes:
Recovery of Underlying Assets
Below is a discussion of the impact of these accounting standards. (i) PFRS 7 (Amendment), Financial Instruments: Disclosures – Transfers of Financial
Assets. The amendment requires additional disclosures that will allow users of financial statements to understand the relationship between transferred financial assets that are not derecognized in their entirety and the associated liabilities; and, to evaluate the nature of, and risk associated with any continuing involvement of the reporting entity in financial assets that are derecognized in their entirety. The Group did not transfer any financial asset involving this type of arrangement; hence, the amendment did not result in any significant change in the Group’s disclosures in its consolidated financial statements.

- 5 -
(ii) PAS 12 (Amendment), Income Taxes – Deferred Tax: Recovery of Underlying Assets. The amendment introduces a rebuttable presumption that the measurement of a deferred tax liability or asset that arises from investment property measured at fair value under PAS 40, Investment Property should reflect the tax consequence of recovering the carrying amount of the asset entirely through sale. The presumption is rebutted for depreciable investment property (e.g., building) that is held within a business model whose objective is to consume substantially all of the economic benefits embodied in the asset over time, rather than through sale. Moreover, Standing Interpretation Committee (SIC) 21, Income Taxes – Recovery of Revalued Non-Depreciable Assets, is accordingly withdrawn and is incorporated in PAS 12 requiring that deferred tax on non-depreciable assets that are measured using the revaluation model in PAS 16, Property, Plant and Equipment, should always be measured on a sale basis of the asset. The amendment has no significant impact on the Group’s consolidated financial statements as the Group’s investment property and land classified as property and equipment are measured at cost.
(b) Effective in 2012 that is not Relevant to the Group
PFRS 1, First-time Adoption of PFRS, was amended to provide relief for first-time adopters of PFRS from having to reconstruct transactions that occurred before the date of transition to PFRS and to provide guidance for entities emerging from severe hyperinflation either to resume presenting PFRS financial statements or to present PFRS financial statements for the first time. The amendment became effective for annual periods beginning on or after July 1, 2011 but is not relevant to the Group’s consolidated financial statements.
(c) Effective Subsequent to 2012 but not Adopted Early
There are new PFRS, amendments and annual improvements to existing standards that are effective for periods subsequent to 2012. Management has initially determined the following pronouncements, which the Group will apply in accordance with their transitional provisions, to be relevant to its consolidated financial statements:
(i) PAS 1 (Amendment), Financial Statements Presentation – Presentation of Items of
Other Comprehensive Income (effective from July 1, 2012). The amendment requires an entity to group items presented in Other Comprehensive Income into those that, in accordance with other PFRS: (a) will not be reclassified subsequently to profit or loss and (b) will be reclassified subsequently to profit or loss when specific conditions are met. The Group’s management expects that this will change the current presentation of items in other comprehensive income (i.e., unrealized fair value gains and losses on AFS Securities and share in other comprehensive income (loss) of associates).

- 6 -
(ii) PAS 19 (Amendment), Employee Benefits (effective from January 1, 2013). The amendment made a number of changes as part of the improvements throughout the standard. The main changes relate to defined benefit plans as follows:
• eliminates the corridor approach under the existing guidance of PAS 19 and requires an entity to recognize all gains and losses arising in the reporting period;
• streamlines the presentation of changes in plan assets and liabilities resulting in the disaggregation of changes into three main components of service costs, net interest on net defined benefit obligation or asset, and remeasurement; and,
• enhances disclosure requirements, including information about the characteristics of defined benefit plans and the risks that entities are exposed to through participation in them.
Currently, the Group is using the corridor approach and its unrecognized
actuarial losses as of December 31, 2012 amounted to P221.0 million which will be retrospectively recognized as losses in other comprehensive income in 2013 (see Note 21.3).
(iii) Consolidation Standards
The Company is currently reviewing the impact on its consolidated financial
statements of the following consolidation standards which will be effective from January 1, 2013:
• PFRS 10, Consolidated Financial Statements. This standard builds on existing principles of consolidation by identifying the concept of control as the determining factor in whether an entity should be included within the consolidated financial statements. The standard also provides additional guidance to assist in determining control where this is difficult to assess.
• PFRS 11, Joint Arrangements. This standard provides a more realistic reflection of joint arrangements by focusing on the rights and obligations of the arrangement, rather than its legal form. This standard replaces the three categories under PAS 31, Interests in Joint Venture, mainly, jointly controlled entities, jointly controlled operations and jointly controlled assets, with two new categories – joint operations and joint ventures. Moreover, this also eliminates the option of using proportionate consolidation for joint ventures.
• PFRS 12, Disclosure of Interest in Other Entities. This standard integrates and makes consistent the disclosure requirements for all forms of interests in other entities, including joint arrangements, associates, special purpose vehicles and unconsolidated structured entities. This also introduces new disclosure requirements about the risks to which an entity is exposed from its involvement with structured entities.

- 7 -
• PAS 27 (Amendment), Separate Financial Statements. This revised standard now covers the requirements pertaining solely to separate financial statements after the relevant discussions on control and consolidated financial statements have been transferred and included in PFRS 10. No new major changes relating to separate financial statements have been introduced as a result of the revision.
• PAS 28 (Amendment), Investments in Associate and Joint Venture. This revised standard includes the requirements for joint ventures, as well as associates, to be accounted for using equity method following the issuance of PFRS 11, Joint Arrangement.
Subsequent to the issuance of the foregoing consolidation standards, the IASB made some changes to the transitional provisions in International Financial Reporting Standard (IFRS) 10, IFRS 11 and IFRS 12, which were also adopted by the FRSC. The guidance confirms that an entity is not required to apply PFRS 10 retrospectively in certain circumstances and clarifies the requirements to present adjusted comparatives. The guidance also made changes to PFRS 10 and PFRS 12 which provide similar relief from the presentation or adjustment of comparative information for periods prior to the immediately preceding period. Further, it provides relief by removing the requirement to present comparatives for disclosures relating to unconsolidated structured entities for any period before the first annual period for which PFRS 12 is applied.
(iv) PFRS 7 (Amendment), Financial Instruments: Disclosures – Offsetting Financial Assets
and Financial Liabilities (effective from January 1, 2013). The amendment requires qualitative and quantitative disclosures relating to gross and net amounts of recognized financial instruments that are set-off in accordance with PAS 32, Financial Instruments: Presentation. The amendment also requires disclosure of information about recognized financial instruments subject to enforceable master netting arrangements or similar agreements, even if they are not set-off in the statement of financial position, including those which do not meet some or all of the offsetting criteria under PAS 32, and amounts related to a financial collateral. These disclosures will allow financial statement users to evaluate the effect or potential effect of netting arrangements, including rights of set-off associated with recognized financial assets and financial liabilities on the entity’s financial position. The Group has initially assessed that the adoption of the amendment will not have a significant impact on its consolidated financial statements.
(v) PFRS 13, Fair Value Measurement (effective from January 1, 2013). This
standard aims to improve consistency and reduce complexity by providing a precise definition of fair value and a single source of fair value measurement and disclosure requirements for use across PFRS. The requirements do not extend the use of fair value accounting but provide guidance on how it should be applied where its use is already required or permitted by other standards. Management is in the process of reviewing its valuation methodologies for conformity with the new requirements and has yet to assess the impact of the new standard on the Group’s consolidated financial statements.
- 8 -
(vi) Philippine Interpretation IFRIC 15, Agreements for Construction of Real Estate. This Philippine interpretation is based on IFRIC interpretation issued by the IASB in July 2008 effective for annual periods beginning on or after January 1, 2009. The adoption of this interpretation in the Philippines, however, was deferred by the FRSC and the Philippine Securities and Exchange Commission after giving due considerations on various application issues and the implication on this interpretation of the IASB’s on-going revision of the Revenue Recognition standard. This interpretation provides guidance on how to determine whether an agreement for the construction of real estate is within the scope of PAS 11, Construction Contracts, or PAS 18, Revenue, and accordingly, when revenue from the construction should be recognized. The main expected change in practice is a shift from recognizing revenue using the percentage of completion method (i.e., as a construction progresses, by reference to the stage of completion of the development) to recognizing revenue upon completion or after delivery. The Group is currently evaluating the impact of this interpretation on its consolidated financial statements in preparation for its adoption when this becomes mandatorily effective in the Philippines.
(vii) PAS 32 (Amendment), Financial Instruments: Presentation – Offsetting Financial
Assets and Financial Liabilities (effective from January 1, 2014). The amendment provides guidance to address inconsistencies in applying the criteria for offsetting financial assets and financial liabilities. It clarifies that a right of set-off is required to be legally enforceable, in the normal course of business, in the event of default and in the event of insolvency or bankruptcy of the entity and all of the counterparties. The amendment also clarifies the principle behind net settlement and includes an example of a gross settlement system with characteristics that would satisfy the criterion for net settlement. The Group does not expect this amendment to have a significant impact on its consolidated financial statements.
(viii) PFRS 9, Financial Instruments: Clarification and Measurement (effective from
January 1, 2015). This is the first part of a new standard on classification and measurement of financial assets and financial liabilities that will replace PAS 39, Financial Instruments: Recognition and Measurement in its entirety. This chapter deals with two measurement categories for financial assets: amortized cost and fair value. All equity instruments will be measured at fair value while debt instruments will be measured at amortized cost only if the entity is holding it to collect contractual cash flows which represent payment of principal and interest. The accounting for embedded derivatives in host contracts that are financial assets is simplified by removing the requirement to consider whether or not they are closely related, and, in most arrangements, do not require separation from the host contract.
For liabilities, the standard retains most of the PAS 39 requirements which
include amortized-cost accounting for most financial liabilities, with bifurcation of embedded derivatives. The main change is that, in case where the fair value option is taken for financial liabilities, the part of a fair value change due to an entity’s own credit risk is recorded in other comprehensive income rather than in profit or loss, unless this creates an accounting mismatch.
To date, other chapters of PFRS 9 dealing with impairment methodology and
hedge accounting are still being completed.

- 9 -
The Group does not expect to implement and adopt PFRS 9 until its effective date or until all chapters of this new standard have been published. In addition, management is currently assessing the impact of PFRS 9 on the Group’s consolidated financial statements and is committed to conduct a comprehensive study of the potential impact of this standard in the last quarter of 2014 before its adoption in 2015 to assess the impact of all changes.
(ix) 2009-2011 Annual Improvements to PFRS. Annual Improvements to PFRS
(2009-2011 Cycle) made minor amendments to a number of PFRS, which are effective for annual period beginning on or after January 1, 2013. Among those improvements, the following amendments are relevant to the Group but management does not expect a material impact on the Group’s consolidated financial statements:
(a) PAS 1 (Amendment), Presentation of Financial Statements – Clarification of the
Requirements for Comparative Information. The amendment clarifies the requirements for presenting comparative information for the following:
• Requirements for opening statement of financial position If an entity applies an accounting policy retrospectively, or makes a
retrospective restatement or reclassification of items that has a material effect on the information in the statement of financial position at the beginning of the preceding period (i.e., opening statement of financial position), it shall present such third statement of financial position.
Other than disclosure of certain specified information in accordance
with PAS 8, Accounting Policies, Changes in Accounting Estimates and Errors, related notes to the opening statement of financial position as at the beginning of the preceding period are not required to be presented.
• Requirements for additional comparative information beyond minimum requirements
If an entity presented comparative information in the financial
statements beyond the minimum comparative information requirements, the additional financial statements information should be presented in accordance with PFRS including disclosure of comparative information in the related notes for that additional information. Presenting additional comparative information voluntarily would not trigger a requirement to provide a complete set of financial statements.
(b) PAS 32 (Amendment), Financial Instruments – Presentation – Tax Effect of
Distributions to Holders of Equity Instruments. The amendment clarifies that the consequences of income tax relating to distributions to holders of an equity instrument and to transaction costs of an equity transaction shall be accounted for in accordance with PAS 12, Income Taxes. Accordingly, income tax relating to distributions to holders of an equity instrument is recognized in profit or loss while income tax related to the transaction costs of an equity transaction is recognized in equity.

- 10 -
2.3 Basis of Consolidation The Company obtains and exercises control through voting rights. The Group’s consolidated financial statements comprise the accounts of the Company and its subsidiaries as enumerated in Note 1, after the elimination of material intercompany transactions. All intercompany balances and transactions with subsidiaries, including income, expenses and dividends are eliminated in full. Unrealized profits and losses from intercompany transactions that are recognized in assets are also eliminated in full. In addition, shares of stock of the Company held by the subsidiaries are recognized as treasury stock and these are presented as deduction in the consolidated statement of changes in equity. Any changes in the market values of such shares as recognized separately by the subsidiaries are likewise eliminated in full. Intercompany losses that indicate impairment are recognized in the consolidated financial statements.
The financial statements of subsidiaries are prepared for the same reporting period as the Company, using consistent accounting policies. Adjustments are made to bring into line any dissimilar accounting policies that may exist.
The Company accounts for its investments in subsidiaries, associates, interests in jointly controlled operations and non-controlling interests as follows: (a) Investments in Subsidiaries
Subsidiaries are all entities over which the Company has the power to control the financial and operating policies generally accompanying a shareholding of more than one half of the voting rights. The existence and effect of potential voting rights that are currently exercisable or convertible are considered when assessing whether the Company controls another entity. Subsidiaries are consolidated from the date the Company obtains control, direct or indirect, until such time that such control ceases. The acquisition method is applied to account for acquired subsidiaries. This requires recognizing and measuring the identifiable assets acquired, the liabilities assumed and any non-controlling interest in the acquiree. The consideration transferred for the acquisition of a subsidiary is the fair values of the assets transferred, the liabilities incurred and the equity interests issued by the Company, if any. The consideration transferred also includes the fair value of any asset or liability resulting from a contingent consideration arrangement. Acquisition-related costs are expensed as incurred and subsequent change in the fair value of contingent consideration is recognized directly in profit or loss.
Identifiable assets acquired and liabilities and contingent liabilities assumed in a business combination are measured initially at their fair values at the acquisition date. On an acquisition-by-acquisition basis, the Group recognizes any non-controlling interest in the acquiree either at fair value or at the non-controlling interest’s proportionate share of the acquiree’s net assets. The excess of the consideration transferred, the amount of any non-controlling interest in the acquiree and the acquisition-date fair value of any existing equity interest in the acquiree over the acquisition-date fair value of the identifiable net assets acquired is recognized as goodwill (see also Note 2.12). If the consideration transferred is less than the fair value of the net assets of the subsidiary acquired in the case of a bargain purchase, the difference is recognized directly in profit or loss as gain.

- 11 -
(b) Investments in Associates
Associates are those entities over which the Company is able to exert significant influence but not control and are neither subsidiaries nor interests in a joint venture. Investments in associates are initially recognized at cost and subsequently accounted for in the consolidated financial statements using the equity method. Acquired investments in associates are also subject to purchase accounting. However, any goodwill or fair value adjustment attributable to the share in the associate is included in the amount recognized as Investment in Associates. All subsequent changes to the share of interest in the equity of the associate are recognized in the Group’s carrying amount of the investment.
Changes resulting from the profit or loss generated by the associate are shown as Equity in Net Earnings of Associates in the Group’s consolidated statements of income and, therefore, affect the net results of the Group. Changes resulting from other comprehensive income of the associates or items recognized directly in the associates’ equity are recognized in other comprehensive income or equity of the Group, as applicable. When the Group’s share of losses in an associate equals or exceeds its interest in the associate, including any other unsecured receivables, the Group does not recognize further losses, unless it has commitments, has incurred obligations or made payments on behalf of the associate.
Unrealized gains on transactions between the Group and its associates are eliminated to the extent of the Group’s interest in the associates. Unrealized losses are also eliminated unless the transaction provides evidence of an impairment of the assets transferred. Accounting policies of associates have been changed where necessary to ensure consistency with the policies adopted by the Group.
(c) Interests in Jointly Controlled Operations
For interests in jointly controlled operations, the Group recognized in its consolidated financial statements the assets that it controls, the liabilities and the expenses that it incurs and its share in the income from the sale of goods or services by the joint venture. The amounts of these related accounts are presented as part of the regular asset and liability accounts and income and expense accounts of the Group.
No adjustment or other consolidation procedures are required for the assets, liabilities, income and expenses of the joint venture that are recognized in the separate financial statements of the venturers.
(d) Transactions with Non-controlling Interests
The Group applies a policy of treating transactions with non-controlling interests as transactions with equity owners of the Group. Any difference between any consideration paid and the relevant share acquired of the carrying value of the net assets of the subsidiary is recognized in equity. Disposals of equity investments to non-controlling interests result in gains and losses that are also recognized in equity.

- 12 -
When the Company ceases to have control over a subsidiary, any retained interest in the entity is remeasured to its fair value, with the change in carrying amount recognized in profit or loss. The fair value is the initial carrying amount for the purposes of subsequently accounting for the retained interest as an associate, joint venture or financial asset. In addition, any amount previously recognized in other comprehensive income in respect of that entity is accounted for as if the Company had directly disposed of the related assets or liabilities. This may mean that amounts previously recognized in other comprehensive income are reclassified to profit or loss.
2.4 Foreign Currency Transactions and Translation
(a) Transactions and Balances
Except for MCII, RHGI and AGPL, which use the U.S. dollars as their functional currency, the accounting records of the Company and its subsidiaries are maintained in Philippine pesos. Foreign currency transactions during the year are translated into the functional currency at exchange rates which approximate those prevailing on transaction dates.
Foreign currency gains and losses resulting from the settlement of such transactions and from the translation at year-end exchange rates of monetary assets and liabilities denominated in foreign currencies are recognized under Interest and Other Income – net in the consolidated statement of income.
(b) Translation of Financial Statements of Foreign Subsidiaries and an Associate
The operating results and financial position of MCII and RHGI, which are measured using the U.S. dollars, their functional currency, are translated to Philippine pesos, the Company’s functional currency, as follows: (i) Assets and liabilities for each statement of financial position presented are
translated at the closing rate at the end reporting period;
(ii) Income and expenses for each profit or loss account are translated at the annual average exchange rates (unless this average is not a reasonable approximation of the cumulative effect of the rates prevailing on the transaction dates, in which case income and expenses are translated at the dates of the transactions); and,
(iii) All resulting exchange differences are recognized as a separate component of
equity. On consolidation, exchange differences arising from the translation of the net investment in MCII and RHGI are recognized as Translation Adjustments in the consolidated statement of comprehensive income. As these entities are wholly owned subsidiaries, the translation adjustments are fully allocated to the Company’s shareholders. Goodwill arising on the acquisition of a foreign entity is recognized as an asset of the foreign entity and translated at the closing rate. The translation of the financial statements into Philippine pesos should not be construed as a representation that the U.S. dollar amounts could be converted into Philippine peso amounts at the translation rates or at any other rates of exchange.

- 13 -
The Company’s equity in net earnings or loss of AGPL, which is also measured in U.S. dollars, is translated to Philippine pesos using the annual average exchange rates.
2.5 Financial Assets Financial assets are recognized when the Group becomes a party to the contractual terms of the financial instruments. Financial assets other than those designated and effective as hedging instruments are classified into the following categories: financial assets at fair value through profit or loss (FVTPL), loans and receivables, held-to-maturity investments and available-for-sale (AFS) financial assets. Financial assets are assigned to the different categories by management on initial recognition, depending on the purpose for which the investments were acquired.
Regular purchases and sales of financial assets are recognized on their trade dates. All financial assets that are not classified as at FVTPL are initially recognized at fair value plus any directly attributable transaction costs. Financial assets carried at FVTPL are initially recorded at fair value and transaction costs related to it are recognized in profit or loss.
The Group’s financial assets are currently categorized as follows: (a) Financial Assets at FVTPL
This category includes financial assets that are either classified as held for trading or that meets certain conditions and are designated by the entity to be carried at fair value through profit or loss upon initial recognition. All derivatives fall into this category, except for those designated and effective as hedging instruments. Assets in this category are classified as current if they are either held for trading or are expected to be realized within 12 months from the end of the reporting period.
Financial assets at FVTPL are measured at fair value, and changes therein are recognized in profit or loss. Financial assets (except derivatives and financial instruments originally designated as financial assets at FVTPL) may be reclassified out of FVTPL category if they are no longer held for the purpose of being sold or repurchased in the near term.
(b) Loans and Receivables
Loans and receivables are non-derivative financial assets with fixed or determinable payments that are not quoted in an active market. They arise when the Group provides money, goods or services directly to a debtor with no intention of trading the receivables. These are included in current assets, except for maturities greater than 12 months after the reporting period which are classified as non-current assets.
Loans and receivables are subsequently measured at amortized cost using the
effective interest method, less impairment losses, if any. Impairment loss is provided when there is an objective evidence that the Group will not be able to collect all amounts due to it in accordance with the original terms of the receivables. The amount of the impairment loss is determined as the difference between the assets’ carrying amount and the present value of estimated cash flows discounted at the effective interest rate.

- 14 -
Loans and receivables are presented as Cash and Cash Equivalents, Trade and Other Receivables (excluding Advances to Contractors and Suppliers), Guarantee and other deposits (presented as part of Other Non-current Assets), and Advances to Associates and Other Related Parties (presented as part of Investments in and Advances to Associates and Other Related Parties) in the consolidated statement of financial position. Cash and cash equivalents are defined as cash on hand, demand deposits and short-term, highly liquid investments readily convertible to known amounts of cash and which are subject to insignificant risk of changes in value.
Trade receivables, which generally have one-year to five-year terms, are noninterest-bearing instruments recognized initially at fair value and subsequently stated at amortized cost using the effective interest method for maturities beyond one year, less accumulated impairment losses, if any. An impairment loss is provided when there is an objective evidence that the Group will not be able to collect all amounts due according to the original terms of receivables. Significant financial difficulties of the debtor, probability that the debtor will enter bankruptcy or financial reorganization, and default or delinquency in payments are considered indicators that the trade receivable is impaired.
(c) AFS Securities
This includes non-derivative financial assets that are either designated to this category or do not qualify for inclusion in any of the other categories of financial assets. They are included as Investments in AFS Securities under non-current assets section in the consolidated statement of financial position unless management intends to dispose of the investment within 12 months of the reporting period.
All AFS Securities are measured at fair value, unless otherwise disclosed, with changes in value recognized in other comprehensive income, net of any effects arising from income taxes. When the asset is disposed of or is determined to be impaired, the cumulative gain or loss recognized in other comprehensive income is reclassified from Net Unrealized Gains (Losses) on AFS Securities to profit or loss and presented as reclassification adjustment within other comprehensive income. Reversal of impairment loss is recognized in other comprehensive income, except for financial assets that are debt securities which are recognized in profit or loss only if the reversal can be objectively related to an event occurring after the impairment loss was recognized.
All income and expenses, including impairment losses, relating to financial assets that are recognized in profit or loss are presented as part of Interest and Other Income - net and Interest and Other Charges – net accounts in the consolidated statement of income.
For investments that are actively traded in organized financial markets, fair value is determined by reference to stock exchange-quoted market bid prices at the close of business on the reporting period. For investments where there is no quoted market price, fair value is determined by reference to the current market value of another instrument which is substantially the same or is calculated based on the expected cash flows of the underlying net asset base of the investment.

- 15 -
Non-compounding interest, dividend income and other cash flows resulting from holding financial assets are recognized in profit or loss when earned, regardless of how the related carrying amount of financial assets is measured. Derecognition of financial assets occurs when the contractual rights to receive cash flows from the financial instruments expire or are transferred and substantially all of the risks and rewards of ownership have been transferred.
2.6 Real Estate Transactions Acquisition costs of raw land intended for future development, including other costs and expenses incurred to effect the transfer of title of the property to the Group, are charged to the Land for Future Development account. These costs are reclassified to Property Development Costs account when the development of the property starts. Related property development costs are then accumulated in this account. Borrowing costs on certain loans incurred during the development of the real estate properties are also capitalized by the Group as part of the property development costs (see Note 2.20). Once a revenue transaction occurred, on a per project basis, up to the stage the unit is sold, the related property development costs are reclassified to Residential and Condominium Units for Sale. The cost of real estate property sold before completion of the development is determined based on the actual costs incurred to date plus estimated costs to complete the development of the property. The estimated expenditures for the development of sold real estate property, as determined by the project engineers, are charged to the Cost of Real Estate Sales presented in the consolidated statement of income with a corresponding credit to a liability account, Reserve for Property Development. Costs of properties and projects accounted for as Land for Future Development, Property Development Costs and Residential and Condominium Units for Sale are assigned using specific identification of their individual costs. These properties and projects are valued at the lower of cost and net realizable value. Net realizable value is the estimated selling price in the ordinary course of business, less estimated costs to complete and the estimated costs necessary to make the sale.
The Group recognizes the effect of revisions in the total project cost estimates in the year in which these changes become known.
2.7 Prepayments and Other Current Assets
Prepayments and other current assets pertain to other resources controlled by the Group as a result of past events. They are recognized in the financial statements when it is probable that the future economic benefits will flow to the Group and the asset has a cost or value that can be measured reliably. Other recognized assets of similar nature, where future economic benefits are expected to flow to the Group beyond one year after the end of the reporting period (or in the normal operating cycle of the business, if longer), are classified as non-current assets.
2.8 Investment Property Properties held for lease under operating lease agreements, which comprise mainly of land, buildings and condominium units, are classified as Investment Property, and carried at cost, net of accumulated depreciation and any impairment in value, except for land which is not subjected to depreciation. Depreciation of investment property, excluding land, is computed using the straight-line method over the estimated useful lives of the assets ranging from 5 to 25 years. Investment property is subject to impairment testing as described in Note 2.17.

- 16 -
Investment property is derecognized upon disposal or when permanently withdrawn from use and no future economic benefit is expected from its disposal. Any gain or loss on the retirement or disposal of an investment property is recognized in the consolidated statement of income in the year of retirement or disposal.
2.9 Property and Equipment Property and equipment are carried at acquisition or construction cost less subsequent depreciation, amortization and any impairment losses, if any.
The cost of an asset comprises its purchase price and directly attributable costs of bringing the asset to working condition for its intended use. Expenditures for additions, major improvements and renewals are capitalized; expenditures for repairs and maintenance are charged to expenses as incurred.
Depreciation is computed on the straight-line basis over the estimated useful lives of the assets. Amortization of office and land improvements is recognized over the estimated useful lives of improvements or the term of the lease, whichever is shorter. The depreciation and amortization periods for property and equipment, based on the above policies, are as follows:
Condominium units 10-25 years Office and land improvements 5-20 years Transportation equipment 5 years Office furniture, fixtures and equipment 3-5 years
Construction in progress represents properties under construction and is stated at cost. This includes cost of construction, applicable borrowing costs (see Note 2.20) and other direct costs. The account is not depreciated until such time that the assets are completed and available for use. An asset’s carrying amount is written down immediately to its recoverable amount if the asset’s carrying amount is greater than its estimated recoverable amount (see also Note 2.17). The residual values and estimated useful lives of property and equipment are reviewed, and adjusted if appropriate, at the end of each reporting period. An item of property and equipment is derecognized upon disposal or when no future economic benefits are expected to arise from the continued use of the asset. When assets are sold, retired or otherwise disposed of, their cost and related accumulated depreciation and amortization and any impairment losses are removed from the accounts. Any gain or loss arising on derecognition of the asset (calculated as the difference between the net disposal proceeds and the carrying amount of the item) is included in the profit or loss in the year the item is derecognized.
2.10 Financial Liabilities
Financial liabilities of the Group include Interest-bearing Loans and Borrowings, Bonds Payable, Trade and Other Payables [excluding value-added tax (VAT) and other tax-related payables] and Advances from Other Related Parties.
Financial liabilities are recognized when the Group becomes a party to the contractual terms of the instrument. All interest related charges are recognized as expense in profit or loss under the caption Interest and Other Charges – net account in the consolidated statement of income.

- 17 -
Interest-bearing Loans and Borrowings and Bonds Payable are raised for support of long-term funding of operations. These are recognized at proceeds received, net of direct issue costs. Finance charges, including premiums payable on settlement or redemption and direct issue costs, are charged to profit or loss except for capitalized borrowing cost, on an accrual basis using the effective interest method and are added to the carrying amount of the instrument to the extent that these are not settled in the period in which they arise.
Trade and Other Payables and Advances from Other Related Parties are initially recognized at their fair value and subsequently measured at amortized cost using effective interest method for maturities beyond one year, less settlement payments. Dividend distributions to shareholders are recognized as financial liabilities when the dividends are approved by the BOD. Financial liabilities are classified as current liabilities if payment is due to be settled within one year or less after the reporting period (or in the normal operating cycle of the business, if longer), or the Group does not have an unconditional right to defer settlement of the liability for at least twelve months after the reporting period. Otherwise, these are presented as non-current liabilities.
Financial liabilities are derecognized from the consolidated statement of financial position only when the obligations are extinguished either through discharge, cancellation or expiration. 2.11 Offsetting Financial Instruments
Financial assets and liabilities are offset and the resulting net amount is reported in the consolidated statement of financial position when there is a legally enforceable right to set-off the recognized amounts and there is an intention to settle on a net basis, or realize the asset and settle the liability simultaneously.
2.12 Business Combination Business acquisitions are accounted for using the acquisition method of accounting (previously called “purchase method”).
Goodwill represents the excess of the cost of an acquisition over the fair value of the Group’s share of the net identifiable assets of the acquired subsidiary at the date of acquisition. Subsequent to initial recognition, goodwill is measured at cost less any accumulated impairment losses. Goodwill is tested annually for impairment and carried at cost less accumulated impairment losses (see also Note 2.17). Impairment losses on goodwill are not reversed. Negative goodwill, which is the excess of the Company’s interest in the net fair value of net identifiable assets acquired over acquisition cost, is charged directly to income.
For the purpose of impairment testing, goodwill is allocated to cash-generating units or groups of cash-generating units that are expected to benefit from the business combination in which the goodwill arose. The cash-generating units or groups of cash-generating units are identified according to operating segment.
Gains and losses on the disposal of an interest in a subsidiary include the carrying amount of goodwill relating to it.

- 18 -
If the business combination is achieved in stages, the acquirer is required to remeasure its previously held equity interest in the acquiree at its acquisition-date fair value and recognize the resulting gain or loss, if any, in the profit or loss or other comprehensive income, as appropriate. Any contingent consideration to be transferred by the Group is recognized at fair value at the acquisition date. Subsequent changes to the fair value of the contingent consideration that is deemed to be an asset or liability is recognized in accordance with PAS 37 either in profit or loss or as a change to other comprehensive income. Contingent consideration that is classified as equity is not remeasured, and its subsequent settlement is accounted for within equity.
2.13 Segment Reporting
Operating segments are reported in a manner consistent with the internal reporting provided to the Group’s Strategic Steering Committee (SSC), its chief operating decision-maker. The SSC is responsible for allocating resources and assessing performance of the operating segments.
In identifying its operating segments, management generally follows the Group’s products and service lines as disclosed in Note 4, which represent the main products and services provided by the Group. Each of these operating segments is managed separately as each of these service lines requires different technologies and other resources as well as marketing approaches. All inter-segment transfers are carried out at arm’s length prices.
The measurement policies the Group uses for segment reporting under PFRS 8 are the same as those used in its financial statements, except that the following are not included in arriving at the operating profit of the operating segments: • post-employment benefit expenses; • expenses relating to share-based payments; • research costs relating to new business activities; and, • revenue, costs and fair value gains from investment property.
In addition, corporate assets which are not directly attributable to the business activities of any operating segment are not allocated to a segment. There have been no changes from prior periods in the measurement methods used to determine reported segment profit or loss.
2.14 Provisions and Contingencies Provisions are recognized when present obligations will probably lead to an outflow of economic resources and they can be estimated reliably even if the timing or amount of the outflow may still be uncertain. A present obligation arises from the presence of a legal or constructive obligation that has resulted from past events.

- 19 -
Provisions are measured at the estimated expenditure required to settle the present obligation, based on the most reliable evidence available at the end of the reporting period, including the risks and uncertainties associated with the present obligation. Where there are a number of similar obligations, the likelihood that an outflow will be required in settlement is determined by considering the class of obligations as a whole. When time value of money is material, long-term provisions are discounted to their present values using a pretax rate that reflects market assessments and the risks specific to the obligation. The increase in the provision due to passage of time is recognized as interest expense. Provisions are reviewed at the end of each reporting period and adjusted to reflect the current best estimate.
In those cases where the possible outflow of economic resource as a result of present obligations is considered improbable or remote, or the amount to be provided for cannot be measured reliably, no liability is recognized in the consolidated financial statements. Similarly, probable inflows of economic benefits to the Group that do not yet meet the recognition criteria of an asset are considered contingent assets, hence, are not recognized in the consolidated financial statements. On the other hand, any reimbursement that the Group can be virtually certain to collect from a third party with respect to the obligation is recognized as a separate asset not exceeding the amount of the related provision. 2.15 Revenue and Expense Recognition Revenue comprises revenue from the sale of goods and the rendering of services measured by reference to the fair value of consideration received or receivable by the Group for goods sold and services rendered, excluding VAT and trade discounts.
Revenue is recognized to the extent that it is probable that the economic benefits will flow to the Group and the revenue can be reliably measured. The following specific recognition criteria must also be met before revenue is recognized:
(a) Sale of residential and condominium units – For financial reporting purposes, revenues
from transactions covering sales of residential and condominium units are recognized under the percentage-of-completion method. Under this method, realization of gross profit is recognized by reference to the stage of development of the properties, i.e., revenue is recognized in the period in which the work is performed. The unrealized gross profit on a year’s sales is presented as Deferred Gross Profit in the consolidated statement of income; the cumulative unrealized gross profit as of the end of the year is shown as Deferred Income on Real Estate Sales (current and non-current liabilities) in the consolidated statements of financial position.
The sale is recognized when a certain percentage of the total contract price has already been collected. The amount of real estate sales recognized in the consolidated statement of income is equal to the total contract price, net of day-one loss related to the discounting of noninterest-bearing receivables. If the transaction does not yet qualify as sale, the deposit method is applied until all conditions for recording the sale are met. Pending the recognition of sale, payments received from buyers are presented under the Customers’ Deposits account in the liabilities section of the consolidated statements of financial position. Revenues and costs relative to forfeited or back out sales are reversed in the current year as they occur. For tax reporting purposes, a modified basis of computing the taxable income for the year based on collections from sales is used by the Company, MGAI, EELHI and ECOC, while MDC reports revenues for tax purposes based also on the percentage-of-completion method.

- 20 -
(b) Sale of undeveloped land – Revenues on sale of undeveloped land are recognized using the full accrual method. Under the full accrual method, revenue is recognized when the risks and rewards of ownership on the undeveloped land have passed to the buyer and the amount of revenue can be measured reliably.
(c) Rental income, commission income and hotel operations – Revenue is recognized when the
performance of contractually agreed tasks has been substantially rendered. Rental income is recognized on a straight-line basis over the lease term. Advance rentals received are recorded as deferred rental income. Unearned Revenues pertain to advanced collections from real estate customers. For tax purposes, rental income is recognized based on the contractual terms of the lease.
(d) Construction contracts – Revenue is recognized when the performance of contractually
agreed tasks have been substantially rendered using the cost recovery and percentage-of-completion methods. Provisions for estimated losses on uncompleted contracts are made in the period in which such losses are determined.
(e) Interest – Revenue is recognized as the interest accrues taking into account the effective yield on the asset.
(f) Dividends – Revenue is recorded when the stockholders’ right to receive the payment is established.
Costs of residential and condominium units sold before completion of the projects include the acquisition cost of the land, development costs incurred to date, applicable borrowing costs (see Note 2.20) and estimated costs to complete the project, determined based on estimates made by the project engineers (see also Note 2.6). Operating expenses and other costs (other than costs of real estate sold) are recognized in profit or loss upon utilization of the service or receipt of goods or at the date they are incurred.
2.16 Leases The Group accounts for its leases as follows: (a) Group as Lessee
Leases which do not transfer to the Group substantially all the risks and benefits of ownership of the asset are classified as operating leases. Operating lease payments (net of any incentives received from the lessor) are recognized as expense in the profit or loss on a straight-line basis over the lease term. Associated costs, such as repairs and maintenance and insurance, are expensed as incurred.
(b) Group as Lessor
Leases which do not transfer to the lessee substantially all the risks and benefits of ownership of the asset are classified as operating leases. Operating lease income is recognized as income in profit or loss on a straight-line basis over the lease term.

- 21 -
The Group determines whether an arrangement is, or contains, a lease based on the substance of the arrangement. It makes an assessment of whether the fulfillment of the arrangement is dependent on the use of a specific asset or assets and the arrangement conveys a right to use the asset. 2.17 Impairment of Non-financial Assets
The Group’s Investments in Associates, Goodwill (included as part of Other Non-current Assets), Investment Property and Property and Equipment are subject to impairment testing. All other individual assets are tested for impairment whenever events or changes in circumstances indicate that the carrying amount may not be recoverable. For purposes of assessing impairment, assets are grouped at the lowest levels for which there are separately identifiable cash flows (cash-generating units). As a result, assets are tested for impairment either individually or at the cash-generating unit level.
Impairment loss is recognized for the amount by which the asset’s or cash-generating unit’s carrying amount exceeds its recoverable amount, which is the higher of its fair value less costs-to-sell and its value in use. In determining value in use, management estimates the expected future cash flows from each cash-generating unit and determines the suitable interest rate in order to calculate the present value of those cash flows. All assets are subsequently reassessed for indications that an impairment loss previously recognized may no longer exist and the carrying amount of the asset is adjusted to the recoverable amount resulting in the reversal of impairment loss.
2.18 Employee Benefits
(a) Defined Benefit Plan
Post-employment benefit is provided to employees through a defined benefit plan.
A defined benefit plan is a post-employment plan that defines an amount of post-employment benefit that an employee will receive on retirement, usually dependent on one or more factors such as age, years of service and salary. The legal obligation for any benefits from this kind of post-employment plan remains with the Group, even if plan assets for funding the defined benefit plan have been acquired. Plan assets may include assets specifically designated to a long-term benefit fund, as well as qualifying insurance policies. The Group’s post-employment defined benefit plan covers all regular full-time employees. The pension plan is tax-qualified, non-contributory and administered by a trustee. The liability recognized in the consolidated statements of financial position for defined benefit plans is the present value of the defined benefit obligation (DBO) at the end of reporting period less the fair value of plan assets, together with adjustments for unrecognized actuarial gains or losses and past service costs. The DBO is calculated annually by independent actuaries using the projected unit credit method. The present value of the DBO is determined by discounting the estimated future cash outflows using a discount rate derived from interest rates of zero coupon agreement bonds published by the Philippine Dealing Exchange Corporation that are denominated in the currency in which the benefits will be paid and that have terms to maturity approximating to the terms of the related post-employment liability.

- 22 -
Actuarial gains and losses are not recognized as an income or expense unless the total unrecognized gain or loss exceeds 10% of the greater of the obligation and related plan assets. The amount exceeding this 10% corridor is charged or credited to profit or loss over the employees’ expected average remaining working lives. Actuarial gains and losses within the 10% corridor are disclosed separately. Past-service costs are recognized immediately in profit or loss, unless the changes to the post-employment plan are conditional on the employees remaining in service for a specified period of time (the vesting period). In this case, the past service costs are amortized on a straight-line basis over the vesting period.
(b) Termination Benefits Termination benefits are payable when employment is terminated by the Group before the normal retirement date, or whenever an employee accepts voluntary redundancy in exchange for these benefits. The Group recognizes termination benefits when it is demonstrably committed to either: (i) terminating the employment of current employees according to a detailed formal plan without possibility of withdrawal; or (ii) providing termination benefits as a result of an offer made to encourage voluntary redundancy. Benefits falling due more than 12 months after the reporting period are discounted to their present value.
(c) Compensated Absences Compensated absences are recognized for the number of paid leave days (including holiday entitlement) remaining at the end of the reporting period. They are included in the Trade and Other Payables account of the consolidated statement of financial position at the undiscounted amount that the Group expects to pay as a result of the unused entitlement.
2.19 Share-based Employee Remuneration
The Company grants share options to qualified employees of the Group eligible under a stock option plan. The services received in exchange for the grant, and the corresponding share options, are valued by reference to the fair value of the equity instruments granted at grant date. This fair value excludes the impact of non-market vesting conditions (for example profitability and sales growth targets and performance conditions), if any. The share-based remuneration is recognized as an expense in profit or loss and the corresponding share option is presented as Share Options Outstanding account in the equity section of the statement of financial position. The expense is recognized during the vesting period based on the best available estimate of the number of share options expected to vest. The estimate is subsequently revised, if necessary, such that it equals the number that ultimately vests on vesting date. No subsequent adjustment is made to expense after vesting date, even if share options are ultimately not exercised.
Upon exercise of share option, the proceeds received net of any directly attributable transaction costs up to the nominal value of the shares issued are allocated to capital stock with any excess being recorded as additional paid-in capital (APIC), and the cost of the stock option under Share Options Outstanding account is reclassified to APIC.

- 23 -
2.20 Borrowing Costs
For financial reporting purposes, borrowing costs are recognized as expenses in the period in which they are incurred, except to the extent that they are capitalized. Borrowing costs that are directly attributable to the acquisition, construction or production of a qualifying asset (i.e., an asset that takes a substantial period of time to get ready for its intended use or sale) are capitalized as part of the cost of such asset. The capitalization of borrowing costs commences when expenditures for the asset are being incurred, borrowing costs are being incurred and activities that are necessary to prepare the asset for its intended use or sale are in progress. Capitalization ceases when substantially all such activities are complete. For income tax purposes, interest and other borrowing costs are charged to expense when incurred.
2.21 Income Taxes Tax expense recognized in profit or loss comprises the sum of deferred tax and current tax not recognized in other comprehensive income or directly in equity, if any.
Current tax assets or liabilities comprise those claims from, or obligations to, fiscal authorities relating to the current or prior reporting period, that are uncollected or unpaid at the reporting period. They are calculated using the tax rates and tax laws applicable to the fiscal periods to which they relate, based on the taxable profit for the year. All changes to current tax assets or liabilities are recognized as a component of tax expense in profit or loss. Deferred tax is provided, using the liability method on temporary differences at the end of the reporting period between the tax base of assets and liabilities and their carrying amounts for financial reporting purposes. Under the liability method, with certain exceptions, deferred tax liabilities are recognized for all taxable temporary differences and deferred tax assets are recognized for all deductible temporary differences and the carry forward of unused tax losses and unused tax credits to the extent that it is probable that taxable profit will be available against which the deferred income tax asset can be utilized. Unrecognized deferred tax assets are reassessed at the end of each reporting period and are recognized to the extent that it has become probable that future taxable profit will be available to allow such deferred tax assets to be recovered. The carrying amount of deferred tax assets is reviewed at the end of each reporting period and reduced to the extent that it is probable that sufficient taxable profit will be available to allow all or part of the deferred tax asset to be utilized. Deferred tax assets and liabilities are measured at the tax rates that are expected to apply to the period when the asset is realized or the liability is settled provided such tax rates have been enacted or substantively enacted at the end of the reporting period. Most changes in deferred tax assets or liabilities are recognized as a component of tax expense in the profit or loss. Only changes in deferred tax assets or liabilities that relate to items recognized in other comprehensive income or directly in equity are recognized in other comprehensive income or directly in equity. Deferred tax assets and deferred tax liabilities are offset if the Group has a legally enforceable right to set off current tax assets against current tax liabilities and the deferred taxes relate to the same entity and the same taxation authority.

- 24 -
2.22 Related Party Relationships and Transactions
Related party transactions are transfers of resources, services or obligations between the entities in the Group and their related parties, regardless whether a price is charged.
Parties are considered to be related if one party has the ability to control the other party or exercise significant influence over the other party in making financial and operating decisions. Related parties include: (a) individuals owning, directly or indirectly through one or more intermediaries, control or are controlled by, or under common control with the Group; (b) associates; and, (c) individuals owning, directly or indirectly, an interest in the voting power of the Group that gives them significant influence over the Group and close members of the family of any such individual.
In considering each possible related party relationship, attention is directed to the substance of the relationship and not merely on the legal form.
2.23 Equity Capital stock is determined using the nominal value of shares that have been issued. Additional paid-in capital (APIC) includes any premiums received on the issuance of capital stock. Any transaction costs associated with the issuance of shares are deducted from APIC, net of any related income tax benefits. Treasury stock are stated at the cost of re-acquiring such shares and are deducted from equity attributable to the Company’s equity holders until the shares are cancelled, reissued or disposed of.
Net unrealized gains (losses) on AFS securities represent gains or losses recognized due to changes in fair values of these assets. Accumulated translation adjustments represent the translation adjustments resulting from the translation of foreign-currency denominated financial statements of certain foreign subsidiaries into the Group’s functional and presentation currency. Retained earnings represent all current and prior period results of operations as reported in the consolidated statement of income, reduced by the amounts of dividends declared. 2.24 Earnings Per Share Basic earnings per share (EPS) is computed by dividing consolidated net profit attributable to equity holders of the Company by the weighted average number of shares issued and outstanding, adjusted retroactively for any stock dividend, stock split and reverse stock split during the current year, if any.
Diluted EPS is computed by adjusting the weighted average number of ordinary shares outstanding to assume conversion of potential dilutive common shares. Potential dilutive common shares as of December 31, 2012 refer to stock warrants not yet exercised. The Group does not have potential dilutive common shares as of December 31, 2011 and 2010.

- 25 -
2.25 Events after the Reporting Period
Any post-year-end event that provides additional information about the Group’s financial position at the end of the reporting period (adjusting event) is reflected in the consolidated financial statements. Post-year-end events that are not adjusting events, if any, are disclosed when material to the consolidated financial statements.
3. SIGNIFICANT ACCOUNTING ESTIMATES AND JUDGMENTS The Group’s consolidated financial statements prepared in accordance with PFRS
require management to make judgments and estimates that affect amounts reported in the consolidated financial statements and related notes. Judgments and estimates are continually evaluated and are based on historical experience and other factors, including expectations of future events that are believed to be reasonable under the circumstances. Actual results may ultimately vary from these estimates.
3.1 Critical Management Judgments in Applying Accounting Policies
In the process of applying the Group’s accounting policies, management has made the
following judgments, apart from those involving estimation, which have the most significant effect on the amounts recognized in the consolidated financial statements:
(a) Impairment of Investments in AFS Securities
The determination when an investment is other-than-temporarily impaired requires significant judgment. In making this judgment, the Group evaluates, among other factors, the duration and extent to which the fair value of an investment is less than its cost; and the financial health of and near-term business outlook for the investee, including factors such as industry and sector performance, changes in technology and in operational and financing cash flows. Based on the recent evaluation of information and circumstances affecting the Group’s investments in AFS securities, management concluded that the assets are not impaired as of December 31, 2012 and 2011. Future changes in such information and circumstance might significantly affect the carrying amount of the assets.
(b) Distinction Among Investment Property, Owner-Occupied Properties and Land for Future Development
The Group determines whether a property qualifies as investment property. In making its judgment, the Group considers whether the property generates cash flows largely independently of the other assets held by an entity. Owner-occupied properties generates cash flows that are attributable not only to property but also to other assets used in the production or supply process while Land for Future Development are properties intended solely for future development.

- 26 -
Some properties comprise a portion that is held to earn rental or for capital appreciation and another portion that is held for use in the Group’s main line of business or for administrative purposes. If these portions can be sold separately (or leased out separately under finance lease), the Group accounts for the portions separately. If the portions cannot be sold separately, the property is accounted for as investment property only if an insignificant portion is held for use in the Group’s main line of business or for administrative purposes. Judgment is applied in determining whether ancillary services are so significant that a property does not qualify as investment property. The Group considers each property separately in making its judgment.
(c) Distinction between Operating and Finance Leases
The Group has entered into various lease agreements. Critical judgment was exercised by management to distinguish each lease agreement as either an operating or finance lease by looking at the transfer or retention of significant risk and rewards of ownership of the properties covered by the agreements. Failure to make the right judgment will result in either overstatement or understatement of assets and liabilities.
(d) Recognition of Provisions and Contingencies
Judgment is exercised by management to distinguish between provisions and contingencies. Accounting policies on recognition and disclosure of provision are discussed in Note 2.14 and disclosures on relevant provisions and contingencies are presented in Note 26.
3.2 Key Sources of Estimation Uncertainty The following are the key assumptions concerning the future, and other key sources of estimation uncertainty at the end of the reporting period, that have a significant risk of causing a material adjustment to the carrying amounts of assets and liabilities within the next financial year: (a) Revenue Recognition Using the Percentage-of-Completion Method
The Group uses the percentage-of-completion method in accounting for its gross profit on real estate sales. The use of the percentage-of-completion method requires the Group to estimate the portion completed using relevant information such as costs incurred to date as a proportion of the total budgeted cost of the project and estimates by engineers and other experts. Should the proportion of the percentage of completed projects differ by 5% from management’s estimates, the amount of revenue recognized in 2012 would have increased by P371.85 million or would have decreased by P352.93 million if the proportion performed decreased. There were no changes in the assumptions or basis for estimation during the year.

- 27 -
(b) Determining Net Realizable Value of Residential and Condominium Units for Sale, Property Development Costs and Land for Future Development
In determining the net realizable value of residential and condominium units for sale, property development costs and land for future development, management takes into account the most reliable evidence available at the times the estimates are made. The future realization of the carrying amounts of real estate for sale and property development costs is affected by price changes in the different market segments as well as the trends in the real estate industry. These are considered key sources of estimation and uncertainty and may cause significant adjustments to the Group’s Residential and Condominium Units for Sale, Property Development Costs and Land for Future Development within the next financial year.
Considering the Group’s pricing policy, the net realizable values of real estate units for sale are higher than their related costs.
The carrying values of the Group’s Residential and Condominium Units for Sale, Property Development Costs, and Land for Future Development amounted to P28.9 billion, P8.6 billion and P4.3 billion, respectively, as of December 31, 2012 and P19.5 billion, P8.8 billion and P4.4 billion, respectively, as of December 31, 2011.
(c) Fair Value Measurement of Investment Property
Investment Property is measured using the cost model. The fair value disclosed in Note 11 to the consolidated financial statements is determined by the Group using the discounted cash flows valuation technique since the information on current or recent prices of investment property is not available. The Group uses assumptions that are mainly based on market conditions existing at each reporting period, such as: the receipt of contractual rentals; expected future market rentals; void periods; maintenance requirements; and appropriate discount rates. These valuations are regularly compared to actual market yield data and actual transactions by the Group and those reported by the market. The expected future market rentals are determined on the basis of current market rentals for similar properties in the same location and condition.
(d) Estimating Useful Lives of Property and Equipment and Investment Property
The Group estimates the useful lives of property and equipment and investment property based on the period over which the assets are expected to be available for use. The estimated useful lives of property and equipment and investment property are reviewed periodically and are updated if expectations differ from previous estimates due to physical wear and tear, technical or commercial obsolescence and legal or other limits on the use of the assets. In addition, estimation of the useful lives of property and equipment and investment property is based on collective assessment of industry practice, internal technical evaluation and experience with similar assets.
The carrying amounts of Investment Property and Property and Equipment are disclosed in Notes 11 and 12, respectively. Based on management’s assessment as at December 31, 2012 and 2011, there is no change in the estimated useful lives of these assets during those years. Actual results, however may vary due to changes in estimates brought by changes in factors mentioned above.

- 28 -
(e) Impairment of Trade and Other Receivables
Adequate amount of allowance is provided for specific and groups of accounts, where an objective evidence of impairment exists. The Group evaluates these accounts based on available facts and circumstances, including, but not limited to, the length of the Group’s relationship with the customers, the customers’ current credit status based on third party credit reports and known market forces, average age of accounts, collection experience and historical loss experience.
The carrying value of trade and other receivables and the analysis of allowance for impairment on such financial assets are shown in Note 6.
(f) Valuation of Financial Assets Other than Trade and Other Receivables
The Group carries certain financial assets at fair value, which requires the extensive use of accounting estimates and judgment. In cases when active market quotes are not available, fair value is determined by reference to the current market value of another instrument which is substantially the same or is calculated based on the expected cash flows of the underlying net base of the instrument. The amount of changes in fair value would differ had the Group utilized different valuation methods and assumptions. Any change in fair value of these financial assets and liabilities would affect profit and loss and equity. The carrying amounts of cash and cash equivalents, financial assets at FVTPL and AFS Securities and the amounts of fair value changes recognized during the years on those assets are disclosed in Notes 5, 7 and 8, respectively.
(g) Determining Realizable Amount of Deferred Tax Assets
The Group reviews its deferred tax assets at the end of each reporting period and reduces the carrying amount to the extent that it is no longer probable that sufficient taxable profit will be available to allow all or part of the deferred tax asset to be utilized. Management assessed that the balance of deferred tax assets as at December 31, 2012 and 2011 will be utilized within the next two to three years.
The carrying amount of the net deferred tax assets as of December 31, 2012 and 2011 is disclosed in Note 22.
(h) Impairment of Non-financial Assets
In assessing impairment, management estimates the recoverable amount of each asset or a cash-generating unit based on expected future cash flows and uses an interest rate to calculate the present value of those cash flows. Estimation uncertainties relates to assumptions about future operating results and the determination of suitable discount rate. Also, the Group’s policy on estimating the impairment of non-financial assets is discussed in detail in Note 2.17. Though management believes that the assumptions used in the estimation of fair values reflected in the consolidated financial statements are appropriate and reasonable, significant changes in these assumptions may materially affect the assessment of recoverable values and any resulting impairment loss could have a material adverse effect on the results of operations. There were no impairment losses required to be recognized in 2012 and 2011 based on management’s assessment.

- 29 -
(i) Valuation of Post-employment Benefit
The determination of the Group’s obligation and cost of post-employment benefits is dependent on the selection of certain assumptions used by actuaries in calculating such amounts. Those assumptions are described in Note 21.3 and include, among others, discount rates, expected return on plan assets, employee turnover and salary increase rate. In accordance with PFRS, actual results that differ from the assumptions are accumulated and amortized over future periods and, therefore, generally affect the recognized expense and recorded obligation in such future periods.
The amounts of retirement benefit obligation and expense and an analysis of the movements in the estimated present value of retirement benefit obligation are presented in Note 21.3.
(j) Business Combinations On initial recognition, the assets and liabilities of the acquired business and the consideration paid for them are included in the consolidated financial statements at their fair values. In measuring fair value, management uses estimates of future cash flows and discount rates. Any subsequent change in these estimates would affect the amount of goodwill if the change qualifies as a measurement period adjustment. Any other change would be recognized in profit or loss in the subsequent period.
4. SEGMENT INFORMATION
4.1 Business Segments
The Group’s operating businesses are organized and managed separately according to the nature of products and services provided, with each segment representing a strategic business unit that offers different products and serves different markets. The Group is engaged in the development of residential and office units including urban centers integrating office, residential and commercial components. The Real Estate segment pertains to the development and sale of residential and office developments. The Rental segment includes leasing of office and commercial spaces. The Hotel Operations segment relates to the management of hotel business operations. The Corporate and Others segment includes marketing services, general and corporate income and expense items. Segment accounting policies are the same as the policies described in Note 2.13. The Group generally accounts for intersegment sales and transfers as if the sales or transfers were to third parties at current market prices.
4.2 Segment Assets and Liabilities
Segment assets are allocated based on their physical location and use or direct association with a specific segment and they include all operating assets used by a segment and consist principally of operating cash, receivables, real estate inventories, property and equipment, and investment property, net of allowances and provisions. Similar to segment assets, segment liabilities are also allocated based on their use or direct association with a specific segment. Segment liabilities include all operating liabilities and consist principally of accounts, wages, taxes currently payable and accrued liabilities.

- 30 -
4.3 Intersegment Transactions
Segment revenues, expenses and performance include sales and purchases between business segments. Such sales and purchases are eliminated in consolidation.
4.4 Analysis of Segment Information
The following tables present revenue and profit information regarding industry segments for the years ended December 31, 2012, 2011 and 2010 and certain asset and liability information regarding segments at December 31, 2012, 2011 and 2010.
2012
Hotel Corporate Real Estate Rental Operations and Others Elimination Consolidated
TOTAL REVENUES
Sales to external customers P 21,507,772,488 P 4,994,769,197 P 462,313,446 P 886,134,955 P - P 27,850,990,086
Intersegment sales - 110,085,770 - 222,831,481 ( 332,917,251 ) -
Total revenues P 21,507,772,488 P 5,104,854,967 P 462,313,446 P 1,108,966,436 (P 332,917,251 ) P 27,850,990,086
RESULTS
Segment results P 3,936,964.620 P 3,848,300,987 P 122,321,275 P 4,097,830 P 17,601,370 P 7,929,286,082
Unallocated expenses ( 84,337,571 )
Interest income 1,840,964,871
Finance costs ( 887,476,458 )
Equity in net earnings of associates 794,347,508
Fair value gains – net 64,200,000
Dividend income 53,887,430
Foreign currency losses – net ( 52,961,596 )
Profit before tax 9,657,910,266
Tax expense ( 2,250,736,998 )
Net profit before non-controlling
interests 7,407,173,268
Non-controlling interests’ share in
net profit ( 113,102,786 )
Net profit attributable to
Company’s shareholders P 7,294,070,482
ASSETS AND LIABILITIES
Segment assets P104,426,551,477 P 16,424,538,688 P 259,410,181 P 13,831,502,038 P - P 134,942,002,384
Investments in and advances
to associates and other
related parties - net - - - 7,782,205,062 - 7,782,205,062
Total assets P 104,426,551,477 P 16,424,538,688 P 259,410,181 P 21,613,707,100 P - P 142,724,207,446
Segment liabilities P 52,847,673,565 P 2,203,461,213 P 121,671,842 P 6,161,807,255 P - P 61,334,613,875
OTHER SEGMENT INFORMATION
Project and capital expenditures P 24,001,473,831

- 31 -
2011 Hotel Corporate Real Estate Rental Operations and Others Elimination Consolidated
TOTAL REVENUES
Sales to external customers P 19,076,553,675 P 3,826,341,215 P 392,171,105 P 3,023,156,092 P - P 26,318,222,087
Intersegment sales - 53,969,793 - 166,500,934 ( 220,470,727 ) -
Total revenues P 19,076,553,675 P 3,880,311,008 P 392,171,105 P 3,189,657,026 (P 220,470,727 ) P 26,318,222,087
RESULTS
Segment results P 3,532,707,027 P 2,903,020,448 P 99,220,101 P 2,184,832,849 P 25,888,853 P 8,745,669,278
Unallocated expenses ( 65,821,843 )
Interest income 1,618,727,549
Finance costs ( 818,237,019 )
Equity in net earnings of associates 597,834,536
Foreign currency gains – net 65,503,537
Dividend income 32,661,662
Fair value gains (losses) – net ( 7,851,631 )
Profit before tax 10,168,486,069
Tax expense ( 1,995,469,148 )
Net profit before non-controlling
interests and preacquisition income 8,173,016,921
Preacquisition income of a subsidiary ( 17,326,952 )
Non-controlling interests’ share in
net profit ( 123,805,458 )
Net profit attributable to
Company’s shareholders P 8,031,884,511
ASSETS AND LIABILITIES
Segment assets P 93,027,684,187 P 13,098,763,945 P 261,591,040 P 15,861,523,363 P - P122,249,562,535
Investments in and advances
to associates and other
related parties - net - - - 6,745,964,129 - 6,745,964,129
Total assets P 93,027,684,187 P 13,098,763,945 P 261,591,040 P 22,607,487,492 P - P128,995,526,664
Segment liabilities P 46,802,707,496 P 1,853,118,305 P 111,753,205 P 7,455,842,379 P - P 56,223,421,385
OTHER SEGMENT INFORMATION Project and capital expenditures P 19,825,843,992

- 32 -
2010 Hotel Corporate Real Estate Rental Operations and Others Elimination Consolidated
TOTAL REVENUES
Sales to external customers P 15,399,973,187 P 2,694,310,554 P 232,757,023 P 808,477,515 P - P 19,135,518,279
Intersegment sales - 52,014,865 - 179,885,935 ( 231,900,800 ) -
Total revenues P 15,399,973,187 P 2,746,325,419 P 232,757,023 P 988,363,450 (P 231,900,800) P 19,135,518,279
RESULTS
Segment results P 3,042,478,040 P 2,062,875,628 P 38,125,649 P 635,421,436 P 25,888,854 P 5,804,789,634
Interest income 835,944,617
Finance costs ( 516,440,321 )
Equity in net earnings of associates 442,281,307
Fair value gains – net 83,500,000
Dividend income 40,630,134
Foreign currency gains – net 3,908,758
Profit before tax 6,694,614,129
Tax expense ( 1,609,101,525 )
Net profit before non-controlling
interests 5,085,512,604
Non-controlling interests’ share in
net profit ( 59,332,029 )
Net profit attributable to
Company’s shareholders P 5,026,180,575
ASSETS AND LIABILITIES
Segment assets P 63,241,644,678 P 5,919,037,407 P 178,376,810 P 14,019,131,426 P - P 83,358,190,321
Investments in and advances
to associates and other
related parties - net- - - - 13,671,332,490 - 13,671,332,490
Total assets P 63,241,644,678 P 5,919,037,407 P 178,376,810 P 27,690,463,916 P - P 97,029,522,811
Segment liabilities P 32,027,981,425 P1,530,032,850 P 78,854,006 P 4,873,517,893 P - P38,510,386,174
OTHER SEGMENT INFORMATION Project and capital expenditures P13,460,175,204

- 33 -
5. CASH AND CASH EQUIVALENTS
Cash and cash equivalents include the following components as of December 31:
2012 2011 Cash on hand and in banks P 1,807,234,630 P 2,049,865,776
Short-term placements 25,019,480,809 28,274,613,404
P 26,826,715,439 P 30,324,479,180 Cash in banks generally earn interest at rates based on daily bank deposit rates. Short-term placements are made for varying periods between 15 to 30 days and earn effective interest ranging from 3.66% to 4.13% in 2012 and 3.5% to 4.9% in 2011 (see Note 19).
6. TRADE AND OTHER RECEIVABLES
This account is composed of the following: 2012 2011 Current: Trade P 13,228,178,001 P 15,414,359,792 Allowance for impairment ( 18,364,972) ( 18,458,087 ) 13,209,813,029 15,395,901,705 Advances to contractors and suppliers 1,399,294,183 1,173,135,782 Others 736,593,641 609,413,603 15,345,700,853 17,178,451,090
Non-current: Trade 23,924,555,970 20,207,201,820 Allowance for impairment ( 12,224,936) ( 12,224,936 ) 23,912,331,034 20,194,976,884 Others 3,825,800 14,065,568 23,916,156,834 20,209,042,452 P 39,261,857,687 P 37,387,493,542
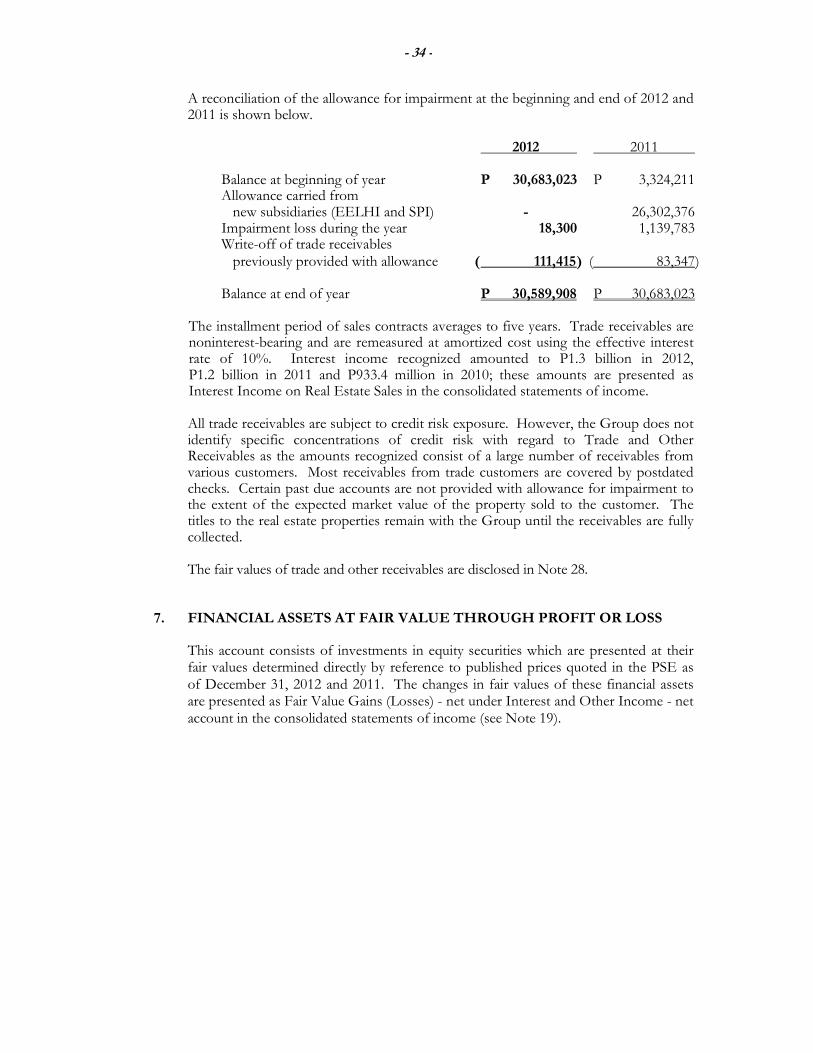
- 34 -
A reconciliation of the allowance for impairment at the beginning and end of 2012 and 2011 is shown below. 2012 2011 Balance at beginning of year P 30,683,023 P 3,324,211 Allowance carried from new subsidiaries (EELHI and SPI) - 26,302,376 Impairment loss during the year 18,300 1,139,783
Write-off of trade receivables previously provided with allowance ( 111,415 ) ( 83,347 ) Balance at end of year P 30,589,908 P 30,683,023 The installment period of sales contracts averages to five years. Trade receivables are noninterest-bearing and are remeasured at amortized cost using the effective interest rate of 10%. Interest income recognized amounted to P1.3 billion in 2012, P1.2 billion in 2011 and P933.4 million in 2010; these amounts are presented as Interest Income on Real Estate Sales in the consolidated statements of income.
All trade receivables are subject to credit risk exposure. However, the Group does not
identify specific concentrations of credit risk with regard to Trade and Other Receivables as the amounts recognized consist of a large number of receivables from various customers. Most receivables from trade customers are covered by postdated checks. Certain past due accounts are not provided with allowance for impairment to the extent of the expected market value of the property sold to the customer. The titles to the real estate properties remain with the Group until the receivables are fully collected.
The fair values of trade and other receivables are disclosed in Note 28.
7. FINANCIAL ASSETS AT FAIR VALUE THROUGH PROFIT OR LOSS This account consists of investments in equity securities which are presented at their fair values determined directly by reference to published prices quoted in the PSE as of December 31, 2012 and 2011. The changes in fair values of these financial assets are presented as Fair Value Gains (Losses) - net under Interest and Other Income - net account in the consolidated statements of income (see Note 19).
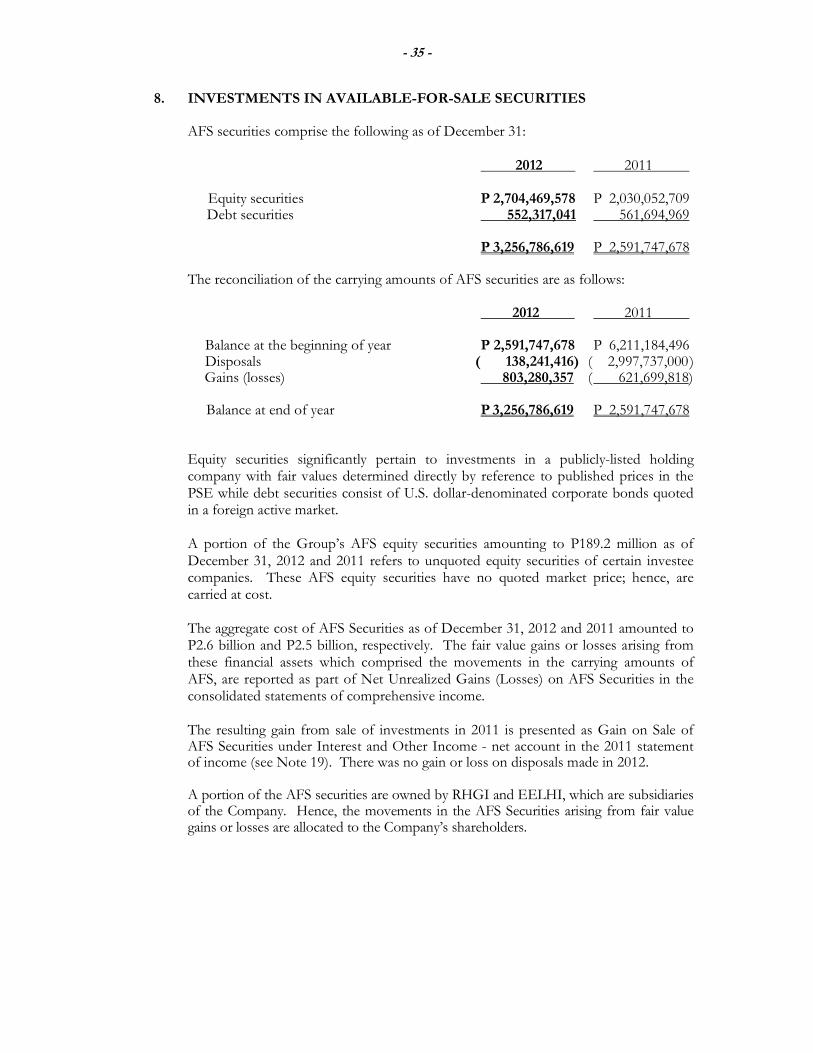
- 35 -
8. INVESTMENTS IN AVAILABLE-FOR-SALE SECURITIES
AFS securities comprise the following as of December 31:
2012 2011
Equity securities P 2,704,469,578 P 2,030,052,709 Debt securities 552,317,041 561,694,969 P 3,256,786,619 P 2,591,747,678
The reconciliation of the carrying amounts of AFS securities are as follows:
2012 2011
Balance at the beginning of year P 2,591,747,678 P 6,211,184,496 Disposals ( 138,241,416) ( 2,997,737,000 ) Gains (losses) 803,280,357 ( 621,699,818) Balance at end of year P 3,256,786,619 P 2,591,747,678
Equity securities significantly pertain to investments in a publicly-listed holding company with fair values determined directly by reference to published prices in the PSE while debt securities consist of U.S. dollar-denominated corporate bonds quoted in a foreign active market. A portion of the Group’s AFS equity securities amounting to P189.2 million as of December 31, 2012 and 2011 refers to unquoted equity securities of certain investee companies. These AFS equity securities have no quoted market price; hence, are carried at cost. The aggregate cost of AFS Securities as of December 31, 2012 and 2011 amounted to P2.6 billion and P2.5 billion, respectively. The fair value gains or losses arising from these financial assets which comprised the movements in the carrying amounts of AFS, are reported as part of Net Unrealized Gains (Losses) on AFS Securities in the consolidated statements of comprehensive income. The resulting gain from sale of investments in 2011 is presented as Gain on Sale of AFS Securities under Interest and Other Income - net account in the 2011 statement of income (see Note 19). There was no gain or loss on disposals made in 2012.
A portion of the AFS securities are owned by RHGI and EELHI, which are subsidiaries of the Company. Hence, the movements in the AFS Securities arising from fair value gains or losses are allocated to the Company’s shareholders.

- 36 -
9. ADVANCES TO LANDOWNERS AND JOINT VENTURES
The Group enters into numerous joint venture agreements for the joint development of various projects. These are treated as jointly controlled operations; there were no separate entities created under these joint venture agreements. The joint venture agreements stipulate that the Group’s joint venturer shall contribute parcels of land and the Group shall be responsible for the planning, conceptualization, design, demolition of existing improvements, construction, financing and marketing of residential and condominium units to be constructed on the properties. Costs incurred by the Group for these projects are recorded under the Property Development Costs account in the consolidated statements of financial position (see Note 2.6). The amounts of other related accounts are presented as part of the regular asset and liability accounts and income and expense accounts of the Group (see Note 2.3). The Group also grants noninterest-bearing, secured cash advances to a number of landowners and joint ventures under agreements they entered into with landowners covering the development of certain parcels of land. Under the terms of the agreements, the Group, in addition to providing specified portion of total project development costs, also commits to advance mutually agreed-upon amounts to the landowners to be used for pre-development expenses such as the relocation of existing occupants.
Repayment of these advances shall be made upon completion of the project development either in the form of the developed lots corresponding to the owner’s share in saleable lots or in the form of cash to be derived from the sales of the landowner’s share in the saleable lots and residential and condominium units. Total amount of advances made by the Group less repayments, is presented as part of the Advances to Landowners and Joint Ventures account in the consolidated statements of financial position.
The net commitment for cash advances under the joint venture agreements amounts to:
2012 2011
Total commitment for cash advances P - P 20,000,000 Total cash advances granted - ( 20,000,000) Net Commitment P - P -
The net commitment for construction expenditures amounts to:
2012 2011 Total commitment for construction expenditures P 9,580,606,292 P 7,973,154,005 Total expenditures incurred ( 6,797,658,256) ( 5,732,041,177 ) Net commitment P 2,782,948,036 P 2,241,112,828

- 37 -
The Group’s interests in jointly-controlled operations and projects range from 73% to 95% in 2012 and 2011. The listing and description of the Group’s jointly controlled projects are as follows: Company:
• McKinley Hills
• Newport City
• Manhattan Parkway Residences
• Greenbelt Excelsior
• Forbeswood Heights
• Forbeswood Parklane 1 & 2
• The Noble Place EELHI:
• Pioneer Woodlands • San Lorenzo Place • Various Metro Manila and Calabarzon projects SPI: • Adriatico Gardens • Capitol Plaza • Governor’s Hill • Mandara • Sta. Rosa Heights • Sta. Rosa Hills • Sentosa
The aggregate amounts of the current assets, long-term assets, current liabilities, long-term liabilities, income and expenses as of December 31, 2012 and 2011 and for each of the three years in the period ended December 31, 2012 related to the Group’s interests in joint ventures are not presented or disclosed as the joint ventures in which the Group is involved are not jointly-controlled entities (see Note 2.3). As of December 31, 2012 and 2011, the Group either has no other contingent liabilities with regard to these joint ventures or has assessed that the probability of loss that may arise from contingent liabilities is remote.

- 38 -
10. INVESTMENTS IN AND ADVANCES TO ASSOCIATES AND OTHER RELATED PARTIES
10.1 Breakdown of Carrying Values
The details of investments in and advances to associates and other related parties, are as follows:
% Interest Held
(see Note 1) 2012 2011 Investments in associates – at equity
Acquisition costs: SHDI 42.48% P 875,445,000 P 875,445,000 MGEI 40.00% 5,000,000 5,000,000 PTHDC 40.00% 64,665,000 64,665,000 AGPL 39.44% 2,463,056,417 2,463,056,417 GPMAI 37.23% 86,830,455 - TLC 19.00% 1,248,571,429 - TIHGI 10.00% 141,590,000 570,000,000
4,885,158,301 3,978,166,417 Accumulated equity in
net earnings: Balance at beginning of year 207,621,276 1,826,240,632 Equity share in net earnings for the year 794,347,508 597,834,536 Share in other comprehensive income (loss) 1,092,535 ( 147,365 ) Reversal resulting from the consolidation of EELHI and GPMAI - ( 2,216,306,527 ) Balance at end of year 1,003,061,319 207,621,276
Advances to associates and other related parties (see Note 23.3) 1,893,985,442 2,560,176,436
P 7,782,205,062 P6,745,964,129
In 2012, the Company acquired 19% ownership in TLC. TLC became an associate as the Company is able to exert significant influence over TLC’s operations through the 4 out of the 10 directors of TLC who are also members of the BOD of the Company. In 2012, TIHGI redeemed 428.41 million preferred shares held by the Company at a par value of P1 per share. There are no outstanding receivables as of December 31, 2012 arising from TIHGI’s redemption of preferred shares held by the Company. There was no change in the Group’s share of ownership in TIHGI as a result of the said redemption. Despite the 10% ownership, the Company considers TIHGI as an associate as it is able to exert significant influence over TIHGI through the two out of the five directors of TIHGI who are also members of the Company’s BOD.

- 39 -
In 2011, EELHI, SPI and GPMAI became subsidiaries of the Company (see Note 1). The increase in ownership in EELHI from 48.38% to 61.13% in 2011 resulted in the consolidation of the entity and increase in non-controlling interests and also in the presentation of the amount of preacquisition income in the consolidated statement of income. In 2011, the Company’s indirect ownership in GPMAI also increased to 46.45% through the Company’s increased ownership interest in EELHI, which has a 52% ownership in GPMAI. Consequently, GPMAI is also treated as a subsidiary of the Company in 2011. In 2012, however, GPMAI ceased to be a subsidiary of both EELHI and the Company (see Note 1). The shares of stock of SHDI are listed in the PSE. The total quoted or market value of investments in this associate amounted to P516.1 million and P498.0 million as of December 31, 2012 and 2011, respectively, compared to its carrying value of P123.7 million and P124.5 million, respectively. The related book values of the Group’s holdings in all other associates are in excess of their carrying values; hence, management deemed that the recognition of impairment loss is not necessary. The fair values of all other investments in associates are not available.
The balance of the Accumulated Equity in Net Earnings of P1.0 billion and P207.6 million as of December 31, 2012 and 2011, respectively, which is mainly lodged in the Group’s Retained Earnings as of those dates, is not available for dividend declaration.
10.2 Summarized Financial Information
The aggregated amounts of assets, liabilities and net profit (loss) of the associates are as follows:
Net Profit
Assets Liabilities Revenues (Loss)
2012:
SHDI P 153,559,159 P 45,232,263 P 1,318,257 (P 1,838,513 )
MGEI 12,275,979 50,582 392,240 192,136
PTHDC 1,136,626,722 1,004,828,741 71,301 ( 327,871 )
AGPL 6,380,453,088 6,848,129 431,546,120 404,975,974
GPMAI 632,627,552 12,044,026 - ( 93,998,746 )
TLC 5,525,542,334 1,394,926,449 13,734,389 ( 43,885,015 )
TIHGI 47,996,781,321 26,710,158,052 29,078,020,445 6,734,216,200
P 61,837,866,155 P 29,174,088,242 P 29,525,082,752 P 6,999,334,165
2011:
SHDI P 155,088,710 P 44,923,301 P 14,595,786 P 10,651,117
PTHDC 1,137,402,691 1,005,276,839 115,409 ( 157,289 )
MGEI 12,032,991 - 34,940 ( 467,014 )
AGPL 6,043,588,479 8,263,874 295,614,455 282,114,487
TIHGI 45,595,379,043 26,801,261,974 26,348,582,418 4,838,534,174
P 52,943,491,914 P 27,859,725,988 P 26,658,943,008 P 5,130,675,475

- 40 -
11. INVESTMENT PROPERTY
The gross carrying amounts and accumulated depreciation of investment property at the beginning and end of 2012 and 2011 are shown below.
Condominium
Land Buildings Units Total
December 31, 2012
Cost P 1,412,634,527 P 8,115,587,002 P 9,694,515,537 P 19,222,737,066
Accumulated depreciation - ( 1,518,791,093) ( 1,071,910,310 ) ( 2,590,701,403)
Net carrying amount P 1,412,634,527 P 6,596,795,909 P 8,622,605,227 P 16,632,035,663
December 31, 2011
Cost P 1,412,634,527 P 7,960,842,147 P 4,977,714,772 P 14,351,191,446
Accumulated depreciation - ( 1,191,162,815) ( 787,737,966 ) ( 1,978,900,781)
Net carrying amount P 1,412,634,527 P 6,769,679,332 P 4,189,976,806 P 12,372,290,665
January 1, 2011
Cost P 1,412,634,527 P 5,878,941,281 P 3,954,063,399 P 11,245,639,207
Accumulated depreciation - ( 930,323,176) ( 598,785,986 ) ( 1,529,109,162)
Net carrying amount P 1,412,634,527 P 4,948,618,105 P 3,355,277,413 P 9,716,530,045
A reconciliation of the carrying amounts at the beginning and end of 2012 and 2011 of investment property is shown below.
Condominium
Land Buildings Units Total
Balance at January 1, 2012, net of
accumulated depreciation P 1,412,634,527 P 6,769,679,332 P 4,189,976,806 P 12,372,290,665
Additions - 154,744,855 4,716,800,765 4,871,545,620
Depreciation charges for the year - ( 327,628,278) ( 284,172,344 ) ( 611,800,622 )
Balance at December 31, 2012,
net of accumulated depreciation P 1,412,634,527 P 6,596,795,909 P 8,622,605,227 P 16,632,035,663
Balance at January 1, 2011, net of
accumulated depreciation P 1,412,634,527 P 4,948,618,105 P 3,355,277,413 P 9,716,530,045
Additions - 1,831,474,260 1,042,662,947 2,874,137,207
Transfers - - ( 19,011,574 ) ( 19,011,574 )
Investment property of a
deconsolidated subsidiary - 250,426,606 - 250,426,606
Depreciation charges for the year - ( 260,839,639) ( 188,951,980 ) ( 449,791,619 )
Balance at December 31, 2011,
net of accumulated depreciation P 1,412,634,527 P 6,769,679,332 P 4,189,976,806 P 12,372,290,665
Investment property with carrying values of P0.9 billion and P2.2 billion as of December 31, 2012 and 2011, respectively, are used as collateral by the Group for its various loans obtained from local banks (see Note 14).

- 41 -
Rental income earned from these properties amount to P5.0 billion, P3.8 billion and P2.7 billion in 2012, 2011 and 2010, respectively, and is shown as Rental Income in the consolidated statements of income. The direct operating costs, exclusive of depreciation, incurred by the Group relating to these investment property amounted to P174.31 million in 2012, P135.08 million in 2011 and P91.4 million in 2010. The operating lease commitments of the Group as a lessor are fully disclosed in Note 26.1. The fair market values of these properties are P85.5 billion and P73.8 billion as of December 31, 2012 and 2011, respectively. These are determined by calculating the present value of the cash inflows anticipated until the end of the life of the investment property using a discount rate of 10% in 2012 and 2011.
12. PROPERTY AND EQUIPMENT
The gross carrying amounts and accumulated depreciation and amortization of property and equipment at the beginning and end of 2012 and 2011 are shown below.
Office Furniture, Office and Condominium Fixtures and Land Transportation Units Equipment Improvements Equipment Land Total
December 31, 2012
Cost P 786,366,715 P 364,319,866 P 161,106,262 P 133,312,797 P 81,095,000 P 1,526,200,640 Accumulated depreciation and amortization ( 522,192,653) ( 222,366,914 ) ( 97,063,452) ( 87,611,943) - ( 929,234,962 ) Net carrying amount P 264,174,062 P 141,952,952 P 64,042,810 P 45,700,854 P 81,095,000 P 596,965,678
December 31, 2011 Cost P 707,071,366 P 295,154,303 P 146,350,111 P 99,645,611 P 81,095,000 P 1,329,316,391 Accumulated depreciation and amortization ( 463,382,815 ) ( 180,626,286) ( 82,351,477 ) ( 62,096,083 ) - ( 788,456,661 ) Net carrying amount P 243,688,551 P 114,528,017 P 63,998,634 P 37,549,528 P 81,095,000 P 540,859,730
January 1, 2011
Cost P 629,423,370 P 208,009,574 P 125,515,520 P 73,056,949 P - P 1,036,005,413 Accumulated depreciation and amortization ( 419,607,035) ( 137,705,039) ( 68,848,502 ) ( 49,326,636 ) - ( 675,487,212 ) Net carrying amount P 209,816,335 P 70,304,535 P 56,667,018 P 23,730,313 P - P 360,518,201

- 42 -
A reconciliation of the carrying amounts at the beginning and end of 2012 and 2011 of property and equipment is shown below.
Office Furniture, Office and Condominium Fixtures and Land Transportation Units Equipment Improvements Equipment Land Total
Balance at January 1, 2012, net of accumulated depreciation and amortization P 243,688,551 P 114,528,017 P 63,998,634 P 37,549,528 P 81,095,000 P 540,859,730 Additions 79,295,349 69,142,747 14,784,675 38,715,624 - 201,938,395 Reclassification 28,524 ( 28,524) - Disposals - ( 5,708 ) ( 5,048,438 ) - ( 5,054,146 ) Depreciation and amortization charges for the year ( 58,809,838 ) ( 41,740,628) ( 14,711,975 ) ( 25,515,860 ) - ( 140,778,301 ) Balance at December 31, 2012, net of accumulated depreciation and amortization P 264,174,062 P 141,952,952 P 64,042,810 P 45,700,854 P 81,095,000 P 596,965,678 Balance at January 1, 2011, net of accumulated depreciation and amortization P 209,816,335 P 70,304,535 P 56,667,018 P 23,730,313 P - P 360,518,201 Additions 21,209,000 49,572,739 6,886,910 9,797,777 - 87,466,426 Disposals - ( 3,613,201) ( 3,026,364) ( 2,383,407 ) - ( 9,022,972 ) Property and equipment of newly-acquired subsidiaries 56,783,508 41,185,190 16,974,045 22,709,850 81,095,000 218,747,593 Depreciation and amortization charges for the year ( 44,120,292 ) ( 42,921,246) ( 13,502,975) ( 16,305,005 ) - ( 116,849,518 ) Balance at December 31, 2011, net of accumulated depreciation and amortization P 243,688,551 P 114,528,017 P 63,998,634 P 37,549,528 P 81,095,000 P 540,859,730
Depreciation and amortization is presented as part of operating expenses account (see Note 18). The Group’s fully depreciated assets that are still being used amounted to P354.0 million and P322.0 million as of December 31, 2012 and 2011, respectively. None of the Group’s Property and Equipment are used as collateral for its interest-bearing loans and borrowings.

- 43 -
13. OTHER NON-CURRENT ASSETS This account consists of:
2012 2011 Goodwill P 343,095,101 P 343,095,101 Guarantee and other deposits 295,356,231 251,854,749 Miscellaneous 19,521,266 14,097,984 P 657,972,598 P 609,047,834
Goodwill is subject to impairment testing at least annually. No impairment losses were recognized in 2012 and 2011. Guarantee deposits pertain mainly to payments made for compliance with construction requirements in relation to the Group’s real estate projects.
14. INTEREST-BEARING LOANS AND BORROWINGS
Interest-bearing Loans and Borrowings account represents the following loans of the Group as of December 31: 2012 2011 Current: Company P 1,203,380,952 P 1,203,380,952 EELHI 152,989,611 221,870,556 SPI 231,223,837 470,822,754 ECOC - 54,041,138 1,587,594,400 1,950,115,400 Non-current:
Company 3,667,833,333 4,871,214,286 SPI 1,005,842,266 702,883,979 EELHI 236,893,851 417,377,123 4,910,569,450 5,991,475,388 P 6,498,163,850 P 7,941,590,788

- 44 -
14.1 Company
In 2008, the Company signed a financing deal with a local bank under which the Company may avail of a P5.0 billion unsecured loan, divided into Tranche A (P3.5 billion) and Tranche B (P1.5 billion). The Company had availed of P4.5 billion out of the P5.0 billion facility in 2008 while the remaining P500.0 million was availed of in 2009. The proceeds of the loan were used to fund the development of the Group’s various real estate projects. The loan is payable in seven years with a grace period of two years, divided into 21 consecutive equal quarterly payments. Interest is payable every quarter based on the Philippine Dealing System Treasury Fixing rate (PDSTF-R) plus a certain spread. The outstanding balance pertaining to these loans amounted to P2.62 billion and P3.57 billion as of December 31, 2012 and 2011, respectively.
In February 2009, the Company issued unsecured corporate notes to several financial institutions in the aggregate principal amount of P1.4 billion which will mature in seven years from the issue date. The principal repayments on this loan commenced in February 2010 and interest is paid semi-annually based on a fixed 9.0% annual interest rate. The outstanding balance pertaining to this loan amounted to P1.35 billion and P1.37 billion as of December 31, 2012 and 2011, respectively.
Also, in May 2009, the Company obtained an unsecured long-term loan from a local bank amounting to P500.0 million. The loan is payable for a term of seven years and interest is payable semi-annually based on a floating six-month PDSTF-R plus a certain spread, subject to semi-annual reprising. The outstanding balance pertaining to this loan amounted to P482.5 million and P487.5 million as of December 31, 2012 and 2011, respectively. The remaining portion of the loans payable by the Company pertains to the balance of a long-term loan obtained in 2003 from a local bank with an original amount of P950.0 million which is payable in 10 years, inclusive of a three-year grace period on principal payments. Interest is payable every quarter based on 91-day treasury bill plus a certain spread. The Company also obtained an additional loan with original amount of P387 million in 2005 and P403.0 million in 2006 from the same local bank subject to the same terms and conditions. The outstanding balance pertaining to this loan amounted to P418.7 million and P650.7 million as of December 31, 2012 and 2011, respectively. Collateral for the loans consisted of a mortgage over certain investment property of the Company with carrying value of P43.5 million and P46.7 million as of December 31, 2012 and 2011, respectively (see Note 11).
14.2 EELHI
EELHI has outstanding secured and unsecured loans from local banks amounting to 389.9 million. The loans bear annual interest rates ranging from 7.8% to 9.5% in 2012 and 7.9% to 10.5% in 2011. Certain investment property with an estimated carrying value of P861.1 million and P1.6 billion as of December 31, 2012 and 2011, respectively, are used as collateral for these bank loans (see Note 11).

- 45 -
Bank loans of EELHI al so include amounts arising from trade receivables discounted on a with-recourse basis amounting to 332.7 million (see Note 6). Included also in the balance is the portion of a P400.0 million loan obtained in 2006. This loan bears annual interest of 10.5%. The principal amount is payable in seven equal annual amortization beginning March 15, 2007. Outstanding balances relating to these loans amounted to P389.9 million and P639.2 million as of December 31, 2012 and 2011, respectively.
14.3 SPI
In 2011, SPI availed of a short-term loan from a local bank amounting to P400.0 million with an annual interest rate of 5.5% payable upon maturity in 2012. The loan was fully settled in 2012. In 2012, the Company also availed of long-term loans from a local bank amounting to P330.0 million. These unsecured loans, which will mature in 2016, bear an annual interest of 5.5%.
SPI partially manages its cash flows for use in operations through discounting its trade receivables on a with-recourse basis with certain local banks. The outstanding loans to the banks arising from receivables assigned as of 31, 2012 and 2011 amounted to P907.1 million and P773.7 million, respectively, and is shown as part of Interest-bearing Loans and Borrowings account in the statements of financial position. 14.4 ECOC
The amount payable by ECOC pertains to the balance of a long-term loan facility obtained in 2002 with an original amount of U.S.$25 million (approximately P1.3 billion) from a foreign financial institution. The proceeds of the loan were used in the construction of several information technology buildings at the Eastwood CyberPark which is operated by ECOC. The drawdown from the loan facility amounting to U.S.$20 million (P1.0 billion) was made on October 15, 2002. The loan was payable in 10 years, inclusive of a two-and-a-half year grace period on principal payment. Interest was payable every six months at London Inter-bank Offer Rate plus certain spread. Collaterals for the loan consisted of a mortgage over ECOC’s certain Investment Property amounting to P553.1 million, and a full guarantee from the Company. The said loan was fully settled in 2012 and the related mortgage was released.
Finance costs arising from the above loans and borrowings that are directly attributable to construction of the Group’s projects are capitalized as part of Residential and Condominium Units for Sale and Property Development Costs. The remaining interest costs are expensed outright. Total finance costs attributable to all the loans of the Group amounted to P509.18 million and P596.8 million in 2012 and 2011, respectively. Of these amounts, portion expensed is presented as part of Finance Costs under Interest and Other Charges - net in the consolidated statements of income (see Note 20). Interest capitalized in 2012 and 2011 amounted to P183.0 million and P355.6 million, respectively. Capitalization rate used in determining the amount of interest charges qualified for capitalization is 6.73% in 2012 and 8.29% in 2011.

- 46 -
15. BONDS PAYABLE
On April 15, 2011, the Group issued seven-year term bonds totaling U.S.$200 million. The bonds bear interest at 6.75% per annum payable semi-annually in arrears every April 15 and October 15 each year starting October 15, 2011. The bonds will mature on April 15, 2018. Also, on November 18, 2009, the Group issued P5.0 billion fixed rate unsecured bonds with a term of five years and six months which bear an interest of 8.46% per annum. The bonds were issued at par and will be redeemed at 100% of the face value on maturity date. The proceeds received are being used by the Group to finance its capital expenditures from 2009 up to 2013 mainly for the development of its real estate projects. On August 4, 2006, the Group issued five-year term bonds totaling U.S.$100 million at a discount of U.S.$1.5 million. The bonds bear interest at 7.875% per annum payable semi-annually in arrears every February 4 and August 4 of each year, starting on February 4, 2007. The bond matured and was fully settled in August 2011. Total interest incurred on these bonds amounted to P984.3 million in 2012 and P1.0 billion in 2011, of which portions capitalized amounted to P423 million in 2012 and 2011. The remaining amounts are expensed and presented as part of Finance Costs under Interest and Other Charges in the consolidated statement of income (see Note 20). Capitalization rate used in determining the amount of interest charges qualified for capitalization is 8.46% both in 2012 and 2011.
16. TRADE AND OTHER PAYABLES
This account consists of:
2012 2011 Trade payables P 5,081,234,403 P 5,241,397,638 Retention payable 2,084,707,464 1,349,444,587 Accrued interest 292,296,901 303,706,055 Accrued construction cost 72,057,733 64,837,800 Miscellaneous 369,720,811 337,580,414
P 7,900,017,312 P 7,296,966,494
Trade payables mainly represent obligations to subcontractors and suppliers of construction materials for the Group’s projects. Retention payable pertains to amount withheld from payments made to contractors to ensure compliance and completion of contracted projects equivalent to 10% of every billing made by the contractor. Upon completion of the contracted projects, the amounts are returned to the contractors. Miscellaneous payable consist primarily of withholding taxes payable and accrual of salaries and wages and utilities.

- 47 -
17. OTHER LIABILITIES
This account consists of: 2012 2011
Current: Unearned revenues P 1,463,820,018 P 1,601,422,726 Deferred rental income 246,307,507 27,698,235 Other payables 2,667,317 78,553,002 1,712,794,842 1,707,673,963 Non-current - Deferred rental income 2,058,307,552 1,943,654,006 P 3,771,102,394 P3,651,327,969
18. OPERATING EXPENSES
Presented below are the details of this account. Notes 2012 2011 2010
Salaries and employee
benefits 21 P 940,407,850 P 775,558,589 P P437,045,219
Commission 940,106,924 934,748,085 467,977,819
Depreciation and
amortization 11, 12 752,578,923 566,641,137 443,203,639
Advertising and
promotions 643,939,022 572,052,650 189,619,585
Utilities and supplies 338,239,281 215,840,286 141,065,957
Rent 264,382,431 163,714,850 60,263,992
Professional fees and
outside services 225,648,686 176,664,004 68,426,284
Transportation 223,735,372 142,590,321 103,626,296
Taxes and licenses 172,504,165 196,304,569 110,188,073
Association dues 188,226,417 103,023,327 51,261,055
Miscellaneous 244,424,584 269,087,243 67,547,715
P 4,934,193,655 P 4,116,225,061 P 2,140,225,634

- 48 -
19. INTEREST AND OTHER INCOME Presented below are the details of this account.
2012 2011 2010
Interest income from cash
and cash equivalents
and others P 1,840,964,871 P 1,618,727,549 P 835,944,617
Construction income 130,162,337 138,492,457 101,962,175
Commission income 112,417,366 73,432,592 352,578
Fair value gains (losses) – net 64,200,000 ( 7,851,631) 83,500,000
Dividend income 53,887,430 32,661,662 40,630,134
Foreign currency
gains (losses) – net ( 52,961,596 ) 65,503,537 3,908,758
Gain on sale of
AFS securities - 2,242,526,309 646,720,788
Miscellaneous – net 643,555,234 568,704,735 59,441,974
P 2,792,225,642 P 4,732,197,210 P 1,772,461,024
Miscellaneous income refers to forfeited deposits, collections, marketing fees and others.
20. INTEREST AND OTHER CHARGES
Presented below are the details of this account.
2012 2011 2010
Finance costs P 887,476,458 P 818,237,019 P 516,440,321
Loss on write-off and impairment
of property development cost 61,518,212 - -
Miscellaneous – net 95,396,369 85,289,416 27,960,793
P 1,044,391,039 P 903,526,435 P 544,401,114
Finance costs mainly pertain to interest incurred from the bonds payable and interest-bearing loans and borrowings (see Notes 14 and 15).
Miscellaneous pertains to amortization of discounts on security deposits, bank charges
and other related fees.

- 49 -
21. EMPLOYEE BENEFITS
21.1 Salaries and Employee Benefits Expenses recognized for salaries and employee benefits are presented below (see Note 18).
2012 2011 2010
Short-term benefits P 819,561,121 P 697,892,237 P 399,773,554
Post-employment benefits 120,846,729 77,666,352 37,271,665
P 940,407,850 P 775,558,589 P 437,045,219
21.2 Employee Stock Option Plan
On November 27, 2012 and December 21, 2012, the Company granted stock options to qualified employees of the Group, giving them the right to subscribe to a total of 190 million and 55 million common shares of the Company at the exercise price of P1.77 and P1.89 per share, respectively. The employee stock options shall generally vest on the 60th birthday of the option holder and may be exercised until the date of his or her retirement from the Group. Based on management assessment, the amount of employee benefits relative to the stock option is not significant to the consolidated financial statements in 2012; hence, the Group will accrue for such granted employee benefits starting 2013 and throughout the vesting period of the stock options granted.
21.3 Post-employment Benefit
The Group maintains a funded, tax-qualified, non-contributory retirement plan that is
being administered by a trustee covering all regular full-time employees. Actuarial valuations are made annually to update the retirement benefit costs and the amount of contributions.
The amounts of retirement benefit obligation, presented as non-current liability in the
consolidated statements of financial position, are determined as follows:
2012 2011 Present value of the obligation P 716,070,125 P 557,555,467 Fair value of plan assets ( 89,869,629) ( 76,027,689) Deficiency of plan assets 626,200,496 481,527,778 Unrecognized past service costs ( 14,971,655 ) ( 3,656,813) Unrecognized actuarial losses ( 221,026,885) ( 192,449,225) P 390,201,956 P 285,421,740
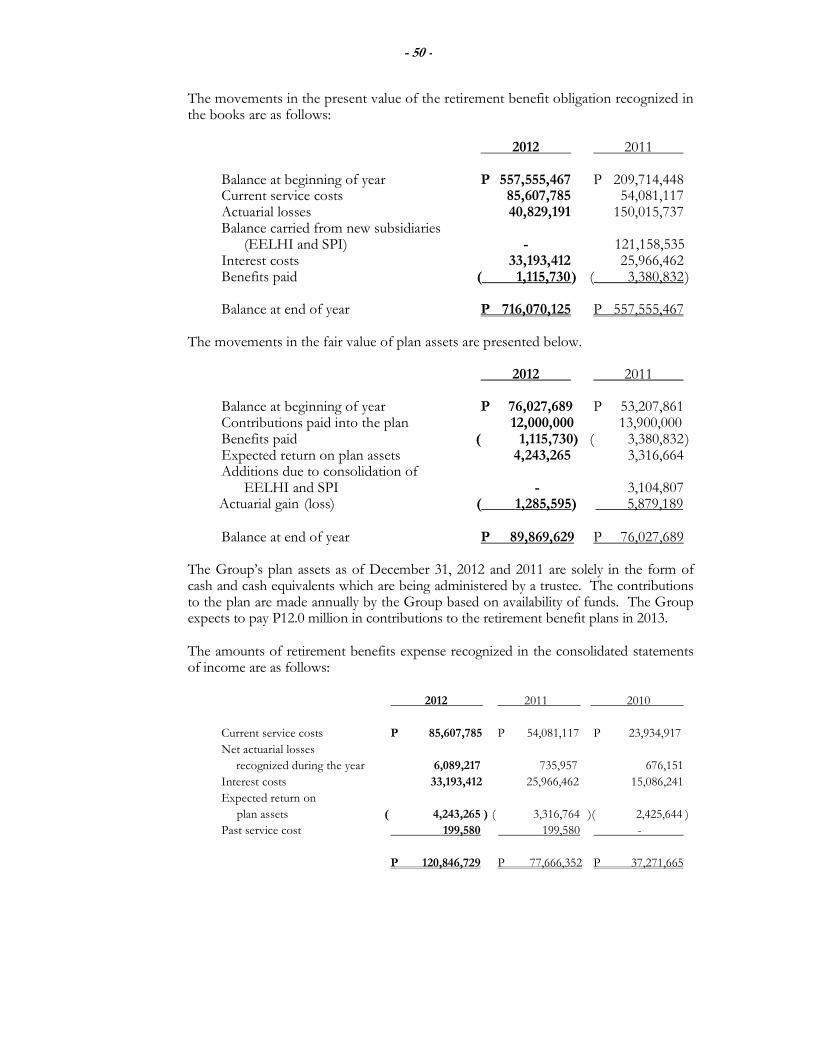
- 50 -
The movements in the present value of the retirement benefit obligation recognized in the books are as follows:
2012 2011 Balance at beginning of year P 557,555,467 P 209,714,448 Current service costs 85,607,785 54,081,117 Actuarial losses 40,829,191 150,015,737 Balance carried from new subsidiaries (EELHI and SPI) - 121,158,535 Interest costs 33,193,412 25,966,462 Benefits paid ( 1,115,730 ) ( 3,380,832 ) Balance at end of year P 716,070,125 P 557,555,467
The movements in the fair value of plan assets are presented below. 2012 2011 Balance at beginning of year P 76,027,689 P 53,207,861 Contributions paid into the plan 12,000,000 13,900,000 Benefits paid ( 1,115,730) ( 3,380,832 ) Expected return on plan assets 4,243,265 3,316,664 Additions due to consolidation of EELHI and SPI - 3,104,807
Actuarial gain (loss) ( 1,285,595) 5,879,189 Balance at end of year P 89,869,629 P 76,027,689 The Group’s plan assets as of December 31, 2012 and 2011 are solely in the form of cash and cash equivalents which are being administered by a trustee. The contributions to the plan are made annually by the Group based on availability of funds. The Group expects to pay P12.0 million in contributions to the retirement benefit plans in 2013.
The amounts of retirement benefits expense recognized in the consolidated statements of income are as follows:
2012 2011 2010
Current service costs P 85,607,785 P 54,081,117 P 23,934,917
Net actuarial losses
recognized during the year 6,089,217 735,957 676,151
Interest costs 33,193,412 25,966,462 15,086,241
Expected return on
plan assets ( 4,243,265 ) ( 3,316,764 )( 2,425,644 )
Past service cost 199,580 199,580 -
P 120,846,729 P 77,666,352 P 37,271,665

- 51 -
Presented below are the historical information related to the present value of the retirement benefit obligation, fair value of plan assets and deficiency of plan assets.
2012 2011 2010 2009 2008
Present value of the obligation P 716,070,125 P 557,555,467 P 209,714,448 P 163,802,833 P 91,871,990 Fair value of plan assets ( 89,869,629) ( 76,027,689 ) ( 53,207,861) ( 40,427,396 ) ( 26,200,243 ) Deficiency of plan assets P 626,200,496 P481,527,778 P 156,506,587 P 123,375,437 P 65,671,747
In determining the amount of retirement benefit obligation, the following actuarial assumptions were used: 2012 2011 Discount rates 5.6 % 8.0% Expected rate of return on plan assets 8.0 % 6.0% Expected rate of salary increases 10.0 % 10.0% Assumptions regarding future mortality are based on published statistics and mortality tables. The average life expectancy of an individual retiring at the age of 65 is 29 for both males and females.
22. TAXES
The components of tax expense as reported in the consolidated statements of income and consolidated statements of comprehensive income are as follows:
2012 2011 2010
Reported in consolidated statements of income:
Current tax expense:
Regular corporate income tax
(RCIT) at 30% P 1,341,243,457 P 1,054,538,463 P 813,802,554
Final tax at 20% and 7.5% 171,404,904 181,904,031 111,933,084
Minimum corporate income tax
(MCIT) at 2% 318,062 1,029,759 425,765
Special tax rate at 5% - 18,802,816 19,479,041
1,512,966,423 1,256,275,069 945,640,444
Deferred tax expense relating to
origination and reversal of
temporary differences 737,770,575 739,194,079 663,461,081
P 2,250,736,998 P 1,995,469,148 P1,609,101,525
Reported in consolidated statements of
comprehensive income –
Deferred tax income
relating to origination and reversal
of temporary differences (P 70,795,068)( P 3,842,636) ( P 55,967,408)

- 52 -
A reconciliation of tax on pretax profit computed at the applicable statutory rates to income tax expense reported in the consolidated statements of income is as follows:
2012 2011 2010
Tax on pretax profit at 30% P 2,897,373,080 P 3,045,347,735 P 2,008,384,239
Adjustment for income subjected to
lower income tax rates ( 528,127,818 ) ( 310,945,790 ) ( 152,228,235 )
Tax effects of:
Non-taxable income ( 526,514,475 ) ( 1,215,511,134 ) ( 462,560,168 )
Non-deductible expenses 386,505,896 461,886,444 214,450,368
Non-deductible interest expense 18,208,891 5,576,527 49,245,102
Excess of optional standard deduction
over itemized deductions ( 11,665,340 ) ( 4,906,889 ) ( 5,784,318 )
Unrecognized deferred tax assets 6,666,883 2,789,101 10,225,726
Net operating loss carry over (NOLCO) 5,058,368 10,266,270 1,000,962
Dividend income ( 11,445 ) ( 1,858,980 ) ( 52,444,145 )
Miscellaneous 3,242,958 2,825,864 ( 1,188,006 )
Tax expense P 2,250,736,998 P 1,995,469,148 P 1,609,101,525
The deferred tax assets and liabilities relate to the following as of December 31:
2012 2011 Deferred tax assets: Accrued rental expense P 15,703,397 P 35,829 Allowance for impairment of receivables 9,176,972 - Retirement benefit obligation 7,591,689 3,818,787 MCIT 651,213 - NOLCO - 2,881,547 Others 9,136,351 597,416 P 42,259,622 P 7,333,579 Deferred tax liabilities: Uncollected gross profit P 4,745,139,010 P4,184,468,051 Capitalized interest 967,478,399 785,595,394 Difference between the tax reporting base and financial reporting base of: - Investment property 219,416,534 163,048,030 - Property and equipment ( 19,249,915) ( 19,520,145 ) Uncollected rental income 126,978,198 76,840,485 Accrued retirement cost ( 116,694,851) ( 55,361,532) Translation adjustments ( 102,276,919) ( 31,481,851) Bond issuance cost 20,754,688 23,908,448 Others ( 26,748,067) ( 14,601,353) P5,814,797,077 P 5,112,895,527

- 53 -
The components of deferred tax expense (income) are as follows: Consolidated Consolidated Statements Statements of Income of Comprehensive Income 2012 2011 2010 2012 2011 2010 Changes in deferred tax assets: Accrued rent expense (P 15,667,568 ) P 32,588 P 149,927 P - P - P - Allowance for impairment of receivables ( 9,176,972 ) - - - - - Retirement benefit obligation ( 3,772,902 ) ( 632,228) ( 601,240 ) - - - NOLCO 2,881,547 1,260,059 793,817 - - - MCIT ( 651,213 ) - - - - - Others ( 8,538,935 ) ( 133,459) ( 315,330 ) - - - Changes in deferred tax liabilities: Uncollected gross profit 560,670,959 1,487,033,750 402,504,512 - - - Capitalized interest 181,883,005 341,878,304 221,065,942 - - - Accrued retirement cost ( 61,333,319 ) ( 12,059,776) ( 10,131,499) - - -
Difference between tax reporting base and financial reporting base of: - Investment property 56,368,504 ( 38,648,833) 52,892,299 - - - - Property and equipment 270,230 270,771 259,714 - - - Uncollected rental income 50,137,713 76,840,485 - - - -
Bond issuance cost ( 3,153, 760 ) 23,908,448 - - - - Translation adjustments - - - ( 70,795,068 ) ( 3,842,636 ) ( 55,967,408 ) Others ( 12,146,714 ) ( 11,171,036) ( 3,157,061 ) - - - 737,770,575 1,868,579,073 663,461,081 ( 70,795,068 ) ( 3,842,636 ) ( 55,967,408 ) Effect of consolidation of EELHI, SPI and GPMAI - ( 1,129,384,994) - - - - Deferred Tax Expense (Income) P 737,770,575 P 739,194,079 P 663,461,081 ( P 70,795,068 ) (P 3,842,636 ) ( P55,967,408 )
No deferred tax liability has been recognized on the accumulated equity in net earnings of associates. The Group has no liability for tax should the amounts be declared as dividends since dividend income received from domestic corporation is not subject to income tax.
Majority of the entities within the Group are subject to the MCIT which is computed at 2% of gross income, as defined under the tax regulations. The details of MCIT paid by certain subsidiaries, which can be applied as deduction from their respective future RCIT payable within three years from the year the MCIT was incurred, are shown below. Valid Subsidiary Year incurred Amount Until
SPI 2011 P 10,025,324 2014 2010 7,679,761 2013
MNPHI 2011 187,256 2014 2010 233,530 2013 MREI 2012 5,019 2015 2011 9,286 2014 2010 9,898 2013 MLI 2012 312,872 2015 2011 308,076 2014 2010 37,824 2013 FTPHI 2011 4,556 2014 2010 7,052 2013
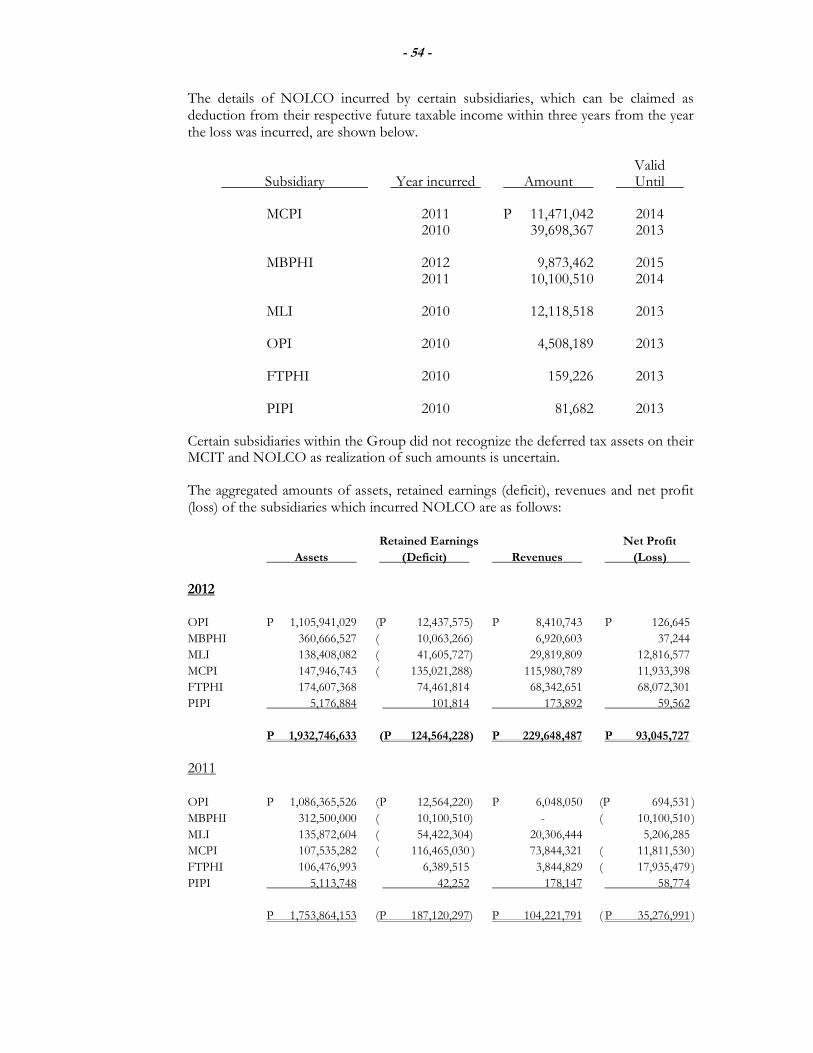
- 54 -
The details of NOLCO incurred by certain subsidiaries, which can be claimed as deduction from their respective future taxable income within three years from the year the loss was incurred, are shown below. Valid Subsidiary Year incurred Amount Until MCPI 2011 P 11,471,042 2014 2010 39,698,367 2013 MBPHI 2012 9,873,462 2015 2011 10,100,510 2014 MLI 2010 12,118,518 2013 OPI 2010 4,508,189 2013
FTPHI 2010 159,226 2013 PIPI 2010 81,682 2013 Certain subsidiaries within the Group did not recognize the deferred tax assets on their MCIT and NOLCO as realization of such amounts is uncertain.
The aggregated amounts of assets, retained earnings (deficit), revenues and net profit (loss) of the subsidiaries which incurred NOLCO are as follows:
Retained Earnings Net Profit
Assets (Deficit) Revenues (Loss)
2012
OPI P 1,105,941,029 (P 12,437,575) P 8,410,743 P 126,645
MBPHI 360,666,527 ( 10,063,266) 6,920,603 37,244
MLI 138,408,082 ( 41,605,727) 29,819,809 12,816,577
MCPI 147,946,743 ( 135,021,288) 115,980,789 11,933,398
FTPHI 174,607,368 74,461,814 68,342,651 68,072,301
PIPI 5,176,884 101,814 173,892 59,562
P 1,932,746,633 (P 124,564,228) P 229,648,487 P 93,045,727
2011
OPI P 1,086,365,526 ( P 12,564,220) P 6,048,050 (P 694,531 )
MBPHI 312,500,000 ( 10,100,510) - ( 10,100,510 )
MLI 135,872,604 ( 54,422,304) 20,306,444 5,206,285
MCPI 107,535,282 ( 116,465,030 ) 73,844,321 ( 11,811,530 )
FTPHI 106,476,993 6,389,515 3,844,829 ( 17,935,479 )
PIPI 5,113,748 42,252 178,147 58,774
P 1,753,864,153 ( P 187,120,297) P 104,221,791 ( P 35,276,991 )

- 55 -
Except for certain subsidiaries, management has assessed that the net losses incurred, as well as the related NOLCO, can be recovered through future operations and are not significant to the overall financial condition and financial performance of the Group.
In 2012, 2011 and 2010, the Group opted to continue claiming itemized deductions,
except for MDC which opted to use OSD in those years.
ECOC, as the developer and operator of Eastwood City Cyberpark, is registered with PEZA pursuant to Presidential Proclamation No. 191, dated October 6, 1999. As a PEZA-registered entity, ECOC is entitled to a preferential tax rate of 5% on gross income earned from registered activities, in lieu of all local and national taxes, and to other tax privileges. In November 2011, the Board of Investments approved SPI’s application for registration on a certain project. SPI shall be entitled to income tax holiday for three years from November 2011 or actual start of commercial operations/selling, whichever is earlier but in no case earlier than the date of registration, with certain terms.
23. RELATED PARTY TRANSACTIONS
The Group’s related parties include the parent company, associates, the Group’s key management and other related parties under common ownership as described below. Transactions with related parties are also discussed below.
The summary of the Group’s transactions with its related parties as of and for the years ended December 31, 2012 and 2011 are as follows:
2012 2011 Related Party Amount of Outstanding Amount of Outstanding Category Notes Transaction Balance Transaction Balance Parent Company: Exercise of stock rights 24.2 P2,585,362,642 P - P - P - Investment in equity securities: FVTPL 7 - 167,600,000 - 103,400,000 AFS 8 - 2,515,228,241 - 1,840,811,372 Dividend income 19 53,549,026 - 26,463,662 - Dividends paid 24.4 ( 299,741,330) - ( 201,996,002 ) - Associates:
Sale of land 23.1 2,100,814,973 1,168,739,781 1,605,212,930 561,843,281 Rendering of services 23.1 28,655,442 1,991,972 21,290,221 21,321,394 Granting (collection)
of advances 23.3 37,288,275 1,060,440,574 ( 376,384,848 ) 1,023,152,299 Obtaining (payment) of advances 23.4 47,509,568 50,559,415 ( 218,972,857 ) 3,049,847
Related Parties Under Common Ownership: Obtaining of services 23.2 141,474,682 96,390,635 109,239,723 89,006,474 Lease of property 21,283,194 1,123,111 14,085,487 1,173,045
Granting (collection) of advances 23.3 ( 703,479,269) 833,544,868 889,590,452 1,537,024,137
Obtaining of advances 23.4 434,852,539 642,045,135 139,347,043 207,192,596

- 56 -
The Group’s outstanding receivables from and payables to related parties arising from the above transactions are unsecured and noninterest-bearing.
None of the companies under the Group is a joint venture. The Company is not subject to joint control and none of its related parties exercise significant influence over it.
23.1 Sale of Land and Rendering of Services to Related Parties
Amount of Transactions
2012 2011 2010
Associates P 2,129,470,415 P 1,626,503,151 P 5,289,782
Other related parties
under common ownership 21,283,194 14,085,487 13,659,040
P 2,150,753,609 P 1,640,588,638 P 18,948,822
Sale of Land and Rendering of Services to Related Parties are usually on a cost-plus basis, allowing a certain margin agreed upon by the parties.
In 2012, the Company sold to an associate parcels of land with a total contract price of P2.2 billion collectible in installments. Outstanding balance related to these transactions amounted to P1.0 billion as of December 31, 2012. In 2010, the same associate entered into a Management Agreement with the Company, who will provide management services for the overall administration of the associate’s leasing operations for a fee, which is based on certain rates of collection plus commission. Total payments received from the associate amount to P42.0 million in 2012 and P17.2 million in 2011.
There were no impairment losses recognized on the trade and other receivables resulting from the above transactions.
23.2 Obtaining Services from Related Parties
Amount of Transactions Outstanding Balances
2012 2011 2010 2012 2011 2010 Other related parties under common ownership P 141,474,682 P 109,239,723 P126,454,782 P 96,390,635 P 89,006,474 P 84,088,445
Services obtained are usually on a cost-plus basis, allowing a margin ranging from 10% to 20%. There are no outstanding payables for services obtained from the associates as of December 31, 2012 and 2011. The outstanding balances of payable to other related parties under common ownership pertain to unpaid commissions presented as part of Advances from Other Related Parties in the consolidated statements of financial position (see Note 23.4).

- 57 -
23.3 Advances to Associates and Other Related Parties
Associates and other related parties under common ownership are granted noninterest-bearing, unsecured advances by the Company and other entities in the Group with no repayment terms for working capital purposes. The outstanding balances of Advances to Associates and Other Related Parties shown as part of Investments in and Advances to Associates and Other Related Parties in consolidated statements of financial position (see Note 10) are as follows:
2012 2011 Advances to associates: PTHDC P 1,004,534,615 P 1,004,987,335 TLC 37,415,119 - SHDI 18,490,840 18,164,964 1,060,440,574 1,023,152,299
Advances to other related parties: Asia’s Finest Cuisine, Inc. 117,080,720 111,946,376 Citylink Coach Services, Inc. 26,285,973 26,013,600 Global-Estate Resorts Inc. 6,449,325 28,693,918 Twin Lakes Corporation - 373,331,075 Other related parties under common ownership 683,728,850 997,039,168
833,544,868 1,537,024,137 P 1,893,985,442 P 2,560,176,436
The movements in advances to associates and other related parties are as follows: 2012 2011 Balance at beginning of year P2,560,176,436 P 2,046,990,832 Additions 26,969,408 1,087,794,342 Repayments ( 693,160,402 ) ( 574,608,738 ) Balance at end of year P1,893,985,442 P 2,560,176,436
Advances to other related parties pertain to advances granted to entities under common ownership of the parent company. No impairment losses on the advances to associates and other related parties were recognized in 2012 and 2011.

- 58 -
23.4 Advances from Associates and Other Related Parties Certain expenses of the entities within the Group are paid by other related parties on behalf of the former. The advances are non-interest bearing, unsecured and with no repayment terms. The outstanding balances from these transactions are presented as Advances from Other Related Parties account in the consolidated statements of financial position and are broken down as follows: 2012 2011 TIHGI P 50,559,415 P 3,049,847 Other related parties under common ownership 642,045,135 207,192,596 P 692,604,550 P 210,242,443
The movements in advances from other related parties are as follows: 2012 2011 Balance at beginning of year P 210,242,443 P 289,868,257 Additions 482,362,107 139,347,043 Repayments - ( 218,972,857 ) Balance at end of year P 692,604,550 P 210,242,443
23.5 Key Management Personnel Compensations The Group’s key management personnel compensation includes the following:
2012 2011 2010
Short-term benefits P 93,436,092 P 78,370,241 P 47,174,219
Post-employment benefits 14,893,828 9,974,137 4,962,292
P 108,329,920 P 88,344,378 P 52,136,511
24. EQUITY
Capital stock consists of: Shares Amount
2012 2011 2010 2012 2011 2010
Preferred shares Series A
– P0.01 par value
Authorized 6,000,000,000 6,000,000,000 6,000,000,000 P 60,000,000 P 60,000,000 P 60,000,000
Issued and outstanding 6,000,000,000 6,000,000,000 6,000,000,000 P 60,000,000 P 60,000,000 P 60,000,000
Common shares – P1 par value
Authorized 30,140,000,000 30,140,000,000 30,140,000,000 P 30,140,000,000 P 30,140,000,000 P 30,140,000,000
Issued and outstanding:
Balance at beginning of year 25,769,203,626 25,769,203,626 25,769,203,626 P 25,769,203,626 P 25,769,203,626 P 25,769,203,626
Issued during the year 3,109,659,359 - - 3,109,659,359 -
Balance at end of year 28,878,862,985 25,769,203,626 25,769,203,626 P 28,878,862,985 P 25,769,203,626 P 25,769,203,626
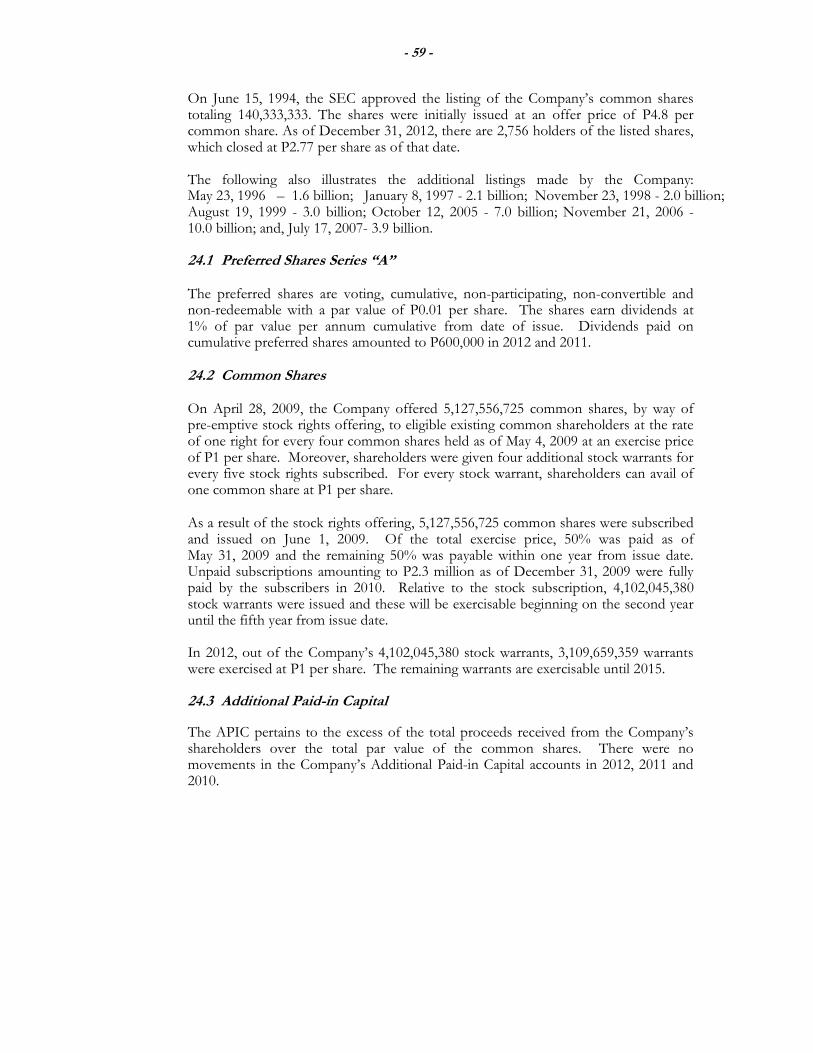
- 59 -
On June 15, 1994, the SEC approved the listing of the Company’s common shares totaling 140,333,333. The shares were initially issued at an offer price of P4.8 per common share. As of December 31, 2012, there are 2,756 holders of the listed shares, which closed at P2.77 per share as of that date. The following also illustrates the additional listings made by the Company: May 23, 1996 – 1.6 billion; January 8, 1997 - 2.1 billion; November 23, 1998 - 2.0 billion; August 19, 1999 - 3.0 billion; October 12, 2005 - 7.0 billion; November 21, 2006 - 10.0 billion; and, July 17, 2007- 3.9 billion. 24.1 Preferred Shares Series “A”
The preferred shares are voting, cumulative, non-participating, non-convertible and non-redeemable with a par value of P0.01 per share. The shares earn dividends at 1% of par value per annum cumulative from date of issue. Dividends paid on cumulative preferred shares amounted to P600,000 in 2012 and 2011.
24.2 Common Shares On April 28, 2009, the Company offered 5,127,556,725 common shares, by way of pre-emptive stock rights offering, to eligible existing common shareholders at the rate of one right for every four common shares held as of May 4, 2009 at an exercise price of P1 per share. Moreover, shareholders were given four additional stock warrants for every five stock rights subscribed. For every stock warrant, shareholders can avail of one common share at P1 per share.
As a result of the stock rights offering, 5,127,556,725 common shares were subscribed and issued on June 1, 2009. Of the total exercise price, 50% was paid as of May 31, 2009 and the remaining 50% was payable within one year from issue date. Unpaid subscriptions amounting to P2.3 million as of December 31, 2009 were fully paid by the subscribers in 2010. Relative to the stock subscription, 4,102,045,380 stock warrants were issued and these will be exercisable beginning on the second year until the fifth year from issue date. In 2012, out of the Company’s 4,102,045,380 stock warrants, 3,109,659,359 warrants were exercised at P1 per share. The remaining warrants are exercisable until 2015. 24.3 Additional Paid-in Capital
The APIC pertains to the excess of the total proceeds received from the Company’s shareholders over the total par value of the common shares. There were no movements in the Company’s Additional Paid-in Capital accounts in 2012, 2011 and 2010.

- 60 -
24.4 Cash Dividends
The details of the Company’s cash dividend declarations, both for preferred and common shares, are as follows:
2012 2011 2010
Declaration date / date
of approval by BOD June 14,2012 June 16, 2011 May 18, 2010
Date of record June 29,2012 July 6, 2011 July 6, 2010
Date paid July 25,2012 July 29, 2011 July 30, 2010
Amounts declared and paid P 839,193,763 P 599,265,803 P 519,885,465
24.5 Treasury Shares
In 2008, the Company’s BOD approved the buy-back of shares of up to P2.0 billion worth of common shares in the open market at prevailing market prices. The share buy-back program is made through the trading facilities of the PSE and the funds used for the buy-back were taken from internally-generated funds. As of December 31, 2012, the Company reacquired 131.4 million shares at a total cost of P118.6 million.
This account also includes the Company’s common shares held and acquired by RHGI and GPMAI. The number of treasury common shares aggregated to 537.4 million as of December 31, 2009. The changes in market values of these shares recognized as fair value gains (losses) were eliminated in full and not recognized in the consolidated financial statements. In 2010, when GPMAI was deconsolidated, the cost of the treasury shares held by GPMAI of P555.1 million was removed from the Treasury Stock account presented under equity. In 2011, GPMAI was consolidated back through EELHI and, accordingly, the cost of the treasury shares held by GPMAI as of December 31, 2011 amounting to P555.1 million was included back to Treasury Stock. In 2012, however, GPMAI was deconsolidated by EELHI and, thus, became an associate of both the Company and EELHI in that year; hence, the same cost of the treasury shares held by GPMAI was deducted from the balance of Treasury Stock account. A portion of the Company’s retained earnings is restricted for dividend declaration up to the cost of treasury stock as of the end of the reporting period.

- 61 -
25. EARNINGS PER SHARE
Earnings per share (EPS) amounts were computed as follows:
2012 2011 2010
Net profit attributable to
Company’s shareholders P 7,294,070,482 P 8,031,884,511 P 5,026,180,575
Dividends on cumulative
preferred shares series “A” ( 600,000) ( 600,000 ) ( 600,000)
Profit available to Company’s
common shareholders P 7,293,470,482 P 8,031,284,511 P 5,025,580,575
Divided by weighted number
of outstanding common shares 25,970,748,295 25,149,519,186 25,130,015,061
Basic P 0.281 P 0.319 P 0.200
Diluted P 0.275 P 0.319 P 0.200
There were no outstanding convertible preferred shares and bonds or other stock
equivalents that may be considered as potential dilutive common shares as of December 31, 2011 and 2010. In 2012, the potential dilutive common shares relating to the unexercised stock warrants were considered in the computation of diluted EPS totaling 992,386,021(see Note 24.2).
26. COMMITMENTS AND CONTINGENCIES
26.1 Operating Lease Commitments – Group as Lessor The Group is a lessor under several operating leases covering real estate properties for commercial use (see Note 11). The leases have terms ranging from 3 to 20 years, with renewal options, and include annual escalation rates of 5% to 10%. The average annual rental covering these agreements amounts to about P6.1 billion for the consolidated balances. Future minimum lease payments receivable under these agreements are as follows:
2012 2011 2010
Within one year P 5,043,673,839 P 4,144,019,854 P 3,145,772,222
After one year but not
more than five years 25,817,849,759 21,253,587,459 14,998,070,516
More than five years 8,144,777,814 6,704,886,317 4,731,453,360
P 39,006,301,412 P 32,102,493,630 P 22,875,296,098

- 62 -
26.2 Operating Lease Commitments – Group as Lessee The Group is a lessee under several operating leases covering condominium units for administrative use. The leases have terms ranging from 1 to 11 years, with renewal options, and include a 5% to 10% annual escalation rate. The average annual rental covering these agreements amounts to about P18.3 million for the consolidated balances. The future minimum rental payables under these non-cancelable leases as of December 31, are as follows:
2012 2011 2010
Within one year P 35,901,531 P 19,395,713 P 12,247,168
After one year but not
more than five years 58,183,558 41,710,168 19,039,825
More than five years 7,395,348 11,093,022 18,908,935
P 101,480,437 P 72,198,903 P 50,195,928 26.3 Others As of December 31, 2012 and 2011, the Group does not have unused credit lines. There are other commitments, guarantees and contingent liabilities that arise in the normal course of operations of the Group which are not reflected in the consolidated financial statements. The management of the Group is of the opinion that losses, if any, from these items will not have any material effect on its consolidated financial statements.
27. RISK MANAGEMENT OBJECTIVES AND POLICIES The Group has various financial instruments such as cash and cash equivalents, financial assets at FVTPL, AFS securities, interest-bearing loans and borrowings, bonds payable, trade receivables and payables which arise directly from the Group’s business operations. The financial liabilities were issued to raise funds for the Group’s capital expenditures. The Group does not actively engage in the trading of financial assets for speculative purposes. 27.1 Foreign Currency Sensitivity
Most of the Group’s transactions are carried out in Philippine pesos, its functional currency. Exposures to currency exchange rates arise mainly from the Group’s U.S. dollar-denominated cash and cash equivalents and bonds payable which have been used to fund new projects and to refinance certain indebtedness for general corporate purposes.
Foreign currency-denominated financial assets and liabilities, translated into Philippine pesos at the closing rate are as follows:
2012 2011 U.S. Dollars Pesos U.S. Dollars Pesos
Financial assets $ 172,024,451 P 7,443,028,714 $ 196,929,685 P 8,749,989,037 Financial liabilities ( 207,848,467) ( 8,561,694,049) ( 195,759,303) ( 8,599,314,640 ) ($ 35,824,016) (P 1,118,665,335) $ 1,170,382 P 150,674,397

- 63 -
The following table illustrates the sensitivity of the consolidated net results for the year with regards to the Group’s financial assets and financial liabilities as shown previously and the U.S. dollar – Philippine peso exchange rate:
Increase (decrease) Effect on consolidated profit before tax in exchange rate 2012 2011 P 1 ( P 35,824,016 ) P 1,170,382 (P 1) 35,824,016 ( 1,170,382 )
Exposures to foreign exchange rates vary during the year depending on the volume of overseas transactions and mainly affect consolidated profit or loss of the Group. There are no material exposures on foreign exchange rate that affect the Group’s other comprehensive income (loss). Nonetheless, the analysis above is considered to be representative of the Group’s currency risk. 27.2 Interest Rate Sensitivity The Group interest risk management policy is to minimize interest rate cash flow risk exposures to changes in interest rates. The Group maintains a debt portfolio unit of both fixed and floating interest rates. These long-term borrowings and all other financial assets and liabilities are subject to variable interest rates. The Group’s ratio of fixed to floating rate debt stood at 16.24:1.00, 12.85:1.00, and 7.68:1.00 as of December 31, 2012, 2011 and 2010, respectively.
The following table illustrates the sensitivity of the consolidated net result for the year and consolidated equity to a reasonably possible change in interest rates of +1% and –1% in 2012 and 2011. The calculations are based on the Group’s financial instruments held at each reporting date. All other variables are held constant.
2012 2011 +1% -1% +1% -1%
Consolidated net results for the year (P 9,438,380) P 9,438,380 (P 17,638,794) P 17,638,794 Consolidated equity ( 6,606,866) 6,606,866 ( 12,347,156) 12,347,156
27.3 Credit Risk Generally, the Group’s credit risk is attributable to trade receivables, rental receivables and other financial assets. The Group maintains defined credit policies and continuously monitors defaults of customers and other counterparties, identified either individually or by group, and incorporates this information into its credit risk controls. Where available at a reasonable cost, external credit ratings and/or reports on customers and other counterparties are obtained and used. The Group’s policy is to deal only with creditworthy counterparties. In addition, for a significant proportion of sales, advance payments are received to mitigate credit risk.

- 64 -
Generally, the maximum credit risk exposure of financial assets is the carrying amount of the financial assets as shown in the consolidated statements of financial position (or in the detailed analysis provided in the notes to consolidated financial statements), as summarized below.
Notes 2012 2011 Cash and cash equivalents 5 P 26,826,715,439 P 30,324,479,180 Trade and other receivables 6 37,862,563,504 36,214,357,760 Advances to associates and other related parties 10, 23.3 1,893,985,442 2,560,176,436 AFS securities 8 552,317,041 561,694,969 P 67,135,581,426 P 69,660,708,345
None of the Company’s financial assets are secured by collateral or other credit enhancements, except for cash and cash equivalents as described below.
(a) Cash and Cash Equivalents
The credit risk for cash and cash equivalents is considered negligible since the counterparties are reputable banks with high quality external credit ratings. Included in the cash and cash equivalents are cash in banks and short-term placements which are insured by the Philippine Deposit Insurance Corporation up to a maximum coverage of P500,000 for every depositor per banking institution.
(b) Trade and Other Receivables
All trade receivables are subject to credit risk exposure. However, the Group does not identify specific concentrations of credit risk with regard to Trade and Other Receivables as the amounts recognized resemble a large number of receivables from various customers. Certain receivables from trade customers are covered by post-dated checks. Certain past due accounts are not provided with allowance for impairment to the extent of the expected market value of the property sold to the customer. The title to the real estate properties remains with the Group until the receivables are fully collected.
Some of the unimpaired trade receivables are past due as at the end of the reporting period. The trade receivables that are past due but not impaired are as follows:
2012 2011 Not more than 3 months P 841,118,917 P 880,160,167 More than 3 months but not more than 6 months 670,846,015 469,684,169 More than 6 months but not more than one year 207,286,843 182,748,702 More than one year 45,793,567 35,707,777 P1,765,045,342 P 1,568,300,815

- 65 -
27.4 Liquidity Risk The Group manages its liquidity needs by carefully monitoring scheduled debt servicing payments for long-term financial liabilities as well as cash outflows due in a day-to-day business. Liquidity needs are monitored in various time bands, on a day-to-day and week-to-week, as well as on the basis of a rolling 30-day projection. Long-term needs for a six-month and one-year period are identified monthly. The Group maintains cash to meet its liquidity requirements for up to 60-day periods. Excess cash is invested in time deposits or short-term marketable securities. Funding for long-term liquidity needs is additionally secured by an adequate amount of committed credit facilities and the ability to sell long-term financial assets.
As at December 31, 2012 and 2011, the Group’s financial liabilities have contractual maturities which are presented below.
2012
Current Non-current
Within 6 to 12 1 to 5 Later
6 Months Months Years 5 Years
Interest-bearing loans and borrowings P 793,797,200 P 793,797,200 P 4,910,569,540 P - Trade and other payables 2,662,082,166 5,237,935,146 - - Bonds payable - - 5,000,000,000 8,556,628,075 Advances from other related parties - - 692,604,550 -
P 3,455,879,366 P 6,031,732,346 P 10,603,174,090 P 8,556,628,075
2011
Current Non-current
Within 6 to 12 1 to 5 Later
6 Months Months Years 5 Years
Interest-bearing loans and borrowings P 1,202,078,269 P 748,037,131 P 5,991,475,388 P - Trade and other payables 2,590,019,174 4,706,947,320 - - Bonds payable - - 5,000,000,000 8,538,914,490 Advances from other related parties - - 210,242,443 - P 3,792,097,443 P 5,454,984,451 P 11,201,717,831 P 8,538,914,490
The above contractual maturities reflect the gross cash flows, which may differ from the carrying values of the liabilities at the reporting dates.
27.5 Other Price Risk Sensitivity
The Group’s market price risk arises from its investments carried at fair value (financial assets classified as FVTPL and AFS). It manages its risk arising from changes in market price by monitoring the changes in the market price of the investments.

- 66 -
For equity securities listed in the Philippines, the observed volatility rates of the fair values of the Group’s investments held at fair value and their impact on the Group’s consolidated net profit and consolidated equity as of December 31, 2012, 2011 and 2010 are summarized as follows:
2012
Observed Volatility Rates Impact of Increase Impact on Decrease Increase Decrease Net Profit Equity Net Profit Equity
Investment in equity securities in a holding company +49.09% -49.09% P 82,274,840 P 1,234,725,543 ( P 82,274,840 ) ( P1,234,725,543)
2011 Observed Volatility Rates Impact of Increase Impact on Decrease Increase Decrease Net Profit Equity Net Profit Equity Investment in equity securities in a holding company +47.56% -47.56% P 51,937,070 P 875,489,889 ( P 51,937,070 ) ( P 875,489,889)
2010 Observed Volatility Rates Impact of Increase Impact on Decrease Increase Decrease Net Profit Equity Net Profit Equity Investment in equity securities in: Holding company +51.53% -51.53% P 64,414,912 P 2,073,193,927 ( P 64,414,912 ) ( P 2,073,193,927 ) Property company +51.54% -51.54% - 71,024,936 - ( 71,024,936 ) P 64,414,912 P 2,144,218,863 ( P 64,414,912 ) (P 2,144,218,863 )
The investments in listed equity securities are considered long-term strategic investments. In accordance with the Group’s policies, no specific hedging activities are undertaken in relation to these investments. The investments are continuously monitored and voting rights arising from these equity instruments are utilized in the Group’s favor.
28. CATEGORIES AND FAIR VALUES OF FINANCIAL ASSETS AND LIABILITIES
28.1 Comparison of Carrying Amounts and Fair Values
The carrying amounts and fair values of the categories of financial assets and liabilities presented in the consolidated statements of financial position are shown below.
Notes 2012 2011 Carrying Values Fair Values Carrying Values Fair Values Financial Assets Loans and receivables: Cash and cash equivalents 5 P 26,826,715,439 P26,826,715,439 P 30,324,479,180 P 30,324,479,180 Trade and other receivables - net 6 37,862,563,504 37,862,563,504 36,214,357,760 36,214,357,760 Advances to associates and other related parties 10 1,893,985,442 1,893,985,442 2,560,176,436 2,560,176,436 P66,583,264,385 P66,583,264,385 P 69,099,013,376 P 69,099,013,376 Financial assets at fair value through profit or loss 7 P 167,600,000 P 167,600,000 P 109,203,260 P 109,203,260 Available-for-sale financial securities: 8 Equity securities P 2,704,469,578 P 2,704,469,578 P 2,030,052,709 P 2,030,052,709 Debt securities 552,317,041 552,317,041 561,694,969 561,694,969 P 3,256,786,619 P 3,256,786,619 P 2,591,747,678 P 2,591,747,678

- 67 -
Notes 2012 2011 Carrying Values Fair Values Carrying Values Fair Values Financial Liabilities Financial liabilities at amortized cost: Interest-bearing loans and borrowings 14 P 6,498,163,850 P 6,498,163,850 P 7,941,590,788 P 7,941,590,788 Bonds payable 15 13,556,628,075 13,556,628,075 13,538,914,490 13,538,914,490 Trade and other payables 16 7,900,017,312 7,900,017,312 7,296,966,494 7,296,966,494 Advances from other related parties 692,604,550 692,604,550 210,242,443 210,242,443 P28,647,413,787 P28,647,413,787 P 28,987,714,215 P 28,987,714,215
See Notes 2.5 and 2.10 for a description of the accounting policies for each category of financial instrument. A description of the Group’s risk management objectives and policies for financial instruments is provided in Note 27. 28.2 Fair Value Hierarchy The Group’s investments in financial assets at FVTPL and AFS Securities are comprised of equity and debt instruments listed in foreign and local stock exchanges. Fair value measurements of these financial assets were determined directly by reference to published prices quoted in an active market (Level 1 of the fair value hierarchy).
29. CAPITAL MANAGEMENT OBJECTIVES, POLICIES AND PROCEDURES
The Group’s capital management objective is to ensure its ability to continue as a going concern and to provide an adequate return to shareholders by pricing products and services commensurately with the level of risk.
The Group manages its capital structure and makes adjustments to it, in the light of changes in economic conditions. It monitors capital using the debt-to-equity ratio.
2012 2011 Interest-bearing loans and borrowings P 6,498,163,850 P 7,941,590,788 Bonds payable 13,556,628,075 13,538,914,490 P20,054,791,925 P 21,480,505,278 Total equity P81,389,593,571 P 72,772,105,279 Debt-to-equity ratio 0.25 : 1:00 0.30 : 1:00
The Group has complied with its covenant obligations, including maintaining the required debt-to-equity ratio for the years presented above.
30. OTHER MATTERS
30.1 Registration with Philippine Economic Zone Authority (PEZA) ECOC, as operator of the Eastwood City CyberPark, is registered with PEZA. As a PEZA registered entity, it is entitled to a preferential tax rate of 5% on gross income earned from its PEZA registered activities, in lieu of all local and national taxes, and to other tax privileges.

- 68 -
30.2 International Organization for Standardization (ISO) Certification The Company was awarded a Certificate of Registration ISO 9001:1994 effective November 26, 1999 by Certification International Philippines, Inc. Effective November 21, 2002, the Company has upgraded its Certification to ISO 9001:2000 series. The scope of the certification covers all areas of the Company’s operations, which include planning, design, project management and customer service for its real estate business. Among others, the Company is required to undergo surveillance audits every six months.
30.3 Awards As a testament to the Company was recognized by various award-giving bodies in 2012 and 2011 as follows: 2012
• Finance Asia’s Best Managed Philippine Company, Best in Investor Relations and Best Mid-Cap Company;
• Corporate Governance Asia’s 2nd Asian Excellence Awards- Best Investor Relations;
• Corporate Governance Asia’s 8th Corporate Governance Asia Recognition Awards;
• Alpha Southeast Asia 2nd Annual Southeast Asia’s Institutional Investor Corporate Poll- Most Organized Investor Relations and Strong Adherence to Corporate Governance.
2011
• Alpha Southeast Asia Most Organized Investor Relations and Strong Adherence to Corporate Governance;
• World HRD Congress Best Employer;
• Asia’s Best Managed Company by Finance Asia;
• Best in Investor Relations by Finance Asia.

;.
., '
Punongbayan &.Araullo An instinct for growth'M
Report of Independent Auditors to Accompany Supplementary Information Required by the Securities and Exchange Commission Filed Separately from the Basic Financial Statements
The Board of Directors and Stockholders Megaworld Corporation and Subsidiaries (A Subsidiary of AUiance Global Group, Inc.) 28111 Floor, The World Centre Building Sen. Gil Puyat Avenue, Makati City
19th and 20th Floors, Tower 1 The Enterprise Center 6766 Ayala Avenue 1200 Makati City Philippines
T +63 2 886 5511 F +63 2 886 5506 www.punongbayan-araullo.com
We have audited in accordance with Philippine Standards on Auditing, the consolidated financial statements of Megaworld Corporation and Subsidiaries (the Group) for the year ended December 31, 2012, on which we have rendered our report dated March 1, 2013. Our audit was made for the purpose of forming an opinion on the basic consolidated financial statements taken as a whole. The applicable supplementary information (see List of Supplementary Information) is presented for purposes of additional analysis in compliance with the requirements of the Securities Regulation Code Rule 68, and is not a required part of the basic consolidated financial statements prepared in accordance with Philippine Financial Reporting Standards. Such supplementary information is the responsibility of the Group's management. The supplementary information has been subjected to the auditing procedures applied in the audit of the basic consolidated financial statements and, in our opinion, is fairly stated in all material respects in relation to the basic consolidated financial statements taken as a whole.
Certified Public Accountants
PUNONGBAYAN & ARAULLO
~At'~~;. By: NelsonY.llinio -
Partner
CPA Reg. No. 0097048 TIN 201-771-632 PTR No. 3671455,January 2, 2013, Makati City SEC Group A Accreditation
Partner- No. 1036-A (until Sept. 29, 2013) Firm- No. 0002-FR-3 (until Jan. 18, 2015)
BIR AN 08-002511-32-2011 (until Feb. 3, 2014) Firm's BOA/PRC Cert. of Reg. No. 0002 (until Dec. 31, 2015)
March 1, 2013
P&A is a member firm within Grant Thornton International Ltd
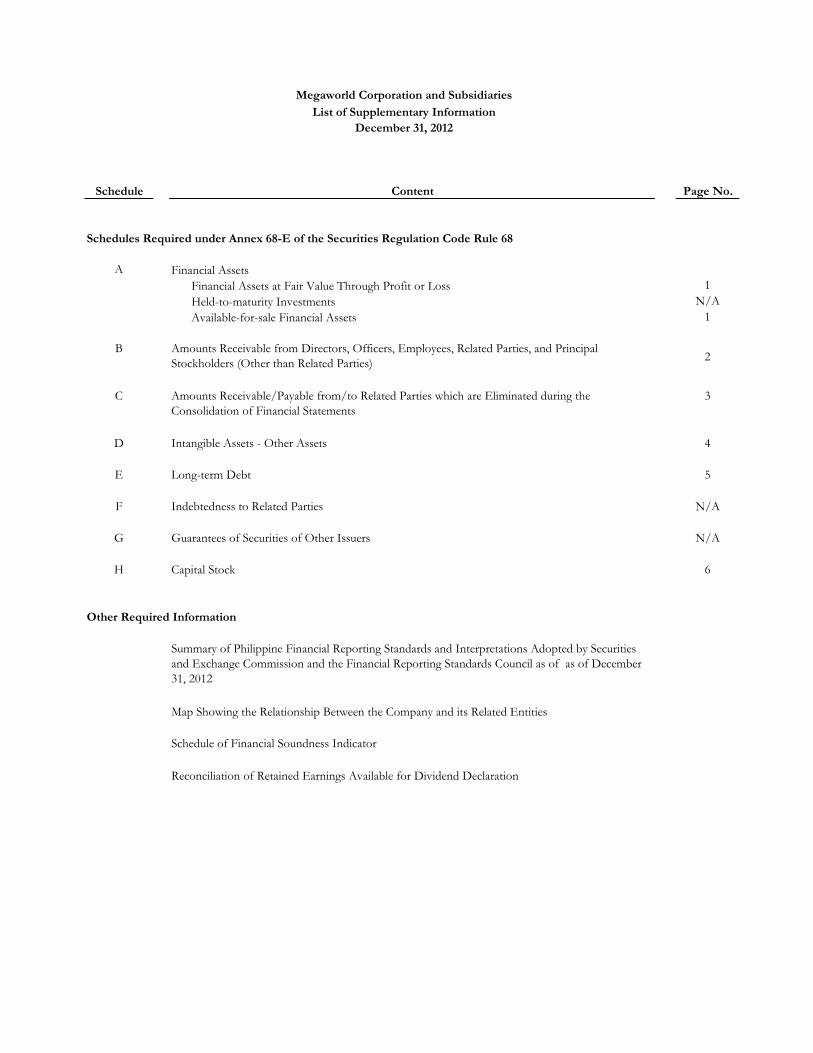
Schedule Content Page No.
Schedules Required under Annex 68-E of the Securities Regulation Code Rule 68
A Financial Assets
Financial Assets at Fair Value Through Profit or Loss 1
Held-to-maturity Investments N/A
Available-for-sale Financial Assets 1
B Amounts Receivable from Directors, Officers, Employees, Related Parties, and Principal
Stockholders (Other than Related Parties)2
C Amounts Receivable/Payable from/to Related Parties which are Eliminated during the
Consolidation of Financial Statements
3
D Intangible Assets - Other Assets 4
E Long-term Debt 5
F Indebtedness to Related Parties N/A
G Guarantees of Securities of Other Issuers N/A
H Capital Stock 6
Summary of Philippine Financial Reporting Standards and Interpretations Adopted by Securities
and Exchange Commission and the Financial Reporting Standards Council as of as of December
31, 2012
Map Showing the Relationship Between the Company and its Related Entities
Schedule of Financial Soundness Indicator
Reconciliation of Retained Earnings Available for Dividend Declaration
Megaworld Corporation and Subsidiaries
List of Supplementary Information
December 31, 2012
Other Required Information

Name of issuing entity and association of each issue
Number of shares or principal amount of
bonds or notes
Amount shown on the balance sheet
Valued based on the market
quotation at balance sheet date
Income received and accrued
Alliance Global Group Inc. 159,953,200 2,682,828,241P 2,682,828,241P 53,549,026P
Shui on Land Ltd. 44,424,007P 45,092,017 45,092,017 76,461
Shui on Development Hold 126,925,692P 129,012,437 129,012,437 241,084
Shimao Property Holdings Ltd. 206,268,940P 238,151,548 238,151,548 550,000
Yanlord Land Group Ltd. 123,699,576P 140,061,038 140,061,038 318,750
Asia E-Commerce, Inc. 12,500,000 3,425,000 3,425,000
Bonifacio West Development Corp. 4,611 185,816,338 185,816,338
3,424,386,619 3,424,386,619 54,735,321
Megaworld Corporation and Subsidiaries
Schedule A - Financial Assets
December 31, 2012
- 1 -
P P P P

Name and designation of debtor1
Balance at beginning of
periodAdditions
Amounts collected
Amounts written off
Current Not currentBalance at end of
period
Advances to Officers and Employees:
Philipps Cando 486,317 135,717 )( 350,600 350,600
First VP - Operations
Garry V. de Guzman 83,147 83,147 )( - - - -
First VP - Legal Affairs
Monica Salomon 196,214 130,810 )( - 65,404 - 65,404
First VP - Corporate Management
Rolando D. Siatela - 463,210 - - 463,210 - 463,210
Assistant Corporate Secretary
765,678 P 463,210 P 349,674 )( P - 879,214 P - 879,214 P
Loans to Directors: - - - - - - -
Megaworld Corporation and Subsidiaries
Schedule B - Amounts Receivable from Directors, Officers, Employees, Related Parties and Principal Stockholders (Other than Related Parties)
December 31, 2012
Deductions Ending Balance
- 2 -

Name and designation of debtorBalance at beginning
of periodAdditions Amounts collected Amounts written off Current Not current
Balance at end of
period
Due from Related Parties:
Megaworld Land Inc. (MLI) 189,413,422 - 10,752,638 - - 178,660,784 178,660,784
Megaworld Newport Property Holdings, Inc. (MNPHI) 91,771,977 989,091 - - - 92,761,068 92,761,068
Oceantown Properties, Inc. (OPI) 217,244,113 41,594,023 - - - 258,838,136 258,838,136
Piedmont Property Ventures, Inc. (PPVI) 92,080 24,801 - - - 116,880 116,880
Stonehaven Land, Inc.(SLI) 92,080 24,801 - - - 116,880 116,880
Streamwood Property, Inc. (SP) 117,620 24,470 - - - 142,089 142,089
Richmonde Hotel Group International, Ltd. (RHGI) 6,844,261,846 - 4,714,186,269 - - 2,130,075,576 2,130,075,576
Suntrust Properties Inc. (SPI) 326,116,391 284,016,293 - - - 610,132,684 610,132,684
Empire East Landholdings Inc. (EELHI) 653,659,919 1,569,814,244 - - - 2,223,474,163 2,223,474,163
Eastwood Property Holdings, Inc. 160,175,472 - 59,221,453 - - 100,954,019 100,954,019
Due to Related Parties:
Prestige Hotels, Inc.( PHRI) - 22,456,427 - - - 22,456,427 22,456,427
Megaworld Daewoo Corporation (MDC) 236,472,977 - 5,322,138 - - 231,150,840 231,150,840
Megaworld Central Properties, Inc. (MCPI) 37,395,882 30,106,519 - - - 67,502,401 67,502,401
Townsquare Development Inc. (TDI) 832,863,205 - 63,287,452 - - 769,575,753 769,575,753
Mega Globus Asia, Inc. (MGAI) 206,579,082 32,000,000 - - - 238,579,082 238,579,082
Philippine International Properties, Inc. (PIPI) 4,028,804 - 273,972 - - 3,754,831 3,754,831
MEGAWORLD CORPORATION AND SUBSIDIARIES
SCHEDULE C- Amounts Receivable/Payable from/to Related Parties which are Eliminated During the Consolidation of Financial Statements
December 31, 2012
Deductions
- 3 -

Description Beginning balance Additions at costCharged to cost and expenses
Charged to other
accounts
Other changes additions
(deductions)Ending balance
Goodwill 343,095,101 P - - - - 343,095,101 P
Megaworld Corporation and Subsidiaries
Schedule D - Intangible Assets - Other Assets
December 31, 2012
Deduction
- 4 -

Title of issue and type of obligationAmount authorized by
indenture
Amount shown under caption"Current
portion of long-term debt" in related balance sheet
Amount shown under caption"Long-Term
Debt" in related balance sheet
Long -term loan 17,274,202,511 P P 1,587,594,400 9,910,569,450 P
Foreign borrowings 8,556,628,075 - 8,556,628,075
25,830,830,586 P 1,587,594,400 P 18,467,197,525 P
Megaworld Corporation and Subsidiaries
Schedule E - Long-Term Debt
December 31, 2012
- 5 -

Title of IssueNumber of shares
authorized
Number of shares issued and outstanding as shown under the related balance
sheet caption
Number of shares reserved for options, warrants, conversion
and other rights
Related partiesDirectors, officers
and employeesOthers
Common shares - P1 par value 30,140,000,000 28,747,442,985 992,386,005 18,784,521,882 99,068,543 9,863,852,560
Preferred shares - P.01 par value 6,000,000,000 6,000,000,000 6,000,000,000
Megaworld Corporation and Subsidiaries
Schedule H - Capital Stock
December 31, 2012
Number of shares held by
- 6 -

MEGA WORLD CORPORATION AND SUBSIDIARIES (A Sulw{!J~ry of Alliance Global Gro11p, Inc.)
Schedule of Philippine Financial Reporting Standards and Interpretations Adopted by the Securities and Exchange Commission and the Financial Reporting Standards Council as of December 31, 2012
Not Applicable
./
./

Not Applicable
,/
,/

Not Applicable
,/
,/

Plu7ippine 1111e1J>rctarions- Standing Interpretations Committee (SIC)
Thc~c s!anc..l:lrds will ht· dTcctin· for !"'llTiods subsctjlll...'nl to 2tl12 and arc not L'ariy aJoptt.:J by the Company.
Tht..·se standard .... han· bt•cn adopted in thl' prcp;uation o( financial statements but tilt.' Company has no sit-,rnificant transactions Co\-crcJ
in b1 ,tiJ ~Tars prt·scntt·J.
Not Applicable


Current ratio 3.17 :1.00 3.35 :1.00
Quick ratio 1.04 :1.00 1.31 :1.00
Debt-to-equity ratio 0.25 :1.00 0.30 :1.00
Interest-bearing debt to total capitalization
ratio
0.22 :1.00 0.26 :1.00
Asset-to-equity ratio 1.75 :1.00 1.77 :1.00
Interest rate coverage ratio
Net profit margin
Return on assets
Return on equity/investment
Return on equity/investment of owners
- 7 -
MEGAWORLD CORPORATION AND SUBSIDIARIES
SCHEDULE OF FINANCIAL SOUNDNESS INDICATORS
DECEMBER 31, 2012 AND DECEMBER 31, 2011
DECEMBER 31, 2012 DECEMBER 31, 2011
24.24% 28.49%
706% 551%
10.20% 13.18%
5.45% 7.22%
9.10% 11.21%
LIQUIDITY RATIOS measure the business’ ability to pay short-term debt. Current ratio – computed as current assets divided by current liabilities Quick ratio – computed as cash and cash equivalents divided by current liabilities SOLVENCY RATIOS measure the business’ ability to pay all debts, particularly long -term debt. Debt to equity ratio – computed as interest bearing loans and borrowings and bonds payable divided by total stockholders’ equity. Interest-bearing debt to total capitalization ratio – computed as interest-bearing debt divided by interest-bearing debt+stockholders’ equity attributable to the company's shareholders. ASSET-TO-EQUITY RATIOS measure financial leverage and long-term solvency. It shows how much of the assets are owned by the company. It is computed as total assets divided by total stockholders’ equity. INTEREST RATE COVERAGE RATIOS measure the business’ ability to meet its interest payments. It is computed as Earnings before income tax and interest expense (EBIT excluding non-recurring gain) divided by interest payments. PROFITABILITY RATIOS Net margin – computed as net profit divided by revenues Return on assets – net profit divided by average total assets Return on investment – net profit divided by total stockholders’ equity. Return on investment of equity owners – net profit attributable to the company's shareholders divided by equity attributable to the company's shareholders.
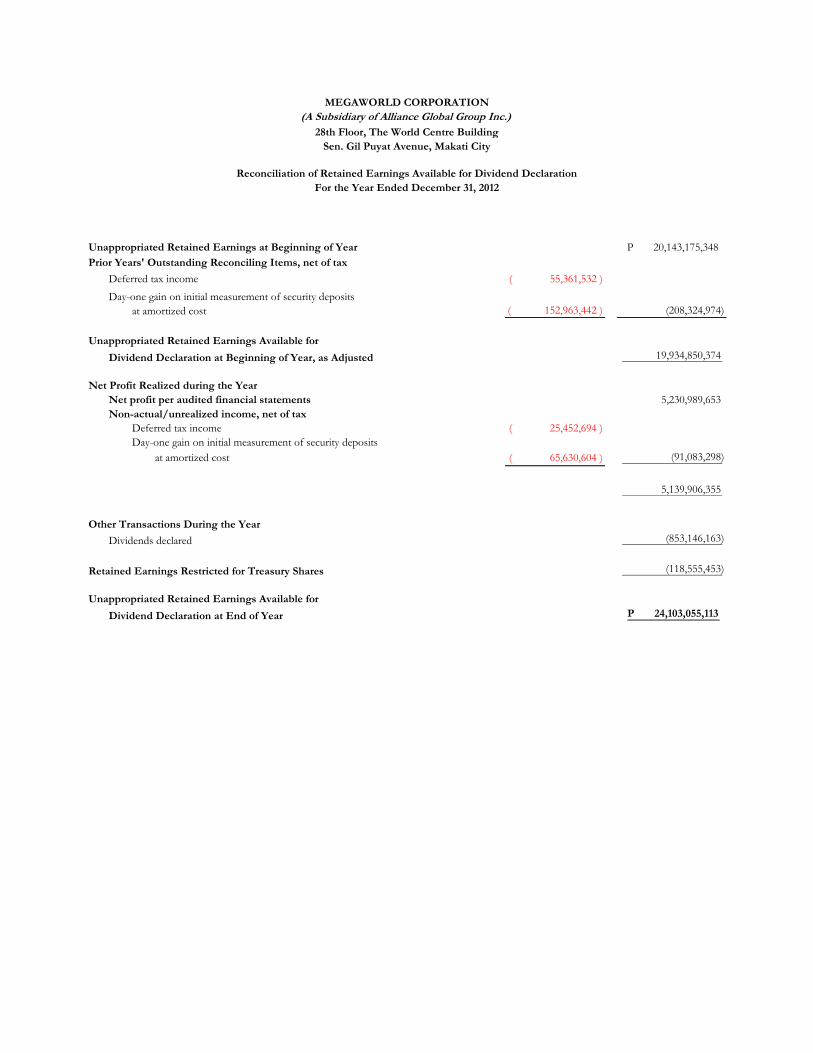
Unappropriated Retained Earnings at Beginning of Year 20,143,175,348 P
Prior Years' Outstanding Reconciling Items, net of tax
Deferred tax income 55,361,532 )(
Day-one gain on initial measurement of security deposits
at amortized cost 152,963,442 )( (208,324,974)
Unappropriated Retained Earnings Available for
Dividend Declaration at Beginning of Year, as Adjusted 19,934,850,374
Net Profit Realized during the Year
Net profit per audited financial statements 5,230,989,653
Non-actual/unrealized income, net of tax
Deferred tax income 25,452,694 )(
Day-one gain on initial measurement of security deposits
at amortized cost 65,630,604 )( (91,083,298)
5,139,906,355
Other Transactions During the Year
Dividends declared (853,146,163)
Retained Earnings Restricted for Treasury Shares (118,555,453)
Unappropriated Retained Earnings Available for
Dividend Declaration at End of Year 24,103,055,113 P
MEGAWORLD CORPORATION
(A Subsidiary of Alliance Global Group Inc.)
28th Floor, The World Centre Building
Sen. Gil Puyat Avenue, Makati City
Reconciliation of Retained Earnings Available for Dividend Declaration
For the Year Ended December 31, 2012