philippine stock exchange, inc. 4/f pse center, … · agi 17-q 2011jun-4 - star luxury hotel) and...
TRANSCRIPT

7th Floor, 1880 Eastwood Avenue Eastwood City CyberPark 188 E. Rodriguez Jr. Avenue Bagumbayan, 1110 Quezon City Tel. Nos. 7092038-41 Fax Nos. 7091966
07 September 2011 Disclosure Department Philippine Stock Exchange, Inc. 4/F PSE center, Exchange Road Ortigas Center, Pasig City Fax No. 636-0809 Attention: Ms. JANET A. ENCARNACION Head, Disclosure Department
Gentlemen:
Attached is the Amended Quarterly Report for the period ended 30 June 2011 under SEC 17-Q of Alliance Global Group, Inc. Please take note that this amended report included Notes to the Interim Consolidated Financial Statements (see pages 21-31) and correction on the 2010 table for interest expense line item (on page 5).
Very truly yours,
Dina Inting First Vice President for Finance & Corporate Information Officer

SECURITIES AND EXCHANGE COMMISSION
SEC FORM 17-Q/A
QUARTERLY REPORT PURSUANT TO SECTION 17 OF THE SECURITIES REGULATION CODE AND SRC RULE 17(2)(b) THEREUNDER
1. For the quarterly period ended June 30, 2011
2. SEC Identification Number AS093046 3. BIR Tax Identification No. 003-831-302-000 4. Exact name of issuer as specified in its charter ALLIANCE GLOBAL GROUP, INC. 5. METRO MANILA, PHILIPPINES
Province, country or other jurisdiction of incorporation or organization 6. (SEC Use Only) Industry classification code 7. 7th Floor, 1880 Eastwood Avenue, Eastwood City CyberPark
188 E. Rodriguez Jr. Ave., Bagumbayan, 1110 Quezon City Address of principal office
8. (632) 70920-38 to -41 Registrant's telephone number, including area code
9. Securities registered pursuant to Sections 8 and 12 of the SRC, or secs. 4 and 8 of the RSA Title of Each Class Number of Shares of Common Stock Outstanding and Amount of Debt Outstanding Common 10,269,827,979 10. Are any or all of these securities listed on a Stock Exchange? Yes, on the
Philippine Stock Exchange. 11. (a) AGI has filed all reports required to be filed by Section 17 of the SRC and SRC
Rule 17 thereunder or Section 11 of the RSA and RSA Rule 11(a)-1 thereunder, and Sections 26 and 141 of The Corporation Code of the Philippines during the preceding twelve (12) months. (b) AGI has been subject to such filing requirements for the past ninety (90) days.

AGI
17-Q
2011JUN -2 -
PART I – FINANCIAL INFORMATION Item 1. Financial Statements Consolidated Statements of Financial Position Consolidated Statements of Comprehensive Income Consolidated Statements of Changes in Equity
Consolidated Statements of Cash Flows Notes to Interim Consolidated Financial Statements Aging Schedule of Trade and Other Receivables Under Current Assets
The interim consolidated financial statements have been prepared in accordance with the Philippine Financial Reporting Standards (PFRS) and Philippine Accounting Standard 34, Interim Financial Reporting. As such, they do not include all of the information and disclosures required for full annual consolidated financial statements, and thus should be read in conjunction with the audited consolidated financial statements of the Group as at and for the year ended December 31, 2010 (ACFS). The accounting policies and methods used in the interim financial statements are consistent with those applied in ACFS. The consolidated financial statements have been prepared using the measurement bases specified by PFRS for each type of asset, liability, income and expense. These consolidated financial statements have been prepared on the historical cost basis, except for the measurement of certain financial assets and liabilities. Accounting estimates, assumptions and judgments are used in preparing these statements. Although these estimates and assumptions are based on management’s best knowledge of current events and actions, historical experience, and evaluation of relevant facts and circumstances, including expectations of future events that are believed to be reasonable under the circumstances, actual results may ultimately differ from such estimates. For a more thorough understanding of the accounting policies used in the preparation of the financial statements, reference should be made to the notes to the latest ACFS filed under SEC 17-A, a copy of which may be found in the Company’s website [allianceglobalinc.com] and PSE website [pse.com.ph]. The interim consolidated financial statements comprise the financial statements of the Company and its subsidiaries, after elimination of material intercompany transactions. Subsidiaries are consolidated from the date the Company obtains control using the acquisition method of accounting (previously called “purchase method”). The excess of the cost of an acquisition over the fair value of the Group’s share in the net identifiable assets of the acquired subsidiary at date of acquisition is carried as goodwill and included under Intangible Assets in the consolidated statements of financial position, while the excess of the Group’s interest in the net fair value of the net identifiable assets acquired over the acquisition cost is charged directly to income. (It is in this regard that AGI recognized gain in the acquisition of a new subsidiary, which is referred to elsewhere in Item 2.)
AGI
17-Q
2011JUN -3 -
In the normal course of business, there were intercompany transactions among the Company and its subsidiaries and these intercompany balances and transactions, including income, expenses, dividends and unrealized profits and losses from intercompany transactions that are recognized in assets are eliminated in full. In addition, shares of stock of the Company acquired by any of these subsidiaries are recognized as treasury shares and these are presented at cost as deduction in the consolidated statements of changes in equity. Any changes in their market values as recognized separately by the subsidiaries are likewise eliminated in full. Gain or loss on the sale of these treasury shares is presented as addition to or deduction from additional paid-in capital (APIC). (In this regard, the gain reported separately by MEG was reclassified to APIC, as mentioned elsewhere in Item 2.) The financial statements of subsidiaries are prepared for the same accounting period as the Company’s, using consistent accounting policies. Adjustments are made to bring into line any dissimilar accounting policies that may exist. The interim consolidated financial statements are presented in Philippine pesos, the Group’s functional and presentation currency, and all values represent absolute amounts except when otherwise indicated. During the interim period, there were no other known items –such as trends, demands, commitments, events or uncertainties- affecting assets, liabilities, equity, sales, revenues, net income or cash flows that were unusual because of their nature, size, or incidents, and that will result in or that are reasonably likely to result in the liquidity increasing or decreasing in any material way, or that would have a material favorable or unfavorable impact on net sales or revenues or income from continuing operations. Business Segments The Group classifies its businesses into the following segments, each managed separately and each representing a strategic business unit that offers different products and serves different markets. Entities not classified under these main business segments are presented as part of corporate and investments. o Food and beverage segment (F&B) includes the manufacture and distribution
of distilled spirits (under the labels of Emperador Brandy, Generoso Brandy and The Bar flavored alcoholic beverage), glass containers and potato snack products (under Pik-Nik label). It also includes the distribution of consumer products under international labels. Emperador Distillers Inc. (EDI) front runs this segment.
o Real estate segment (RE) involves the investment in and development of real
estate, lease of properties, hotel development and operations, and integrated tourism development. The segment is led by publicly-listed Megaworld Corporation (Megaworld or MEG) and includes Travellers International Hotel Group, Inc. (Travellers), AGI’s first integrated tourism vehicle in Metro Manila (which is being reported under equity method). Travellers operates Resorts World Manila which currently houses Maxims Tower (the Philippines’ first six-

AGI
17-Q
2011JUN -4 -
star luxury hotel) and Marriott Hotel Manila. MEG operates two Richmonde hotels, one in Ortigas Center and the other in Eastwood City.
Three new subsidiaries were consolidated in first half of 2011: Global-Estate Resorts, Inc. (GERI, formerly Fil-Estate Land, Inc.), Suntrust Properties, Inc. (SPI) and Empire East Landholdings, Inc. (ELI). GERI is a new member of the group, acquired in January, and is presently 61% owned; while SPI and ELI were associates of MEG until MEG increased its stake on them to majority which as at end-June was at 79% and 52%, respectively. All these three companies are listed in the Philippine Stock Exchange. GERI will be a vehicle for AGI’s tourism projects outside Metro Manila, because it has large tracts of property in prime locations such as in Tagaytay City, Batangas, Boracay and Iloilo. ELI specializes in multi-cluster condominium projects and multi-phase subdivision developments in key locations in Metro Manila and Laguna. SPI focuses in socialized or mass housing developments in Cavite and Laguna.
o Quick service restaurant business (QSR) operates under the McDonald’s brand, in accordance with a master franchise agreement with McDonald’s USA. Golden Arches Development Corporation represents this segment.
Please refer to the Note 1 to the ACFS for a comprehensive list of subsidiaries, associates and joint venture in each business segment Item 2. Management’s Discussion and Analysis of Financial Condition and Results of Operations Key Performance Indicators Presented below are the top five (5) key performance indicators of the Company and subsidiaries as of and for the first six months ended June 30:
2011 2010 Revenue growth 58.01% 22.11% Net profit growth 99.98% 35.67% Attributable to owners of the parent company 118.66% 42.88% Net profit rate 28.72% 22.69% Attributable to owners of the parent company 24.00% 17.34% Return on investment 4.43% 3.59% Current ratio [times]
6/30/11 3.65x
12/31/10 3.46x
o Revenue growth – measures the percentage change in revenues over a designated period of time. Performance is measured both in terms of amount and volume, where applicable.
o Net profit growth – measures the percentage change in net profit over a designated period of time

AGI
17-Q
2011JUN -5 -
o Net profit rate– computed as percentage of net profit to revenues - measures the operating efficiency and success of maintaining satisfactory control of costs
o Return on investment [or capital employed] – the ratio of net profit to total assets - measures the degree of efficiency in the use of resources to generate net income
o Current ratio – computed as current assets divided by current liabilities – measures the ability of the business to meet its current obligations. To measure immediate liquidity, quick assets [cash, marketable securities, accounts receivables] is divided by current liabilities.
Results of Operations – First Half Comparative interim results per segment were as follows:
(In Millions)
RE YoY
%
F&B YoY
%
QSR
YoY
%
Corpor
ate & Others
YoY
%
Consolid
ated
YoY
%
2011
Revenues 15,142 54 7,823 94 5,694 9 4,934 128 33,593 58
EBIT 5,669 48 1,363 132 477 -8 4,924 130 12,432 75
Interest expense 501 64 0 53 6 793 9 1,347 24
Tax 951 15 329 86 132 -17 25 33 1,437 21
Net profit 4,217 56 1,034 152 291 -6 4,106 194 9,648 100
Net profit before non-recurring gain
4,217
56
1,034
152
291
-6
761
194
6,303
31
Net profit to owners
2,784
61
1,034
152
138
-7
4,106
194
8,062
119
Net profit to owners-recurring 2,784 61 1,034 152 138 -7 761 -45 4,717 28
2010
Revenues 9,817 4,037 5,238 2,168 21,260
EBIT 3,825 587 519 1,442 6,373
Interest 287 0 50 27 364
Tax 830 177 159 19 1,184
Net profit 2,709 410 309 1,396 4,825
Net profit to owners
1,731
410
149
1,396
3,687
Note: Totals may not add up due to rounding off.
AGI hit record level with net profit for the first half of the year soaring to P9.6 billion which was twice the P4.8 billion reported a year ago and surpassing last year’s annual profit of P9.5 billion. This was on the back of strong operating results of F&B and RE segments and income from acquisition of a new subsidiary,
AGI
17-Q
2011JUN -6 -
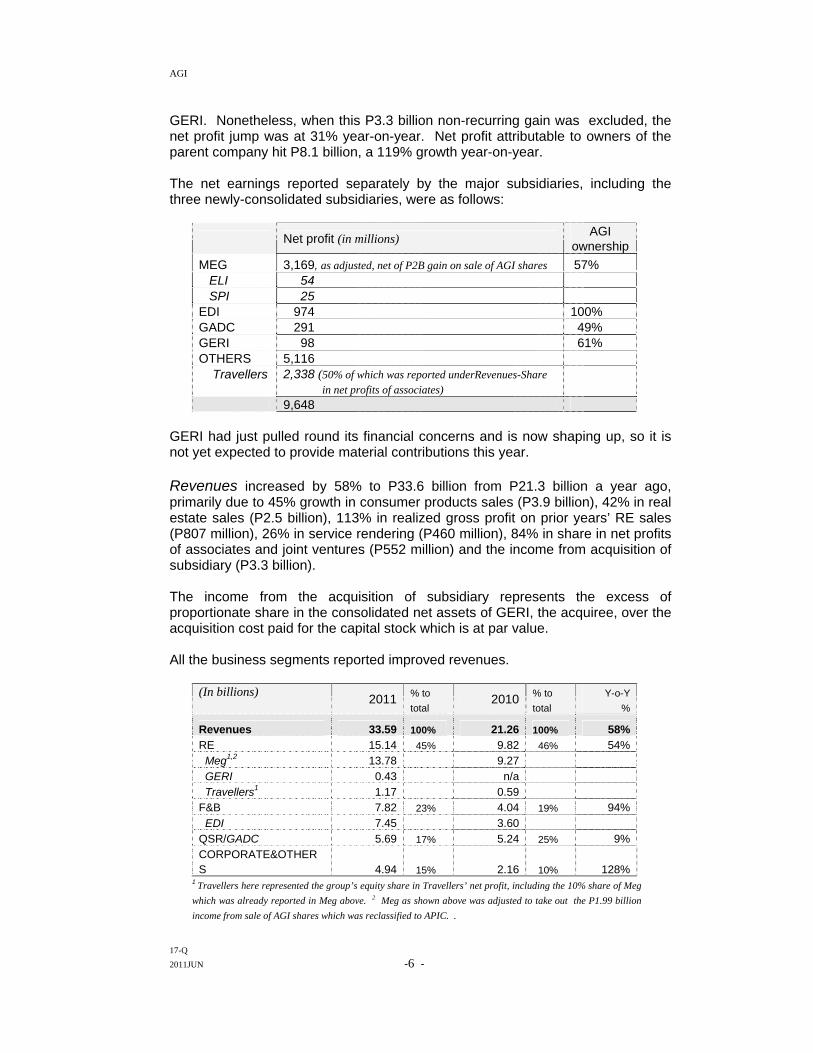
GERI. Nonetheless, when this P3.3 billion non-recurring gain was excluded, the net profit jump was at 31% year-on-year. Net profit attributable to owners of the parent company hit P8.1 billion, a 119% growth year-on-year. The net earnings reported separately by the major subsidiaries, including the three newly-consolidated subsidiaries, were as follows:
Net profit (in millions) AGI
ownership
MEG 3,169, as adjusted, net of P2B gain on sale of AGI shares 57% ELI 54 SPI 25 EDI 974 100% GADC 291 49% GERI 98 61% OTHERS 5,116 Travellers 2,338 (50% of which was reported underRevenues-Share
in net profits of associates)
9,648 GERI had just pulled round its financial concerns and is now shaping up, so it is not yet expected to provide material contributions this year. Revenues increased by 58% to P33.6 billion from P21.3 billion a year ago, primarily due to 45% growth in consumer products sales (P3.9 billion), 42% in real estate sales (P2.5 billion), 113% in realized gross profit on prior years’ RE sales (P807 million), 26% in service rendering (P460 million), 84% in share in net profits of associates and joint ventures (P552 million) and the income from acquisition of subsidiary (P3.3 billion). The income from the acquisition of subsidiary represents the excess of proportionate share in the consolidated net assets of GERI, the acquiree, over the acquisition cost paid for the capital stock which is at par value. All the business segments reported improved revenues.
(In billions) 2011 % to
total 2010 % to
total Y-o-Y
%
Revenues 33.59 100% 21.26 100% 58% RE 15.14 45% 9.82 46% 54% Meg1,2 13.78 9.27
GERI 0.43 n/a
Travellers1 1.17 0.59 F&B 7.82 23% 4.04 19% 94%
EDI 7.45 3.60 QSR/GADC 5.69 17% 5.24 25% 9% CORPORATE&OTHERS 4.94 15% 2.16 10% 128%
1 Travellers here represented the group’s equity share in Travellers’ net profit, including the 10% share of Meg
which was already reported in Meg above. 2 Meg as shown above was adjusted to take out the P1.99 billion
income from sale of AGI shares which was reclassified to APIC. .
AGI
17-Q
2011JUN -7 -
RE revenues came from P8.6 billion (P6.1 billion in 2010) sales of residential and commercial lots, condomium and office units, and golf club and resort shares; P1.9 billion (P1.4 billion) rental/lease of office and commercial spaces and hotel operations; P1.5 billion (P715 million) realized gross profit on prior years’ sales; and P2.5 billion (P1.1 billion) finance and other income. The Group’s revenues were derived from the following projects: Eight Forbes Town in Fort Bonifacio; Eastwood Le Grand in Eastwood City; McKinley Hill Tuscany, Stamford, Morgan Suites, and The Venice Luxury Residences and McKinley West in Taguig City; Manhattan Heights in Quezon City; Newport City, Newport Parkside Villas and Newport Palm Tree Villas in Pasay; City Place in Binondo, Manila; One Central and Greenbelt Madisons in Makati City; Eight Sto. Domingo Place in Quezon City; Magnificat Executive Village in Lipa, Batangas; Monte Cielo De Naga in Naga City; and Sta. Barbara Heights in Iloilo City; and commercial lots in Carmona, Cavite. The following were added from ELI: California Gardens Square, Little Baguio Terraces, Pioneer Woodlands, The Cambridge Village, San Lorenzo Place, Laguna Bel Air Projects, Suntrust Aurora Gardens, Xavierhills, Cybergreen, Governor’s Hills, Sta. Rosa Heights and Suntrust Adriatico Gardens. Rental income from office and retail tenants grew due to high occupancy in both the BPO offices and retail spaces, and escalation of rental prices. RE revenues also included P1.2 billion share in net profit of Travellers, as compared to P595 million a year ago. Travellers reported net profit of P2.3 billion this year from P1.2 billion a year ago. Its earnings before interest, tax and depreciation and amortization amounted to P3.8 billion and P1.8 billion for the same respective periods. Comparatively, revenues grew to P12.2 billion from P6.5 billion while operating expenses increased to P3.4 billion from P1.8 billion due to new hires to support the expanding operations as well as marketing and advertising efforts to promote the integrated resort. Resorts World Manila opened in August 2009 and revenues were derived from the gaming, hotel, food and beverage, theatre, cinema operations and retail shopping mall and commercial office space rentals. F&B revenues scaled up by 93.8% from a year ago due to invigorating demand for the distilled spirits products. Emperador Brandy and The Bar flavored alcoholic drinks continued to enjoy spirited sales in the first half of the year. New The Bar variants - the pricey Citrus Tequila, the popular Strawberry Vodka and the pure Silver, which were launched in the market in April this year, May and November last year, respectively - provided incremental growth that pushed up sales further. Sales of distilled spirits for the first half was already about 10% shy of 2010 annual sales. Pik-Nik sales, on the other hand, rose by 3% from a year ago, with its USA sales gaining 8% despite 3% slip in international sales outside of USA. QSR revenues grew by 8.7%. Product sales generated from company-operated restaurants, in particular, went up by 8.6% and revenue from franchised restaurants by 8.7%. The growth came from the increase and improved performance of its store chain and business extensions (24-hour delivery service, drive-thru, dessert centers, midnight hours and breakfast daypart) and aggressive advertising/promotional campaigns to support McSaver Meals and P25 McSavers (sundae, floats, fries and Burger McDo). Twenty-two new restaurants were

AGI
17-Q
2011JUN -8 -
opened from a year ago, bringing the total number of stores nationwide to 318 stores by end-June. These new stores contributed 4.3% to total system sales. Finance and other income, which represented 9.8% of total revenues, grew by 20.9% due to higher interest earnings and fair value gains on financial assets reported at fair value through profit or loss. Costs and expenses went up by 47.5% to P22.5 billion from P15.2 billion due to 48.2%, 33.7%, 109.7% and 77.0% rise in cost of goods sold, cost of real estate sales, deferred gross profit on real estate sales, and selling expenses, respectively, reflecting robust sales and service rendition. The higher sales translated into higher commissions, advertising and promotions, freight, royalty and fuel expenses.
(In billions) 2011
% to
total 2010
% to
total Y-o-Y %
Costs and expenses 22.50 100% 15.25 100% 47%
RE 9.97 44% 6.28 41% 59%
Meg 9.66 6.21 F&B 6.46 29% 3.45 23% 94%
EDI 6.17 3.06 QSR/GADC 5.27 23% 4.77 31% 10% CORPORATE & Others
0.80 4% 0.75 5% 6%
The top three cost components in the manufacture of alcoholic drinks were raw materials, depreciation and amortization, and factory supplies representing 90% of cost. In the QSR, these were food and paper, rental and utilities and personnel costs, representing about 84% of cost. General and administrative expenses rose by 53.0% because depreciation, salaries and employee benefits increased, particularly in RE business. GERI and ELI expended P438 million during the first half this year. Finance costs and other charges, which represented 4.0% of total costs and expenses, went up by 24.2% to P1.3 billion from P1.1 billion a year ago, due to interest on interest-bearing notes and bonds which comparably increased this year. Tax expense totaled P1.4 billion from P1.2 billion a year ago as a result of increased sales and profits. Earnings before interest, taxes, depreciation and amortizations (EBITDA), computed as net profit before share in net profits of associates and joint ventures, income taxes, interest expense, depreciation, amortizations and impairment provisions, amounted to P11.9 billion, or P8.5 billion when the one-time gain on acquisition of GERI is taken out. EBITDA was P7.0 billion a year ago.

AGI
17-Q
2011JUN -9 -
Financial Condition
Consolidated total assets amounted to P217.9 billion at end-June 2011 from P164.2 billion at beginning of year, a 32.7% increase, primarily due to increased activity in RE segment which included the acquired assets from newly consolidated subsidiaries. Cash and cash equivalents increased by P17.4 billion or 36.9% - from P47.3 billion at the beginning to P64.7 billion at the end of the interim period. The increase came significantly from operations, sale of treasury shares and issuance of MEG bonds. Cash flows from operating, financing and investing activities during the period were presented in the interim consolidated statements of cash flows. Financial assets at FVTPL decreased by P4.0 billion or 29.2% this period, primarily due to reduction in investments in bonds and marketable securities. The fair value gain on the appreciation of market prices, which amounted to P88.6 million, was included under Finance and Other Income in consolidated statements of comprehensive income. Financial statements classified in this category are held for selling in the short term and are measured at fair value. The Group does not actively engage in the trading of financial assets for speculative purposes. Current trade and other receivables went up by P10.4 billion or 59.6% and noncurrent portion went up by P3.3 billion or 20.9% due to increased real estate sales, plus the receivables added to the end-June balances from GERI and ELI. Inventories increased by P6.5 billion or 79.7% because of real estate and resort and golf shares added from GERI. Property development costs soared by P13.1 billion or 346.1% due to increased development activity on ongoing RE projects, plus those in ELI. Land for future development increased by P6.6 billion or 445.0% due to addition to the Group’s land bank of property that belong to GERI, SPI and ELI. Likewise, advances to landowners and joint ventures went up by P1.9 billion or 69.3% largely from those made by ELI. Property and equipment went up by P960.9 million or 18.7% from the P670 million property of GERI and ELI, and P313 million capital expenditures for new McDonald’s stores, kiosks and ongoing renovations. Investment property increased by P694.3 million or 7.0% primarily due to the property added from the newly consolidated subsidiaries. Investments in and advances to associates and other related parties decreased by P4.6 billion or 19.4% primarily due to transfer of investment in ELI which become a subsidiary this year. The reduction was partly offset by GERI’s P2.2 billion account balance as of end-June. Deferred tax assets increased by P396.4 million or 127.8% as a result of P421.6 million from GERI.

AGI
17-Q
2011JUN -10 -
Available-for-sale financial assets decreased by P479 million or 29.8% due to financial assets disposed during the period by MEG. These financial assets include non-derivative financial assets that are either designated to this category or do not qualify for inclusion in any of the other categories of financial assets. These financial assets are reported at fair values by reference to published prices in an active market. Other current assets swelled by P1.3 billion or 133.7% due to GERI’s assets which totaled P489.5 million at end-June and MEG’s accounts which increased by P808.9 million. Other non-current assets, on the other hand, grew by P114 million or 14.0% which was attributable to increases in MEG’s accounts. The increases in customers’ deposits, reserve for property development, deferred tax liabilities, deferred income on real estate sales, trade and other payables, and other current and non-current liabilities, all of which are related to RE segment, were attributed to pumping up of RE development and lease activities as well as vigorous marketing and pre-selling campaigns. The reserve pertains to cost to complete the development of various projects while the deferred income represents unearned revenue. Interest-bearing loans and borrowings dropped by P1.3 billion due to net payments made during the period. Bonds payable climbed up by P8.3 billion due to MEG’s $200 million bonds. Advances from related parties went down by P167.9 million or 49.6% partly due to reduction of MEG’s liabilities, including those brought about by the consolidation of associates. Redeemable preferred shares went up by P22.1 million due to interest accretion. The changes in equity components are presented in detail in the consolidated statements of changes in equity. Treasury shares are AGI shares reacquired by the Company or its subsidiaries but not cancelled and are carried at cost in the consolidated statements of changes in equity. The shares are reported at cost so that fair value gains (losses) on the shares held by subsidiaries were eliminated in full and were not recognized in the consolidated financial statements. Any gain on subsequent reissuance/sale of these shares is considered as additional paid-in capital (APIC). The P1.8 billion reduction in treasury shares referred to the cost of the shares sold during the period, less cost of shares brought from ELI. The P6.4 billion gain realized on these sales was classified as APIC, and this included the P2.0 billion gain realized by MEG which was reclassified from profit or loss (in MEG) to APIC (in AGI). Accumulated translation adjustments represent the translation adjustments resulting from the conversion of foreign currency denominated financial statements of certain subsidiaries into the Philippine pesos, the Group’s presentation currency. The P575.4 million translation loss end-balance represented the strengthening of the Philippine pesos during the period.

AGI
17-Q
2011JUN -11 -
Revaluation reserves represent cumulative changes in unrealized gain or loss in fair value of available-for-sale financial assets. The P165.3 million end-balance is the excess in market values of these financial assets over their costs. The consolidated balance sheets showed strong liquidity. Current assets as of beginning and end of the period totaled P91.4 billion and P136.2 billion, respectively, while current liabilities for the same periods remained low at P26.4 billion and P37.4 billion, respectively. Current ratios were at 3.5:1 and 3.6:1 as of the start and end of the current period, respectively. Liabilities-to-equity ratios remained low at 0.79:1 and 0.75:1 at beginning and end of the period, respectively, while interest-bearing-debt-to-controlling equity ratios were 0.69:1 and 0.63:1 at the beginning and end of the period. The Group’s net cash position will provide the financial muscle to pursue its strategic activities.
(In Billions) June 30, 2011
December 31, 2010
Cash and equivalents 64.69 47.26 Interest-bearing debt [bonds included] 47.11 40.15 Net cash 17.58 7.11 Cash and cash equivalents to interest-bearing debt 137%
118%
Interest-bearing debt to controlling equity 63%
69%
Prospects for the future AGI remains focused on its business programs. AGI is committed to face challenges head-on and, with its track record, proves to be resilient. Management will continue to adopt prudent measures to ensure financial sustainability and look for new opportunities that will enhance the overall profitability of the group while maintaining established markets. The healthy cash position will buoy us up. Others
There were no other known material events subsequent to the end of the interim period that would have a material impact in the interim period. There are no other known trends or demands, commitments, events or uncertainties that will result in or that are reasonably likely to result in the Company’s liquidity increasing or decreasing in any material way. The Company does not have nor anticipate having any cash flow or liquidity problems within the year. AGI and its subsidiaries are not in default or breach of any note, loan, lease or other indebtedness or financing arrangement requiring it to make payments.

AGI
17-Q
2011JUN -12 -
There are no other known events that will trigger direct or contingent financial obligation that is currently considered material to the Company, including any default or acceleration of an obligation. There are no other material off-balance sheet transactions, arrangements, obligations, and other relationships with unconsolidated entities or other persons created during the reporting period. There are no other known trends, events or uncertainties that have had or that are reasonably expected to have a material favorable or unfavorable impact on net sales or revenues or income from continuing operations. There are also no known events that will cause material change in the relationship between costs and revenues. There are no other significant elements of income or loss that did not arise from continuing operations. The business has no seasonal aspects that had a material effect on the financial condition and results of operations of the Group.
SIGNATURE
Pursuant to the requirements of Securities Regulation Code, the issuer has duly caused this report to be signed on its behalf by the undersigned, thereunto duly authorized.
Alliance Global Group, Inc. Issuer
By:
DINA D.R. INTING
First Vice President for Finance & Corporate Information Officer & Duly Authorized Officer August 15, 2011

AGI
JUNE 30, DECEMBER 31,2011 2010
(UNAUDITED) (AUDITED)
A S S E T S
CURRENT ASSETSCash and cash equivalents 64,688,964,657 P 47,264,487,187 P Trade and other receivables - net 27,976,749,870 17,533,261,797 Financial assets at fair value through profit or loss 9,706,800,130 13,705,592,182 Inventories - net 14,597,251,657 8,124,448,257 Property development costs 16,945,001,446 3,798,108,537 Other current assets 2,305,509,248 986,661,326
Total Current Assets 136,220,277,008 91,412,559,286
NON-CURRENT ASSETSTrade and other receivables 18,967,449,556 15,687,307,294 Available-for-sale financial assets 1,129,990,812 1,609,030,965 Advances to landowners and joint ventures 4,583,574,159 2,708,026,497 Land for future development 8,080,545,449 1,482,561,015 Investments in and advances to associates and
other related parties 19,196,334,312 23,821,886,376 Property, plant and equipment - net 6,089,409,199 5,128,522,733 Investment property - net 10,671,317,515 9,976,978,748 Intangible assets - net 11,312,099,218 11,290,486,753 Deferred tax assets 706,545,968 310,119,631 Other non-current assets - net 927,474,390 813,465,175
Total Non-current Assets 81,664,740,578 72,828,385,187
TOTAL ASSETS 217,885,017,586 P 164,240,944,473 P
(Amounts in Philippine Pesos)JUNE 30, 2011 AND DECEMBER 31, 2010
CONSOLIDATED STATEMENTS OF FINANCIAL POSITIONALLIANCE GLOBAL GROUP, INC. AND SUBSIDIARIES
17-Q2011JUN -13 -

AGI
JUNE 30, DECEMBER 31,2011 2010
(UNAUDITED) (AUDITED)
LIABILITIES AND EQUITY
CURRENT LIABILITIESInterest-bearing loans and borrowings 1,561,187,305 P 1,586,752,515 P Bonds payable 3,385,626,240 3,416,062,159 Trade and other payables 17,066,916,980 12,372,689,846 Customers' deposits 3,894,688,334 1,020,277,628 Income tax payable 238,683,511 364,251,263 Reserve for property development 4,477,474,215 3,640,068,354 Deferred income on real estate sales 3,905,612,312 2,220,540,650 Other current liabilities 2,828,513,693 1,827,830,542
Total Current Liabilities 37,358,702,590 26,448,472,957
NON-CURRENT LIABILITIESInterest-bearing loans and borrowings 7,264,755,620 8,580,458,712 Bonds payable 34,897,660,610 26,571,051,933 Customers' deposits 1,315,770,309 1,201,422,709 Advances from related parties 170,682,733 338,605,308 Retirement benefit obligation 479,031,077 383,657,948 Reserve for property development 2,941,841,165 2,487,557,735 Deferred tax liabilities 5,286,940,710 3,314,202,355 Redeemable preferred shares 393,916,526 371,866,226 Deferred income on real estate sales 1,586,214,458 1,588,240,851 Other non-current liabilities 1,618,792,016 1,241,505,132
Total Non-current Liabilities 55,955,605,224 46,078,568,909
Total Liabilities 93,314,307,814 72,527,041,866
EQUITYEquity attributable to owners of the parent company:
Capital stock 10,269,827,979 10,269,827,979 Additional paid-in capital 33,545,877,692 27,175,173,772 Treasury shares 1,351,073,567 )( 3,194,861,260 )( Revaluation reserves 165,271,195 61,488,392 )( Accumulated translation adjustments 575,360,593 )( 530,783,788 )( Dilution gain 1,196,566,827 1,196,566,827 Retained earnings 31,454,856,034 23,393,036,949
74,705,965,567 58,247,472,087
Non-controlling interest 49,864,744,205 33,466,430,520
Total Equity 124,570,709,772 91,713,902,607
TOTAL LIABILITIES AND EQUITY 217,885,017,586 P 164,240,944,473 P
- 2 -
17-Q2011JUN -14 -

AGI
Year-to-Date Quarter Year-to-Date Quarter
REVENUESSale of goods 12,770,642,133 P 6,783,634,461 P 8,832,934,725 P 4,525,714,681 P Real estate sales 8,640,475,841 5,144,958,196 6,100,740,837 2,993,600,116 Income from acquisition of subsidiary 3,345,241,051 - - Finance and other income 3,280,606,998 1,780,381,874 2,713,398,633 1,308,349,826 Rendering of services 2,252,379,400 1,127,878,050 1,792,355,063 979,627,898 Realized gross profit on prior years' real estate sales 1,522,172,459 727,496,398 714,854,272 317,595,731 Share in net profits of associates
and joint ventures - net 1,208,083,112 672,328,008 656,015,624 378,589,289 Interest income on real estate sales 573,007,022 336,825,069 449,998,519 256,495,962
33,592,608,016 16,573,502,056 21,260,297,673 10,759,973,503
COSTS AND EXPENSESCost of goods sold 9,576,711,632 5,165,532,661 6,460,250,609 3,315,804,391 Cost of real estate sales 5,370,510,515 3,195,792,436 4,016,374,964 2,039,014,433 General and administrative expenses 2,106,935,450 1,173,580,764 1,377,343,975 680,720,982 Deferred gross profit on real estate sales 1,916,484,734 833,673,080 914,090,734 431,176,429 Selling expenses 1,799,992,584 990,940,339 1,016,719,134 524,572,915 Finance costs and other charges 1,347,139,016 742,138,357 1,084,375,003 371,986,571 Cost of services 383,725,723 211,780,802 382,488,455 212,495,098
22,501,499,654 12,313,438,439 15,251,642,874 7,575,770,819
PROFIT BEFORE TAX AND 11,091,108,362 4,260,063,617 6,008,654,799 3,184,202,684 PREACQUISITION INCOME
TAX EXPENSE 1,436,947,823 797,848,153 1,184,152,433 577,768,884
NET PROFIT BEFORE PREACQUISITION INCOME 9,654,160,539 3,462,215,464 4,824,502,366 2,606,433,800
PREACQUISITION INCOME 6,133,073 6,133,073 - -
NET PROFIT 9,648,027,466 3,456,082,391 4,824,502,366 2,606,433,800
OTHER COMPREHENSIVE INCOME
Net unrealized fair value gains on
available-for-sale financial assets 226,759,586 351,555,420 47,847,241 (184,102,887)
Translation adjustments 44,576,805 )( 11,055 (38,677,811) 101,151,602
182,182,781 351,566,475 9,169,430 82,951,285 )(
TOTAL COMPREHENSIVE INCOME 9,836,343,320 P 3,813,781,939 P 4,833,671,796 P 2,523,482,515 P
ALLIANCE GLOBAL GROUP, INC. AND SUBSIDIARIES
2011 2010
(UNAUDITED)(Amounts in Philippine Pesos)
FOR THE PERIODS SIX MONTHS JUNE 30, 2011 AND 2010CONSOLIDATED STATEMENTS OF COMPREHENSIVE INCOME
17-Q2011JUN - 15 -
AGI
Year-to-Date Quarter Year-to-Date Quarter2011 2010
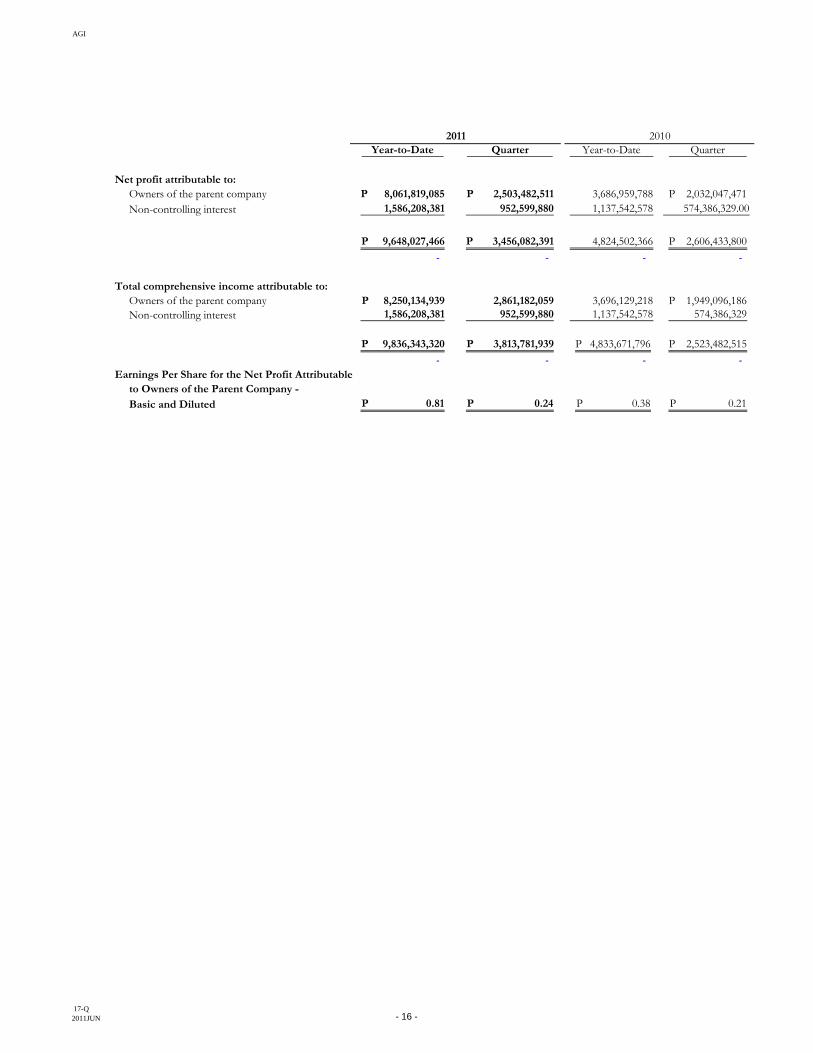
Net profit attributable to:Owners of the parent company 8,061,819,085 P 2,503,482,511 P 3,686,959,788 2,032,047,471 P Non-controlling interest 1,586,208,381 952,599,880 1,137,542,578 574,386,329.00
9,648,027,466 P 3,456,082,391 P 4,824,502,366 2,606,433,800 P - - - -
Total comprehensive income attributable to:Owners of the parent company 8,250,134,939 P 2,861,182,059 3,696,129,218 1,949,096,186 P Non-controlling interest 1,586,208,381 952,599,880 1,137,542,578 574,386,329
9,836,343,320 P 3,813,781,939 P 4,833,671,796 P 2,523,482,515 P - - - -
Earnings Per Share for the Net Profit Attributableto Owners of the Parent Company - Basic and Diluted 0.81 P 0.24 P 0.38 P 0.21 P
17-Q2011JUN - 16 -

AGI
2011 2010
EQUITY ATTRIBUTABLE TO OWNERSOF THE PARENT COMPANY
Capital Stock 10,269,827,979 P 10,269,827,979 P
Additional Paid-in CapitalBalance at beginning of period 27,175,173,772 27,157,647,455 Sale of treasury shares 6,370,703,920 -
Balance at end of period 33,545,877,692 27,157,647,455
Treasury Shares - at costBalance at beginning of period 3,194,861,260 )( 4,334,613,117 )( Net sale (purchase) of treasury shares 1,843,787,693 -
Balance at end of period 1,351,073,567 )( 4,334,613,117 )(
Revaluation ReservesBalance at beginning of period 61,488,392 )( 29,487,721 Net unrealized fair value gains on
available-for-sale financial assets 226,759,587 5,011,032 )(
Balance at end of period 165,271,195 24,476,689
Accumulated Translation Adjustments
Balance at beginning of period 530,783,788 )( 73,570,226 )( Currency translation adjustments during the period 44,576,805 )( 14,180,462
Balance at end of period 575,360,593 )( 59,389,764 )(
Balance carried forward 42,054,542,706 P 33,057,949,242 P
ALLIANCE GLOBAL GROUP, INC. AND SUBSIDIARIES
(UNAUDITED)
(Amounts in Philippine Pesos)FOR THE SIX MONTHS ENDED JUNE 30, 2011 AND 2010
CONSOLIDATED STATEMENTS OF CHANGES IN EQUITY
17-Q2011JUN - 17 -

AGI
2011 2010
Balance brought forward 42,054,542,706 P 33,057,949,242 P
Dilution Gain 1,196,566,827 1,196,566,827
Retained EarningsAppropriated for capital expenditures 446,297,286 446,297,286
UnappropriatedBalance at beginning of period 22,946,739,663 16,613,195,605 Net profit for the period 8,061,819,085 3,686,959,788 Cash dividends declared during the period - 583,183,679 )(
Balance at end of period 31,008,558,748 19,716,971,714
Total Retained Earnings 31,454,856,034 20,163,269,000
Total 74,705,965,567 54,417,785,069
NON-CONTROLLING INTEREST
Balance at beginning of period 33,466,430,520 30,796,066,359 Non-controlling interest in additional investments 15,322,331,435 - Share in consolidated net profits 1,586,208,381 1,137,542,578 Dividend from investee 510,226,131 )( 480,700,059 )(
Balance at end of period 49,864,744,205 31,452,908,878
TOTAL EQUITY 124,570,709,772 P 85,870,693,947 P
- 2 -
17-Q2011JUN - 18 -

AGI
2011 2010
CASH FLOWS FROM OPERATING ACTIVITIESProfit before tax and preacquisition income 11,091,108,362 P 6,008,654,799 P Adjustments for:
Income from acquisition of subsidiary 3,345,241,051 )( - Interest income 1,561,856,585 )( 597,747,048 )( Interest expense 1,347,139,016 363,905,787 Share in net profits of associates
and a joint venture 1,208,083,112 )( 656,015,624 )( Depreciation and amortization 613,462,545 529,397,022 Amortization of trademarks 50,628,638 50,628,638 Fair value losses (gains) - net 36,926,931 )( 695,464,372 Unrealized foreign currency losses - net 6,622,762 5,447,967 Dividend income 6,227,542 )( 33,812,236 )( Impairment losses 1,036,028 )( 3,000,000
Operating income before working capital changes 6,949,590,074 6,368,923,677 Increase in trade and other receivables 4,419,778,642 )( 1,597,877,118 )( Decrease in financial assets
at fair value through profit or loss 4,031,991,401 840,543,752 Decrease (increase) in inventories 197,407,652 619,467,808 )( Decrease in property development costs 1,264,241,304 471,796,415 Increase in other current assets 276,879,680 )( 34,496,847 )( Increase (decrease) in trade and other payables 1,284,352,509 528,445,764 )( Decrease in reserve for property development 141,481,887 )( 313,026,610 )( Increase in deferred income on real estate sales 257,586,167 199,236,462 Increase (decrease) in customers' deposits 59,848,485 9,542,346 )( Increase (decrease) in retirement benefit obligations 15,704,182 )( 15,941,551 Increase (decrease) in other liabilities 447,761,373 )( 395,255,164
Cash generated from operations 8,743,411,829 5,188,840,528 Cash paid for taxes 995,023,156 )( 762,282,908 )(
Net Cash From Operating Activities 7,748,388,673 4,426,557,620
Balance carried forward 7,748,388,673 P 4,426,557,620 P
ALLIANCE GLOBAL GROUP, INC. AND SUBSIDIARIESCONSOLIDATED STATEMENTS OF CASH FLOWS
FOR THE SIX MONTHS ENDED JUNE 30, 2011 AND 2010(Amounts in Philippine Pesos)
(UNAUDITED)
17-Q2011JUN -19 -

AGI
2011 2010
Balance brought forward 7,748,388,673 P 4,426,557,620 P
CASH FLOWS FROM INVESTING ACTIVITIESInterest received 1,535,964,213 625,469,962 Reductions (additions) to:
Investments in and advances to associatesand other related parties 3,705,884,563 )( 840,820,668 )(
Property, plant and equipment and investment property 1,282,303,308 )( 518,281,532 )(
Land for future development 1,068,926,926 )( - Advances to landowners and joint ventures 226,559,597 )( 1,500,000,000 )( Available-for-sale financial assets 711,286,730 45,328,382 Other non-current assets 10,941,282 9,561,867 )(
Cash dividends received 6,227,542 33,812,236 Proceeds from sale of property, plant and equipment 3,510,599 277,754,440
Net Cash Used in Investing Activities 4,015,744,029 )( 1,886,299,047 )(
CASH FLOWS FROM FINANCING ACTIVITIESNet sale of treasury shares 8,214,491,613 - Net increase in interest-bearing loans
and borrowings 6,183,146,810 754,925,483 Net increase (decrease) in advances from related parties 1,148,152,171 )( 67,963,514 Interest paid 1,782,758,257 )( 775,713,603 )(
Net Cash From Financing Activities 11,466,727,995 47,175,394
NET INCREASE IN CASH AND CASH EQUIVALENTS 15,199,372,639 2,587,433,967
CASH AND CASH EQUIVALENTS AT BEGINNING OF PERIOD 47,264,487,187 31,145,329,040
BEGINNING BALANCE OF CASH AND CASHEQUIVALENTS OF ACQUIRED SUBSIDIARIES 2,225,104,831 -
CASH AND CASH EQUIVALENTS
AT END OF PERIOD 64,688,964,657 P 33,732,763,007 P
-2-
17-Q2011JUN -20 -
AGI
17-Q/A 2011JUN - 21 -
ALLIANCE GLOBAL GROUP, INC. AND SUBSIDIARIES NOTES TO INTERIM CONSOLIDATED FINANCIAL STATEMENTS
JUNE 30, 2011 AND 2010 (With Comparative Figures for December 31, 2010)
(Amounts in Philippine Pesos) (UNAUDITED)
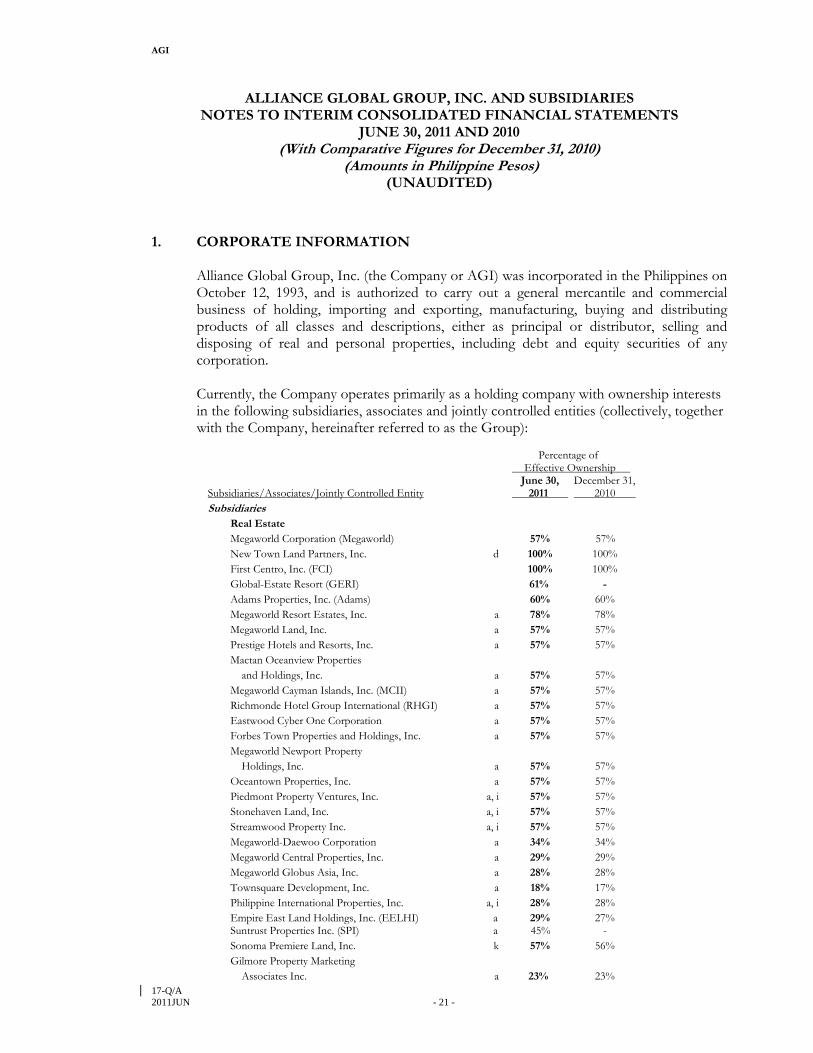
1. CORPORATE INFORMATION
Alliance Global Group, Inc. (the Company or AGI) was incorporated in the Philippines on October 12, 1993, and is authorized to carry out a general mercantile and commercial business of holding, importing and exporting, manufacturing, buying and distributing products of all classes and descriptions, either as principal or distributor, selling and disposing of real and personal properties, including debt and equity securities of any corporation. Currently, the Company operates primarily as a holding company with ownership interests in the following subsidiaries, associates and jointly controlled entities (collectively, together with the Company, hereinafter referred to as the Group):
Percentage of Effective Ownership June 30, December 31, Subsidiaries/Associates/Jointly Controlled Entity 2011 2010
Subsidiaries Real Estate Megaworld Corporation (Megaworld) 57% 57% New Town Land Partners, Inc. d 100% 100% First Centro, Inc. (FCI) 100% 100%
Global-Estate Resort (GERI) 61% - Adams Properties, Inc. (Adams) 60% 60%
Megaworld Resort Estates, Inc. a 78% 78% Megaworld Land, Inc. a 57% 57% Prestige Hotels and Resorts, Inc. a 57% 57% Mactan Oceanview Properties and Holdings, Inc. a 57% 57% Megaworld Cayman Islands, Inc. (MCII) a 57% 57% Richmonde Hotel Group International (RHGI) a 57% 57% Eastwood Cyber One Corporation a 57% 57% Forbes Town Properties and Holdings, Inc. a 57% 57% Megaworld Newport Property Holdings, Inc. a 57% 57% Oceantown Properties, Inc. a 57% 57% Piedmont Property Ventures, Inc. a, i 57% 57% Stonehaven Land, Inc. a, i 57% 57% Streamwood Property Inc. a, i 57% 57% Megaworld-Daewoo Corporation a 34% 34% Megaworld Central Properties, Inc. a 29% 29% Megaworld Globus Asia, Inc. a 28% 28% Townsquare Development, Inc. a 18% 17% Philippine International Properties, Inc. a, i 28% 28%
Empire East Land Holdings, Inc. (EELHI) a 29% 27% Suntrust Properties Inc. (SPI) a 45% -
Sonoma Premiere Land, Inc. k 57% 56% Gilmore Property Marketing Associates Inc. a 23% 23%

AGI
17-Q/A 2011JUN - 22 -
Percentage of Effective Ownership June 30, December 31,
Subsidiaries/Associates/Jointly Controlled Entity 2011 2010 Subsidiaries Real Estate
Oceanic Realty Group International, Inc. b 100% 100% ERA Real Estate Exchange, Inc. b 100% 100%
First Oceanic Property Management, Inc. b 100% 100% Citylink Coach Services, Inc. b 100% 100% Fil-Estate Properties Inc. c 61% - Aklan Holdings Corporation c 61% - Blue Sky Airways, Inc. c, j 61% - Fil-Estate Industrial Park, Inc. c, i 48% -
Fil-Estate Subic Development Corporation c, i 61% - Fil-Power Concrete Blocks Corporation c, i 61% - Fil-Power Construction Equipment c 61% -
Leasing Corporation c 61% - Golden Sun Airways, Inc. c, j 61% - La Compaña De Sta. Barbara, Inc. c 61% - MCX Corporation c 61% - Pioneer L-5 Realty Corporation c 61% - Prime Airways, Inc. c, j 61% - Sherwood Hills Development, Inc. c 33% - Sto. Domingo Place Development Corporation c 61% - Fil-Estate Golf and Development, Inc. c 61% - Golforce, Inc. c 61% - Fil-Estate Ecocentrum Corporation c 34% - Philippine Aquatic Leisure Corporation c, j 61% - Novo Sierra Holdings c 61% - Fil-Estate Urban Development Corporation c 61% - Twin Lakes Corporation c 60% - Megaworld Global-Estate Inc. c 37% -
Food and Beverage Emperador Distillers, Inc. (EDI) 100% 100%
Anglo Watsons Glass, Inc. (AWGI) 100% 100% Tradewind Estates, Inc. (TEI) d 100% 100% Great American Foods, Inc. (GAFI) e 100% 100% McKester America, Inc. (MAI) e 100% 100% The Bar Beverage, Inc. (TBBI) f, i 100% 100% Quick Service Restaurant Golden Arches Development Corporation (GADC) 49% 49% Golden Arches Realty Corporation (GARC) 49% 49% Clark Mac Enterprises, Inc. g 49% 49% Advance Foods Concepts Manufacturing, Inc. g 37% 37% Davao City Food Industries, Inc. g 37% 37% Golden Laoag Foods Corporation g 38% 38% First Golden Laoag Ventures g 34% 34% Retiro Golden Foods, Inc. g 34% 34% Corporate and Others Alliance Global Brands, Inc. j 100% 100% Mckester Pik-nik International Limited (MPIL) d 100% 100% Emperador International Ltd. (EIL) f 100% 100% Venezia Universal Ltd. (Venezia) 100% 100% Travellers Group, Ltd. (TGL) 100% 100% Alliance Global Group Cayman Islands, Inc (AG Cayman) 100% 100%
AGI
17-Q/A 2011JUN - 23 -
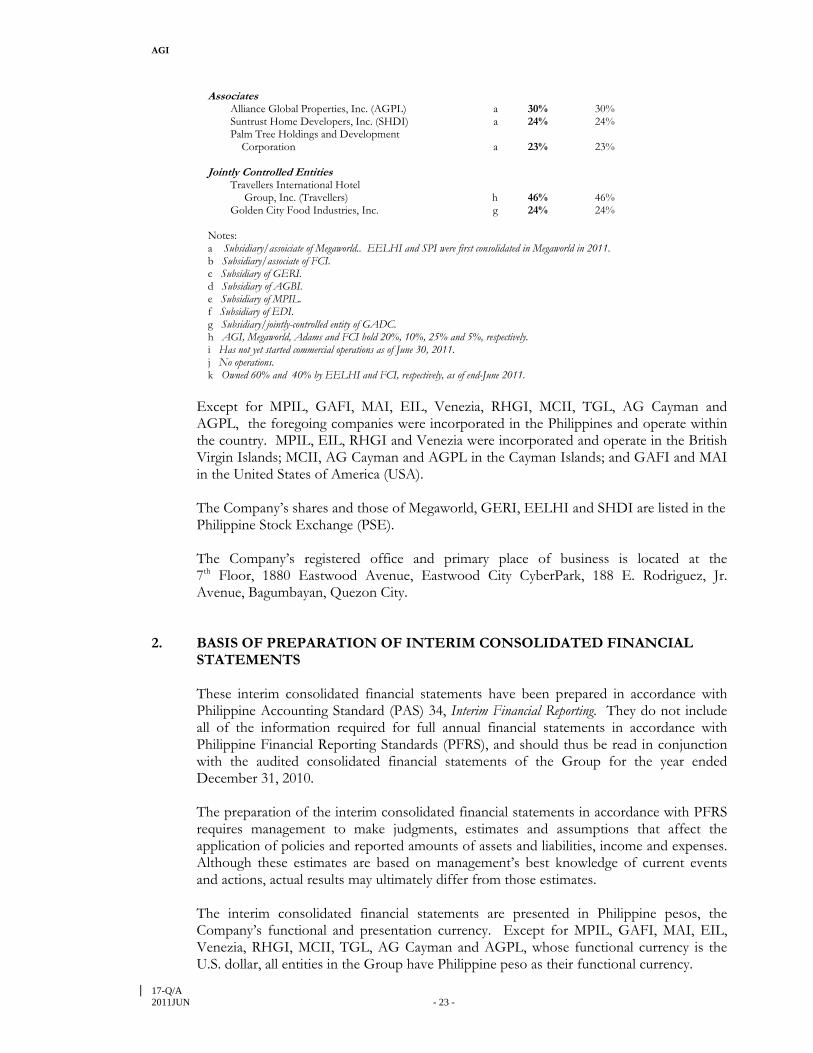
Associates Alliance Global Properties, Inc. (AGPL) a 30% 30% Suntrust Home Developers, Inc. (SHDI) a 24% 24% Palm Tree Holdings and Development Corporation a 23% 23% Jointly Controlled Entities Travellers International Hotel Group, Inc. (Travellers) h 46% 46% Golden City Food Industries, Inc. g 24% 24% Notes:
a Subsidiary/assoiciate of Megaworld.. EELHI and SPI were first consolidated in Megaworld in 2011. b Subsidiary/associate of FCI. c Subsidiary of GERI. d Subsidiary of AGBI. e Subsidiary of MPIL. f Subsidiary of EDI. g Subsidiary/jointly-controlled entity of GADC. h AGI, Megaworld, Adams and FCI hold 20%, 10%, 25% and 5%, respectively. i Has not yet started commercial operations as of June 30, 2011. j No operations. k Owned 60% and 40% by EELHI and FCI, respectively, as of end-June 2011.
Except for MPIL, GAFI, MAI, EIL, Venezia, RHGI, MCII, TGL, AG Cayman and AGPL, the foregoing companies were incorporated in the Philippines and operate within the country. MPIL, EIL, RHGI and Venezia were incorporated and operate in the British Virgin Islands; MCII, AG Cayman and AGPL in the Cayman Islands; and GAFI and MAI in the United States of America (USA). The Company’s shares and those of Megaworld, GERI, EELHI and SHDI are listed in the Philippine Stock Exchange (PSE). The Company’s registered office and primary place of business is located at the 7th Floor, 1880 Eastwood Avenue, Eastwood City CyberPark, 188 E. Rodriguez, Jr. Avenue, Bagumbayan, Quezon City.
2. BASIS OF PREPARATION OF INTERIM CONSOLIDATED FINANCIAL
STATEMENTS
These interim consolidated financial statements have been prepared in accordance with Philippine Accounting Standard (PAS) 34, Interim Financial Reporting. They do not include all of the information required for full annual financial statements in accordance with Philippine Financial Reporting Standards (PFRS), and should thus be read in conjunction with the audited consolidated financial statements of the Group for the year ended December 31, 2010. The preparation of the interim consolidated financial statements in accordance with PFRS requires management to make judgments, estimates and assumptions that affect the application of policies and reported amounts of assets and liabilities, income and expenses. Although these estimates are based on management’s best knowledge of current events and actions, actual results may ultimately differ from those estimates. The interim consolidated financial statements are presented in Philippine pesos, the Company’s functional and presentation currency. Except for MPIL, GAFI, MAI, EIL, Venezia, RHGI, MCII, TGL, AG Cayman and AGPL, whose functional currency is the U.S. dollar, all entities in the Group have Philippine peso as their functional currency.

AGI
17-Q/A 2011JUN - 24 -
3. ACCOUNTING POLICIES
The significant accounting policies used in these interim consolidated financial statements are consistent with those applied in the Group’s annual consolidated statements as of and for the year ended December 31, 2010. In 2011, the Group adopted the following amendments, interpretations and improvements to existing standards that are relevant to the Group and effective for the period beginning on or after January 1, 2011:
(i) PAS 24 (Revised), Related Party Disclosures. The revised standard clarifies and
simplifies the definition of a related party and removes the requirement for government-related entities to disclose details of all transactions with the government and other government-related entities. Management has determined that this amendment did not materially affect the Group’s interim financial statements.
(ii) Philippine Interpretation IFRIC 14 (Amendment), Prepayments of a Minimum Funding
Requirement. This interpretation addresses unintended consequences that can arise from the previous requirements when an entity prepays future contributions into a defined benefit pension plan. It sets out guidance on when an entity recognizes an asset in relation to a PAS 19, Employee Benefits, surplus for defined benefit plans that are subject to a minimum funding requirement. The amendment did not have a material effect on the Group’s interim financial statements because it does not usually make substantial advance contributions to its retirement fund.
(iii) Philippine Interpretation IFRIC 19, Extinguishing Financial Liabilities with Equity
Instruments. It addresses accounting by an entity when the terms of a financial liability are renegotiated and result in the entity issuing equity instruments to a creditor to extinguish all or part of the financial liability. These transactions are sometimes referred to as “debt for equity” exchanges or swaps, and have happened with increased regularity during the financial crisis. The interpretation requires the debtor to account for a financial liability which is extinguished by equity instruments as follows:
the issue of equity instruments to a creditor to extinguish all or part of a financial
liability is consideration paid in accordance with PAS 39;
the entity measures the equity instruments issued at fair value, unless this cannot be reliably measured;
if the fair value of the equity instruments cannot be reliably measured, then the fair value of the financial liability extinguished is used; and,
the difference between the carrying amount of the financial liability extinguished
and the consideration paid is recognized in profit or loss. Management has determined that this interpretation did not have a material effect on the Group’s interim financial statements as management does not intend to extinguish in the subsequent periods financial liabilities through equity swap.

AGI
17-Q/A 2011JUN - 25 -
(iv) 2010 Annual Improvements to PFRS. The FRSC has adopted the Improvements to PFRS 2010 (the 2010 Improvements). Most of these amendments became effective for annual periods beginning on or after July 1, 2010, or January 1, 2011. The 2010 Improvements amend certain provisions of PFRS 3 (Revised 2008), clarify presentation of the reconciliation of each of the components of other comprehensive income and clarify certain disclosure requirements for financial instruments. The 2010 Improvements did not have a material impact on the Group’s interim consolidated financial statements.
The Group has decided not to early adopt any PFRS including PFRS 9, Financial Instruments (effective from January 1, 2013), for its 2011 financial reporting and therefore, the interim consolidated financial statements do not reflect the impact of the said standard. Also, management is yet to assess the impact that this standard is likely to have on the consolidated financial statements of the Group. However, it does not expect to implement the amendments until 2013 when all chapters of the PAS 39 replacement have been published at which time the Group expects it can comprehensively assess the impact of the revised standard The policies have been consistently applied to all periods presented, unless otherwise stated.
4. SEGMENT INFORMATION
4.1 Business Segments
The Group is organized into three major business segments, namely food and beverage, real estate, and quick service restaurant. Entities not classified under the three main business segments are retained as part of corporate and investments. Presented below is the basis of the Group in reporting its primary segment information. (a) The Food and Beverage segment includes the manufacture and distribution of distilled
spirits, glass containers and potato snacks products. (b) The Real Estate segment is engaged in the development of real estate, leasing of
properties, hotel operations and tourism-oriented businesses.
(c) The Quick Service Restaurant includes operations of McDonald’s restaurants in the Philippines in accordance with the franchise agreement with McDonald’s Corporation, USA.
4.2 Segment Assets and Liabilities
Segment assets include all operating assets used by a segment and consist principally of operating cash and cash equivalents, trade and other receivables, inventories, property, plant and equipment, intangible assets and investment property. Segment liabilities include all operating liabilities and consist principally of trade and other payables, interest-bearing loans and borrowings, customers’ deposits and bonds payable.

AGI
17-Q/A 2011JUN - 26 -
4.3 Intersegment Transactions
Segment revenues, expenses and performance include sales and purchases between business segments. Such sales and purchases are eliminated in consolidation.
The following tables present revenue and profit information regarding business segments for the periods ended June 30, 2011 and 2010 and total assets and liabilities information regarding segments as at June 30, 2011 and December 31, 2010 (amounts in millions).
2011
Quick Service Food and Real Corporate Restaurant Beverage Estate and Others Eliminations Consolidated
TOTAL REVENUES Sales to external customers P 5,590 P 7,552 P 12,616 P - P - P 25,758
Intersegment sales - 471 - 4 ( 475 ) -
Finance and other income
Interest income 18 53 746 745 - 1,562
Foreign currency gains 7 248 82 777 - 1,114
Other income (loss) 78 ( 30) 490 3,412 - 3,950
Share in net profits of associates
and joint venture 1 - 1,208 - - 1,209
Total revenues P 5,694 P 8,294 P 15,142 P 4,938 (P 475 ) P 33,593
Total revenues after intersegment P 5,694 P 7,823 P 15,142 P 4,934 P 33,593
RESULTS
Segment results P 476 P 1,363 P 5,675 P 4,924 P 12,438
Finance costs and other charges ( 53) - ( 501) ( 793) ( 1,347)
Preacquisition income - - ( 6) - ( 6)
Profit before tax 423 1,363 5,168 4,131 11,085
Tax expense ( 132) ( 329) ( 951) ( 25 ) ( 1,437)
Net profit P 291 P 1,034 P 4,217 P 4,106 P 9,648
SEGMENT ASSETS AND
LIABILITIES
Total assets P 7,764 P 7,857 P 154,821 P 47,443 P 217,885
Total liabilities P 4,145 P 1,476 P 62,263 P 25,430 P 93,314
OTHER SEGMENT
INFORMATION
Capital expenditures P 538 P 38 P 706 P - P 1,282
Depreciation and amortization 251 85 277 - 613

AGI
17-Q/A 2011JUN - 27 -
2010 Quick Service Food and Real Corporate Resraurant Beverage Estate and Others Eliminations Consolidated
TOTAL REVENUES Sales to external customers P 5,148 P 4,025 P 8,717 P 4 P - P 17,894
Intersegment sales - 331 1 4 ( 336 ) -
Finance and other income
Foreign currency gains (losses) ( 1) - - 1,916 - 1,915
Interest income 18 12 379 189 - 598
Other income (losses) 72 - 66 59 - 197
Share in net profits of associates
and joint venture 1 - 655 - - 656
Total revenues P 5,238 P 4,368 P 9,818 P 2,172 (P 336 ) P 21,260
Total revenues after intersegment P 5,238 P 4,037 P 9,817 P 2,168 P 21,260
RESULTS
Segment results P 518 P 588 P 3,844 P 2,144 P 7,094
Finance costs and other charges
Fair value gains (losses) - - - ( 695) ( 695)
Finance costs ( 50) - ( 287) ( 27) ( 364)
Other charges - - ( 18) ( 7) ( 25)
Profit before tax 468 588 3,539 1,415 6,010
Tax expense ( 159) ( 177) ( 830) ( 18 ) ( 1,184)
Net profit P 309 P 411 P 2,709 P 1,396 P 4,825
SEGMENT ASSETS AND
LIABILITIES – Dec 31, 2010
Total assets P 8,001 P 6,561 P 109,056 P 40,623 P 164,241
Total liabilities P 4,173 P 2,005 P 38,425 P 27,925 P 72,527
OTHER SEGMENT
INFORMATION
Capital expenditures P 219 P 13 P 368 P - P 600
Depreciat ion and amortization 208 108 213 - 529
5. EARNINGS PER SHARE
Basic and diluted EPS as of June 30, 2011 and 2010 were computed as follows:
2011 2010 Net profit attributable to owners of the parent company P 8,061,819,085 P 3,686,959,788 Divided by the weighted average number of subscribed and outstanding common shares 9,971,983,780 9,719,727,979 P P 0.8084 P 0.3793
There were no dilutive potential common shares as of June 30, 2011 and 2010, hence, diluted EPS is equal to the basic EPS.

AGI
17-Q/A 2011JUN - 28 -
6. COMMITMENTS AND CONTINGENCIES
There are other commitments, guarantees and contingent liabilities that arise in the normal course of operations of the Group which are not reflected in the accompanying interim consolidated financial statements. The management of the Group is of the opinion that losses, if any, from these items will not have any material effect on their consolidated interim financial statements. In addition, there are no material off-balance sheet transaction, arrangements, obligations and other relationships of the Group with unconsolidated entities or other persons created during the reporting period.
7. RISK MANAGEMENT OBJECTIVES AND POLICIES
The Group has various financial instruments such as cash and cash equivalents, financial assets at FVTPL, AFS financial assets, interest-bearing loans and borrowings, bonds payable, trade receivables and payables and derivative asset and liabilities which arise directly from the Group’s business operations. The financial debts were issued to raise funds for the Group’s capital expenditures. The Group does not actively engage in the trading of financial assets for speculative purposes.
The Group is exposed to a variety of financial risks in relation to financial instruments. The main types of risks are market risk, credit risk and liquidity risk. 7.1 Market Risk (a) Foreign Currency Sensitivity Most of the Group’s transactions are carried out in Philippine peso, its functional currency. The currency exchange risk arises from the U.S. dollar-denominated cash and cash equivalents, loans and bonds which have been used to fund new projects. Foreign currency denominated financial assets and liabilities, translated into Philippine peso at period-end closing rate are as follows:
June 30, 2011 December 31, 2010 U.S. Dollars Pesos U.S. Dollars Pesos
Financial assets $ 1,054,116,928 P 45,808,563,407 $ 898,537,017 P 39,424,291,079 Financial liabilities ( 803,297,575) ( 34,878,735,039) ( 574,083,347) ( 25,193,647,690)
$250,819,353.00 P 10,929,828,368 $ 324,453,670 P 14,230,643,389
The sensitivity of the consolidated income before tax in regards to the Group’s financial assets and the US dollar – Philippine peso exchange rate assumes +/-14% and +/-14% changes of the Philippine peso/U.S. dollar exchange rate for the six months ended June 30, 2011 and for the year ended December 31, 2010, respectively. These percentages have been determined based on the average market volatility in exchange rates in the previous six months and year, respectively, estimated at 95% level of confidence. The sensitivity analysis is based on the Group’s foreign currency financial instruments held at each reporting periods.

AGI
17-Q/A 2011JUN - 29 -
If the Philippine peso had strengthened against the U.S. dollar, with all other variables held constant, consolidated income before tax would have decreased by P1.5 billion and P2.0 billion for the six months ended June 30, 2011 and for the year ended December 31, 2010, respectively. Conversely, if the Philippine peso had weakened against the U.S. dollar by the same percentage, then consolidated income before tax would have increased by the same amount. The Group periodically reviews the trend of the foreign exchange rates and, as a practical move, increases its U.S. dollar-denominated time deposits in times when the Philippine peso is depreciating or decreases its U.S. dollar-denominated time deposits in times when the Philippine peso is appreciating. Exposures to foreign exchange rates vary during the period depending on the volume of overseas transactions. Nonetheless, the analysis above is considered to be representative of the Group’s currency risk. (b) Interest Rate Sensitivity The Group interest risk management policy is to minimize interest rate cash flow risk exposures to changes in interest rates. At present, the Group is exposed to changes in market interest rates through certain bank borrowings and cash and cash equivalents, which are subject to variable interest rates. The Group maintains a debt portfolio unit of both fixed and floating interest rates. The long-term borrowings are usually at fixed rates. All other financial assets and liabilities are subject to variable interest rates.
The sensitivity of the consolidated income before tax for the period to a reasonably possible change in interest rates of +/-1.76% and +/-0.19% for Philippine peso and US dollar, respectively, for the six months ended June 30, 2011 and +/-1.49% and +/-0.70% for Philippine peso and US dollar, respectively, for the year ended December 31, 2010 with effect from the beginning of the period. These percentages have been determined based on the average market volatility in interest rates, using standard deviation, in the previous periods estimated at 95% level of confidence. All other variables held constant, the consolidated income before tax would have increased by P0.1 billion and P0.6 billion for the period ended June 30, 2011 and for the year ended December 31, 2010, respectively. Conversely, if the interest rates decreased by the same percentage, consolidated income before tax would have been lower by the same amount. 7.2 Credit Risk Generally, the Group’s credit risk is attributable to accounts receivable arising mainly from transactions with approved franchisees, installment receivables, rental receivables and other financial assets. The Group maintains defined credit policies and continuously monitors defaults of customers and other counterparties, identified either individually or by group, and incorporate this information into its credit risk controls. Where available at a reasonable cost, external credit ratings and/or reports on customers and other counterparties are obtained and used. Franchisees are subject to stringent financial, credit and legal verification process. In addition, accounts receivable are monitored on an ongoing basis with the result that the Group’s exposure to bad debts is not significant. The Group’s

AGI
17-Q/A 2011JUN - 30 -
policy is to deal only with creditworthy counterparties. In addition, for a significant portion of sales, advance payments are received to mitigate credit risk. With respect to credit risk arising from the other financial assets of the Group, composed of cash and cash equivalents, the Group’s exposure to credit risk arises from default of the counterparty, with a maximum exposure equal to the carrying amount of these instruments. Trade and other receivables past due but not impaired can be shown as follows:
June 30, 2011 December 31, 2010
Not more than 30 days P 5,129,606,920 P 3,926,830,184 31 to 60 days 2,066,369,699 1,736,931,713 Over 60 days 1,124,819,676 1,102,622,632 P 8,320,796,295 P 6,766,384,529
7.3 Liquidity Risk The Group manages its liquidity needs by carefully monitoring scheduled debt servicing payments for long-term financial liabilities as well as cash outflows due in a day-to-day business. Liquidity needs are monitored in various time bands, on a day-to-day and week-to-week basis, as well as on the basis of a rolling 30-day projection. Long-term liquidity needs for a 6-month and one-year period are identified monthly. The Group’s objective is to maintain a balance between continuity of funding and flexibility through the use of loans, preferred shares and finance leases. The Group maintains cash to meet its liquidity requirements for up to 60-day periods. Excess cash are invested in time deposits, mutual funds or short-term marketable securities. Funding for long-term liquidity needs is additionally secured by an adequate amount of committed credit facilities and the ability to sell long-term financial assets. In addition, the Group regularly evaluates its projected and actual cash flows. It also continuously assesses conditions in the financial markets for opportunities to pursue fund raising activities, in case any requirements arise. Fund raising activities may include bank loans and capital market issues. As at June 30, 2011, the Group’s financial liabilities have contractual maturities which are presented below.
Current Non-current
Within 6 to 12 1 to 5 Later than
6 Months Months Years 5 Years
Trade and other payables P 9,439,771,039 P 7,627,145,941 P - P -
Interest-bearing loans and borrowings 932,023,606 1,430,557,219 6,202,538,863 1,010,512,000
Bonds payable 3,573,822,907 705,737,500 13,326,375,000 30,951,245,555
Derivative liabilities - 70,044,599 - -
Redeemable preferred shares - - - 1,574,159,348
Security deposits 23,473,536 7,704,201 41,977,357 28,671,945
Payable to MRO stock option 3,163,683 - -
Advances from related parties - 170,682,733 -
P 13,972,254,771 P 9,841,189,460 P 19,741,573,953 P 33,564,588,848

AGI
17-Q/A 2011JUN - 31 -
As at December 31, 2010, the Group’s financial liabilities have contractual maturities which are presented below.
Current Non-current
Within 6 to 12 1 to 5 Later than
6 Months Months Years 5 Years
Trade and other payables P 9,991,786,855 P 2,190,224,738 P - P -
Obligation under finance lease - 317,500 - -
Interest-bearing loans and borrowings 696,795,389 4,495,102,540 13,618,728,298 2,051,712,000
Bonds payable 713,212,500 4,129,274,659 12,132,125,000 23,371,425,000
Derivative liabilities - 85,792,964 - -
Redeemable preferred shares - - - 1,574,159,348
Security deposits - 34,811,012 38,914,886 22,258,486
Payable to MRO stock option - 6,302,395 3,132,850 -
Advances from related parties 91,898,094 48,737,051 289,868,257 -
P 11,493,692,838 P 10,990,562,859 P 26,082,769,291 P 27,019,554,834
The contractual maturities reflect the gross cash flows, which may differ from the carrying values of the liabilities at the end of the reporting period.
8. SEASONAL FLUCTUATIONS There were no seasonal aspects that had a material effect on the financial condition or results of operations of the Group.

AGI
Trade Receivables
Current 20,037,199,145 P 1 to 30 days 5,129,606,920.00 31 to 60 days 2,066,369,699.00 Over 60 days 1,124,819,676.00
Total 28,357,995,440.00
Less: Allowance for Impairment 381,245,570.00
Balance at end of period 27,976,749,870 P
(Amounts in Philippine Pesos)
ALLIANCE GLOBAL GROUP, INC. AND SUBSIDIARIESAGING SCHEDULE OF TRADE AND OTHER RECEIVABLES
UNDER CURRENT ASSETSJUNE 30, 2011
-32 -