philippineinstitutefordevelo ent studies w the ... stpjjcturen_d growthofthephilippine...
TRANSCRIPT

PhilippineInstitutefor Develo_ent StudiesWorking Paper 81-06
THE STPJJCTUREN_D GROWTHOF THE PHILIPPINEFINANCIALMARKET AND THE B_4AVIOROF
ITS MAJOR C(lqPONENTS
Edita Abella Tan
June 1981
PhilippineInstitutefor DevelopmentStudies

TABLE OF CORT_S
1 Inzzoduc_ica • I
2 A Model of Financial Market Development 7and the St_ructure ef the F_IXpg_ M_keZ
1. A Model of Financial Develo._ment 7
3 The Growth and Strua_ure of the F/nancial 19Market
1. The Financ/al System 21
2. Bank Performance in Terms of _mter_ 29mediation Rate and Term TmansfozTm%tion
2.I. Term Transfgrraation 32
3. Performance and Struetume of Private 35Cca_ercial Banks
4. Cc_er_zlal Bank Organization 41
5. Cx:)n,i_icmerati_1, 44
4 Portfolio Choice _%_ory 50
2. Indivisibility of Finane/al Assets 60
3. Mamket Information 62
3.!, Savings and Time Deposits 63
3.2. Money Ma_ke_ Papems S!.i.
3.3. ianding Without Reoourse 66
3.4. Coz_ate Stocks 68
3.5. Othem Papers 68

ChapterNumber _ PageNumber
5 The 5_co_ Market 70
Append_ 3.A.i. The V_miance_ 83Covarianoe Matrix
2. The Market Portfolio 85Variance
3. The Cova_iance of the 86Return of an Asset j
with _he Mamket Return _M
4. The Data 86
5. Validation of Data 88
6. The Case of _b TPading 89for a Given _knth
7. The Cases Where Pu_ 89
PL or Both are In_x_ect
8. The C_se of a Stock Split 90
9. Calc_alationsBased on the 81
Canputational Format
6 Efficient Frontiers and Yield-Risk Beh@_ior 98of Fq_dties
I. Efficient Frontiers 94
2. Pal-ternof Security Yield-Risk Behavior IOl
3. Cor_omate Pemformance and _ket Yield 105
7 The t_oneyMarket 116
i. Transactions in the f'_ket 118
2. Some Features of the Money Market 120

Chapter Numb_ Deserivtion Page
3.1. Pisk of Money _,_t Ins_ments 125
3.2. Avemage and Relative Pbney _rket Rates 134
3.3, Data Description 144
8 F/nance Choice 147
i. Theoretical }_amewo_k 147
2. i_az,ket Adjustment 154
3. Sources and Uses of Funds 155
4. Household Saving and Portfolio of Assets 157
4.1. Corporate Sector 163
5. The Basis for Congl_m_?ation 164
6. Other Forms of Influence 167
7. The Relative Cost of Firknnce 167
8. Compo_ate Fin_%ce 1950-/976 170
9 Concluding Remarks 175

LIST OF TABLES
Table Number Description Page Number
3.1 Financial DeveloFnent Indicatc_?s_ 231950-1977
3.2 Total Assets of the Philippine 24Fina%eial System
3.3 Total Real Assets of Selected F/_%m%cial 25Institutions and their Annual Growth Kates
3.4 intermediation Rate of Selected Inter- 30mediaries, 1970-1978 (in %)
3.5 C_edits Granted by Banking Institutions 34by.Maturity and Percentages of TotalCredits Gr_ted
3.6 Assets of Individual Bar_<sand their 36Earrdmgs to Equity Ratio and Assets toEquity I_tio, iST0s
3.7 Percentage _are in Commercial Bank Assets 42of the Largest Private Bar_s _ the PNB _ndthe Foreign Banks_ 1971 m_d 1978-1978
3.8 Nt_er of C_npardes Interlocked with 47Selected CO,hernial Banks_ by Industry,1977
5.1 _hmber of Securities with 14egativeRisk 73
5.2 Results of Regression _lysis, OLS _ of 75the CAH_
5.3 Aver_ Returns and Vamianees of Traded 80Secu_i%ies, 1876-1979
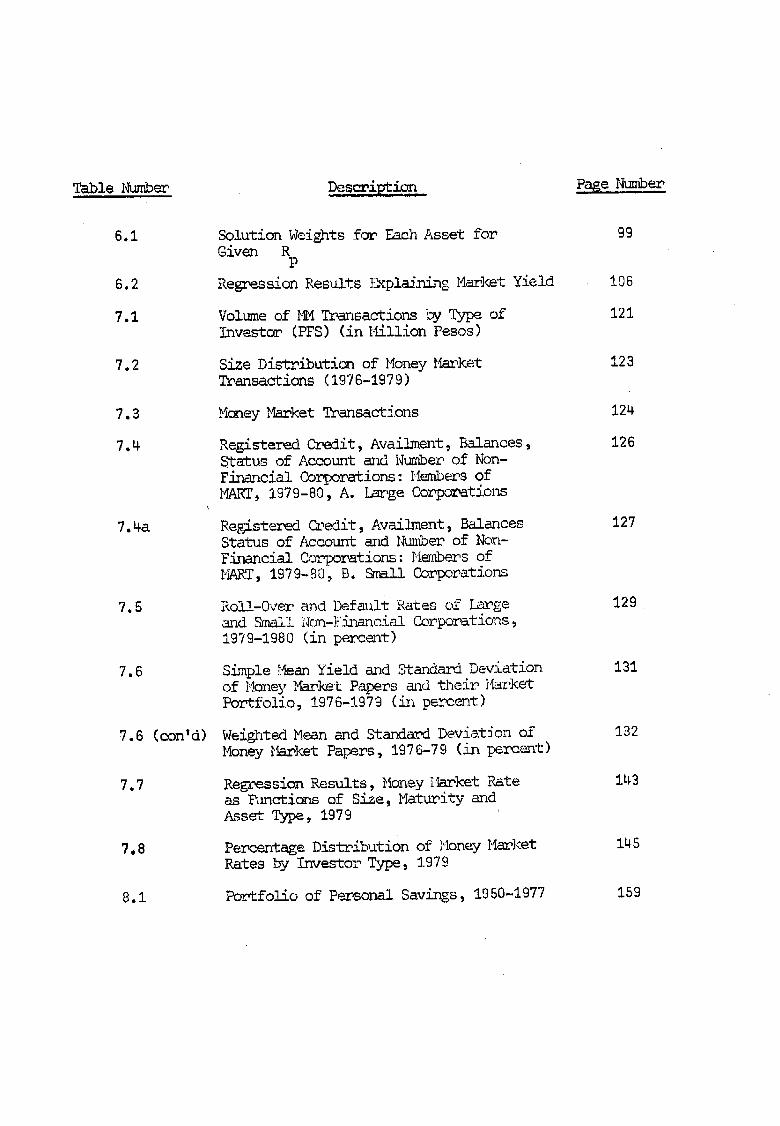
Table I_'_ber Descri_ Page Number
6.I Solution Weights for Each Asset for ggGiven R
P
6.2 Regression Results _Vxpla/nLnZMarket Yield 106
7.1 Volume of _ _k_ansactionsby %_fpeof 121Investgr (PFS) (in l_tillionPesos)
7.2 Size Dist]cibutionof Money _az_ket 123Tmansactions (1978-1979)
7.3 Money _ket Transactions 124
7.4 Registered Credit, Availm_t _ -Balances, 126Status of Account and Number of Non-
Financial Corporations: Members ofI_RT, 1979-80, A. Lar.geCompc_ations
7.4a Rezistered Ck_edit_ Availment, Balances 127Status of Account and _ambe_ of Non-
F_mncial Corporations: _i_abersofY_hRT,1579-80, B. _ll Co_porations
7.5 Roll-0ver and Defall± Rates of "-Large 129and 9hall _bn-Financial Co_poz_tions,1979-1980 (in pea_ce%T)
7.6 Simple Mean Yield and Standard Deviation 131of Honey Market Papers and _eir I'_rkc_Por_folio_ 1976-1979 (in percent)
7.6 (eon'd) Weighted Mean and Standa__dDeviation of 132Money Market Papers, 1976-79 (in percent)
7.7 Rez_ession Results, Money 14arketRate 143as Functions of Size_ Maturity andAsset Type, 1979 ....
7,8 Percentage Distribution of Honey Market 145Rates by I_nvestorType, 1979
8.1 Portfolio of Pa_sor_ulSavings, 1950-1977 159

Table i_nber _ Page Numbel_
8.2 Size Distribution of Savings and Time 161Deposits and Deposit Substitutes, 1977(in percent)
8,2a Percentage Dist_ibution of Corporate 172Sources of Finance, 1951-76
8.3 CozT_rate Source of _s by industry 173Grouping and for Manufacturing,Whether c_ not Registered with theB0t, 1969-1973 (in percent)

TP_ismono_raDh is an a,._emn-tto explain-e_]_epatte_n of development
of the PhilipDine financial _rket. _:is ._..%urkethad a very modest
beyin_imF _n the immediate postwar period consisting only of alx_t seven
conmereia! bed_ks_ three savin_s ba_<s and a sm_l! stock exc.han[,.e.
It ]-_.ssince developed quite rapidly_ though at uneven rates, over the
years and _._ng its najor component institutions. S_ne ._ectors,
[_articulal_lvthe _vrivatecou_o_.._rcia!]x_u_ks,showed _o_eatentr_.preneurial
dyn_mmism. _,_hey_w rapidly, they became very.large banks and their
portfolios bee_._enDr_ di_vel_sified.A number of con_emcJal bar_<s
expanded into eon_loFerate financial companies s_\nDol_tingallied
financial as well as D_.×k_ctionand tra_[ng e_.terprises. Investment
and finance ]_uses, inst_mnce comDaries add savings and mort_age b_nks
also _Frewat f_rl.y h/gh rates !),at-they_as a whole, were unable to
increase theJ.]?relative importance in the syst_u. Investment houses
e_aibited snoradic gr_.rthst_rtin_ at _d_h levels around 1970 and
sl_ing down in the latter _halfof the decade. Other parts of the
syste_msuch as the .tu_rall_nk.sand the bonds and eouity market have
not been able to compete for funds as successfully as private coumereial
banks. Of Dar_icular interest is the failure of the heavi!v subsidized
rural banks to in_se their market share and the average size of

each institution° Their level of intermediation ]_s eve_.deteriorated.
Sinilarly, the _r]<et .forbonds and equity ]]asremained very thin.
ks a consequence of this uneven Derfor_ance_ the more dvnmnie co_nercial
banks c&T._eto dor._inatethe system. Some h_ve attained such lam_e
sizes as to Dose oligopoly power.
Another import_antfeatlme of the syste_nis the presemce of a
large public sector -- the _milippine National B_m_k(PI'_)_a connei_ial
.}x_J<,the Development B_nk of the _ilippines (DBP), an invesimt_nt
bank_ and the seml-public rural and develc_nent h_nks. The last two
are savings ban_ with a develo_nent-oriented l_din_ objective. The
.r_Bhas beer,the lar%z_esteorTL_ial bank w_se assets ec_np_isefrom
20 to 30 percent of the total con_r_ial h_nkin9 sector. _e DBP
assets ha_been about 15 pemce_t of total bankin9 assets. Co_tinz
___raland development b_J.-.s,the share in _ssets of the public and
s_:d-pub]ic banP_ amount to rote than half of the total..
_,___.lethe o.r_a,_izedsector h._s<_r_..mguite rapidly_ there still
remains a lar[_etraditional m_m-]..'.etwhich relies on intelmal _nd Dersonal
sources for,invest_,._:tsand saves in ?raditional fo_s such as hoardln_,
%_rson_" lendir_.zand direct _nvestm_t. In a sens% a d_._a]istie f/naneial
m_.r]<etexists wherein a _ue.._ sector operates separately but side by
..)_d.with traditional segments, The pa_e_ shows that ther_ is segmentation
even in the or,zsnizedsector.

3
This patte_.nof development has been discussed Jm several _pers
(World Ban}<,1976; Tan, 1976, 1979), but so far there has not been a
comprehensive desc_J_tion of this pattern of _ro_,_hor an adequate
explanation of why the organized system,developed this pattern. .._he
World Bank slml_1attri]_utedthe see_ng lack of c_._petitivenessof the
m_,_ketto t_e s_necializedrole assigned by the _onetar_ Authority to
the diffe_e_t _fpes o:fffinancial institutions. Tan, on the other hand_
blamed the _et of re_u].ationsw_/_% _Frantsttbsidyto selected hanks and
borrowers _Indinterest rate ceiling on selected credit instruments.
These works were narrowly focused and nr_vided little empirical suDDor_
to the possible irapactof these factors. ,Thiss_idy tries to ur_derstand
how the Philipp/_e capital market works and expla/ns why it developed its
present str_cture of institutions_ instl_e,nts and intel_st rates.
Explanation is souffhtin the analvsis of the behavior of the three groups
of economic units that trm_sact in t]_emarket -- stn_pii_s,deficit and
intermedia_] tm/ts. _e monograph st_ts with a hi_hlv agg_egative
capital market mode]_t!_atext_ds the _alysis of Gurley and Shaw
(1956) _nd :_eliinnon(lq73). It discusses the work/ng of the market
_underdifferent conditions. A± one extreme is the traditional market
where there are no 'intermediaries; f_mds flow between individuals
like i.na b_3rtersystem. At anoth_ end ms a capital market eonsist/_
of an extensive ne'_ork of competing fir_mneialinstitutions. A
eom.Darisonof these extreme cases is made to show the ga/ns

that can be obtained from eff<cient inte_ediation. _e model is then
,±sedto analyze the Lmplic_tions Of specific forms of i_Derfectlons
includ/_ngr_id_:ties i___pose4by goverr_ent [_li_T. The ag_egative
model is followed by an analysis of portfolio decision of sla_lus
units _%d finance problems facing r!rms.
_-_.eGurley and Shaw/_IcKinnonmodel of intermediation is highly
.... _zm.ol._led. _ds from savin_ __ndother,sources area_-ege_ive _a%d_-". -"="
cjnannelledto borrowez_sfor investment and other uses via intermediaries.
We have to _o into po_tfol.ioand capital bud_[etingtheo_! to be able to
%_iderstandthe more ccm_Dlexchoice of assets _id sources of finance.
In_e_diaz_ies offer assets and sotmces of fina_ce that are differentiated
as to ris]% liquidit_zand retul_ns. Tb._isthey do in order to meet
differences in liquidit[_re_u/!_ents ,_ndpreferences of surplus and
deficit un/ts for _isk ,m_diiq_/d/_. In t]_isway,inte_,_medi_ri.esare
able to expamd rheim level of ou:tl)utor inter_ediation activities.
Financial assets _ subs'titutesof each other. Pren%iumis paid
for ' -r_sk and iliiqu/_[_/. _e _3rket dete__minesthe equilibrium
str_eture of interest rates_ portfol_'oof assets and sources of finance.
Efficient market mode.isincluding the capital budgeting m_lel of
Nodigliani and Niller eive a very neat derivation of d_e st-ructu_ of
interest _ate and cost of caDit_l that sole]$ depends on risk. These
models ass_znecompetitive oonditions. We m_ce use of the basic

behavioc_alassumptions of the tbeo_.7. _ut we emnsider e_lieitly h_4
it wo_ks under imr_erfectconditions. Imn_fections in LDC n_rkets
are i_,eatedas de'te._tiningthe consln_aint_in _hich economic _]3",ts
opec?ate. _hey result in _equal sets of constraints for d.iffere_t
g_ups of decision units...Se_qmentationof the _.n_3_ketis sh<_..,_to
result from the inequs!ii_ of consiloaints. Inste.adof one __.ket
equil_i_y_i1._n,ooint_a sl-guctLreeof e_fuilibriais ob%_ined from the
diffement se[m__ents.
'Goverr.:,lentinter_,ention,_..Th/.ch3_sextensive and hi_r,_yselective
in nature_ is conside?ed an important source of _nperfection. Some
imperfections r.esult from physical bare-icesthat still re_ain
including.,discontJm.uousco_mication and.i-r_ansDo_s_tionnetwork.
,,."Ynelatte_.__i.mDer,fectionsare eonslde_e<_to arise from tmderr,]evelopment.
,Impe_.fect],'nc_._!ed_teand indh,is.'f.bi]itiesalso seem to prevail in the
fin_ncial _keto _e i_r@lica:tionof all these is analyzed in the paper.
The model seems able to ex.r,,laJmsome of the Deculiane.feattu_es
of rilePl¢ilippinecaToitalr_ket such as the wide interest rate
differential, firms' r_e]i_nceon loan and inte_n6_,financing, the
persistence of closed family eol_porations,"thesmall size of the equity
market and _he short m_.tu_itsjof most f,_.%ncialpapers.

1_m m_no[_ra!)hcontains eight c?_pters 5ncludin_ this .blt_oduction.
The second chapter develops an ag[!_ega:tiveintemmedialion r_del.
This is followed by a brief historical a_%lysis of the fine~ncial
system. Chapter 6 discusses the basic portfolio theory and how it appl/es
to an imperfect market. _e model is tested on the Philippine stock
market. The results are given in Chapters 5 and 6. Chapter 7 deals
_ith the n_)neymarket; Chapter 8 with finance _oice. Flow of funds
data a_e used to provide some _nDiric_mlinsiFhts .intofi_%nee decisions.
Chapter 9 lives the conclusion.

7
A Model of Fir_ncia! ?_arketDevelonme_%tc_nd_e Structure of the PhilioDine _i-nrket
1. A _99delof Financial De.w_!opment
Gurley and Shaw (1956) and later Tobin (1963)_ llcKi_non (1973)
and other economists attribute much b_mefit from,financial intermediation.
The most important coni-ributionof finmlcia! intermediaries is in
mesource alloc_tion. The],ralso heln reduce risk and the cost of
liquidity and financial tremsactions. These positive effects of
intermediation are exola/ned below throu_h a model of financial
develo_ne_t from a traditional to a develor_edfinancial market.
F/r_._icia!inter!_ledJ_iesare _nannels of _9.mdsfrom surplus to
deficit _Lnits. %hey collect a large _o]. of f_.)2.ds.In a la_%e pool, the
placement of _ly one s:m_lllende_ is liqlid since it fbr_ but a ve_z
_mmall.partof the total. On the other hand, each intemne_{.ar_!_ts
loans to a la_._gen_nber of _}_rr_.4ers.%_e depositor's claim aga/nst
the intermed_iaryis ult_.,natelya claJm_a_;ainstall hmrTowers. He
therefore shares in the diw_-msifiedDortfollo of the intermediary.
By placing his funds with an intermediary.._ the l__nderis able to
diversify his portfolio of assets and to /ncrease its liqu/dity.
Diversification generally leads to risk _eduction. And as specialized
institn/tions_weexpect Jmterme._aries to ga/n f_.o:,economies of scale

in o'oerationand in the collection of information ,_boutlenders and
_ers. Such ecoDom/es of scale shou].4reduce risk.and the
transactions cost of ].endi_ e_d l_rrowin,F. These gains frcm
inZermediation could _e substantial. We e_ct, howevem, that its
most impo_tant /mpact is allocative in hazard. To show this impact,
we exTpandon _c/</nnon'sanalysis of investment-saving-borrowing-lending
(S/I-B/L) choices in a se_qm_ntedmarket,
Let us begin,with the traditional market where there are no
intermediaries. >bney may ol-_._ynot be in use. income and wealth
are [meq_mlly disitc_ibuted.Tl_ansactionsin .goodsand.borrowing/lending
may take p]mce amon[<individuals who are proxim.atelylocated and
personally ]_,m to each other. In an e.x_-r_necase _ they neither
borrow nor le_.L _ach unit is firh_nciallyself-conteined and decides
- =.__ _: " inves_nentonly on #ts rate of savin_. In such a case_o_:v..n,an<_
take place simultaneously.
Unequal _k[stributionof _2,.formationresults in uneo_al investment
and financial D_ket op!x)__m/ty _ves (IOC and }_OC). The best-
informed individ_]s face the .bestpossible options; the poorly-
informed, infe_ior options. Borrr_,Ting7_dr_on' s _aph _ we take %-wo
individuals, A and B_ each facln_ a .d/fferentIOC. _ach bins
]%iso%_ mRp of J.ndifferencecu__ves, I._'s and ICB's. The slope
of the IC curve gives the rate of time F/Pef_ce, and the slope of
the IOC_ the internal rate of r_tur_. If there are no lending

Dossibilities, individuals A and. B will save and invest at
the po/iLtof tanffencyof their respective indifferem,.ee_nd investm_mt
op_h_nitz_ ctnwes. _eir respective optimal z_atesof ___turnneed not
eot_]l..14ewill see tl_t the possibility of bomro_Tingfrom each other
_ill bring th_n to a ]xighmolevel of utili_, r,...._my ho_ f!_mm
A at any rate bei_een B's a_d A's origi_._loptinm! rates at
aI and bI and continue doing_,so tmtil _both A ._md P b_ve
reached,eq_malmgmgin_ilrate of re_tn._and equal time preference rate.
Funds are tra%sferred fr<_mthe low nroductivity to the hill productivity
investor, and from one with low to one _ith high t/me preference. Both
are able to r_.aeha higher level of utility f__omsavJ-ngand investing.
In_ividua! borrowin_:-len_.Sn_,like barter, is costly to transact
_nd rems_ir,esthe _ir_cidence of quantit_fend maturity of ex,edit, _n/s
double coincidence ,bes Dot easil7 oec_n[,be_._'cenany _:,AoD-._i_sof
individ1_Is. In our case, @_-t [! w_Y'csto !_>___mcwat the equili.brium
rate is larger,tha_ _#mt A w,m]±sto lend. E _,v._.sto look for
other lemde_s. Obta/nin_ funds frrrnseve/_alJndividuels would involve
_highertransaction cost than if the funds 9__eobtained from one source.
The matchin._of maturity "i_;anod]er complication, also that of risk.
Even with good matching of amount and nmturity betwem_ bartering
individuals,Pareto opt.Jmmli_ is not feasible at the aggregate
level. In traditional mamkets_transactions tend to t}-j<eplace between

10
prow/mate and f_m/li_ /n<iividuals, One does not usually face all
tmansactors. We m/Zht [!_vea _roup of individuals who 6_e kTm_m tO
_ach other but _ahobiLveec'ual!yi_¢ investment opportunit?/cu,__ves.
In this eas% t3%ereis a sT:m!leryossibil/ty of g_ns from ]x)rr_win_ &nd
iendir_[. Eo1_ffng and lending._,take place ma/n!y to equalize the
ma_zinal t/me F2refez_Icerate. Ass,mnethere is another gfrouoof
individlmls who have higher IOCs. Each ,croupwill :reachits o_
equilibrium mate of _turn and mate of t._meprefe]_nee. _le equilibria
need no-t,_.qtmlfor the _.,m_<_uns. __e %_4ogroups would be better
off if they could transact _,zizheach other,so that funds are allocated
optimally for all their _.._)e2s. }{erewe see how i_perfect information
results in some ],d_ndof se_er:_tation_mnda [xnorerallocation of
resources. Fhvsical L_l_r/erswo,_k like poor information. [f_eyp,_event
the nov._Tnertofftmds f_x_.those with low n__oductlv/_zand low t/r_e
n_ference _ate to those _Tithhi!_hp_.,ductivi-tyand hiJ_ t_e 9reference
_ate. Inte_nediar.ie$should r,edueeif not alto_Tether_reprovet/_ese
_fections/so that the se<nentation bme_<s do_,r_.}m ideal situation
is where bo_};in[[ e_d lending via in-temediamies t_<e place s_ mDothly
t½zt the Pareto opt_nml point is :reached. _nis is where thenceis one
c,_rmn equilibrium time preference and ._a_ternalrate fo_,eve_yl_>dy,
with total lendir_:<eoual to total bom._.{in_. [Thistakes place because
the _rmesenceof inte_[_diaries reduces rmst of the nrob].e_sinheren:t
in e .bartersystem-- do_ble eoincidemce, indivisibilities ,endhiJ_

!!
cost of information and , _--,_+"17_an,_.:....ion cost. We c_ im,%_,[inean in.ter-
medlar5T beinF able tO c]-_nne]_f_.midsfrom.n_v_ys_'__l]z_,_D!IIsm_its such
as A to bor_._,,_e_sin nx_nylocations.
Cha_t 2.i may be used to deriw_ the supply to and der%_ndfor funds
from inter_e¢lie_ies. At each interest rate reflected .inthe slope of
the mar)_etor _bor_ow4_ng_,/lendir_line _i, so_e peoI_lewant to lend,
some _-_antto ID._cr_,_,. '_e oupp_/_,__ cur_leis the sum of desired lending
at each mate, _he demand is the sum of desired borrowin_._at each ?ate,
As interest r_te incmeases, desJ_.edle_din? increases but deslred
borr_,ing decreases. _e demand for funds f,_omintel_e¢lia_iesis the
total investment fol_theo_rdr_r'inusthe investment made by lenders and
the self-financed investment lx_r_z_ers.
e_[_otnot_'lenote tbet the supply and deT_nd functions v'_ just
because of diife"_encesin time preference mates but also ]_eause of
the heterogeneity of J_nvesime_ntoD:porturities. Even _ith very Food
ir_fo_nationin the _.._ket_enl-ge:_reneurialand manacel-ialtalemt is
faimly s<_x_eeand ,diffemsm._onz/x_dlvlduals. Most individuals seem
to have co_rative advantaze in %._r-kin_as m_ployees. _.'Tecan say
that the ,_!locatmverole of inter_.._edi.ar.ies].....to in the ve_y nature]
of _m_'S capaei_./.
In the cou-_.seof deve]npm_n% inter_ediaries diversify thelm credit
offemings. _%ey _ay find it _re efficient to specialize in intermediary

I__,_,i
" _i_' '_v_ L
i
12
functions. Ve find ma_},_countries _ving several types of intermediaries
~- commercial and sav_igs b_J,'s,investmlenthouses_ securities dea!ea?s,
and ins,,mm_cecompanies each t_ specializinz, to a eertaiA exte_]t_
on one or a few _struments. Cormercial _id sav_[s ba_ks are
usuall,]the first intermediaries to be established. An iraDeflant
reason is that their inten,_ediaryfunction is easily understood by
people who &_e just bein£ introduced to financial assets. The act of
depo_iting and ].endingis ve_z e!ementar_]. Later on, othe_-financial
insts._en£s _ccx.qeaccepted -- h,nra<bi!is_ trmst certificates _ and
other deposit substitutes_ coi:_i.al _Ders and sto@(s and bonds of
private and Concernmententities, includin£ financial enterDrises. A
_,_Pe_stervariety is offered in order to meet the demand for different
deKrees of liquidity an_q_risk by borTowers and lenders. _1_%einstruments
offe1_ed_e c_netin_ fi_ncia! assets (or liabilities). The m_m]<et
_mu].dtemd to move towa_ds {m equilibrium str_ictureof interest rates
reflecting the relative !iquidlty_ risk and intermediation cost of
=_ac]_cTedit insi-rmm_nt. As the m_-m?.%cetdeve!oms the cost of risk,
liquidity msd intermediation are expected to fall. The reduction in
these costs _/1] lower equililxoiuminterest mates, everything else
_]iven,and _ thei_ ranges. At each lending rate, risk will tend
to ]_ lower and the asset more liquid.
The rate of diversification will depend, to a large e._ent_ on
the growth of the financial system as a whole since " _ "_-'_llq,n,,_.t./,_isk

1.,,3
and inte_.ne,,_iationc_)stare,to a !ar,_eex_cent,detei_i'_edby the m:-nrket
size of each asset. .U:[v_r_si,_icationand ....[:J.n_-'_icim!{n_,_h=_ sin.e,theref_ore_
expected to move together. '3ud__iiversifieationmereisan i_ereasing
_nst_,_t_ that _:_uldoomnete _,_ithbank assets andn[m_berof cre$it 4 ,r._
li&lillties, It is therefo__e-to_ exDecteJ tba% in the absm]ee of
in:terventior_-the_e].ai:ive__nDor.t,_nceof ]>nnP_ in the system _,:ill
decline <]u.._inzthe Dxocess of develo_.lenZ_d nossib!y stabilize at
_^-,_L___t vis-a-vis that of the securities market, mutual funds, insurance
!nts___.,_i_,le_.k_e_,il! find in,the followi__ chapter_md other " _,' _,.l"_'_.
that t_ds did not hapv_-nin the Philippines. _km]cin_institution
continued _o dor_mate the systeln. _is p_ttern coul,dbe traced T_al_]_y
-tozhe financial _91iey p_irsued]7,'the _over_en:t.
1]_epo!iey to n_'o!_tethe establis]%men_of financial intermediaries
is based on the ]_ne+_itsto be e,__m_-_dfmm%_t[he.irservices. _bwever,
this policy ]ms been ir_ter_winedwith no!icies aimed at the overall
develonment of the eeon_m_ _d of specJ._[icsecto["s. The mix of policy
tools us_x_]md _me_faalimpact on the different t_)es of intermediaries
and financial assets.
The s_?ate_ contsined a mixed ]:mffof reT_lations includi_
int_ _o_ _=*__ ,.. and subsidies. Ceilin_ interest
rates have been imposed on selected credit instr,_e_..ts-- bank deposits,

14
money m-=mketinstr_,_e_,ts,:rodloans.1 F_mCks)_ve p__escribeddebt
equity cei.lin_an_ size limitations on an_ individual borr<_er
pmoticulariy i_)sri(h_fk _-_/.rector-offieersand related individuals)
bo_r_,_rs. Subsidy in the fo_<_of 3.,o_,7rediscountLng rate is granted
Go all ?_k,4mS instit_itionsand preferential redisco_nting i_atesand
voltmes are [roantedbanks for thei:._lo_ns to priorit}7activities m._chas
in rice and exmoz_s. O_ean solaces of eeuitv _e granted fc_rthe
est-ablisb__entof _/ra! and ,nr,ivatedevelo_nent barLks. Other fo__ms
of su/}sidva_ [_nted co_ne__nia!kmmks on a _Dre selected basis such
as the allocation of n_oceeds from foreien loans. _l]_ereare no clear-
cut or objective criteria for r_tioring this fired, The_e _re many
other regulations such as the 35 n.ercenttax on ±he {nterest rate
p_id by ult[ns.te_r___row___s_'__the money market, the _100,000 minimt_n
size plac_gant in this msrket and t]heinclusion of at least 25 percent
a_rieu!i_m._ loan._in co_:mercialbanks' iom-_r_rtfo!io.
The strate_/, it is se_n, has _,_oimno_t<-m_tfeatures. It is
selective in nattn_eand it involves both intended and m dmtended grmnt
of credit subsidy. Z:_esubsidy c_mes n_irulyfrom monet-a_fe_ansion.
%_e selective m_ture of the rezulations on inte]._estrates, placement
sizes and _,<nt of credit subsidy throu[]%rediscounting and eq}_ity
assist,m_cedJ.sc_im/_atesanonc mrmnlus units, a_mng deficit units and
1Ail ceiling mates, except .forshort-term loans, are to be,disbanded as of July 1_ 1981.

1.5
amonc fi1_mia! ir_em_edi_mies. _,om_surplus urLits_ benefited
•/nile others _re h_< by these re_u3ations. 9an]<_m_Tinstitutions
... _,_-IC,_L]._.,e,_an<.{the cellini[..ratesprofit f_m the cene__us rediscolu]ti_v{= - :_c , =
on de,sits which provide YmzJ,_with d_ean :_ourcesof f_mds.
"_]%eeeilirm on de,nositreduces its attractiveness as an alter-
native asset to hold. Those _ho have f_q finarieL<e!asset a!ter_tJves
]ike small savers _e therefol_ Jiscrlminated against by the deposit
ceiling. The ceilin_,irate on loans ma]<esthese a _elatively _heap
source of finance so that those _.)leto ._r_ow at the eel!in}I,rates
ire benefited, while those _,Thoare rationed ou_ of the available ].om_.
funds and for_ed to rely on _ e_en.sive sou_,ces_re .'"_- e
.Theal!oeative imr_actof the interest emd z_erliseountingrep/lati.ons
is rout]relyillustrated in the f..3.1o_,z_r<,._,cha?Tt. Asst._neac_.n t_mt
OT)r)ortmnlti,_c_,_rvesciiffer[or .+_heavet_aze_m_]l!household fi_n and.the
advanced __de_ _n_._ermeneuras r__f].ectedin " ' e,nd v_v_ respectively..... 0-i,'
I_t us assume ftDvt.he2that the ag._r_egatesupDli_and demamd for funds
d,ezivedf_m_.the IC and the IOCs of all house_holds/firmsare in
3. A eon,_..titivefi._mcial system._._ulddeter_ninethe inte_._estmate
at the inter.sec-tJ..onof supply and.demmnd at re. F_ A. ar._d B
houoeno_ds/firn_% it means a nz_rketline of equal slope. An al_tificia!
...-.. __r_ theIc_:.,_eringof deposit re:rewould lead to a smeller supDlV of funds _= ,
A-tsqi_]_.ouo_ho_,,s,,Theywill,tend,to invest .._Krreon their _m projects.
_e policy of lowe.rin[the rate _low that of the market impl/es unfilled demand
for funds by deficit units. _.e,_ep._ev6d.lsa retu_._nsdifferential
between A-i-97)ea_¢IB-t>_e inouseholds.

I _l,i, " ,r IIIi
If,III_iiii!r_,If_III
iI II
IIr rll _I_ifillr.............. IIil
l_I_i _iI iI I, il
I_I fill i _
_ _I I IIiII
_ ,ifI i?'I i_I"_In_I
_ IIrl • iI ,itII
• ii_iIi •r_I_J
I_ !I _iIf,Ill_IiIi_I__Ir_
_I II,Ii,I_I_ _ m,,Ill Iif, IllI'
_I I lit ,i I_IIIi
r, I
i,I_IiiIIIi!_!,i_
_i _ ,_ ,_ _'_ _ _

17
C_m_ci-_l _n]:.funds have been sun_;!ementedby rediscountinK.
_i.s J s an fincr__Jnent i_ frond su,onlv. ,?_o:;._.np: .for Jnves!_P.nt
Jmcz_ases, since A &nd ]_ together invest _moPethan _-9_t they
wou/_ _ve done under Dure]:,rse!f-fJJm_ncec2r_.Lnderoo_net//ive financial
intermediation. If,as a conseouenee of the iner,eTseddeP._mc__nflation
occurs and has a ne[,ativered5_stsi]_riv¢:b_ipacton [;he A households/
f£ems, their I0C _uld s.._,ftdo,mw,-m_dand to the left as <i I .
Az=_gregatedemand retuz,_sto the old !evel_ and income is tr_ansfe_red
to the Z housel_lds/firms via inflation. .Allocationnizht be _mde
as efficient as in a competitive /_term,ediation systm__,but a:tthe
e_pense of redistr_tion fpom tne low sav_Z investment units to the
large B-t_pe _nits.
The effect of o+,:herresulations Parediscussed in later ck_:_pters.
Ue contend that _licy has much _o e_:._lainfor 8 L�d_o_,_h of
financial in_erm.,e0{ariesor of the credit inst_nts w_deh they
s1_cialize to issue. _<is has to be bo_-_ein _Aindin t-racingthe growth
of the e_nnonent institutions in the syste_.
In the nex_ o]_-_pter%we t_,]to nrevide _m m_pirical answer to
the question of how faz,tl_ePhilippines ]_s progressed toward establishing
a v,moied_mt in-te_Ted f_mneia! system in wt_.ch a competitive str<_eture
of interest mates prevails. _is involves describinS the ,cro__hof the
org,mn/zed system as a whole and its _mj_r eom,_nonents,the subsequent

18
strelct<.m,eof f/]_ancial assets _hev suDDii.ed to _._v<r_ _-
s1._nlus units_ their pe_formance as measu_ed by their inteznlediation
activity, ,randfor co_:[.mmci_]._-- _'"• _;_u%_<s_-ihe_ data a_e available, their profit
rates also,
19
C}b_ 3
'.._eGro}rt.h_:_ndSi'ructt.meof the Fin__moial}[a_.%et
_nny forces acc_.mt .,.orthe !g_o_,_hof the country's finsncial
market mid the strmct_ tb_._.tevolved, i...Liththe econo_m,developJ.n_
at a fa/rly fast rate, supply and c].enmndfor various fin_n.cialassets
increased. __h.vsical hart,letswe_ ]:meakingdo_ lead/nz to the
._dual integral-ionof _Jot]_real <9_ndfinancial mamkets. _]e ,,.-_ro_,._ng
level of income and economic activity £.eme_.ateda )%i[f_erlevel of savings
randinvestment. '_U_efinancial r,__nmket_:_sDondedto these deve].opmg_nts
by establish/_g new institutions _.d new forms of f:inanclalFropets,
and in.creasinr,,their level_of intermediation, kt the time that these were
tmUiri_[?!aee.,the )..._netar_lAuthority or eq_.va!e_nt!y_ the Cen_0al Fx_n]<
adozted m, a[[_,essivebut ?ighly '.selectivefinancia.],policy. It
__ncoura?;edthe estab!isbnent of heJ<in_ /_stitutions by subsidiz/nR their
initial capital and opepational f<mds thrDush the rediscount window.
The main recipim_ of t_is s_;)sidywere the m_al banks but all b_.<s
received rediscountinZ privileges. The government also directly expanded
the syst_ by estab]/shinF,the Development R,m_k of the Philippines (DBP)
_nd e}_and/ng the size of the 7%r[linpineNational Bank,,,%state co_nerci._
bar_<. Since the late 60s when the Sove._nmenthas followed inflation_m]
plicv_ credit expansion was [_tly ci_.nnelledthrough the public and
the r_.u_alban]-.s.
20
This financial deve!or_ne_tstrate_/ was selective in the sense
that the development of othe? t-ypesof inte_nedis.rieswas neglected and
the different types of banking institutions received unequal rates of
s,mbsidy. Private savings b_<s were not deliberately encouraged to grow.
A _evi_4 of CB reports and r_sulations s]_Dwsno concern about othem
sectors of the financial market. In addition to this bias t(_ards banks
interest rateson bankin._ deposits and loans were regulated. Ceilin_
rates wer_ imposed on deposits; the rates depended on maturity, and on
loans, the rate depending on whether or not they are collater_lized,
Portfolio constraints were also inDosed on ba_ks and the go_t social
ins_ee system. There were other regulations but these are consider_d
to be the most important in ter_s of their implications to allocation
and financial growth.
In addition to these factors are some inv_-fections _ni_h also
influenced the market for D,_t.icularfinancial assets and the movanent
of flmds between geographic areas. The quality of enn_eurship
see_s to have differed especially be_4een rural and city bankers.
Information is not equally distributed and the pov_ and generally
low level of income of the majority of families make many assets and
inves_nents indivisible.
The way these factors influenced the market fol,particular assets
om credit is analyzed in later chaptems. This .chaptertries to capture

21
some of these influences on the development of "theinstitutions and their
inter_dial_y functions. The ehaptem is focused on the bankin_ sector
because there are more data on it. It is, moreover, the 1_st i_2o_t_nt
sector of the financial system.
i. The Financial System
__hesystem consists of intermediaries that supply financial Dapems
to surplus units and credit to deficit _mits. The financial papers supplied
may be primarN o_ secondar_ papers, i.e. _ those issued by ultimate
borrowers om spending units like col]poratestocks, and those issued by
the intermediamy like deposits and bank bills. Intern_diaries •also
function as broker.sfor r,rimary securities unde_itin_[ primary security
issues or ar_angir_qa loan port,folio for su1_plusunits who wish to lend
d4rectly as in the case of money market without recourse i_pers (_,DRP).
The geowth of intermediary activity is gaug,ed by the amount of •funds that
flows into and out of the system. Funds flow in the form.of new deposits,
payment for bar_<bills, etc. ._31eseare recorded &s liabilities of the
int_ia_y. Funds accumulated are lant out /J%the for_ of loans,
securities purchased, etc. These are recorded as assets. These have
counterl_rt accounts with spending or vrimaz_yunits -- they are assets
of surplus units and 1/abilities of deficit units.
22
FI_ of funds data (FOF) r_easurebest the level of internediation.
A complete FOF traces the Uflowof funds among all four g[Dups of economic
units: households _ business, gove_.rnment,fin_cial institutions, and the
foreign sector. AT_ca_iginalplacement of f_ds with _mninte_r_dia_y and
rheim relending increase intermediation level. _en the debt by a deficit
unit is r_[mid and relent again to anothe__ deficit _mit_ intermediation
increases further. In eontr_est,a portfolio change from_ sav_ deposits
to l_nnkbills, does not add to inter_ediated funds. The F0F w!_.ehemntains
the sum of all debit and cred_'teuntriesto each account allows a more
ac_ate accounting of intermediation activity. Balance sheet accounts, in
_id _s of each account _md l_port the endin_contrast, net out the %/_ _" _'
balances onlv. They, therefore, tend to underest/n_te the level of
inte_aediation. Balance sheet information is_ however, the r_e readily
available set of data. _,leh_w_ to rely on this for our historical
description of the developmemt _d si_ctume of i:hesystem. In late__
chapters when we armlyze in _q_eaterdetail the marke± for.major financial
assets, _flowof funds and othe_ infoz_ation are used.
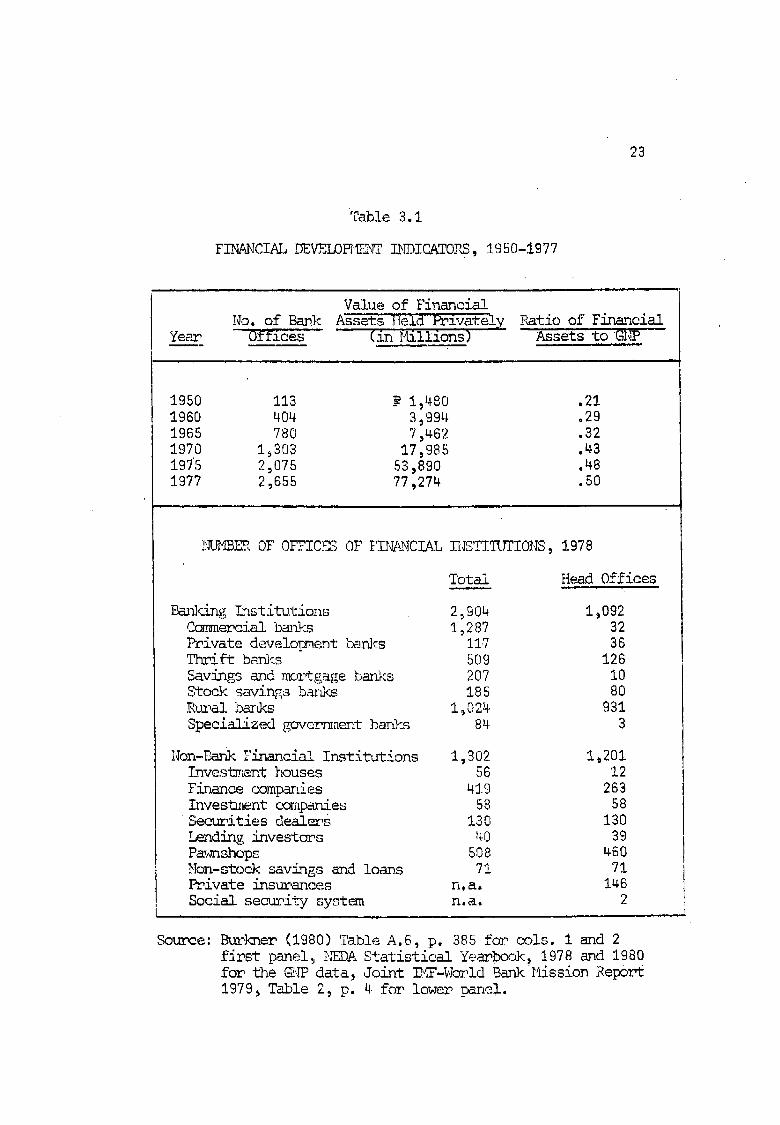
We have three tables to describe the gro_rthand structure of the
system. Table 3.1 gives a h%sic financial develonment indicator, Gurley
and Shzw's financial assets to G_ ratio. Also in the table are data on a
nun_er of financial institutions and their offices, and their geographic
distribution. Tables 3.2 and 3.3 show the gro<ethof assets and their
distribution amon_ the differ_mt groups of fi_nc/al instit_tions
23
Table 3.1
FINANCIAL DEVELOB_2,_ I._DICATOP_,1950-1977
Value of Financial
No. of Bank Assets Held Privately Ratio of FinancialYear _s (in _lillions) Assets to _
1950 113 _ 1,480 .211960 404 3_994 ,291965 780 7,462 .321970 19303 17,985 .43197'5 2,075 53_890 .481977 2,655 77,274 .50
]:&_BEP.,OF OFF..ICI_']OF f'INAiNCIALINSTIIUTIONS, 1978
Total He_d Offices
P_ng= l:nstitu:tions 2,904 1,092_mmercial bm_<s 1,287 32_civate develo,nmentbar_<s 117 36Thrift banks 509 126Savings and moz_gage banks 207 i0Stock savings banks 185 80P,_al banks 1 _024 931Specialized gover_nent bar_<s 84 3
Non-PxlnkFinancial Institutions 1,302 1,201Invest_lenthouses 56 12
Finance comparies 419 263Inves_]nentcompanies 58 58Securities dealers 130 130Lending investors 40 39 ,Paw_nshops 508 460Non-stock savings and loans 71 71Private insurances n,a. 146Social security system n.a. 2
Source: Burkner (1980) Table A.6, p. 385 for cols. 1 and 2first panel_ ,_,_DAStatistical Yearbook, 1978 and 1980for the _'_Pdata, Joint ]NF-W_Id BankMission Report1979_ Table 2, p. 4 f¢_ lower panel.


•O
_--1"
¢0_
C'J
--1"L
O
,r--IO
J_-i
O,I
__
_C
O0"_
t.',,I¢0
_t,P'-
["--C
O
,_o_
oo
,-__n
e_o_
,-_o
L"-
03O
,I•
,_f¢O
O'_
¢O,
O,_t__-
Ol
LO
_O0r)
_O
_-4U
')P--
_03
fO¢O
O_
,1"L
OC
O03
"-_x._
_O
1L
"-L
"--0r_
L'_
1_',,'"t
¢'0L
'N_
,,r,II
I
*t
L,')
OI.C
)('0
0*4_-I
CO
!1
L"-..'_I
(23_'i
._i._i
C)
o_o_
-4o
_o_
®o_,
_;o
CO
_O
09C
OC
OC
O00
0'_....
_-
..
og
I
L"--
:hC
,,IL
'NL
_L
t__
L.Q
OL
t_
U'}
O"_
CN
CO
_1"_
_.OL
""C
OL
'"b',
L"-
L"
t'_["-
L""
['-("-,
L

/
i•
t0
i
•9
!"_
z._.:.1"
I.__
I._Q
D_
k_12",.
_.__
_,_
_-._,._
__
II
i
Nk"_
CO
cOoo
¢"_1¢"N
coC
OcO
II
I
__
gg
gg
gg
"_._
_4._
__
__
_4o_
_4
_i.._
cOcO
L_O
,IC
Ok"_
Cr)C
_
1I
I
I_O
OO
'_O
O_
0'_L
""-_1
k"_k'N
¢N_
(N_
C_I
¢NC
OC
O

26
including the _,e_lar?e nublie ]_rg_ -- the Philiuoine }TationalP_<
(_) and the Develo_en± B:_nPof the Philippines (DBP). The tables are
self-explan_o_T but we _,_=_ntto note a f,e_7points°
On the whole_ the fiFures in Table 3.1 are encouraging. !_e
finance ratio rose from 1950 to 1977 from a rather low level of .21 to.
.50. Howevem this de_',eeof develoFr_entis still io_ comDared to advaneed
eeon_ies like the U.S. wbicl_ev__nin 1950 had about 4.0 finance ratio.
Japan's M2/.&;_ratio was aJ_ut unity in the 70s. The mm_er of _stitutions
and ban]<offices also increased quite _._pidly. }I_ever, their geo__rap]mic
dispemsal is not so satisfactoc;. AlnDst one-hail of b_nking offices
are located in Metro !'_m/laand orulvother major cities like Cebu have
branches of investment houses. :_'_ereare no branches of the stock exchange
in the mrovinees, The r_n?alsector is serviced mainly by rur,al_er_,s.
In T_T01e3.2,we note the strong relative i]_o_ance of t_ groups
of intermedi_ies -- co_nercial banjo;and the gov:_Dment _nd goveanmment-
supported-managed institutions. These include the F_TB,the DBP, the
rural and ryrivatedevelopmen-tbarJ<s,the social security system, and
2other smaller specialized insti_._tions.
_]e dominance of these t_o groups .}_ssome _mportant implications.
Connercial banks supply mostly s.hort-termpapers and credit. Their
dormtnaneeshould ex%_lain_in ;ermt_._,the observed shortness of the maturity
of financial papers.
2_]ese consist of the Land Bank, the B_nah Ba_<_ the NationalIndmstrial Development Cmr_o_ion (_,_DC),and the Ag_icul_mal Ck_ditAdministration (ACA)o

27
The assets of the "gow_nent" _groupamounted to 60 pere__ntof
the total. We might even consider adding to the assets of this j_%gupthose
of the United Coconut Producers Bank (UCP]>)and the Republic Pl_:ters
Bank w.hie_:are controlled by the g,overnmentorganized ;_onopolieson
coconut and sugar export i-r_ading,lev.ieson coconut and sugar export have
been channelled to these b_nks.
The establishment of these "govern:t" institutions definitely
hastemed the growth of the financial system and provided r_mote areas
with h:nking and insurance facilities. They Offer an /m_rtant potential
for.mobilizing saving. Yet so_ serious :]3_estionscould b_ asked
about the ratio:malefor establishing t_is rather large _ov_nme_'it-
controlled financial sector. .Theseimstitutions are_,more directly and
effectively controlled by the _overr_ment. _.eir officers sre executive
appointee.s. _ev r:Dr__e_:di:yfollow Ce_itralD_k regulations such as
that on interest rate. They have been an _rtant ch_el for credit
for priority activities such as the !_asagana__ro£ram,BOI-registe_d
industries _ -tourismand hotel hi!din_[, the national a_line and
othe_ government D1_jeets. Casual observations show t_t t]::_, _i_ht
_nothave followed o_inarv inves_nemt criteria in the allocation of funds.
_ere is, therefore_ a big question on whether the funds have been
allocated socially efficie_ntly.
28
It is to be noted also that a large [_rt of the funds t]_:tget
ch__elled to these institutions c_me from contract_3, sav::n_sof
salaried e_nployees,hidden taxes from inflation and the nebulous
expor_ levies. The savers weme the:refo_._enot in a _sition to choose
their asset portfolio. 0_m/sfact leaelsto the question of whether
these savers ]%-_vegained by placing their savings JJnthis way or whether
they could have done bettex,choosing their c_m portfolio. We see that
these issues have serious effici_icy and equity implications.
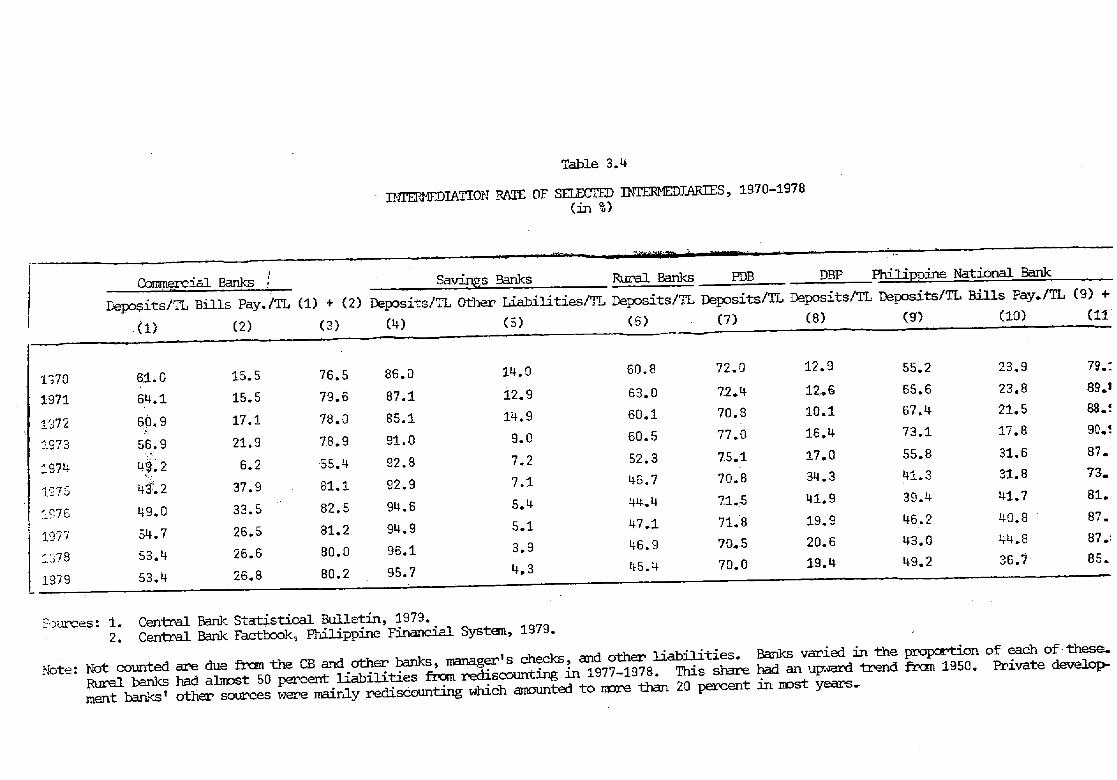
Looking,now at Table 3._ we find the g_h rates between 1865
and 1978 of the different ,_ups of _temmediaries to be.,_[renerallyhigh
but widely flue_atingo Cc_mercial h_nks'_wth mate ranged from -17.3
to 39.0 pe/_cent;investment houses, -11.3 to 50.2 percent ; other
banki_ institu_ions_ -!3.6 to 37.2. It is encoura;Iingto see the
increasir_ rate of pro_d_ of savinzs b_n},:s._.ese are ,_e_al!y small
b_J_s that _.ter to neighborhc_)dsavers. It will be seen later that
their p_cforv,aneein intelmedia-tion_,.'ndin te_n transformation has
been very = -'-'__ /,.,at.lo.__iCtOrS,•
As we proceed the rest of the paper shows that broad
indicators like tbe finance ratio .-nndthe fast gro_th of financial
institutions do not Live us a Zoc_ basis for judging the development of
a financial rm_rket. ._neQ_ta p_me,sented_ therefore, need to be interpreted
with caution.

29
2. BarJ<Perform_ce Jm Terms of Inte_r,_ediatJonRate arw]Term
Transformation
Bank pemfo_nance may be evaluated by the Kro_rthof its inter_le-
diation activity and by its a]_ilityto len_hen "thematurity structure
of its assets given the maturity structure of its liabilities, Other
p_formance indicators may be used such as profit rate and overall
financial position, O_m interest here lies mainly in the banking
system's effectiveness in mmbilizing funds, hence our focus on interme-
diation rate and term-transfoITnation. We also have a _ore complete set
of data on inter_lediationrate which can be used to conkna_ethe various
bank groups ' perform,ante.
Intermedi,_Zionmate is measured bv the ratio of liabilities to
•prin_qy o_.?non-fir_:Lncialliabilities to total liabilities. (Note t_hat
liabi!/ties _:_r.ethe records of the sources of fmlds.) _e l_nk l_lance
sheet accounts we are using do not disaggregate 1_7t_)e of cr,editor.
Here we assu_r_etha± all deposit,_are intermediated ft_ds. A s_ll
proportion of bank-issued seetn_itiesal_eheld by primary units, [_he
money _rket reports that from 1976--1979,only about 22 percent of its
papers were held b31inddviduals, and 19 pe_0eentby Drivate corporations.
The bulk _s intem-financial_stitutions transaction amounting to 83
percemt of transactionm (,._<-..eTab]_e 7.3_ D,124) _-h_mthis we might
assume that only a]_outone-half of eo_nereial hank bills including the
_.'s was held by _?imar_!units and was considered to comprise interme-

31
diated f_Is, A s/milam probl_1 arises with regamd to DBP bonds. Only
a portion is held by p_imarS!units. Since we had no adequate basis
for estimatJa_gthe intern_diated poz_tionof bar_<securities, we simply
presented the fi_ures. (Ple&se see Table 3.4.)
The share of deposits varies substantially among bank _ups
with -thesavings and the private development _mks relying mostly on
this source. The DBP, the I_3 and re_calbanks had i_,7denosit/total
liabilities 1_tio. The DBP used mainly bond and foreign loan financing,
while the P_B used the m_ney market for its sho_t-ter_ issues. Rural banks"
other liabilities consisted mostly of CB rexliscounting. C_rc.ial
banks used deiDsits at a decreasing rate and seemed to have substituted
these _,iththe higher yie]._lin_deposit subst_.tutesand shirt-term notes_
From.these we find the r_.rformanceof the different ]_,nkh,_roups
in intermediation to w_ry significantly. [btably, there is a decline in
the s]_]reof deposits for conne/_i_l and mural bar_<s. These banks have the
widest network of offices in the eountz_yand therefore offem a great.
pote_tJ.alfor mobilizing savings. The r.isein im©ol_tanceof bank bills
is not a!togethe_ encouraging since they te_ndto cater to large
financial and non-flnancial corporate transactions that only partly
reflect saving:_mobilization. These bills are not divisible and accessible
to most savers. Rural ba_s, on the other hand, have increasingly relied
on CB rediseounting so that by the late 70s,this source comprised one-half

32
of these banks' regular source of funds. Despite or possibly because of
such assistanc% they have failed to grow as fast as other banks.
The perfornmnce of rural banks may be compared to that of two
similar bank types -- the savings and the private developme_ntbanks.
All three are essentially savings hm_,-.scate_0ing"tothe longer te/_n
credit needs of smaller _e_s. Fbreover, 17rivatedevelopment banks
obta/n the same kinds of mbsidy as rt_-6_lbanks. We speculate that
diffe_._ncesin the q_zlity of entreprene_ms_hipand in the attitude to
gDverrm_nt subsidy may help exgp!aindifferemces in their performance.
It will be _eful to study th/s problem in the fu_m_e since these banks
have a good potential for fund T_bilization.
2.I. Term Transfo_tion
We may expect va_iation Jn teresatr_msfomn_tion for diffement
bank groups. Cc_merci_l banks are essentially in the sho_ter-temm
market for funds @file develo_me_t banks were established precisely to
cater to the ionger-,termcapital mequir_jnentsof business. Savings banks
also essentially in rilelongem-term market. The rural and private
develoDment banP_ in the country ar_ealso development-oriented so that
we can expect more lonEer-t_rm credit from them. The same applies to
the _.hilippineNational Bank.
This problem of term transformation and the observed average
shortness of the maturity]str_ictureof credit _ted by financial

33
institutions kas bothered policy-makers. The reason for this seems to
be that the financial market has been dondnated by con_er_/al banks
which by their nature transact in shoz_-term papers. This is exacerbated
by the fact that they have in_sed their participation in the money
market i_th as a borrower and a lender. Nithin the corme_cial bank
sector_ ]_y_ever_we should still expect scme term transfo_natlon unless
this is not ontima! for the firms for reasons like capital rationing and
inflation. (See C_]apter8 on tlds. )
We shDw in Table 3.5 the _t_city structure of lo_is granted by five
bank groups. 13_e_rettmitystructure for each group is m_e or less
what we expect for cQmmercial b_@_. DBP loans were m_stly
intermediate and long-term_. Savings and private development banks I_nd
a shorter maturity than the DBP but still the}"_%_antedmore th_n filthy
percent longer-tez_nn_]turitycredits. It would appear as if _ial
banks had no ter_ tr_qsfor_ation and that there migl]thave been _-everse
transformation. Note that the sha_ of their short-term loans was
generally high at more t]_mn90 percent in the 70s but J_trose to 98
percent by 1976 at which it has remained. At the s_mmetime the s_mre of
time deposits in total deposits rose substantially _% recent years. We
have to consider, however, that nDney market _nqdloans usually turn over
regularly,resulting in longer term maturity than as stated in the loan
contract. In regard to _rur_lbanks _ it is surprising to see an absence

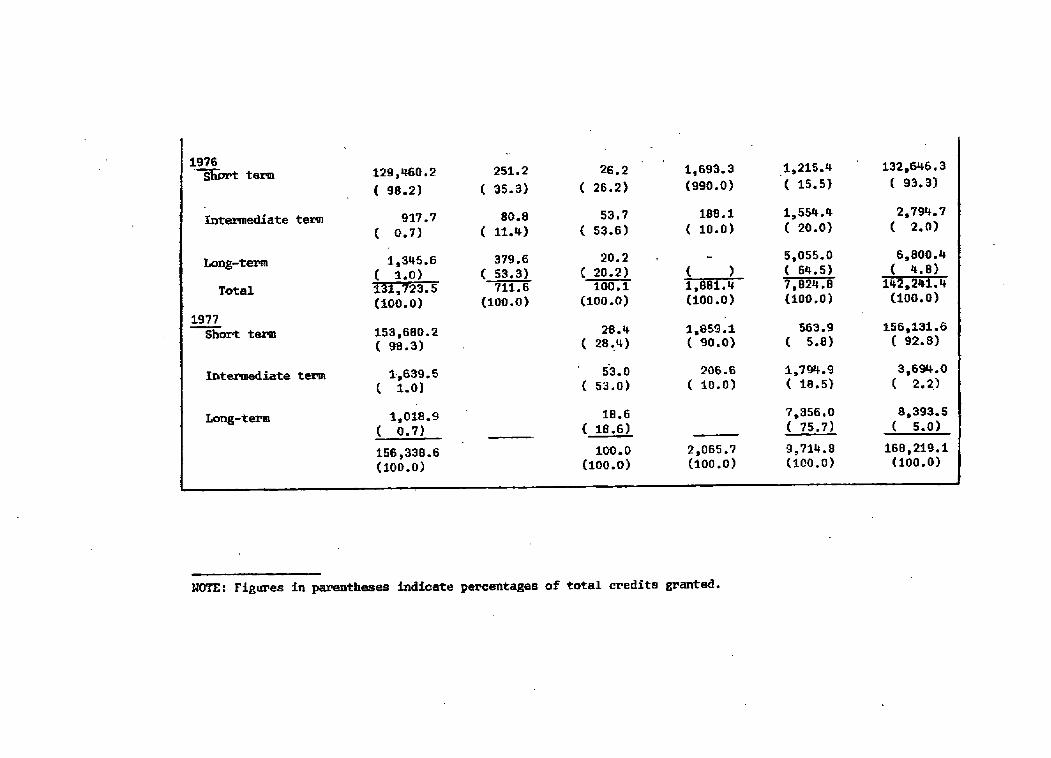

35
of long-ter_ loans granted in the 70s. Like loans at con_._cial banks,
rural bank intermediate loans are ren_,Tedso that their actual matlmi_l
beee_ne.slonger than as reported.
Th/s problem of maturit_yis discussed in more deta/l in Chapter 8
as we analyze the sources and uses of funds.
3. Performance and Structure of Private Commercial P_mnks
We observe earlier the rapid [_o_h of the assets of conTnereial
barJ<s. This ,_rowthinvolved not so much _Trowt.hin new banks but more
in the growth in size of existin_ bar_s and in its nei_,_rkof branches,
_ere were about 1,370 in 1979. By 1972_there we_ 33 banks. _is
number fell to 28 by 1979 following the Central _ank nolicv to eneouraze
Erc_rthof bank,size by restrictin_ the number of banks operating.
Table 3.6 gives data on the sector's st_ucture randperfornzm%ce. We
f/ridtkmt in 1972_bank (asset) size ran_ed from _66H to _4638H. In
1977,the r_mnZewas _300M to _19,238_{.and in 1978, the range was _561
to _4442. We also find these banks Zrmwing at uneven rates, their
g_th rate r_nzing from,148 percent to 1,261 percent over the 1971 to 1978
period. As a reml]t, the/r relative posits'onfreguently shifted so that among

36
"_I'---
C,O
CO
C_
uO¢0
__"-I
C._
C)
(,-'__
_'1l'--,
C'-J
('1"}
mr}"r-.--
CD
t'---{:_
(.O"_'-I
CO
crO
_©
I'NLO
LOO
OC
C)
O0
_-I
G)
O_
_'_"H
_1',l-I
e'-,t'i"1
_'v'-I
C',I
_H,r-I
',rl_4
H'r'l
CM
c:._C
,.C
')o),,_..
C)
C23
C:_,'-D
c_cz)
o.I_'
CD
(:_,"D
o.1
("oO
O')
[-'--,_1
LC
)L_
C,_l
C'.,IO
U.,
L"--,C
'OO
O¢_
ED
LOO
_L
Ob"-
"C't
,:.-.-.-_['_u'_
_G
_.iN
_LO
_1O
,IC
r)L
.,'_",.O
__L
r)(,D
CO
C_
C,')
X--I
,FI
Lr_
(-",)T
'_-IC
O(D
If)C
".IC
)U
')t'-'-
_-_"
_L
OL
Z:I
_--,_
["-C
.')
_f--,
c_c',_
t,_]_0
C)
C0
-.:I-cOP
--0"._LO
,_
'_tC
O09
C'-,l
C.,I
_P-I
C',l
u_l¢_
_G
,,!_-'1
__
',I'-I
(::Dl
_-,;:i"
_(_
C_
co_
_'0.:1-
0Jc_r)
G)
0:)/
g..,"
0
t__l__
__
_'_
__
0
_-_]E
_{_-',F
_O


37
_he ten largest banks in 1971,only five mainte/_ed their _-mnkin 1977.
Of the five lar_est irl1971, only _,_ stayed at 1_hisrarJcby 1_!78.
There we_ big shifts in the late 70s. _._ new Fiants, the ;_llied2_r_c
and the [k/ted Coconut Pla_t__?sBan_,each ,absor.bin_smz_llbanJcs,were
established _ 1977.
The _ise of large banks and their shifting position may be
exDla/ned bY several factoms" performance, me1_gers,aecept_mneeof feral,on
equity, and snecial govemnment supnort. The exp_mnsionof a !_ depends
to a si_fic_nt deFree on its ability to increase the intermediation
activity. _/s _ in turn, deter_dnes profit rate. Thus, theme is a
direct relation between a 1_r_c'sability to extend its inter_Led.iars.'
services and its assets. '!_elevel of p__ofitis .inttmn datelined by
the level of outpu-t.
Statistics show that the ability of Y:_nksto intezm_ediatediffers.
This is reflected by assets to net worth _-itiowhich showed wide
variation _._ng banks. Profit rates also v_r,iedrangin_ .frn_.01 to .24
for 1972, 1973 and 1974; .01 to .30 for 1975; .02 to ,21 fop 1976; and
.02 to .30 for 1977. l'_stbanks earned mor_ than 10 percent on their
_t is expected tb_t the profit rate of financial inter_aries will
depend on how well they manage their Dortfo!io and the level of their

38
inter_ation activity at a _iven net worth. L_mb___teis developing
an econometric _del of cost and revenue behavior of banks. Among others,
it will explain var._tion in.the profit rates of bar0_sand what is the
optimal b_k size and portfolio° In the me_ntim% we !_.vethe findings of
Roxas &nd _eyes (1980) that profit rate and int_mediation rat_ _cre-
hiF_ly positively correlated. Int_diation rate was reflected in assets
to equity ratio.
_]e effect of size was tested by reg_essi_ net income on equity.
%3herewas a ve_y high positive relation between these variables but the
elasticity at the mean was less than unit_/for all years exceDt _n 1974
when its w_!ue was 1.02. This imDlies that profit rate did not increase
_.,Tithb_mnksize. R2s were ve_y hig1%ranF_J_g from .85 to .92 for all
years except in 1,972. R2 was .04 then. The students interpreted the
1972 result as reflecting the unce_t,._intTJdue to the declaration of
Martial Law in that year.
_ other factors contributed to the _%r_h of individual ]_nks --
merger and forei_ equity contribution and special gr)verr_entsupport.
In 1973, the l_netary Autho_.i_7adopted a recommendation of the 1972
I_iF?_ssion to the Fhilippines of increasing the size of commercial
banks and their equity contribution. Each b_k was requi__edto have at
least _100 million equity. F_rly this ye_ (1981)_the Universal BanP_ng
l_w_ _as _t in effect. _nis law further encourages size growth by
merEing and other mesas. Uniw_rsal bmnking status is _Frantedto banks
3The law frees commercial and other bsnks to engage in m_ay activitieswhich they were former].vr_stricted to do such as acceptance of d_nanddenosits by savings P_ _mndacquittingequity in other financial and non-fi_nncial enterprises by all _r_s.

39
with mor_ than ._500million equity. Since this re_lation was imposed,
14 banks _.havemerged into six and ei.g,hthave accepted forei_ capital,
including,three that merged.
In addition to forei_n equity,,two large sources of funds became
available to some banks. The [.h/tedCoconut Planters' Penks's e>fcra-
o_dinarily _apid _h was .mainlya result of the deposit into this bank
of the large revenue from the levy on coconut output. To illustrate the
dimension of the support_ we point to a conservative estimate of revemue
collection in 1979 of arol.mda billion pesos. _Therate of levy was
l_ough!ycalculated to be from 30 to 50 [_rcent of the export value of
coconut pl_d_ct. The tax _oceeds do not ,_oto the Treasury but are
deposited as the fa_e_.s__ _ ' con.tr_ibutionto the coconut f_md at the [_PB.
Except for minor allocation to subsicb'.zedomestic oil consumers (20 per-
ee/%tat most of the levy)and for _,e , -._ ":.,J]claa.:_hz.D(less than 5 percent), the
fund remains under the personal coni-fn],of the officers of the __Tilippine
Coconut Authority, the UCPB m_6 the [gmitedCoconut _ill_ms ([kicon).
This rather /rreLn_larlevy and its <lis_sition amo_mt to a g_nt of
confiscatory power to PCA_ monopoly of a so,raceof fund to the UCPB_ and
a monopoly of export and milling to liD/con. _e efficieu_cyand equity
implications of this legislation are alarming but are not wit]'inthe
scope of this paDer.
A similar explanation aDplis_ to the rapid eroertl_of _ other_ise
modest bank -- the Re[_ublicBank, __heproceeds from the export levy on

4O
sugar also __ointo this hank rather than to the Treasu__y. In addition
to these t_ cases of very special support_ ].o_Jnsfo_ capital expansion
have been granted by the Central }:_a:_kto selected ba_(s since the _ule
on merrierbec_nme effective.
The following domestic bar_<shave merged:
I. Bank of the Philippine Islands (existing)and People's Bar_<andTrust C_. _ later with the Commercial BaT_:and 1_rus-tCompanT¢
2. Pacific (existing) and _eogressive Cxm_aercia!Ba_k
3. First Insular Bank.of Cehl with B_k of Asia and /_nerica (.nowInsular Bar_<of _aia and 7k_emica)
4. PCIB_ (existing)_ Fnilippine Bar_<of C_nmerce and _,lerch_itBan}cingOorporation
5. Associated and Citizens n_ _Associated Citizens Ba_<
6. Manufac±nrers and Filininas nc_ Filmanbank
7, The l_nd Bank absorbed the _I_ncomDevelopment Corporation.
The following accepted equity .eromfcmei_ investors:
% of Equity
Forei_ Investor Pa_ic._._ation
i. BPI Morgan Guaranty Trust Co. 20.4
2. Corot-rust Chase t_anhattan Bank 20.0
3. FEBTC Chemical International Finance 12.7of New York
4. Rizal Commercial Continemtal International 30.0
Banking Corp. FJ.n_TceCo,_p.
5, Security Bank Bank of Nova Scotia 30.0•_rust Co.
6. .TradersRoyal Bank The Royal Bank of Canada 30.0
7. Feati First National City Bank 30.0of New York
8. General @indlayVs Bank Ltd. 31.22

41
4. Cor_n_cial BarJ<Organization
We looked into a _ossible mDno:nolybase of the large private
dc_aesticbanks as indicated by theJ_crelative impo_tance it)the sector
and their conglomeration with othe_ co_orations, financial and otherwise.
The 26 private domestic banks are.ranked by their 1978 asset values and
divided into three groups -- large, medium, s_nallhmlks. In 1978
and 19799 the s}_re of the largest five b_ks was quite _large(35 percent)
and that of the nine largest mo_e than one-b_xlfof the .privatedomestic
b_nk assets, Their shaT_ dl_pped to 31 nercent _hen t_<e_ in proportion
to the whole co_cial banking sector,s/z_cethe _._ and the forei_TL
sector comDrised a large ___roup(almost 40 nercenZ). In spite of their
large share_the large b_r_csdo not seem to nose at present a basis for
oligopoly power, __e ._ and otk_eri/overnmne_tbanks for_dng a ve_¢ large
$TDup can operate as a stron[_co0nte_rai!inq force aga/nst the large
private domestic bay_s. And the fo_'ei_ branches,though not a dondnant
group, operasthe domestic sector to some fo._Peiqncompetition. We mi_._ht
anticipate, however, a further concentration of banks under the universal
banking.,law and with the forthcoming (July 1981) deregulation of inte_est
rates. Already this year (1981)_ Bank of the Philippine Islands merged
with the CorxnercialBank and _rust Company Jm a move to acquire a
universal bank status. (Please see Table 3.7.)
Moreover, we find in Table _q.6tha.tsoraebanks have been able to
incr_se their size rather rapidly. New giants c_u].drise overnight such

42
Table 3.7
_C_'_/.AGE .gI'_RE IN CG'_'_,CLkL PA_E<ASSEfS OF %_-F.,LARCZ_,STPRIVATE BAI:'.E<S,']:._ _'_' R D T}_ FOreIGn[B/_n<S,
1971 and 1978-197.9
1971 1978 and 1979 O3mbined,Sharein Private Share in Share in Private Share in.DomesticBanks All Banks Domestic Banks All Banks
Top Five 31.7 20.5 34.6 19.5
Top Nine 50.8 32.6 55.0 31.3
Second Nine 29.4 18.i 31.0 18.1
Private ' "Domestl _ to ToIual 61.8 59.3
PNB to Total 26.8 25.9
Foreign to Total 9.7 12.9
I_%ilippineVeterans Bar_ 2.1 2.2
Source: Table 3,6.

43
as Allied Bar_<and the thlted Coconut Planters B_%k. _"3_erewas great
volatility among banks and even among the giants. Between 1971 and 1975_
and 1975 and 1979, only _D amon_[the top five rema/ned at the top, with
the ten _al_!_est,_s_hifting&_ong themselves in their relative sizes. Three
banks failed between 1967 and 1976, t_D of which were z_established under
4new names. S_%11 ]._nksmight be vulnerable to merger. The absoz_tion
by the i=nnd[<ar_of Baneom _evelo_x_t CxxVxg_ationrapidly increases its
5relative importance and adds a potentially large bank to the system.
More mer_ers and foreign equity l_artieipationmay be,.exT_ectedin the
future if universal bankin_ proves Dr_fitable and as a way to absorb
weak banks.
The universal banking law allows _gcial bar_¢sto invest in
other banks. One possible d/rection is for some large banks to acquire
controlling interest _ sr_ll sav/_igsand _iral bar_s_ especially those
t_t have not been so successfull}/oper_,_ted.We mi_ihtalso expect poorly
managed rural bar_<snot to be able to compete wi.thlarger banks under
unregulated rates. In such a eas% they may either fold uI_or ...beabsorbed
h5_ the larger b_nks. In conclusior_we have _easons to expect increasing
concentration of banking. [;itha large goverr_tentsector and an active foreign
sector_ such concentration may not result in oligopoly pr_'eing. _r_e
danger Daused .byt_is kind of market s_T_e,tur_e,is diff_re,nt.
4We have no l_eportas of t]_/sdate on tlaisnewly-establishedpublicly supported bank.
5The Allied Bank and Intembank took over t_ of these.

44
5. Conglomeration
Philippine business is a!lege41y controlled by Froups of f_i]ies.
One observes the 7_bel-Ayala e_nteriprises, the }_at, _ladrigal,Disini
groups of industries, _%ndothers. It is not easy to docmnent controlling
int_?est, less so%group cont_ol of business. .Thewomk of Jo]m Dohe_ty,
a Jesuit, documents "theaffiliation of firms through their interlockinz
directorate. Interlock/ng directorate, bv itself,does not mean contro]..
_re information such as equit_Tshare is needed to be mb!e to measure
the extent of control of a group of entrepreneurs over a set of firmz
But such information is not readily available. Position in a finn may be
used but this c_%nbe confounded in the relationship of officers to the
head of a %roun of fir_s. Intea,lock/ng directorate may underestimate
the influence of one f_._ilysince it tr_ces only each director's firm
affiliation, not of _elated individuals. The sons and daughters of
the head of a eon_{lomeratemay be fa_ed out as directors to different
firms. Each may interlock _,_ithone or two other fir_. The relevant
interlock is the whole fami].y_s,not each son's or daughter's. Individual-
based i%terlock does not therefore,distinguish family affiliation nor the
quality of directorship, @%ether a director is a principal one or not.
,Despitethese qualifications_Doher_cy'sstudy F/rovidesa zood sta__ting
point at describing the affiliation of the major business enterprises
in the countr_jand provid_ some insight into possible controlling grouDs.
Ev_ at the individual level, the affiliation he found was ver_7
extensive. !ntere_tingly enough for our purpose, he uses comm.er_ialbanks

45
as the basis of affJ_!iation. We e_ect that in ;_st eases the
interlockLng directoz_ateinvolves conclomeration of varying degrees.
(Cmnglomeration is joint _.mership of several firms.)
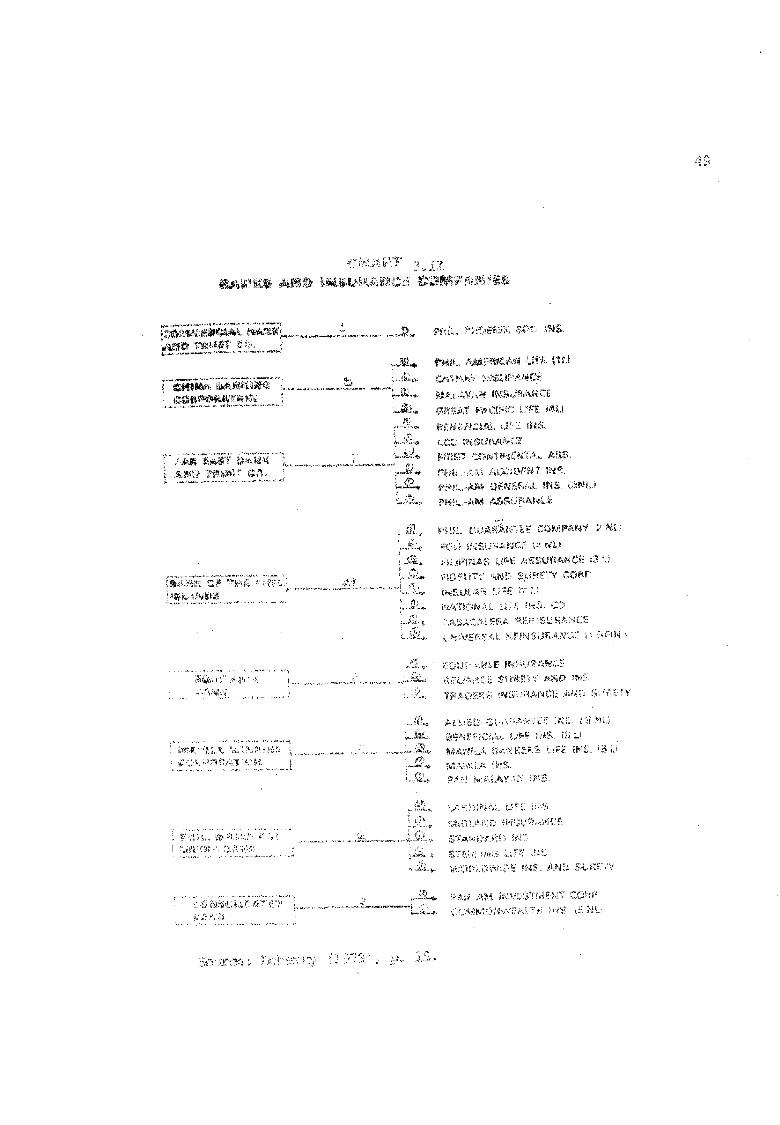
Dohe/_tychose 12 private domestic banks which {.ncludefive that
belorkqto the I0 largest in 1877 and four controlled by rm%turalized
C_%._mese._leir 605 directors wem,etraced to d%e directors_dp of the
top 1_000 co,Donations .inthe cotmtry. The banks were selected on the
basis of available data and they ]_ppem to revres_]t all size groups of
the industry. The affiliated firms weme then classified into find industrial
_0_OUDings. We reproduce on page 47 his summary table and two charts
on financial affiliation.
To be noted is the prevalent interlochir_ directorship of eon_ercial
banP_ with two oth_ _,]pesof fin_.ncialintermediaries -- investmemt
houses and insurance companies. 'Fniswas in spite of the la_,(Presidential
Decree No. 129) which prolibited interloc_in_ of banks anl investment
houses. Such interioc]<J_ng:_increases the _elative importance of the bar_<s
in the firwzneialmarket. For __nstanee,the Bank of the Philippine Islands,
one of the 5 largest bank% interlocks _ith t_9 major JJ%ves_ent houses
and several large inst_ance companies, the Far East Bank interlocks with Philippin,
American Life and Genen?allns_manee Co., the largest insurance company,
_nneom Development Corporation_ the largest investment house_ and
the Private Development Corm_on_tionof the ._%ilippines(PDCP)_ another
large investment house.

46
Ba_< inte_locki_z _th non-f_qncial corporation is found to be
very ex_ensiv% coverin_ food, const_ction _ _ining, metal, chemtical,
household apD3/ances_ heaw e(lui,_nm_mt_ textile, ph_maceuticai, _pem,
shippJJ%g,_eal estate and petroleum products. To illustrate the
extent of interlock,of five large family F/Pup enterprises and their
bank$ we _ro4uce Table 3.7. [bhert_zfu_ther considered the industrial
conc_tretion of the interlocked _upo _-btethat the fi_ studied
were from the top 1,0O0 corporations meaning that,they were the largest
fillns/_,each industry. He found si,qnific_ntconcent_cationamo1%q_,some
of the conglomerated fi!_s.
(_nglc_aerationadds another complexity to the working of our
financial market. It could influence i_,eallocation of funds especially
wh_l these have to be r'ationed. The financial syste/nconsists of a
large public seet(m caterin_ to _miority activities or borrow__rs,a
large conglomerated eonme_cia! and f/_zncial corporations, a small
se_.ent of nmn}_sm_l! _ura].and savings ban]q_and a neglected sectmlties
market. We cannot exFect competitive trading in such a financial
.n_nmket.

47
Table ,3.8
_ _'_ BY I_USTRY,1977
Ban]<of the Philippine Islands C?m'ma-RizalBar_dmg
Zobel-Ayala Q_up Yuchengco-Sycip Group
8 Petr_Jle,mland Chemi_l Companies 5 Minipz Comp_nie_2 Mining Companies 2 HearT/Equipmemt ComE_nies2 _,mel-oLuez_Com_ies 1 Fertiliz_ _ Company2 Aut_mbile ComI_.ies 5 Automobile Co_,iesT_,_le Compani.ep B Te_ile Compm_es
1 _/Ip and Paper C.c._r__V 7 PulD and Paper [email protected] Real Estate C_x{]ies S P_ceutical Comparies2 Hotel Companies 2 Tobacco Companies2 C__munications C_panies 2 Con_tanicationsCcm_/es
Fa_ East _nk and 7_st C,omp_Zr _,i_niiaBa_Yk.j_ngFemnandez and Yulo Group Puyat Group
3 Che_.icalC__!)._ies 1 Chemical Con\nany8 Hining Ccmpacnies 5 ?_ining_ "r "<_mpan_es
2 Heavy EquivalentC_m$__ies 1 _._.loomw+-_Company3 Automobile C_:i]mi_ies 2 Automobile Companies3 Te_ile Companies 3 Textile and Fiber Companies5 Pulp and Paper _:_ducts Cc_panies 1 Pt_Ipand Paper Company1 Pha_aceutiea! ComF_rly 3 Shipping C_@aniesI Tol_eco Con_rp_._y 1 Real Estate Cosanany3 Sl/pp_ Come.hies! Real Zstate C_g:_ny2 Ibtel Companies2 C_x_nunicationsComr_nies
Insular B_9< of Asia and Ame_iea
Aboitiz C_up
,I Hea_] Equipment Comlx_ny1 Industrial _e.... e,-._=Cor_.tnany3 Automobile Cmm;_mmies
2 Pulp ar_l Papem Companies! Tobacco ComT_y5 St_pping " ' "C.r_nI_es
Source: Dohe2t, r (1979), pp. 98-9:9.

,_,_..........._._,, _!_,_ _,_,_i'_ i i_" _,_'U_ _ _._._
_: _:__;!_.i,._'!t,_._i,)_ .%._.._ _ _..........,_'_.:..................#'_i_.,.,._"_ __._i_ '
im ._ _'__,,_;_,._: _ mi •_...................... _
t
_._ ..... ...... , ........., , ......................_,_,_,_,,.,_,_,_,:,_,_,_ _,,i,_ _,is,_',._,_! _:_,',,.,.,t'_,_ _"_.............r_ii......................................... i.
_,_,_i!_, _'_:__ :,_'",_?'i':'_: (_;, _':_i_i,";:_,_N"_'_;_",%}__,'__I,_ r_,_._f:__ _._,A,_._e; ..........................................................................:_ i_"!:_'._l_'_,;, _r
....................._-........................ '_'""; '_'"_',_"_"_i_:"':,::i_:':'_ _::_'"'_::'_'_)_:I'_,_ti _%_Fr ',_','i__ i , "_'_"_ S,_,_,_._,_ _]_,
_!,_. ,_,_,_,_'_i,':'_f'_, _ _iS' _'_;r::_l,;.,"_,_"_'_,t'_'l-
[
'].
,?._;_"L._,_._,__. , :_,1,..,_,,_._ _,_.,_ ...... _ (._,._
.... _o!:_,__3 _ ,_,_ ......
_,.-:_,_',.... _._!,:,..,-_k_ IkIJ_iJ F'k_I_C'._,,
_'_ _:'4.._,',., '+"
_,_,)_,_,; .... ' " ',,........ ,................. flZ,.'. ............ . ....... '.7', "
..J._
............................................_ .....",_,-_'." _,::_._,,_:._ ;,k,__.'.':!._'.,l_:_-_A,',:_
_' i_,k_i..'/'_'_.i._',_,'",,'_ _ ............_:"'"-, "..... :'"_'_ _,_;_':_Y_',?_'_._!'_.."_i_',l!!'_',-__ _,_b' ?_,'!':'._,'-_':'_._b,'!_ ........... '
........................................... _ ....'!.'i':'_-._"__'k&_ii!;_,.__._.k:k._:t:k,_,_'_,_,';l,:'. A'_,r!_''_':'_,;"_i_V
. ¢.
• _,..............................",i....... ,,.,=.........., ,a._. _,_kk_,,!_k,,.,,_,_,:;_k.,",___ ;:"_."::i,;._"_i _b!_:_.__:.__._
_,..,,.._.._,,, M,,,:_L:_!_.._3,i
_:,,,,,:_.-_.__:',,.r:_l':_;,i_,ik_!,,._,_'_'_:i!'.._'_
................................................. •,.,.,,,_, _:___'__,!..,_'_,i,:__ _I_,9_i._,:_:,,_.kkq_'i'_,_¢'_,I_,I!_,.,,_, :_'k:_:_,_.__;_..'_,_... " ' ....
: ,,._:..,_,_;:_t_l,_k,,_,-,,._,._U;,__ ;:_: _.,.,_':.-_, !;'-'_,,'_i,,_,'_ _,k:"_s_!_',IE_,""!'k_h_"_"_t_q_:Ik__
,.,_;.; ,_,-.,._:.. ,,_, .. ;:,',:'_,,.'':_'• ; _.... JL).:k,_,

5O
_'LaT_fliR4
Portfolio Choice Theory
From the saving-lending/borrowing decision discussed in Chapter 2,
we now go into the more complex choice of what forms of lending to n_<e,
or equivalently, w_hatforms of assets to hold saving and the initial
wealth. The literature has, as a whole, treated saving and portfolio
decisions as being r_de independently of each other. The literatu__-
concentrated on the behavior of asset returns over one time horizon and on
methodologies for ar_iving at efficient portfolios. This focus allowed
the neglect of the wealth effect on portfolio choice and_ therefore
the interaction of saving and portfolio choices. Such neglect I/mits
the usefulness of the literature in _mderstanding the effects of wealth
distribution and growth on the equilibrium market portfolio and behavior
of asset returns.
Portfolio theory starts with a given value of wealth whirl]is
to be held in alternative assets. In order to link portfolio d%oice to
saving, we may argue tl_t the reinm_nsand risk to alternative portfolios
influence the saving r_te and therefore the value of wealth in the
succeeding period. This becomes the new wealth level to be allocated
to different assets in the n_ct pemiocL In a later chapter_ we will speculate
on the effect of wealth on portfolio. For now, we simply discuss the
basic portfolio theory and use it to analyze the Fdnilippineexpe_ience.

51
At "d_eheart of the portfolio choice theory is diversification. In
genera/_diversification reduces risk. _ne_e a/_e_ however, innumerable
ways of diversifying from a set of available assets. The theo_
specifies a neasure of risk and provides a methodology for obtaining
the best or _e efficient portfolio choice set. The desired ]_rtfolio
is to be chosen from this se_ using conventional utility,maximization
model.
Theme ame two types of risk in financial assets -- risk of
default or cmedit risk and risk due to uncertainty about returns. The
latte_ risk is measured by the vamiance of returns. Other measures
have been SUF_ested such as the h_lf vamianee (taking account of
negative deviations from the expected returns only). The total vamiance
of meTurns _s been the most accepted measure in theoretical as well as
_ieal studies. This measure;is particulamly Suited to measuring
risk of equity,issues.
Alternative portfolios can be formed out of N assets including
one-asset portfolios of I, 2, ..._ or the Nth asset, -Eachportfolio
gives an expected r_turn, P_p equal to the weighZed expected returnsN
of the assets in the por<folio_ 7 xiE(Ri), xi is the proportioni=1
of wealth invested in asset i and R. is its observed returns.l
The risk of a portfolio is not as simply estimated as portfolio returns.
Financial assets are subgtitutes of each other and exogenous variables

52
tend to affect their returns in the same diraetion, For these reasons
returns of different assets tend to be positively co__relat_]>thouF_
there may be special cases where the correlation is negative. In either
case, Re risk of a portfolio would depend not just on the own variances
of the component assets but on their covariances.
Risk of a portfolio, Vp_ is thus measured by
Vp _7.xi [ x.]coy (R.,_R.]) (!)
N
[, X. : 1<=1 .l
Assuming perfect divisibility of assets or portfolios, innumereble
portfolios can be formed out of available assets. We may imagine a
space of portfolio returns and risk that can be derived from these
assets as pictured below,
VZ
L'_ R
P
Chart 4.1

53
Some are inferior to others in the sense that their risk is greater for
a g_ven level of return. 1%_epositive outer b1_[mdaryof the space of
portfolio ret_n-risk is the best or the efficient portfolio frontier.
Along the frontier, risk is at the m/r/mum at every level of poz<folio
return, or return is at the maximt_,at every level of risk.
The efficient fl_ntier of risky assets, EME, may be solved
P_fquadmatic progranming. For each value of portfolio _et_cn R_°",we
find the portfolio that minimizes the portfolio variance V . Givenp
N assets,
N N
min. Vp = i!ixi X _ coy<m,R) <2)j:l ] • ]
N
s.t. [ x. = 1i=l a
N
[ x. E(R.) = R*j-1 l l p
A portfolio P is defined by_values of the x. 's.l
x. - PiQii w
P is the price and Q, the numbe_ of units of asset i.
W is total wealth.

54
The av_<!ability of a riskless asset, or the _ssibility of
lendi_ or borrowing at a r/,-_<lessrate P_ generates a new efficiant
frontier. We shall call t]_s market line. As sho%m in Chart 4.19
the new frontier dominates the efficient fl_ntier of risky assets.
•Wealth cm_.now be held in alternative oombinations of _%e risPdess
asset and any efficient portfolio of ris]_ assets R .P
(3) = ymmr+ (:-P
(4) V = (1- x)V*P P
R_ is the return on an efficient portfolio of ris]cyassets with risk V_.
13misimplies that the cc_mbinationof expected returns and standard
deviation _rovided by portfolios involvin_ risk-free asset F and
an efficient portfolio R must fall along a straig)_tllne andD
passing through RF. 111edon_irk%ntline is that @_ich passes
through _ and is tangent to the _ ctu_veat portfolio
M. _<s new frontier w_hichdominates the frontier of risky assets
is now considered the (efficient) ma?ket ]ine_ R_4Z.

55
Once the efficient frontier is derived_ the theory applies
conv_itional economic tools for optimization. A two-variable utility.
function, U(R#, V) wheme dU-_,>O_ and dU < O, is assignedp dVpfor each decision unit. q._e U-functions are reflected in indifference
6curves that are positively sloped to reflect risk aversion. They are
assumed convex and non-intersecting_. The tang_icy point between the
efficient frontier and the indifference curve of an individual gives
b_s optim_l point.
Theory assumes t?mt _ is the lendin_ s_d borrowing rate.
Individuals chooose along the dominant or the efficient market line_
R_Z. At the tangency point M_ where portfolio is purely of risky
assets and holding of risk-free asset, x F is zero. Sc_e may choose
points below M where xF > 0_ some at M where
xF = 0, others above M where xF < 0. Investors of this last type
to invest in ris]q_assets. Their holding of portfolio M is
greater than their origirml wealth.
6Some people may be plungers, some risk-lovers. We expect thatrisk averse individuals form the n_jority we_Ithholders and that theformer two types do not significantly affect the determination ofmarket returns.

56
The micro armlysis ].(!_dsto the derivation of the a_regate
d_r_nd for the riskless asset at given values of r:[skand ret_mns of
available assets @rich generate the efficient frontier. As assets'
risk and meturns change, the _. curve shifts, and so with the ._
line. We can therefore arellyzeeha/_es in d_d for riskless assets
(or risky assets) as returns and risk change. This was very clearly
illustrated by Tobin (1958). From her% t]%eefficient market model of
Fama (1965), Mossin (19-_6), Lintner (1965) and Sharpe (1964) developed.
_£arket adjustment under competitive assumptions leads to the equilibrium
rote of ?eturn of available assets. This is reviewed briefly below.
The model assumes equal distribution of information _nong
investors, perfect divisibility of assets, zero transaction cost,
decision ove_ one time homizon and equal lending and borrowin_ rate
at _. The f/rst ass_m©tion implies that the _nrket opportunity
curves P_ and D,Z are the same for everybody. Individual
portfolios will differ depending on their preferences. Their opt._nal
portfolios will be the tangency of the.{rindifference cur_e and _Z
the market line. Assundng equal borrowing and lending rate at the risk-
free rate_ some will be lending_ others will be borrowing. Those whose
opt/n_! point is to the left of point _ will be lending, i.e., the/r
holding of risk-free asset (say, bank deposits) is positive. Those
to the right of M w_ll be borrowing and holding a portfolio size
greater than their wealth. The market is at equilibrium at the tangeney

57
point of n_irketline Y%/{, and the E$_ curve. At this
tangency, net holding of riskless assets is zero and there is equality
between available assets _mndtheir dermm_.
K
If the aggregate value of lending, [ _ Wk k:l_ 2 ... K individuals_k-1
is not equal to the ag_egate value of borrowing, prices at securities willK
change. More precisely, if [ _ Wk > 0, theme is excess supplyk=l
of misky assets. Rett_?nswill go uD as asset prices fall. 131iswill
shift the EME and the RFMZ curves upwar_ leading tO substi_.ition
of mis]_ assets for the risk!ess assets. Asset prices would continue
to change _itil total lendinZ is equal to total borrowing and the
excess supply or demand is el_mninated. Note that equilibrium in the
market mea%s that the total hold_]g of the riskless asset is zero or
deposit holding.
From this equili[mciumcon<]itlor%the nDde],proceeds to the
equilibr/um structure of rates of retAmn of risky assets. Conside_
portfolios of any asset i and M ?ortfolio. The expected return-
variance of alternative portfolios of asset i and M will look
like /_/ curve. /_4i w/ll also be tangent to the _ curve
' _LFM,:_, 'Ei'_ andat M where xi zs zero_ xM : 1. Since _
/}_ are all tangent to each othem at M, their slopes are equal or
6o(R )
_o(R.)/6E(R.)- _(R_ at x.: _ : 0z z 6 zP
Evaluatin_ t/_ederivatives at xi - _ = 0, we have
coy(R._,_) _ o2(_) _(_) (7)• i)- : -

58
To get an expressi0n for expected retur_ on asset i solve (7) for
E(Ri). This zives
i = 1_ 2, ... N.
The misk premium in the expected return on asset is
E(Ri)-_%)}:(Ri)-_F = [ 2 (F.) ]°_(Ri'r%)=__v (%,_) (9)
i = 1, 2, ... N.
Equation (9) applies to all assets in the.mamket, k is the average
premium or Voice per _mit risk in the mamket, and the _isk of assetM
i is measumed by cov(Ri_ P]_). The cov (Ri, _) = i=1[ x.lcow (Rj_ Ri)
i = i, 2, ... N. Equations (8) and (9) p<ivea testable hypothesis of
the CAPM.
The tests of the model or,the more advanced security _3rkets
such as the United States and Britain _ave mixed but not altogether bad
results. The random walk behavior of security pPices whi@l was observed
as early as 1900 by Bachelie_ and later b] Cowles [1937]_ Kendall [1953],

59
Roberts [19593 and others al-econsistent with "theefficient ms_,_ketmodel.
l_e f_nous _x_ks of Samuelson [1965] and Mandelbrot [1966] conclude that
prope_!y anticipated _ices fluctt_te randomly. The studies of stock-
split and its announced effect on future security prices arealso consistent
with the assumption about the quick spread of and fast action on new
information [Fama_ et al. 1969]. [[hestudies show that prices adjust to
a new level fairly quickly so "thatno serial correlation of prices takes
place. An evaluation of perforrm%nceof mutual funds shows that as a whole_
they earn no better than a random selection of assets in the market. These
studies conf/aqnthe predictions of the theory's assumption about the
distribu-tionof information. 'Fnemarket would not behave as observed
if this assumption did r_otbear.
'_]emore di_ect tests of the efficient market theor_ via the
asset pricing equation :i_aveless conclusive results_ A positive relation
. _ of the market rate _ hasbetween security returns and _3
been obt_a/nedbut the predicted values of a0's _nnd e1's were not
_lways borne out. Variants of the pricing ea51ationhave been developed
and tested including one which takes n_rket factor_ rather than risk-
free assets as the other alternative to risky assets. It may be concluded
that the empirical _alyses h_ve not demolished the efficient mamket
mode].. On the cont?ary,there has been ample sup_port/fori% given some
qualification.
60
We pres_Ited the efficient market modelas an _lytical frame-
work fo_ o_ st_Idythough we knew beforehand that some of its _jor
assumptions _mve to be relaxed to fit Ph/!ippine conditions. A prelimi-
nary look at the n_rket leads us to conclude that ther_ are significant
imDer.fectionsther_ to war_ant a ref_lation of the model. The mote
serious imperfections are identified based on casual observations and
their implications on individual _d market be/_vior, analyzed. In
particular we discuss below indivisibilities of asset, apparent
imperfections in knc_;ledge,se_:_nentationof the market arising from
physical barriers, and imperfections other than the above and their
implications on risk-return relationship.
2. Indivisibility of Finsncial Assets
The importance of assets' divisibility lies in the size of
the wealth consent of individual decision traits. In the perfect
model of portfolio selection, e/_oiceis _ade out of a set of efficient
portfolios. 1_e value of wealth of a given portfolio k, _ isn n
equal to [ Pj0j = [ xj_._ , where P. is asset price, Qjj=l " j=l 3
is number of s_res of asset j purchased, x. is proportion of]
wealth in asset j. _Wnenassets are d/visible the x. 's can take on3
any value from z_o "_oone, 0 .<xj .<1, and we can have the largest
possible set of feasible portfolios.

61
In T_st markets theme are assets t_-_itare denor_inatedin
relatively large a_o1_ts. There _e always_ however, divisible cash
and savings deposlts. _9henthere are indivisibilities, say, of assets
j, j - 1, 2, ... m with divisible assets £, £ = m + i, ... n,
may take on values in multiples of Pj only. Feasible Dor_follos
will be
m
9:1 _ " £--m+1
where
n m Q,P.
Qj are integers, [ x£ = 1 - X_=m+l j=2.
The presence of indivisibility will result in a smaller number
of possible portfolios 6_d a discontinuous effieiency locus since the
portfolio ce_n_otbe varied by _nall ch_mges in the x. 's.3
Given a wemlth size, the larger the denominations of assets, the
smaller the number of possible portfolio alternatives; and the sm_xllem
the value of wealth to be managed_ the _maller the ntm%berof feasible
portfolios for a given degree of indivisibili?y. To illustrate ;_n
extreme ease of two assets, one perfectly divisible cash or.deposits
and one of denomination P2" If P2 > W_ then the only feasible
portfolio is a one-asset portfolio of cash or deposits,wheme

62
_ _ individual mayXcash or deposit " 1. Or we may take a u_se where an
choose between t_ indivisible lar[_e-denominatedassets, t_mt is_P1 P9
and A 2 with prices PI and P[) where -it+ -_ > 1. HisPl P2
portfolio choice c_nsists of P1 + (I - -_-)W and P2 + (1 - _-)W.P1 P2
(1 - -_-)W or (1 - -_)W will be in cash.
The effect of indivisibility is to lin_itthe number of feasible
portfolios fr_._which choice is made. Unfortunately fo_ the average
Filipino saver_ there are mary indivisible assets in the market_ _,Di_
(without recourse papers), equities and even government securities.
3. Market Information
There are -twosources of /mperfection in knoled,eein the
financial mal_ket. The average amot_t of information about each asset
differs_ _,.e._ some _oe more,perfectly known than others, Secondly,
information about each asset or about the _arket as a whole is [mequally
distributed. In the _<_lippine case_ thel-eis practically perfect
/nformation on savings deposits at con_nercialand savings ban]_sand
possibly near-perfect infor_nationon t/me deposits of differing
maturities. Information on money m_rket instrmnents
a n d lending instruments without recourse is _igly imperfect and
is possessed by only a small n_miberof surplus units. There may be
more published information on equity shares than on _oney market

63
instruments since the stoc}-exchange regularly publishes reports on
trading in the mass media. M_ny registered cor_Trations issue financial
statements, Though this information is available its interpretation is
no easy mattem. _ere is no straight-forward way of estimating
expected yield and riskiness and accepted methods involve difficult
calculations and are based on past yield movement only.
The foll_ing sections describe the nature of major financial
assets -- deposit, money market papers and direct lending or without
recourse instruments.
3.1 Savings and Time Deposits
The regulated rate on savings deDosit prevails throughout the
economy. Hence_we may ass[_nethat this rate is well-known. The ease
for tin_ deposit though also regulated is different. In the cities where
banks compete with each othe_ the interest rate on longer maturity
deposits are publicized over the Pad/o _ n_espaper_ and on walls of
bank hildi_s. In smaller towns where there are usually only one o_
two banks_ such advertisement for funds is not done. It is thus very
I/kely t_t savers are not informed of the higher yield they can ear_ if
they place thei_ fuu_.dsin t/me rather than in savings deposits. It is
not to the interest of banks which ?.navemonopoly power in smalle_ cities
and towns to so inform their clients.

64
Anothez,case of it[reflectionsis Jm the offe_ of p_emiums to
laPge deposits in certain banks. Because of the ceilin_ on deposit
rates, barJ_ cannot publicize their interest rate offer if this b_ippens
to be hiF_ than the ceiling. Off_ of a p_,emium.forlamge deposits
is spread by word of mouth only. _xperience shows the dissemir_%tion
of this inf_tion is very limited and that unlike other news items,
depositors do not compare notes on what they earn on their wealth.
One reason is that discussing,financial matters is not socially
accepted. A rough telephone canvass we conducted showed that time
deposit rates varied between 12 and 16.5 pemceant. The maturity,did not
se_n to affect the mate. Some banks simply give a uniformly higher
intemest rate. We may cone].udethat information on the lowest yielding
savings deposits is De_fect and equally dislncibutedbut not so good
and unequally distrihlted for !m:,getime deposits.
3.2 _ney >_ket Papers.
The b1_Ikof money market papas is a secondar_/issue of banks
and investment houses. Their l-isk/ness,therefore, depends on the
financial condition and quality of management of the issuing institution,
The ?isk of a bank-issued money market /nstr_nent would be equal to the
risk of deposit$ for both ape liabilities of banks. T%eme is _Peater
uncertainty about The .instmuments issued by investment houses since
they are less known and have weake_ financiai bases than competing
eonmer_ial banks. Being relatively new intermediaries (since 1964 only)

65
they have not been able to fully develop their goodwill. Moreover,
they are not backed by the CB for equivalent credit accs_dations
7granted banks.
_4anywealthholders in the country are still unaware of the
existence of money market papers or if they are, their information is
imperfect. There is no mass media publication of interest rate and
features of nDney market papers. Insteac_small circulation papers
such as the Business Dav_ the Bancom Review and other monthly pamphlets
regularly report on the rates. Occasionally, the market made news when_
for instance_ Filcapital_ the Manotoc Inves_ent House and Agrix failed.
The news coverage on their failures was rather limited and did not
offer adequate info'_nationon the features of the issues and why the
institn/tionsfailed. Such inadeq1_aterepo_ting has probably lead some
investors to generalize the weaknes_ of these _companiesthu_ to ove_-
estimate the risk on plaeemmentswith stable campanies, On the other
_hand,investors in the safer investment _housespmobably did not apply
the problem to their placement. In e/ther eas_ the information was
inaccurately perceived.
At this time there is no way n_ney market risk can be m_sured
from v_blished information. There bas been no attempt to measure it.
7Until t[hemost recent exDerience when a majo_ investment houseobtained CB ftnndsto meet the dew,and of its nDney market lenders afterthe Dewey Dee _p_.
66
Theme were some defaults but _Dst investment houses have been able to
bear theme,leaving the _rket risk borne bv investors equal to zero.
Reputed investment eo_npaniesand banks have even met the WORP obligations.
Risk due to fluctuations in intemest rate can be estimated from published
_eports but so faz,this has not been done, either.
3.3 Lendin_ Without Recourse
Direct lending to a _rtfolio of borrowers that is arranged
by a h_ker bar_<or investment _Duse is becoming a popu]a_ financial
investment. _he investor ass_nes _he risk of default. Its portfolio
risk depends on the probabiiitqfof default by the borrowing companies
and the choice of the lending _ortfol/o among borrowers. The degree
of diversifica_¢ionis n_ch more limited than in investment in secondary
issues of fi_mcial institutions. To compare_ a deposit or b_mk bill
is a claim aga/nst the de_:_sitorybank's total portfolio of loans and
other assets_while placem,entin WORP is for a selected number of companies.
7_hereis less information on direct lending than on regular
moneF market /ns_ts. An investor may take the recon_nendedset of
borTowers which the broke_ has evaluated and/or make an independent
assessTnentof the borrowers. He will have to canvass the offers of
various brokers. Apparently_ "thegross rate of interest offered to
clients by brokers is eompe_titivesince it varies with/n a narrow
__ange. However_ theme is significant variation in borke_s' fees
which results in a wider _an_e in net yield. Investment brochures do

67
not clearly state fees or riskiness. Fees have to be negotiated by.
the ]_nrties. The negotiation usually takes place a/.:te_the broker
has been chosen. The prohelbilityof default by a firm dep_mds, among
others _ on its financial ¢bnditions and q_lii_ of management, its
inancial condition is evaluated from the balance sheet ai_ statement
of operation accounts from wh/eh financial,ratios used in credit evalu-
ation are obtained -- short-temm assets to shore-term liabilities%
liquid assets to short-term liabilities, total debt to total assets_
and debt to net worth. Cash flow statemeats are also looked into.
Ideally_ financial /nformation for several years is used in credit
evaluation to gauge a firm's stability and quality of management. Some
investment bank managers stated that even qua]i-tativeaspects of
borrowing firms' management are considered in the evaluation.
_bst credi_ m_naF_ershere r_nnk'_ing firm_ by their credit
standing based on the al_ve criteria and make their'recommendation of
lending portfolios to their client lenders. Lend=_rs_ therefore_ have
to i-rustthe competence and ir_egrity of their brokers in selecting
their loan portfolio, om else undertake rheim own evaluation of
prospective borrowers. The cost of indivia_a]ly-conducted evaluation
is high and undertaking it defeats the very ptmpose of financial inter-
mediation. It see_s that what is needed is a systematic collection
and publication of _elit information by brokers a/reedat facilitating
investors' evaluation of yield, fees and risk.

68
3.4 .C9._rporateS,,ock,._
It is interesting to note that tredinF,in corporate stock is
regularly reported in a].l;_jor dailies and over the radio and T.V..
The Manila Stock Exd%ange also issues a monthly report,on %_ansactions
includi_ dividends. .Theseurovide a continuous series fo_ seo_ity.
_unalysis. Howev_ this study is just the second atter_ptto undertake
such an analysis so that the public has not had any useful _ide for
portfolio selection. Up to this time there is no information on the
yield-risk curve_ or on the time ser.iesof the same variables. Prices
ape hig_!y _latile -_._s<msitive to large transactions since the market
is small, There .l'sno published information on how well stock market
rate comnames with the rlsk-free rate on time and savings,depos.its
money marketeand other financial assets.
3.5. Other Papers
The _government.hasissued large amounts of long-term and shore-
term bonds, They have been held nminly by financial institutions as
_e,serve assets; sc_e_ as primary; othe-Ps_as secondary reserves. Tmeasurst
bills ere specially at-tractiveprimary reserve assets because of their
high yield compared with reserve de]_sits which have zero yield.
Because of this feature, new treasury bill issues have been oversubscribed
for by financial institutions, The purchase

69
of goverr_ent sec_i'ties as D_im_. _eserves releases to the goverr_ent
the equivalent reserve deposits by financial institutions. Its effect
is monetary e_q_ansion. The goverrm_t has also used other treasury
bills like the Cent-ralP_ Certificates of Indebtedness (CBCI) as
means for allocating eon_e_c/al bank funds to priority sectors. Banks
are required to allocate one-fourth of their loans to the agricultural
sector or to buy CBCIs. _st of the proceeds were channelled to rice
producers. There are other cumbers_ne features of bonds like the
premyo savings bond whose earnings are to be won bv lotte/_y. There is
no way an investor can estimate the average yield of the bond since
information on total earnings and outstanding value of the bonds are not
mepo_ted. This is indeed a strange gJTmTdckthat is hard to rationalize.
Consequently, it _s not become an "_ant instrument for mobilizing
_nall savings.
Private bonds have also failed to be nerketed. Firms probably
find othe_ financial sources cheape_. As in equities, the cost of
marketing is quite high. An inves_nemt house reports an und_iting
cost of 5 percent.
The foregoing describes how the competitiveness of financial
instmuments is weakened by regulations and imperfections. With
this prob!a% it is net easy to vredict the behavior of asset returns.
We approach the problem ma/nly by descrintion in ord_ to ga_ insight
into how the market works. We e21oseto study in more detail equity and
money market papers because of data availability.

7O
_m?le_ilippine stock n_ket is ve_f sn_nl! in absolute terms
and in relation to the market for other financial claims. It has been
volatile and is supposed to be highly vulnerable to manipulation by
large investors. It includes a relatively large listing of weak mining
and oil issues in which intermittent purely speculative movements tM<e
place. The list of blue chips is short,and consists mainly of well-
established companies like the San _guel Corporation, Atlas Mines,
and thePhilippine Long Distance Telephone Company, Trading volume is
small and many companies r_J_ inactive for periods of time. These
peouliam features of the mamket should lead to hig_ risk. How well
this is compensated by returns is the subject of this section. Here
we studied the p_:ieemovement of the mo]._eactively traded stocks and
estimated the rate of return and _,iskas reflected in the variances of
returns. From these estimates we obtained a yield-risk curve over a
four-yea_ pe_iod_ 1978-1979. We eonsidemed as actively traded the
shames that appear in the major da/lies_ picking_the month of April
of each yea2,as the r_f_ee date to get the newspapers' listing.
About I00 companies w_e. initially chose2%but only 72 of these had
fairly regular t_adinF,over the four-year period. Many of them
exhibited zero tma,.iingfor several months at a time. Consider that about
37,000 eo._porationswere registered with the Securities and Exchange
Can_nission.in1978. Daily w)lume of t-_ansactionsover the last two
years ran to as little as a million pesos only.
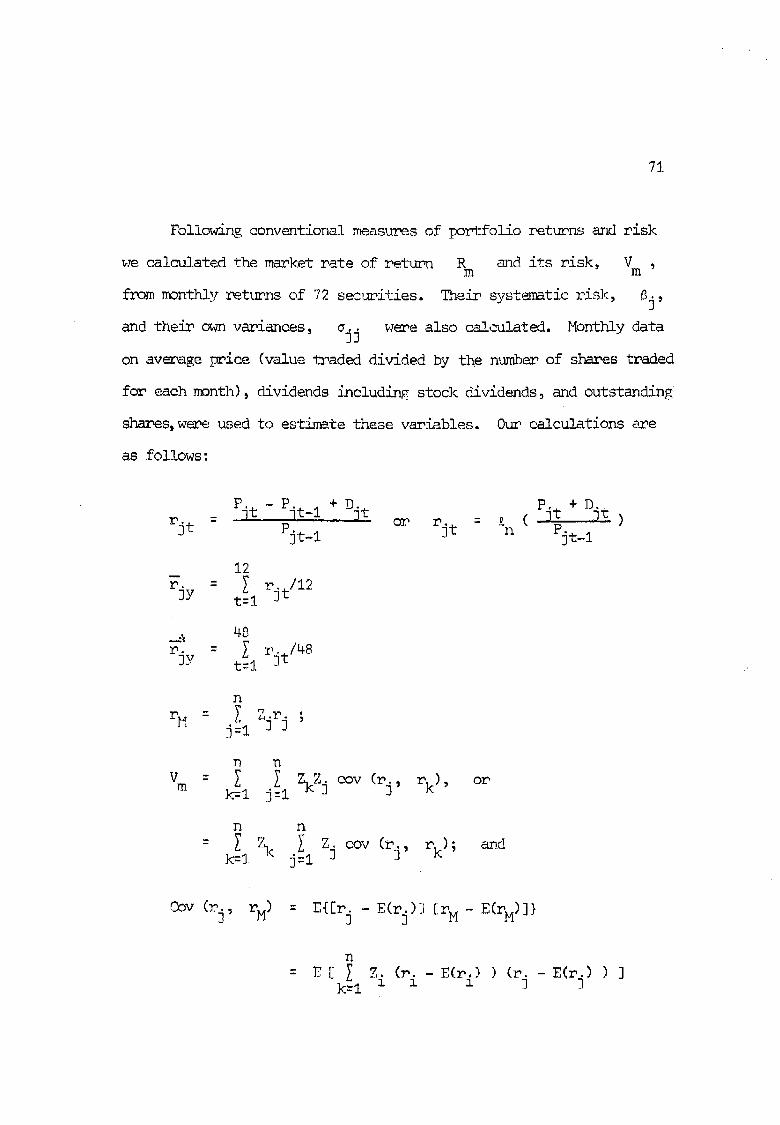
71.
FoliowirL_conw_.ntional_m.asuresof po._folio returns and risk
we ¢_leulated the market rate of _et_n R and its risk, Vm ,m
from monthly ret_mns of 7'2seclm_ities. Their systematic risk, ,_j,
and their own variances, _.. were also calculated. Monthly data]3
on average F_eice (value traded divided by the number of shares traded
for each month), dividends including stock dividends, _d outstanding
shares,were used to estimate these variables. Our calculations are
as follows:
rjt Pit - Pit-1 + Djt or _ £ ( Pit + Djt )- " Pjt-1 rjt n - Pit-1
12
-- _ _ .mjt/12r]y t=l
.,. 48_b
. = _ rjt/48r]y t=l -
n
= _. Z.r. 'rM j=1 -]] '
D n
v --[ cov(rj, ),k=l j=1
n n
-- [ Zk _ Z coy(_., rk); a_dk=1 j-i J ]
r_v (rj, rM) : E{[r.3- E(rj)j [rM - E(rM)]}
n
: E [ [ z. (_.- E(r.)) (r.- E(r:)) ]k:l l i l _J. j

72
where
r. is observed nDnthly re_Jrn]
_. is the estimate of E(r.) for a given p__riod;] ]
Pit is the average price for month t of security jand measur_J as value of trading divided by no. ofshares traded;
Djt consists of cash and stock dividends;
Zj : Q_
Qj is the total outstandiw: r_mrketvalue of asset j, whichis equal to the mont?flyoutstand/ng shares multiplied by themonthly average price summed for the whole year;n
QM = 7. Qj ; thus Z. is the proportion of the totalj=l ] ' *market value of all assets aecom_ted by asset j ;
y subscript is for the period in which the variables arecalculated, 1 year and 4 years.
We calculated the variance of security returns to have an
insig$nton how much they fluctuaZed from month-to month.
"Jy 2-- s 3y-- t-J,[:(=it - gy)2/T-1
Please see Appendix A fo_ details of the computation.
Here are some initial findings:
1) The market is highly volatile. The annual marke_tmate of return
_Dved up and down with such wide amplitude _s shown below.

73
2rM .o M = _
1976 ~0. [)033 1. 3641
1977 O.0434 0.3703
1978 n.4910 0.72q4
1979 -0.0565 0.4585
1976-1979 O. 1229 O. 7259
The h/.g]nmarket variance ref].ectsthe extrez__lyhigh variances
of the securities and the enctremelyhigh variation of their,means
with the _mm_ketmean. Annual mean return of securities rangesfrom
many large negative values to as h/_ as 1,364 percent in 1976_ 992
percen-_in 1977, 19033 percent in 1978_and 844 percent in 1976. The
range of the means over four years was 68 percent to -46 percent, much
narrower than the yearly range but is still qmite wide by developed
market standards, e .'_, 6j measured by its covariance.... _eeur,.._>risk
with the market (or _ith ,illsee_mities) _]d wei@hted by market shares
ar_, as a whole, ve_y Ilia,with a few negative values. Many securities
have values of _. ( --°_iH) g_t_ than 1.0 w_ieh means that their] 2 -
OMvariances are larger thaH the market variance. 1_e nlanberof 8's
which _havenegative values are shown in Table 5 below,
Table 5
Percent of TotalPeriod (bvered Numbe_ of 8'_s < 0 No. of Sec.
]
1976 7 9.7
1977 1:3 20.8
1978 5 6.9
1979 12 16.7
1976-1979 5 6.9

74
2) There is no apparent relationship bei_een rett;±nn_m",.drisk as
shown by the plot of po;intsof these two vari&bles, in each year
and for the whole four-year period. _?is _nplies that premium is
not being _%id for risk in any regular manner.
3) To verify the above initial observations we tested the efficient
: _ + (R - _) 8 using equation 8 oP 9, i.e.market equation_ r3 m j '
r].= s0 + _i Sj + e..3
The results obtained are shown in Table 5.2. Such results on the
whole_ do not conf/rm the hypothesized positive linear relationship
between rj and Bj. It is only for the year 1976 where there is
a significant relationship. However_ only 11 percent of the variation
is explained by the regression. For the years !g77 and 1978, and for
the 4-year period 1976-!979_ the hypothesis is rejected at .10 level.
For the year 1979_ though the result is significant_ the relationship
is pervemse in the sense that the sign of el is negative.
A
The values of s0 and _ are sepm to be different from
each other. Column (7) of Table 5.2 shows their ratios which range from
-2.8g to 2.5. The ratio of al and (_ - _) are shown in
column (8). The predictions of the model are that both ratios should
be equal to 1.0. Althotkv_hthe values of _i/(_. - RF) are muchA
closer to i.0 tYk_nthat of e0/_ , came should be taken in ma_cing
inferences from these values due to the absence of significant relation-
ship as noted.

7S
_40%
_c_l
_-___-
v
II
t
-_"C
)-_
¢qt_
_C
nC
O'_D
,'_C
:)C
'C
.,_-I
C)
q)
LD
0")C
_C
O0')
C)
LO
z'-4_1
cot"-C
OO
")C
'-J
_,_o
')(:::_
.._d-(::::)co
¢..,,_oo
L_.
(1)r.)
,_'__
-_rq
)o
J C_.,
4J
_._-__
.__'_
_..[_.
L-_
__--!

78
These results may not be defiT_itivein the sense that the
us_l stationary ass_xnptionin deziving the est/m_tes of the _ameters
of the Imderlying probability distributions of returns of securities
may not be valid.
Recall that to armive at an estimator of the expected value
E(rj) - u of the rate of return of a security j_ we used
T
• = rjt/T ,r t!l
wher_ T = 12 or 48 (months). That is,
uj - j 3"
Clearly, 1_singa larger value of T_ i.e., extending the period of
observation, will not prr,vide a better estimate for u. using _.3 ]
as the estimator irwin fact._ u. is non-stationary.]
_Thiscould serve as one possible explarst/on of the poem explana-
tory results of the re_ression analysis. If we look at the F-values or
R2 for the four-year pemiod (T = 48) and compare themwith those
of the one-year periods (T = 12)_ the former are much lower compamed
to the latter. For example, d_e lowest value of R2 for the annual
tests is 0.01071. This is almost three times as large as the R2
for the foum-year period.

77
If our estimates of the parameters of the mnde_lying distributions
of returns of the various securities are inadequate, then the fact
tkmt our m_x_elfa/led does not, therefore,
necessarily imply that the model is in_dequate. Thus_ before any
further attempt to modify the model to take into account some of the
implications of its ass_n_ptlons_ _lter_mtive estimates of the _mderlying
parameters of _robability distributions of returns of the securities
may be necessary. This is being investigated by Prancisco.
It may also be argued that this market behavior reflects
_mperfections J_ the market and possibly the existence of a significant
group of risk-lovers. _nDerfect infoz_nation_7 take two aspects ; 0ne_
is that an investor des/ring to obt&_n a certain re_n and riskiness
from his invest_ent may not Pm_ the methods by.which this is obtained.
He may ?rovea feeling that diversifying will reduce risk but the method
of arriving at the efficient frontier is tu_nown to him. Unlike other
economic decisions_ opt_Jnalitycondition cannot be arrived at without
going into complex ca/c_lations. Housewives _re assumed to a_rive at an
optimal consumption basket of goods quite accurately. Arriving at a
probability d/stribution of returns of alternative assets and estimating
their expected _eturns and risk requ/res expe_t knowledge. For this
reason, application of portfolio selection criteria according to efficient
market models is done by financial intermediaries and professional
portfolio managers mostly. In this country very few, if any, intezmediaries
undertake portfolio r_turns-risk calculations. Many of them select

78
portfolios on the basis or feel, speclai information, and rough rules.
These r_les might be categorized as satisfleing rules. It is likely
the rule differs among investors. Scme may choose fr_n a small set of
assets on which they .haveinforn_tion. Another rule might be to hold
the larger par_ of wealth in moderately risky assets and to "gamble"
the balance on risky assets. Other satisficing rules may be in use.
Satisficing behavior would seem r_sonable in a market with very
imperfect information for optic%zing over socially efficient frontier
is difficult to do.
If information is inadequate and unequally distributed,
estimates of returns and _isk will differ from the ac_lal and will
vary among investors. Some wi]] overest_nate returns or risk; some
tmderestimate them. The efficient fTontier for'individuals will form
a blurred band around the market frontier. Those bel_7 the frontier
overestimate r_sk_ those above, underestimate it. if risk is over-
estimated_ demzlndfor risky assets will tend to be lower than when
risk is correctly estimated, and vice versa. Excess de_mnd or supply
will be determined by the excess or shortage of borrowin_ to lending.
The excess or sho_age will be due to the distribution of investors
by their preference for return and risk as well as their distribution
between conservative (those who consistently underestimate risk) and
opt/ndstic investors. If optimistic investors dominate the market there
will tend to be a gmeatem demand for assets than if risk were correctly estimated.

79
Security,_ices would go up, retrainswould go down. The oonverse
would be true. _tighly/naccurate estimation of mar_ketreturn and
risk would place the (perceived) efficie_ttfrontiers of individuals
seattemed all ov_the portfolio return-risk space. The scatter of
efficient frontier will generate its own _j - 8j relations_hip
that is not necessarily positive and =i not equal to (Rm - _).
Another oonsequ_ce of 5Jnpe#feet_nowledge is that investors failing to
realize thea'mexpected returns and rgsk would tend to eorTect
their initial position. Correction unde_ imperfect information
assumption would result in greater amplitude of price fluctuations
and therefore greeter risk. Risk is thus contributed by.variation
in corporate perfoz_mmnceas well as by market adjustment to eorTeet
or wrong forecast.
In the Philippine _mrket, a Little mo_e than half of listed
stocks belor_ to the small board. 1_ese are stocks of new mining and
oil c_npanies which are still in exploration. Thus, there is much
g_eater uneer_a/nty about their eo_pectedreturns. In the past ther_
were alleged manipulation of their trading _hieh 2ed to extremely wide
price changes and therefore to la?ge losses for n/sinformed stockholders.
To be remembered are the speculations on Redeco_ O_iental and Western
Minoleo stocks, prices of which rose and dropped within a day or a few
days by as much as 100 percent. "Inside" information received too late
allowed large speculators to realize substantial capital ga/ns. Uneon-


¢_,1

81
firmed reports ran that s_,_eissuing,corporations and stock brokers were
responsible f_r such manipulations of the market. Needless to sa_ capital
Eains arising from specula!:[on_re at the ex_)enseof the losers.8 Whether
o_ not these reports had a rolid basi% the fact is tl_t price fluctuation
in small board has been ex_-remelvwide. This is seen in Table 5.3
in which the own variances and returns of securities classified into
blue-chips and snsll~boaz_ are given.
The inclusion of risk-lovers /J_the market complicates the
dete/mdnation of the equilibrium structure of returns and ?isk for.the
different assets. Pisk-lovers would optimize by selecting from the
maximum return point on efficient frontier. This would be point L
in Figure 1. Under imp_fect information and/or indivisibility condition_
individuals _uld have their own perceived efficient frontiers Which the
market frontier dominates.
EqLilih_i_n condition is that demand and supply of each security
are equal. Demand is the sunmation of the number of each security
in the optimal portfolios of all investors, D_m_nd would thus depend on
the distribution of efficient frontiers and of risk averse and risk
loving_investors. A relatively large proportion of risk-lovers in the
population would raise demand for nmr_ risky assets.
8Capital gains arising from a permanent improvement in a corpora-tion's profit rates are at no one's cost.

82
In the next chapter, we will tl_yto arrive at the market frontier and at
frontiers from some subsets of available equities. 17_eoretie_.ly_the
frontier from a subset is expected to be dominated by the market. The
subsets are taken tc be the possible choices of satisfierSo

8-3
i_m x3.A_
1. The Variance_ Covarj,_Lnee_trix
For each of the years 1976, 1977, 1978 and 1979 and for zhe
4-year 1976-1979, a varianee-covariance matrix was computed. The
format is sho_] in Table 1 below.
Table 1
I 1 2 3 .,. 72I
I_ A _ A
1 a11 a12 a13 a172
2 a21 e22 a23 ... a272
3 a31 a32 a33 ... a372
• " t .o w •
72 a721 a722 _723 a7272
The formula for the variance of a r_ndom variable X is
defined as:
_ UX)2] _ 2 22 = E[(X _[X + _X]aX = _ 2uX

84
The sample variance is defined9 as:
T_2 2 _ 1 [ (Xi _ _)2., where _ =°X - SX T- I i:1
T
- T-I _ [._-2×.,,i:l .... 1
1 T X2": T--n--f[ _- - 2_T_ 2]i=1 ]"
T1 X2
i=l i
Computationally, the last equation for the sample variance is
mor_ convenient to use.
Zhe covsrie_ce of random variables X and Y is
defined to be
_XY : E[(Y- _X) (Y - Uy)]
: E[XY - UXY - Xuy + UXuy]
= E[XY] - _Xuy.
9See_ for instance, Larson, H. J., Introduction toProbabilityTheol_fand Statistical Infe__ence,Morterey, Gml_fornia: John WileyandSons, Inc., 1969, pp. 2i0-2ii for a Proof why the divisor should beT - 1 rather than. T.

85
Y21 YT..._ as the r,andomsamples of X and Y respectively_are:
T
°_ _ sin" T- i [ (%.-×)(h-_)i=l
T1- [ (×.w.-_. +_)
T - I i-':_ .ii _. i
Again, this last equation is eomputationally _Dre convenient.
^22. The Market Bn_t.folioVariance:
_M
As previously defined, the estimate of the market portfolio
variance is :
^ n n ^
: Zk [ Z. Ojk
This is illust_ated by Table 2 below.
Table 2
I ZI[ZIOlI + Z2_12 + Z3a13 + ... + Z725172] +
2 Z2[ZI_21 + Z2_22 + Z3_23 + ... + Z72_272] +
3 Z3[ZIO91 + Z2a32 + ,_,3a33_ + + Z72a372] +
• _ t •
• w _ t
_ A 2
72 Z72[ZI_721+ Z2o722 + Z38723 + ... + Z72@7272] = OrM .

86
3. The Covariance of the Retu_,nof an Asset j with the _rket Return rM
The covarlance of the i_In_ of an asset j _niththe
return of the ir_rketportfolio rM as _re,viously defined is:
^ n
OjM = cov (rj_ rM) = [ Z. eov (]_i' r.).i=l l 3
The sample eovarianee is:
_M _ '_ : g Zk_]*[ k=l aJk
A
For example_ for j = 1_ _IM is:
_IM = Z!_ll _"Z2_12 + '3_13 + "'" + Z72<s172'
inich is the slmlof ix_w! in Table 2 above not premultiplied by ZI.
4. _lheData
Monthly _datal0 are available for a total of 72 stock se_mities
for,the entire period of 1976-1979. If the t91_ p_iod were further
extended into -thepast, the number of sec<mities t_mt can be included is
reduced since some securities are ne_ly Listed. Other se_mities are also
10The monthly data weme taken fr_n the "Marila Stock ExchangeMonthly Reviews" published by the Manila Stock Exchange Research andPublication Department, Manila.

87
delisted tbmough time so that t]aisf_her reduces the number of
securities. _he total of 72 is_therefore_the m_ximt_nnt_ber of
secumities that can be included for the 48-month period. Besides_
iithe period from 1965-1975 has been covered h51a related study,
According to the Manila Stock Exchange classification_ the
72 securities _neluded in the analysis are broken down as follows:
NmN)er ofClassification Securities
I. Banks 4
iIo Conme_ial, Industrial andInves1_emt I_4
III. Minin_ 19
IV. Sm_ll k,ard 35
T 0 T A L: 72
The ;_nthly data consist of the following specific information,
among othems_ fo_ each securi_7:
1. The number of outstand/ng shares;
2. The hi_hest and lowest prices registered for em_h month;
3. The number of shares traded;
l_l B. Perez, "Sys___atic Risk and levels of UnsystematicPisk in the Philippine Capita] _ket: A Modified Capital Asset PricingModel?," Thesis_ Ph.D._ CoLlege of Business Admdnistl_ation_[hivemsiTy ofthe Philippines_ 1979.

88
4. The total value of sb_res traded; _nd,
5. Cash and stock dividends issued.
5. VaLidation of Data
1. PH eof Pt"
Honthly data for the 48-month pe_,_{odfor the 72 securities
were.placed in the Hollerith computer cards. To ensure t_t the
data that were.punched are correct, aside from the visual and
preliminar_yinspection of the "card-to-prJ_t" list that could
reveal simple a/]dobvious errors _ a compute_ program was written
to validate and erasurethat the monthly prices used to compute the
monthly rates of return are accurately punched from the reports.
.Theprices used are the monthly average prices calculated as
the total value of sh_nresdivided by the total n_mber of s_eres traded.
Data on the following wer_ punched in the c_ds.
Pt : as per our record;
Nt : the number of shares traded for _nth t;
Vt = the total value of the Nt shares traded;
PH : the highest price registered for the month; and_
PL : the lowest price registered for the mon±h.

89
Pt - Vt/l:t was calculated fr_n the punched ezu_ds. To validate,
the following relationship _st hold:
A number of errors were caught and corrected _ this validation.
6. 'ITleCase of No Tradin_ for a Giw_n Month
If no tra4ing occurs for the month, the average price of the
previous month is used. Pemez (1975)_ convmitteda serious error
here by.assun_.np,the price as zel_o. Thus _ even if there are
divide/%d_issued_ the r_%'teof return is % in which case he
sets the rate of retul_ equal to zero, The author claims that this is
an error in the computer p_.o_ram.
7. _ Cases %'_ere PH' PL or Both are Incorrect
If either 5{ or PL o_ both _:meincorrect, the
relationship above may still be satisfied and the basis for va_]/dating_
the accuracy of Pt do not hold. ThUS :,in the computer validation
progrenm,prelim/nary calculations of the nDnthly rates of return,
their means and standard deviations, annual and for the entire
period, were included. Investigation of the relatively large
standard deviations indicated the correspond_ly large monthly rates

9O
of return. These monthly rates of retulvlare then checked for
the price charges that generated "theserelatively large rates of
retu_z.
8. The Case of a Stoe_kSplit
1_ee validation computer runs were made. The first
indicated most of the errors. The results of the second .runwere
compared _ith the first and some errors were further noted. Among
the errors noted in the second run is the ease of a stock split.
This ease was observed only for security numbem 28 for the month
of November, 1977; We _had,_r example, the following stock
split for one security.
Valueof
_. of Outstand- Nm. of Shares S_esYear/Month ing ST_res _{ PL Traded __raded Pt
1977 Sept. 2,019,103 .7 ,7 1_000 700 .7
Oct. 2,019,103 .7
Nov. 201,910,300 .7
Dec. 452,306,620 .006 .006 200,000 1_200 .006
Based on the above data, the uneorTected and eor%-ected_ates _
of return are shown in Table 4.
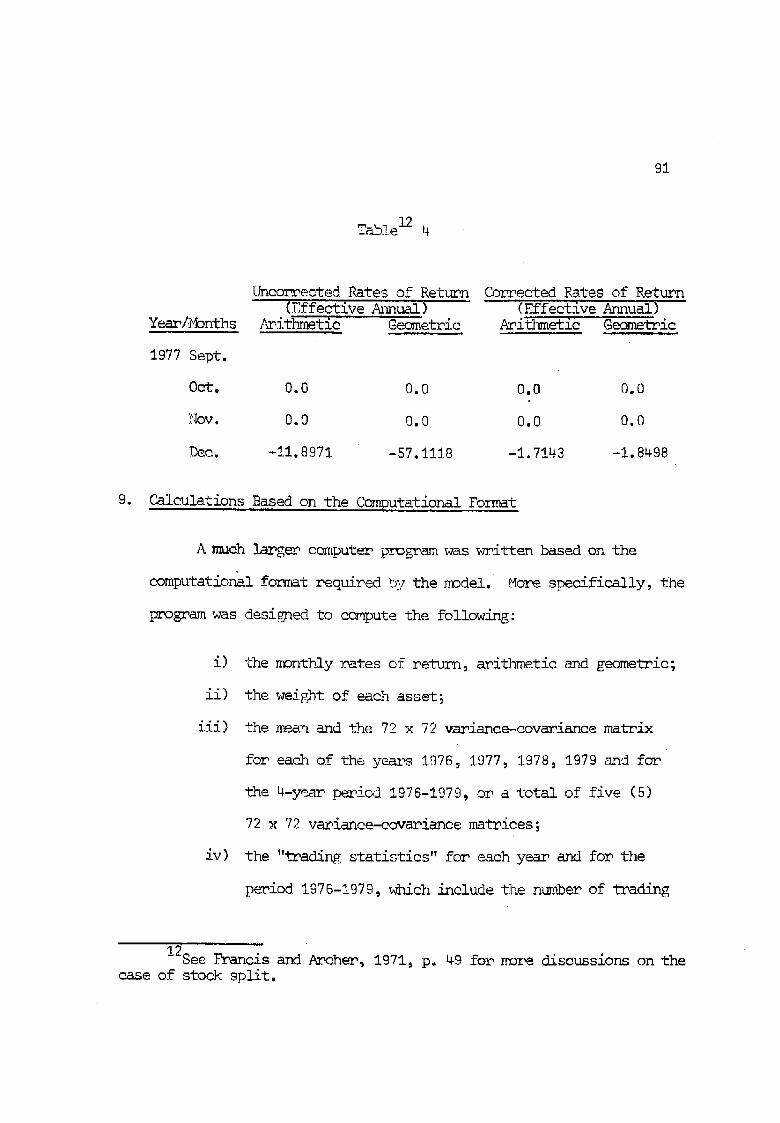
91
Tab!e12 4
Uncorrected Rates of Return Comrected Rates of Return(Effective 7_mual ) (Effective Annual)
Year/_4onths Arithmetic Geometric Arithmetic Geometric
1977 Sept.
Oct. 0.0 0.0 0.0 0.0
i,_ov . 0.0 0. O 0.0 O. 0
Dec. -11.8971 -57.1118 -1.7143 -1.8498
9. Calculations Based on the Computational Format
A much larger computer program was _mitten based on the
computational format requi_ed by the model. More specifically, the
program was designed to compute the following_:
i) the monthly rates of return, arithmetic and geometric;
ii) the weight of each asset_
iii) the mean and the 72 x 72 vari_nce-covsriance matrix
for each of the yeal_s1978_ 1977_ 1978_ 1979 arldfor
the 4-y_nr period 1976-1979, or a total of five (5)
72 x 72 varianoe-cova_iance matrices;
iv) the "tradin_ statistics" for each year and for the
period 1976-1979, which include the number of trading
12See Francis and Archer, 1971, p. 49 for more discussions on thecase of stoeY_split.

92
nDnths and the _._atioof t_ds number w/th d_e total
number of months for the period under consideration;
v) the covariance of each of the asset with the market
variance for emch year and for the enti_e 4-year period;
Vi) the market variance for each year and for the 4-year
period;
vii) the Beta c_ "systematic risk" of each security for each
year and for the 4-year period.
Moreover _ the computer program was e_anded to make a scatter
plot13 of the mean ve_rsusvariance as well as the Beta versus the
mean for each year and for the four-year period. In effect, theme
are a total of ten (10) scatt__rdia_rm_ conts_inedin the computer
print-out. The purpose of expanding the program,to _rint scatter
plots aside f[_x_its usiml _apb/cai usefulness is to serve as
a starting point for the construction of the efficient frontier14
in the case of the mean-variance scatter dial_mam,and, to serve
as a space on which the results of the linear regression between
the r.s and the 8 .s can be conveniently plotted.] ]
_3The sub-routine "plot" of the UP ComplrterCenter was used here.However, there is an error in the logic of the program resulting to aninverted data print-out in the vertica3,axis. More specifically, theva/ues are pzinted in descend/rigorder reckoned from the origin.
14The (n + i)t-_h observation is (rM_ SM), where 8M = 1.00.

93
C_TJ:_/z1"_26
_"_" _ _',...._ehavior of E_uitiesEfficien!-_._ontiers_nd __7_e.;.u-_z_
_'tepr_-c_]J3k_chanter ;_.es_'tedsome Ixtsicinfoz_ztion on the stock
market and the results of the .preliminarytest of the capital asset pric/_g m3del.
The cJnapterended speculating why the market behaved as it did.,that i.s,
the yield on seuAn2itiesfluctuated too }.Tildly:[frommonth to month over the
foum-year period studied.;there was no signifi.Cmltrelationship found.
betwee_ the risk and yield of securities, _d the_rewas no apparent
adjustment to equilibrium pricing over time. Imperfections in the market,
particularly imperfect information and indivisibility_were suggested to
lead to oor_folio behavior that would not necessarily be like the<optim/za-
tion asst_ed by poz_fo!io selecti<m theory. Many possible decision criteria
.maybe,used by invest<_s which _e_ _m_rereasonable and practical to
apply in.an J_z___feel:_rk,?.tthan the neat but otherwise s_ict perfect
capital asset model.
In this chapter_we el_nJ.ne_her -theyleld-risk distribution of
the 72 sectmities and d%nive the efficient frontier of all ava/lable
assets with positive re,tur_s. We tr_Ito see whether this frontie__ d_ni-
nates the efficient frontiers of subsets of securities. Z3nesesubsets
are considered the sets selected by satisfi_s. '__eestimation of the
frontiers allc_s the identification and comparison of the seetmities in
the market portfolio and 5_nthe t_hreefrontiers. _pital russeturic_
model argylesthe market po_tfo!io is on the efficient frontier. This is
to be tested by a comparison of the nortfolios on the f_ontiers and the

94
market. In addi.tior_we ]::topeto find a patte2_nof risk and yield
_ " _ in,perfectmarket. For,this chapter,_efle_t_ng _--'-""_ ._a_isf_.c_.ngbeha.vicmin an
th_refcrre_we de_ive alten'_tiw._efficient frontier,s -- one fr_n the
whole set of aw%i!.ablesecurities_ one on the -top20 eamnin_ securities,
another on the bi[,_bosrd which includes blue dmips and large mining
issues. We try to see to What extent the belnaviorof yield and risk of
securities on tlhefro_tiars differsflx_nthe rest and whether it
approximates t_mt of a perfect market. .Thefollowing sections
successively discuss these topics.
1. Efficient Prontiers
Portfolio selection theory,argues that in order to maximize
utility_ U_ from a portfolio of assets where U - U(Rp, Vp)_
3U/SR > 0 and _)U,/V < 0_ choice of'the por_cfoliomust be made alongp p
the efficient f_ontier as illust_ated below. Portfolios alo_y_this
frontier give the higjnestreturn _ evers,level of risk, or the lowest
risk at ever_ level_of return. Under capital asset pricing mode_ assump-
tions: equal _ist-ributionof info_nnation,perfect divisibility of invest-
ment_ etc., investors face homogeneous ___arketopportunities o__ the same
efficient frontier,. At equilibrium, asset prices will so adjust to demand
by different individuals so as to bring the market portfolio at the tangem-.r
cy of the market line and the efficient frontier of risky assets at E.
Call this equilibrium portfolio. (Please see Chapter 4.)

95
VP
EZ
.////
/= / R
RF P
Fi_Jre 6.1
At 14 all available securities in the mmrket will be in the
equilibrium portfolio, each with a share equal_ its market s_hare. At
other points_ por_.follo_holding.sof individuals will not be optimal since
they can be _nprcved by choosing the equilibrium portfolio on the market
llne _Z.
We est/mared a few points of the efficient frontier of all securi-
ties that have positive returns by_quadratic pro_er_nnming.We as_m/med

96
the securities with persistent negative _,etu:Lms would not be included
in the choice set by rDst investors. Al,_o_including them in the
program would have r_ised p_ogram cost beyond ot_ b_a_get. These
numbered 40 out of the total 72 traded. To obtain points on the
efficient frontier the following proble_ was solved.
s.t.: x. _ 01
4O
_ x. .<1i=1 1
4O
R ) [ x.R,P i=1 l
where V - portfolio varianceP
Rp : portfolio returns (in h_ndredths)
xi : weight of security i in the portfolio
i = I_ 2_ ... 40 securities
The pro_am was applied to selected values of R : .10, .15, .20, .25,P
.30, .40_ .45 and .50.
The computer progmam developed by Bates (1975) was applied limiting
the iterations to 5_000. Exce_ in three eases_ the solution was reached

ioloo
_oP
Qo
L(';C
O(:'D
..dr"03O
CO
UO
O_,
O"<
q_!
<O
I.rLO
¢_C
O(.N
_'1(D
r3)_
CO
__"
C'4
c'-,IO
"_
O]
x-IC
OC
OC
OO
DC
O".-q
er)LO
OO
00
_--IC
N0
.rl0
0-¢_
0,w
l0
0m
••
••

=.-.-_v'-IC
'-,¢0(0
_C
OC
",-O
__
0"_
•0
00
_30
_0
_-.I0
00
0
-.':rC
,,ICO
C',J
L_
t--t"_
t__]If)
t"-u')
_'-I_-I
E-_
eO._-tC
'--0
eo_0
cO._._''_D
_{'0
02}0
_-I•
00
v-_C
40
_t0
0v_
0_-I
00
p.:
_.:
0O
_C
9_
:k"_.__}
t"-C
O0-}
ll}(22)_
C_:
_zC
O00D
CD
u"_v-I
..._-L_-.d/-
,d}v-I
_02,
*,--i
c
L",I
009
O_
L_-0
0_-2
O'_
CxlC
O0
oOcO
00C
_c_
C.-_.
0_'q
c-_0
0C
_C
xl-¢-IC
'.'.)
Oi
0(2;-_0"
("O(DC}O
I'_'_'(_)0"
_'_(hlO
C'_'Otf)OOCkl_C)
_-ILl')_-l_'q
_'_'f)O')O
r40)¢XlO*
(XI['O['_'O
Of/-_O0
CWC_O%I?q
OCol'f}v4
_"I-_-LO0


5.2Sd

98
before this n1_rberof iterations was reached. Budget constraint pt-evented
us from [{oingf1_ther ,;<0.dwe feel __e estimates obta/nel are good enough
for our p_mposes. IDle_97G-1979 covarianee matmix and vector of re±ur_Is
estimated in d_apter 5 were used as inputs to the program. Deta/is of the
estimation are diseuss_ in Tedmical Note A.
The results_together with those for s_i_setsof secL_itie$ are
given in Table 6,1. This table gives the list of securities included,
their yield _nd the solution portfolio variance, returns and weig_hts
of the securities in the efficient market frontier.
_,$etake note of the followinZ results of the market frontier.
a) The market v)rtfolio is off the efficient frontier. For
1976-1979_ the average re't_n for the market was .1229 with variance
of .726 While the variance_;for 10 a_d 15 per.centreturn Jm the
fronti__rwere .013 and .029,
b) Not all securities were inelud_._in the efficient poz_folio.
For .10 and .15 returns,only 17 securities were included. Theiz_ shares
differed greatly from those of the _up],-.etand there was a concentration
of investment in three banks -- the Chii_ Bank, the _-_ of the
Philipp/ne Isl_nds and the Consolidate(]Bank, as well as in the Philippine
Long Distance Telephone Co_y_ a public utility_ and in Manila _ Corpora-
tion. Each of these had at least 5 Dereent s__moein the portfolio. In fact,

99
PLDT and BPI absorbed 15 and 16 percemt_r_espectively._,of the total port-
folio at 15 percent re,tu_r,. Vie_ed ;inotherway, thereare many secumities
that are excluded in the efficient portfolios. It means -thatthe.ix,
mar.gi]'mleontrihJtion to portfolio risk is higher than that of other
securities. Yet_they have been kept in some investors' no_tfolios for
a fairly long period. It is to be noted that there was tra£_.ngin
these securities and yet the/r pri,cesdid not adjust so as to ra/se their
returns hig_ _mouglhto compensate for their high risk and thus
included in the efficient portfolios°
c) _ the rate of returns _creased_ the portfolio became less
diversified and included high risk-high return securities. At 35 percent
returr_s,for example, only 13 sec1_ities composed the portfolio and it
included nmre mining7issues, However_ there was a number of securities
that remained in the efficient portfolios at all the rates selected.
d) Finally, we find wide differences in the weights of the
seclmities in the efficient Portfolios. A ra,_1ol_lyselected por<folio_
each security to be given equal weight that is taken to be efficient
in a perfect mmeket, will defin/tely be inferior to one obtained by actual
calculation of the efficient frontier. There is a gre_%terneed to solve
for the efficient frontier in _<nimperfect mmrket than in a mor_ perfect
one since competitiveness of issues is weaker in the former. We show the
gain that can be obtained from the derivation of the efficient frontier
by way of a reduction in risk.

100
These observations and the insi_fican± result of the test of
the capital asset pricing,flmction obtained in Chapter 5 lead to the
eonclusior_thatthis market operates t_dem conditions different from
those asstm_d h_]C_A_4.
We try ne_ a satisficing behavior wherein investors ape assigned
to limit d'_eirchoice set to the top 20 earning securities. Alternatively,
we assume some investors confine their choice to the large
board which includes blue _h/ps and miring securities, ri_eefficient frontiers
for each of these sets is estimated. We try to see them t2_eposition
of t_ese frontiers relative ±o the vrevious one or to what extent the
frontiers of the subsets are dora/hatedby the total frontier. The
results of the exercise are given in Table 6.I also. Please note that
for these subsets _ the re_suitswere obtained before the iteration
limit was reached. _hey were, there_fore,the solution of the convergence
of the pro_am.
For the top 20 securities_ we solved for ]dgh rates of re_]rns
starting at 20 percent to 50 percent since the lowest returg_sfor the
securities in this set is .15 pe,rcemt. At 5_000 iterations n_%defor the
40 securities, the variances obtained for each rate of rettmn selected
were not significantly lower than the variance for the first subset
of top 20 securities. The variances of the efficient portfolios of the
blue e/tipsand _ining issues were, h_evem, significantly higher than
those of the 40 and top 20 securities. Apparently, it _tters from what
set one chooses his portfolio. %h_e.re,are some diffe/_nces also in the

101
por_.folioshares of the securities though in some issue_ they
were not very substantial. Cmnsolidated Bar_<and the Bar_:of the
Philippine IsLm_ds have large and a3m_st equal s_re in the efficient
portfolios of the three sets. It ;_y _ _g_led that on the whole not
much is lost by limiting portfolio choice to the better re_arded
issues in tilebig board or to %he top earners of recent years.
As in the case of the first set_ not all issues were included in
the efficient portfolios. Most of the excluded issues wez_e_Iso not
in the portfolios of the larger set. As shown in the tabl% these have
either or both low return and _i.gj]own variances. We will try_to•find
some e(mmon characteristics of d_e securities ._%the _tiers as well
as of -thosethat were not in them_,.indthose that earned negative returns.
.- -- 7" / '2. Pattern of Security YlelJ-Pdsk 8e_navior
It is not easy to find a pattern of how security yield and risk
behave, As found in Chapter 5, there is no signifiear_ positive relation
between these variables for the sample of t-fadedsecurities between 1976
and 1979. the scatter of points given below describes this lack of
relationship even more clearly, However, a pattern seemsto emerge when
we label the observations by their corporate names. It seems the securi-
ties fall into three groups which we demarkated by bands. The first band
included most of the blue chips and most of the securities contained in
the estirm_tedefficient portfolios, Another group consists of high risk and


.(
_ " ' i.... i. "_."_ _"-m
m
.._...
•_ _! /"_. . ,,o _ . .i.._..i_ • _
f
:__ '_ '" '_"" ! iT :
_,_ _, .,i_'_ _ _,L _ ,_, _..:_:,'_. ;_,_=,__,_,:,_, i
r i
,'LT i
" i
?
•
i.! , i :
.-, _,,_

103
actively traded mining securities which have positive returns. Among
them al_ethe oil comparies that r.e_.entlyz_eported_oad prospects --
Oriental, Basic, Tr_ns-AsiaJ Sea-front, Land-oil. Also included here
are a few big board mining such as Mar.eoppem,Benguet, Atlas and
Lepanto. Below the _d line are securities that earned negative returns
over t/_eperiod. They showed no apparent yield-misk relation. Except
for four bi_ ]_ard comDan/es _hieh experienced unusual difficulties
like the weak market for copper, the securities in this group a_e small
and not very active mining.-companies such as Omieo, Samar _/ning, Abra
N/ning, Great Pacific, American Asiatic, Acoje Mining_and Atok Big
Wedge. (PLease see Char_ 6.1.)
The secl_ities in the two uppem banks could be considered as two
sets fo_ portfolio choices -- one_for the more secure assets ; the
other _ for gambling. The securities in the two sets would not app_2m
competitive with e_ch other if investoms behave as if they apportion their
wealth to riser and less risky assets and then choose separately a
portfolio from each set. _en many investors behave this way, the
securities in the two sets will be.less competitive than the securities
Jm a set. This will be _efleeted in a yield-risk relation that will be
stronger for each set than fo_ the total available securities. In fact,
this see_s to be the ease as shown by the securities in the two bands
we drew roughly. There is a positive relation between yield and rlsk
within each band.

io4
Seclmities falling tmdem "the_ed line is ye-tanother category.
We try to understand the nat_e of seclmities in this group by looking
at the movement of their yield over the four-year period of study and
their o_m variances,
In general, Philippine securities exhibited wide yield fluctuations.
Variances of yield r_nn_qefrom .139 (PiIFf)to 16.51 (Surigao _iines)with
their corresponding coefficients of variation of 1.09 and 424.54. This
wide amplitude in yield provided opportunity for high capital gains but
also risk of h/gh capita],loss. For most of these securities the yield
was negative .farthree of the four years. %3%ec_mmncesof losses for these
issues were,therefor_ h/gh. %,_ydid people persist in holding these
securities? One explanation m/F_t be that they decided to be 'locked-ln'.
When people get caught in a big price drop selling the losing sccurities
and shifting7the gortfolio might not prove worthwhile. It is
also possible that most of the holdings of the small board were by
controlling interest groups or corporate owners.
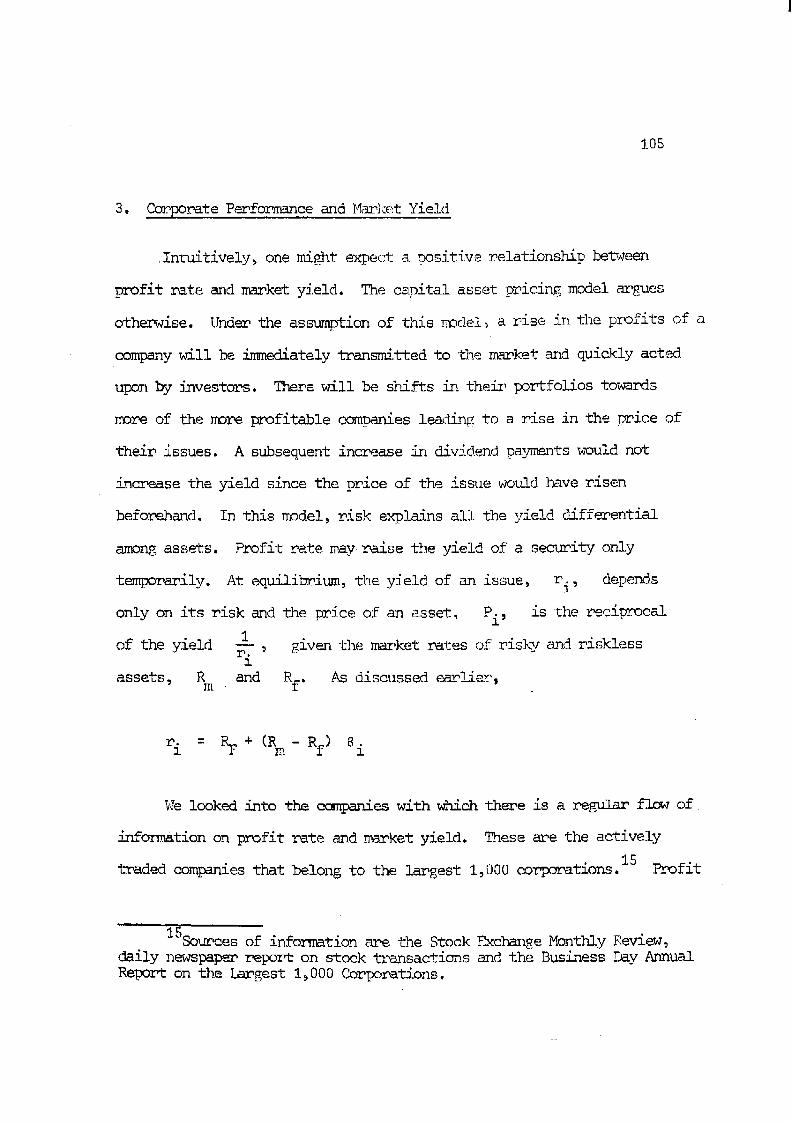
!05
3. Corporate Pemfor_ance and M,_J,<etYield
Intuitively, one might expect a 0ositive _elationship between
profit #ate and market yield. The capital asset _icing. model argues
othemwise. Under the assumption of this model_ a rise irtthe profits of a
company will be /_ately i-ransmittedto the market and quickly acted
upon by investors. There will be shifts in their portfolios towards
more of the mor_ profitable com_mlies leading to a rise in the Drice of
their issues. A subsequent increase in dividend payments would not
increase the yield since the price of the issue would have risen
beforehand. In this model, risk explains all the yield differential
among assets. Profit rate may rmise the yield of a security only
temporarily. At equilibrium, the yield of an issue, ri, depemds
only on its risk and the ..priceof an asset_ Pi, is the reciprocal1
of the yield _. _ given the market Pates of risk_/and risklessI
assets, Rm and Rf. As discussed earlier,
q= % �(%-R?
We looked into the emmpanies with which there is a re_-u]a_', flow of
information on profit #ate and market yield. These are the actively
traded oompanies that belong to the largest 1,000 corporations.15 Profit
15Sources of information are the Stock Exchan[e Monthly Review,daily newspapem r_poz_ on stock tl.ansactionsand the Business Day AnnualReport on the largest 1,000 CorTmrations.

106!
Table 6.2
REGRESSION PESULTS EXPLAIn'lING?{&[_T YIELD
1. ri= a + blSi
1976 1977 1978 1979 1976-79
a - .0959 .0262 .4470 - .1143 .1366
b .0003 .0089 .0041 - .0001 - .0004
R2 .001 .4277 .1001 .0003 .0045
2. ri = a + b2(I/E)i_ :
1976 1977 1978 19.79 1976-79
a - .2533 .0098 ,4499 -..4636 - .0544
b 1.1412 1.1.4.93 .7103 1.5715 1.0082
R2 .2826 .2324 .107 .2005 .1191
Means si[_tificantat 5%. S is sales growth_ I/E isprofit to equity ratio.
SOURCE: Chapter 4 for _ield and the Business Day, 1976 to 1977Annual Report _ the largeot_pp/ne Corporaticns.
107
rate-yield relationship was investigated, We also tried to see whether
sales growth explained yield assuming that sales growth is used as a
basis of expected future perf_ce of con_anies. Simple linear
regressions were _ using intone to equity ratio for profit rate and
sales _grDwth. ]Dataon 24 securities were available from the Business
Day P,epolecon the I_000 largest co?potations. Data on yield were frgn
our estimates. The results are Riven in Table 6.2.
We find that sales gr<_th influenced yield only _halfof the
time. Profit rates, .however.,persistently influenced n_]rketyield
positively. Except for 1978, the coefficient of profit rate was greater
than unit_y_meanin_ that a one percentage point increase in profit rate increased
the yield by a _ittle ove_ one _ +-c ,_. p_rcen_a_ I_int. !he persistence of t]zis
relationship over four years indicates that operating performance of
the corporation was not quickly '.vransmittedto the market or that
i _vestors did not resnon4 fast to new /nfor_etion, In th/s case, it
becDmes important for investors to take close accoLultof corporate
perfornm_aeeand finance in their _x9rtfoliodecision since yield rises
with p_ofit rates. It would not be sufficient to consider infcaTmation
on market yields only as our portfolio selection exemcise dJ_d.

_,08
Conclusion
The c_haptersh_,Tshowahi_hly im_erfectm_ket behaves.
Investors hol_ inefficient ,nortfoliosas Jmdicated by the dominance
of the portfolios on the solution frontiers over the actual m_rket
portfolio. Portfolios on the frontier exclude a fairly lar_le
numb___of securities, me_mingthat it is not optin_l to holl all
securities. We also find that information was too slowly transmitted
to the market_ or if it was transmitted at all, investors failed to
respond to it. T_.iswas evidenced hv the persistent positive relation-
ship between market yield and profit rates. L_ofi+_rates should therefor% be
considered in portfolio selection in addition to mar_ketyield and risk.
_ showe_ the usefulness of quadratic progr_ummingof the
efficient frontier. _q/s is a costly exercis% but it is particularly
needed in an _nperfect.n_mket w]hereco_petition among securities is
weak. The hig_ cost and exDe__tiseinvolved in nrogranm/ng and other
forms of se_irity analysis point to the need fop specialized services
such as those found in mutual fur_s in the [_ited States. Investment
nmnag_ershere should find _le pro[_am useful It can be adapted
fairly easily to the specific portfolio problems they face.
Security armlysis and dissentina%ionof information on the market
seem badlyneeded. The results of our exercises show th_ one can earn
fairly high rates of return at not too high a risk if he knows how to

109
choose securities coz_ectly. A1ternatively, one car,do so badly as
to suffem successive losses. _e also find that gains from diversifi-
cation are l_nited to not tc_ m_ny securities ,andth_ata r6_dom selec-
tion of securities would be very inefficient.
The next chapter will apply .portfolioselection _mder indivisi-
bility constraints_

110
To.clinicalNote on _d_at/c _mmning
by
16Fe Lisondra
Quadmatic Programning (QP) is one foz_ of nonlinear programming.
It deals with Tminimizingor _xi_izirge an objective function of q1_dra-
tic form subject to linear constraints.
A qmm]ratic function conta/r_ste_s of an order no higher than
the second (for example, a single variable x, the highest order is
x2). The general form of such function with n variables
xI , x2, ....._ xn Is :
2
f(x_ _2' ""_ x:) : c!7:5_ + ...+ CnnXn +
C12 c21 XlX2 an_l, + c )}r xn + _ " + c2x2 +( + ) + + ( n n_ n-! _-I, 1 1
+ C X + Cnn 0
In _matrixform, this ,nolynomi_lfunction of the second de_ee
order17 with n terms is:
1 xTc1 Z +.,f(×)= cT× + _- co
16The v_citerheads the progr_m_.ng staff of the UP_School of Econcmics.
17This quadratic form can _.heexpress_d as a nroduct of syn_netricmatrix (made up of its coefficients) and a given veotor rep_es__ntedbyvariables X..
]
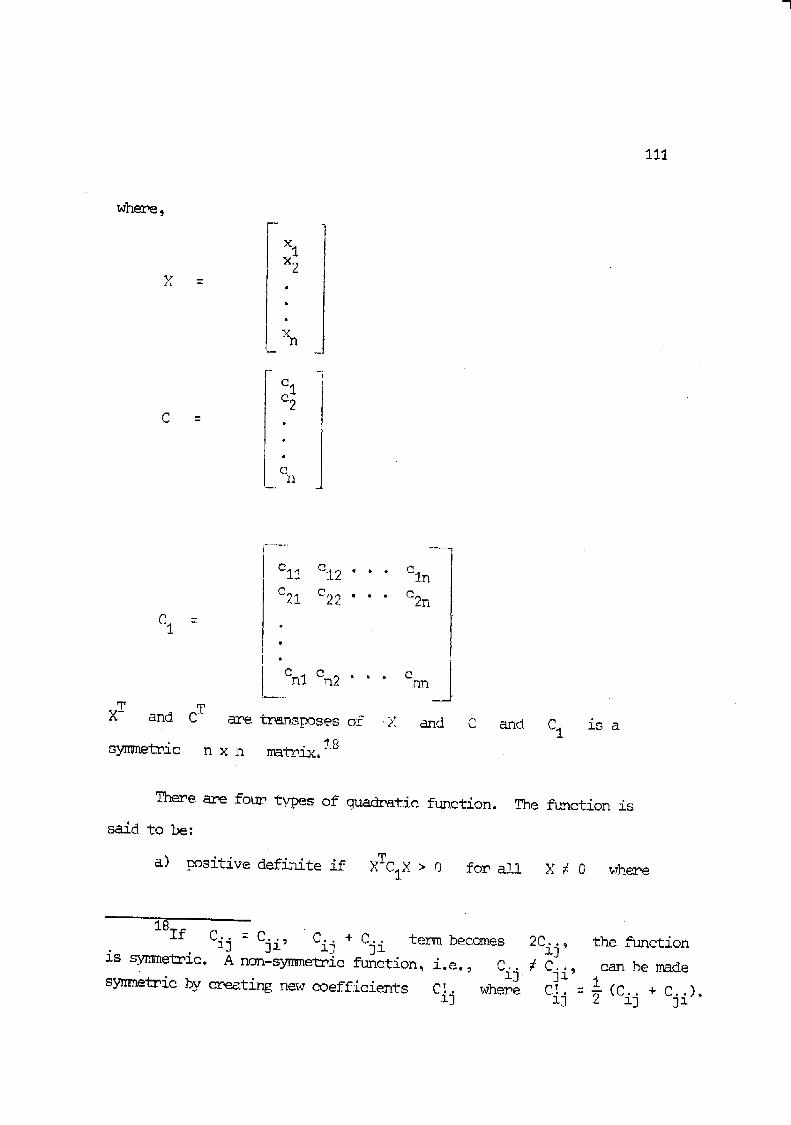
111
where,
x1x2
X -i
t
n
e1c2
C = 0
"tI el2 • . .
c21 c22 • . . C2n
C1 -/
I On1 cn2 Cnn
XT and CT are transposes of X and C and C1 is a18
symmetric n x n matrix.
Theme are four _s of quadratic function. The f_nction is
said to be:
a) positive definite if xTc1X > 0 for all X _ 0 where
181f Cij = Cji, Cm3..+ C..jl term beeches 2Cij_ the function
is synmetric. A non-sy_netmie function_ i.e. _ Cij # Cji, can be made
• f_T i .. •symmetric by creating new coefficients C! where = (C. + C )•13 _ij lj 31

112
/
a.
////
/
.....j..1"
../e b
"\\
\\
f .
C
'_.,,,
...... JL __ i L *
d

!13
C1 is a square synme%_ic matrix. A positive definite is always
strictly convex. (Fig. 1)
semidefirdte if xTcIx _ 0 for all X. (Fig. b)b) positive
e) negative deflr_iteif -f(X) is positive definite. A
negative definite function is always strictly concave. (Fig. e)
d) negative sem/defirdte if -f(x) is positive semidefinite.
(Fig. d)
Mathematically, a quadratic progma_/ng problem can be expressed as:
I xTcIXMinimize f(X) : cTx +
subject to linear cons_ts:
AX .< B
X >_ 0
where B is an m x I column vector of scalars b.(i = i_ 2_ ... m)i
and A is an m x n matrix with coefficients aij(i = 17 2_ ... m;
j : I, 2, ... n).
Another way of expressing the above is:
n _ n n
_ee_ze f(×): [ c.x [ 7 c xj:l 3 ] z i=i j:l _3 _]

114
st_ject to ]_near c_straints:
[ [ Aijx..< b. i = i_ 2, ..._ m
X. ) 0 j : 1, 2, ..., n]
Maximization may be obtained by s/replyreversing the sign of
each te_n in the objective function.
There are many methods of solving a quadratic programming problem.
One of them is Wolfe's method or the so-called Wolfe's algorithm using
a modified simplex method for solving quadratic problems. This algorithm
was later __ogran_redby H. T. Bates of Kansas State Ilniversity.19 The
algorithm proceeds as follows:
1. A basic feasible solution to the constraint set is found such
that the resulting values of the state variable are all non-negative.
2. The objective function is separated into its linear and
quadratic terms:
N
Z. : _ C.X + H[Xi,j:i ] J xj].
3. The quadratic function H is decomposed into an
19Bates' program was used in this paper.

115
N X N matrix by inspectionor by partialderivatives:
H[Xi, Xj] - X. Q X.1
_1 --
where X.] and X.l are N elementr_w and column vectors
respectlvely_ and
Qij = -
4. A s_le_ algorithmthen finds the minimumof the augmented
tableau.

116
The Money _rket
This market deals mainly in very sboz_-term credit instruments.
As such it serves two functions. First, it all_s fina_cial institutions
to economize on reserves and non-financial business enterTmises to
mJm/mize transactions balances, Second, it provides saving
units one other alte1_nativeset of assets in which to hold wealth. Banks
and non-bank institutions faced with inadequate reserves or ti_T liquidii?I
position borrow from fellow financial institutions. Business enTempmises
usually face uneven cash inflow and outflow. Any surplus can be lent
To the market and deficits can be covered by the same source. L_milethe
mamket fulfills the function of serving the liquidity needs of financial
and non-financial enterp_.ises_a part of Their issues has been bought by
saving units. In fact individuals' holdin_ has _isen to about 20 percent
of Total outst_id/ng issues in the last few ye&rs. However, financial
intermediar_ transactions still ecru[raisethe largest shame of the mamket.
_Themarket offers varied instruments -- or_iinarypr_missor_
notes, r_ur_hase agreements, trust certificates, certificates of partici-
pation (CP) and direct lending portfolios or without recourse papems
(WORP). Risk on the papers varies depending on the creditability of the
ultimate borrower and on factors detemmining movement of the cost of
capital in the financial system. Both primary and secondary issues are

117
transacted in this market. Secondary issues of financial institutions
are close substitutes of ordinar_ deposits. Both are direct liabilities
of these institutions. Their credit risk is depemdent on the probability
of default by the intetm_ediariesthemselves. In the case of CP's and
WORP, investors bear much of the c_dit risk since financial institutions
act princlpally as broke22swithout explicit liability in case of
default. Actual risk to the investom tends to be lower than credit
risk since many broker intermedia_.iesprovidean implicit _larantee of
the loan portfolio they reeon_nendto investors. Despite such _antee_
a significant pr_um for risk in the form of interest mate differential
is being paid these papers.
_ne paper describes mnpirica!ly some major features of this
market with the aim of evaluating its role as a purely shoz_t-termmamket
and as a channel for savings and investment. The paper also traces the
movement of interest mete and compares its level with the mates on
alternative assets in the financial system, Finally, we its]to measure
both credit and market risk. Credit risk is risk of default by the
creditor. >_m_ketrisk is risk due to possible fluctuation in the yield of
an asset.

118
I. Transactions in _e _arket
The money market star_ed Jm 1965 as essentially an intembank
market. It _ms s_ee ,_own rapidly in volume of transaction, number
of participating companies and .inthe varie±y of assets transacted.
Membership in the money market association (M.ART)rose to 994 by the
end of 1979 of which 739 were active members. Each member has to be
registered with the Securities and Exc?mmge C_mmission (SEC) lille
companies iss_ing eq_Lities. The gro_,r_hof the money market can be
better appreciated if this number of active members is ccmpared to the
72 corporations which are more regularly traded in the stock ex__hange.
(See chapter on the stock market. ) Voh_ne of transactions also rose
r_the_ phenomenally from _131 billion in 1974 to _295 billion in 1979.
As discussed above_ the _oney mmrket caters mainly to s_rt-term
uses of funds while the stock ,marketis considered to be a source of
long-temm funds. There is, h_,_Tever,much overlap in their function
since both markets s_4.Dplyliquid assets to savings units. }_reover,
as will be seen later, short-term funds have been used for longer term
uses. 'Thesemoney market functions are delineated by sege_egatingthe
issues that are held by MART m_mbems and by savinEs units such as
individuals, pemsion and trust funds and social insurance companies.
The paper focuses on son_.special featumes of the _ket and
tries to explain tPeavmoa_e and relative mates of interest. FeaZumes

1:1.9
to be,noted are the laz.,gesize of transactions tak/n_ place, the fairly
wide interest _ate differential an_n_ instrume_ntsand the hi_)_rate of
renegotiation of loans by boz._owingnon-fin_aei,alcorporations. We
are.fol_n_nateto be able to make use of t_o unpublished sets of data --
the nonthiy report of _qkRTMonitor and the Central Bank decoded file on
individual transactions.
The _oney Market Association (_%RT) a_eed to monitor transactions
of m._nberinstitutions and con%panics. !t issues a monthly report to members
containing J_nfo._n_tionon each member's amount of borrcgeingallowed by
or re_istered wi1:h the SEC_ outstanding bal_nce_ availmemt of eredit_
and the/r distribution by t_?e of [,ap_zr.A comple_emtary report by
creditors of each company on the Sta-_.usof its bor_/_cingis also provided.
Repo_ting creditors stat(_h_,_much of "thecl_u'_sth_y hold are in
current, negotiated_ over_lueand default st_-:%t_ises.It is to be noted
that the volume of credit reported by credi_ors is generally 1_uchlower
t]_n the total debts _eported by the debtor co_n_n.ies. There is a
possibility the distribution of total debts by status may not be equal
to the dist'__ibutionas .repo_tedby !:_IRTcreditors. Urlortunately, _ART
creditor reDorts provide the only source of information on _uality of
credit. M_%nwhile_ we assume the }_dLRTcreditor _eport is representative
of the total volume of eu_edit.

120
2. Some Features of the Money _k_amket
Table 7.1 a_eii[ated into four _Duns of participants -- large non-
financial eor1_orations,coT_lercialb_._nks,non-ba_< financial intexmediaries
and small non-financial cor_xJmations -- the information provided by MART
!bnitor on the crech'.tpermitted by the SEC_ outstandSmg balances,
their distribution by type of paper_ and outstanding status of credit
granted by _%P<Tmembo_r. (The Eroups are labeled by }_P,Tas CP10, CP20, CP30
and CPl;0), __Tefind d_t monthly availm_it is us_mlly a fraction of
SEC-allowed issues with the rate of avai]ment d/ffering quite substantially
-amongfinancial and non-financial co_9orations. Monthly availment rate
has been highest at be_<,en35 to 50 percent for finanei_ institutions
and less t[hon25 per.centfoz_ large cot,notations. Sm_zllnon-financial
co,r_or_tionsaw._ile_ of tl_e]'rtunneyn-_ket line at an even smaller rate.
This low availment rate fo__ the non-financial corporate seeto_ T)_obably
reflects the eonserva'_ismof fin,mncialinstitutions _l their ._ranting
of _,edit line to ultimate l_r_wers. Corporate borrowers have to
th._oug]_a fairly strict and comprehensive credit evaluation to be granted
a money n_rket e_it line. Consequently, only a small nu_nbemof registered
bor_x_qerscould actually bo_. Another consequence is the concentration
of lending,to prime corporations which absorbed n_e than two-thirds of
credit P_rantedthrough the m_ney m_rket. In fact one investment house
complains of the fe%mess of qualified non-financial borrowers, This
successful, though not a ve_/ large house 1/nits _ts lending to a surprisingly
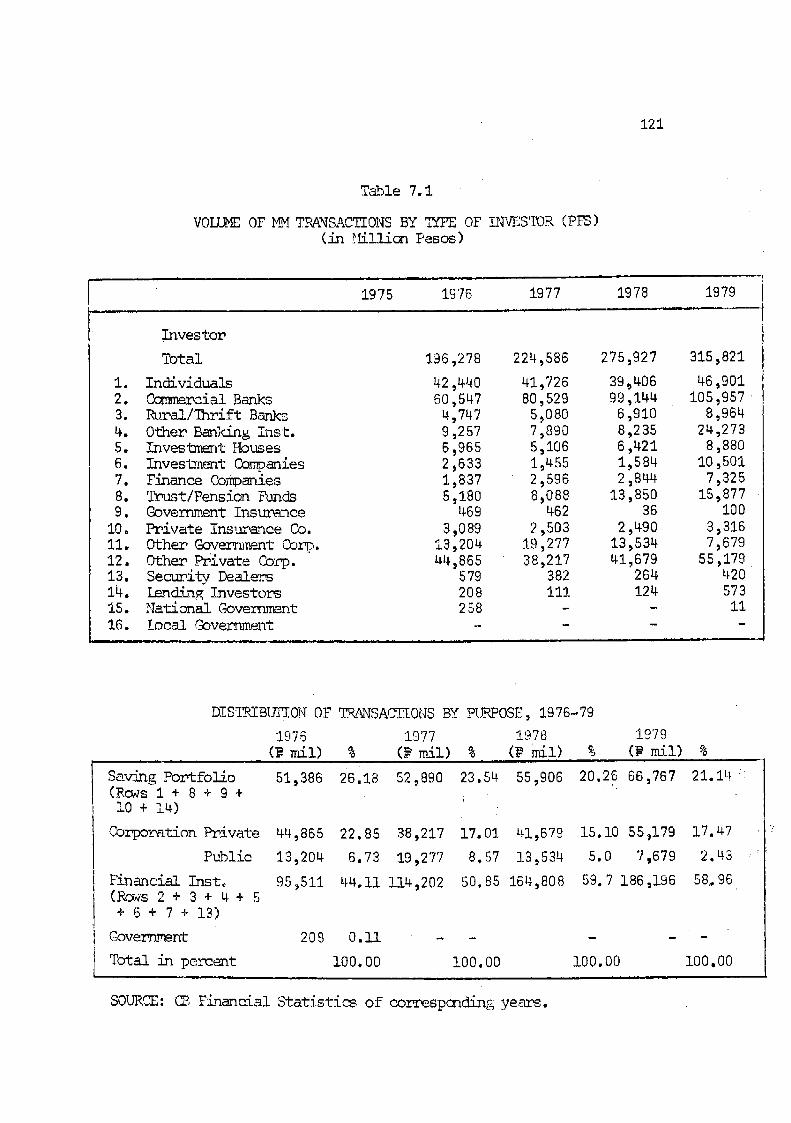
12i
Tauble7.I
VOLUME OF _ TR_NSACTIONS BY _YPE OF i??IESTOR(PPS)(in _illicn Pesos)
1975 1976 1977 i978 1979
II1vestor
Total 196,278 224,586 275,927 315,821
I. Individuals 42,440 41,726 39,406 46,9012. Commercial Bar_<s 60,547 80,529 99,144 105,9573. _ral/_rift Banks 4,747 5,080 6,910 8,9644. Other Banking Inst_ 9,257 7,890 8,235 24,2735. InvestT_nt Houses 6,965 5,106 6,421 8,8806. investment Companies 2,633 1,455 1,584 10,5017. Finance Companies 1,837 2,596 2,844 7,3258. Trz_t/Pension }Amds 5,180 8,088 13,850 15,8779. Government Insurance 469 462 36 100
10. Private Instance Co. 3,089 2,503 2,490 3,31611. Other Gover_mt Corp.° 13,204 19,277 13,534 7,67912. Other Private Corp. 44,865 38,217 41,679 55,17913. Security Dealers 579 382 264 42014. iendin_ Investors 208 111 124 57315. National Government 258 - - 1116. Local Government ....
DISqRIBVflON OF TRANSACIIONS BY PROPOSE, 1976-79
1976 19'77 1978 1979(_ rail) % (_ m/l) % (_ rail) % (F rail) %
Saving Portfolio 51,386 26.18 52,890 23.54 55,906 20.26 66,767 21.14 :, ,'..
(Rows 1 + 8 + 9 +I0 + 14)
Corporation Private 44,865 22.85 38,217 17.01 41,679 15.10 55_179 17.47
Public 13,204 6.73 19,277 8.57 13,534 5.0 7,679 2.43
Financial Insto 95,511 44.11 114,202 50.85 164,808 59.7 186,196 58..96(Rows 2 + 3 + 4+ 5+ 6 + 7 + 13)
C_ver_ent 208 0.iI .....
Total in percent I00.00 100.00 100.00 i00.00
SOURCE: (2,Financial Statistics of co__respcndingyea_s.

122
f_ strictly evaluated coronations totalling 30 _Ters. }_anvof
the cor_rations that obtain a credit line with this house are a/so in
the same list of qualified eor_x__,ationsin other investment houses and
c{mmercial banks. (Please see ava/lments _ 'fable7.2.)
!%onevmarket transactions are not elearl-¢delineated as to use,
whethel_ for p_n-e!yshort-toreroor long-term purposes (savin_-investment).
Howeven we can infer frr_.the type of investor in the market the
distribution of transactions for these i_,;opurposes. We consider purchases
of money market issues by individuals, trust and pension funds and
/_sur_mce companies including gove_Tnmentsocial ins<mance systems to be
part of their smzings nortfolio. On the other hand%security dealers
cnndf__zmncia.]and non-financial corporations purchase _mney mar]<et
issues as their,stoc.kia tr'_deor to reduce excess liqtr[dit77.The
propol_tionof transactions for savincs fluctuated aro_md 25 percemt of
the total ov_JPthe last five years, q/hisis a rather l_igjnr_oportion
going to savh_:',sl_tfolio considering that the z_.eaterportion of money
_aPket transactions is an interfinancial acconTnodationfor reserve and
other liquidity needs, q]]eyearn-endbalance of ptmchases b,!individuals
and other savings traitsexceeded the level of saving _d time deposits
in these years. This fact leads us to conclude that the money market
has become a very /z_Doz_tantsavings altemnative /m.the system. Note,
however, that the size of individual placement has been la_ge with about
80 percent being of one ,millionor lar_er in the _st five years. (Please
see Tables 7.2 m_d 7.3.)

123
ep
c_
t..
_o
_D
u9
eO
qO
co
P--
%_
CD
(_
cO
u9
CO
¢0
__
09
_"
....
'g
Aj
"
C_
_C,4
CO
CO
u9
04
u-)
['..
0O_
C_
0"3
Co
¢q
u)
_..
CD
_-
0_
F--
?'-
OD
_'-
09
CD
04
vH
C)
v-_
__D
vH
_J
0u')
0-'T
C_
e9
_D
<)
co
O0
vqC
-,IuO
C2._
v'lC'-
09
_-ICD
rJ-
¢-_
v-I
_.o
03
CO
C"_
C,..I
_,_
_.(3")
0")I..C
._vq
,,--_0"_
.,--I03
0",_._
•I--
_'HC
O_1
(',_09
14")'
_.
_--
__
CO
u9
v-I
09
u)
CO
[__
_•r'-t
(.0..-_
eO1.0
u')"_1
_0¢',1
_u9
mIt
^°
• '-,"_
II
I!
I_"_I
(D
cO
u_
cD
0CD
CD
C9
,_

124
Table 7.3
M0_ST ?_E<Y£TTP_&NSACTIONS
1979 % 1980
Value w-ithouttax (in _1,000) 5,716,079 66.6 5,810,949 70.2
Value _ith tax (in _1,000) 2;863,737 33.4 2,466,644 29.8
T 0 T A L: 8,579,816 100o0 8,277,593 100.0
1979 1980
Number without te,x 5,327 5,525
with ta_ 2,258 1,681
T 0 T A L: 7,585 7,206
" N(YfE:This does not .includegoverr__nt !_pers and interbarfl{call loans,
SOJRCE: Calculated from the Central B&nk computer file; one week,September, 1979; one week, Septembe._ 1980.

.1.25
The impol_ance of -thismarket as a sotmce of long-term fund is
also indicated by the volt,heof rene_otlated loans. _le _gkRT>[on/tor
reports that of the /nventory of papers meported bv emeditors of l_ge
eorqnorations_ about 70 percent was renegotiated fr_T_month to month.
}{oreover_the rate of roll-over va__iedonly slightly over the months.
This iI_nliesthat part of compensate.borrowing from this market anDunted
to an issue of perpetual hDnds. The roll-over rate varied among non-
financial corporate borrowers. It was lower by as much as one-half
for sm_ll co, rations (CP40). Aecordin_ to a dea!er_the ability to
reme_otiate a loan depmlds on a ?_er's ability to meet the obligation
at its maturity. _%_s roll-over criterion r,esultsin what might be,
considered a oervm0se allocation of rolled-over funds since those who
do not need the funds obta/n them while those who do_ 40 not. (Please
see Table 7.4.)
3.1. Risk of Money Market Instrumentsi
_lelooked at.risk from the viewpoint of the invest_ and estJm_ated
i_o risk indicators -- credit randmarket risk_ the former frmm the
default rates reported in "the_i_R,TMonitor; the latter from the t/me
series of yields reported in the CB-Financial Statistics. Ris}<of
defa_rlton paDems issued by a bar_<or investment house depends on the
probability of bankruptcy or f_%ilure. This could be taken as rathem

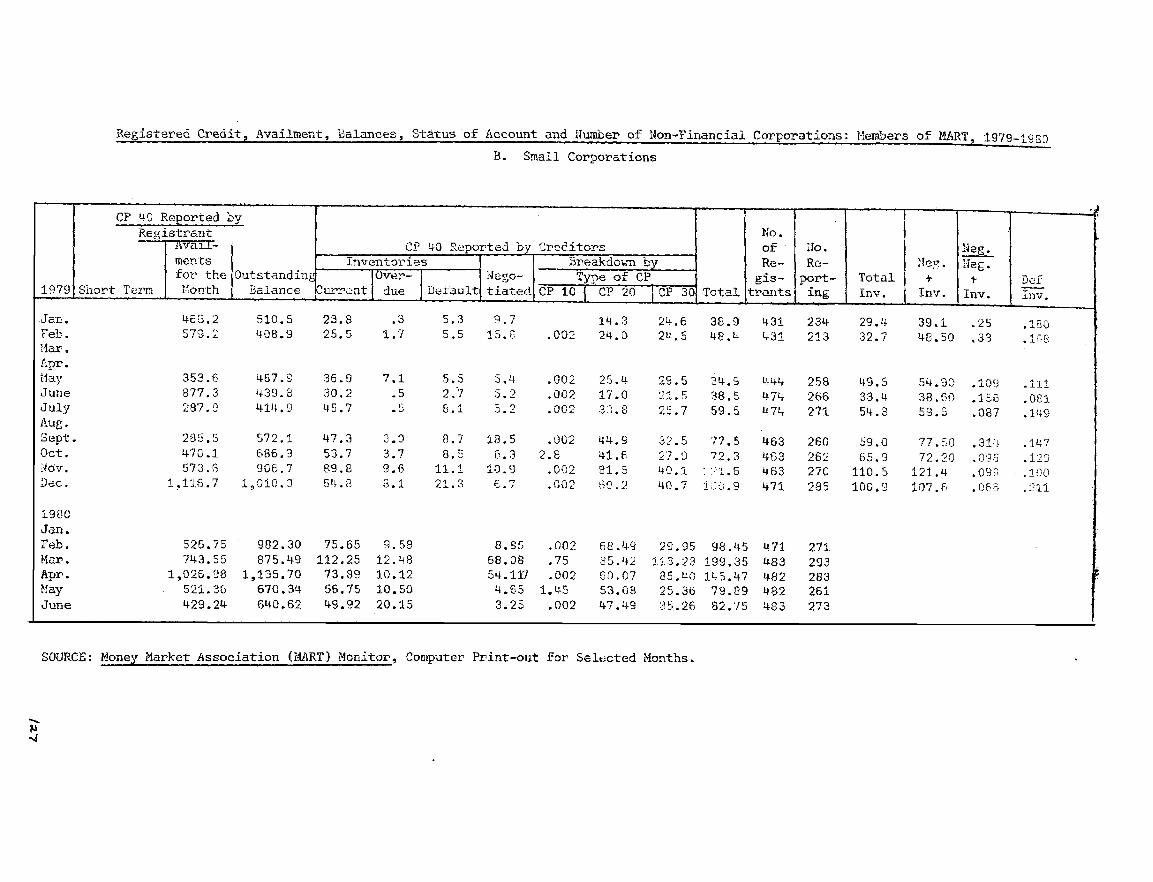
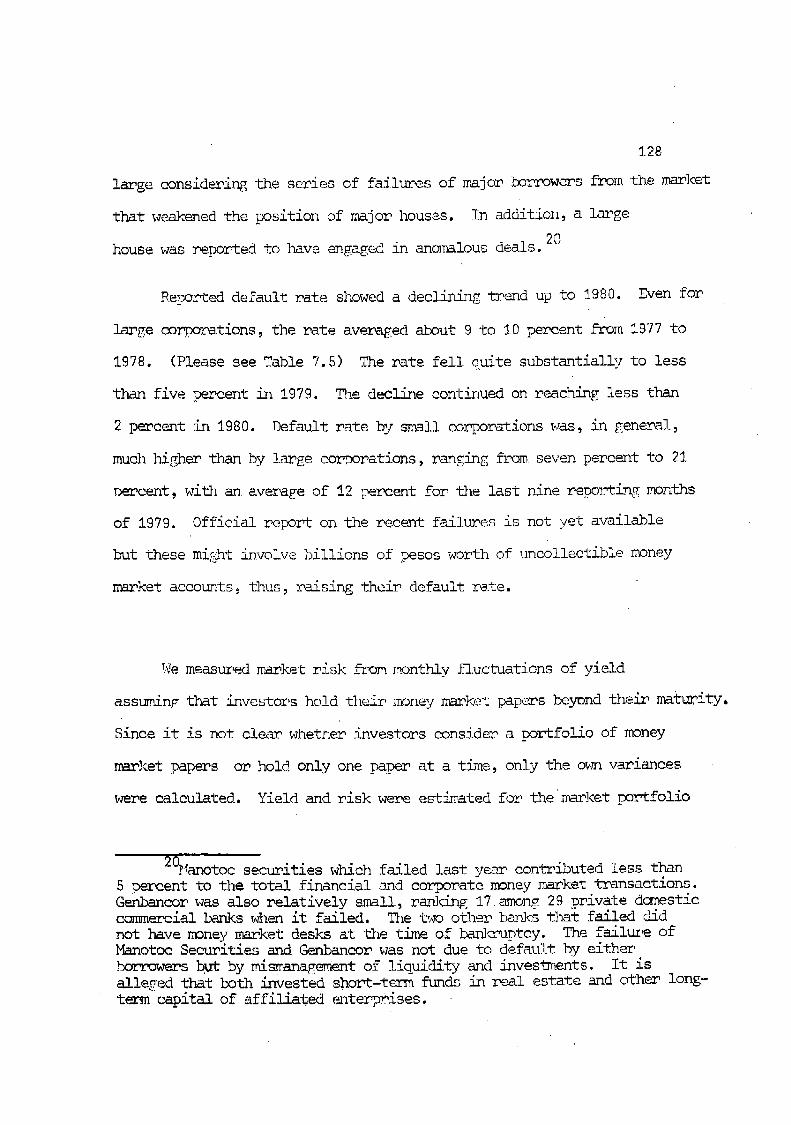
128
large considering the series of failures of major borrowers from the market
that weakened the ]_sition of major houses. In addition, a l_ge
2[]house was meported to I_ve engaged in ano1_lous deals.
Renorted default rate showed a decli1_ingtrend up to 1980. Even for
large eortorations, the rate ave_ed about 9 to 10 percent from,1977 to
1978. (Please see Table 7.5) The rate fell _o/te substantially to less
th_n five percent in 1979. __%edecline continued on reaching less than
2 percent in 1980. Default rate by sr_ll corporations was, in generml_
mud_ higher than by large cor_orat{.ons,ranging fl_omseven percent to 21
nercent _ with an average of !2 percent for the last nine repo:_tin,_months
of 1979. Official report on the recent failures is not yet available
but these mi$]htinvolve billions of pesos worth of uncollectible money
nzlrketaccounts_ thus_ raising their default rate.
We measured market risk fr_. l_nthly fluctuations of yield
assuminF that investoms hold their money market palx_s beyond their mat_ity,
Since it is not ele_lrwhet_lerinvestors consider a portfolio of money
market papers or hold only one paper at a time,,only the own variances
weme calculated. Yield and risk were estt_a-tedfor the m_ket portfolio
20_{anotocsecurities which failed last year contributed less than5 percent to the total financial and c_rate money market transactions.Genbancor was also relatively amall, rar_ing 17 amo_ 29 private domesticcc_mercial banks when it failed. The _o other _aks that failed did
not have mmney market desks at the time of bar_kruptcy. The failure ofManotoc Securities and Genbancor was not due to defat_t by eitherborrowers but by mlsmanagementof liquidity and /nves_nents. It isalleged that both invested shore-term funds in real estate and other long-term capital of affiliated el%terprises.

129
Table 7.5
ROLL-0VL?. AND DEI_ULT Pd_TES OF L_,._-F. J_D S$_M_ NON-FII_fCIAL
CORPORATIONS, 1979-1980(i_ pe_?zent)
LARGE S._f.AL L_:
Default Roll-0ve_- DefaLtlt Roli-Ove_...... f i,_. : _f s
1979- 1 3.1 18,0 24.82 3.5 71.8 16.8 32.6
4 i i i m
5 2.5 67,7 11.1 9.8
6 2.4 75.1 8.1 13.5
7 4.8 75.5 17.2 10.0
9 4.5 72.5 lU,.8 23.9
10 7,2 75.9 12.9 10.3
11 7.7 •72.9 10_1 9.0
12 1.8 71.5 22.6 6.6
1980- 1 ....
2 4.3 71.4 4.8 9.0
3 6.2 72.1 5.0 34.2
4 3.4 69.6 8.0 37.2
5 2.7 72.9 10.6 5.8
6 1.5 68.9 11.9 3.9_ll i i|
SOURCE: Money bimrketAssociation CiART) Monitor.

130
of papers that we__enot ey.clusivelvor mainly [heldby financial
institu.tlons. Exe.!udedwere inter?:_,*,lo_ns and gove_mr,ent securities.
Included wel_eDromissors,notes, repurchase a¢._eements,certificates of
participation, and con_ereial papers which are_held by all _roups of
investors.
The estimated yield and market risk for each nsner and for their
market portfolio for 1978 to 1979 ar_,nresented in Table 7.5. Excent for
c_tificates of antici[mtion a__ndpamtieipa.tion (C.._e_ndCP)_,yiel.d
fluctuations were relatively small (vis equities), with coefficient of
variation ranting from .04 to .16. CAs and CPs ewJmibitedmuch
higher f]_uct_Jatior_with a coeffici_m_ of v_miation as ]i_h as 1.93 in 1976.
_le _r].:etportfolio was hieh!y eoncen:tratedin promissory notes
and reDurchase afTeements. [[%ei]?yields moved closely together over
time except in 1979 as sho_,nby their high correlation coefficients.
Such a high..:.positive.,eor_e?_tion weakens the need for so much diversifi-
cation of money market r_r_fo]io. In !978, for instance, a one-asset
nortfolio of either repurchase a_.ee_nentor non-financial eor.me_eial_per
gave a hiFhem yield and lower vari_anceth_n the market portfolio.
_%reover, the improvement in yield-risk level @ue to diversification
into _o major Dapers (p,a.and PN) was quite miltinmlfor all years. It
_uld, there.fore,be more meaninFft_ to consider either paper as an
alter_ative to other assets in the financial market -- bank deposits and
eqt_ities -- t]m_nas an alternative to each other. Contrast yield

Simple._14can ¥ieid and Standard ]-l,,,evJ.atlon'" of
Money Market Papel_s and their _arket Portfolio_ 1976-1979
Weight1976-79 1976 1977 1978 1979 1976-79
1, Promissory llores ,795 13.11 12.58 i0,60 12.05 12,07
(1.10) (1.52) (__.05) (.58) (1.4S)
2. Repurchase AEreements .151 13,57 13.45 li.34 13.72 18.02
(1.42) (1.34) (,65) (1.20) (1.52)
3. Certificates of Assignment .001 !J_.31 14.35 1.1..35 11.95 12.99
(79) (1.22) (3.80) (18,22) (3.6,£)
4. Certificates of £articipa- .002 !0.93 10.55 10.25 /3.52 11.31
tion (21.06) (16.55 (.48) (1.71) (4.38)
5. Commercial £apers .04b 14.09 13,57 11.42 14.3q 13.35
(non-financial) (1o34) (1.7!') (.46) (1.55) (1.77)
6. Commercial Papers _005 14,4<, 14.00 11.26 15.40 13.79
(financial) (1.q7) :2oZ_)_ (.62) (1.6_,)_ (2.20)
Market Portfolio :i_00O [3.25 "!2°71 10.72 12.50 12.28
(1.1:2) (1.49) (.95) (.57) (1.L<!)
V12 °r-!3q .993 ,851 .215 .834
Note: These are simple average of monthly y[:_Id. Standard deviations are inparentheses°
SOURCE: Central Bank Fhili_.pine Financial Statistics'.

i,Tei_hted_......:_e._,and Standard Deviation of
Hon_y ?_arket papers_ 1976-79)
_976 1977 1978 1979 1976-79
3..Promissory ]_otes 13.18 12.51 10.59 12.05 11.99
(1.06) (1.4.3) (.96) (.Sq) (1.ql)
2. Repul_chase Ag_ee:,,_:_ts 13.57 13.46 11.36 13.72 13.25
(1.36) (:[,271) (.62) (1.11) (1.48)
3. Certificates ¢,f 1"_.13 14.86 12.69 11.95 14.19
Assignments (.63) (1.08) (.34) (1.19) (1.31)
4. Certificates of lq,42 12.81 10.19 13,52 12.90
Participation (1,0/-)) (1.43) (,49) (I,o55) (2.17)
5. Commercial Papers 14.02 13. '_6 il.Li2 14.34 13.38
(non-financial) (1.31) (S.72)' (.45) (1,48) (1.71)
6. Commercial Papers 15.04 14.77 11.37 15.40 14.56(financial) (1.5q) (2.17) (.65) (1.52) (2.22)
SOURCE: Central Bank Philippine Financial c, '_-" sotatz .....me,.

:133
movements with the wild f[[uctuat.ionsexperienced around 1970 (Clemente,
i975). The narrowing7of ti_:_fl_ctua+ion is a reflection of the _2owth
of tj_en_zrketand its in±e_,._-tioninto the other se_ents of the finan-
cial market. _ile mone_,_r'ket _r_._msactionswere mainly in_e_b,_nkaccom-
modations aroun_ 197_0_theistn_ consist of korrowi_ _mndlendine:_ a
_h larger mm_ber ar_,-_mc_revaried surplus and deficit units --
individuals, fir_,c:ialand non-fin_nc,4.alcorporations. The rapid _o_owth
of commercial bank participation to the lnoint_heme they dominate the
market contributed mtu_:;hto its growth and its inteEration into the
system. This develonmen'thas _ important consequences. One is
greater competition in the sourc_ and allocation of funds within
at least the central ei__zfinancial market. C_mmer.cial_nnks can
borrow /_itime deposits _r ;_uey ,v_ket insirt_ents; they may lend in
the form of straight loans or _r_neymarket _nsements. 'Fnisgreater
degree of con_etition _d the la_ge pool of f_nds collected prevent
wide interest rate fluctuation. To be recalled are the r_lated
ar[_n_9.entsused by Rotes and Tan to explain the wide money market rate
fluctuation. Roxas pointed to the hm_piness of w/thdrawal of funds
and lack of seeonda_r _eser_es w.hich_endered banks vulnerable to
sudden reserve deficiency. In a small mar]<et_this c_eates monoDoly
powe_ for those which b_ppened to be, in a surp._usDosition. _is
monopoly power is necessarily we2J_erin a larEe market with many players.
Tan nointed to the sr_allsize of the market a_:_und1970.

134
3.2. Averaee and Relative Money Yerket Fates
Until July 1976 money market rates w_e not re_eulated nr directly
taxed. Their movement reflected _gre fully the conditions of supply and
demand for funds in this market and possibly the rest of the financial
system. The 1976 restrictions consisted of a 17-percent rate ceiling
imposed on known money mar]._tinst_/ments and a 35-perccmt tax on the
rate paid by ultimate borrow_ms in the market. At the same tim% the
eeilinz rates on competir_ debt instruments -- t_nk deposits and loans --
were t',_is_,in order to rmukethem more competitive with the issues in
the m)ne'z_rket. q_neeffectiveness of these regulations is not clearly
evid_ed. _ observed _.rlier_ the market continued to grow and
deficit L_its did not seem to have been discouraged from borr_win_ by the
35 [_ercenttax.
Eith_ or.both the fo!Ic_ing mi_t ..have_%npened.
The Dartieipatin._u_litscould avoid the reFa!ations by using
money market instruments that did not fall under the regulations. It is
to be noted,that these re,..o_/lationswere _sed on specific instre_ents.
It is not difficult for financial institutions to issue 0aDers with new
names or.to arrange new means of b_wing or lending that _Duld legiti-
mately avoid the ceiling rate and,the tax. Without recourse _pers (WORP)
and trust certificates are examples of such innovations. It is to be

135
recalled that the money n_mket itself is a means by which conmercial
and other banl_ emr!iem avoided the in±crest rate ceiling on bank
loans and dew.sits. It is well-_o_m WORP earn as _mch as 22 percent
while the genera],money market ceiling is 17 percemt. Appar_tly_ the
cover%ze of the 35 percent tax is even less restrictive. Only 32
percent of the total vol_mneof transactions occurring in one
week .inSeptember 1979 and another week in September 1980 fell mndpir
the taxed category. As a consequence of the uneven enforceabiiii_tof
the _egulations _ the maz_ketprobably functioned fairly freely. It
could so arrarqqeits portfolio of assets and liabilities:so that those
of relatively low risk and tr,mTsactiorlscost are issued in known money
market papers and b_%verates at or below the ceilin[_w,_uilethose whose
market _ate is above the ceiling are issued as new paper,s and_
ther,efor__not covere<]bT.:.the re_u!atlons. In th/s way_a struct_me of
mates can be determine_ less _,_ "._.=,trlctedly, In this market we expect
the structure of rate to be det_mr_inedby the l_e].mtiverisk and trans-
actions cost of each _D_. In .......c_ne,_al,risk is ]-_[ghe_the longer the
maturity1of a paper and the less diversified a norifoiio. There is more
unce_t_aintyabout the value of an asset in the far future, A bank or
individual lendin_ To one larze comte bor_x_er means a ]Jar_e
concentration of his Dortfol/o in this _mrmower. }<eforegoes the
opn_r_tmity of d_iversifyJ_g_is credit to _m or more smaller bormowers.
On the other hand_ the cost of processing;and col!ectin,_informer ion per
peso lent tends to be smalle_,the larger the value of a credit transac-
tion. Information cost t_%ds to be lower the longer es_a/)li_hed+ _- a borrowing

136
enterprise is. In m_ny cases_credits are secured be liqt_d assets, scme_
by a f'i_.,_'stotal assets; some. ._rante_on the basis of special
client relation. All these factors are exp.ected to influence the
#elative rate of :Lnterest.
The average rate of inter,est _ in contrast, is e}_ected to depend
on the ovez_sll condition of supply and demand for .fundsin the economy
as a whole and on comp.etinZ sets of financial assets such as equities,
denosits, an(]loans. The array of assets that may fo_m the choice set
of non-flnancial investor includes cash, deposits_ equities, money market
instz___e_tsand insurance claims. Banks and non-ber_ inte_ne_aries face
an asset choice set of loan,s,money market na__ersand equities and a
liability (source of ftmds) set of denosits, re#naymarket instruments,
discounting at CB and otl,ercredits such as fbr,ei_nbo._rowing. The factors
t_t influence the _,-,_lativera-'cesof -!_neyTqarketinstrument are the same
factors that affect l_].ative_ate,:_of cc_[petineinstnmmmentsconsidered
as asset (l_-ndirk_)or as li_>ilities (l_cowing). Ne may thus expect
that the average money mamket rate will den_d in painton the average
mate of competinF classes of assets -- deposits and equ/ties -- from
the investor's vimcpoint, and on loans emd equities, from the financial
intermediaries' viewpoint.
Supply and demand condition //lthe _mnrketwill dete/_ine the av_.ra_e
rate of all classes of financial claims. Wealth is a constraint variable.

137
qivem these argumexltswe hypothesize _,.nfunctions -- on% on
average rate_ R; the other_o_:,.relative rate R.{ in the money _mmket_
i for money market category.
(I) = _.,I, RD)
(2) _ = R (Si., Ti_ Cij)
R = weighted average mate where weights are_the volumes of
transactions in pesos of each pap_,
;ff= c_mn_y_e/n the stock of money, alternativeiy_the reserve
position of banks as reflected in excess meserves, _,
Ri = the rate on each mone,_._mrket paper., i : 1_ 2_ ... 7
(Please _ _....._., Dace !40 for the _uping of transactions. )
S_I = the stock price index as _enorted by the Manila Stock _._xchang]e
S = tr,.-._isactionsize in thousands
r. = catep:or_of nan_ _ j = 1, 2, ° 4
where 1 .Promissory i,lotes
2 ReT>urchase,._mem_ents
3 Ce_tifi.eatesof Assi_/mments
4 Ce_.:[.ficatesof Participation
0 PaDe__s subject to tax
T -- n_turity in daTs

138
Data:
Montb!y data used in the first set of :ce,_.<ressionr<ms explaining.
the av_a_Te laoneyn_mr,ketyield were obtained fi<_rr,'the
Central _3nk Financial Statistics. The data on re!retirerates were obtained
fl%_ the oompute_ file of an institution. Ne obt<_.ineda new file of
individual _em_sactions in the money m.amkettakin[[place dmil.vfor
one wee_ in September 1979 and enothem week in September.1980. _-i.eme
were.more than 5_0O0 transactions recorded in each week of 19'79:rand
1980 with ii_for[_,ationon q,,_eof investor or buyer, t]_e of paper, rate
of interest_ maturity and v£_lue. 'Ihedata were decoded so that the
particimatinF financial /3_stitutionscould not be identified. A
se_ate 6n_lysis was done for 8pvermment securities and intez_bankcall
loans. '_ese se_,,e.,_<in].V the n_ir,_r,v resel_veneeds of bank/ny fnstitu-
tions and cannot be considered as olo_e -_,_,_ _'_-_..................._t=_,__tesof the other honey
market Daners, Inte_bank call " _ __.o,._ns?ene_a].lypay relatlvely low interest
...... ' " "'_ ':_ auctions mostly torates and 8:over_mentDaDerS are __ssuedOn _,,,r-.c_,.a..,..
financial institutions° q3teforme'0a_.every sho.vt-termlo&ns of about
24 hours maturity only.
We tested the me!ative ,_,a,teb__ntothesisby both linear and
nonlinear _-,ndthe averape rate by linear r,ettressions.Z]_eaverage rate
function was tested separately for Januazy 1971 to J[me 1976 and July 1978
to December 1978 monthly data in order to ta]<Eaeco[mt of the effect of
the /_x]sition of the 17 percent rate eeilin_ and 35 percent ta._:_m June
1976. The relative rate function _,_astested on the 1979 and 1980 cross-
section data separately.
139
The linear test of the average rate function gave _dxed results.
For the e_I/er period _97!-1976 during _,Tbichthe rates were free to
fluctuate, the results supported the ]\ypethesis. The inter.b_< rate was
negatively!influenced by ?_th excess reserve pesition of banks and the
stock price index. %_nerate on promissor_ynotes, _ = was signifi-
cantly influenced by the stock price index. _',Teitherexcess reserves nor
CB loans to h_nks nor changes in .moneysupply significantly affected
money market rates exeent interba_nkrates. It is to be noted that durin_
the period most transactions were inter'bar_<.In fact up to 1975, the
latter composed 70 Der.cenZof the total. _e effect of tightness of
money supply and cre<_itwas probably directly transmitted to bank
I/quidi_ position and only later to non-ba_< tra_isactJ.onsin the
morleymarket.
In the second period, we obtained a pervex,s% if not an insi_ficant,
effect of cm_edittightness as reflected in CB loans or excess reserve and
generally insignificsnt effect of the stock price _dex. We hesitate to
interDret these results rig_htnow and feel we need more institutional
insights to be able to explain the rate movement. There could _havebeen
erm_neous reporting of interest rate after d_e ceilin_ rate was imposed.
In such a cas_ the results would be spurious.
_Thesecond hypothesis relates the rate of a money market
inst_2nemt to its ch:meacteristics_isk and transaction cost. Risk and
transaction costs are both reflected in the size of the Daper_ with risk

140
rising and tnm_saction cost falling with size. P/sk is expected to
increase with maturity and varies with the type of _pe_ -- whether
secured or unse_ure_l_and whether _anted to old clients_ prime borrowers
or to new firms or new Ix_rrowex_s,Repurchase azree_ents_ for example_
are well-sec_med ,paperscollateralized by marketable securities.
The transactions were ,_roupedinto seven categories and regressions
were run on each. This was done in order to isolate the effect of
institution_l factors tb_t might be reflected in the type of paper or
type of transactor. Inte1"_b_mkloans and _,_overnmentsecurities are mainly
reserve assets. Merketing of _overnment securities are more restricted
and they ,_reless eo)_titive wid_ other money _erket [_Ders. W_ith_t
reco_mse papers _Lrefree of rate ceiling and tax. These three tvpes of
papers _2e thus se_eyated from each other. Finally_we'separated the trans-
actions by _e of :b_vesto),_:(a] whether die buyer is likely to be
folio ma_mfing his savings _r his cash flow, Individual
buyers and pension funds belong to the former grou_ while co__rations and
investment ]_uses belor_ to the lattem categors'. _hu$ we have the follow-
_2_Z,_oupin g of transactions:
I. Cc_mernial ?_ks buyir<@
II. Investment houses buying
III. Saving units selling, buying
IV. Other financial institutions buyi_
V. Transactions of Vrivate corporations

141
VI. Transactions of government securities
VII. Tmansactions of without recotmse papers (_DP__)
_is grouping controls for the influence of put,pose of papem
in interest rate determination. Conmercial bank and investment house
buying involves lending to non-financial corDorations. Saving tm/ts'
buying is Teminly!elndin_to financial insti_tions since without recourse
payers are excluded as a categoric variable. _e categoric variables are
type 1, pr_nissc_y notes ; _vpe 2, repurchase azreements; t_tDe3, certifi-
cate of assi_/_ent_ and t_e 4, ce_tificates of pa._ticipation;and 0
fo_ Dap_ subject to tax.
Let us focus first on the three [Troupsof buyin[ or lending units --
the two major financial institutions consisting of c_mercial bar_,_sand
investment houses (¢h_oupsI and II)_ and savin_ units (Group IIl).
For banks and. investmemt bouses_ transaction cost seems to dora/hate
the cost of risk. The coefficients of tn0ansactions.4_zea1_enegative for
_x)thinstitutions. The coefficient of n_turity is significant. However_
it _s the unexpected sign, negative, in both cases. The coefficient
for the t_pe of paper reflectinp,lowe_ risk for re_<L_chaseagreement is
sign/ficant and of the e_eeted si_.
Lookin_ now at savins_units, the linear re_ression gives coefficients
that are si_nnlficant_d of the expected sign. Appar_mtly_ risk of placing
investmemt in one borrower overwhelms the saving in transaction cost.

142
Hence, the negative sign of the coefficient of transaction size. ___en
Group III sells_ the coeffici(mt turns positive, as is expected. '[_eother
variables have significant and expected coefficients.
For 1980, the behavior of saving units •withrespect to transaction
size and mat1_ity and kind of .paperis as expected. The coefficients of
size and maturit%7are both positive _id of the expected (positive) sign.
Risk sb-mringreflected in certificates of paz_icipation and anticipation
is pa/d interest premium so that the coefficients of these categoric
•variables are positive and relatively lar£er,
For financial institutiens, savings in transactions cost seem to
offset the additional risk from large lending as shown by the negative
siy_ificant size coefficients. }__e ris_l t_]e papers Z and 4 bear
higher interest rate t?_n Dromisso_! notes and repurchase a_e__ments.
_,_turityis the si_lific_%t w_isble for government issues. It has the
e_T?ectedsi_.
_ne regression runs on money market Fx_persexplained in some way
the relative rate of interest. F,_r.both!.979and 1'980,;there was an
apparent r_eferemee by f/m_ncial institutions (Groups I, II, IV) for
longer te/rmpapers charging them a lower rate of interest than short Fmpers,
_%is would be a _:,easonableresnonse if fin-3ncialfir_s anticipated a
fall in short-term rate. They would,thus_sell their short-term and buy
long-term_ reekingcanital gains on the short papers. This decision

Regression Results
_te as Functions of Size, Haturity and Asset Tvpe_ 1979
}$ C O E F F I C I E R T S
Type i Type 2 Type 3 TTpe 4
Promissory RepurchaseCertificates Certificates of 7Jumber of
Note Agree>ent of Assignment Participation _2 F Observations
'j2g2e 1. !3Iqf: .1030 23,0:15 76£" "gl) (2. 312)
' " .,')3[:2 .1975 48.199 765.c,±d )
" :'_ I"5556_t' .2838 IL_.67 139':- (2.q80)
.1787" .1755 8.3q3 139(2.657)
r
' 2. R923::: 3. 3868 .3594 i,['_,_,.a-_:_ :_..,,9_8i_ (45.Z85) (4.2838)
I 2155 .2800 2437 '25S.53 3,'368,. • . . .
f (33. " .....z._,,:) (3.48q-)
2-6888;_ 3.4499 .6192 31,{,9 966C,.0024) (" _.±0,953_*')
.2105 t; .2613 .... <33,_i3a 31. 96'_.,,_0616) (I. 0.6917)
_" 923_': . .5019 31. q8 122. t. 0 tJ._b
. L,'337_'; .4314 23.95 122_ .b, 07_2J_)I
" • 7912': .3_'84 68.15 4916.0326)
i .50q8_ .83,45 61.52 491'-', 9616 )
;i
:" !i .07,56 q6. _,_7 1,098

Ke_resslon ]reSUltS_te as Function of Size_ Haturity and Asset Type, 1980
:/.........................." ' Type I Type 2 Type 3 Type 4
i[ Promissory Repurchase Certificates Certificates of --2 Numb,,-'.rof_ity !Iote Agreement, of ,lssignment Participation R _c Ob_ _,_=_w__L_o_=_
([.
<:i 1.792_* 5.799, _'_ 7.0767 .196! 38.982 779...._ "_ (3 9228)::_i (_._051) (10. 5731) .
• _. • • P I ,%:i 2.'44;4_'; 5313 .76r<, .1891 37295 779:_ _6_" {'i0. ;!19) (3 9919)'$" ,? , -........ , o
- .'2'_. 7 .0827 3 .4.55 110
. t,o_,,_ .123_, I, o78 110::i (-.225-!)
/ , j"
2. ':;_ :"6'" 3._I 210 <' 3.5996 _'_ .3494 355. L'/';2 3,966fX"j
: _dO.z,.,'_'_l_). 13._1517 (2. 2931)
:.i .e.%0S:'_ '>26 '_¢_ .1825 3248 ,_. r_ :'86....... , a_,o. 835 3.(32. '-_'-')oo,J iI.777! (1.3598)
; ! 6. 2095':_ 4.9135" ,8320 62.8a0 5!.... " _":: <'_38) (9 8 '_"":i i .......... _' )
:' , _: _ .4257 '= .3469" ,8856 97.735 5!:: (10.7894 (11.2!01)
/<}:[: 5. 8607* .4931 1,_4.131 55: : _3. 7425?
:: v1°3 f': 36L_3 8 73t;' 55:" (3. 8788l..
6. 2982 w .4954 6.1'54 _2....; (4.69q3)
• • _ .5039 .5376 7.104. 22(5.ooq)
_- : _i: / .0894 35.857 711
: .... 37_0 21.3.106 711::!
<j-•

144
_uld be reflected .inobserved lower rate for lon[_ermatnmity papers.
It is, however_ diffi_.t to ex]?iainwhy the anticipations for a r_ndomly
selected week in t_ sepal_ateyears _,muldbe s/z,i].ar.This leaves us
w.ithan unex_)lainedpe_¢erse t_rm s_ructume J_nthe money market. ._ever-
theless, the R2's are quite high for cross-section data. Type of
..pape?must capture most of the risk-difference. The influence of this
categoric,w_iable is strong as well as highly si_Fnifiem_t.
3.3. Data Description
We find in the pr_cedir%qsection that misk and.transaction cost
explain only a fraction of the wrianee of interest rate in the nDney
market. In order to obtain additional insi_]htinto the market..,we -present
here the weighted mean_ st._v_darddeviatio_ and relative frequency dis_ri-
h_tion of r_nev r,ar]<etra:_.esbTypu_..oseatndt_,,peof transactor _,@_ich
we?e calculated from the com:t_utemfile. Table 7.8 shows that the rate, !.,
paid b] the %_nee [_oups financial insti__Itions:co_memeial bar,c, invest-
ment houses,m_d oth_<,fire,nee _ _ "<_...... e.m.p__.% v_f.J.edfairly si_ificantly
with the investment house paying the highest mate; commercial
bank_ the !c_es% with a ra;tediffa_ential of about _ pe_reentage
points in 1980. Within emc]1g_up of institutions, the rate also
vaz,ied signifie_intly as seen in the frequency dis_._ributionand
the coefficients Of variation. Interest rate earned by savings mlits
also differed depending on the type of paper_ whether without reco_mse

Percentage Distribution of Money Market Rates by Investor Type,1979
x
Invest- inter- Other !
Commercial ment Saving Without bank Financial Private iBank Houses Units Recourse Call Inst. Corp.
_hlying Buying Buying Papers Loans Buying Buying,lJ J = i
< 5 1.562 1,439 1.285 .0 11.355 .0 0
5 - 7.9 9.114 5,755 1,815 .065 2o198 9,836 0
8 - 9.9 3.3S5 .719 1.209 .0 .732 9.836 77.551
10 -10.9 9.895 2,878 11.442 .130 .366 5.738 16.326
11 -11.9 2,735 .719 30,771 1,043 .366 1.639 2,041
12 -12.9 1.823 1._39 .630 .261 2.198 3.279 0
13 -i3.9 2.213 2.394 1.435 1.oo_"_° 2._59 0
...... _o 4.713 2 216 .366 0.459 014 -14.9 3.124 _.z_ .
15 -15.9 65.234 85,892 q5. 514 14,798 80.586 64,754 4.082
16 -16.9 .260 o156 31.421
17 -17.49 .051 16.623
17.r- --.,-_, .9 .260 6.58q-
18.0-18.49 °260 17,666
18.5-18.9 .13C 5.737
19 -19.9 1.825
> 20 .195R 13.106 14.090 12.794 16.638 :13 346 "_'. _,958 4,
d 3,196 2,461 2,414 1.440 3,738 3.179 1.
N 768 139 3_968 1,534 273 122 49
_/ R .244 .175 ,189 ,087 .280 ,245
1_6
pap_ which earned the b]g]_estrates or the other. Note that WORP are
not m_Jject to _t__rest rate or tax re_1].aTionsso that we can exnect
their rate to be higher than t_t on other papors. .Thiswide rate
differential was partly eq_].ainedby risk and transactions cost. It
may be a_.,g_edt?_t imnerfections .inthe m__ket also account for some
of the mate variation. There is little reasor_for instance, why the
mean and distribution of ,Patesshould differ between instit_itional
groups. Thu% the _mexplained variance in the regression rm_s given
in the follow_g section may be taken as an indicator of the ]Fresence,
if not the degr,ee_of non-competitive pricing in the money mamket.
_e renorted re_:esor.money _rket instruments _ just like the
_eDorted rates on ]_:_.mJ(de_>nsitsand loam_ need to be t_ken with caution.
IYLe ceiling rates imposer"or.,these :,[nstmmments_i,g_%thave led to the
undm_re_rting of _:_ctu-_!rates° P,utew_n taking into account possible
underrepor_ing_ the re:x_ted pates on monev m_n2ket_De/_s are high
e_npared to the rate on,bank de!_sits_ their close substitutes.
This miy_t account for the rapid Rro_h in money market placement
reflecting responsiveness of wealthholders to the rate diffemential.
However, they cannot be .as sensitive to this because of the
indivisibility]of money nmrket paDe2s, it is suggested that the
restriction on placement size be abandoned. With this proposed
relaxatior_the eompetitivm_ess of fi[mncial assets would improve and
=_r_%ncethe impact of the deregulation of __nterestrates. Another
concluding suKzestion we would like to make is for an official
reporting _lndanalysis of the paners transacted in this market.

147
(_-I__!,,._.D_.8
Fin_nce Choice
_his @lapter will look into the supply side, i.e..,the capital
budgeting c_ finance _hoice of fir_s. _e _digliani-FLiller classic
m_gdel (1958)is used as the analytical .f-ramewmrk,Finance data .from
scattered somgces incluciin_.,,spo'_,adicflc_Jof f_nds estimates are put
to_ether and analyzed us_ the T_del revised to su/t conditions __,e-
vailing here. ,Thechanter ,_roceedsbl first ..._resentin_:the M-7.._fin_nce
mmdel. _le empiric_l ,._nalysisfollows.
1. 1_neoreticalFr,ame_,_ork
Fi_ face seve_ralso_m_cesof fin_c,e for the._ eanital and
c1_re_nte.,q_enditJres.Cs_pital,expenditl.]r,es rm_.ybe funded .gr_ internal
sources_ eq_.ityand looms co 1x_n4i.s,cu._r.entexpenditures may be
financed frmT_lel_<r,ent income_ _:'adecredf{:tand shoat-term debt instru-
ments. %qneremay be some ove_0!apin the so_r0eesof f_m{ing capital
and cu_r.entexpemditures but we consider the overlap not too im[m.._tant
and we assume that long-term sources finance long-term uses only_ and
sbe__t-te.rmsources_ current exnendi_n_es. The theory,has focused on long-
temm financing. We follow this same focus for this pap_'.
The }_odiF.liani-Millem(M-M) _del developed along the s&me pr_/ses
as the effici_nt market or capital asset 9micin_ model described earlier.

148
Fir_ ownems are assumed to nmx_._izeretn_rnste thei_ inves%memt in the
firm. The mr_delassizes si_i_i]e_con_=titive conditions as in the
efficient capita] m:_rketn_del sllchas _mogeneity of mmpket opportunities,
perfect _ivisibility of bor_owing_ and zero brokerage cost. These are
not explicitly stated in their paper, it also i_plleitly assumes that
competitive conditions hold in the _oods and factor _mrkets. Tne latter
assumption _der!ies the application of the M~M nmdel to a class of
fi_s which e_n t._treated as b_mogeneous with resnect to real op[.ortu-
1_itles. Furthermore_ firm ownems are not distingna/shedby their
controlling interest. _e:,_rat% thu_ tak,_nto be also h_..ogeneousin
temms of corporate po_mr ,-and.profitshare. This impl.{est]-,_tmaximization
of net • =_" ,_,-'-_ equity sha_esp.cD__is leads to the n_xindzation of z ..,.t_._n_to
We will discus,tlater that this asst_nptionneeds to be relaxed in ordem
to conside._behavior of contro!li_i! interest in e_rate enterprises.
Capita,].bodgeting decision takes off from more _._sicinves_nent
decision. It is _thwhile invest_z%gor t_ing on additional ..capital
so long,as its present value is positive. The inves_nt
n_.nybe financed by debt or equity or in:terna!finance. The choice del>_nds
on vfn/chsource _,_il.lr_x/mize the rote of return to the o_ifina-iequity.

149
So long as the r/ateof retumn on 'd_einvestmerrtis ,_eater than
the yield of the original eq_dty_ ¢_eners_ ne_,mrth is increased b!
unde_tak_._ the inves_n_,nt, i{owev_ 1:he_te of increase in net_orth
depends on the source of funds used whet:hemnew eglity issue or debt
finance. Equity i.ssuewill fti!utethe profits fzom the new investment
while debt firmncir%_will not. In gene_a.l_debt fi1_cing is ,nreferred
to equity {.ssuewhen the differential between the internal rate of
return to /nvestment and the loan rate is yjeea:tel_than the additional
risk prex_ium,of debt financing. In this cas% internal finance or
retained profits are subs1_neJ,.inthe initial value of equit_]. In the
real wor,ld_the opportunity cost of inter_al .financemay be lo_r t]_n
equity yield. It migh% therefor,%be worthwh/le to use it in lieu of
loan or new eql,ii-yissue.
The model involves interaction of financial investors in their
portfolio decisions _nd boFrowers in theil_ finarme clnoice. With _ze
above restrictive eondit._onsin all three markets, equilibritm rates
of re_mn to equity of finns in a given class are shown to be a function
only of the risk prem/._nassi[<nedto equity as against loan financing.
This risk is t.herisk of investmemt in ee51i_7assets in temns of zero
or,giv__nrisk on fixed liability assets like loans. For details of the
m___el_the following is reproduced from.the Mod/gliani and _iiller's
naper.

150
In a perfect c,;_!nitalm'¢_,ket_the _i.ce per dollar's worth of
expected return must be the same for all equity shares of any _iven class.
The sha_s wit]Lineach class are assumed to have ecual risk, In
each class k the price of every share is p]._oporticr_llto its expected
return, De,lorethis factor of Dropor_:ionalityas !/Pk. Then if
P. denotes the price and X, the e_pected r,eturm _=r share of] ]
jth share in kth class, o_ the expected profits before pavTnent
of interest rate.
• - -=- Xj _ or, equ/valentlv8.1) P3 rk ' "
X.
8.2) _ -- l_u_ a constant for all firms j in class k.3
rk is the expected mate of return of any share J.nclass k_ and
1/rk is the price which an i.nvestormust pay forea dollar's worth
of expected return.
Loans and beardsar_ fixed _liabilities-andyield a constant income
r _ .pesoloan pe_._it tJ]ne, r is the loan _ate or the discount mate
of a certain stream of income. ,Defaultrate isassumed zero.

151
Let
LiD the market value of debts of f/rm j
S. the market value of co_m%ons.haresof j
V3. - S..]+ D_, the market value of all its securities or -the
market value of _tn_.firm.
8.3) V.3--(SJ +Dj) = _Jirkfor any firm j in class k.
_quatlon 8.3 is M-H's proposition I: the market value of any firm_
•Vj is independent of its capital structure and is given by capitalizing
its expected return kj at the discotmt rate rk apDrovriate to
its class. Equiw-alently,the average cost of capital is %/Vj _ or
r, ]7
s.4) (Sj :l _it : :o+ D.)I _ V. k]
If (8.3) and (8°4) do not hold between any pa/r of firms in a class, arbitrage
will take place and restore the stated equalit2,_.Investors would buy
and sell stocks and bonds in such a way as to exchange one income stream
for anoth___ income stream_ identical in all relewant respects _it selling
at lower price. The value of over47ricedshares will fall, t]_mtof the
undex_rieed will rise, raising the former's rate of return To rk.
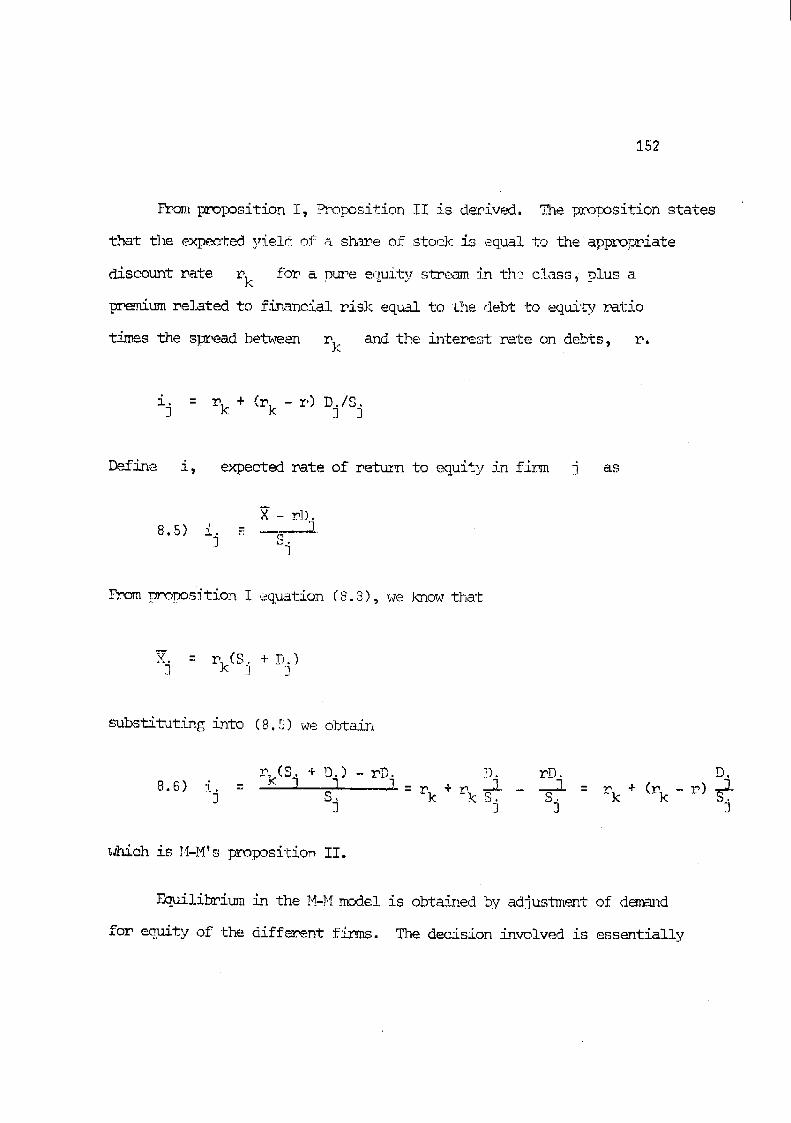
152
Prom _rolmsition !, _position II is derived. The proposition states
that the expected yield of a sh_r.eof stock is equal to the app_F2riate
discount rate rk fo_ a DLa_ee(.!uitystream _ tha class, plus a
premi_n related to financial risk equal to the debt to equi'_ ratio
times the s_,ead between rk and the interest rate on debts, r.
ij = rk + (rk - r) D.IS.] 3
DefJ_e i, expected rate of return to equity in firm j as
X - rD.8.5) i. _ ,, 7
_3 S.]
Prom r/ropositionI equation (8.3), we know that
m
X. = (Sj-1 r k + D.)
substituting into (8.5) we obtain
rk($j + Dj) - rDj_ n. rn. D.
which is ![-M'sproposition II.
F_uilibrium in the I'%Mmodel is obtained by adjustment of damm]d
for equity of the different firms. The decision involved is essentially

153
a portfolio decision. H_,lever_the mode],contmibutes to our understanding
of a cause for risk variation_ .i.e.,the risk attributed to leverage.
The higher the leverage rate_ the higher the variation in re±_mns to
equi_z for a given distrih,ttJ.onof returns to i.nvestment(Philippatoss,
1973, pp. 250-253). It helps us to be aw&re of the interaction of d,_mnd
and supply in d_e financial market and to .linJ(the literature on por_-
folio choice to that on finance or capital budget_x_;.
Let us consider that loan fina_einF,rate is relatively low m_d firms
try to obtain funds through this source. _s d_anandfor !o_is increases, their
_ate is bid up Fm_tly because intermediary (,_ ".....edltor_ have to
attract additional funds to meet the increased demand. In "theprocess,
Ja_ter_,strate on their borm_in.z such as bank deposits or bills is bid
up. As the rate on these assets rises, portfolios tend to shift toward
deposits &nd bills° '?h_enrices of other assets tend to be pulled down
_m]dtheir yield, to be pulled uD. .Theloan rate cannot, therefore_
rema/n low. It will a£just upward until the eqtu'_ty-loanrate differential
just equals the misk premium on loans. This would /replyan upward shift
of the market line for investors, Its intercept is the rate on txar_<
deposit mate. The loan mate may be assumed equal to the deposit rate plus
some mark-up by.Y_q_J<sto covet-their operating cost. Equilibrium in
the M-}{nmdel means a sJ_nultaneousequilibrium in the portfolio of assets
and in the sources of f_mance. If the sources of finance are in
equilibri_n but the portfolio of assets is not, the latter prices _ilI
cbsn_e leading to a _-hangein their rates which are the relative costs
of financial sources. _e equilibrlum eondition in one market therefore_
implies equilibrium in the other. -,

1S4
2. Market Adjustvnent
_he interaction be-L_eenmo__tfolio_d finance decisions (d_and
and supply of assets) de_er_Lin_the equilibrium of the nortfolio _d
rate of meturn of the different assets. These are vie_,Jedas assets
by wealthholders and as sources of finance by firms and intermedia_ies.
If the capital market is not efficient_M-M's Prov_sition II will not
hold. Recall tlhatunder efficiency conditions of the capital asset
pricing tiDdel (CAPM), asset returns will be1_ve as follows:
(8.7) Rj : RF + (RM - RF) 8j
R is returns to asset j, risk-free asset F and the average for
ris}_ assets in the _l:_ket ?_. 8. is _isk of asset j. Obviously,O
Bj includes the risk due To leverage since levera_.erate dete_n_ines_
in pa_t_ the variation in return to equity. We ex_ect that people's response
to risk due to leverage will h_ si_,silarto their response to total
risk, [hder efficiency conciitionswe exDeet, therefome, that equation
(8.1) will hold. If this hoLC1sthen M-M's Proposition II also holds.
A test of the CAPM also tests Proposition II.
Our test of the C_l_ gave verstpoor results which leads us to
think that it is not too meaningful to _mde_t&ke a separate test of M-M's
model. Instead we go into aggregate financial analysis to find how
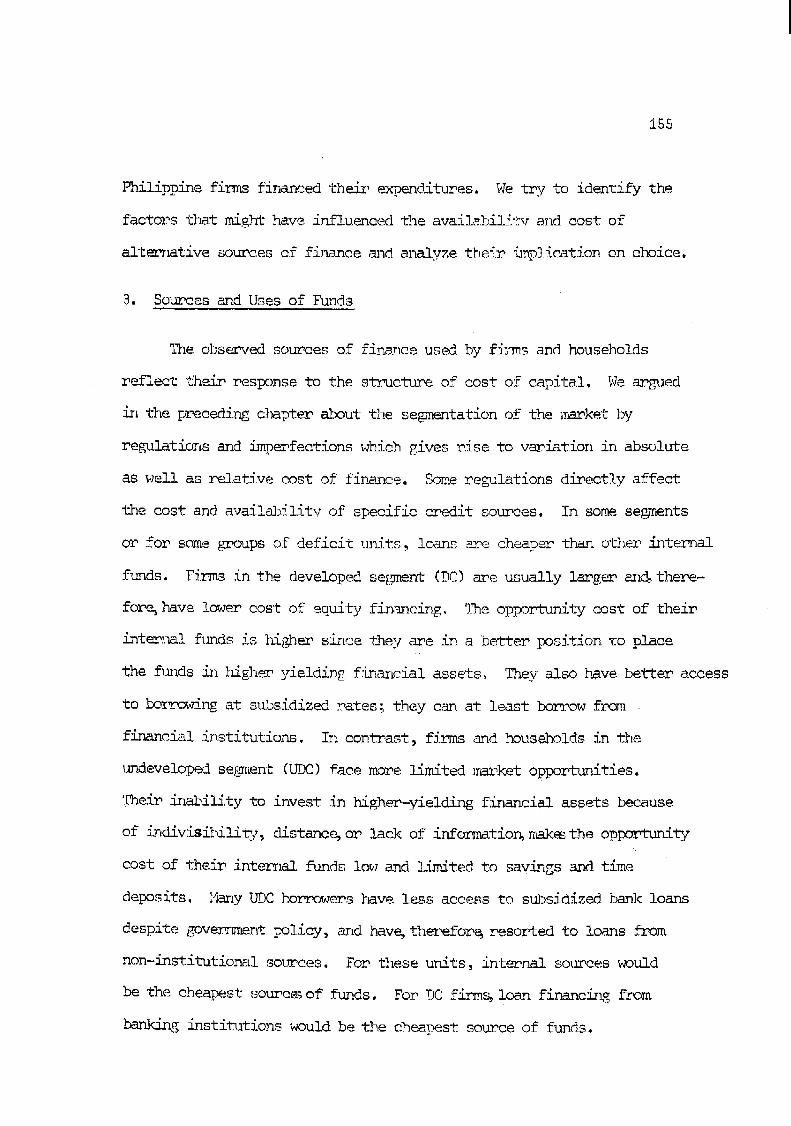
155
Philippine firms financed,the/r e_pe_nd:[tures.We try,to identify the
faoto_.sthat might _haveinfluemeed the availabili-tvand cost of
alternative sources of finance _]d analyze their imp,lie_tionon choice.
3. Sources and Uses of FUnds
%]neobserved sources of finance used by fJn_s and households
reflect their response to the str_ctur_,of cost of capital. We ar_ed
in the preceding c_mpter about the segnentation of the ;.Terketby
regulations and imperfections which gives rise to variation in absolute
as well as relative cost of finance. Some regulations directly affect
the cost and av&i!_>{!ity of specific c_edit sources. In some segments
Or for sQme groups of deficit u1_.ts_ loans are cheaper than other internal
f&nds. Firms in the developed se[_ent (DC) are usually lamger and_there-
for% have !owem cost of equ/ty financing. ']_eoppor_nmnitycost of their
_t_na! f_mds is hiF_]ersince t/heyare in a better position to place
the ftu_dsin higher yielding financial assets. They also have better access
to _xTrrowingat subsidized rates; they can at least borrow fr<_
financial institutions. In contrast _ firnm and .householdsin the
undeveloped sentient(UDC) face more limited n_rket opportunities.
Their iTmbility to invest /n higher-yielding financial assets __eause
of indivisibili_y_ distant% or lack of inf_tio_ n_k_sthe opporin/r/ty.
cost of their internal funds low and 7._ted to savings and t/me
deposits. _i_nyUDC borrowers _mve less access to s_J]sidizedl_nk loans
despite goverrm_nt policy, and bay% therefor% reso_ted to loans _rom
non-institutior_l so_rces. Fom_these units, internal set,teeswould
be the cheapest souree_of funds. Fo_ DC'firm% loan financing_from
banking institutions would be the cheapest source of funds.

156
The res_r_.seof the diffez,en1:groups of borrowers to the respective
flnanei__G._opporttmitles they face is, to some e_ent, reflected in the
data. Information on souz,cesof finance is obtained from scattered
sources, kl ideal source of info_mltion on sources is flow of finds
statistics. Available flow of f[_ds data wez,ecollected in special
studies rathe# than as a re.E_tla&?part of natioz_&lstatistics (Hooley
and.Moreno, 1950-1965_ More_o and Vasquez, 1969-197% _d NCS0t 1974-
1976). We try.to put these together,to see the _rends in the sources and
uses of f_mds. ""r,ih_ interpretation of trends _%s to be ],nadewith caution
since the estimation methods used were not -{;hesame rendering the three
sets of information not exactly comparable. .1_efirst two used primary_
data from a sample of fiz,,nsand house2_olds.The NCSO is reconstructed
from secondary sources.
Flow of f_nds table -(FOr_.,.,-br_acesthe sources _d uses of ft_ids
for one or all economic sectors -- households _ h_tsiness,financial
governmelnt__id f_rei,6n. The soul_cesfor each sector a__eits income.,
sale of assets, collection of receivables, proceeds frc_.borrewing,
_.%ndissue of securities. Uses are cumrent e_q._enses_physical invest-
ment, financial investmen_ and pa_yme,nt of liabilities. This set of
infoz_ation,not only traces the sources of saving[for investment but it
also allows an estinate of funds that are inter_ediated or channelled
throug_hfinancial institutions via deposits and other financial assets.
157
Moreover, the time series of FOF show_ I_;.rtfolioc_mnges among alter-
native financial and phvsi.eal'_s_nues.
I_iecomplete (all sector,s)FOF tables ar_ available for 1950 to
1965 (Hooley-Morm_%o)and for 1974-1976 (NCSO). In a comnlete FOF table,
the flow of funds can be traced from sI>_nc__ngunits (households,
business a%d government) to financial intermediaries and the rest of
the world, and hack from the latter t_D sectors to spending units. A
separate estimate of FOF for households 1950-1977 was made by Bur_er
(1979) using secondary,source% and another for urivate corporations
by _reno and Vasquez (:1978). The sectoral FOF are used to supplement
the information fron the two complete FCF s_ies.
Importcmt changes -<nthesavings and pomtfolio bc?mvior _m_din the degree of
inte_mediation are observ_JDle. LSnter_ediationhas affected nortfolio
choice bF households and consequentl_ ._hesources of funds for invest-
ment by them as well as non-household or business _.tn_its.These changes
are discussed in greater-detai.lsbelow.
4. Household $aving_and Portfblio of AsseZs
Households including _nincory_rated enterprises contributed the
largest though s!o_].ydecreasing s_._.,_ein total saving -- 74 percent
from 1950-1959, 70 pereeJltfrcm 1960-1969, and 62 per_.entin the 70s.
C_te saving ccmDmise_ 11, 18 and 16 Dercent, respectively, for the

_58
same period. As access to f_encial assets increas¢_, the_r portfolio
became mo_e diversifi,_ _nd the s_ne of c_ investment in physical
assets dropped. This is shown by a downward trend in the ratio of
physical inveslznentto sav/_g given in Table 8,1 (Hooley-,_orenoand I<[CS0).
A better picture of the c_ansing portfolio of household asset is shown
in Burkner's table_ here Table 8.20 We pref_ to use this since The
}boley-Mor_mo F0F seemed not to l'_vecaptured all the spending urLits'holding
of financial assets. There was no entry on deposits in theirause column,
In the inmediate postwar when the financial syst_n was still
very.small most of household sav_mg went to direct physical inves_nent.
In the decade of 1950 to 1959, tangible i_vestment absorbed on the
average about 83 ]L_reentof total saving. %]0iswas l_!rtlyfir_inced
by fJ2%_ncialliabilities (ai_nut5.8 pe_cent of saving) leaving a net
financial investment of about 17 percent, 1?hysicalinvestment _radually
fell over the years tho_h at flluctAzatin_T rate so th,-ntin the next
decad% .itwas 7,2 peroent and in the 70% it was &bout 57 percent. House-
hold partici_Dation_% The im_rket_as shown both by their finan_cial invest-
ment and bor_x_in_ grew at a fairly rapid rate from 28 to 62 to 74 per-
cent over the same p_iod. Gross financial investment which started at
22 percent in the 50s rose to almost 60 percent in the 70s. Households
borrowed more in later yecm_.s_allo:,_ingsome of them to be,in deficit
fo_ building the/r physical capital.

1,59
•""'._,'_
q--I._q
"C'_
L"--
GO
00C
DC
O_
O'_
_OC
OC
O'r"!
m,,-.,,,
(,rj_
(_C
_O
"1o')
['__N
¢OC
-)kD
LJ)_
¢0
P,_C,JC'_LO
__
_C_JO_
¢,x)_
C'II#)CD
_tJ')
17)_9
.p_l•",
__'_
__
cO_
_._"
(':'o.=
1"P--
_¢N
O_
_C
3_
%-4
_C
'_O
_C
_O
__
P_.
__
_
Q)
o'5
rJ_p
..
r[j._--I
P..
rJ)_,,
p..
4J
4J
o,-,
,._gJ
J-._d
,.-,_J_;J
,:,c_J=;_
,:,Jd
_,;__
J,-;_
J_,,;,4
_;dJ
C_
IILQ
c-,II'--I
4-._O
')_
CO
O'_
CO
C_
CO
'",'_(.0
CO
_:--tC:'_
C"_
_,r_,CT
_+
,",.D.,
CO
+,.._.C
'-_
C'._
L_,-_
_-I_
__
C',J
,,-,.
•-_><
11"g.......
"-,--"I
I,__,_,
_'__
C_
_--_,_¢'_
_1_
,__'_
_.0
(2__-I
__
("4¢._
__-I
C4
I.__1
t-_0")
CO
__
F--_
0_
.._,.,r,j';
.,,.-.,,.,
.,__.__
"_O
_-_J
0")_0
_--'t-._It,_
0")0"_
Lr._
_C
'_cO
_..,_
-_C
,__.0
-,_C
O---t"
_'_._-
Cr)
_-_C
O_
,:-4C
D._
b_I
II
II
1I
iI
iI
II
YI
II
II
II
iI
II
II
I!
4
'_'C
,'),,-I
C_l
C_I
C'_
C'4
C-,l
c(_c,*_
c_,_-,-_._
u-._(0
,':"):.t
u'Ou
'}L
,'OL
OL
,'O_
_i.'-,
if)_)
__-
._,,
0")O
")O
"1'cr_0")
C,')
('_")__
C_
CT
)O
")C
T;
_,o)
C_3
,,3_,_C
_cr_
..-_c_
0")O
_.3")
t,.j--)O').
C'_

160
Despite these im_m.ds,tlheproportion of household savings that
became available fo_._ busine_s inw_s_ent _?mained Icw. in the 70_ net
financial investment was only _;[t p_.c:_'_t of total saving. Counting
investment in unincor_ated enterpz_isesdoes not chang,e the pictume
ver_ much since the bulk of pllysi_alinvestment went to real estate
and consume_ durables (90 percent in t!ne70s).
It may be.argued that the se_en-tation of the financial market
has not en.c0ura£_edfinm_cial investmen-_especially by sT_ellsaves
whose oppc_t_m_itiesin the financial n_rket _e not very al-t._a_t_ve.
Most financial investments may be said to have been made by L-_mge
savers and little %_ sm_ll savers. Investment in deposit s_stitutes,
securities and trust funds al_ made mainly by the central city.rich.
They _ve access to these assets and ]_-_veno D__oblt_nwith their
indivisibility.. Compulsoz_ and con.t.r_:,_<,_n_alsaving forms (emplctyee
benefit irL_ur_neeo_ soei&l sec_&_i_7and othP__life Jmsmcances)_ on
the other hand, are generally held b! those with stable income like
salari,,_Jindividuals. _tey belon}_to the upp@ half of the income
distribution. Private voluntary life insurmnee would not glve a good
ret_ for _ose with low and _mcertain income since the probability of
insurance lapses and forf__itureis high. Small savers especially in
r_mal areas ame, themefore,left w&th deposits as the only financial
option. %4efind that rheim shame in deposits has net been laz'ge.
Only five pep.centof saving and rime deposits in the last three years

161
Tz_tb!e 8.2
SIZE D!S'I_hIBjT!ONOF LAV!NGS f_.ND'FIkIEDEPOSITS A_TD
DEPOSIT S_rJSTIIIfT.,_T,S_1977 (in %)
(1) (2) (3) (4)
SavingsSavings Time and T_ne DepositDeposits t_eposits Deposits Subst/.tutes
_1,000 g bel_7 7,6 0.4 5.1
_1,001-_i0,000 1.8.0 11.3 15.7
_10 _001-=o0,000 20.., 1.6.7 18.9
Over #50 _000 54.3 71.6 60.3
< _'100 ,,000 0.9
_100-!99 2.4
_200-2,000 32.2
Over, 2,000 64.5
Total 100.0 _.00'.0 ._,'__"_,.0 100.0
Source: T. 4.7 p. 293 and T.411, p. 207, Bur]_ner(1980).

162
was in _1,000 or' less size, snout: 15 pe.rcent in _1001 to =_10_000.
(See Table 8.2) _qTneaverage _x)or wou!d hold less than __1_000 deposits,
We may also consider the fact t_t less than five percent of total
banki_ deposits came from ritual_nks reflectin_ a low shame of rural
households in financial sav/n[_s.
We might argue from the above findings that more savings could
have been mobil/zed from the household sector with a correct policy or
eormeet pricing of assets. Among large savers_ direct investment in
real estate and consume_ disables were encouraged by "theunintended
subsidy of loans obtained from governmez_tand other ba_ks for these
uses, These were further encouraged by the low tax mate of real estate,
A com_.titive finarmial regime combined with a progressive high real
estate tax might have reduced t-helmshare and directed household saving,
to financial assets, 9_e funds could _ve been allocate@,to more pro-
ductive uses, Home firmr,cial savings from low-income groups could also
be expected _m such a regime, _,']emigb_ supDort this contention by
pointim4<to the mat_ierlarge shifts in household Vrrtfolios. These
shifts might be int.e2cor__tedto reflect their attempt at finding optimal
portfolios. With the rise in the ceiling rates on t/nm deposits in
mid-1970s, the share of this financial assets rose. The share of
/]Isuraneecla_-s declined possibly in response to the high inflation
rate which eroded the e_cte_d real returns on this form of saving. We
cannot clearly support the responsiveness of households to relative rates
of returm_ assets given the difficulties of obtaining fine enough data
on this variable.
163
4.I. Corporate Sector
Incorporated enterprises tepidto be _._uchlarger than urLincornorated
enterprises.21 They also tend to be loc_at_lin urban c_mlters. All
top _I_,000corporations are.eith_r located in the metropolitan are_ or
keep their een-_al ad_::_is-t_ativeoffices there. ___ey_theref¢_ have
bette-_TM access to institnltlonalso_ces of finance t!_n tmlneorporated
businesses. As a whol% the opport_ity cost of corTx_ate internal
funds is higher an@ cost of equity,issue lower than for the latter small
household firms. Nevertbeless_corporate fi_ncia! market opportunities
are not homogeneous because of imperfections in the J_stitutior_lized
,financialsector. As discussed _rli_r_ transactions cost differs
depending on the size of eq1_ityissue and firm regulations. Ability to
borrow from subsidize_ so_ces depends on many factors_ some of which
are not necessarily econc_iicin nature. Firm_lly,some corporations
belong to financial conglo_2ates. For these reason$ the relative cost of
alternative sources of funds diffe_s even amf.>ngincorporated firms. Some
would find equity issue the cheaper source_iothers_ loan financing. It
is not easy, however_ to document relative cost and show how choice
depende_ on this vamia/>le. One way is to categorize fizzesby the/r
relative cost and to see how cost determines each category's firk_nce
1: .....
_e 35 percent ceiling i_x rate on corporate income encouragesthe incorporation of large enterT_ises.

164
choice. We may take as one category f/tinsthat belon_ to financ/al
congla_lerates. Another category consists of firms which have polltieal
and personal influence with _ove_ment _nks. A th/rd category is size.
The melative Cost of loans will Tend to be lower for the first two
categories while equity cost will be lower for large firms in _eneral.
The first two categories ar_ not readily observable and tend to be confounded
with each other and even with size. Test/rigfor their effect is, therefore,
not easy to do. In regard to internal finance we expect its opportunity
cost tO be equal among all cor_ations though its relative cost vis loans
and equity depend on the othe_ factors.
5. _'heBasis for C_1_la_erat_on
We tr_ to pmovide the basis of financial-non-financial conglsmer_tion.
Filxnsfaced with a downward sloping demand for investment funds or goods
like consumers with a downward sloping demand for const_nptiongoods, obtain
a suplus in their purchases at a given p_ice. Consider a fimm faced with
a hypothetical marginal _t_mr_l rate of return line IOR as in Chart 8.1.
Superimpose on the chart a supply of funds curve FF with equilihriumrmte
at Rm. Assume this rate to be also the market rate. At this rate firm
has a net gain, call it producer su[_plusequal to the triangle _0 I.
AT the supply curve FF, the intermediary has a net gain of _i F.
Without conglome_ation_ the intermediary gain is the area _01 F. If it is
conglomerated with the bo_n_ f/ramits owners share in the producer st_plus.
The intermediary surplus thus increases. Ever_hing else equal (risk, manage-
ment cost, etc.),intezn_aries would prefer to lend to affiliate versus
non-affiliate firms.
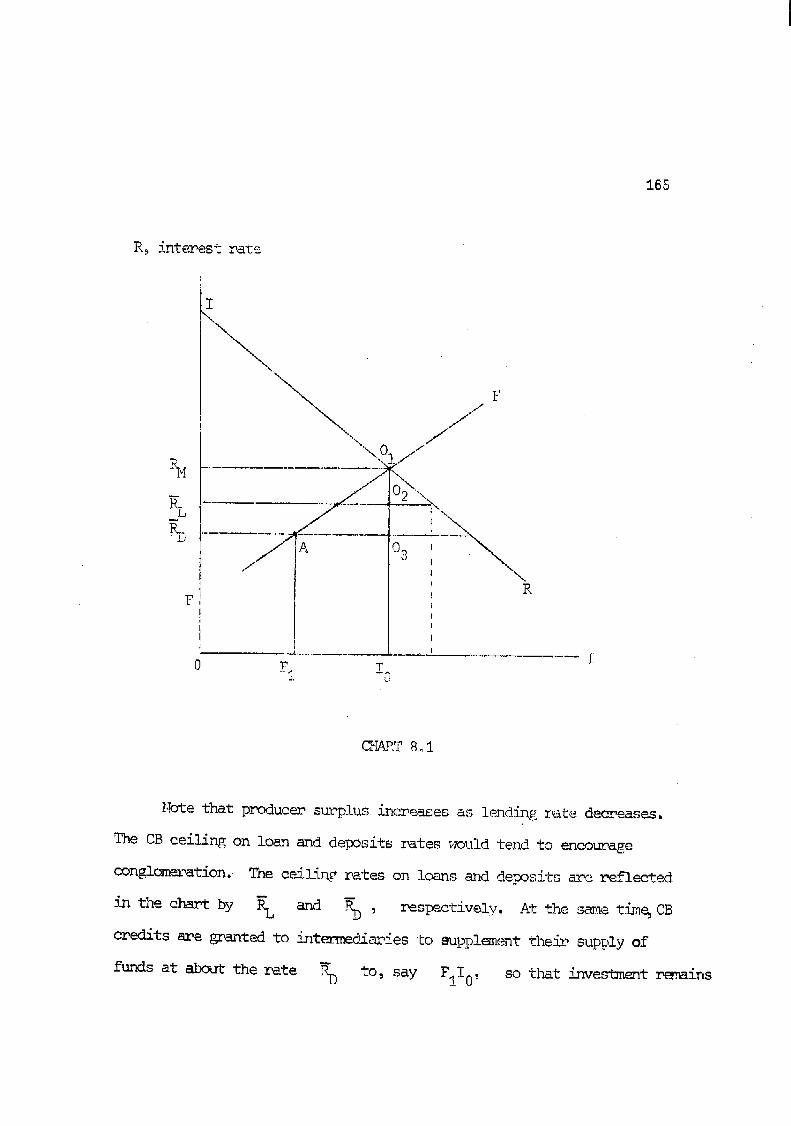
165
R_ /nterest rate
I
"4
"\
T 7AR
F
0 F1 -3
_L%RT 8,,1
Note that producer,surplus increases as le_ding r._-%tedeere&ses.
The CB ceiling,on loan and deposits rates ;,x)Ltldtend to encourage
eonglomeration. The ceilin_r rates on loans and deposits are reflected
in the chart by _ and % , respectively. At the same t.im_CB
credits are granted to /nte_ned/ar_es to supplem+mt the/__ supply of
funds at about the rate _ to_ say FIIo_ so that investment _ns

166
at I0. At _, there is excess demand for loans (as experienced
in the country). If the ee/1/_g rate on loan i.simplementec_vroducer
sur_lLsincreases but intermediary surplus decreases. Intermediaries
would have a 6r_ate_ incentive to conglQme_ate so they can share in a
lerger produee_ surplus which includes some CB subsidy equal to
i PP2"
Conglomeration is not costless, however. _There ere usually
diseoonomies of scale due to the deterioration of the qualit_ of
manag_nent as enterprise size expands, There may also be diseconomy
due to loss of expertise as manages enga_e themselves /J'1diverse
activities. _hese _,seconomies p_obably don_<natepossible _a/ns frcm
the reduction in the cost of credit /_iformation,collection of payment and
transactions between affiliate companies._hus _ society loses from
any difference in marginal returns to investment between con_lomerated
and independent enterprise_3. Political patronage eneot_ragesconglome-
ration. Special licenses for imports _ natural resource exploitation
(logging..,]_inerals_oils)_ V_]ic utili.17 (electrici_7, fuel processing),
expo.,rt i-tad%and processing of major products (sugar and coconut) have
been _ranted to political interest ,.q_ouDs.These licenses create
monopolies and guarantee large Txof.its. It becomes wor_.hwhilefez,
financial institutions to conglom_._atewith these interest _r_ups or
for these to take ovem financial institutions. Such conglomeration
concentrates the total surplus in a smaller group of entrenreneurs.

167
This kind of conglomeration is very much in evidence in this decade
(Doh_y, 197g).
6. Other Forms of Influence
Pemsonal and minor political connections have influenced the
allocation of creciit_y intermediaries especially the public and
publicly-supportc_dones. P_gfit _Tatesof f:[_s able to avail,of
credit from this source _Dul.dte/_dto be higher evemytking else equal.
Entrepreneurs possessing political _m_dother kindsof influence over
these banks _gul_ therefor% tend to undertsJ<emore activities t2m_l
others. In eont_,ast_independent firms would have to compete with
each other in obta/rdng _fur_sfor the/r investments an_ themefore,
have to be efficient in ord,e_ to survive. It is possible that where
political firms take ove__ fr_m_these competitive firn_ s_iety loses
out. It foregoes higher margir_l retla_nsto invesin_entby the
unsubsidized firms which political f_4xmsreplaced.
7. The Relative Cost of Fin,_mce
These influences llavedirect hJt differing effect on the cost of
capital to different groups of borrowers. It is obvious that if the_re
is capital rationing at an artifica!ly low rate, those able to borrow
at this rate _ favored. The opposite _holdsfor those who are __ationed

168
out of the system. The relative cost of borrowing throu_h lo_s
is lower than that of stock issue and ot]'_rso_ces for the former_
Othe_ reg.ulationsnot directed at specific sources of financ/ng
also affect the cost of capital anc_therefor% the choice of finance.
The eeil<n_ on deposit rate has art<fieially lowered the opportunity
cost of internal finance especially of small household entrepreneurs
and othe_ businesses. They have little or no access to high-yield
finanei_l assets such as nDnev _erket plac_nents or a well-selected
portfolio of equities. _nese assets require a large minimum placement
and am% th_mefoz_ not availab]e to small surplus units. Poor informa-
tion further limits access to ce_ta/n assets; Another cause for cost
differences is t-ransactionscost. The_ is usually a large_ fixed
component of tr_/,sactJ.oncost _J1equity issue. It has to be
registered at the Securities sad Exchange _mmission and it also has
to be advemtised. The ave_._ageteansaction cost_ themefore, depends on
the vol1_neof f_mds needed and on the reputation of a f/rm. It willA"
tend io be relatively _dgh far small and new fiz_s.
We find in the foregoing that far from _havinga perfect capital
market, we _haveseveral factors that results in substantial variation
in the _gsolute as well as relative cos'tof alternative sources of
finds. Some so_ircesare not available (or their cost is prohibitively
high) to e_ta/n groups of deficit un/ts particularly tO small _irms _nd to
those located in remote are_s not serviced by intermediaries.

169
The relative cost will determine the source chosen. Firms with
low oppo_hmi_," cost of inter_l fi,nancewould re<v on this more than on
other fi_,s. Those belonging to a finm_eial conglomerate would tend
to z_ly on loans mcme than inte_lal _mndequit7 so,races. Financial
decision is also colored by the non-homogenelty of equity holders.
Many _ilippine corporations are effectively controlled by a _m_all
group of stock holders. It is [mssible that the effective rates of
return to the equity holding of the contTolling int_est £ro1%Dis higher
than the effective rate on small holdirk%s. Profit share can be paid
in the form of dir,ectors_ and officers' fees in excess of their opportunity
salaries. Since cont._oli31_ng/_.terestdecides on this matter, the
effective dividenSs can differ. _ ex_[ple of t]misbehavier is tb_t by
San M/guel C_rr_mations (_C) officers. 2Y_eywere reported to have
p6d.dthen_selvesa very 16n_gepro[x_rtionof company rmofits in the form
of directors' fees and allowances. Apparemtly_SMC is not an exception
in the Philippine scene juc]Eing,from the opulence of corporate officers'
lives and the relatively low dividend rates paid on most stocks. The
case is not easy to support by data since .financialreports usually
lump together officers'and non-officers' salarie% fees and allowances
JJntothe same accounts.
'i-'he rise of family col_x_rationscan be rationalized by low
op__7 cost of internal _nd loan financing. So long as the cost of
intexrm_lfinance and loans _ low relative to the pure equity rates _ these
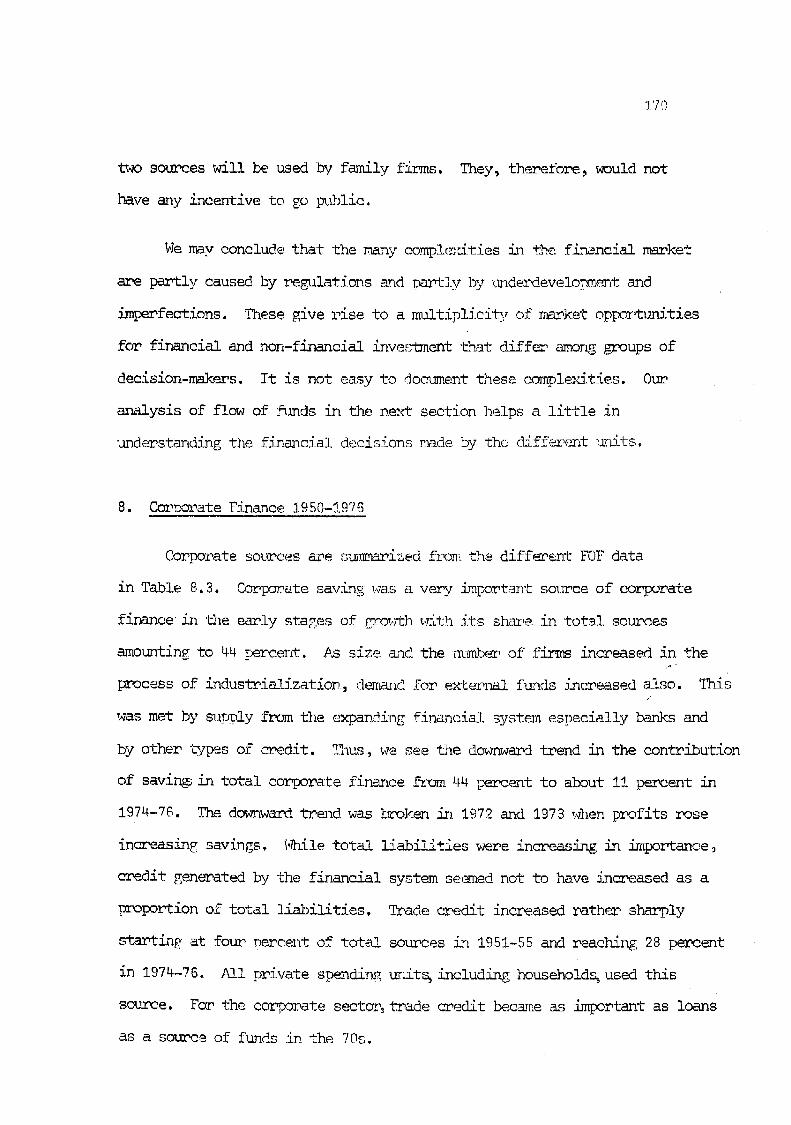
:1.7_')
tWO sources will be used by family finns. They_ there_bre_ would not
have any incentive to go l_ublie,
We nB.Vconclude that the m_ny con_le._d:ties_ t_e fi_ncial market
are partly caused by ?egulatic_s _(l Darkly ]_7c_ide_developme2atand
imperfections. These _ive _ise to a multiplici_j of _rket oppor<unities
for financial and non-financial investment that differ among _ups of
decision-makers. It is not easy to document these cxgmpl_dt__es. 0up
analysis of flow of 5unds in the ne:_tsection helps a little in
understand/rigthe financial decisions n_de by the diffem_mt ixits,
8. Co_,norateFinance 1950-._,976
Corporate sources are s_rized fr_ the diffement F0F data
in Table 8.3. Corpom..atesaving _a.._a very solmce_ _ _ ir,_po_,t_z_'t of corporate
finance in "theear)y stages of _,zth _Ti-thits s_z,e in total sources
amounting to 44 percent. _ size c_qdthe nu_be3rof firthsincreased in the
process of industria._;zation,dem_id fo_ exter1%_lfunds 5increasedalso. This
was met by supply from the eXpandin[_financial syste_nespecially banks and
by other _/_nesof cme_iit. _a_-s,we see the downward trend in the contribution
of savin_ in total corpomate finance from 44 pereeantto a1._ut1_.percent in
197t_-76. ..Thedownward tr._d was broken /m 1972 and 1973 when p_ofits rose
increasing savings, hhile total liabilities were increasing.,in /mportance_
credit generated by the financial syste_nseemed not to have increased as a
Dropo_tion of total liabilities. Trade credit increased _ather sharply
starting-at fou/__2ce_t of total sources in 195!-55 and reaching 28 percent
in 1974-76. All private spe/%dingunit% including household% used this
source. For the colas?ate secto_,_trade credit bec_rn_eas important as loans
as a source of funds in the 70_.

171
We present Table 8.2 in _n atten_ptto see a natte_n_of corporate
financing of capital and other expm_ditures by different indusl_ial
groups. We find tremendous vamiation in the Sha_,eof each source
anDng i_lustries. To be_noted is the relativeiv low reliance on funds
from financial institutions averagin[ 18 percent by all c@_]_rations
with ranges of .6 of one percent for m/ning to 39 percent for
agriculture. Lord-term loans from this source We_e even less 9nF_rtant_
aver_%ging7 percent and rang_in_from .5 of one _cent to 27 _rcent.
Non-intermedisn_j_7_u_ces -- triodecmedit and other borrowing -- had
the largest share in mlmos-tall corDorations. Loo]dng now at long-
ter_nsource% we find just as n_ch variation in the use of altel_ative
sources. Savi_,gvaried fr_l 12 "to54 percent; equity,from 25 to 92
percent; loans from financial,insti±_tion% from 1 to 46 percent; and
other long-term so,race%frown0 to 34 percent.
Theme seems to be.no clear-cut _tten_ in the _r_y-thedifferent
_ndustq_ieswere fi_aced. _medit incentives gra_ted via financial
institutions may exp.!aina_riculture's hig_ share of long-term financial
loans. But then the BOI-_glstered manufacturing c(xrporationsborrowed
less than non-registered manufact_ming corporations from this
source. _e forrne_should be expected to rely more on goverr_nentbank
loans, DBP in _-ti_lar_ since they are granted priority status for
borrowing from this source.

172
P•
c_
_g
__o
gd
J_
dme-i
-o_
o_
__,_
¢_o_
oo'_r_-N
og
_d
Id
o,d
oo_
_,d
d
u__'-
C_
C'_
__
__
¢._0
c__0
•_._-I
_,r-t
__
__
o-aC
._.0
,¢-IoO
rd
__"
_•
•.
•.
..
••
e•
J_r
,.._.,T
J"_
_-_C
_D_'-
__
OD
_.'---._,-_
0_
r_
'_....,_--I
_.'_v-I
_@
.4_
',.0-¢-I
D".,,
0_',,_-_
C,"J
__1
c_o_
_'_D
__
caD"<
i-1_.-..o
I•
_•
•rl
,o_
L
,-.0__
.r.-I_-I
_c._
0..Iq,,,,lCz
co
E'-_
',_1
.r-t
rJ_-I-
C,r.1
,r.-t
"C
T_
•-I_
,<-I
O0


174
We explaJmed earlie_ wy Philippine corlx_rationstend to rely
on internal finance and to re_,_inas f<e_;[lyco___x)rationq.1_]isseems to be
bol_neout by the data which show savi:np]as a f&ir,]yim_x_rtantsou_ce
of long-term fu1_ds. For sud_ cor_ora:tior_%even equity _y be considered
as an /_te_n_alsouDPcesJmce it consists ef the di_,ectinvestn._entof the
fir_ owners. Contrast the case for _z_g and electnflieity._%dustries.
These are public corporations whose equity s;haresare n_rketed in
the stock exchange. Both sectors have very.,hi[:hequ/ty sh_es and low
savi_ and other soirees s]%arein their lon[7-te_mfinancing.
FJ_all¥_ we wa_t to note that except for,electricity/,all industrial
groups had imGretitan_ou_h long-_e_n funds for their capital expe_ditnmes.
If_ however_ only lon_-.te_ funds f_om f_anc!al :hlstitutionsar,ecounted_
they _u]i a[_pe_'_inadeqj_atesince "d_eyeov_ only 15 _mcent of total
long-tern funds of cox_pora:[:ionsbe!:ween1969 and 19'73. It is possible
that the observation ,_boutthe short mat,_it_zstr_,uct_a__ of ftmds (1978
World Bank-I_-CBP Repcmt_ various Cemt_1 Baz_kofficial statements
a/reedat rationalizir_ the s±_ructureof interest ceiling and "the
•succeeding relay.trigof the cei]/ng) was bas_ on the maturity structure
of loans _ranted by financial institutions. The data s1_w that lone-
term f_mds were available but that they came from non-institution&lized
sources -- savin[!,direct investme_,tof firE_owner% and other
sources. Cmrpo_rateaccounts do not specify what these 'other' sources
are. A possible important eom_ne,nt of these a_e purchases of equipment
on c_edit and long-t_zemleases of equipment and other capital expenditures.

176
Concludir_.Remarks
The Philippines has come a lon_ way in developing a network of
financial institutions which provides the infrastructure for the
mobilization of savings and other funds, and the widening of asset
choices to wealthholders. The financial asset ratio more than doubled
from .20 to .50 over the post independence period. Financial develop-
merithas indeed been taking place but rather slowly and involving
certain structural problems m_m%yof _hich are consequences of the interest
and credit policy follows. The finance ratio is about l0 percent of the
United States and our M2/GNP ratio is about a third of Japan. The low
financial development indexes reflect the poor mobilization of saves
of households especially those in the lower income brackets and those
frownrural areas. Apparently, financial savings a_e being done mainly
by urban hi_,-Incon_ families and businesses. We blamed the low interest
rate on savings and time deposits _nd tlm.inaccessibility of the higher
yielding financial assets to small savers as m% important factor for
the slow rise in financial]savings. __negenerally poor performance of
rural banks should also account for this problem.
We find business enterprises to have rel_ed increasingly on
external f_aqds. However, they c_me from non-financlal sources. Trade
credit and loans from non-intermediary sources accounted for about half
of total corporate sources. Financial intermediaries supplied loans

177
amountir_ to about 20 nerce£st,of't;ota.isources ,,_.._,_,,.We _Li£_htexpect
unincorporated business to have bo]zrowedeven less than corp_oratlons
from f£na.ncial institutions. Being,,small_ less informed ,.-_Idlocated
in more remote areas they had,less or more costly access to financial
inst_1.tutlons.K_-erise of t,'"adeand other non-institutional credit
meant that their cost was found lower thz_ninstitutiona! sources or
that these were not available at the _oi_4°<interest rate. !_,Teshould
expect t}_t if financial institutions were eff,'icientlym_sa£ed they
would have lower transactions cost of credit tl-mu_non-fi_._ncialfir_,_s.
We _sy therefore ar_e tl_t the extensive use of non-f'ina,_]cialsources
ret'lectssome _efficiency in the s_stemo
The study fLmther showed tl__tre,_.lationsand imperfections ._mve
obstructed the J_te_ation of the fina_cial system _to one market and
prevented competitive tradinf of available assets and allocation of
credit. Interest rates on hor_geneous papers like time deposits_ or
these ar_]their close substitute bank bills differed by as ,muchas four
9ercentaT.,enolnts. Averaf_eenuit%_ yield varied even more ran_j_n_from
-.46 to +.68. There was also substantial variation in moneF market
rates. We find t_t equity .yieldcould not be explained by risk.
Reported money _aa_ketrates _,,eze.notexplained by either risk or m.aturlty.
This beha_riorof interest rate .mifhtbe interoreted to describe _z_rket
se_q_entation.

178
We exn!ained how sedimentationarises as a consecluenceof indivisi-
bility,-7_nperfectinforr_etion_iphysicalbarriers and the w_ious ceilinTs
on interest rates. _'ith the dere,_ulat.lonof interest rates and the
flexibility offered b_" the universal bsn%d.nglaw_ financial institutions
are e_,ected to be!_aven_re co_npetitively. Co_._etitionitself is likely
to weaken ph_Tsicalbarriers as intermedia1'iestr2 to obtain more funds
and to cater to more creditors. It miyht also encourage some interme-
diaries to advertise their services and thereby provide info_r_ationon
their papers. In this re_ard we wish to take note of the need for a
.moreconscious and orKanized dissemination of janfor_tion on the
availability, risk and yield of alternative assets. The _zriterfeels
that poor .informationis a major cause of the observed se,,_,ntationof
the market. IAFd!ethe ffovernmenthas engaged in information c_mpaign
on population control, _ood nutrition and a_riculture, among other
interests, there has not been anTfeducation pro_r.s_nrelated to savings
and finance. Admonitions to _'ma_-impoksa banco" (sa_e in the batik)
does rot do m_ichunless the interest ra_e on deposits are made
attractive _:_nddeposits s_reshown to be a _ood asset alternative.
_ne deregulation of Janterestrate is a very _©ortant move for
the rationalization of the flow of ,._qdsin the financial n_rket. It
is a necessary condition for fosterin_ competition. It does not_ how-
ever, _arantee competition since there are still other serious Imper-
fections and barriers tl_atobstruct competitions. One is oliF_opoly

179
Dower posed by the dominant vroup of a s_s.lln_,_berof co_ercial b_ks.
Their Dower is exacerbated by their men%ers' conglomeration with other
financial intermediaries inc!uding_insurance companies and investment
houses. Even more serlous tl_m_bank o!i_io_)ol_lpower is the extensive
and complex package of government intervention in the market via the
large public and publicly-supported financ.ialintermediaires, special
financ_x Sclhemesand liberal,rediscountin_ ac..,.litie_,at very low
interest rates, :ibAspacl_ge involves cheap credit source for'financial
i_.ti'Cutionsand more narticulsrly for f:h_,sand individuals that have
access to government intermediaries sad special funds. Relatively cheap
credit bas been _enerated .frommonet_[rye_pamsion via the rediscount
window, foreign borrowing, abnormal profits of the monopolized sugar
and coconut export .m(_u_...ieo_ _nd comoulsory sav_s via the social
security system. The allocation of funds _om these sources has mot
been based on normal credit criteria. _ GSIS funds have fi_anced
r_blic corporations such as the Philippine Air Lines and favored firms
like the stsr_ed hotels, while the P!_,and the D_P have financed
priority industries as well as specially Cavored firms. As a whole
. _- _banks have a continuous cheap rediscountin_ priv_le_e with the Central
Bank, with some banks obtaining special redlscounting privilege. _mile
this privilege helped expand commercial b_m_kingas a whole, it provided
a c_utch to poorly,rmnaK_d__ .ruralbanks.
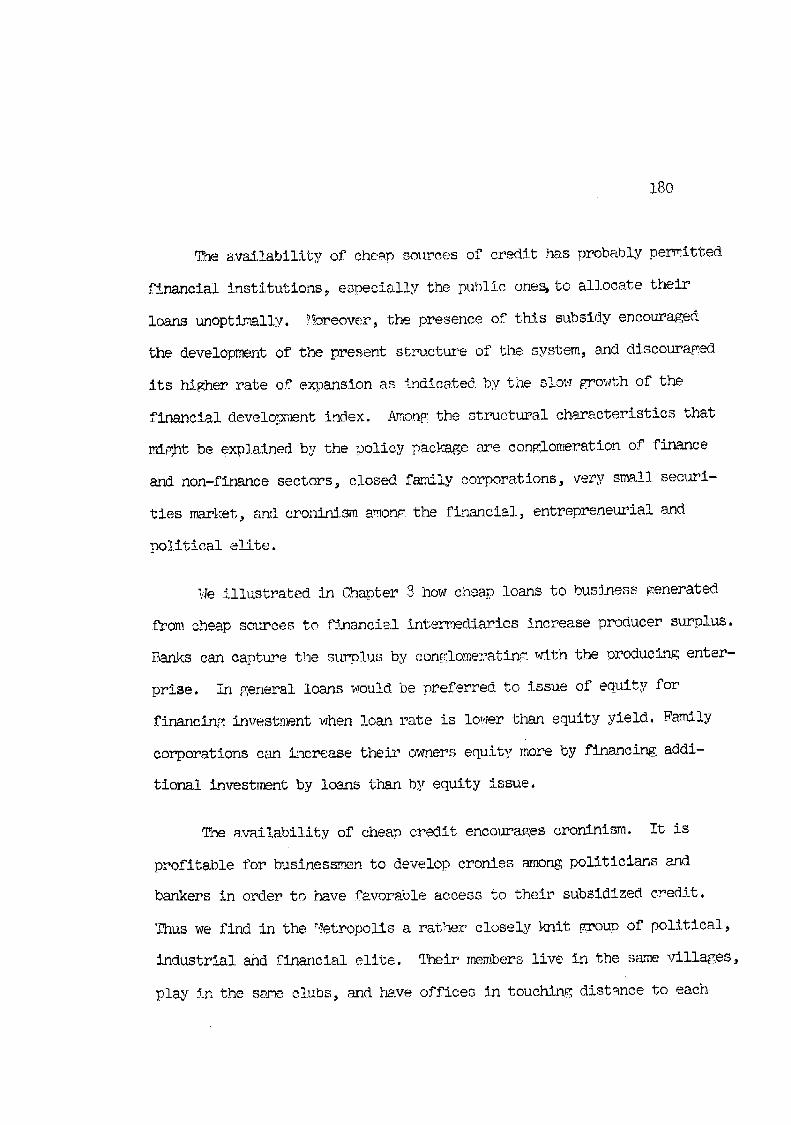
18o
q_neavailability of cheao so_ces of credit has probably pe_itted
financial instltutions_ especially the public ones to allocate their
loans unoptLnally. Moreover, the presence of this subsidy encouraged
the development of the present structure of the system, snd discouraged
its higher rate of em_nsion as indicated by the slow growth of the
financial developnmnt index. Ar_on_the structural characteristics that
mi_t be exolained by the policy package are conglomeration of finance
and non-finance sectors, closed family corporations, very small securi-
ties market, and croninlsm a_ong the financial, entrepreneurial and
political elite.
We illustrated in Chapter 8 how cheap loans to busJ/ness_enerated
from cheap solaces to financi_1 intermediaries increase producer surplus.
Bar_s can captore the surdplusby conglomeratin_ with the oroducln_ enter-
prime, in general loans would be preferred to issue of equity for
financln_ investment when loan rate is lower than equity yield. Family
corporations can _crease their owners equity more by financing addi-
tional investment by loans than by equity issue.
The availability of cheap credit encourages cronini_. It is
profitable for businessmen to develop cronies among politic"lansand
bankers in order to have favorable access to their subsidized credit.
'lhuswe find in the _,_etropolisa rather closely knit group of political,
industrial and financial elite. _Teir members live in the smme villages,
play in the seineclubs, and i_,veoffices in touching distance to each

ISI
other. Such a socially close me,lieu gives the members easier'access
to each other's privileges.
_he structural c_mracteristics in the modern market of'the _etro-
polis _haveprobably contributed sil-_ficantly to the recent difficulties
and failures of major f_m_ncia! and industrial,enters,rises. A co.nFlo-
merate bank is vulnerable to press_re b_ the off_Icersof the affiliated
companies. The discussions and r_ewsreport of the causes of the
difficulties of Philfinance, Atrium and earlier, Philcapita_ point to
the liberal _ant_g of loans by these Snte_diaries to their affilia-
ted companies. Croninis_ is exemplified by the Dewey Dee _id other
simil_ircases. Dee could not _havebeen lent so much if _hisloan applications
underwent normal credit evaluation process. Aoparently, a friendly
socially close atmosohere in the city developed a euphoria of truestthat
made fin_cial companies dispense with re_iar credit ew_,luationof
theJ_ _iends' loans application. _is is evidenced b_rthe rather hi_
proportion of uncollateralized loans (50_) _anted by the bankia_ system,
This reversed the earlier r_racticeof st_:_ictcollateral requirement
among lending institutions.
In s_._.larywe wish to a_gue that the above structure and its
consequences would not have developed under competitive conditions.
Congl_eration would be based on economies of scope and _noton the
presence of privilege, There would be no reason for croninism s_ce
friends would not have gifts to offer. Security issues would be

182
competitive _.th loans as a solmce of _mds, Fi_ investment decision
and management would reflect t_m t_ae scarcity value of capital.
It is not easy to assess the stre_to'thof o!i_opoly power of
commercial bar_cs. In fact it diJ not sm_face until after ti_ederegu-
lation of interest rates which took effect on July i (1981). __herewas no
need for collusion on interest rates before dere_u!ation since the
ceiling on deposits worked as a monoosony price. _ro meetings of the
Bankers Association of the Philippines (B_P) took place in the first
ten days of July to obtain a_eement on savln_,deposit rates. Com_ercia!
banks agreed to fo].lowan interest rate schedule for savings deposits
starting.,from the old ce.i.lln_rate of 9 oercent for small deposits and
i0 percent for _10,00O or !arF_erdeposits, q_ere has not been a discus-
sion on other rates. The BAP is a ready organization and mi_,htbe an
effective one for arriving at collusion on interest rates t_qdother
terms for their services by the small ,_roupof co,mercia! brooks. It
is doubtlk_l,however, that it exercises cartel power. It does not
seem likely that all members will follow cartel m11e. Secondly, this
sector faces competition from other institutions studother se,_ents of
the market.
BAP's strer_,_,_h_;[[I!depend on the competition posed by the public
sector and the many small unit b,,_nks.__]epublic sector is quite large
in terms of its share in the assets of the total financial system. How-
ever, its two nt_jorcomponents -- the P_ and the DBP --- have a
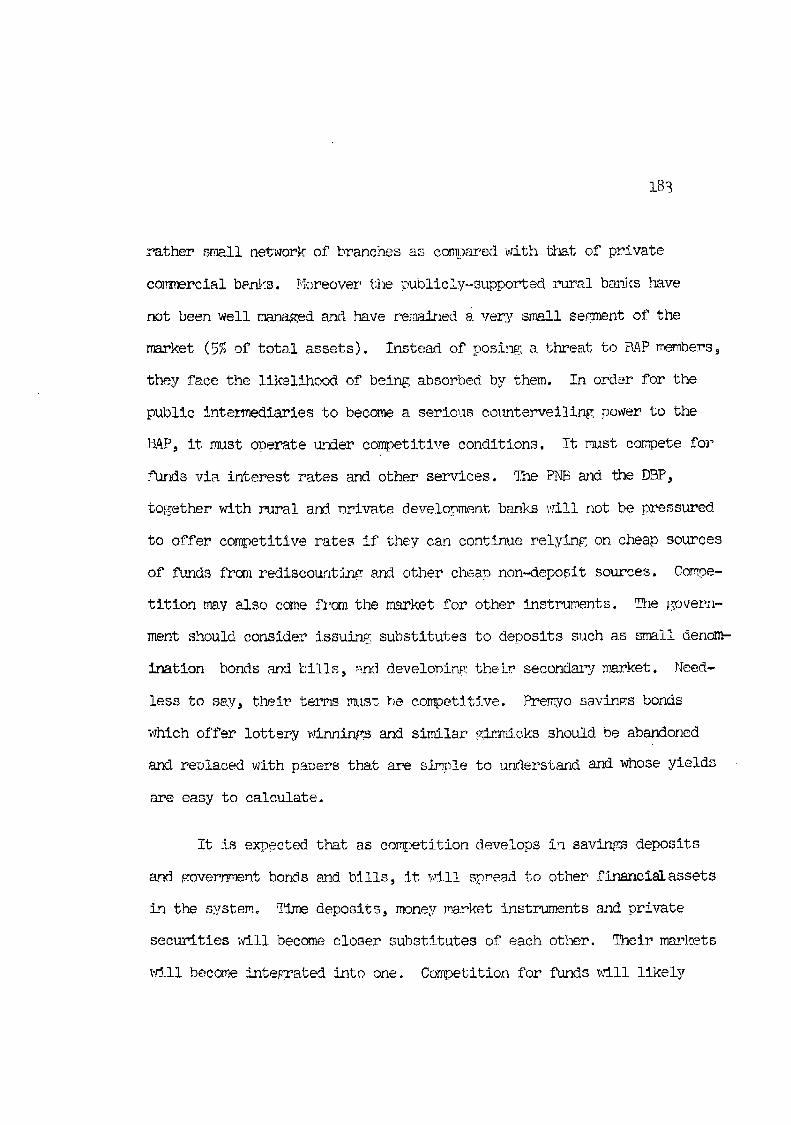
183
rather sn_ll network of branches as compared with that of private
commercial ba_J<s. _loreoverthe publicly-supported rural ba_s have
not been well man_ed and have retained a very s_!l se_lnentof the
market (5% of total assets). Instead of posi_ a threat to BAP mJ_mbers_
they face the likelihood of being absorbed by them. In order for the
public !nter_ediarles to become a serious cotlnterveilingpower to the
BAP_ it must operate _nder competitive conditions. It must compete for
_t_ds via interest rates and other services, qlnePNB and the DBP,
together with rural a_l orivate development banks will not be pressured
to offer competitive rates if they can cont_nue relying on cheap sources
of funds from rediscountin_ snd other cheao non-deposit sources. Co_e-
tltion rma¥also come from the _rket for other instruments. _ govern-
ment should conslde_ issuing substitutes to deposits such as small denom-
ination bonds and bills, _)nddeveloo!r_ their secondary market. Need-
less to say, their terms _ist be cor_petitive. _reN_o savinFs bonds
which offer lottery _t2d_ingsand similar gimmicks should be abandoned
and replaced with paoers that are simple to understand and whose yields
are easy to calculate.
It is expected that as competition develops in savin_ deposits
and p-overnmentbonds and bills, it will spread to other flnancialassets
in the syste_o Time deposits, money ms__ketinstruments and private
securities _,_illbecome closer substitutes of each other. Their ma_-kets
will become interrated into one. Competition for funds will likely

184
lead to flrmncial institutions reach_%, out further to rural clientele,
hence also weskenlng ohvsical b_riers to financial flows.
The foregoing leads to the following specific reconmendations
which are all aimed at fostering competitive trading in the financial
market :
i. I/ir_itthe use of rediscountin_,facilities to neet target
levels of money supply. Their use for financin$_special projects
including development of certain financial intermediaries should be
stooped. Other credit facilities such as those from foreign borro_d_ng
are to be granted on a competitive basis. The rediscount rate should
be set at competitive level also at either the inter-bank borrowing
rate or at prime commercial paper rate. qhese sources will thus be used
sparirgly.
2. Develop the market fbr government securities. Small denom-
__nationbills and bonds of s&y _200, F500_ _l,000, and hi_her may be
floated at rates competitive v_ithmoney market rates. It is expected
that the smaller denomination papers will have a lower yield to cover
for increased transaction cost.
3. A pro_ram for developing:_a secondary market for these securi-
ties is to be initiated. Private b_<s are to be encouraged to trade
_u the securities and as an incentive they may be allowed to use the
proceeds as a source of fhnds.

185
4. FLundingfor special projects should come from the proceeds
of goverr_nentissues _W_ich;_ssu_r_estedabove, are to pay competitive
rates. In this w_v the project costs are estimated more accurately.
Or they may be fln_ced by taxes.
5. ForeiyJqloans fbr industr_rshould be _anted at competitive
rates. An inflow of capital .increasesf_md supply and will tend to
lower the domestic rate. _he Central Ba_k is to be permitted to earn
profits in managing external sources of furlds.
6. GSIS and other employee savings placed in government acencies
should earn competitive Field, or at least the rate on !ong-term bank
deposits. In this w_y, the GSIS and other aKencies _%I1 be forced to
invest the funds in profitable enterprises. This holds true for the
P,._._-ibigftunds.
_ch _as left out in this study. It seems that we barely
scratched the s_mfaee of the issues that imoinFe on the efficient
functioning of the financial market. _%_ereis a need to understsnd
more fully corporate financial decision s_ndthe saving and portfo!io
behavior cfthe non-modern sectors -.- low income Froups, the agri-
cultural sector which faces _reat income uncertainty and the unlncor-
norated service and industrial sectors. How do they relate to this
imperfect financial market, l,_t is their demand function for financial
assets and for sources of credit?

186
It is to be noted that this Daper is written at the time of
transition from the regime of re[_lated rates and specialized role
assigned to intermediaries to a regime of liberalized interest rate and
intermediary portfolio. Later works will be able to compare the out-
comes of the two re_imes.

49 _ 4 _:__I _:.,S
i. Burkner, Hans-Paul_ "Savings B__havior_fi Savings Hobilization inDevelop/_lgCounlries: A Comparative 7m_alysisof -thePhilippinesand Thailand," __h.D.dissertation submitted to tl_Un/versity ofOx±brd, 1980.
2. Cl_mente, Irma P._ "A Study of the MorleyF_n-ket in the _ilippines ,"-thesissuk_nit-tedto the University ofthe Philippines Pro$ramin Develo_nent Economics, 1975.
_ . " Journal3. Cootner_ Paul, "Returns to Specul_tors_ _e!ser vs. l_ynes_of Political Econ_ly, _8_ 1960.
4. [_herty_ John F._ S. J. _ A Prel/n/nary S Fady of Interlo_kinz D/z_c-rotate. No plb]ishing inf'o_tion, p'ublisb_:l:c.a.=i979.
5. Fama_ Eugene F._ "Risk_ Return, and Equi!ibrium: Some.Clarifying._" ._Cenment,;'Jou_nal of _inance_ Harsh .1,968
6, _ "__e Be_vior of Stock Market Prices," Journalof Busines_ January 1965.
7. Gurley_ Jo_n G. _d Edward S. $haw_ "Financial ir';te_m_edi_iesandthe Sav/mg-Znvestmer_tProeess_" Journal of Fire,nee, Vol. If,Hay 1956.
8. GolJ_ith, i%a_,_ondW. _ Financial Institutions, New York_ R_mdomHouse, _68.
9. Hooley, Rid%ard W. _ and Honorata Moz_m_o_ "A $-cudyof Firmm_cialFlows in the Philipp//_es_" Unive?sfty of the _mhil/ppinesInstitmte of Eeonc_mic_Dee_elov_ntand Research (IEDR),QuezonCity.
I0. Kendall, l_urice G°, "The Analysis of Ee_nc_de T_e Series, PartI: }_ices," Jou_2nalof Royal Statistical Societv_ 1953.
ii. _-l'lorld Bank Mission Repox< _ Aspects of the PhiliplDineFirmncialSystem, draft, 1970.
12. Lintner, Jo]m-_,:"D_eValuation of }tis_yAssets and the Selection ofP_i_<yInvestments in Stock Portfolios 6_d Capital Budgets,"Review of Econcmies and Statistics, February 1965.

r_rices__,zskano _mxlme_lGainsfrom Dzversification of Investments_" Jourrml of Finance,De.eerier :1.965,
14, Mcl(/_mon,Ronald I., Mon_y and CaDital J_]Economic Develom_ent.Br_o,<ingsInstltutlc_ Wash_n_TtonD.C. _ 1973.
15. Mamkowitz, }brry_ Portfolio Selection: Efficient Diversificationof I_ves_ents, New York, John Wiley ,rodSons, Inc., 1959.
16. Pier,onH. }iillerand Myron Seholes, "Rates of Return in Relationto Risk: A Re-examination of Some Recent F/_idings,"S%_dies in the Theory of Capital Harket _ M. Hensen (ed.),New York, _aeger, 1972.
17. Modigliani, }_anco and Mer_on H. Miller._ "The Cost of Capit_ml,Corporate Finance toldthe l_eomy of Inves_m_t," AmericanEconomic Review, June 1958.
18. Ibssin, Jan_ "Equil/brim_l7'-aCapital Asset Market," Econometrica,34_ October 1986.
19. Santuelson_Paul A. _ "Proof that Properly &ntic/pated PricesFluJtuate Randomly _" Investment Portfolio Decision-Making_M. Jmnes L. Bicksler and Paul A. Samuelson (eds.),Le_ington_ _iassaehusetts_D.C. }.{eat]%and Co. _ 1976.
20. TcfDin,James, "Cr_'mtercialEanks as Cl-.eatorsof 'Honey'_"and:_{onetamyr tudigs, Dea[me _r_on (ed.)_ Hcmewood IliinoisPich_d D. Irwin_ Inc. _ .1963.
21. _ "1]_e_eorg."of Portfolio Selection/' the1_eory of Interest_ F.H. Harm and F.P.R. Bz_chling_--_ds.),New York_ St. _tJnPress_ 1966.
22. Sl_rpe, Willi_n P. _ "Capital Asset ]_rices,A 'Fneoz_yof _3rketEquilibrit_nUnder Conditions of Risk," Journal of FinanceSept_#e_, 1964.
23. Ph:ilippatos_George C. _ Fina-_eial]4m_agementTheory and Tedm/ques,San _,ancisc_ Pbld_m Day_ Inc. 1973.
....... .L_-¢_,:,_,-T;-._,,_,-_,rid-_.,-,ortz.'_-m__' McQraw-iLill_.,,..,,,,,,_.'-',-_...','.-_=-v',[_7 .....

Major Sou_ces of Data
I. Central Bank of the Philippines_ f%_iLippineFir_ncial Statistics
2, National Economic and Development AuI:hority(N_) Statistie_ilYearbook
3. 'D:_eNati_d C_msus and S±atistics Office_ 1974-76 Flow of Funds.
4. Hooley-Moreno Flow of _Funds_see alive.
5. PIoreno-Vasquez5hlrveyof Fir_ncial Si-_ucture_see above.
6. Z_Jel_im_ilaS_ock Exchar_e Monthly Review.
7. Compute? File of money mar,kettmansactions from an institution whichwe c_not id__tify for now.