phillystat quarterly ops meeting - philadelphia€¦ · phillystat quarterly ops meeting ......
TRANSCRIPT

PhillyStat Quarterly Ops Meeting
Office of Human Resources
February 20th, 2013

About PhillyStat
• PhillyStat is the City of Philadelphia’s performance management program, led by the Managing
Director and the Finance Director. During PhillyStat meetings, the Mayor or a Core Team
member reviews progress towards the Mayor’s strategic goals and individual departmental
performance. There are two types of PhillyStat meetings: Ops and Outcomes. This
presentation is for a PhillyStat Ops meeting.
• At PhillyStat Ops meetings, a single department reviews their operations with a member of the
Mayor’s Cabinet. Performance is reviewed in five areas: departmental operations, customer
service, finances, technology and human resources. These meetings are held quarterly.
Structure of Presentation
• The presentation begins with the department’s core mission and a logic model, both which are
useful for readers who are not as knowledgeable about what the department does.
• Each of the five sections (Operations, Customer Service, Finance, Technology, and People)
have a summary dashboard of key performance measures and explanatory measures.
• Explanatory measures help explain movement in performance measures. For example, the
number of employees and number of vehicles managed by the Office of Fleet Management
impact the Office’s operational performance measures.
• The presentation ends with brief explanations of the department’s key challenges and wins for
the quarter, and recognizes an employee of the quarter.
Introduction
2 Fiscal Year 2013 Quarter 2 Office of Human Resources

Core Mission
The core mission of the Office of Human
Resources is to administer the civil service
in a manner that allows departments to
effectively attract, select and retain a
qualified, diverse, and effective workforce
that supports the goals of the City.
- Office of Human Resources
3
Core Mission
Fiscal Year 2013 Quarter 2 Office of Human Resources

4
Logic Model A logic model is a representation of how an activity (such as a service, project, program, or policy) is
intended to produce particular results, also known as outcomes. They also help identify key operations
measures.
Inputs Services Outputs Outcomes
• OHR employees
• Services, supplies, and materials
• Information Technology Solutions
• Civil Service Regulations
• Philadelphia Home Rule Charter
• Various Collective Bargaining
Agreements and Act 111 Awards
• Local, State, and Federal
employment laws
• Designing job specifications and
requirements and setting
compensation
• Creating Eligible lists for
departments to use in hiring
process
• Referring candidates to
departments for interview in the
order prescribed by the Charter
• Auditing all personnel
transactions for compliance with
Civil Service regulations
• Providing shared HR services for
9 departments
• Equal Employment Opportunity
Compliance
• Benefits Strategy and
Administration
• Employee Health Management
• Interpreting and advising
departments on applicable
employment and labor laws,
Charter requirements and Civil
Service regulations
• Job specifications and
compensation are defined
• List of qualified candidates are
available from which departments can
select
• Eligible candidates are referred to
departments for interview in the
appropriate order
• Personnel transactions comply with
Civil Service regulations
• Transactions for Shared Service
agencies are processed timely
• Accommodations for disabilities in
Civil Service testing and employment
are provided
• Complaints of illegal discrimination
or harassment are investigated
• Employees in the City Administered
benefit group are enrolled in health
plans
• Departments are able to
effectively attract, select and
retain a qualified, diverse, and
effective workforce that supports
the goals of the City
Resources used in providing
services
Services provided What the services produce The goal of providing the
services
Finance,
Technology,
People
Operations Operations & Customer Service
Where You’ll Find Measures for Each part of the Logic Model
Fiscal Year 2013 Quarter 2 Office of Human Resources
Strategic Direction
5
Strategic Direction
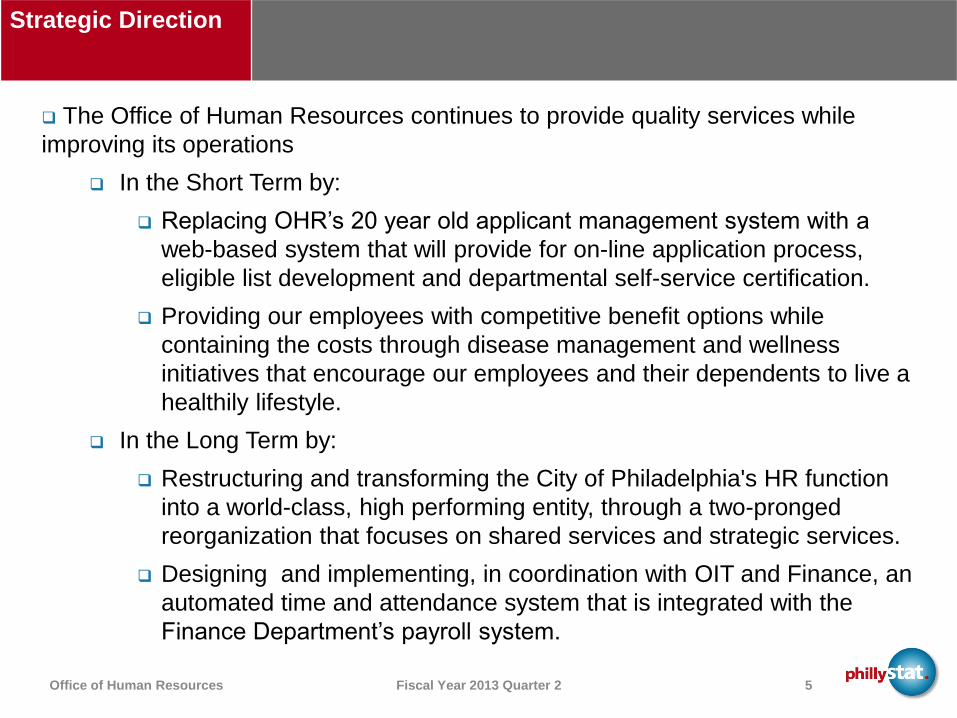
The Office of Human Resources continues to provide quality services while
improving its operations
In the Short Term by:
Replacing OHR’s 20 year old applicant management system with a
web-based system that will provide for on-line application process,
eligible list development and departmental self-service certification.
Providing our employees with competitive benefit options while
containing the costs through disease management and wellness
initiatives that encourage our employees and their dependents to live a
healthily lifestyle.
In the Long Term by:
Restructuring and transforming the City of Philadelphia's HR function
into a world-class, high performing entity, through a two-pronged
reorganization that focuses on shared services and strategic services.
Designing and implementing, in coordination with OIT and Finance, an
automated time and attendance system that is integrated with the
Finance Department’s payroll system.
Fiscal Year 2013 Quarter 2 Office of Human Resources

Executive Summary
Technology is a major component to the future success of the Office. Implementation of a system to replace our 20 year old test management system is steadily progressing, but has stumbled a bit. We experienced an unexpected but significant vendor outage in the First Quarter of FY 13, highlighting our vulnerability to external, uncontrollable conditions. The test administration and scoring modules are almost fully operational and we are working on certification.
The Average Number of Days to Establish an Eligible list was 64 days in Quarter 2 - below our FY 12 100 day target and significantly below our FY 11 average of 160 days. This metric continues to trend downward.
We continued to exceed our goal of administering exams during the week announced in the official job announcements through all 4 quarters of FY 12. We hit our target 87% of the time in the 2nd Quarter of FY13.
Eligible lists were established on the agreed upon date 80% of the time in the 2nd Quarter of FY 13.
OHR’s Shared/Strategic Services Pilot Project continues to out perform the operating departments HR Units in percentage of transactions completed correctly the first time and percentage of civil service employees with current performance evaluations. In addition, on July 1st, the Shared Services Division took responsibility OIT’s HR transactional work, including the payroll responsibilities for 330 employees. The transition was seamless. We did discover the several OIT employees were paid incorrectly prior to our assumption of responsibility and promptly corrected those errors.
We’ve added a new metric last quarter – tracking probationary rejections and resignations. This data shows that over 97% of our appointments are successful
In the 2nd Quarter, the Benefits Division completed Open Enrollment and implemented a last-minute change to provide a low-income flex credit subsidy to those employees earning $35,000 or less.
6
Executive Summary
Fiscal Year 2013 Quarter 2 Office of Human Resources
Key Wins – (Q1)
7
Key Wins
Fiscal Year 2013 Quarter 2 Office of Human Resources
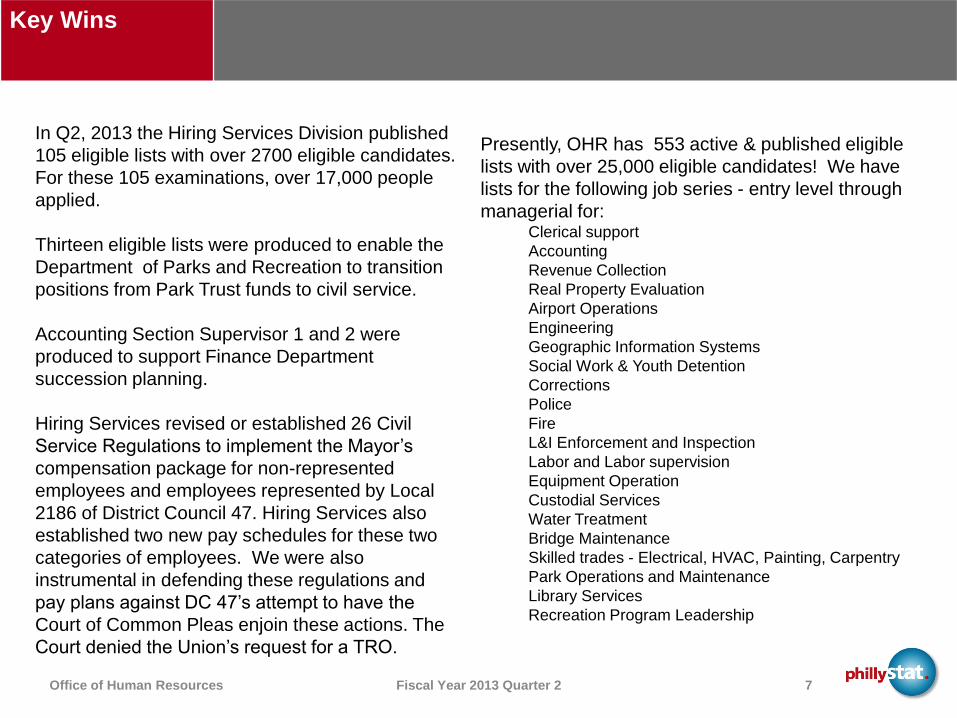
In Q2, 2013 the Hiring Services Division published
105 eligible lists with over 2700 eligible candidates.
For these 105 examinations, over 17,000 people
applied.
Thirteen eligible lists were produced to enable the
Department of Parks and Recreation to transition
positions from Park Trust funds to civil service.
Accounting Section Supervisor 1 and 2 were
produced to support Finance Department
succession planning.
Hiring Services revised or established 26 Civil
Service Regulations to implement the Mayor’s
compensation package for non-represented
employees and employees represented by Local
2186 of District Council 47. Hiring Services also
established two new pay schedules for these two
categories of employees. We were also
instrumental in defending these regulations and
pay plans against DC 47’s attempt to have the
Court of Common Pleas enjoin these actions. The
Court denied the Union’s request for a TRO.
Presently, OHR has 553 active & published eligible
lists with over 25,000 eligible candidates! We have
lists for the following job series - entry level through
managerial for: Clerical support
Accounting
Revenue Collection
Real Property Evaluation
Airport Operations
Engineering
Geographic Information Systems
Social Work & Youth Detention
Corrections
Police
Fire
L&I Enforcement and Inspection
Labor and Labor supervision
Equipment Operation
Custodial Services
Water Treatment
Bridge Maintenance
Skilled trades - Electrical, HVAC, Painting, Carpentry
Park Operations and Maintenance
Library Services
Recreation Program Leadership
Key Wins – (Q1)
8
Key Wins
continued
Fiscal Year 2013 Quarter 2 Office of Human Resources
We continue to vastly exceed our FY 13 annual Heath management target, with
over 73% of City employees participating in the program and over 40% meeting the
incentive requirements.
We had a successful 2013 open enrollment season - a year with cost and plan
changes - with 70% of all the eligible employees making an active benefit election.
We also had a seamless implementation of the dental insurance program to a self
insured model in Q2 for an effective date of January 1, 2013.
Finally, we were able to successfully implement a last-minute change to provide a
low-income flex credit subsidy to those employees earning $35,000 or less.

Key Challenges (Q1)
9
Key Challenges
Fiscal Year 2013 Quarter 2 Office of Human Resources
Staffing issues – Attrition, hiring freezes and recruitment of experienced OHR staff by operating
departments creates staff shortages that impact OHR’s ability to meet the needs of our client departments.
We are losing a key HR Manager and a Hiring Services HR Professional to other departments this quarter
and our IT Director is dropping this year.
Technology
Key software tools (e.g., Human Resource Information Systems) not fully supported pending
Administrative Modernization of Systems. In addition, departments are careless in maintaining
and correcting data in ORACLE. While the City’s HRIS has experienced fewer outages during
normal business hours, PeopleAdmin continues to be problematic.
Lack of a Benefits Claim Tool Software to assist in the analysis of self insured medical claims to
determine accuracy in payment and detection of errors.
Time and attendance automation continues to be on hold.
No auto archive or electronic records management in Lotus Notes.
Decentralized HR Function
OHR must compete with departmental HR offices for needed resources. The majority of HR staff are
employed by operating departments and have no reporting relationship to the central agency.
Operations Customer Service Finance Technology People
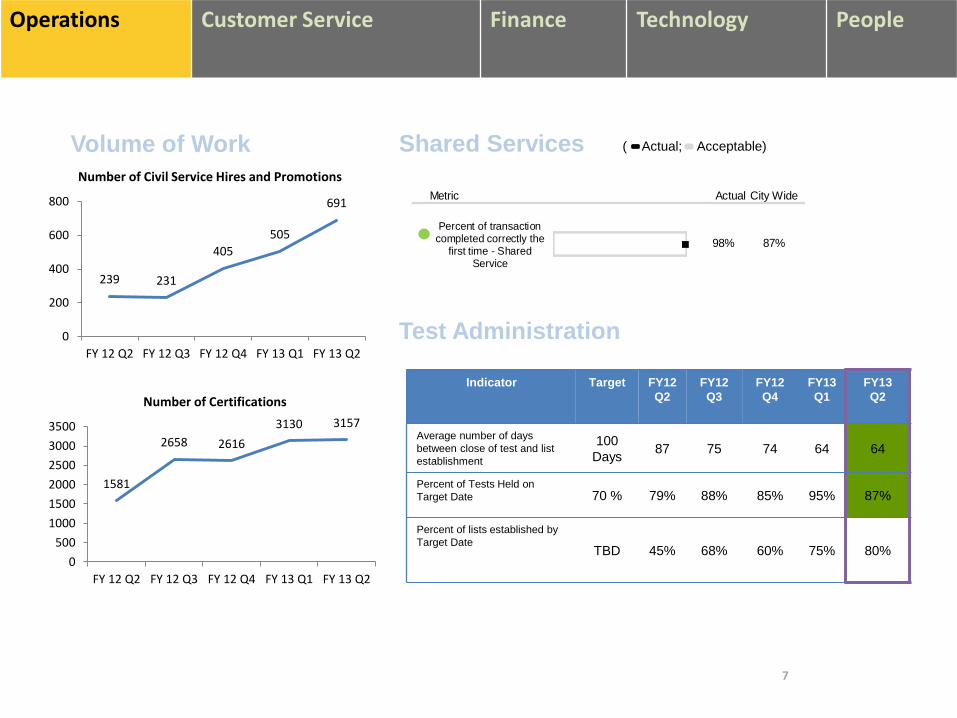
Volume of Work Shared Services
Metric Actual City Wide
98% 87%
Percent of transactioncompleted correctly the
first time - SharedService
Test Administration
( Actual; Acceptable)
7
Indicator Target FY12
Q2
FY12
Q3
FY12
Q4
FY13
Q1
FY13
Q2
Average number of days
between close of test and list
establishment
100
Days 87 75 74 64 64
Percent of Tests Held on
Target Date 70 % 79% 88% 85% 95% 87%
Percent of lists established by
Target Date TBD 45% 68% 60% 75% 80%
239 231
405
505
691
0
200
400
600
800
FY 12 Q2 FY 12 Q3 FY 12 Q4 FY 13 Q1 FY 13 Q2
Number of Civil Service Hires and Promotions
1581
2658 2616
3130 3157
0
500
1000
1500
2000
2500
3000
3500
FY 12 Q2 FY 12 Q3 FY 12 Q4 FY 13 Q1 FY 13 Q2
Number of Certifications

11
Logic Model
Service Indicator Annual
Target
FY12 Q2
FY12 Q3
FY12 Q4
FY13 Q1
FY13 Q2
Output Health mgmt. Total number of City
employees participating in at
least one health mgmt activity
in 2012
n/a n/a n/a n/a n/a 73.8%
Output Health mgmt. Percent of employees who
fulfilled incentive requirements
25% 61.0% 65.8% 66.8% 41.6% 40.7%
Outcome Benefits
Strategy and
Administration
Total health benefits spend $76.4
Million
$18.8
Million
$21.1
Million
$20.0
Million
$18.7
Million
$20.3
Million
Outcome Number of Enrolled Benefits
Members
N/A 6,428 6,357 6,321 6,211 6,175
1.2 Operations Dashboard - Benefits
Source: Office of Human Resources
Note: 1. Health Benefits spending is inclusive of medical, prescription drug, dental and vision coverage. 2. The spending figures represented are NET of employee contributions and COBRA premium payments.
Previous Quarters Current
Quarter
Operations Customer Service Finance Technology People
Fiscal Year 2013 Quarter 2 Office of Human Resources

12
Operations Customer Service Finance Technology People
Fiscal Year 2013 Quarter 2 Office of Human Resources
City of Philadelphia
Health Management Program (CY 2012)
Spring Initiatives Total
2,228Spring and Fall
2,177
HRA and Biometric levels
Fall - 3,946
Flex Fitness Log
Spring - 256
Registered Dietician Visits
Spring - 1,202
Healthy Steps
Spring - 770
CAP Total
5,350
40.7%
73.8%
41.6%
4.8%
22.5%
14.4%

`
13
Operations Customer Service Finance Technology People
Fit of Hire (Fiscal Year 2013)
Average Performance Ratings All civil service employees w/ Current Evaluations (City-Wide)
Rejection and Quit Rate (City-Wide)
# Employees
7593
2488
743
Unsatisfactory Evaluations within 2 Years (City-Wide)
Observations:
- DC 33, DC 47 and Non-Rep. heavily
skewed towards positive ratings
- Rejection rate and quit rate are
maintained at lower levels even
though total # hired increased
Fiscal Year 2013 Quarter 2 Office of Human Resources
( Actual)
*Performance Rating Description:
DC 33: (1.0 = Unsatisfactory, 3.0 = Satisfactory). The highest rating a DC
33 employee can receive is Satisfactory
DC 47 & Non-Rep : (1.0 = Unsatisfactory, 2.0 = Improvement Needed,
3.0 = Satisfactory, 4.0 = Superior, 5.0 = Outstanding) ** Total Hired: # of total civil service hired in a six month period, ending with the last day of the current quarter
1% 0% 1% 0%
1%
2%
3%
4%
5%
6%
7%
8%
9%
10%
0
200
400
600
800
1000
1200
1400
1600
DC 33 DC 47 Non Rep
# of Employees % Unsatisfactory Rating
0.00 1.00 2.00 3.00 4.00 5.00
*Non-Rep
*DC 47
*DC 33

Logic
Model
Service Indicator Annual
Target
FY12
Q2
FY12
Q3
FY12
Q4
FY13
Q1
FY13
Q2
Outcome Hiring
Process
Hiring process survey - overall
satisfaction
4.50 3.97 3.84 4.09 3.79 3.70
New Hires New hire survey – overall satisfaction * N/A 3.33 3.18 3.56 4.05
Customer Service Operations Customer Service Finance Technology People
2.1 Customer Service Dashboard
14
Source: Office of Human Resources, Philly 311
Note: 1. Hiring Process Annual Target is out of 5.0; New Hire Survey Annual target is now out of 5.0, changed from 4.0
*Previously, the New Hire survey target was 3.50, but now that the New Hire survey is on a 5.0 scale, the annual target
must be adjusted
Previous Quarters Current
Quarter
Fiscal Year 2013 Quarter 2 Office of Human Resources

Finance - Dashboard
15
Operations Customer Service Finance Technology People
Legend % Diff. from YTD Projection
0% and above
-1% to -3%
-4% and below
Fiscal Year 2013, Quarter 2
October 2012 to December 2012
Previous Fiscal Year 2012, Quarter 2
October 2011 to December 2011
3.1 General Fund
FY13 Q2
YTD
Current
Target
Budget
FY13 Q2
YTD
Obligation
Target
Budget
minus
Projected
Obligation
%
Difference
3.1 General
Fund
FY12 Q2
YTD
Target
Budget
FY12 Q2
YTD
Obligation
Target
Budget
minus
Projected
Obligation
%
Difference
Total General Fund $2,652,855 $2,526,329 $126,526 5%
Total
General
Fund
$2,561,820 $2,498,746 $63,074 2%
Class 100 $2,064,286 $2,099,936 ($35,650) -2% Class 100 $1,993,250 $1,960,721 $32,529 2%
Class 200 $560,682 $401,323 $159,359 28% Class 200 $547,413 $521,406 $26,007 5%
Class 300 $27,887 $25,070 $2,817 10% Class 300 $21,157 $16,619 $4,538 21%
Class 400 $0 $0 $0 N/A Class 400 $0 $0 $0 N/A
Overtime $16,275 $15,977 $298 2% Overtime $33,114 $29,853 $3,261 10%
3.1 Budget Dashboard
Fiscal Year 2013 Quarter 2 Office of Human Resources
Source: 10th of the Month Report, as of 1/10/2013

Technology
16
Operations Customer Service Finance Technology People
Project Name Description FY13 Q1 FY13 Q2 FY13 Q3 FY13 Q4 Target
Delivery
Date
People
Admin
Web-based recruitment,
test scoring & list mgmt
tool.
Implement-
ation in
progress
OHR is awaiting
receipt of the final
Business
Requirements
Document for online
certification, which
will then be
implemented
End of FY
2013.
Admin
Modernization
City-wide solution for
workforce management,
managed by Finance,
but OHR is key project
partner.
Planning
vendor
selected
Project Manager.
Assessment in
progress.
Solution/RFP being
strategized.

Operations Customer Service Finance Technology People
13
5.2 Staff Performance
The following metric shows if the department is current with performance evaluation, which are important
documents for staff growth and development.
Target FY13 Q2 FY12 Q2
Percent of Employees with Current Performance Evaluations 80% 96% 93%
DC 33
100%
0%
0%
50%
100%
Sat
isfa
ctor
y
Unsa
tisfa
ctory
DC 47
50% 50%0%
0%
50%
100%
Out
stan
ding
Sup
erior
Sat
isfa
ctor
y
Fiscal Year 2013 Quarter 2 Office of Human Resources
5.1 Staff Availability
The following set of metrics provide information on the availability of staff to perform the work of the department.
Performance Rating Distribution
(Percent of evaluations by category for full-time union and non-representative civil service employees w/ current evaluations)
82 82 82 85 84
7%
5%
3%
6%
4%
0
30
60
90
0%
1%
2%
3%
4%
5%
6%
7%
8%
FY 12 Q2 FY 12 Q3 FY 12 Q4 FY 13 Q1 FY 13 Q2
Number of Budgeted Positions Percent of Positions Vacant
Position Vacancy
FY 13 Q2 FY 12 Q2
% Employees Retirement Eligible
14.8% 15.7%
% Employees in DROP 9.8% 10.5%
% Employees Retirement Eligible Not in DROP
5.0% 5.2%
DROP
(30 Emp.) (4 Emp.) (42 Emp.)

18
Employee of the
Quarter Brian Albert
Source: Office of Human Resources
On October 1, 2012, the Mayor lifted the 2009 freeze on employee annual pay step
increases, or “increments”, for non-represented and Local 2186 – represented employees.
The Mayor also directed that these employees be placed on the pay step where they would
have been on October 1, 2012 if the freeze had never been implemented.
OHR was asked to analyze the cost of this decision and to determine an implementation
plan to make it happen. The analysis was not simple, since the results were impacted by
performance reports and promotions that occurred during the intervening years. Brian
Albert used his deep knowledge of the civil service regulations and his top notch skills with
data analysis and various software tools to analyze the cost and ultimately create a data file
that was used to update both the Oracle Human Resource Information System and the
Payroll System. Without his knowledge and skill, this task would have cost countless hours
of staff time throughout the City to perform the same analysis and implement the changes
one-by-one through individual employment transactions.
OHR is grateful for Brian’s skills and his unending dedication and is pleased to nominate
him for Employee of the Quarter.
Brian, we appreciate the excellent job you do, every day. Thank you.
Fiscal Year 2013 Quarter 2 Office of Human Resources

Core Mission
The core mission of the Office of Human
Resources is to administer the civil service
in a manner that allows departments to
effectively attract, select and retain a
qualified, diverse, and effective workforce
that supports the goals of the City.
- Office of Human Resources
19
Core Mission
Fiscal Year 2013 Quarter 2 Office of Human Resources

Contact Us!
For more information about PhillyStat:
• Check us out on Facebook at
www.facebook.com/phillystat
• Follow us on Twitter @PhillyStat
• Find us online at www.phila.gov/phillystat
• Email us at [email protected]
Contact Us!
20 Fiscal Year 2013 Quarter 2 Office of Human Resources

Strategic Direction
21
Appendix
1The Shared Service Pilot began in July 2010 with eight departments: OHR, Procurement, Public Property, Records ,Office
of the Managing Director, Fleet, Civil Service Commission and Mural Arts. In July 2012 the Office of Innovation and
Technology was added to the Shared Services program (for payroll and transactions only). Starting in FY12 Q1,
performance appraisals were excluded to show operations related transactions only.
2 In order to hire for a vacancy, OHR must certify the top 2 candidates standing on an eligible list to the appointing
authority. This measure shows data from only one source as the office is transitioning between two systems (from SIGMA to
PeopleAdmin)
3‘Metric ‘Percent of lists established by target date’ on the previous slide, note: A new online application/test scoring
system was implemented in FY11. Installation problems resulted in backlog and delay in establishing lists requested in the
current quarter, as reflected in FY12 Q1. Improvement can be seen in subsequent quarters as these issues became
resolved. This metric is a lagging indicator as lists are accounted for in the fiscal year they were established, which may be
different from the year a department makes a request.
4In Civil Service, candidates can not be hired for open positions unless a list has been established. This metric is a lagging
indicator as it is accounted for in the fiscal year the exam was held, which may not be the year the department request was
made.
Fiscal Year 2013 Quarter 2 Office of Human Resources