phone: 859-744-6171 fax: 859-744-3623 - kentucky cases/2017-00111/20170228_delta...balan
TRANSCRIPT
DELTA NATURAL GAS COMPANY, INC.
3617 Lexington Road Winches ter, Kentucky 40391 -9797
Mr. Talina Mathews Executive Director Kentucky Public Service Commission P. 0. Box 615 Frankfort, K Y 40602-0615
Dear Ms. Mathews:
www.deltagas.com
PHONE: 859-744-61 71
FAX: 859-744-3623
February 27, 2017
DGAS NA.aaq LI8T~D
RECEIVED
FEB 2 8 2017
PUBLIC SERVICE COMMISSION
Enclosed are the original and ten copies of Delta ' s Annual Pipe Replacement Program rate filing which determines the Pipe Replacement Program Rate to be effective May 1, 20 17.
An extra copy of the filing is attached for public files.
Please acknowledge receipt of this filing by stamping the extra copy of the cover letter and returning to Delta in the envelope provided.
Sincerely,
9~ ~~ Jenny Lowery Croft Manager - Employee & Regulatory Services
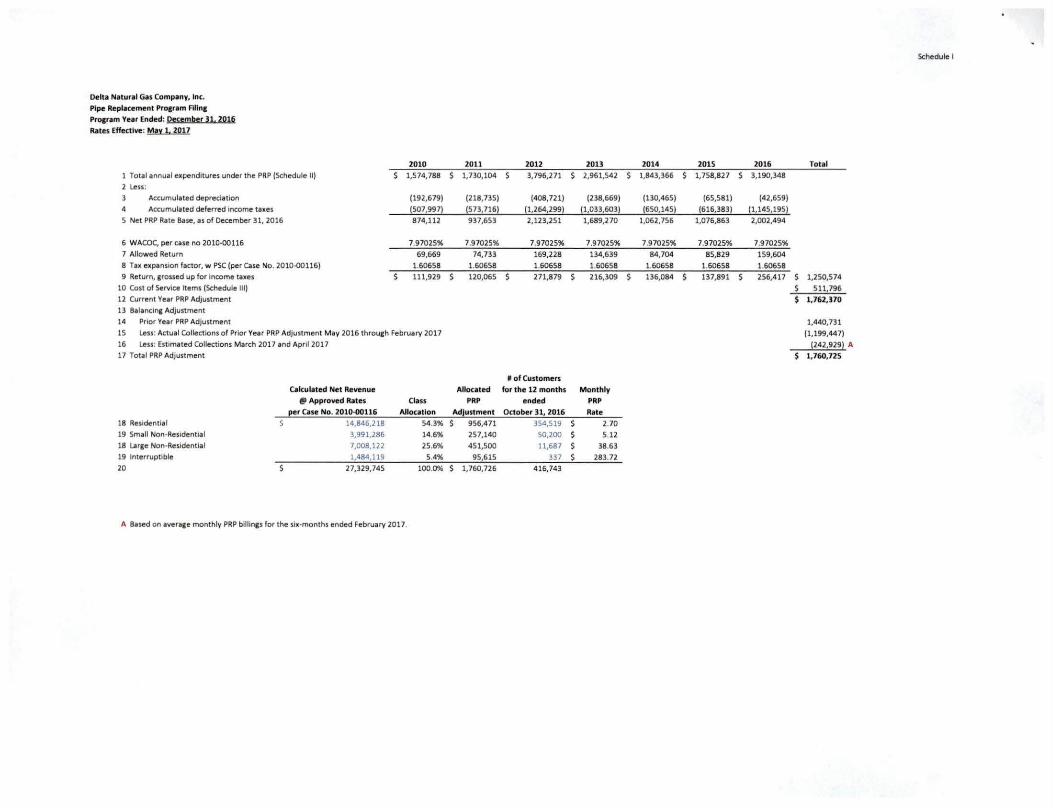
Delta Natural Gas Company, Inc. Pipe Replacement Procram Alln1 Procram Yeor Ended: December 31. 2016 Rates Effective: Mn 1. 2017
1 Total annual expenditures under the PRP (Schedule II)
2 Less: Accumulated depreciation
4 Accumulated deferred 1ncome taxes 5 Net PRP Rate Base, as of Oecember 31, 2016
6 WACDC, per case no 201~116
7 Allowed Return 8 Tax expanSion factor, w PSC (pe r Case No . 2010-Q0116) 9 Return, arossed up for Income taxes
10 Cost of Service Items (Schedule Ill) 12 Current Yeor PRP Adjustment 13 Balan<~nc Adjustment 14 Prior Year PRP Adjustment
2010 1,574,788
(192,679) (507,997) 874,112
7.97025" 69,669
1.60658 111,929
15 Less: Actual Collections of Prior Yea r PRPAdjustment May 2016 through February 2017 16 Less: Est1mated Collections March 2017 and Aprll2017
17 Total PRP AdJUStment
Calculated Net Revenue @ Approved Rates Class
~er Case No. 201Q-00116 Allocation 18 Residentlol 14,846,218 54.3" 19 Smoll Non-ReSidential 3,991,286 14.6" 18 Loree Non-Residential 7,008,122 25.6" 19 Interruptible 1,484,119 5.4" 20 27,329,745 100.0%
A Based on avera11e monthly PRP billings for the six-months ended February 2017.
2011 1,730,104
(218,735) (573,716) 937,653
7.97025" 74,733
1.60658 120,065
Allocated PRP
Adjustment
s 956,471 257,140 451,500
95,615 1,760,726
Schedule I
2012 2013 2014 2015 2016 Total 3,796,271 2,961,542 1,843,366 1,758,827 3,190,348
(408,721) (238,669) (130,465) (65,581) (42,659) (1,264,299) (1,033,603) (650,145) (616,383) (1,145, 195) 2,123,251 1,689,270 1,062,756 1,076,863 2,002,494
7.97025" 7.97025" 7.97025" 7.97025" 7.97025" 169,228 134,639 84,704 85,829 159,604 1.60658 1.60658 1.60658 1.60658 1.60658 271,879 216,309 136,084 137,891 256,417 5 1,250,574
s 511,796 $ 1,762,370
1,440,731 (1,199,447)
!242,929) A 1,760,725
I of Customers for the 12 months Monthly
ended PRP October 31, 2016 Rate
354,519 s 2.70 50,200 $ 5.12 11,687 $ 38.63
337 $ 283.72 416,743
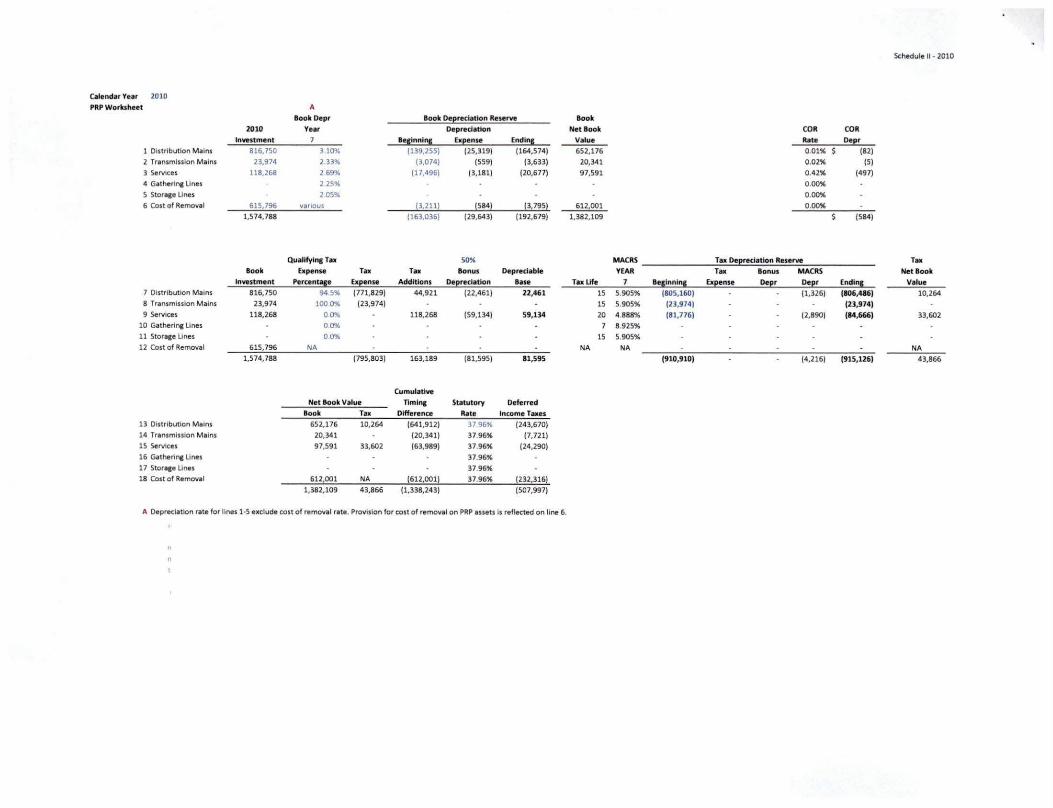
Schedule II • 2010
Calendir Ye1r 2010
PRP Worksheet A Book Depr Book Oe~reclitlon Reserve Book
2010 Year Depredation Net look COR COR
Investment 7 Beslnnl!!l bfense Endlnl Value Rote De~r
1 Distribution Mains 816,750 310% (139,255} (25,319) (164,574} 652,176 0.01" (82)
2 Transmission Mains 23,974 2 33% (3,074} (559) (3,633) 20,341 0.02" (5)
3 Services 118,268 2 69" (17,496) (3,181) (20,677) 97,591 0.42" (497}
4 Gatherlnc Unes 2 25" 0.00% S Storaae Unes 2 05% 0.00% 6 Cost of Removal 615,796 VI riO US (3,211! !584! !3.7951 612,001 0.00%
1,574,788 (163,036} (29,643} (192,679) 1,382,109 (584}
Quallfylnc Tax SO" MACRS Tax Deereclatlon Reserve Tax
Book Expense Tox Tox &onus Depredable YEAR Tax lonus MACRS Net look Investment Percent!l• bl!ense Additions De~redatlon Base Ta• Ufe 7 sealnnlnl Exe;ense De~r De~r Endlnl Value
7 Distribution Mtlns 816,750 94 5" (771,829) 44,921 (22,461) 22,461 15 5.905" (105,160) (1.326) (106,416) 10,264 8 Transmission Mains 23,974 1000% (23,974) 15 5.905" (23,974) (23,974) 9 Services ll8,268 00% 118,268 (59,134) 59,134 20 4.888% (81,776) (2,890) (14,666) 33,602
10 Gatherlnc Unes 00% 7 8.925" 11 Storage Unes 00% 15 5.905" 12 Cost of Removal 615,796 NA NA NA NA
1,574,788 (795,803) 163,189 (81,595) 81,595 (910,910) (4,216) (915,U6) 43,866
Cumulotlw
Net Book Value Tlmlnc Stotutory Deferred look Tax Difference Rote Income Taxes
13 DistributiOn M1lns 652,176 10,264 (641,912) 37 96" (243,670) 14 Transmission Mains 20,341 (20,341) 37.96" (7,721) 15 Services 97,591 33,602 (63,989) 37.96" (24,290)
16 Gatherinc Unes 37.96" 17 Storace Unes 37.96" 18 Cost of Removal 612,001 NA (612.0011 37.96" !232,316)
1,382,109 43,866 (1,338,243) (507,997)
A Oepreclatkm nne for lines 1-5 exclude cost of removal rate. Provision for cost of removal on PAP assets Is reflected on line 6.
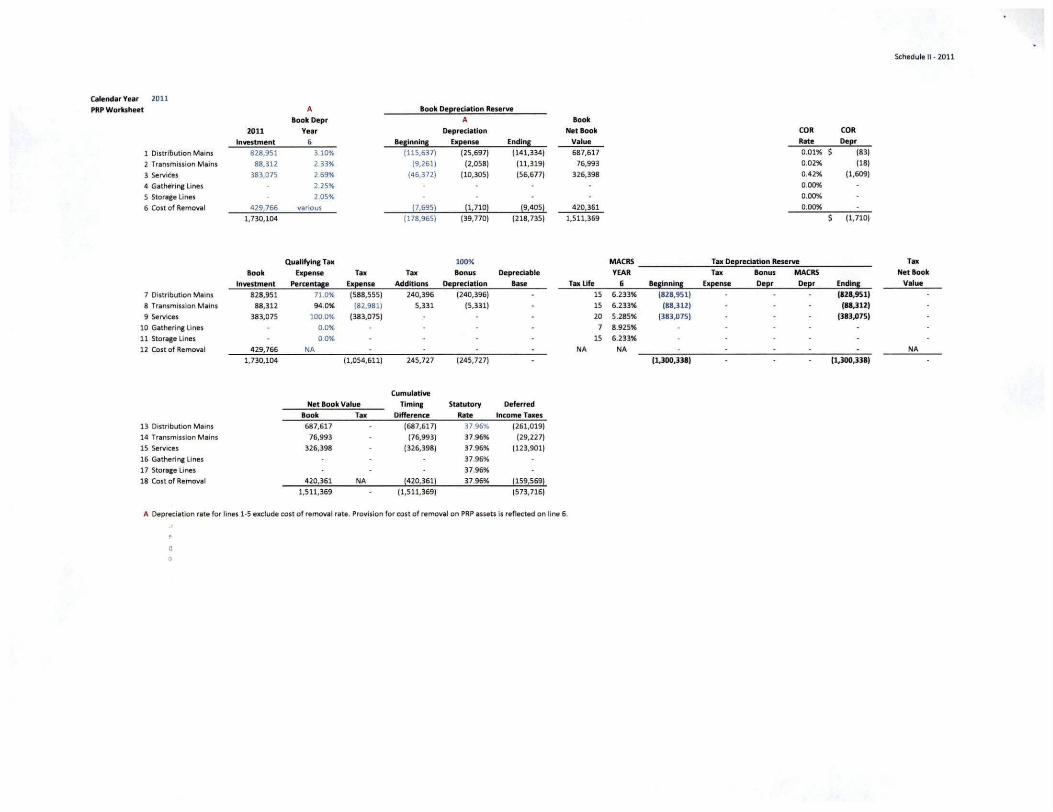
Calendar Year 2011
PRP Worksheet A look De~redation Reserve
BookDepr A Book
2011 Year Depredation Net Book
Investment 6 Be1innin1 Exeense Endlnl Value
1 Distribution Mains 828,951 3.10% (115,637) (25,697) (141,334) 687,617
2 Transmission Mains 88,312 2.33% (9,261) (2,058) (11,319) 76,993
3 Servl<es 383,075 269% (46,372) (10,305) (56,677) 326,398
4 Gatherlnc Lines 2.25%
S Stor•se lines 2.05%
6 Cost of Removal 429,766 vanow p ,695) !1.710! !9.405! 420,361
1,730,104 (178,965) (39,770) (218,735) 1,511,369
QuAiifylnc Tax 100" Book Expense Tax Tax Bonus DepreciAble
Investment Percent!le Exl!!nso Additions DoerociAtion BASe TaxUfo
7 Distribution Mains 828,951 710% (588,555) 240,396 (240,396) 15
8 Transmission Mains 88,312 94.0% (82,981) 5,331 (5,331) 15
9 Services 383,075 1000% (383,075) 20
10 Gathering Lines 00% 11 Storace Unes 00% 15
12 Cost of Removal 429,766 NA NA 1,730,104 (1,054,611) 245,727 (245,727)
Cumulative
Net Book VAlue Tlmlnc Statu tory Deferred
Book TAX Difference Rate Income Taxes
13 D•stributlon Malns 687,617 (687,617) 37 96" (261,019)
14 Transmission Mains 76,993 (76,993) 37.96% (29,227)
15 Servi<u 326,398 (326,398) 37.96% (123,901)
16 Gathering Lines 37.96"
17 Storage Lines 37.96%
18 Cost of Removal 420,361 NA (420,361) 37.96" (159,569)
1,511,369 (1,511,369) (573,716)
A Depreciation rate for lines 1·5 exclude cost of removal rate. Provision for cost of removal on PRP assets is reflected on line 6.
COR
Rate
0.01%
0.02% 0.42%
0.00% 0.00%
0.00%
MACRS Tax Deere<JAtlon Reserw
YEAR Tax &onus MACRS
6 Be(lnnlnl Ex!!!nse Deer Deer
6.233% (828,951)
6 .233% (88,312)
5.285% (383,075)
8.925" 6 .233"
NA (1,300,331)
COR
Deer (83)
(18)
(1,609)
(1,710)
Endinl
(121.951) (11,312)
(313,075)
(1,300,331)
Sthedule II • 2011
Tax
Net look
Value
NA
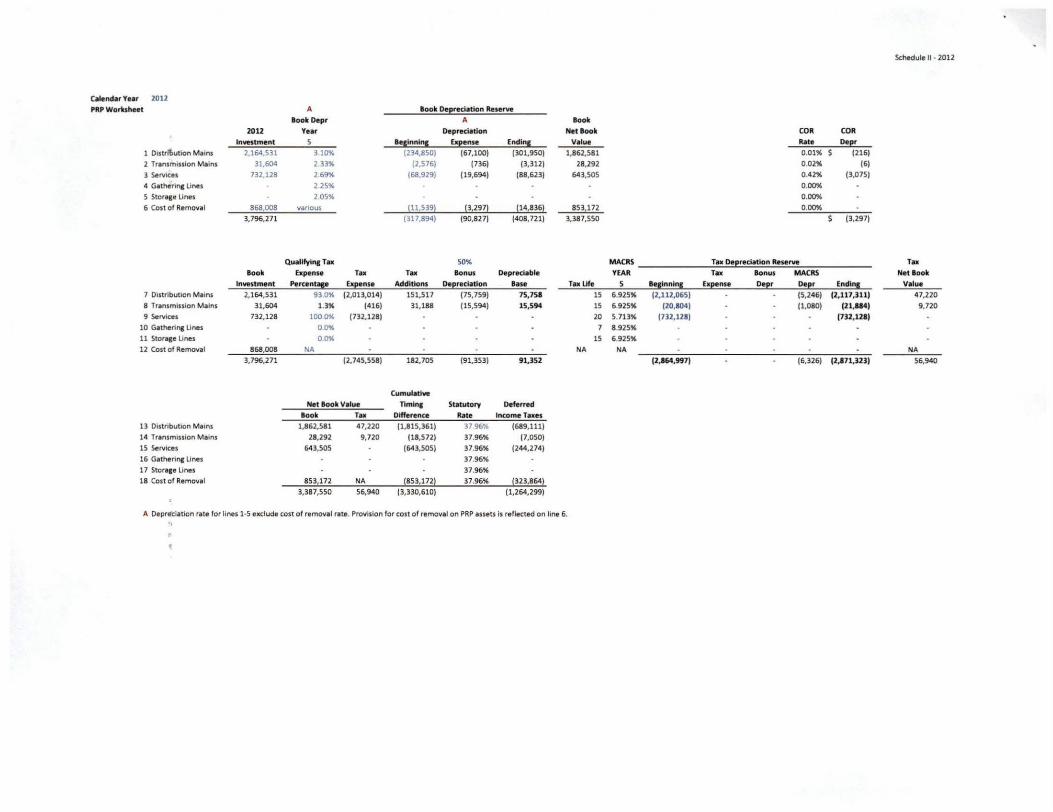
Schedule II • 2012
calendar Year 2012
PRP Worbhtet A look Defrtdatlon Reserve look Depr A look
2012 Ye1r Depredation Net look COR COR
Investment 5 aealnnl!!l Expense Endlnl Value Rate Defr 1 OistrJ!:,ution Mains 2,164,531 310% (234,850) (67,100) (301,950) 1,862,581 0.0 1% (216)
2 Transmlu lon Mains 31,604 2.33% (2,576) (736) (3,312) 28,292 0.02% (6)
3 Services 732,128 269% (68,929) (19,694) (88.623) 643,505 0.42% (3,075)
4 Gatherinc Lines 2 25% 0.00% 5 5toroae Lines 2.05% 0.00% 6 Cost of Removal 868,008 VlfiOUS !11,539) !3,297! !14,836! 853,172 0.00%
3,796,271 (317,894) (90,827) (408,721) 3,387,550 (3,297)
Qualllyln& Tu SO% MACRS Tu: De~reciation Reserve Tu look Expense Tax Tu lonus Depreciable YEAR Tu Bonus MACRS Net look
lnwstment Percent!l• Exf!n•• Additions De~redatlon lase TuUfe 5 le&lnnln& Ex2!:nse De~r Dtfr Endl!!i Value 7 Distribution M1ins 2,164,531 930% (2,013,014) 151,517 (75,759) 75,751 15 6.925% (2.112,065} (5,246) (2,117,311) 47,220 8 Transmission Mains 31,604 1 .3% (416} 31,188 (15,594) 15,594 I S 6.925% (20,104} (1.080) (21,1114) 9,720 9 Services 732,128 1000% (732,128) 20 5.713% (732,121) (732,121)
10 Gathennc Lines 00% 7 8.925% 11 Storace Une.s 00% 15 6.925% 12 Cost of Removal 868,008 NA NA NA NA
3,796,271 (2, 745,558} 182,705 (91,353} 91,352 (2,164,997} (6,326) (2,171,323} 56,940
Cumulative
Net look Volue Tlmlnc Statutory Deferred look Tu Dtfferenca Rate Income lues
13 Distribution Mains 1,862,581 47,220 (1,815,361) 37 96% (689,111) 14 Trtnsmission Mains 28,292 9,720 (18,512) 37.96% (7,050) 15 Service s 643,505 (643,505) 37.96% (244,274) 16 Gathennc Lines 37.96% 17 Stor~ce Unes 37.96% 18 Cost of Removal 853,172 NA !853,112! 37.96% !323,864!
3,387,550 56,940 (3,330,610) (1,264,299)
A Oeprttclation rate for lines 1-5 eKclude cost of removal rate. Provision for cost of removal on PRP assets Is reflected on line 6.
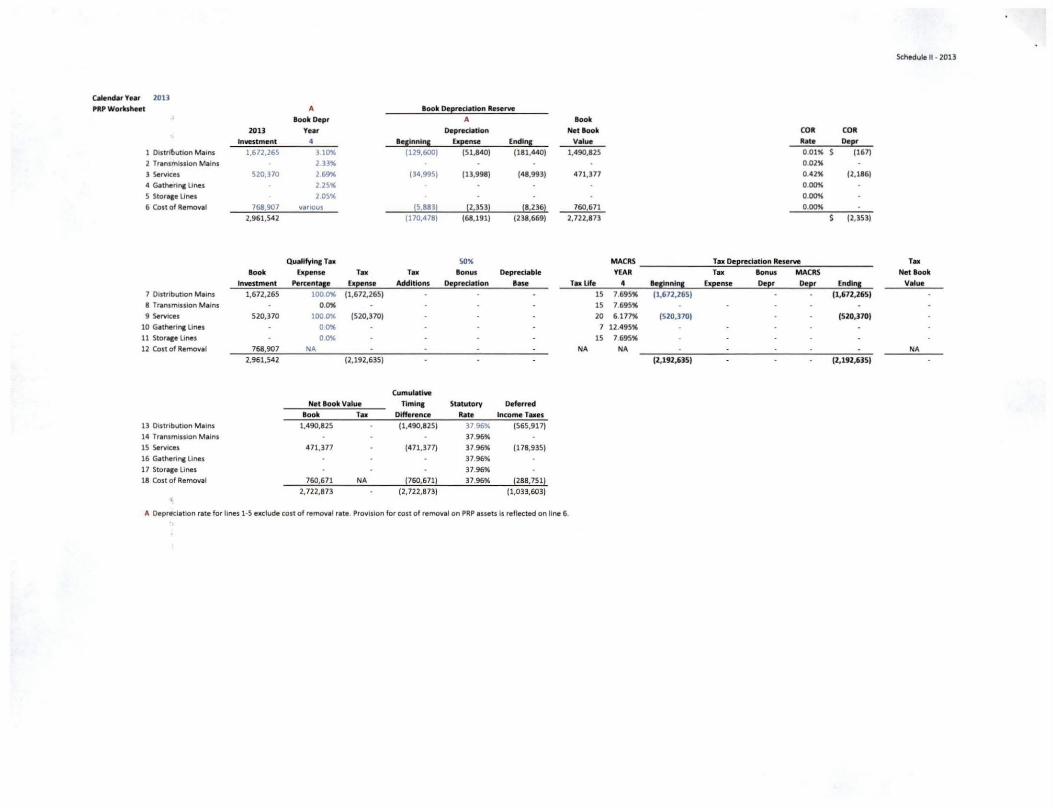
Caaend•r Ya•r 2011 PAP Worbheet A look De!!!e~tlon Reserw
lookOepr A look 2013 Ye•r Depredation Net look
Investment 4 1e1innln1 Exe:ense Endlnl Value
1 OlstrftJutk>n Ma1ns 1,672,26S 3 1""- (129,600) (SI,840) (181,440) 1,490,82S 2 TrenJmlulon Mains 2 33" 3 Services S20.370 269% (34,99S) (13,998) (48,993) 471,377 4 Gatherina u~s 2 2S" S Storaso Unos 2.0S" 6 Cost or Removol 768.907 VIllOUS jS,8831 j2,3S3) j8,236) 760,671
2,961,S42 (170,478) (68,191) (238,669) 2,722,873
Quallfylnl Tb so" Book bpense Tu Tu eon u.s Oepredable
Investment Porteni!JI Exf!!nSO Additions Dof!ro~tlon ·- TuUfo 7 Distribution M•lns 1,672,26S 100 D'K ( 1,672,265) 15 8 Transmission Malns OD'K 15 9 Services 520,370 100~ (520,370) 20
10 Gatherlna Unes O<l" 7 11 Storace Unes 0~ 15 12 Cost or Remov•l 768,907 Nil. NA
2,96l,S42 (2,192,63S)
Cumulative Not look V•lue T1mln1 Statutory Deferred
look Tax DtHerenca Rail Income Taxes 13 Distribution M• lns 1,490,82$ (1,490,825) 37 9611 (565,917) 14 Transmission Mains 37.96% IS Services 471,377 (471,377) 3796% (178,93S)
16 Gatherlna Unes 37.96" 17 Storace Unes 37.96" 18 Cost or Removal 760,671 Nil. j760,671) 37.96" j288,751)
2,722,873 (2,722,873) ( 1,033,603)
A Depr•clatlon rate for lines 1-5 exclude cost of removll rate. Provision for cost of remov1l on PRP aueu is reflected on line 6.
COli Rate
0.01" 0.02" 0 42" 000% 0.00% 0.00%
MACRS Tb Def!redatlon Resorw YEAR Tax &emus MACRS
4 1111nni!!J Exj!!nSO Oef!r Def!r 7.695" (1,672,265)
7.695" 6177% (520,370)
12.49S" 7 695"
Nil. (2,192,635)
COR
Oef!r (167)
(2,186)
(2,3S3)
Endlnl (1,672,265)
(520,)70)
(2,192,635)
Schedule II · 2013
Tax Net look v .....
NA
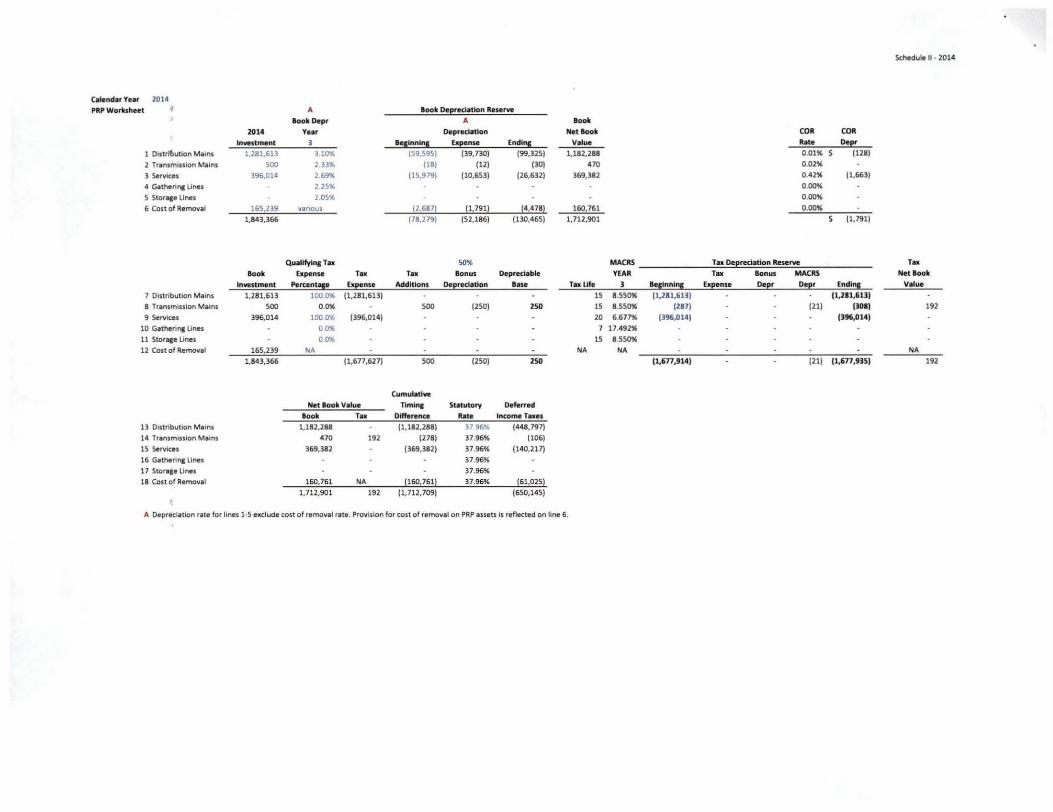
Schedule II · 2014
CMnd•rYear 2014
PIIP Worbheet A look Def!remtlon Reserw
l ook Depr A loolt
2014 Year OepreO.tion Net look CDR COR
Investment lglnnlnl ~ense Endl!!l Value RJ.te Dej!!
1 Oistrl6ution Ma1ns 1,281.613 310% (59,595) (39,730) (99,325) 1,182, 288 0.01" (128)
2 Transmiu lon Mains 500 2 33" (18) (12) (30) 470 0.02"
3 Servtces 396,014 2.69% (15,979) (10,653) (26,632) 369,382 0.42" (1,663)
4 Gatherlnc Unes 225" 0.00%
5 Stor11e Lines 2.05" 0.00%
6 Cost of Removal 165 239 vanous !2,6871 j1,791l !4,4781 160,761 0.00%
1,843,366 (78,279) (52,186) (130,465) 1,712,901 (1,791)
Qu3llfyln& T illl 50% MACRS Tilll De f!rec13tlon Re•erw Tilll
Book Expense: Tax Tax Bonus Depreciable YEAR Tilll Son us MACRS Net look
Investment Pertenl!le Exf!!n•• Addition• Dtf!rttl3tlon lue Tul!f. 3 ... lnnln1 Ex2;ense Dtf!r Dtl!r Endlnl Value
7 Distribution Mains 1,281,613 100.0% (1,28 1,613) 15 8.550% (1,281,613) (1,281,613)
8 Transmission Mains 500 0.0% 500 (250) 250 15 8 .550% (287) (21) (301) 192
9 Serv~ee• 396,014 1000% (396,014) 20 6.677" (396,014) (396,014)
10 Gotherlnc Unes 00% 7 17.492" 11 Storace Une:s 00% 15 8 .550% 12 Cost of Removal 165, 239 NA NA NA NA
1,843,366 (1,677,627) 500 (250) 250 (1,677,914) (21) (1,677,935) 192
Cumul3tlve
Net loo k Value nmlna Statutory Deferred
look Tilll Difference RJ.te Income Taxes 13 D•stnbut1on Mains 1.182,288 (1 ,182, 288) 37 96% (448,797)
14 Transmission Mains 470 192 (278) 37.96" (106)
15 Services 369,382 (369,382) 37.96" (140,217)
16 Ga therins Lines 37.96% 17 Stora&e Lines 37.96%
18 Cost of Removal 160,761 NA !160,761) 37.96" (61,0251 1,712,901 192 (1,712,709) (650,145)
A Oeprecladon rate for lines 1·5 exclude cost of removal rate. Provision for cost of removal on PRP assets Is reflected on line 6.
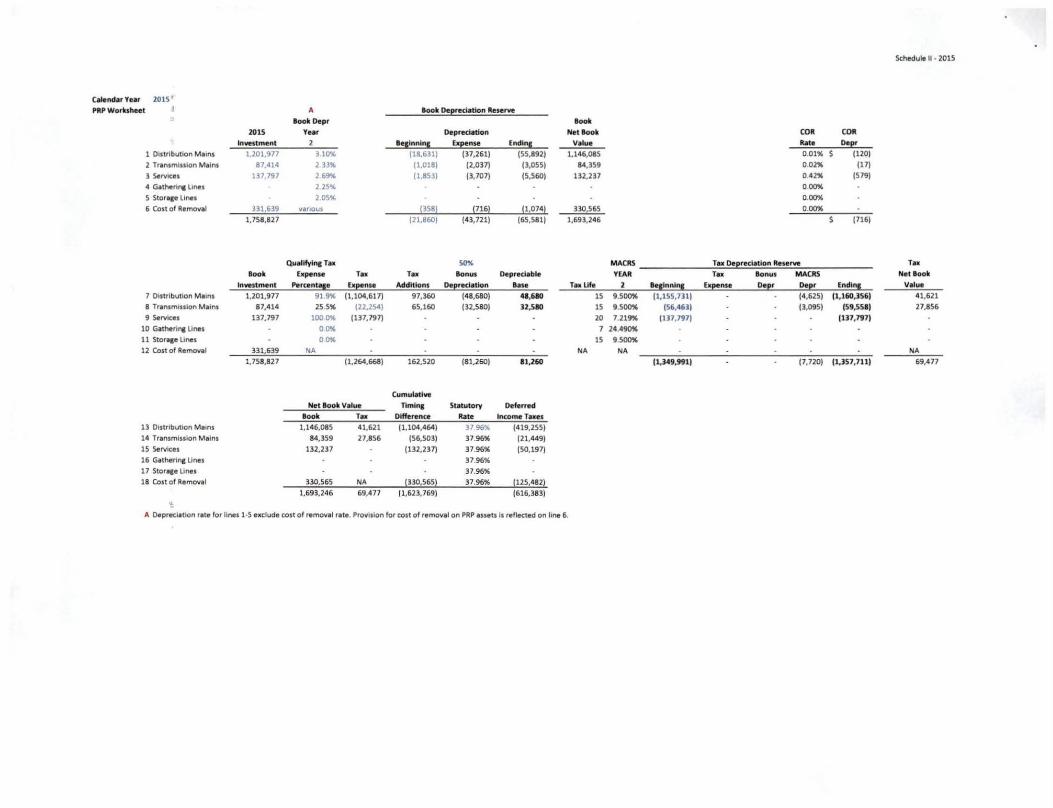
Schedule II - 2015
Calendar Year 2015 -
PIIP Worbheet J A look De!!!:edatlon lleserw lookDepr look
2015 Year Depredation Net look COR COR Investment 2 le&lnnln& b:~nse Endln& Value Rote Dee!:
1 Distribution Mains 1,201,977 3 10'llo (18,631) (37,261) (55,892) 1,146,085 0.01" (120)
2 Transmission Mains 87,414 2 33" (1,018) (2,037) (3,055) 84,359 0 02" (17)
3 Services 137 797 269% (1.8S3) (3,707) (5,560) 132,237 0.42" (579)
4 Gatherinc Unes 2 25% O.DO'llo 5 Stora1e lines 2 OS" O.DO'llo
6 Cost of Remcwol 331,639 YlriOUS !358! !J16! !1,074! 330,565 O.DO'llo 1,758,827 (21,860) (43,721) (65,581) 1,693,246 (7 16)
Quallfylnl To• SO% MACRS TOM Deereclatlon Reserw To
look Expense To Tu Bonus Depredoble YEAR To Bonus MACRS Net look tnvestment Ptrt:en!!l• bf!!OSI Additions Doeredatlon lase TuUfo 2 lo&lnnl!!l Exf!!n.se Deer Deer Endl!!l Value
7 Distribution Molns 1,201,977 919% (1,104,617) 97,360 (48,680) 41,610 15 9 .SDO'llo (1,155,731) (4,625) (1,160,356) 41,621
8 Transmission Mains 87,414 25 5" (22.254) 65,160 (32,580) 32,510 15 9 SDO'llo (56 ,463) (3 ,095) (59,551) 27,856
9 SeiVICOS 137,797 1000'llo (137,797) 20 7 219% (1)7,797) (137,797)
10 Gathennc Unes OO'llo 7 24 490% 11 Stora1e Li nes OO'llo 15 95 DO'llo 12 Cost of Remcwal 331,639 NA NA NA NA
1,758,827 (1,264,668) 162,520 (81,260) 81,260 (1,349,991) (7,720) (1,357,711) 69,477
Cumulatlw Net look Value llmlna Statutory Deferred
look TOM Olfference Rote Income Toes 13 Distribution Moins 1,146,085 41,621 (1,104,464) 37 9616 (419,255) 14 Transmission Mains 84,359 27,856 (56,503) 37.96" (21,449)
15 Serv•ces 132,237 (132,237) 37.96" (50,197) 16 Gatherina Li nes 37.96" 17 Storaae Unes 37.96" 18 Cost of Removal 330,565 NA !330,565! 37.96" p25,482!
1,693, 246 69,477 (1,623.769) (616,383)
A Oeprecl1tlon rate for lines 14 5 exclude cost of removal rate Prov1slon for cost of removal on PRP a.sseu Ls reflected on llne 6.
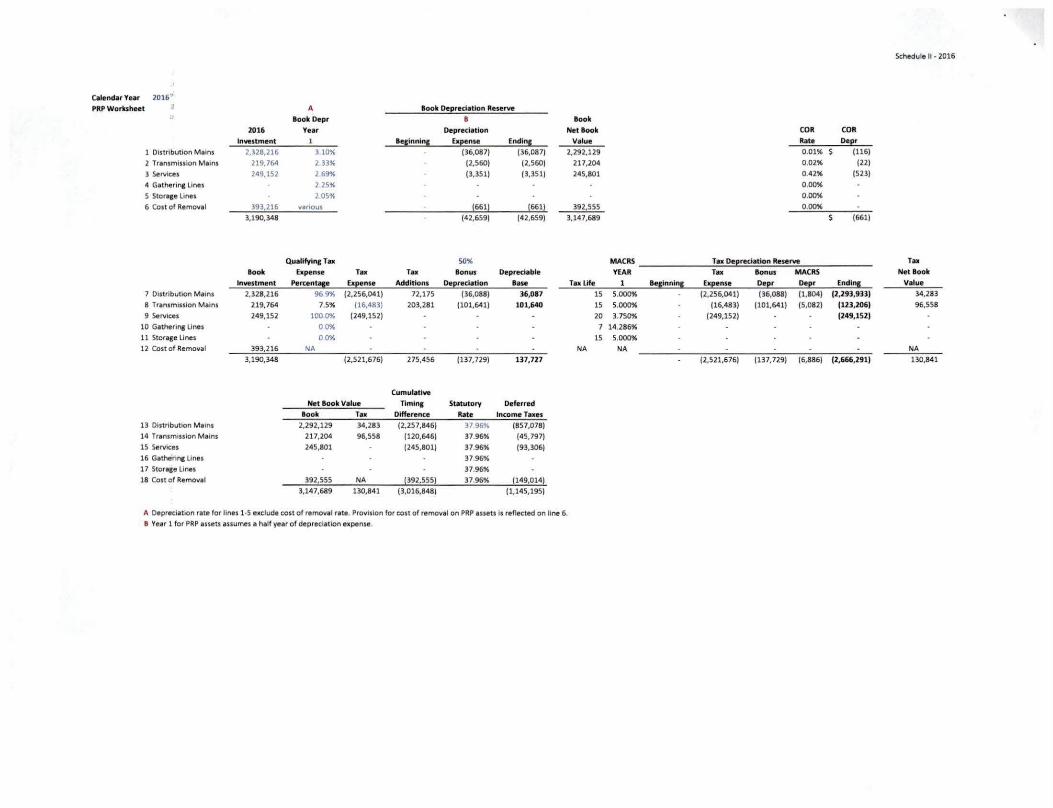
calendar Yeor 2016"
PRP Worksheet A look Oe~redatlon Reserve Book Depr B Book
2016 Ye~r Depreciation Net Book
Investment 1 Be1lnnln1 Ex~ense Endln1 Value 1 Dlstrtblrtlon Mains 2,328,216 310% (36,087) (36,087) 2,292,129
2 Transmission Mains 219.764 2 33% (2,560) (2,560) 217,204
3 Services 249.152 2.69% (3,351) (3,351) 245,801
4 Gathenng Lines 2 25% 5 Storage Lines 2.05%
6 Cost of Removal 393,216 vareous j661! j661! 392,555 3,190.348 (42,659) (42,659) 3.147.689
Quallfyinc Tu 50%
Book b pense Tn Tn Bonus Deprecloble
Investment Perten!!l• Exeense Additions Oel!reclatlon Base TIX Life
7 DistriblJtion Molns 2,328,216 969% (2,256,041) 72,175 (36,088) 36,087 15 8 Transmission Mains 219,764 7.5% (16,483) 203,281 (101,641) 101,640 15
9 Services 249,152 1000% (249,152) 20 10 Gatherlnc Lines 00% 11 Storage Unes 00% 15 12 Cost of Removal 393.216 NA NA
3,190.348 (2.521.676) 275,456 (137,729) 137,727
Cumulative
Net Book Value Tlmlna Statutory Deferred
l ook Tu Difference Rite lncomeTexes 13 DlstrlbYtlon Mains 2,292,129 34,283 (2,257,846) 37 96% (857,078) 14 Transmlssion Mains 217,204 96,558 (120,646) 37.96% (45,797)
15 Servk:es 245,801 (245,801) 37.96% (93,306) 16 Gatherong Lines 37.96%
17 Storage Unes 37.96% 18 Cost of Removal 392,555 NA !392,555) 37.96% (149,014!
3,147,689 130,841 (3,016,848) (1,145,195)
A Depreciation rate for lines 1-S e)(clude cost of removal rate. Provision for cost of removal on PRP assets Is reflected on line 6. B Year 1 for PAP asseu assumes a half year of depreciation expense.
Schedyle II • 2016
COR COR
Rite Defr
0.01% s (116)
0.02% (22)
0.42% (523)
0.00%
0.00%
0.00% (661)
MACRS Tax Def!reclation Ruerve Tu YEAR TIX Bem us MACRS Net Book
11e11nnln1 Exf?:ense Deer Defr Endlnl Volue
5.000% (2,256,041) (36,088) (1,804) (2,293,933) 34,283
5.000% (16,483) (101,641) (5,082) (123,206) 96,558
3.750% (249,152) (249,152)
14.286%
5.000%
NA NA
(2,521,676) (137,729) (6,886) (2,666,291) 130,841
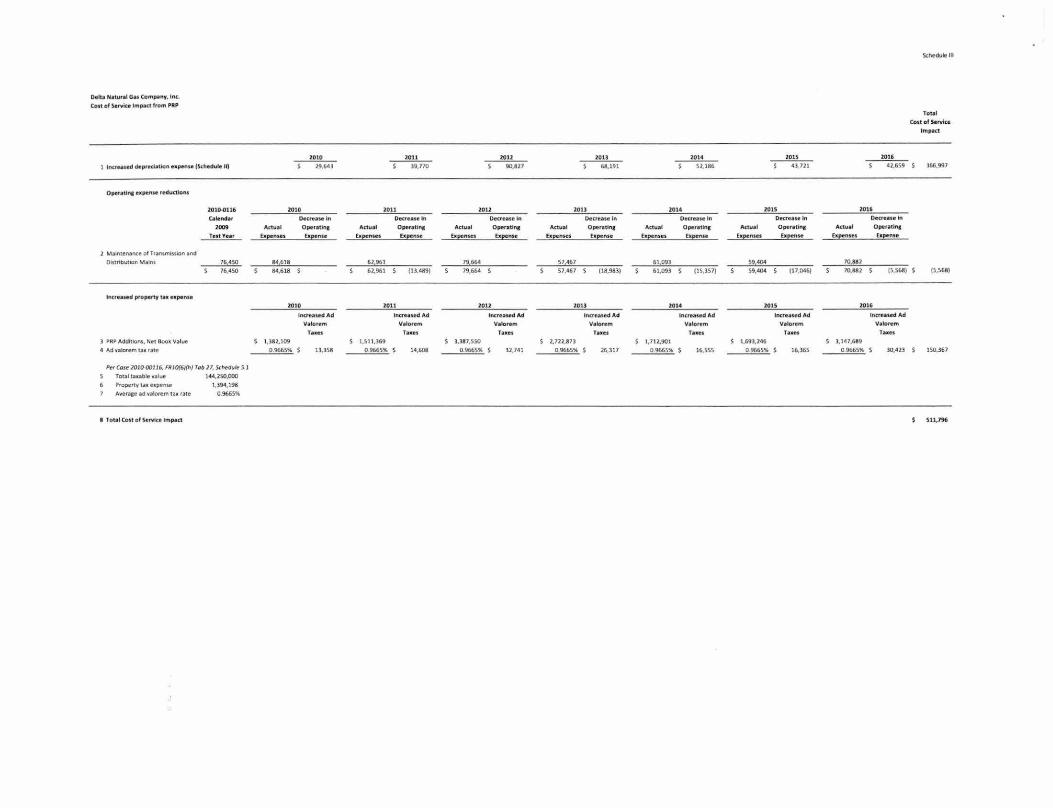
Delli N1h.1r1l Gas ComJNny, Int.
Co1t of Servke lmi)Kt from PRP
1 lnuaasad dept"adltlon ll!lllpetuetSthecfutell)
2 M1unerwnce of Tr~nsmrss.on ~nd
D1stribuuon M~Jnt
] PRP Addit!Of\S, Ntt Boolc Vllue
4 Ad valorem tla rate
2010.011' C.~nd•r
Z009 Test Ye~r
76,450
76,450
PtrCose 1010.00116, FR10(6Hh} rob 11, ~dulr 5 J S To10111 taubt. v1lue J44,2SO.OOO
Propertytne:rp.n~ 1. 394.198
09665"
I To1al Cot1 of Service lm~u
5
1010
1010
Oc.c.ruseln '-ctu•l Ope:r1t1n1
[J:penses [l: pense
8.4,618
84,618
1010
lncruu:dAd
V• torem
Taaet. 1,382,109 5
0 9665" 13,158
lOll lOll
)9,770 90,877
lOll lOU Oecre•seln Decre ase In
Actu al Opt:,. tina Actlolll oper~tinc
Upensn bpense b penMS E.lpense
62961 , ... 62,961 lll.489) 7'1 ....
1011 101> lncreued Ad lncru.s<ll'd Ad
V1lorem v.~rem
h••• , .... , 1,51 1,169 s 1.l87,SSO
0 9665" 14,608 0.9665" 32, 741
101) 1014
5~116
zan 2014 Oecre1se ln Oecruseln
Adu•l Ope_ratinJ Actu•l Operatinl &penws E•eense fl.pensu hpense
57,467 61093
57,46 7 118 ... 3) 61,093 115.357)
l Oll 1014
Increased Ad lncreaudAd
V1'orem Vl toflm fa u.s TUtl
Z.722,81l 1,712 .. 901 s 09665" 26,317 0 9665% 16.555
201S
0 711
l OIS
Decruse In A<tual Oper~t.lna
&pensu bpens•
.. ..,. 59,404 117,046)
lOIS
lncreaud Ad
V1kuem
ra . .. 1,693,246
09665" 16,165
101,
4~.659
l Ol l Oecr .. seln
Actvll Opetatinl
bpen.ses EJi pense
70181
Sthedu~ Ill
ToUI Cost of Service
lm~ct
70.812 15,5611) s 15,568)
101,
Increased Ad
V1torem , .... 3,1-47,689
09665" 30,423 150.367
S11, 796
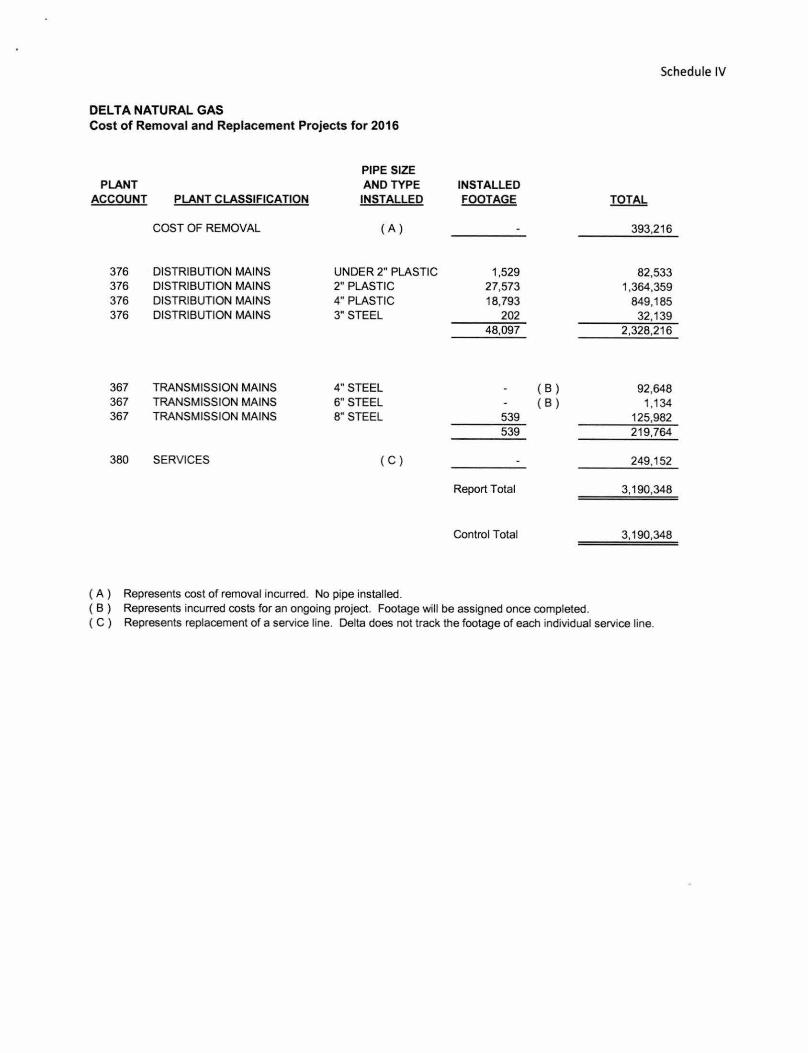
DELTA NATURAL GAS Cost of Removal and Replacement Projects for 2016
PLANT ACCOUNT
376 376 376 376
367 367 367
380
PLANT CLASSIFICATION
COST OF REMOVAL
DISTRIBUTION MAINS DISTRIBUTION MAINS DISTRIBUTION MAINS DISTRIBUTION MAINS
TRANSMISSION MAINS TRANSMISSION MAINS TRANSMISSION MAINS
SERVICES
PIPE SIZE AND TYPE
INSTALLED
(A)
UNDER 2" PLASTIC 2" PLASTIC 4" PLASTIC 3" STEEL
4" STEEL 6" STEEL 8" STEEL
(c)
(A ) Represents cost of removal incurred. No pipe installed.
INSTALLED FOOTAGE
1,529 27,573 18,793
202 48,097
539 539
Report Total
Control Total
(B) ( B)
( B ) Represents incurred costs for an ongoing project. Footage will be assigned once completed.
Schedule IV
393,216
82,533 1,364 ,359
849,185 32,139
2,328,216
92,648 1,134
125,982 219,764
249,152
3,190,348
3,190,348
( C ) Represents replacement of a service line. Delta does not track the footage of each individual service line.
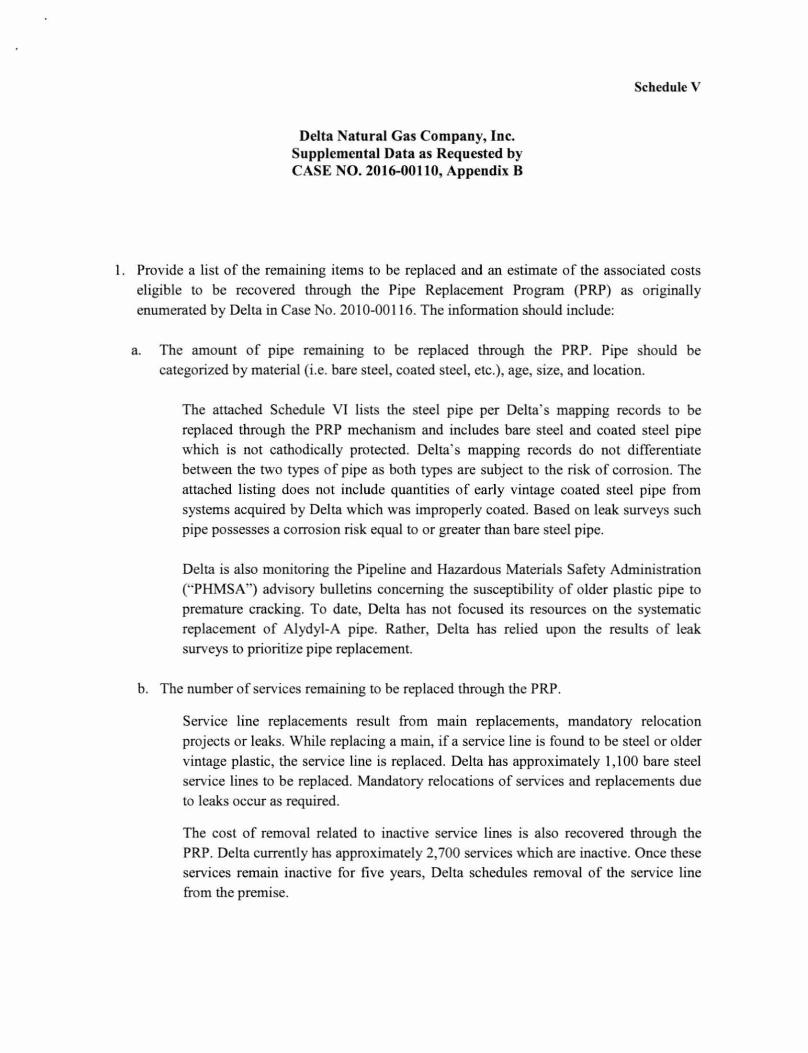
Delta Natural Gas Company, Inc. Supplemental Data as Requested by CASE NO. 2016-00110, Appendix B
Schedule V
I. Provide a list of the remaining items to be replaced and an estimate of the associated costs eligible to be recovered through the Pipe Replacement Program (PRP) as originally enumerated by Delta in Case No. 20 I 0-0011 6. The information should include:
a. The amount of pipe remaining to be replaced through the PRP. Pipe should be categorized by material (i.e. bare steel, coated steel, etc.), age, size, and location.
The attached Schedule Vl lists the steel pipe per Delta's mapping records to be replaced through the PRP mechanism and includes bare steel and coated steel pipe which is not cathodically protected. Delta's mapping records do not differentiate between the two types of pipe as both types are subject to the risk of corrosion. The attached listing does not include quantities of early vintage coated steel pipe from systems acquired by Delta which was improperly coated. Based on leak surveys such pipe possesses a corrosion risk equal to or greater than bare steel pipe.
Delta is also monitoring the Pipeline and Hazardous Materials Safety Administration ("PHMSA") advisory bulletins concerning the susceptibility of older plastic pipe to premature cracking. To date, Delta has not focused its resources on the systematic replacement of Alydyl-A pipe. Rather, Delta has relied upon the results of leak surveys to prioritize pipe replacement.
b. The number of services remaining to be replaced through the PRP.
Service line replacements result from main replacements, mandatory relocation projects or leaks. While replacing a main, if a service line is found to be steel or older vintage plastic, the service line is replaced. Delta has approximately I, I 00 bare steel service lines to be replaced. Mandatory relocations of services and replacements due to leaks occur as required.
The cost of removal related to inactive service lines is also recovered through the PRP. Delta currently has approximately 2,700 services which are inactive. Once these services remain inactive for five years, Delta schedules removal of the service line from the premise.
Schedule V
c. The number of years Delta expects to use the PRP mechanism to recover the cost of bare
and coated steel pipes along with associated services.
At the current pace, Delta expects to reduce its mapped bare steel at a rate of 2-3
miles per year, which indicates bare steel replacement will take fourteen to twenty
years to complete. The quantity of bare steel main Delta is able to replace in a given
year largely depends on resource requirements. In addition to replacing bare steel pipe, the PRP includes main replacements resulting from leak surveys, replacements dictated by outside agencies and the termination of inactive service lines.
Excluding mandatory relocations, Delta has replaced an average of 42,000 feet of
main per year since the PRP' s inception. However, the quantities of bare steel and unprotected steel are not declining at the same rate. Experience under the PRP has
shown quantities retired to be greater than the quantities originally cataloged in
Delta' s mapping records, primarily when pipe is retired from older systems acquired by Delta many years ago and therefore not originally mapped by Delta personnel.
In these acquired systems, Delta has discovered steel which is mapped as protected, but when replaced based on leak history is either unprotected or inadequately protected. Going forward Delta intends to track the decline in bare steel per its
mapping records, as compared to the amount of pipe replaced, to better extrapolate
the number of years required for replacement. Additionally, Delta is encountering portions of plastic connected to the steel which require replacement. As in recent
years, priori ties at the time of work will continue to influence the pace and scope of replacement activities. As Delta monitors the PHMSA advisory bulletins, the pace of
replacements could change. Delta 's PRP is a continuing program which utilizes a risk
based approach based on its leak surveys to target the replacement of bare steel,
unprotected or inadequately protected pipe which poses the greatest risk. In doing so, Delta's PRP focuses on the improvement of public safety and reliabili ty of service fo r its customers.
d. The estimated remaining cost per year of the PRP, broken down by pipe, services, and
any other eligible PRP activities.
See attached Schedule VU.
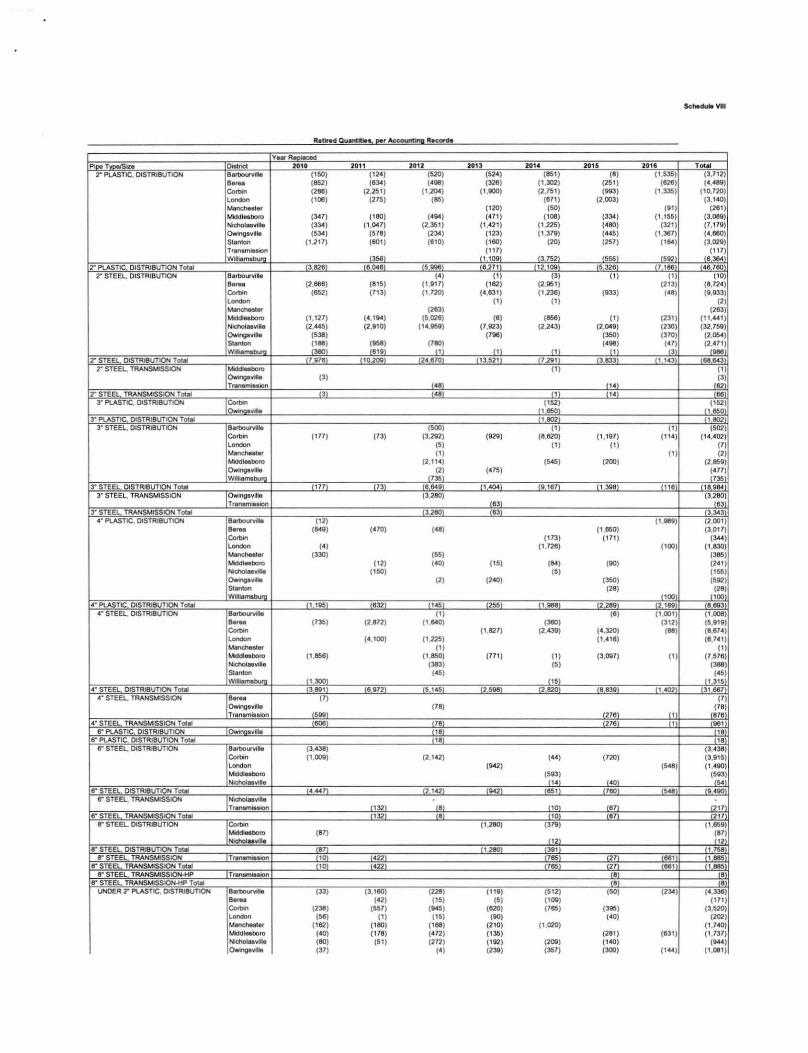
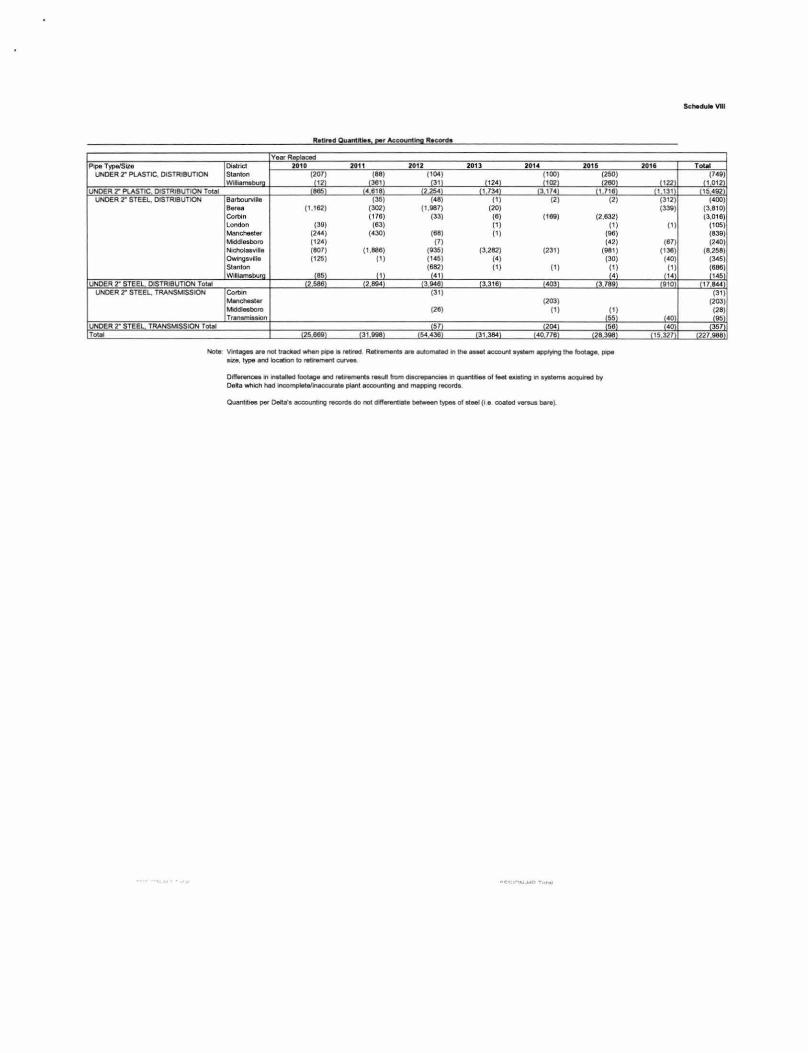
2. Provide a list showing by year the amount of pipe replaced through the PRP since the
program started. Pipe should be categorized by material (i.e. , bare steel, coated steel, etc.), age, size and location.
See attached Schedule VIII.
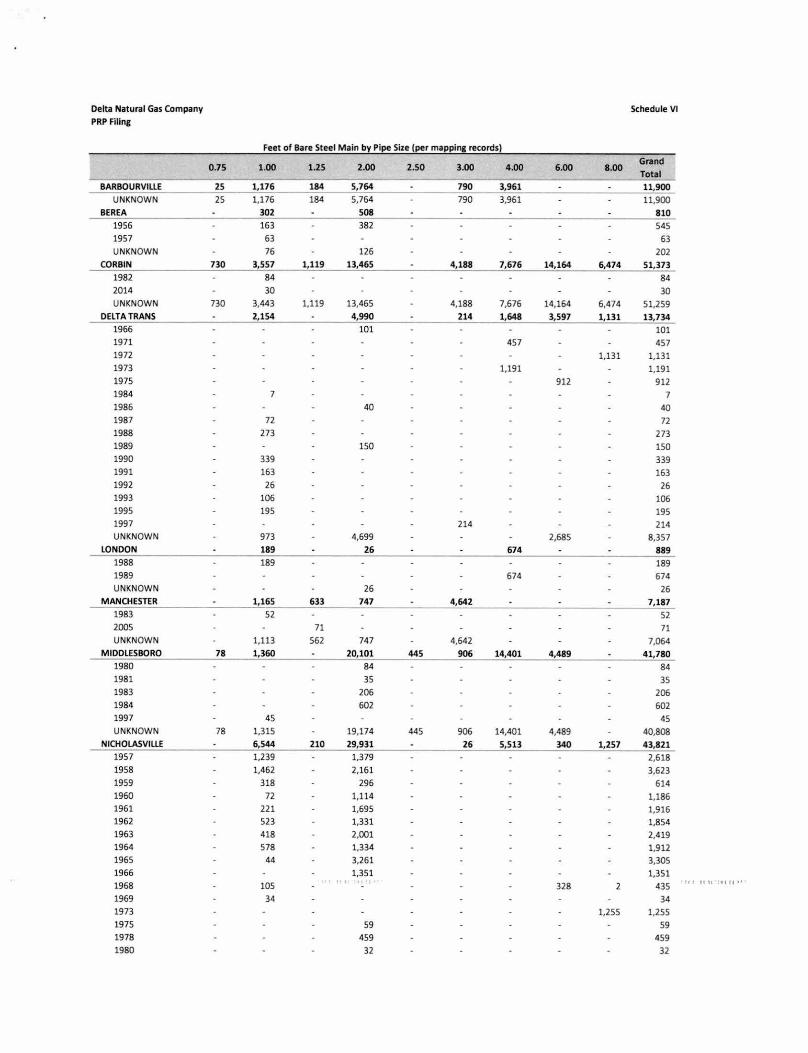
Delta Natural Gas Company Schedule VI PRP Filing
Feet of Bare Steel Main by Pipe Size (per mapping records)
0.75 1.00 1.25 2.00 2.50 3.00 4.00 6.00 8.00 Grand
Total 8ARBOURVIUE 25 1, 176 184 S,764 790 3,961 11,900
UNKNOWN 25 1,176 184 5,764 790 3,961 11,900 BEREA 302 SOB 810
1956 163 382 545 1957 63 63 UNKNOWN 76 126 202
CORBIN 730 3,5S7 1,119 13,465 4, 188 7,676 14,164 6,474 51,373 1982 84 84 2014 30 30 UNKNOWN 730 3,443 1,119 13,465 4,188 7,676 14,164 6,474 51,259
DELTA TRANS 2,154 4,990 214 1,648 3,S97 1,131 13,734 1966 101 101 1971 457 457 1972 1,131 1,131 1973 1,191 1,191 1975 912 912 1984 7 7 1986 40 40 1987 72 72 1988 273 273 1989 150 150 1990 339 339 1991 163 163 1992 26 26 1993 106 106 1995 195 195 1997 214 214 UNKNOWN 973 4,699 2,685 8,357
LONDON 189 26 674 889 1988 189 189 1989 674 674 UNKNOWN 26 26
MANCHESTER 1,165 633 747 4,642 7,187 1983 52 52 2005 71 71 UNKNOWN 1,113 562 747 4,642 7,064
MIDDLESBORO 78 1,360 20,101 445 906 14,401 4,489 41,780 1980 84 84 1981 35 35 1983 206 206 1984 602 602 1997 45 45 UNKNOWN 78 1,315 19,174 445 906 14,401 4,489 40,808
NICHOLASVIUE 6,544 210 29,931 26 5,513 340 1,257 43,821 1957 1,239 1,379 2,618 1958 1,462 2,161 3,623 1959 318 296 614 1960 72 1,114 1,186 1961 221 1,695 1,916 1962 523 1,331 1,854 1963 418 2,001 2,419 1964 578 1,334 1,912 1965 44 3,261 3,305 1966 1,351 1,351 1968 105 328 2 435 ''I It h ' II II ••
1969 34 34 1973 1,255 1,255 1975 59 59 1978 459 459 1980 32 32
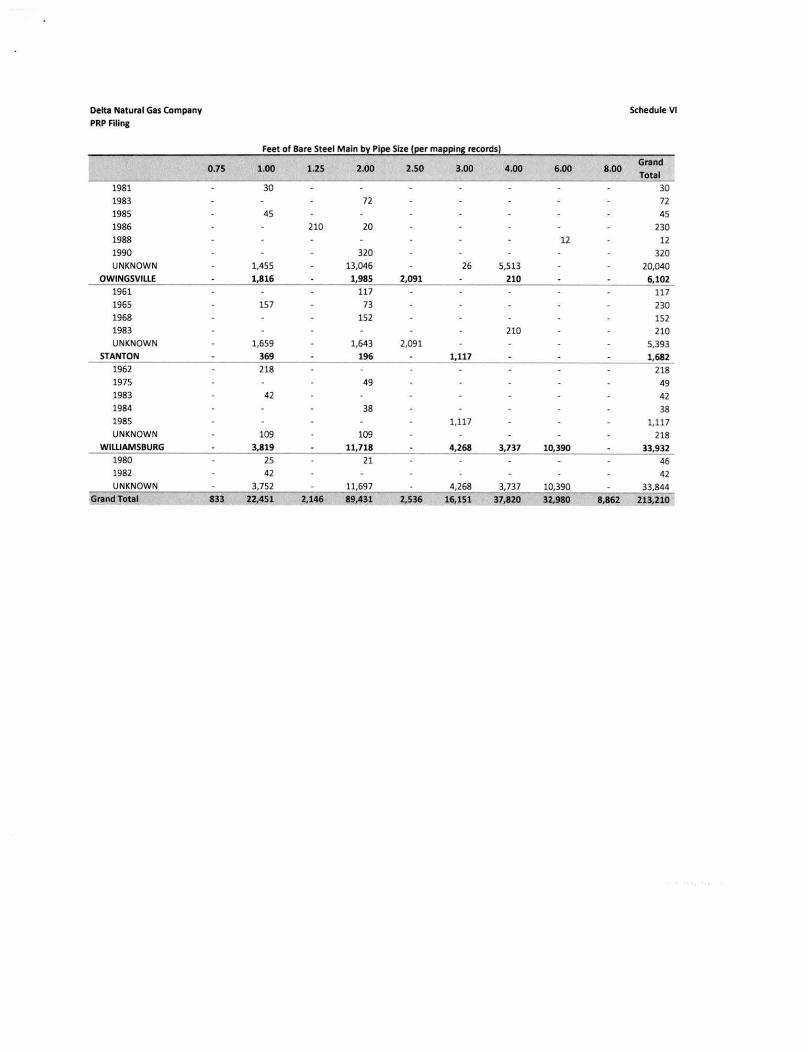
Delta Natural Gas Company Schedule VI
PRP Filing
Feet of Bare Steel Main by Pipe Size (per mapplnl records)
2.00 2.50 3.00 4.00 6.00 8.00 Grand
0.75 1.00 1.25 Total
1981 30 30 1983 72 72 1985 45 45 1986 210 20 230 1988 12 12 1990 320 320 UNKNOWN 1,455 13,046 26 5,513 20,040
OWINGSVILLE 1,816 1,985 2,091 210 6,102 1961 117 117 1965 157 73 230 1968 152 152 1983 210 210 UNKNOWN 1,659 1,643 2,091 5,393
STANTON 369 196 1,117 1,682 1962 218 218 1975 49 49 1983 42 42 1984 38 38 1985 1,117 1,117 UNKNOWN 109 109 218
WIWAMSBURG 3,819 11,718 4,268 3,737 10,390 33,932 1980 25 21 46 1982 42 42 UNKNOWN 3,752 11,697 4,268 3,737 10,390 33,844
Grand Total 833 22,451 2,146 89,431 2,536 16,151 37,820 32,980 8,862 213,210
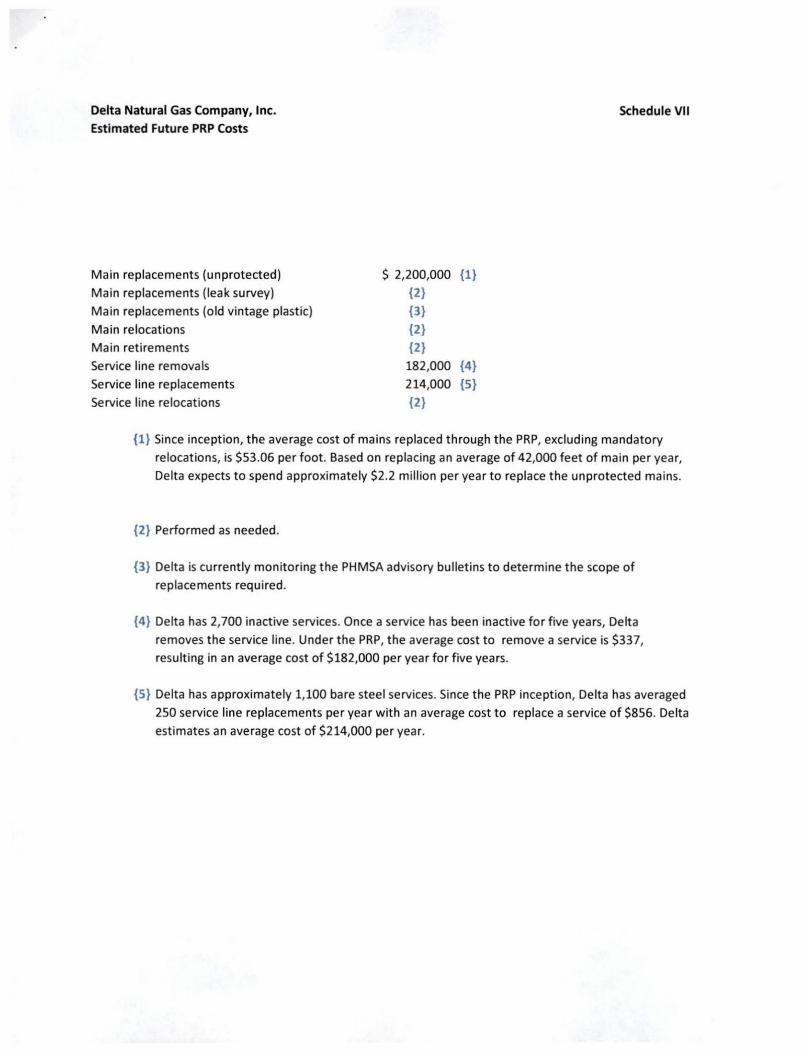
Delta Natural Gas Company, Inc.
Estimated Future PRP Costs
Main replacements (unprotected)
Main replacements (leak survey)
Main replacements (old vintage plastic)
Main relocations
Main retirements
Service line removals
Service line replacements
Service line relocations
Schedule VII
$ 2,200,000 {1}
{2} {3}
{2} {2} 182,000 {4}
214,000 {5}
{2}
{1} Since inception, the average cost of mains replaced through the PRP, excluding mandatory
relocations, is $53.06 per foot. Based on replacing an average of 42,000 feet of main per year,
Delta expects to spend approximately $2.2 mi llion per year to replace the unprotected mains.
{2} Performed as needed.
{3} Delta is currently monitoring the PHMSA advisory bulletins to determine the scope of
replacements required.
{4} Delta has 2,700 inactive services. Once a service has been inactive for five years, Delta
removes the service line. Under the PRP, the average cost to remove a service is $337,
resulting in an average cost of $182,000 per year for five years.
{5} Delta has approximately 1,100 bare steel services. Since the PRP inception, Delta has averaged
250 service line replacements per year with an average cost to replace a service of $856. Delta
estimates an average cost of $214,000 per year.
SchoduloYnl
Retired Quant: lie a, per Atc:ounttna Reccwda v--Pioo TYDO/Sizo Dlolrict 2010 2011 2012 2013 2014 2015 20 11 Toto! 2" PlASTIC, DISTRIBUTlON BOiboUMio (150) ( 124) (520) (524 ) (851) (8) (1535) (3,712)
s .... (852) (834) (4118) (3211) (1,302) (251) (828) (4,4811)
Cort>on (286) (2,251) (1,204) (1,1100) (2,751) (ggJ) (1 335) (10,720) London (1015) (275) (85) (871) (2,003) (3,140) MonchoSIOf (120) (50) (G1) (281) Middlesboro (347) (180) (4G4) (471) ( 108) (334) (1,155) (3,089) Nk:holaevine (334) (1,047) (2,351) (1 ,421) (1.225) (480) (321) (7,179) OwtngsvUio (534) (578) (234) (123) (1,379) (445) (1,387) (4,880) Stanton (1,211) (601) (810) (160) (20) (257) (184) (3,029) TrenemiN.on (117) (117) Wiliamoburv (358) {I 109) {3 752} (555} (592 (8 384
2" PlASTIC DISTRI8l!T10N ToU.I 3 828 8 048 5998 8 271 12 109 5 328 7 188 48 780 2" STEEL. DISTRIBllTION BerbourviKe (4) (1) (3) (1) (1) (10)
Berea (2,886) (815) (1,917) (182) (2,951) (213) (8,724) Cort>in (852) (713) (1,720) (4,831) (1,238) (933) (48) (9,1133) London (1) (1) (2) -- (283) (283) Modd!Mbofo ( 1, 127) (4,1G4) (5.028) (8) (858) (1) (231) (11,441) Nid'lotNYtle (2,445) (2,910) (14,959) (7,923) (2.243) (2,049) (230) (32.759) Owingsvjlo (538) (798) (350) (370) (2,054) $Uon1on (1118) (958) (780)
(1 (4118) (41) (2,471)
Wllliotnoburv {3801 l811ll_ 11i {1) { 1) (3 (988 2" STEEL DISTRllll!TION Toto! 7978 10209 24 870 13.521 7 291 3 833 1143 88843
2" STEEL. TRANSMISSION -"""' (1) (1) Owlngtv;llo (3) (3) Tranam•llon (48) 114) 182
2" STEEL TRANSMISSION Toto! 3 48 1 14 88 3' PlASTIC, DtSTRIBl!T10N
1=.~ .. (152) (152) (1 850) 11850
3' PlASTIC DISTRIBUTlON Toto! 1802 1802 3" STEEL, OISTRIBUTlON Borbounrilo (500) (1) (1) (502)
Cort>ln (177) (73) (3,292) (929) (8,820) (1, 197) (114) (14,402) London (5) (1) (1) (7) -· (1) (1) (2) Moddlooboro (2,114) (545) (200) (2,859) Owlngovllo
(7~: (475) (477)
wi•&amaburg f735 3" STEEL DISTRIBUTION Totol 177 73 8 849 1404 9187 1 398 118 18 984
3" STEEL, TRANSMISSION Owingsville (3.280) (3,280) Transmiu10n (83) 183
3" STEEL TRANSMISSION Toto! 3280) 83 3 343 4"PlAST~.DtSTRIBUTlON BorbouMio (12) ( 1.989) (2,001)
B.,.. (849) (470) (48) (1,850) (3,017) Cort>in (173) (17 1) (344) London (4) (1,728) (100) (1,830) -- (330) (55) (385) Modd!Mboro (12) (40) ( 15) (84) (g()) (24 1) -- (150) (5) (155) Owlngt- (2) (240) (350) (592) Stonton (28) (28) Wiliomol>unl 000 {100
4" PlASTIC DISTRIBl!TION Toto! 1195 832 145 255 1 988 2 289 2189 8893 4" STEEL. DtSTRIBl!TION BorbouMio (1) (8) (1.001) (1,008)
80<00 (735) (2,812) (1 840) (380) (312) (5.919} Cof1>ln (1,827) (2,439) (4,320) (88) (8,874) London (4,100) (1225) (1,418) (8,741) MonchoSior (1) (1) Middlooboro (1,856) (1,850) (771) ( 1) (3,097) (1) (7,578) Nicholoovlle (383) (5) (388) Stanton (45) (45) wilio .... burv (I 300) (15) (1 315
4" STEEL OISTRIBl!TION Toto! 38111 8 972 5145 2 598 2820 8839 1402 31 887 4" STEEL, TRANSMISSION Berea (7) (7)
()wingo ville (78) (78) Tranamiaabn (599) 1278) (I 1876
4" STEEL TRANSMISSION Tocat 606 78 278 1 981 8" PlASTIC DlSTRIBl!TION Owinaovillo 18 18
8" PlASTIC DISTRIBl!TION Total 18 18 8" STEEL, OISTRIBllTION Borbounrilo (3,438) (3,438)
Cort>ln (1,009) (2,142) (44) (720) (3,915) london (1142) (548) (1,4g()) Mddl•boro (593) (593) Nic:hot .. vt~e . (14l 140) .(54
8" STEEL OISTRIBUTlON Toto! 4.44tL 2 142 G42 851 780 548 g 4g()
8" STEEL. TRANSMISSION Nicholas-TranetNHion (132) (8) (10} (87) (217
8" STEEL TRANSMISSION TOial 132 8 10 87 217 8" STEEL. OISTRIBllTION Cort>ln (1,280) (379) (1,859)
-"""' (81) (87) -- (12) f12 8" STEEL DtSTRIBUTlON Toto! 8 1.280 391 1758
S"STEE TRANSMISSION r- 10 422 65 27 881 1885 8" STEEL TRANSMISSION Tocol 10 422 765 27 881 1885
8" STEEL TRANSMISSION-HP Tranamiaaion 8 8 8" STEEL TRANSMISSION-H' Toto! 8 8
UNDER 2" PlAS~. DtSTRI8l!T10N Bol1louMio (33) (3,180) (228) (119) (512) (50) (234} (4,338) - (42) (15) (5) (109) ( 171} Cort>on (238) (557) (G45) (820) (765} (395) (3,520) London (58) (I) (15) (g()) (40) (202) Mancheller (182) (180) (188) (210) (1,020) (1,740) Midd!Mboro (40) (178) (472) (135) (281) (831) (1,737) Nichol .. VIle (80) (51) (272) (192) (209) (140) (G44 ) Owlngovlllo (37) (4) (239) (357) (300) (144) (1,081)
Retired Qu.MIUea, eer Accounllna Records
Ye•~
P1pe Type/Si.to Dillricl 2010 2011 2012 2013 20U 2015 UNOER 2" PlASTIC, OISTRIIIUTION samon (207) (88) (100) (100) (250)
Wlliatnobuf!l 12 1:1e1i .131i 124 _L102i (280i UNOER 2" PlASTIC DISTRIBUTION Total 886 • 818 2.25-<l ln. 3 1H 1718
UNOER 2" STEEL. DISTRIBUTION BarboLWV~Io (35) (.a) (1) (2) (2) 88100 (1 ,182) (302) (1,11117) (20) Corbin (178) (33) (8) (18i) (2,832) London (30) (83) (1) (1) Manchester (2") (430) (88) (1) (ll6) Middleobo"' (124) (7 ) (•2) Nicholas vile (1107) (1 ,888) (035) (3,282) (231) (ll61 ) Owings vile (125) ( 1) (1~) (4) (30) Stanton <:: (1 ) (1) (1) Williams bum 185) (1) •i
UNDER 2" STEEL DISTRIBUTION Tolal 2588 2 894 3i48 3318 403 3 780 UNOER 2" STEEL. TRANSMISSION Corbin (31) - .. (203)
MiddlesOO... (28) (1) (1) TransmiiSIOfl 55
UNDER 2" STEEL TRANSMISSION T- 57 204 58 Total 25880 31008 54 43el 31384 .0778 28 308
Noto --•• no<,_ when- 10 '*'lOd Roo..,..... .. ...,.,..od., 11>o ..... accountoyot.,..-""'~! tho looUge, pope aa.e. t)'PI 8nd toca;on ID teenmen~ CfJI'YM
Oifl..-onc:.s In ...-~ooUgo- roiJr.,_.o r-.ftlrom ~.,- ol lool oxiobng In·~ ecquirod by Oolta wtrich hod lncomploto{'""""""'o plan! OCCOUflbng - ""'-'~~ rooonla
~I* o.llo'o aocoun1ong ..ooldo do notdlfl•.,.llllo- ,._ oiOlool(i o c:ootod venue t..).
Schodulo VII
2011 Total (7.0)
_(122 {I 012 , 131 15492 (312) (400) (33i) (3,810)
(3,018) (1) (105)
(839) (87) (2.0)
(1Je) (8,258) (40) (~)
(1) (888) 14 11~
010 17S.. (31)
(203) (28)
{.0 {05 40 357
15 327 227088
DELTA NATURAL GAS COMPANY, INC.
•
••
•••
APPLICABILITY
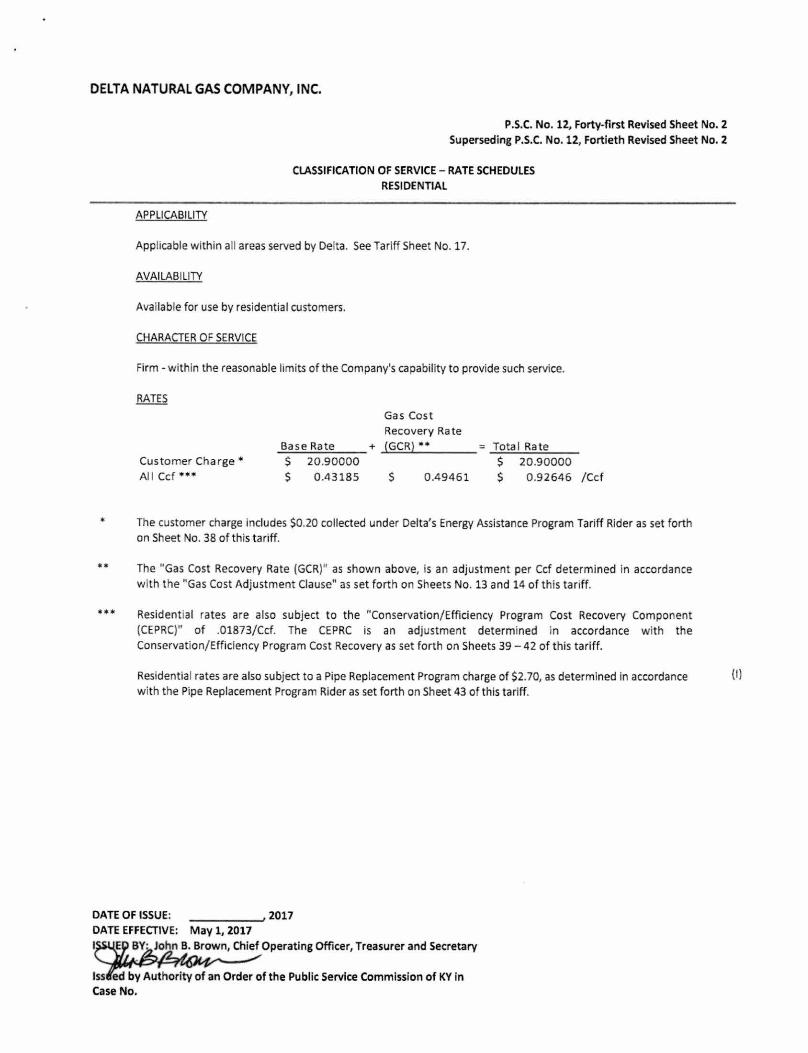
P.S.C. No. 12, Forty-first Revised Sheet No. 2
Superseding P.S.C. No. 12, Fortieth Revised Sheet No. 2
CLASSIFICATION OF SERVICE- RATE SCHEDULES
RESIDENTIAl
Applicable within all areas served by Delta. See Tariff Sheet No. 17.
AVAILABILITY
Available for use by residential customers.
CHARACTER OF SERVICE
Fi rm -within the reasonable limits of the Company's capability to provide such service.
Customer Charge*
Al l Ccf •••
Gas Cost Recovery Rate
...:B:..:a:..:s~e...:R.:.:a:...:t.::.e __ + (GCR) ** $ 20.90000
$ 0 .43185 $ 0.49461
Total Ra te
$ 20.90000
$ 0.92646 /Ccf
The customer charge includes $0.20 collected under Delta's Energy Assistance Program Tariff Rider as set forth on Sheet No. 38 of this tariff.
The "Gas Cost Recovery Rate (GCR)" as shown above, is an adjustment per Ccf determined in accordance
w ith the "Gas Cost Adjustment Clause" as set forth on Sheets No. 13 and 14 of this tar iff.
Residential rates are also su bject to the "Conservation/Efficiency Program Cost Recovery Component
(CEPRC)" of .01873/Ccf. The CEPRC is an adjustment determined in accordance w ith the
Conservation/Efficiency Program Cost Recovery as set forth on Sheets 39 - 42 of t his tariff.
Residential rates are also subj ect to a Pipe Replacement Program charge of $2.70, as determined in accordance (I)
w ith the Pipe Replacement Program Rider as set forth on Sheet 43 of this tariff.
DATE OF ISSUE: ____ _,2017
DATE EFFECTIVE: May 1, 2017
I E BY: John B. Brown, Chief Operating Officer, Treasurer and Secretary
Iss ed by Authority of an Order of the Public Service Commission of KY in Case No.
DELTA NATURAL GAS COMPANY, INC.
•
...
APPLICABILITY
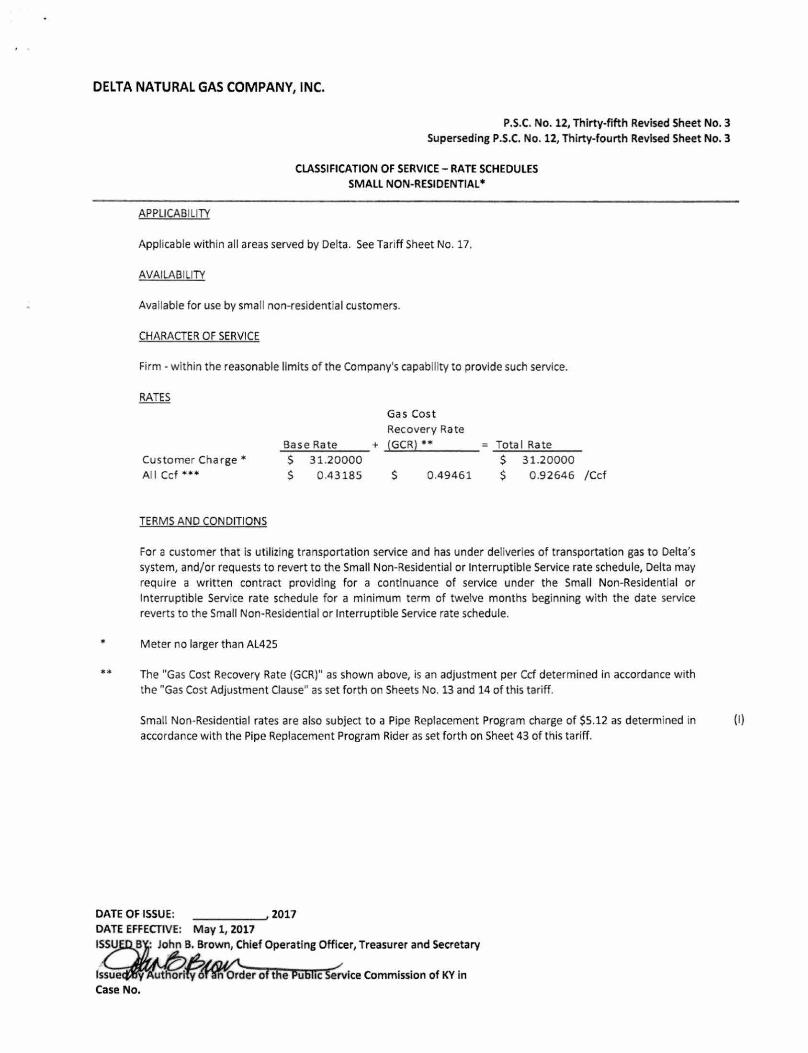
P.S.C. No. 12, Thirty-fifth Revised Sheet No. 3 Superseding P.S.C. No. 12, Thirty-fourth Revised Sheet No.3
CLASSIFICATION OF SERVICE - RATE SCHEDULES SMAll NON-RESIDENTIAL*
Applicable w ithin all areas served by Delta. See Tariff Sheet No. 17.
AVAILABILITY
Ava ilable for use by small non-resident ial customers.
CHARACTER OF SERVICE
Fi rm - w ithin the reasonable limits of the Company's capability to provide such service.
Customer Charge* Al l Ccf ***
TERMS AND CONDITIONS
Gas Cos t Recovery Rate
...:B;.:a;.:s..=e...:.R.:.:a;.:t.=.e __ + ( GCR) •• $ 31.20000 $ 0.43185 $ 0 .49461
Total Rate $ 31 .20000 $ 0 .92646 /Ccf
For a customer that Is utilizing t ransportation service and has under deliveries of transportation gas to Delta' s system, and/or requests to revert to the Small Non-Residentia l or Interruptible Service rate schedule, Delta may require a w ritten contract provid ing for a continuance of service under the Small Non-Residential or Interruptible Service rate schedule for a minimum term of twelve months beginning with the date service reverts to the Small Non-Residential or Interruptible Service rate schedule .
Meter no larger than Al 425
The "Gas Cost Recovery Rate {GCR)" as shown above, is an adjustment per Ccf determined in accordance with the "Gas Cost Adjustment Clause" as set forth on Sheets No. 13 and 14 of this tariff.
Small Non-Residential rates are also subject to a Pipe Replacement Program charge of $5.12 as determined in (I) accordance with t he Pipe Replacement Program Rider as set forth on Sheet 43 of this tariff.
DATE Of ISSUE: -----' 2017 DATE EfFECTIVE: May 1, 2017
B • John B. Brown, Chief Operating Officer, Treasurer and Secretary
--::~:lll4out orl~~ice Commission of KY in Case No.
DELTA NATURAL GAS COMPANY, INC.
*
••
P.S.C. No. 12, Thirty-fifth Revised Sheet No.4 Superseding P.S.C. No. 12, Thirty-fourth Revised Sheet No. 4
APPLICABILITY
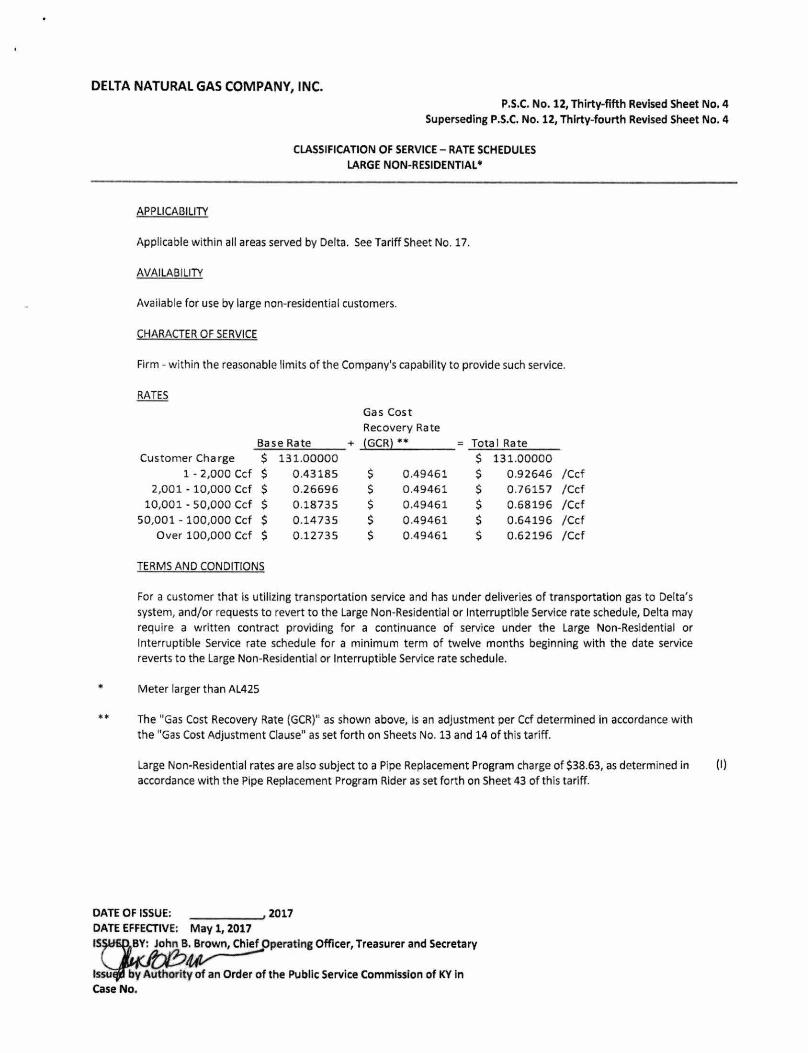
CLASSIFICATION OF SERVICE- RATE SCHEDULES LARGE NON-RESIDENTIAL*
Applicable within all areas served by Delta. See Tariff Sheet No. 17.
AVAILABILITY
Available for use by large non-residential customers.
CHARACTER OF SERVICE
Firm - within the reasonable limits of the Company's capability to provide such service.
RATES
Gas Cost Recovery Rate
Base Rate + (GCR) ** Total Rate Customer Charge $ 131.00000 $ 131.00000
1 - 2,000 Ccf $ 0.43185 $ 0.49461 $ 0.92646 /Ccf 2,001- 10,000 Ccf $ 0.26696 $ 0.49461 $ 0.76157 /Ccf
10,001 - 50,000 Ccf $ 0.18735 $ 0.49461 $ 0.68196 /Ccf 50,001 - 100,000 Ccf $ 0.14735 $ 0.49461 $ 0.64196 /Ccf
Over 100,000 Ccf $ 0.12735 $ 0.49461 $ 0.62196 /Ccf
TERMS AND CONDITIONS
For a customer that is utilizing transportation service and has under deliveries of transportation gas to Delta's system, and/or requests to revert to the Large Non-Residential or Interruptible Service rate schedule, Delta may require a written contract providing for a continuance of service under the Large Non-Residential or Interruptible Service rate schedule for a minimum term of twelve months beginning w ith the date service reverts to the Large Non-Residential or Interruptible Service rate schedule.
Meter larger than AL425
The "Gas Cost Recovery Rate (GCR)" as shown above, is an adjustment per Ccf determined in accordance with the "Gas Cost Adjustment Clause" as set forth on Sheets No. 13 and 14 of this tariff.
Large Non-Residential rates are also subject to a Pipe Replacement Program charge of $38.63, as determined in (I) accordance with the Pipe Replacement Program Rider as set forth on Sheet 43 of this tariff.
DATE OF ISSUE: ----....J 2017 DATE EFFECTIVE: May 1, 2017 IS BY: John B. Brown, Chief Operating Officer, Treasurer and Secretary
·~LJ--~ lssu by Authority of an Order of the Public Service Commission of KY In case No.
DELTA NATURAL GAS COMPANY, INC.
••
APPLICABILITY
P.S.C. No. 12, Thirty-sixth Revised Sheet No. S Superseding P.S.C. No. 12, Thirty-fifth Revised Sheet No.5
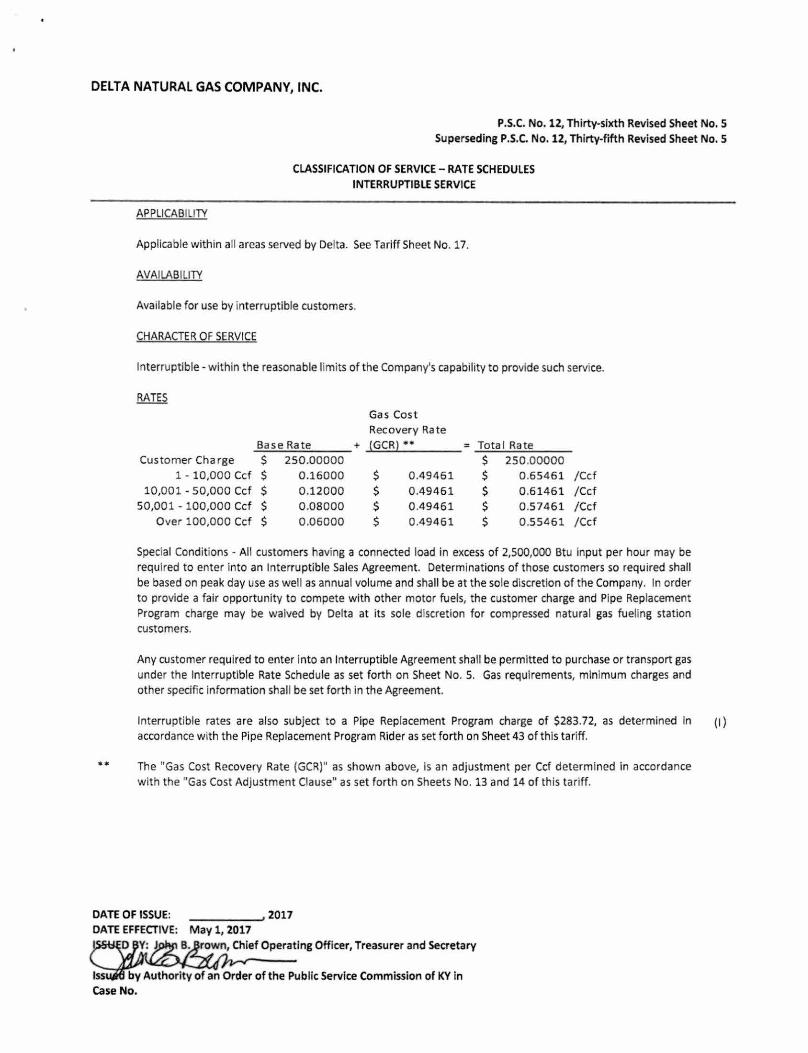
CLASSIFICATION OF SERVICE- RATE SCHEDULES INTERRUPTIBLE SERVICE
Applicable within all areas served by Delta. See Tariff Sheet No. 17.
AVAILABILITY
Available for use by interruptible customers.
CHARACTER OF SERVICE
Interruptible- within the reasonable limits of t he Company's capability to provide such service.
RATES
Gas Cost Recovery Rate
Base Rate + !GCR)•• Tota l Rate Customer Charge $ 250.00000 $ 250.00000
1 - 10,000 Ccf $ 0.16000 $ 0.49461 $ 0.65461 /Ccf 10,001- 50,000 Ccf $ 0.12000 $ 0.49461 $ 0.6146 1 /Ccf
50,001- 100,000 Ccf $ 0 .08000 $ 0 .49461 $ 0 .57461 /Ccf Over 100,000 Ccf $ 0 .06000 $ 0.49461 $ 0 .55461 /Ccf
Special Condit ions - All customers having a connected load in excess of 2,500,000 Btu input per hour may be required to enter Into an Interruptible Sales Agreement. Determinations of those customers so required shall be based on peak day use as well as annual volume and shall be at the sole discretion of t he Company. In order to provide a fair opportunity to compete with other motor fuels, the customer charge and Pipe Replacement
Program charge may be waived by Delta at its sole discretion for compressed natural gas fueling station customers.
Any customer required to enter into an Interrupt ible Agreement shall be permitted to purchase or transport gas under the Interrupt ible Rate Schedule as set forth on Sheet No. 5. Gas requirements, minimum charges and other specific Information shall be set forth in the Agreement.
Interruptible rates are also subject to a Pipe Replacement Program charge of $283.72, as determined in (I) accordance with the Pipe Replacement Program Rider as set forth on Sheet 43 of this tariff .
The "Gas Cost Recovery Rate (GCR)" as shown above, Is an adjustment per Ccf determined in accordance with the "Gas Cost Adjustment Clause" as set forth on Sheets No. 13 and 14 of this tariff.
DATE OF ISSUE: ____ __, 2017
May 1, 2017
by Authority of an Order of the Public Service Commission of KY in case No.