phosphate adsorption by mixed and reduced …soils.stanford.edu/theses/theresa_barber.pdf ·...
TRANSCRIPT
PHOSPHATE ADSORPTION BY MIXED AND REDUCED IRON PHASES IN
STATIC AND DYNAMIC SYSTEMS
A THESIS
SUBMITTED TO THE DEPARTMENT OF GEOLOGY
OF STANFORD UNIVERSITY
IN PARTIAL FULFILLMENT OF THE REQUIREMENTS
FOR THE DEGREE OF
MASTER OF SCIENCE
Theresa M. Barber
August 2002

ii
I certify that I have read this dissertation and that, in my opinion, it is fully adequate in scope and quality as a thesis for the degree of Master of Science.
Scott Fendorf, Principal Advisor
I certify that I have read this dissertation and that, in my opinion, it is fully adequate in scope and quality as a thesis for the degree of Master of Science.
Adina Paytan
iii
ABSTRACT
Phosphorus (P) availability is an important biogeochemical element and is often
the limiting nutrient in freshwater and estuarine ecosystems. It is a macronutrient and is a
critical component in DNA, RNA, ATP, and phospholipids. The prominent correlation
between phosphorus retention and iron has led to numerous examinations of P adsorption
capacities and mechanisms onto iron oxides and hydroxides in aerobic environments,
most commonly hematite and goethite.
Many studies have discounted iron oxides as playing a significant role in P
retention under anoxic conditions, suggesting P will be released to solution upon the
reductive dissolution of the iron (III) oxides or phosphates; however, there are conflicting
sentiments regarding P retention in anaerobic environments. The goal of this study was
to elucidate the binding capacity of phases common to anaerobic environments for P
retention. The specific objectives of this study were (1) to determine P sorption
capacities of siderite, magnetite, and sulfate green rust and compare retention to that of
lepidocrocite, goethite-coated sand, ferrihydrite-coated sand, and ferrihydrite slurry, (2)
to determine the influence of pH and ionic strength on retention capacity, and (3) to
examine phosphate retention under flow through heterogeneous and homogenous
mixtures of iron phases.
The results of the static experiments indicate ferrous minerals have phosphate
adsorption capacities that are much greater than those of the ferric phases examined.
However, the ferrous minerals all had much lower binding coefficients and were more
sensitive to changes in pH. The high capacity for phosphate of the ferrous minerals,
combined with the relatively low affinity and sensitivity to pH suggests that the ferrous
minerals investigated may provide appreciable, although transitory phosphorus sinks in
some reductomorphic environments.
The hydrodynamic experiments indicated that the pH of a system will determine
the reaction time necessary for a particular sorbent to become saturated with respect to
PO4, but if the reaction time is adequate pH will not diminish the capacity of the sorbent.
Additionally, the influent PO4 concentration will control the adsorption capacities
exhibited by an iron oxide sorbent. The presence of elements such as Ca and Fe(II) may
promote the precipitation of phosphate minerals, which increases the apparent adsorption

iv
capacity of a sorbent. Reductive dissolution of ferric oxides leading the precipitation
secondary ferrous minerals create complicated mixtures of sorbents, each of which will
exhibit different sorption capacities and responses to changes in pH. Sorption of ferrous
iron may passivate reactive sites on the primary and secondary phases that could
otherwise sorb phosphate. This work has demonstrated that phosphate retention in
dynamic systems is dependant upon many interrelated factors, each of which must be
considered in order to fully understand and predict P retention, even in these relatively
simple geochemical systems.
v
ACKNOWLEDGMENTS
I would like to thank my advisor, Dr. Scott Fendorf, for his guidance and patience
throughout the last two years. His excitement for science is contagious and kept me
motivated even during the times I felt like giving up. Colleen Hansel, Dr. Shawn Benner,
and Dr. Bruce Wielinga were all instrumental in the completion of this work, providing
guidance in the lab, as well as thought-provoking discussions about experimental results.
I would also like to thank Dr. Adina Paytan for her time and input during the final stages
of this project. Dr. Guangchao Li assisted with many of the chemical analyses and
offered valuable advice regarding experimental design. I would like to thank several
other graduate students, Colin Doyle, Chris Oze, T.J. Kiczenski, Megan Young, Kristen
Averyt, and Chris Van de Ven, for providing counsel, insight, and encouragement
throughout the past two years. I also wish to thank Tim Himmer for his patience and
support throughout the past year. Finally, I would like to thank the Department of
Geological and Environmental Sciences and the McGee Foundation for their financial
support.

vi
TABLE OF CONTENTS
Abstract.....................................................................................................................iii
Acknowledgements ..................................................................................................v
Table of Contents .....................................................................................................vi
List of Tables ............................................................................................................viii
List of Figures...........................................................................................................x
Chapter 1: Literature Review
Importance of phosphate in the natural environment..................................... 1
Global cycling and phosphate chemistry ....................................................... 4
Iron: mineral occurrence, chemistry, and importance toward phosphate...... 9
Adsorption and adsorption models: a general overview................................12
Phosphate sorption onto iron oxides ..............................................................15
Need and research objectives .........................................................................22
References......................................................................................................26
Chapter 2: Phosphate Adsorption by Mixed and Reduced Iron Minerals Under
Static Conditions
Introduction
Importance and cycling of phosphate.................................................33
Phosphorus retention processes .........................................................34
Need and research objectives .............................................................36
Materials and Methods
Mineral preparation............................................................................39
Mineral characterization ....................................................................40
Phosphate adsorption experiments.....................................................41
Release of sulfate from green rust......................................................42
Results
Adsorption capacities & isotherms ....................................................43
Influence of pH and ionic strength.....................................................45
Release of sulfate from green rust......................................................45
Discussion ......................................................................................................53
vii
Conclusions....................................................................................................59
Appendix: Isotherm data collected during sorption experiments ..................60
References......................................................................................................71
Chapter 3: Phosphate Adsorption by Heterogeneous Mixtures of Ferrous and Ferric
Oxides Under Hydrodynamic Conditions
Introduction
Importance and cycling of phosphate in the natural environment .....75
Need and research objectives .............................................................78
Materials and Methods
Ferrihydrite-coated sand preparation .................................................79
General column set-up and sampling ................................................79
Aerobic columns (ferrihydrite-coated sand only) ..............................80
Anaerobic columns (multiple iron phases coating sand) ...................82
Static adsorption experiments (on sand) ............................................83
Surface Area Analysis........................................................................83
Results
Aerobic columns ................................................................................85
Anaerobic columns ............................................................................90
Discussion ......................................................................................................103
Conclusions....................................................................................................107
References......................................................................................................109

viii
LIST OF TABLES Chapter 1: Literature Review
Table 1.1. Summary of previously determined phosphate adsorption capacities........................................................................................................17
Chapter 2: Phosphate Adsorption by Mixed and Reduced Iron Minerals Under Static Conditions
Table 2.1. Maximum observed phosphate adsorption on a mass basis of
the mineral adsorbent (µmols PO4/g mineral)................................................44
Table 2.2. Surface area (SA) and SA normalized adsorption maxima for phosphate on various iron oxides...................................................................44
Table 2.3. Summary of adsorption capacities (b-values) and KL-values for minerals conforming to the Langmuir isotherm.............................................44
Table 2.4. Average adsorption (µmols PO4/g) at high and low ionic strength...........................................................................................................46
Table 2.5. Concentration data and saturation indices for phosphate solutions after 2 d reaction with geologic magnetite, geologic siderite, and sulfate green rust. ....................................................................................55 Table 2A.1. Summary of data used to establish adsorption isotherm of PO4 by naturally occurring (geologic origin) magnetite. ...........................61 Table 2A.2. Summary of data used to establish adsorption isotherm of PO4 by sulfate green rust ...........................................................................62 Table 2A.3. Summary of data used to establish adsorption isotherm of PO4 by naturally occurring (geologic) siderite ..........................................63 Table 2A.4. Summary of data used to establish adsorption isotherm of PO4 by ferrihydrite (as a slurry). ................................................................64 Table 2A.5. Summary of data used to establish adsorption isotherm of PO4 by ferrihydrite-coated sand.................................................................65 Table 2A.6. Summary of data used to establish adsorption isotherm of PO4 by goethite-coated sand. .....................................................................66 Table 2A.7. Summary of data used to establish adsorption isotherm of PO4 by lepidocrocite. .................................................................................67

ix
Table 2A.8. Summary of data used to establish adsorption isotherm of PO4 by synthetic siderite............................................................................68 Table 2A.9. Summary of data used to establish adsorption isotherm of PO4 by naturally sulfate green rust. ...........................................................69
Chapter 3: Phosphate Adsorption by Heterogeneous Mixtures of Ferrous and Ferric
Oxides Under Hydrodynamic Conditions Table 3.1. Average feed solution compositions used during biotic column experiments. ...................................................................................................84 Table 3.2: Distribution of iron (mole percent) in abiotic, anaerobic column upon experiment termination. ...........................................................91 Table 3.3. Mineralogical composition (in terms of mole percent iron) with distance downfield in GW and BC columns..........................................98

x
LIST OF FIGURES Chapter 1: Literature Review Figure 1.1. Depiction of the phosphorus cycle.............................................6 Figure 1.2. Speciation of phosphate as a function of pH. ............................8 Figure 1.3. Diagram of surface complexes. ..................................................13 Figure 1.4. Example of an experimental adsorption envelope for goethite......................................................................................21 Chapter 2: Phosphate Adsorption by Mixed and Reduced Iron Minerals Under
Static Conditions
Figure 2.1. Phosphate adsorption curves for minerals fit to a Freundlich isotherm (a) geologic magnetite, (b) sulfate green rust and (c) geologic siderite .................................................................................47 Figure 2.2. Adsorption isotherms of ferric (hydr)oxides all fit to the Langmuir isotherm (a) ferrihydrite, (b) ferrihydrite-coated sand, (c) goethite-coated sand, and (d) lepidocrocite. .............................................48 Figure 2.3. Phosphate adsorption curve fit to a Langmuir isotherm for (a) synthetic siderite and (b) synthetic magnetite. ..................................49 Figure 2.4. Influence of pH on phosphate adsorption to various iron oxides......................................................................................................50 Figure 2.5. Sulfate released from green rust with increasing ionic strength (as NaCl). ................................................................................51 Figure 2.6. Phosphate adsorption and sulfate release with increasing phosphate concentration. Also shown is phosphate sorbed and sulfate released into 100 µM phosphate solution when no NaCl is present ..............52
Chapter 3: Phosphate Adsorption by Heterogeneous Mixtures of Ferrous and Ferric Oxides Under Hydrodynamic Conditions
Figure 3.1. Schematic of column apparatus used to evaluate PO4
3- transport through packed mineral beds. .........................................................81 Figure 3.2. Average influent and effluent P concentration and pH for aerobic columns PB1 and PB2 (a) and aerobic well-buffered column (b). .....................................................................................................86
xi
Figure 3.3. Side-port solution P concentration and pH through time for aerobic columns PB1 (a-b) and PB2 (c-d)................................................87 Figure 3.4. Elemental concentration (mM) of P and Fe on the solid-phase after 50 d (a-b) and 21 d (c) of reaction for PB1 and PB2 (a–b) and the well-buffered column (c)..................................................88 Figure 3.5. Aqueous P concentrations along the flow-path of the well-buffered, aerobic column. ......................................................................89 Figure 3.6. Schematics of ripened anoxic, abiotic column before (a) and after (b) introduction of phosphate solution...........................................92 Figure 3.7. Influent and effluent P concentration and pH data (a) for abiotic, anoxic experiment and side-port solution P concentration and pH through time.. ....................................................................................93 Figure 3.8. Side-port solution Fe concentration through time for the anaerobic, abiotic experiment. .................................................................94 Figure 3.9. Elemental concentration of the solid-phase after 11 d of reaction for the anoxic, abiotic column .....................................................95 Figure 3.10. Mineralogical composition as determined by EXAFS analysis upon termination of anoxic, abiotic column. ...................................96 Figure 3.11. Influent and effluent P and pH data for the GW (a) and BC (b) biotic columns .............................................................................99 Figure 3.12. Total (6 M HCl) and partial (0.5 M HCl) extraction data from GW (a) and BC (b) anaerobic, biotic columns......................................100 Figure 3.13. Fe and PO4 concentrations (mM) in pore water in GW (a) and BC (b) biotic columns at experiment termination...................................101 Figure 3.14. Mineralogical composition (in terms of mole % iron) of packed mineral beds within GW (a) and BC (b) columns upon experiment termination. .................................................................................102

1
CHAPTER 1
Literature Review I. Importance of phosphate in the natural environment Phosphate is an essential component of ATP (adenosine tri-phosphate), DNA
(deoxyribonucleic acid), RNA (ribonucleic acid), and phospholipids as a result of its
unique chemical properties. Phosphoric acid has three ionizable groups; within DNA
molecules two groups link the nucleotides while the third inhibits hydrolysis and
maintains the structural integrity of the molecule. Phosphate also serves as an
intermediary in metabolism and during energy transfer involving ATP. Available pools
of phosphate and nitrogen control the expanse and activity of the biosphere on a global
level. The critical role occupied by phosphate in combination with relatively low
availability leads to very rapid biological cycling and a high level of phosphate
conservation in undisturbed ecosystems (Schlesinger, 1991). In many forests, phosphate
input through atmospheric deposition is greater than loss to runoff (Berner and Berner,
1996). Berner and Berner (1996) also refer to phosphate at being the most ‘biologically
active’ of all the macronutrients, meaning the ratio of phosphate stored in the biomass to
that lost to runoff is very high. However, in areas cleared for agricultural production,
phosphate loss may be significant due to increased soil erosion and removal during the
harvesting process (Brady and Weil, 1999). The high amount of phosphate lost from
agricultural ecosystems is also due in part to the large quantities of soil amendments used
in those areas (Berner and Berner, 1996).
From the agricultural standpoint, phosphate is an important factor in crop vitality.
Phosphate availability is often a problem due to three primary factors. First, the
phosphate content of soil is relatively low, usually falling within the range of 0.001
mg/kg (infertile) to 1 mg/kg (heavily fertilized). Secondly, phosphate compounds and
complexes within soils are often insoluble and not readily available for biological uptake.
Finally, the complexes previously mentioned fix (irreversibly adsorb) phosphorus added
as a soil amendment. Phosphate deficiency can impede numerous developmental
processes including photosynthesis, flowering, fruiting, maturation, nitrogen fixation, and
root growth. The combination of strong retention mechanisms within soils and the

2
importance of phosphate to plant health has led to the over-application of phosphate in
many agricultural areas (Brady and Weil, 1999).
Freshwater and estuarine ecosystems are often nutrient limited and are
particularly sensitive to increases in phosphate (Reddy et al., 1999; Manahan, 1994).
Phosphate input to lakes is normally limited to rainfall and most of the phosphate in a
given lake is sequestered in the biomass (plankton). Cycling of phosphate is very rapid in
these systems, but a small amount is lost from the biomass to the sediments. Reductive
dissolution of ferric iron phases within the sediments may release phosphate back into the
water column but this is typically a very small input (Schlesinger, 1991). Soil and
sediment erosion can contribute appreciable quantities of particulate phosphate to aquatic
systems, especially since erosion will preferentially remove clay-sized particles and
organic matter, both of which are strong phosphate sorbents. Dissolved phosphate may
also be introduced to aqueous systems by surface runoff from drainage areas with
unincorporated fertilizers on the land surface. While phosphate is not directly toxic to
aquatic organisms, eutrophication and toxic algal blooms, such as pfisteria, do cause fish
kills. Eutrophication occurs when a limiting nutrient is added to a water body. Decay of
resulting algal blooms consumes oxygen and prevents light infiltration. As the algae
begin to die and decompose the biological oxygen demand spikes, resulting in anoxia
(Brady and Weil, 1999). Phosphate is not often a problem in groundwater due to strong
sorption by Fe and Al oxides common in aquifer materials (Sparks, 1995).
Recent studies in the Everglades have documented that small additions of
phosphate, due to increased runoff from agriculture, appear to be altering the ecology of
the area. Prior to urbanization and intensified agriculture, rainfall was the predominant
source of phosphate to the system and the Everglades were oligotrophic (DeBusk et al.,
1994). Minor increases of phosphate, from ~0.07 µM/L to ~16 µM/L, shift the
environment to a more eutrophic state resulting in the replacement of cyanobacterial-
diatom populations by a filamentous green algae, the advance of cattails into areas that
were once strictly sawgrass, and endemic periphyton replaced by algal species normally
found in more eutrophic areas (DeBusk et al., 2001; Noe et al., 2001; DeBusk et al.,
1994). DeBusk et al. (1994) also suggested that increased phosphate loading might result
in even larger scale changes in tropic state, including possible increased biomass

3
production, changes in species composition, and a decrease of species diversity. In
addition to changes in vegetation, Wright and Reddy (2001) noted that phosphate was a
factor in peat accumulation rates and changes in enzyme activity within the Everglades.
Finally, the high binding strength of phosphate to ferric oxides has implications
on the fate of other contaminants in the natural environment. Phosphate competes with
and displaces numerous other anions including AsO43-, SO3
2-, MoO42-, CrO4
2-, SO42-,
SeO42-, Br-, I-, and Cl- (Geelhoed et al., 1997; McBride, 1994). Ryden et al. (1977a)
examined phosphate sorption and competition by other inorganic anions and found that
SO42-, SeO4
2-, Cl-, and NO2- had no effect on phosphate sorption; however, H2AsO4,
HSeO3-, and MoO4
2- all depressed phosphate adsorption. These authors also found that
H2AsO4- was more competitive for sites when added at the same time as phosphate.
Arsenic migration, in particular, has received a great deal of attention in recent
years due to the implications on human health. Application of phosphate fertilizers has
been correlated with increased As mobility (Darland and Inskeep, 1997; Peryea and
Kammereck, 1997) in soils, and in some cases phosphate and hydroxide have been used
specifically to remove As from soils (Jackson and Miller, 2000). Su and Puls (2001)
studied As removal by zero-valent Fe and observed that phosphate caused a substantial
decrease in As retention, with As(III) retention inhibited more at lower pH and As(V)
retention hindered more at higher pH. In soil columns, phosphate addition increased As
mobility but did not yield total As desorption even when the amount of phosphate added
was greater than the sorption capacity of the soil (Darland and Inskeep, 1997). Reynolds
et al. (1999) found that phosphate enhanced As transport in well-aerated soils but had
very little effect on As mobility in soils that had undergone cycles of flooding and
subsequent aeration. This phenomenon was attributed to the formation of more
amorphous iron oxides in the flooded soils, leading to increased sorption capacity for
both arsenic and phosphate.
Several researchers have examined the competition of arsenic and phosphate for
sorption sites in more controlled, single sorbent systems. O’Reilly et al. (2001)
demonstrated arsenic release from goethite upon addition of phosphate to the surrounding
solution. Hongshao and Stanforth (2001) also used goethite as a sorbent and found that
the order in which arsenic and phosphate were added to solution made a significant

4
difference in the adsorption and desorption characteristics. They observed roughly equal
adsorption when arsenic and phosphate were added concurrently, resulting in an overall
surface coverage greater than that observed during single anion addition. When the ions
were added successively the amount of exchange was found to be dependant upon how
long the first anion had been allowed to react. A positive correlation between amount of
exchange and equilibration time was observed. Based on these observations, a two-stage
reaction was proposed, beginning with very rapid surface complexation followed by
slower precipitation, with the second step being the most influential on exchange. Jain
and Loeppert (2000) examined the influence of phosphate on arsenate and arsenite
adsorption by ferrihydrite. The presence of phosphate reduced the amount of As sorbed
by ferrihydrite, but this occurrence was conditional and dependent upon the pH and
phosphate concentration. Phosphate had a greater effect on arsenate sorption at higher
pH and on arsenite at lower pH. They also suggested some surface sites had a greater
affinity for arsenite than phosphate as well as a “moderate preference for arsenate”.
II. Global cycling and phosphate chemistry
Weathering of geologic materials is the ultimate source of phosphate to the
biosphere; however, the amount of phosphate released is a small fraction of that required
for the current levels of biological production. This deficiency results in phosphate being
highly conserved and very rapidly cycled within the biosphere (Filippelli and Souch,
1999; Berner and Berner, 1996). Vegetation, periphyton, plankton, and microbes all act
as biotic phosphorus sinks. However, biotic cycling is not without P loss to abiotic
mechanisms, including adsorption by soils and sediments, mineral precipitation, and
sedimentation. Phosphate lost from the biomass is quickly complexed by iron and
aluminum oxides or sorbed by clay minerals (Berner and Berner, 1996). Dissolution of
phosphate minerals and complexes may be expedited by plant root exudates or
mycorrhizae, but the major environmental transformations of phosphate are not
biologically or chemically driven. The largest flux of phosphate in terms of geochemical
cycling is fluvial transport to the oceans. Phosphate cycling within the water column is
quite rapid, but constant losses of small amounts from the biomass to the sediments and

5
soils have resulted in oceanic sediments being the largest phosphate reservoir on earth
(Schlesinger, 1991). Figure 1.1 is a flowchart of the global phosphorus cycle.
Phosphorus almost always occurs as the oxyanion PO43-, the behavior of which
may be used as a proxy for arsenate (O’Reilly et al., 2001; Reynolds et al., 1999). The
acid-dissociation constants for phosphate are listed below (Stumm and Morgan, 1981).
[H3PO4] ↔ [H+] + [H2PO4-] Ka = 10-2.2 [1.1]
[H2PO4-] ↔ [H+] + [HPO4
2-] Ka = 10-7.2 [1.2]
[HPO42-] ↔ [H+] + [PO4
3-] Ka = 10-12.3 [1.3]
One should note that the pKa values for the arsenate anion are 3.60, 7.25, and 12.52
(Benjamin, 2002). At circumneutral pH, both HPO42- and H2PO4
- are important anions,
with HPO42- being more prevalent in slightly alkaline conditions and H2PO4
- dominating
in slightly acidic environments (Figure 1.2).
Phosphorus adsorption by soils and lake sediments has often been correlated to
amorphous iron, aluminum, and manganese oxides and hydroxides, as well as calcium
and magnesium (Brady and Weil, 1999; Reddy et al., 1999; Torrent, 1997; Golterman
1995; Olila and Reddy, 1995; Blanchar and Frazier, 1991; Williams et al., 1971). Once
sequestered within soils or sediments, phosphate falls into one of four categories:
phosphate minerals, labile or non-labile sorbed phases, or organic phosphate. Non-labile
and labile soil phosphate pools fall into calcium bound phosphate and iron or aluminum
bound phosphate. Non-labile phosphorus is usually incorporated within the matrices of
Fe and Al minerals and are usually quite insoluble. Labile, or more bioavailable,
phosphate is sorbed to the surface of silica, calcium carbonate, or other soil minerals. In
acidic soils, iron and aluminum phosphate minerals and complexes are dominant, while
calcium phosphates are the main controlling phases in alkaline environments. Several
common soil phosphate minerals are apatite [Ca5(PO4)3(OH,F,Cl)], hydroxyapatite
[Ca5(PO4)3OH], fluorapatite [Ca5(PO4)3F], octocalcium phosphate [Ca8H2(PO4)2·5H2O],
strengite [FePO4·2H2O], vivianite [Fe3(PO4)2·8H2O], variscite [AlPO4·2H2O], and
wavellite [Al3(PO4)2(OH)3·5H2O] (Brady and Weil, 1999; Reddy et al., 1999).

6
Xenobiotic Organisms
Soluble inorganic P (HPO42-,
H2PO4-), polyphosphates
Assimilation by organisms Precipitation
Biological P: ADP, ATP, DNA, nucleic acids, phospholipids
Biodegradation
P in sediments: biological, organic, inorganic
Insoluble P (inorganic): Ca & Fe phosphates
Fertilizer runoff, wastewater, etc
Dissolution
Figure 1.1. Depiction of the phosphorus cycle (taken from Manahan, 1994).

7
Organic phosphate is typically categorized into three groups. Inositol phosphates
make up 10 to 50 percent of the total organic phosphate pool in soils. These compounds
are phosphate esters of sugar-like molecules and are usually very stable in alkaline
conditions and are likely to react with higher molecular weight compounds. The second
group consists of phosphate contained within nucleic acids, which may be sorbed by
silicate clays and humic acids. Phospholipids, molecules critical to the cytoplasmic
membranes of cells, comprise the final group. Most organic phosphate is associated with
the fulvic acid fraction of soil organic matter (Brady and Weil, 1999).
Organic phosphate must be converted back to an inorganic form via
mineralization in order to be usable by higher plants. Humus and organic matter will
decompose to release HPO42- or H2PO4
-, depending on pH. Soil conditions and the
presence or absence of carbon will dictate whether the released phosphate is rapidly
reincorporated into the biomass, precipitates as a mineral, or retained as a sorbed phase
(Brady and Weil, 1999; Manahan, 1994). The cycling of phosphate within soils can be
simply expressed (Brady and Weil, 1999):
1 2 Organic P H2PO4 Fe, Al, Ca phosphates 1. Microbial catalyzed reaction in both directions 2. Reaction requires presence of Al, Fe, Ca, or organic matter. This
phosphate is fixed and not readily available.
Seasonally flooded soils pose unique conditions on phosphate dynamics due to
the changing oxidation-reduction conditions. Periodic flooding may occur naturally or be
the result of rice production or be a means to control weeds, insects and soil subsidence
(Diaz et al., 1993). Episodic flooding generally leads to amplified P release due to
changes in iron mineralogy (i.e., reductive transformation) (Pant and Reddy, 2001a;
Quang and Dufey, 1997; Diaz et al., 1993). Pant and Reddy (2001a) in fact proposed that
water table fluctuations within wetlands destabilize sorbents and lead to phosphate
release.

8
pH
0 2 4 6 8 10 12 14
Frac
tion
of S
peci
es
0.0
0.2
0.4
0.6
0.8
1.0H2PO4
-HPO42- PO43-H3PO4
Figure 1.2: Speciation of phosphate as a function of pH.

9
Riparian zones, areas adjacent to rivers where the vegetation is predominantly
influenced by the presence of water, can take many different forms, from narrow bands of
land along headwater streams to well-developed floodplains along larger rivers (Carlyle
and Hill, 2001). Phosphate retention within riparian zones is particularly important
because these systems provide a crucial buffer between surface run-off and phosphate-
limited freshwater systems. Riparian zones have long been recognized as natural filters,
removing excess nutrients, heavy metals, and other contaminants from non-point sources
(Bridgham et al., 2001; Carlyle and Hill, 2001; Fisher and Reddy, 2001; Wright and
Reddy, 2001). Riparian zones, do however, exhibit differing abilities to sequester
phosphate, a property of which is thought to be related to the amount of dissolved oxygen
present in the system; higher dissolved oxygen levels have been associated with higher
levels of retained phosphate (Carlyle and Hill, 2001). Within wetlands three biological
pools predominate: plants, microbes and organic matter (peat) are partially responsible
for phosphate accumulation. While retention by plants and microbes is seasonal, peat
accumulation in wetlands can store large amounts of phosphate for long periods of time
(Bridgham et al., 2001; Carlyle and Hill, 2001; Fisher and Reddy, 2001). Bridgham et al.
(2001) and Carlyle and Hill (2001) both cite the main phosphate removal processes as
sedimentation of particulates and adsorption, with the greatest phosphate removal taking
place within the first few meters of the wetland.
III. Iron: mineral occurrence, chemistry, and importance toward phosphate
Iron oxides account for the majority of metallic oxides in soils and are found in
most climatic regions. These oxides are particularly important because they are often
contributing, if not controlling, factors in the fate and transport of nutrients and
contaminants (Huang and Wang, 1997). The various iron oxides usually have high
surface areas and chemically reactive functional groups. Surface complexation not only
results in the retention of contaminants and nutrients but also alters the redox properties
of the iron phase (in particular, reductive dissolution) (Stumm and Sulzberger, 1992).
The primary source of iron to the aqueous environment is the weathering of
igneous and metamorphic minerals. Ferrous (II) iron is present in these minerals and
oxidation to ferric (III) iron can weaken the silicate structure and enhance the weathering
10
process. Once ferric iron is released into solution, it rapidly hydrolyzes and subsequently
precipitates as an oxide (Huang and Wang, 1997; Langmuir, 1997). The iron cycle is
closely tied to phosphorus, sulfur, oxygen, carbon, and heavy metals, as well as light and
biological organisms. Due to the highly reactive surfaces and large surface areas of most
iron oxides and hydroxides, surface reactions are a controlling factor of iron flux (Stumm
and Sulzberger, 1992).
The mobility of iron in aqueous systems is dependant on the redox potential and
pH of the environment. Under reducing conditions, ferrous iron predominates and is
generally relatively soluble up to near pH 8. However, if sulfide is present, ferrous iron
will be removed as FeS. In addition to low redox conditions, low pH (pH<4) will
enhance dissolution of most ferric iron phases. Complexation of ferric iron with organic
ligands (humic and fulvic acids) may also lead to mobile complexes. Ferric iron forms
strong, inner-sphere complexes with ligands such as OH-, PO43-, and F- and is likely to be
present as complexes in most aquatic environments (Langmuir, 1997).
The common ferric oxides and hydroxides are goethite, hematite, lepidocrocite,
and ferrihydrite (or hydrous ferric oxide). The arrangement of the anions is the main
control on the crystal structure and interconversion of the oxides. An octahedron,
Fe[O(H)]6, is the basic structural unit in these oxides, which are linked by sharing edge
surfaces, faces, or corners (Cornell and Schwertmann, 1996). The surface areas and
reactivities of iron oxides are highly variable and dependent upon crystallinity and
porosity. The porosity of iron oxides may be caused by structural defects, aggregation, or
dehydroxylation and contributes to the internal surface area. Common ranges of surface
areas are: goethite 8-80 m2/g, lepidocrocite 15-100 m2/g, ferrihydrite 100-400 m2/g,
hematite 2-90 m2/g, and magnetite 4-100 m2/g (Cornell and Schwertmann, 1996; Deng
and Stumm, 1994).
Goethite (α-FeOOH) is the most widespread Fe oxide in soils and sediments in
temperate climates. Hematite (α-Fe2O3) is a common weathering and oxidation product
of ferrous silicates and may form as a result of ferrihydrite conversion. Like goethite,
hematite is quite stable and is often an end member of transformations and is more
common than goethite in older sediments and desert soils, since higher temperatures and
arid conditions favor hematite formation. Organic matter will also dictate whether

11
hematite or goethite forms, particularly in surface soils, due to its ability to complex Fe.
Complexation of organic matter with Fe will suppress hematite formation since it
prevents the solubility product of ferrihydrite from being exceeded, but not that of
goethite (Langmuir, 1997; Cornell and Schwertmann, 1996).
Lepidocrocite (γ-FeOOH) is a small component of noncalcareous soils in humid
and temperate regions. This oxyhydroxide is particularly apt to form in soils having a
fluctuating water table (reductomorphic), since formation is favored by rapid oxidation at
low pH, low total iron, low temperature and the absence of aqueous ferric iron (Huang
and Wang, 1997). Ferrihydrite or hydrous ferric oxide (Fe(OH)3·nH2O) is very prevalent
in surface conditions and precipitates from the rapid hydrolysis of Fe(III) or oxidation of
Fe(II). Ferrihydrite is poorly ordered and is likely to convert to hematite in warm areas
and goethite in cooler areas. The degree of ordering of both synthetic and naturally
occurring ferrihydrite is variable, producing differing XRD patterns (2-line and 6-line).
The 2-line and 6-line ferrihydrites form under different conditions, and 2-line ferrihydrite
is not thought to convert to the 6-line form (Langmuir, 1997; Cornell and Schwertmann,
1996).
Mixed and low valent iron minerals, such as magnetite, siderite and green rust, are
also common in natural environments. Magnetite (Fe3O4) contains both ferrous and
ferric iron and has been found in soils as lithogenic magnetite in the mineral fraction and
as authigenic magnetite. Formation of authigenic magnetite occurs abiotically but is
facilitated by bacteria (Cornell and Schwertmann, 1996; Zachara et al., 2002). Siderite
(FeCO3) is the third most common carbonate mineral in ocean sediments (Schwertmann
and Taylor, 1977) is a by-product of microbial respiration of iron (Zachara et al., 2002);
authigenic siderite has also been observed in anoxic sediments (Boughriet et al., 1997;
Moore and Reddy, 1994).
Green rust is a blue-green Fe2+-Fe3+ hydroxide with a pyroaurite structure and
may contain Cl-, SO42-, or CO3
2- in the interlayer. The structure of the mineral consists of
FeII(OH)6 octahedra in which a fraction of the FeII is replaced with FeIII. The FeII/FeIII
ratio can vary from 0.8 to 3.6, creating a positive layer charged which is balanced by the
interlayer anions (Cornell and Schwertmann, 1996). Green rusts were first noticed as
products of steel corrosion and were later observed in lake sediments and soils (Boughriet

12
et al., 1997). They can form as byproducts of dissimilatory iron reduction by bacteria and
as intermediates in the formation of iron oxides and hydroxides. The most common
interlayer anions observed in nature are SO42- and CO3
2-. The sulfate form of green rust is
examined in this study and has the general formula Fey2+Fex
3+(OH)3x+2y-2z(SO4)z (Randall
et al., 2001).
IV. Adsorption and adsorption models: a general overview
Stumm (1992) describes adsorption as “the accumulation of matter at the solid-
water interface”. A major ramification of this process is an alteration in the distribution
of molecules between the solid and solution, subsequently influencing their transport.
Adsorption can also change the electrostatic properties of particles and affect flocculation
and adhesion. Finally, adsorption will affect the reactivity of surfaces, altering rates of
precipitation, dissolution, and subsequent ion retention. Surface precipitation and
polymerization are not considered as forms of adsorption, but collectively the three
processes are referred to as ‘sorption’ (Sparks, 1995; Stumm, 1992).
Adsorption mechanisms are commonly divided into inner-sphere complexation,
outer-sphere complexation, and retention in the diffuse swarm. Inner-sphere complexes
are a result of a chemical reaction, are highly specific, and are quite strong. Electrostatic
attraction is responsible for outer-sphere complexes and retention in the diffuse swarm.
Outer-sphere complexes result from localized charge imbalances and are not specific
(Sparks, 1995). Figure 1.3 illustrates several inner- and outer-sphere complexes.

13
Figure 1.3: Diagram of various surface complexes. The top three (a-c) are examples of outer sphere complexes, while d (monodentate) and e (bidentate) are inner sphere complexes (from McBride, 1994).
-
+1-
2+
Oxygen Hydrogen Metal/divalent cation
+
+
1-
14
Anions are commonly observed to sorb to oxide and silicate minerals within soils
and in some cases bind to organic matter, with iron or aluminum typically acting as a
bridging ion. Chemisorption of anions occurs on ionizable functional groups on mineral
surfaces. Adsorption occurs through a ligand exchange process in which the anion
displaces H2O or OH-. Since H2O is a more mobile ligand than OH-, sorption is often
favored at lower pH. Four key characteristics of ligand exchange are the release of
hydroxyls, high specificity toward binding sites, apparent hysteresis, and the surface
charge becoming more negative after adsorption (McBride, 1994).
Adsorption isotherms are used to describe the adsorbed mass (normalized to the
mass of the substrate) as a function of the equilibrium concentration of the adsorbing
molecule at constant temperature. Isotherms have been classified into four main types: S,
L, H, and C. The L-type isotherm exhibits a decreasing slope with increasing
concentration, with the slope eventually becoming zero. This shape suggests a high
affinity between the adsorbed molecule and the substrate and often represents
chemisorption. The H-type isotherm is an exaggerated form of the L-type, suggesting
very strong interactions such as the formation of inner-sphere complexes. The C-type
(constant partitioning) isotherms insinuate partitioning between the solution and substrate
without any type of specific bonding. S-type isotherms usually have a slope that
increases with adsorptive concentration until sites are filled, when the slope decreases to
zero (Sparks, 1995; McBride 1994).
Several equilibrium-based models are used to describe adsorption on mineral
surfaces. The Freundlich equation, Langmuir equation, the diffuse double-layer model,
and the Stern model are commonly used. However, the Langmuir and Freundlich
equations are two of the most widely used and are incorporated in the following work.
Both models allow one to summarize and compare adsorption data, and possibly even to
predict adsorption behavior outside of experimental conditions. However, these
isotherms do not specifically indicate the type of sorption mechanism responsible for
adsorption, nor do they provide the speciation of surface complexes (Cornell and
Schwertmann, 1996).
The Langmuir equation was developed to describe gas adsorption on metal
surfaces but has been adapted for solid-solution interactions given the following
15
assumptions. First, a surface has a fixed number of identical sites which can each retain
one molecule, resulting in an adsorption maxima or monolayer coverage. Second,
adsorption is also reversible, and third, the molecules do not move laterally along the
surface of the substrate. Finally, adsorbate molecules do not react with each other and
the adsorption energy for all sites is identical, regardless of surface coverage (Sparks
1995).
The Freundlich equation is an empirical model that was first used to describe gas
and solute adsorption; it has also been used to describe ion retention by adsorption and
precipitation processes. This model does not predict an adsorption maximum and implies
that the adsorption energy of a surface varies with surface coverage (Sparks, 1995).
V. Phosphate sorption onto iron oxides
The prominent correlation between phosphorus and iron minerals in estuaries
(Pant and Reddy, 2001b; Roden and Edmunds, 1997), lake and ocean sediments (Young
and Ross, 2001; Olila and Reddy, 1997; Slomp et al., 1996; Olila and Reddy, 1995;
Moore and Reddy, 1994), and soils (Golterman, 1999; DeMello et al., 1998; Szilas et al.,
1998; Willett and Higgins, 1978) has led to numerous examinations of P adsorption
capacities and mechanisms by iron oxides and hydroxides. The most commonly studied
ferric minerals have been hematite and goethite since they are the most stable and most
abundant, although not necessarily the most reactive, iron minerals found in soils. They
are also easily synthesized in the lab and have well defined crystal structures (Cornell and
Schwertmann, 1996; Sparks, 1995; Torrent et al., 1994).
The mechanism of phosphate adsorption onto ferric oxides is generally dominated
by ligand exchange in which two singly coordinated hydroxyl groups or water molecules
are replaced by a single phosphate anion resulting in the formation of a bidentate,
binuclear complex (Reddy et al., 1999; Torrent, 1997; Colombo et al., 1994; Goldberg
and Sposito, 1985; Parfitt and Russell, 1977; Parfitt et al., 1975). The phosphate surface
complexes are very stable and result in slow exchange rates and an apparent
irreversibility (hysterisis) of phosphorus adsorption. The strength of these complexes
leads to long-term phosphorus storage in soils, sediments, and wetlands (Reddy et al.,
1999; Goldberg and Sposito, 1985; Parfitt et al., 1975).
16
Spectroscopic methods have been used to determine the type of surface complex
formed by phosphate on various oxides. Parfitt et al. (1975) and Parfitt and Russell
(1977) identified the formation of binuclear complexes on lepidocrocite, goethite,
hematite, ferric hydroxide gels, and β-ferric hydroxide using infrared (IR) spectroscopy.
Persson et al. (1996) examined phosphate adsorption by goethite and hematite also using
IR spectroscopy and suggested a monodentate inner-sphere complex was the primary
sorption mechanism. Three distinct surface complexes on goethite were observed, each
having a different degree of protonation as a function of pH. Unexpectedly, differences
between the hematite and goethite samples were noted. The authors proposed the
observed variations were due to surface precipitation on the hematite surface that resulted
from mineral synthesis. Arai and Sparks (2001) used attenuated total reflectance Fourier
transform infrared (ATR-FTIR) spectroscopy to show that the phosphate adsorption
mechanism on ferrihydrite was a non-protonated, binuclear complex at pH greater than or
equal to 7.5 and was a protonated, inner-sphere complex at sorption levels between 0.38
and 2.69 µM P/m2 from pH 4 to 6. Goethite, lepidocrocite, and hematite were all found
to form bidentate, binuclear complexes with phosphate, though the possibility of a
monodentate, mononuclear complex on goethite surfaces was not ruled out.
Goldberg and Sposito (1985) cited several lines of evidence for a ligand exchange
mechanism including hydroxyl release, adsorption and desorption kinetics, and
stereochemical calculations as well as spectroscopic evidence. A bidentate complex on
goethite was suggested on the basis of their IR data; however, it was noted that the
addition of water to the system may favor a monodentate complex. Phosphate was also
observed to behave very differently than other ions that are not specifically adsorbed,
particularly chloride. At a pH higher than the point of zero charge of a given iron oxide,
chloride sorption does not occur to any significant extent because the interaction is
entirely electrostatic. Phosphate can by sorbed by iron oxides at pH levels above the
PZC, however.

17
Table 1.1. Summary of previously determined phosphate adsorption capacities. Mineral P adsorption capacity (µM/m2) Reference Hematite 0.2 – 1.7 (1 day) Torrent, 1994 0.8 – 4 .1 (75 days) Torrent, 1994 2.6 (average) Torrent, 1994 2.1 – 2.4 Borggaard, 1983 HFO gel 643 – 1020 Ryden et al., 1977a Goethite ~2.5 Strauss et al., 1997 2.1 – 2.6 Borggaard, 1983 Maghemite 1.8 – 3.0 Borggaard, 1983 Akaganeite 6.2 Borggaard, 1983 Lepidocrocite 2.4 – 2.5 Borggaard, 1983 Feroxyhite 2.5 Borggaard, 1983 Amorphous Iron Oxides 3.1 Borggaard, 1983
Phosphate sorption by soils and pure mineral phases occurs in two distinct steps -
rapid adsorption taking place during the first few minutes of the reaction followed by a
slower stage (Reddy et al., 1999; Strauss et al., 1997; McLaughlin et al., 1977). Barrow
et al. (2000) proposed that lag times seen in experiments were due to variations in the soil
to solution ratio. Nooney et al. (1996) conducted sorption experiments of PO43- on
hematite under vacuum and observed very rapid adsorption within the first ten minutes,
followed by surface precipitation after 20 minutes. Crosby et al. (1984) found that
phosphate adsorption by iron hydroxides in estuaries obeyed first- and second order rate
expressions and that the adsorption rates were highly dependent upon the age of the
precipitate, the initial iron oxidation state, pH, and temperature. Torrent (1997)
summarized several other proposed theories explaining the slow adsorption step. These
include the initial formation of mononuclear complexes and rearrangement to form
binuclear complexes, replacement of silicate in the sorbent, competing anions on the
surface, and surface precipitation processes. Slow adsorption increases with specific
surface area, micro- and meso-porosity, and ferrihydrite impurities (Strauss et al., 1997;
Torrent 1997; Torrent et al., 1994), and has also been attributed to diffusion of phosphate
into the structural pores and defects of soil minerals (Ryden et al. 1977c). This slow
sorption has also been associated with the irreversibility of phosphate retention by soils
and pure iron oxides (Madrid and DeArambarri, 1985; Ryden and Syers, 1977).
The phosphate adsorption capacity of iron oxides generally averages 2.5 µM P/m2
and ranges from 1.5 to 3.5 µM/m2 (Reddy et al., 1999; Torrent 1997; Enyard, 1994;

18
Torrent et al., 1990; Borggaard, 1983). The findings of several previous studies are
summarized in Table 1. Torrent et al. (1994) found phosphate adsorption by natural
hematite specimens increased between 1 and 75 days. They also observed that hematite
had a lower affinity for phosphate and thus, a slower reaction rate than goethite.
McLaughlin et al. (1981) found that hematite, goethite, ferric hydroxide gel, and dried
ferric hydroxide gel all had very high affinities for phosphate with maxima of 6.9, 6.1,
6.9, and 4.8 µM/m2, respectively. The unusually high capacity of hematite in comparison
to goethite was attributed to variations during mineral synthesis, particularly the lack of a
sufficient crystallization period. In a study by Strauss et al. (1997), P adsorption on
crystalline goethite (surface area = 18 m2/g) had a sorption capacity near 2.5 µM P/m2
and was complete within a day. Several other less crystalline goethite samples reacted as
long as 3 weeks and exceeded the 2.5 µM P/m2 adsorption capacity. Borggaard (1983)
listed the ranges of phosphate adsorption by several iron oxides; overall, sorption ranged
from 1.8 to 6.2 µM P/m2.
Phosphate adsorption by synthetic and naturally occurring iron oxides has been
described by Langmuir and Freundlich isotherms, each of which with limitations
(Golterman, 1995). McLaughlin et al. (1977) and Ryden et al. (1977a) used three
separate Langmuir isotherms to describe different regions of an adsorption curve of
phosphate on ferric hydroxide gel. The first two regions (I and II) occurred at lower
equilibrium concentrations and were attributed to chemisorption, or ligand exchange;
region III was thought to be a more physical, ‘potential-determining’, sorption. It was
also noted that the equilibration time had significant influence on sorption in region I, the
steepest section of the adsorption curve, leading to increased sorption with time. Even
after 28 d sorption continued in region I, increasing the H-type character of the
adsorption curve, whereas regions II and III achieved equilibrium in less than a day.
These authors found that sorption by ferric hydroxide gel did not conform to first order
kinetics under the experimental conditions and that extractable phosphate decreased with
reaction time, suggesting that increased ligand exchange was the result of diffusion into
the gel. Ryden et al. (1977c) also observed that increases in ionic strength or decreases in
pH amplified the H-type character of the adsorption isotherm. Torrent et al. (1994) fit
19
sorption by hematite with a Freundlich isotherm modified with a time function. The
initial fast reaction was observed to take less than a day.
Surface area, crystallinity, and morphology of iron oxides are the best indicators
of phosphorus retention capacities and adsorption kinetics. Often a linear relationship is
observed between surface area and adsorption capacity (Enyard, 1993). Colombo et al.
(1994) found adsorption on hematite ranged from 0.31 to 2.27 µM P/m2 and this range
was attributed to variations in crystal size and morphology. More platy hematite crystals
diminish the proportion of binding sites (i.e., increased proportion of the chemically inert
[001] plane), decreasing the overall phosphate sorption capacity. Torrent et al. (1994)
also found sorption capacities of natural hematite, ranging from 0.8 to 4.1 µM P/m2, to be
influenced by crystal morphology. This study also noted that sorption by hematite
specimens exhibited a similar average to that of goethite, but it was much more
inconsistent due to the high degree of variability among hematite samples. Ainsworth et
al. (1985) found that aluminum substitution in goethite led to decreased crystal size,
increased surface area, and increased phosphate adsorption.
Solution pH has been found to influence which metal oxides will preferentially
sorb phosphate; it will also determine the extent, rate, and mechanism of adsorption by
iron oxides. In acidic soils, phosphate is most likely to be sorbed by amorphous iron or
aluminum oxides, while in more alkaline soils, phosphate is generally associated with
calcium and magnesium carbonates. Since the sorption capacity of CaCO3 is quite low,
this association has been credited to ferrihydrite impurities within the mineral
(McLaughlin et al., 1981) or, more probable, the formation of Ca-phosphate minerals. In
general, it appears that phosphorus sorption by ferric oxides decreases with increasing pH
(Figure 3) (Geelhoed, 1997; Willett and Cunningham, 1983; Ryden et al., 1977b;
McLaughlin et al., 1977; and Hingston et al., 1972). Strauss et al. (1997) found P
adsorption onto goethite is greatest at pH 2 and that pH was particularly important during
the initial fast reaction, with high pH slowing the reaction kinetics. Shang et al. (1992)
examined the kinetics and overall adsorption of phosphate by amorphous iron precipitates
and also found that as pH increased sorption decreased with the most prominent
difference in the fast adsorption step, defined as 0.5 h. The authors also found that total
phosphate sorption decreased with pH and attributed this occurrence to the presence of
20
fewer fully protonated (i.e, water) leaving groups, which are preferred over hydroxyl
groups. Torrent (1997) stated that phosphate formed mono- and bi-nuclear complexes on
goethite at low pH and binuclear complexes were only predominant near neutral or
higher pH. Arai and Sparks (2001) found phosphate sorption on ferrihydrite decreased
with pH from 3.5 to 9. Arai and Sparks (2001) also noted that at pH greater than 7.5,
phosphate formed non-protonated, bidentate, binuclear complexes on ferrihydrite, while
from pH 4 to 6 their evidence suggested the presence of protonated complexes.
Ionic strength and competition with other ions also influence phosphate retention.
Ryden et al. (1977c) and McLaughlin et al. (1977) found P adsorption onto ferric
hydroxide gel to increase with ionic strength. Ryden et al. (1977c) also noted that the
ionic strength effects on chemisorption were predominantly kinetic and that the effects on
physical adsorption were absolute. The authors attributed this behavior to the decreased
thickness of the diffuse layer with increased ionic strength, which would result in an
increased concentration of ions in the diffuse layer. Arai and Sparks (2001) found that
from pH 4 to 7.5, phosphate adsorption on ferrihydrite was unaffected by changes in
ionic strength; however, at pH greater than 7.5, adsorption increased with ionic strength.
Celi et al. (2000) observed increased phosphorus sorption by goethite with ionic strength
in agreement with Ryden et al. (1977c). However, Geelhoed et al. (1997) found that
increasing the ionic strength at low pH resulted in lower phosphate adsorption, but at
higher pH an increase in sorption was observed. Rietra et al. (2001) examined the
influence of calcium on phosphate adsorption by soils and goethite and found that at high
pH and at high concentrations of calcium, phosphate will be more strongly retained.

21
pH
2 4 6 8 10 12 140
20
40
60
80
100
Figure 1.4. Example of an experimental adsorption envelope for goethite (Hingston et al., 1972).
µM PO4 sorbed/ g goethite
µM P
O4 s
orbe
d/ g
goe
thite

22
Organic ligands are ubiquitous in soils and sediments and must not be ignored
when considering phosphate dynamics. Plants will often respond to phosphate deficiency
by releasing various organic ligands as root exudates, which make phosphate available by
promoting dissolution of phosphate minerals or desorption from iron oxides (Geelhoed et
al., 1999). The relationship between plant exudates and phosphate release has led to
studies of the competition of citrate and phosphate for sorption sites on goethite. Citrate
causes partial desorption of phosphate below pH 7, with the greatest effect at pH 4.5 to 5
(Geelhoed et al. 1999). Additionally, phosphate decreased citrate sorption over the entire
pH range (2 to 10) studied. In contrast, particulate organic matter did not hinder
phosphate adsorption to iron oxides in soils and would likely increase phosphate sorption
by inhibiting crystallization of iron and aluminum oxides (Borggaard et al., 1990).
Nevertheless, organic matter in solution could possibly inhibit sorption due to
competition for sorption sites. Gerke (1993) examined phosphate retention by iron oxide
mixtures in the presence of humic acids, which were found to reduce sorption initially.
However, sorption increased in long-term trials due to inhibition of iron oxide
crystallization by the formation of Fe-organic complexes. This study also observed that
sorption of phosphate by iron oxides decreased with aging when no humic substances
were present and that humic-Al or –Fe complexes exhibited higher phosphate sorption
capacities than the metal oxides alone.
VI. Need and Research Objectives
Many studies have discounted iron oxides as playing a significant role in
phosphate retention under anoxic conditions, suggesting phosphate will be released to
solution upon the reductive dissolution of the iron oxides or iron (ferric) phosphates.
However, Patrick and Khalid (1974) observed that anaerobic soils would release
phosphate to solutions having low initial phosphate concentrations, but the same soils
would also retain more phosphate from solutions with high initial concentrations than
their aerobic counterparts. The authors postulated that reductive dissolution of iron
oxides and the precipitation of ferrous minerals with high surface areas led to increased P
adsorption capacity, but that P would be less tightly held than in the aerobic environment.
Willett and Higgens (1978) examined reduced and re-oxidized rice soils and found
23
phosphate to be controlled by clays in the non-flooded soils, but by both ferric and
ferrous iron oxides in the seasonally flooded soils. These authors also observed increases
in phosphate adsorption capacity with flooding, which were correlated to oxalate
extractable iron. Upon drainage, the phosphate sorption capacity quickly decreased, but
still remained higher than the original level. The authors felt the ferrous hydroxides
produced under reducing conditions were likely to have higher surface areas than the
crystalline oxides present in the original soil. During re-oxidation, ferrous hydroxides
would convert to ferric phases, but with less crystallinity than the original materials.
Holford and Patrick (1979) examined the effect reduction and pH changes have
on phosphate sorption and mobility in acidic soils. They observed that anaerobic soils
could retain appreciable amounts of phosphate, owing to the precipitation of ferrous
phosphates and to sorption onto freshly precipitated ferrous hydroxides. Manahan (1994)
also observed that if phosphate concentrations are high in solution, iron, manganese, and
calcium minerals were all capable of sorbing phosphate even in anaerobic conditions.
Roden and Edmunds (1997) conducted several experiments in naturally anoxic lakes,
wetlands, and coastal marine sediments. Their findings indicated that large amounts of
phosphate released due to reductive dissolution of ferric phases were subsequently
retained by Fe2+ hydroxide phosphate complexes or ferrous phosphate minerals. The
authors also noted that if sulfate reduction was favored, Fe2+ would be sequestered in iron
sulfides and that phosphate would be released. Thus, P retention in anaerobic
environments is complex and site specific. Accordingly, the goal of this study is to
elucidate the binding capacity of phases common to anaerobic environments for
phosphate retention. Specifically, we investigate phosphate sorption on a number of
biogenic ferrous-bearing minerals that may be formed by microbial reduction of ferric
oxides and hydroxides in anaerobic environments (Fredrickson et al., 1998; Zachara et
al., 1998). Identified ferrous phases include siderite, vivianite, magnetite, and green rust.
Characterizing phosphate retention by these minerals is important since
microbially and chemically induced mineral transformations within soils, sediments, and
riparian zones can have a substantial influence on the mobility of phosphate, other
nutrients, and contaminants (Loyaux-Lawniczak et al., 2000; Erbs et al., 1999; Myneni et
al., 1997; and Hansen et al., 1996). Riparian zones are often important in determining the
24
behavior of contaminants in freshwater systems, since these areas can be pathways
between surface run-off and rivers. The changing oxidation – reduction conditions in
riparian zones will dictate the formation of specific iron minerals, partially through
biogenic processes. The results from this study will help determine how nutrients,
specifically phosphate, interact with iron phases in suboxic environments. This research
will also help to characterize interaction between iron and phosphate in riparian systems,
which will lead to a better understanding of the fate and transport of phosphate in the
freshwater environment. Knowledge of the extent of phosphate retention by mixed and
reduced iron minerals will also have implications in nutrient management from an
agricultural standpoint, particularly with respect to fields subjected to periodic flooding.
Alteration between oxic and suboxic conditions could lead to formation of the mixed and
reduced iron minerals formed and these phases will need to be considered when making
decisions about nutrient management and when evaluating phosphate dynamics in a
system.
The specific objectives of the first part of this study are (1) to determine
phosphate sorption capacities of siderite, magnetite, and sulfate green rust and compare
retention to that of lepidocrocite, goethite-coated sand, ferrihydrite-coated sand, and
ferrihydrite slurry, (2) to determine the influence of pH and ionic strength on retention
capacity, and (3) to compare phosphate sorption behavior on natural magnetite and
siderite to synthetic specimens. Sorption isotherms were determined using batch
experiments allowed to react for 48 h. Initial phosphate concentrations ranged from 10 to
1500 µM, with the pH adjusted to 7 and ionic strength to 0.1 M. Ionic strength effects
and pH effects were evaluated using 100 µM phosphate solutions.
The second component of this project examines phosphate retention under flow
through heterogeneous and homogenous mixtures of iron phases. A total of six
hydrodynamic column experiments were run. Three were anoxic and three were oxic.
The three oxic columns all contained only one iron phase, ferrihydrite-coated sand, and
two of the columns were replicates that were not buffered while the third column was
buffered. The three anoxic columns all consisted of heterogeneous mixtures of iron
oxides and hydroxides. In two of the anaerobic columns the iron reducing bacteria
Shewanella putrefaciens (CN 32) was used to facilitate the conversion of ferrihydrite to

25
magnetite, siderite, green rust, lepidocrocite, and goethite. Ferrous chloride was used to
drive magnetite precipitation in the third anoxic column.
The flow experiments are necessary in order to evaluate phosphate retention
dynamics under more realistic conditions. The specific objectives of the second section
of this project were to compare the phosphate adsorption of minerals in static and flow
conditions. The retention time and capacity of the columns were also examined; in
addition to assessing which iron phases were responsible for phosphate retention within
the columns. These experiments were also used to determine what other factors are
likely to influence phosphate retention in hydrodynamic systems.

26
REFERENCES
Ainsworth, C.C., M.E. Sumner, and V.J. Hurst. 1985. Effect of Aluminum Substitution in Goethite on Phosphorus Adsorption: I Adsorption and Isotopic Exchange. Soil Sci. Soc. Am. J. 49:1142-1153.
Arai, Y., and D.L. Sparks. 2001. ATR-FTIR spectroscopic investigation on phosphate
adsorption mechanisms at the ferrihydrite-water interface. J. Colloid Interface Sci. 241:317-326.
Barrow, N.J., H.C.B. Hansen, P.E. Hansen, and J. Magid. 2000. A note on the description
of phosphate sorption. European J. Soil Sci. 51:531-535. Benjamin, M.M. 2002. Water Chemistry. McGraw-Hill Higher Education, New York. Berner, E.K., and R.A. Berner. 1996. Global Environment: Water, Air, and Geochemical
Cycles Prentice Hall, Upper Saddle River, NJ. Blanchar, R.W., and M.D. Frazier. 1991. Soil model of iron phosphate solubility. Dev.
Plant Soil Sci. 45:99-105. Borggaard, O.K. 1983. Effect of surface area and mineralogy of iron oxides on their
surface charge and anion-adsorption. Clays Clay Miner. 31:230-232. Borggaard, O.K., S.S. Jorgensen, J.P. Moberg, and B. Raben-Lange. 1990. Influence of
organic matter on phosphate adsorption by aluminum and iron oxides in sandy soils. J. Soil Sci. 41:443-449.
Boughriet, A., R.S. Figueiredo, J. Laureyns, and P. Recourt. 1997. Identification of newly
generated iron phases in recent anoxic sediments: 57Fe Mossbauer and microRaman spectroscopic methods. J. Chem. Soc, Faraday Trans. 93:3209-3215.
Brady, N.C., and R.R. Weil. 1999. The Nature and Properties of Soils. Twelfth ed.
Prentice Hall, Upper Saddle River, NJ. Bridgham, S.D., C.A. Johnston, J.P. Schubauer-Berigan, and P. Weishampel. 2001.
Phosphorus sorption dynamics in soils and coupling with surface and pore water in riverine wetlands. Soil Sci. Soc. Am. J. 65:577-588.
Carlyle, G.C., and A.R. Hill. 2001. Groundwater phosphate dynamics in a river riparian
zone: effects of hydrologic flowpaths, lithology and redox chemistry. J. Hydrol. 247:151-168.
Celi, L., E. Barberis, and F.A. Marsan. 2000. Sorption of phosphate on goethite at high
concentrations. Soil Sci. 165:657-664.

27
Colombo, C., V. Barron, and J. Torrent. 1994. Phosphate adsorption and desorption in relation to morphology and crystal properties of synthetic hematites. Geochim. Cosmochim. Acta 58:1261-1269.
Cornell, R.M., and U. Schwertmann. 1996. The iron oxides: structure, properties,
reactions, occurrences and uses Weinhein: VCH, New York. Crosby, S.A., G.E. Millward, E.I. Butler, D.R. Turner, and M. Whitfield. 1984. Kinetics
of phosphate adsorption by iron oxyhydroxides in aqueous systems. Estuarine Coastal Shelf Sci. 19:257-270.
Darland, J.E., and W.P. Inskeep. 1997. Effects of pH and phosphate competition on the
transport of arsenate. J. Environ. Qual. 26:1133-1139. DeBusk, W.F., K.R. Reddy, M.S. Koch, and Y. Wang. 1994. Spatial distribution of soil
nutrients in a northern Everglades marsh: water conservation area 2A. Soil Sci. Soc. Am. J. 58:543-552.
DeBusk, W.F., S. Newman, and K.R. Reddy. 2001. Spatio-temporal patterns of soil
phosphorus enrichment in Everglades Water Conservation Area 2A. J. Environ. Qual. 30:1438-1446.
DeMello, J.W.V., V. Barron, and J. Torrent. 1998. Phosphorus and iron mobilization in
flooded soils from Brazil. Soil Sci. 163:122-132. Deng, Y., and W. Stumm. 1994. Reactivity of aquatic iron (III) oxyhydroxides--
implications for redox cycling of iron in natural waters. Appl. Geochem. 9:23-36. Diaz, O.A., D.L. Anderson, and E.A. Hanlon. 1993. Phosphorus Mineralization from
Histosols of the Everglades Agricultural Area. Soil Sci. 156:178-185. Enyard, A. 1994. Relationship of well- and poorly crystallized iron oxides with
phosphate and water retention by soils, a review. Mineral. Petrol. Acta 36:343-350.
Erbs, M., H.C.B. Hansen, and C.E. Olsen. 1999. Reductive dechlorination of carbon
tetrachloride using iron(II) iron(III) hydroxide sulfate (Green Rust). Environ. Sci. Technol. 33:307-311.
Filippelli, G.M., and C. Souch. 1999. Effects of climate and landscape development on
the terrestrial phosphorus cycle. Geology 27:171-174. Fisher, M.M., and K.R. Reddy. 2001. Phosphorus flux from wetland soils affected by
long-term nutrient loading. J. Environ. Qual. 30:261-271.

28
Fredrickson, J.K., J.M. Zachara, D.W. Kennedy, H. Dong, T.C. Onstott, N.W. Hinman, and S.M. Li. 1998. Biogenic iron mineralization accompanying the dissimilatory reduction of hydrous ferric oxide by a groundwater bacterium. Geochim. Cosmochim. Acta 62:3239-3257.
Geelhoed, J.S., T. Hiemstra, and W.H. VanRiemsdijk. 1997. Phosphate and sulfate
adsorption on goethite: single anion and competitive adsorption. Geochim. Cosmochim. Acta 61:2389-2396.
Geelhoed, J.S., W.H. VanRiemsdijk, and G.R. Findenegg. 1999. Simulation of the effect
of citrate on exudation from roots on the plant availability of phosphate adsorbed on goethite. Eur. J. Soil Sci. 50:379-390.
Gerke, J. 1993. Phosphate adsorption by humic/Fe-oxide mixtures aged at pH 4 and 7 and
by poorly ordered Fe-oxide. Geoderma 59:279-288. Goldberg, S., and G. Sposito. 1985. On the mechanism of specific phosphate adsorption
by hydroxylated mineral surfaces: A review. Commun. Soil Sci. Plant Anal. 16:801-821.
Golterman, H.L. 1995. The role of the iron-hydroxide-phosphate-sulfide system in the
phosphate exchange between sediments and overlying water. Hydrobiologia 297:43-54.
Golterman, H.L. 1999. Quantification of P-flux through shallow, agricultural and natural
waters as found in wetlands of the Camargue, (S. France). Hydrobiologia 392:29-39.
Hansen, H.C.B., C.B. Koch, H. Nancke-Krogh, O.K. Borggaard, and J. Sorensen. 1996.
Abiotic Nitrate Reduction to Ammonium: Key Role of Green Rust. Environ. Sci. Technol. 30:2053-2056.
Hingston, F.J., A.M. Posner, and J.P. Quirk. 1972. Anion adsorption by goethite and
gibbsite. I. The role of the proton in determining adsorption envelopes. J. Soil Sci. 23:177-192.
Holford, I.C.R., and W.H. Patrick Jr. 1979. Effects of reduction and pH changes on
phosphate sorption and mobility in an acid soil. Soil Sci. Soc. Am. J. 43:292-297. Hongshao, Z., and R. Stanforth. 2001. Competitive adsorption of phosphate and arsenate
on goethite. Environ. Sci. Technol. 35:4753-4757. Huang, P.M., and M.K. Wang. 1997. Formation Chemistry and Selected Surface
Properties of Iron Oxides. Adv. GeoEcology 30:241-270.
29
Jackson, B.P., and W.P. Miller. 2000. Effectiveness of phosphate and hydroxide for desorption of arsenic and selenium species from iron oxides. Soil Sci. Soc. Am. J. 64:1616-1622.
Jain, A., and R.A. Loeppert. 2000. Effect of competing anions of the adsorption of
arsenate and arsenite by ferrihydrite. J. Environ. Qual. 29:1422-1430. Langmuir, D. 1997. Aqueous Environmental Geochemistry. Prentice Hall, Upper Saddle
River, NJ. Loyaux-Lawniczak, S., P. Refait, J.-J. Ehrhardt, P. Lecomte, and J. Genin. 2000.
Trapping of Cr by formation of ferrihydrite during the reduction of chromate ions by Fe(II) and Fe(III) Hydroxysalt Green Rusts. Environ. Sci. Technol. 34:438-443.
Madrid, L., and P. DeArambarri. 1985. Adsorption of phosphate by two iron oxides in
relation to their porosity. J. Soil Sci. 36:523-530. Manahan, S.E. 1994. Environmental Chemistry. 6th ed. Lewis Publishers, Boca Raton,
FL. McBride, M.B. 1994. Environmental Chemistry of Soils. Oxford Univeristy Press, New
York. McLaughlin, J.R., J.C. Ryden, and J.K. Syers. 1977. Development and evaluation of a
kinetic model to describe phosphate sorption by hydrous ferric oxide. Geoderma 18:295-307.
McLaughlin, J.R., J.C. Ryden, and J.K. Syers. 1981. Sorption of inorganic phosphate by
iron- and aluminum-containing components. J. Soil Sci. 32:365-377. Moore, P.A.J., and K.R. Reddy. 1994. Role of Eh and pH on phosphorus geochemistry in
sediments of Lake Okeechobee, Florida. J. Environ. Qual. 23:955-964. Myneni, S.C.B., T.K. Tokunaga, and G.E. Brown, Jr. 1997. Abiotic selenium redox
transformations in the presence of Fe(II,III) oxides. Science 278:1106-1109. Noe, G.B., D.L. Childers, and R.D. Jones. 2001. Phosphorus biogeochemistry and the
impact of phosphorus enrichment: Why is the Everglades so unique? Ecosystems 4:603-624.

30
Nooney, M.G., T.S. Murrell, J.S. Corneille, E.I. Rusert, L.R. Hossner, and D.W. Goodmand. 1996. A spectroscopic investigation of phosphate adsorption onto iron oxides. J. Vac. Sci. Technol. 14:1357-1361.
O'Reilly, S.E., D.G. Strawn, and D.L. Sparks. 2001. Residence time effects on arsenate
adsorption/desorption mechanisms on goethite. Soil Sci. Soc. Am. J. 65:67-77. Olila, O.G., and K.R. Reddy. 1995. Influence of pH on Phosphorus Retention in Oxidized
Lake Sediments. Soil Sci. Soc. Am. J. 59:946-959. Olila, O.G., and K.R. Reddy. 1997. Influence of redox potential on phosphate uptake by
sediments in two sub-tropical eutrophic lakes. Hydrobiologia 345:45-57. Pant, H.K., and K.R. Reddy. 2001a. Hydrologic influence on stability of organic
phosphorus in wetland detritus. J. Environ. Qual. 30:668-674. Pant, H.K., and K.R. Reddy. 2001b. Phosphorus sorption characteristics of estuarine
sediments under different redox conditions. J. Environ. Qual. 30:1474-1480. Parfitt, R.L., R.J. Atkinson, and R. St.C.Smart. 1975. The mechanism of phosphate
fixation by iron oxides. Soil Sci. Soc. Am. J. 39:837-841. Parfitt, R.L., and J.D. Russell. 1977. Adsorption on hydrous oxides. IV. Mechanisms of
adsorption of various ions on goethite. J. Soil Sci. 28:297-305. Patrick Jr., W.H., and R.A. Khalid. 1974. Phosphate release and sorption by soils and
sediments: effect of aerobic and anaerobic conditions. Science 186:53-55. Persson, P., N. Nilsson, and S. Sjoberg. 1996. Structure and bonding of orthophosphate
ions at the iron oxide-aqueous interface. J. Colloid Interface Sci. 177:263-275. Peryea, E.J., and Kammereck. 1997. Phosphate-enhanced movement of arsenic out of
lead-arsenate contaminated topsoil and through uncontaminated subsoil. Water Air Soil Pollut 93:243-254.
Quang, V.D., and J.E. Dufey. 1997. Phosphate desorption from flooded and reoxidized
soils as compared with adsorption characteristics. Commun. Soil Sci. Plant Anal. 28:885-898.
Randall, S.R., D.M. Sherman, and K.V. Ragnarsdottir. 2001. Sorption of As(V) on green
rust (Fe4(II)Fe2(III)(OH)12·3H2O) and lepidocrocite (β-FeOOH): Surface complexes from EXAFS spectroscopy. Geochim. Cosmochim. Acta 65:1015-1023.
Reddy, K.R., R.H. Kadlec, E. Flaig, and P.M. Gale. 1999. Phosphorus retention in
streams and wetlands-a review. Crit. Rev. Environ. Sci. Technol. 29:86-146.
31
Reynolds, J.G., D.V. Naylor, and S.E. Fendorf. 1999. Arsenic sorption in phosphate-amended soils during flooding and subsequent aeration. Soil Sci. Soc. Am. J. 63:1149-1156.
Rietra, R.P.J.J., T. Hiemstra, and W.H. VanRiemsdijk. 2001. Interaction between calcium
and phosphate adsorption on goethite. Environ. Sci. Technol. 35:3369-3374. Roden, E.E., and J.W. Edmonds. 1997. P mobilization in Fe-rich anaerobic sediments.
Microbial Fe(III) oxide reduction versus iron-sulfide formation. Arch. Hydrobiol. 139:347-378.
Ryden, J.C., J.R. McLaughlin, and J.K. Syers. 1977a. Mechanisms of phosphate sorption
by soils and hydrous ferric oxide gel. J. Soil Sci. 28:72-92. Ryden, J.C., J.R. McLaughlin, and J.K. Syers. 1977b. Time-dependant sorption of
phosphate by soils and hydrous ferric oxides. J. Soil Sci. 28:585-595. Ryden, J.C., J.K. Syers, and J.R. McLaughlin. 1977c. Effects of ionic strength on
chemisorption and potential-determining sorption of phosphate by soils. J. Soil Sci. 28:62-71.
Ryden, J.C., and J.K. Syers. 1977. Desorption and isotopic exchange relationships of
phosphate sorbed by soils and hydrous ferric oxide gel. J. Soil Sci. 28:596-609. Schlesinger, W.H. 1991. Biogeochemistry: An Analysis of Global Change. Academic
Press, Inc., San Diego. Schwertmann, U., and R.M. Taylor. 1977. Iron Oxides, p. 145, In J. B. Dixon and S. B.
Weed, eds. Minerals in Soil Environments. Soil. Sci. Soc. Am. J., Madison, WI. Shang, C., J.W.B. Stewart, and P.M. Huang. 1992. pH effect on kinetics of adsorption of
organic and inorganic phosphates by short-range ordered aluminum and iron precipitates. Geoderma 53:1-14.
Slomp, C.P., S.J. Van der Gaast, and W. Van Raaphorst. 1996. Phosphorus binding by
poorly crystalline iron oxides in North Sea sediments. Mar. Chem. 52:55-73. Sparks, D.L. 1995. Environmental Soil Chemistry. Harcourt Brace and Company, San
Diego, CA. Strauss, R., G.W. Bruemmer, and N.J. Barrow. 1997. Effects of crystallinity of goethite
II: Rates of sorption and desorption of phosphate. Eur. J. Soil Sci. 48:101-114. Stumm, W., and J.J. Morgan. 1981. Aquatic Chemistry: An Introduction Emphasizing
Chemical Equilibria in Natural Waters. 2nd ed. John Wiley & Sons, Inc., Toronto.

32
Stumm, W., and B. Sulzberger. 1992. The cycling of iron in natural environments: Considerations based on laboratory studies of heterogeneous redox processes. Geochim. Cosmochim. Acta 56:3233-3257.
Stumm, W. 1992. Chemistry of the Solid-Water Interface: Processes at the Mineral-
Water and Particle-Water Interface in Natural Systems. John Wiley & Sons, Inc., New York.
Su, C., and R.W. Puls. 2001. Arsenate and arsenite removal by zerovalent iron: Effects
of phosphate, silica, carbonate, borate, sulfate, chromate, molybdate, and nitrate, relative to chloride. Environ. Sci. Technol. 35:4562-4568.
Szilas, C.P., O.K. Borgaard, and C.B. Hansen. 1998. Potential iron and phosphate
mobilization during flooding of soil material. Water Air Soil Pollut 106:97-109. Torrent, J., V. Barron, and U. Schwertmann. 1990. Phosphate adsorption and desorption
by goethites differing in crystal morphology. Soil Sci. Soc. Am. J. 54:1007-1012. Torrent, J., U. Schwertmann, and V. Barron. 1994. Phosphate sorption by natural
hematites. Eur. J. Soil Sci. 45:45-51. Torrent, J. 1997. Interactions between phosphate and iron oxide. Adv. GeoEcology
30:321-344. Willett, I.R., and M.L. Higgins. 1978. Phosphate sorption by reduced and reoxidized rice
soils. Aust. J. Soil Res. 16:319-326. Willett, I.R., and R.B. Cunningham. 1983. Influence of sorbed phosphate on the stability
of ferric hydrous oxide under controlled pH and Eh conditions. Aust. J. Soil Res. 21:301-308.
Williams, J.D.H., J.K. Syers, S.S. Shukla, and R.F. Harris. 1971. Levels of inorganic and
total phosphorus in lake sediments as related to other sediment parameters. Environ. Sci. Technol. 5:1113-1120.
Wright, A.L., and K.R. Reddy. 2001. Phosphorus loading effects on extracellular enzyme
activity in Everglades wetland soils. Soil Sci. Soc. Am. J. 65:588-595. Young, E.O., and D.S. Ross. 2001. Phosphate release from seasonally flooded soils: A
laboratory microcosm study. J. Environ. Qual. 30:91-101. Zachara, J.M., J.K. Fredrickson, S.M. Li, D.W. Kennedy, S.C. Smith, and P.L. Gassman.
1998. Bacterial reduction of crystalline Fe3+ oxides in single phase suspensions and subsurface materials. Am. Mineral. 83:1426-1443.
Zachara, J.M., R.K. Kukkadapu, J.K. Fredrickson, Y.A. Gorby, and S.C. Smith. 2002.
Biomineralization of Poorly Crystalline Fe(III) Oxides by Dissimilatory Metal Reducing Bacteria (DMRB). Geomicrobiol. J. 19:179-207.

33

33
CHAPTER 2
Phosphate Adsorption by Mixed and Reduced Iron Minerals Under Static Conditions
INTRODUCTION I. Importance and cycling of phosphate
Phosphorus (P) availability is an important factor in biogeochemical cycling and
is often the limiting nutrient in freshwater and estuarine ecosystems (Reddy et al., 1999).
It is a macronutrient required by plants and animals and is a critical component in DNA,
RNA, ATP, and phospholipids (Schlesinger, 1991). Too little available P in agricultural
systems can result in poor productivity and crop failure. Conversely, increased P input to
fresh or saltwater systems via erosion can lead to large algal blooms and subsequent
eutrophication of water bodies (Brady and Weil, 1999). Noe et al. (2001) have recently
documented that even small P increases due to increased agricultural runoff in the
Everglades appears to be altering species distribution and, subsequently, the ecology of
the system.
The ultimate source of P to the biosphere is weathering of rocks, and the amount
required for biological production is much greater than the amount released by
weathering. This deficit results in P being highly conserved and rapidly cycled within the
biosphere (Filippelli and Souch, 1999; Berner and Berner, 1996). Vegetation, periphyton,
plankton, and microbes all act as biotic phosphorus sinks. However, biotic cycling is not
without P loss to abiotic mechanisms, including adsorption by soils and sediments,
mineral precipitation, and sedimentation. Minerals controlling P in soils and sediments
include apatite, hydroxyapatite, fluorapatite, octocalcium phosphate, strengite, vivianite,
variscite, and wavellite (Reddy et al., 1999). Phosphorus adsorption by soils and lake
sediments has often been correlated to amorphous iron, aluminum, and manganese oxides
and hydroxides, as well as calcium and magnesium (Brady and Weil, 1999; Reddy et al.,
1999; Torrent, 1997; Golterman 1995; Olila and Reddy, 1995; Blanchar and Frazier,
1991; Williams et al., 1971). The relationship between P and ferric oxides is usually
more apparent in acidic to neutral soils, while in alkaline soils P is often associated with
calcium or magnesium (Reddy et al., 1999).

34
II. Phosphorus retention processes
The prominent correlation between phosphorus retention and iron has led to
numerous examinations of P adsorption capacities and mechanisms onto iron oxides and
hydroxides in aerobic environments. The most commonly studied ferric minerals have
been hematite and goethite since they are the most abundant, although not necessarily the
most reactive, iron minerals found in soils (Torrent et al., 1994; Sparks, 1995).
The mechanism of phosphate adsorption onto ferric oxides is dominated by a
ligand exchange reaction in which two singly coordinated hydroxyls or water molecules
are replaced by a single phosphate anion resulting in the formation of a bidentate,
binuclear complex (Reddy et al., 1999; Torrent, 1997; Colombo et al., 1994; Parfitt and
Russell, 1977; Parfitt et al., 1975). Parfitt et al. (1975) used infrared (IR) spectroscopy to
verify the formation of binuclear complexes on lepidocrocite, goethite, hematite, ferric
hydroxide gels, and β-ferric hydroxide. Arai and Sparks (2001) used attenuated total
reflectance Fourier transform infrared (ATR-FTIR) spectroscopy to show that the P
adsorption mechanism on ferrihydrite was a non-protonated, binuclear complex at pH
greater than 7.5. Binuclear complexes are quite strong and result in slow exchange rates
and an apparent irreversibility of phosphorus adsorption. The strength of these
complexes lead to long-term phosphorus storage in soils, sediments, and wetlands (Reddy
et al., 1999; Parfitt et al., 1975). However, formation of mononuclear complexes cannot
be overlooked. Torrent (1997) stated that P formed mono- and binuclear complexes on
goethite at low pH and binuclear complexes were only predominant near neutral or
higher pH. Nonetheless, it is clear that phosphorus forms very stable surface complexes
on iron (hydr)oxide solids.
Two stages of phosphate sorption transpire. Rapid adsorption takes place during
the first few minutes of the reaction and is followed by a slower stage, which may be
measurable for days to weeks, attributed to diffusion into the solid phase (Reddy et al.,
1999; Strauss et al., 1997; McLaughlin et al., 1977). Torrent (1997) summarized several
other proposed theories explaining the slow adsorption step. These include the initial
formation of mononuclear complexes and rearrangement to form binuclear complexes,
replacement of silicate in the sorbent, competing anions on the surface, and surface
precipitation processes. Slow adsorption increases with specific surface area, micro- and
35
meso-porosity, and ferrihydrite impurities (Strauss et al., 1997; Torrent 1997; Torrent et
al., 1994). This slow sorption has also been associated with irreversible phosphate
retention (Madrid and DeArambarri, 1985).
Phosphate adsorption capacity generally averages 2.5 µmols P/m2 for most iron
oxides, ranges from 1.5 to 3.5 µmols/m2 (Reddy et al., 1999; Torrent 1997; Enyard, 1994;
Torrent et al., 1990; Borggaard, 1983). Surface area and crystallinity are the best
indicators of phosphorus retention capacities (Strauss et al., 1997; Colombo et al., 1994;
Enyard, 1993; Borggaard, 1983; McLaughlin et al., 1981). Phosphate adsorption on
synthetic iron oxides has been described by the Langmuir and Freundlich isotherms
(Miltenburg and Golterman, 1998; Torrent, 1997; Golterman, 1995; Gerke, 1993;
McLaughlin et al., 1977).
Colombo et al. (1994) found adsorption on hematite ranged from 0.31 to 2.27
µmols P/m2 and was described by the Freundlich isotherm. This range was attributed to
variations in crystal morphology and size, and it is supported by the work of Torrent et al.
(1994), where adsorption capacities of natural hematite were reported between 0.8 and
4.1 µmols P/m2. Sorption onto hematite was more variable than onto goethite. The rate
and adsorption capacity of phosphate on goethite is highly dependant on crystallinity
(Strauss et al., 1997). Crystalline goethite with a surface area of 18 m2/g had an
adsorption capacity near 2.5 µmols P/m2, and adsorption was complete within a day.
Several other less crystalline goethite samples reacted as long as 3 weeks and exceeded
the 2.5 µmols P/m2 adsorption capacity.
In general, it appears that phosphorus sorption by ferric hydroxide gel and
goethite decreases with increasing pH (Geelhoed, 1997; Willett and Cunningham, 1983;
Ryden et al., 1977a; McLaughlin et al., 1977; Hingston et al., 1972). Strauss et al. (1997)
found P adsorption is greatest at pH near 2. Shang et al. (1992) suggested pH has an
appreciable influence on reaction rate in the beginning of sorption reactions and noted an
overall decrease in phosphorus adsorption capacity with pH from pH 4 to 6. Strauss et al.
(1997) also observed P sorption onto goethite occurred most rapidly at pH 2 and that pH
was particularly important during the initial fast reaction, with high pH slowing the
reaction kinetics. Shang et al. (1992) examined the kinetics and overall adsorption of
phosphate by amorphous iron precipitates and also found that as pH increased sorption
36
decreased with the most prominent difference in the fast adsorption step, defined as 0.5 h.
The authors also found that total phosphate sorption decreased with pH and attributed this
occurrence to the presence of fewer fully protonated (i.e, water) leaving groups, which
are preferred over hydroxyl groups. Torrent (1997) stated that phosphate formed mono-
and binuclear complexes on goethite at low pH and binuclear complexes were only
predominant near neutral or higher pH. Arai and Sparks (2001) found phosphate sorption
on ferrihydrite decreased with pH from 3.5 to 9. Arai and Sparks (2001) also noted that
at pH greater than 7.5, phosphate formed non-protonated, bidentate, binuclear complexes
on ferrihydrite, while from pH 4 to 6 their evidence suggested the presence of protonated
complexes. Understanding how the sorption characteristics of a given oxide change with
pH is important when considering phosphate cycling. Oxides with well defined, sharp
adsorption envelopes are likely to be more sensitive to pH fluctuations and are less likely
to strongly retain phosphate under changing pH conditions.
Ionic strength may also have an important influence on phosphate retention.
Ryden et al. (1977b) and McLaughlin et al. (1977) found P adsorption onto ferric
hydroxide gel to increase with ionic strength. Arai and Sparks (2001) found that from pH
4 to 7.5, P adsorption on ferrihydrite was unaffected by changes in ionic strength;
however, at pH greater than 7.5, adsorption increased with ionic strength. Work by Celi
et al. (2000) on goethite has shown increased ionic strength results in increased
phosphorus sorption as well. However, Geelhoed et al. (1997) found that increasing the
ionic strength at low pH resulted in lower P adsorption but at higher pH an increase in
sorption was observed.
III. Needs and Research Objectives
Many studies have discounted iron oxides as playing a significant role in P
retention under anoxic conditions, suggesting P will be released to solution upon the
reductive dissolution of the iron (III) oxides or phosphates. However, Patrick and Khalid
(1974) found the adsorption capacity for iron-rich sediments increases under reducing
conditions. They postulated that reductive dissolution of iron oxides and hydroxides and
subsequent precipitation of ferrous minerals with high surface areas increased P
adsorption capacity in an aerobic environment, but that the P would be less tightly held

37
than in the aerobic environment. Thus, there are conflicting sentiments regarding P
retention in anaerobic environments. Accordingly, the goal of this study is to elucidate
the binding capacity of phases common to anaerobic environments for P retention.
Specifically, we investigate P sorption on a number of biogenic ferrous-bearing minerals
that may be formed by microbial reduction of ferric oxides and hydroxides in anaerobic
environments. Identified ferrous phases include siderite, vivianite, magnetite, and green
rust (Fredrickson et al., 1998; Zachara et al., 1998).
Characterizing P retention by these minerals is important since microbially and
chemically induced mineral transformations within soils, sediments, and riparian zones
can have a substantial influence on the mobility of P along with other nutrients, and
contaminants (Loyaux-Lawniczak et al., 2000; Erbs et al., 1999; Myneni et al., 1997; and
Hansen et al., 1996). Riparian zones are often important in determining the behavior of
contaminants in freshwater systems, since these areas can be pathways between surface
run-off and rivers. Changing oxidation – reduction conditions in riparian zones will
dictate the formation of specific iron minerals, partially through biogenic processes.
Results from this study will help determine how phosphate interacts with iron phases in
suboxic environments. More importantly, this study will help to elucidate phosphorus
dynamics within riparian zones, thus improving our understanding of the fate and
transport of phosphate in the freshwater environment. Knowledge of the extent of P
retention by mixed and reduced iron minerals will also have implications in nutrient
management from an agricultural standpoint, particularly with respect to fields subjected
to periodic flooding. Alteration between aerobic and anaerobic conditions could lead to
formation of the mixed and reduced iron minerals and these phases will need to be
considered when making decisions about nutrient management and when evaluating P
dynamics in a system.
The specific objectives of this study are (1) to determine P sorption capacities of
siderite, magnetite, and sulfate green rust and compare retention to that of lepidocrocite,
goethite-coated sand, ferrihydrite-coated sand, and ferrihydrite slurry, (2) to determine
the influence of pH and ionic strength on retention capacity, and (3) to estimate P
sorption within anaerobic and aerobic soils. Sorption isotherms were determined using
batch experiments allowed to react for 48 hours. Initial P concentrations from 10 to 1500

38
µM were evaluated. Ionic strength and pH effects were investigated using 100 µM P
solutions with ionic strength of 0.05 M to 0.1 M and pH from 4.5 to 9.

39
MATERIALS AND METHODS
Batch studies were conducted using several mixed and reduced iron minerals as
sorbents. Natural and synthetic samples of magnetite and siderite were studied in
addition to green rust, ferrihydrite, ferrihydrite coated sand, goethite coated sand, and
lepidocrocite.
I. Mineral preparation
Naturally occurring siderite was purchased from Ward’s Scientific (46E7351,
Antigonish County, Nova Scotia) and naturally occurring magnetite was obtained from
the Stanford University Research Mineral Collection. Synthetic magnetite was purchased
from Aldrich Chemical (1317-61-9). The natural (of geologic origin) magnetite and
siderite samples were crushed and passed through a 250 µm sieve. Both magnetite
samples were treated with 1 M HCl for 1 h to remove oxidized surface constituents,
rinsed three times with anoxic, deionized water and dried using vacuum filtration. The
siderite was treated using 0.05 M HCl for 1 h, rinsed, and dried. All mixed or reduced
iron minerals were stored in an anaerobic glovebox (Coy Products, Ann Arbor, MI)
having O2(g) levels less than 5 ppm.
Synthetic siderite was made inside an anaerobic glovebox using the method
described by Hallbeck et al. (1993). Anoxic water was used to prepare 0.1 M
Fe(NH4)2(SO4)2·6H2O and 0.1 M Na2CO3 solutions. Water was made anoxic by boiling
and bubbling with oxygen-free N2 for 1 h prior to making solutions. A cloudy white
precipitate formed immediately upon the addition of 500 mL of the Na2CO3 solution to
500 mL of the Fe(NH4)2(SO4)2. The solid was allowed to settle, rinsed three times with
anoxic deionized water, and dried using vacuum filtration followed by desiccation.
Ferrihydrite (2-line) was made using the method described by Cornell and
Schwertmann (1996). A ferric chloride solution (2.3 L of 0.062 M FeCl36H2O, pH near
2) was titrated with 0.2 M NaOH to pH 7. The solution was then stirred and allowed to
stabilize for several hours with pH maintained by base addition. Once the solution pH
was stable, the precipitate was allowed to settle and rinsed three times with deionized
water. Ferrihydrite coated sand was made by drying the slurry onto 660 g of Iota 6

40
Quartz Sand (Umimin Corporation). The sand was dried at room temperature, rinsed
several times with deionized water, and dried again.
Goethite was synthesized using a method described by Cornell and Schwertmann
(1996). A 1 M NaHCO3 (110 mL) was added to 1L of 0.5 M FeCl2 4H2O (made with
deoxygenated water) while the latter was stirred and bubbled with N2. Upon addition of
the NaHCO3 the flow of N2 was replaced with air at a rate of 35-40 mL/minute. The
solution was stirred and bubbled for 48 h. When oxidation was complete, solids were
allowed to settle and the supernatant decanted. The remaining slurry was then washed by
suspension in a 0.1 mM NaCl solution followed by centrifugation. This rinse procedure
was repeated a total of five times and after the last rinse the slurry was sonicated for 1 h.
Goethite-coated sand was made by drying the slurry onto 278 g of Iota 6 Quartz Sand
(Umimin Corporation). The sand was dried at room temperature, rinsed several times
with deionized water, and dried again.
Lepidocrocite was synthesized following a method described by Cornell and
Schwertmann (1996). A 0.6 M FeCl2 solution was titrated to pH 6.5 using 1 M NaOH.
Air was then introduced to the solution by bubbling at a rate of ~250 mL/min. The pH
was maintained between 6.3 and 6.5 using 1 M NaOH and the process terminated when
no additional base was necessary to maintain pH.
Sulfate green rust was precipitated using a modification of the method described
in Schwertmann and Fetcher (1994). A 0.5 M ferrous sulfate solution (pH near 3.7) was
prepared using anoxic deionized water. The ferrous sulfate solution was kept in an
anoxic reaction vessel and the pH was brought to 7.1 using 4 N NaOH. Air was then
introduced at 60 mL/min while additions of 4 N NaOH or 1 N HCl were added to
maintain the pH. The reaction was complete when the Eh stabilized.
II. Mineral characterization
X-ray diffraction was carried out using a Rigaku Geigerflex diffractometer
(Model CN2029) with Cu Kα radiation (35 kV, 15 mA). Samples were prepared for
analysis by pressing the powdered mineral material into a 0.5 mm depression on a Rigaku
mono-crystalline silica XRD slide. The synthetic siderite was easily oxidized and thus
the slide needed to be prepared in the glovebox. In order to prevent oxidation during

41
analysis, a small amount of the solid was mixed with glycerol to form a thick paste,
which was then packed into the depressed slide. The sample was analyzed immediately
upon removal from the glovebox.
Specific surface area was determined by N2 adsorption using the BET equation
(Brunauer et al., 1938). The adsorption curves were obtained using a Coulter SA 3100
surface area analyzer. All minerals, except synthetic siderite and sulfate green rust, were
degassed by heating overnight at 85˚C. Contact with the atmosphere was avoided by
maintaining positive pressure (helium) on the sample containers. Excess water was
removed from the synthetic siderite and green rust by dessication under a vacuum for 1
week.
III. Phosphate adsorption experiments
Solutions used to define the adsorption isotherms ranged from 10 µM to 1500 µM
PO4 and were made using Na2HPO4. Ionic strength was adjusted to 0.1 M using NaCl.
The pH was adjusted to 7 using anoxic 0.05 M HCl or 0.05 M NaOH. The pH effects
were evaluated using 100 µM PO43- solutions adjusted to pH 4, 5.5, 7, 8, and 9. Ionic
strength influences were investigated using 100 µM PO43- solutions at pH 7 with the ionic
strength adjusted between 0.1 and 0.005 M. All solutions used with mixed or reduced
iron minerals were made under anaerobic conditions.
All experiments using mixed or reduced iron minerals were prepared in an
anaerobic atmosphere. Acid-cleaned glassware was allowed to equilibrate in the
glovebox at least 12 h before use. Approximately 0.1 g mineral was weighed into 125
mL serum vials, followed by the addition of 100 mL of solution. The supply of green
rust was limited, so about 0.02 g mineral was weighed into a 25 mL serum vial and 15
mL of phosphate solution added. The vials were sealed, removed from the glovebox, and
shaken using an orbital shaker (120 rpm) for 48 h. All samples were run in triplicate,
with the exception of the sulfate green rust, which were run in duplicate. Upon
completion, 8 mL of solution were passed through a 0.45µm filter and acidified using two
drops of HNO3. Starting and ending solutions were analyzed using inductively coupled
plasma-optical emission spectroscopy (ICP-OES). The amount of phosphate adsorbed
was determined from the difference between the initial and final concentrations.
42
IV. Release of sulfate from green rust
Sulfate release from green rust with increasing ionic strength was evaluated by
allowing the mineral to react for 48 h with deionized water and anoxic NaCl solutions
ranging in ionic strength from 0.001 to 0.1 M. Approximately 0.02 g green rust was
weighed into a 25 mL serum vial, 15 mL solution added, and the sample placed on an
orbital shaker (120 rpm). A solution containing only 100 µM NaH2PO4 was also
assessed using the same procedure.
43
RESULTS
I. Adsorption capacities and isotherms
Phosphate adsorption capacities for several minerals were higher than expected.
Adsorption capacities were determined by measuring the amount of phosphate in solution
before and after reaction with a known quantity of mineral. The amount of phosphate
lost from solution was assumed to be adsorbed by the mineral phase. Experimental
adsorption capacities ranged from 4.73 to 10.37.55 µmols PO4/g mineral (Table 2.1).
Goethite coated sand exhibited the lowest adsorption capacity and ferrihydrite the
greatest capacity on a mass basis.
Mineral surface areas ranged from 0.13 to approximately 200 m2/g. On a surface
area basis, sulfate green rust exhibits the greatest capacity for phosphate (343.23 µmols
PO4/m2) and lepidocrocite the lowest (1.65 µmols PO4/m2). Surface area values and
normalized sorption maxima are summarized in Table 2.2.
Adsorption curves for geologic magnetite, green rust, and geologic siderite
(Figures 1a-c) were best described by the Freundlich equation (R2 = 0.88, 0.99, and 0.97,
respectively). The linear form of the Freundlich equation is
log (x/m) = (1/n) log C + log K [2.1]
where K is the distribution coefficient, C is the equilibrium concentration, x/m is mass
phosphate adsorbed/mass mineral, and n is a correction factor. The calculated
distribution coefficients (K) were 0.0031 (magnetite), 0.535 (green rust), and 0.017
(siderite). Correction factors (n) for the three minerals were 1.38, 1.35, and 1.47
respectively.
The Langmuir equation best describes the adsorption curves for ferrihydrite,
ferrihydrite-coated sand, goethite-coated sand, and lepidocrocite (Figure 2.2), as well as
synthetic siderite and synthetic magnetite (Figure 2.3). The calculated monolayer
capacities and binding coefficient values for these equations are listed in Table 2.3.

44
Table 2.1. Maximum observed phosphate adsorption on a mass basis of the mineral adsorbent (µmols PO4/g mineral). Mineral
Maximum observed adsorption (µmols/g)
SD*
Goethite coated sand 4.73 0.36 Natural magnetite 13.61 4.20 Ferrihydrite coated sand 14.39 0.38 Natural siderite 26.97 2.15 Synthetic magnetite 34.56 3.98 Lepidocrocite 123.82 0.52 Sulfate green rust 878.67 131.84 Synthetic siderite 957.53 21.46 Ferrihydrite 1037.55 1.07 *SD = standard deviation.
Table 2.2. Surface area (SA) and SA normalized adsorption maxima for phosphate on various iron oxides.
Table 2.3. Summary of adsorption capacities (b-values) and KL-values for minerals conforming to the Langmuir isotherm.
Mineral Monolayer capacity (µmols /g) Binding coefficient (KL) Ferrihydrite slurry 1022.32 0.145 Synthetic siderite 974.94 0.040 Lepidocrocite 122.99 0.163 Synthetic magnetite 34.11 0.0407 Ferrihydrite-coated sand 14.11 0.042 Goethite sand 4.63 0.145
Mineral
Surface Area (m2/g)
Maximum adsorption normalized to SA (µmols PO4/m2)
Sulfate green rust 2.56 343.23 Natural magnetite 0.13 104.69 Natural siderite 0.27 99.89 Synthetic magnetite 1.74 19.86 Synthetic siderite 63.05 15.19 Ferrihydrite-coated sand 2.28 6.31 Ferrihydrite slurry 200 (estimated) 5.19 Goethite sand 2.39 1.98 Lepidocrocite 75.21 1.65

45
II. Influence of pH and ionic strength
Generally P sorption decreased with increasing pH, at least beyond a critical value
(Figure 2.4). Goethite- and ferrihydrite-coated sand both exhibited linear decreases in
adsorption. Natural siderite and natural and synthetic magnetite all exhibit a relatively
well-defined adsorption envelope, with minimal P retention at pH 9. Lepidocrocite
appears to behave similarly to both magnetite specimens and natural siderite; however,
sorption was not examined at pH 9 and the envelope thus cannot be constrained.
Ferrihydrite and sulfate green rust showed only slight decreases in adsorption with
increased pH. Synthetic siderite noticeably deviates from the general trend. Phosphate
adsorption reaches a maximum at pH 7 and there was little difference in sorption at pH 4
and 9.
Overall, changes in ionic strength had a negligible influence on P adsorption
within the pH range examined. The only appreciable change in sorption observed with
ionic strength was on sulfate green rust (Table 2.4).
III. Release of sulfate from green rust
Sulfate release from the interlayer of the green rust is likely to be an important
consideration when attempting to evaluate P adsorption. Hansen and Poulsen (1999)
found that approximately 50% of the interlayer sulfate was replaced by phosphate,
ultimately leading to the formation of vivianite. The release of sulfate from green rust
increased from an average of 245 µmols SO4/g in deionized water to 632 µmols SO4/g in
0.1 M NaCl solution (Figure 2.5). The amount of sulfate released into the 0.1 M ionic
strength phosphate solutions used to establish sorption isotherms ranged from 437 to 677
µmols SO4/g (Figure 2.6). The average sulfate released into 100µM NaH2PO4 solution
with no NaCl was 306 µmols SO4/g and release into 100µM NaH2PO4 with ionic strength
adjusted to 0.1 M using NaCl was 558 µmols SO4/g (Figure 2.6). It should also be noted
that phosphate adsorption was greater, 95.8 µmols PO4/g, when the solution contained no
NaCl. Adsorption averaged 66.3 µmols PO4/g when the ionic strength was adjusted to
0.1 M using NaCl.

46
Table 2.4. Average adsorption (µmols PO4/g) at high and low ionic strength. Comparisons were done using an initial 100 µM NaH2PO4 solution at pH 7. Mineral 0.05 M SD* 0.1 M SD*
Green rust 110.14 14.22 66.55 3.37 Natural magnetite 1.16 0.11 0.84 0.63 Ferrihydrite 112.14 0.32 108.56 0.84 Synthetic magnetite 26.75 0.84 28.22 1.16 Lepidocrocite 84.87 1.26 90.98 2.53 Goethite coated sand 4.00 0.11 4.42 0.02 Synthetic siderite 109.40 12.00 122.57 9.90 Ferrihydrite coated sand 6.42 0.11 7.27 0.21 Natural siderite 2.74 0.42 3.79 0.21
*SD = standard deviation.

47
0 200 400 600 800 1000 1200 1400
0.0
0.2
0.4
0.6
0.8
1.0
1.2
1.4
log C0 1 2 3
log
(x/m
)
-2.0
-1.5
-1.0
-0.5
0.0
0.5
0 200 400 600 8000
20
40
60
80
100
log C0 1 2 3
log
(x/m
)
-0.5
0.0
0.5
1.0
1.5
2.0
2.5
0 200 400 600 800 1000 1200 1400
0.0
0.5
1.0
1.5
2.0
2.5
3.0
log C0.5 1.0 1.5 2.0 2.5 3.0 3.5
log
(x/m
)
-1.2
-0.8
-0.4
0.0
0.4
Figure 2.1. Phosphate adsorption curves for minerals fit to a Freundlich isotherm (linear form is inset): (a) geologic magnetite (R2 = 0.89), (b) sulfate green rust (R2
= 0.99), and (c) geologic siderite (R2 = 0.97). In the case of sulfate green rust data points obscure the error bars. Observed adsorption maxima were: 13.61 µmols PO4/g magnetite, 878.67 µmols PO4/g GR, and 26.97 µmols PO4/g siderite.
C (equilibrium concentration µM PO4)
x/m
(mg
PO4
/ gra
m m
iner
al)
a
c
b
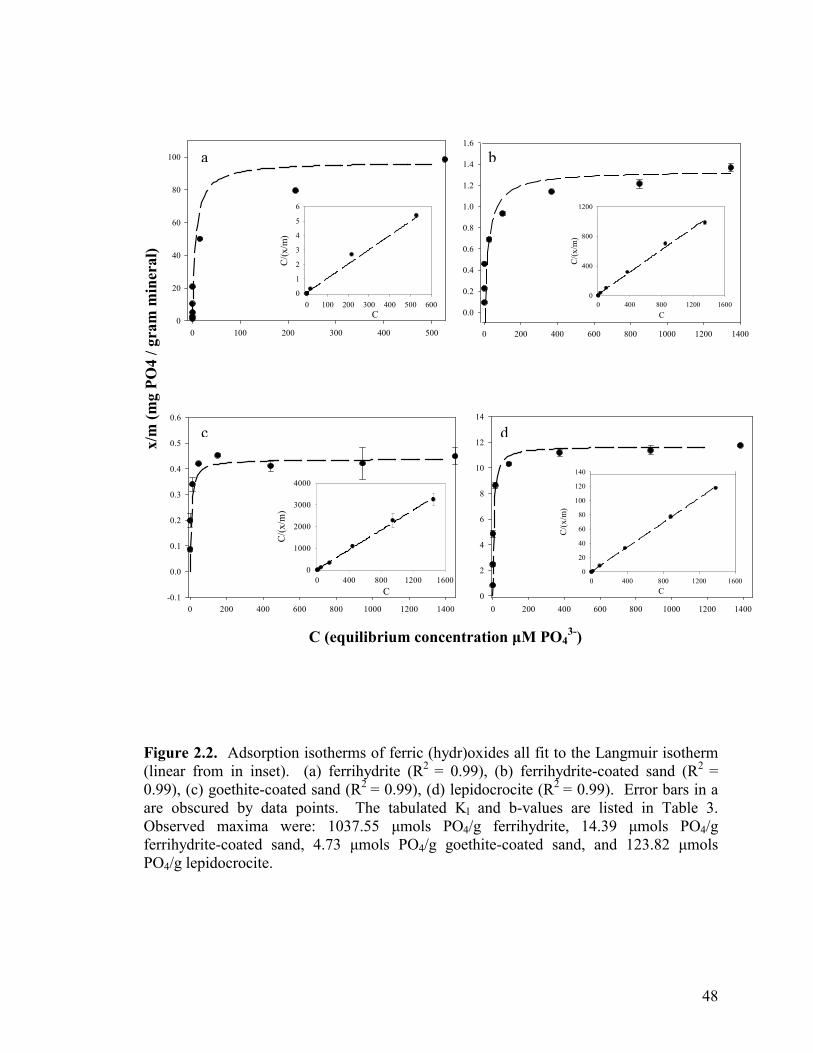
48
Figure 2.2. Adsorption isotherms of ferric (hydr)oxides all fit to the Langmuir isotherm (linear from in inset). (a) ferrihydrite (R2 = 0.99), (b) ferrihydrite-coated sand (R2 = 0.99), (c) goethite-coated sand (R2 = 0.99), (d) lepidocrocite (R2 = 0.99). Error bars in a are obscured by data points. The tabulated Kl and b-values are listed in Table 3. Observed maxima were: 1037.55 µmols PO4/g ferrihydrite, 14.39 µmols PO4/g ferrihydrite-coated sand, 4.73 µmols PO4/g goethite-coated sand, and 123.82 µmols PO4/g lepidocrocite.
0 100 200 300 400 5000
20
40
60
80
100
C0 100 200 300 400 500 600
C/(x
/m)
0
1
2
3
4
5
6
0 200 400 600 800 1000 1200 1400-0.1
0.0
0.1
0.2
0.3
0.4
0.5
0.6
C0 400 800 1200 1600
C/(x
/m)
0
1000
2000
3000
4000
0 200 400 600 800 1000 1200 1400
0.0
0.2
0.4
0.6
0.8
1.0
1.2
1.4
1.6
C0 400 800 1200 1600
C/(x
/m)
0
400
800
1200
0 200 400 600 800 1000 1200 14000
2
4
6
8
10
12
14
C0 400 800 1200 1600
C/(x
/m)
0
20
40
60
80
100
120
140
c d
ba x/
m (m
g PO
4 / g
ram
min
eral
)
C (equilibrium concentration µM PO43-)

49
0 100 200 300 400 500
0
20
40
60
80
100
C0 100 200 300 400 500 600
C/(x
/m)
0
1
2
3
4
5
6
7
0 200 400 600 800 1000 1200 1400
0
1
2
3
4
C0 400 800 1200 1600
C/(x
/m)
0
200
400
600
Figure 2.3. Phosphate adsorption curve fit to a Langmuir isotherm for (a) synthetic siderite (linear form in inset, R2 = 0.96) and (b) synthetic magnetite (linear form in inset, R2 = 0. 98). The tabulated Kl and b-values are listed in Table 3. Observed adsorption maxima were 957.53 µmols PO4/g siderite and 34.56 µmols PO4/g magnetite.
Ads
orbe
d P
Con
cent
ratio
n, x
/m (m
g PO
4/g so
lid)
Equilibrium PO4 concentration, C (µM)
a
b
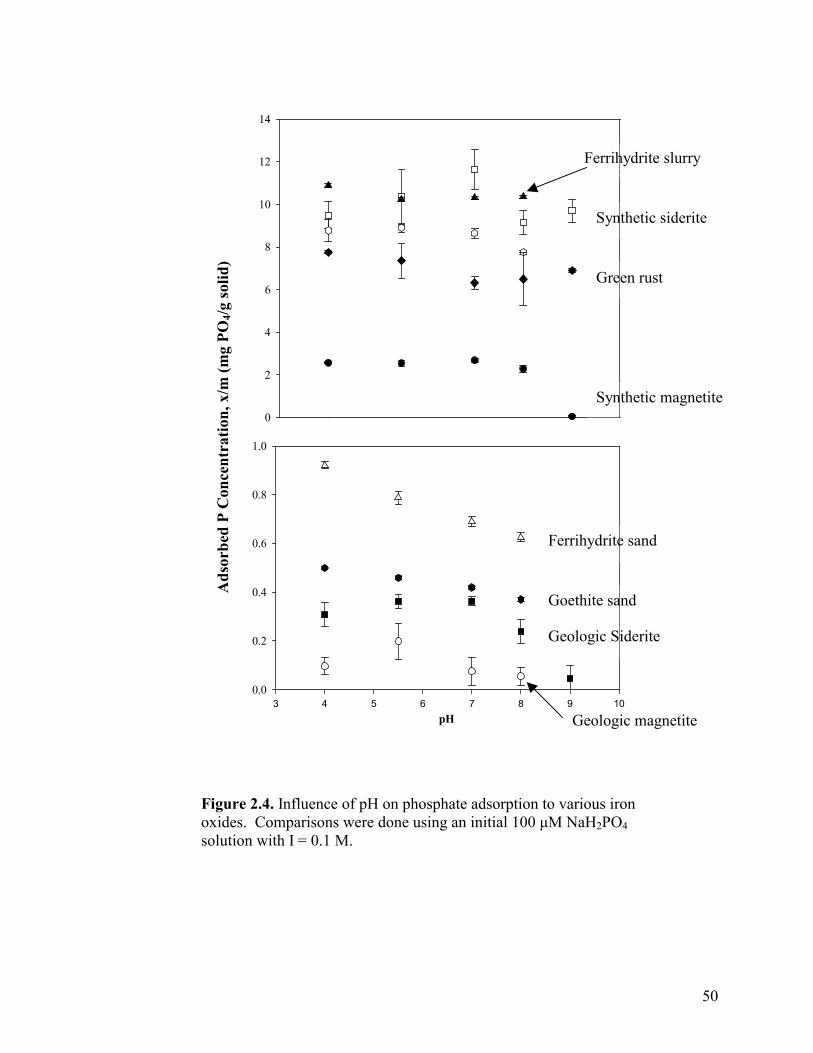
50
0
2
4
6
8
10
12
14
pH3 4 5 6 7 8 9 10
0.0
0.2
0.4
0.6
0.8
1.0
Figure 2.4. Influence of pH on phosphate adsorption to various iron oxides. Comparisons were done using an initial 100 µM NaH2PO4 solution with I = 0.1 M.
Ferrihydrite sand
Goethite sand
Geologic Siderite
Geologic magnetite
Green rust
Synthetic siderite
Ferrihydrite slurry
Ads
orbe
d P
Con
cent
ratio
n, x
/m (m
g PO
4/g so
lid)
Synthetic magnetite
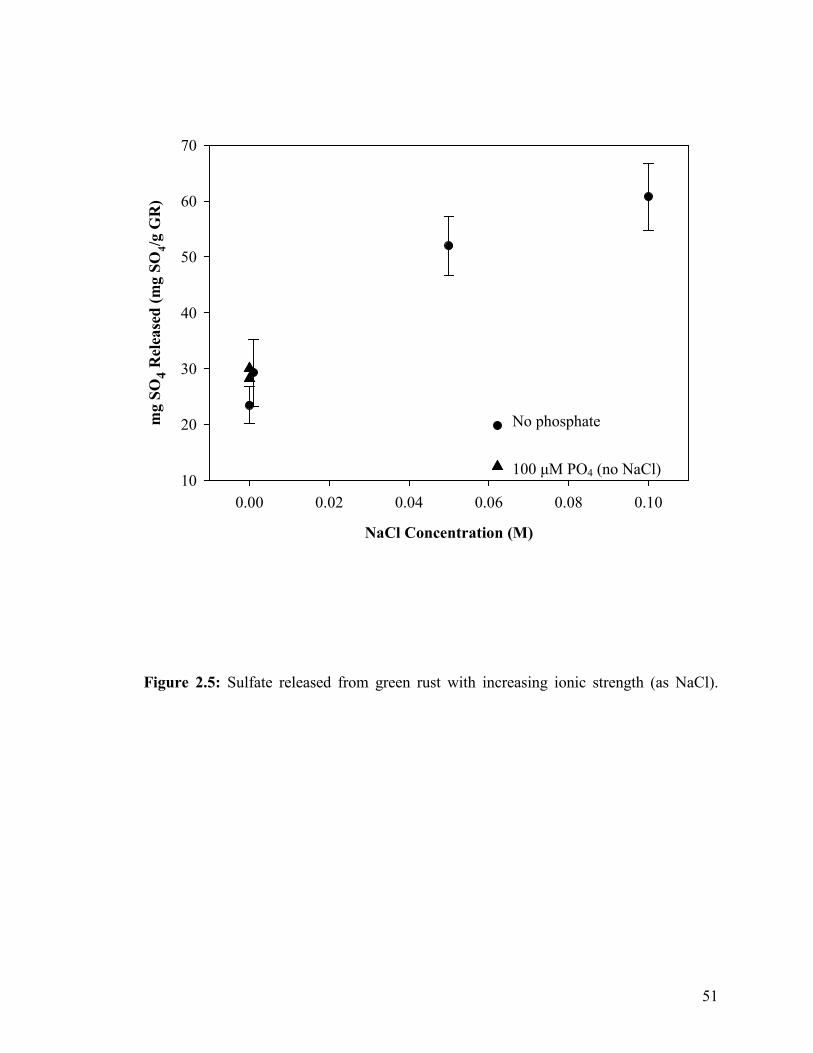
51
NaCl Concentration (M)
0.00 0.02 0.04 0.06 0.08 0.10
mg
SO4
Rel
ease
d (m
g SO
4/g G
R)
10
20
30
40
50
60
70
Figure 2.5: Sulfate released from green rust with increasing ionic strength (as NaCl).
No phosphate
100 µM PO4 (no NaCl)
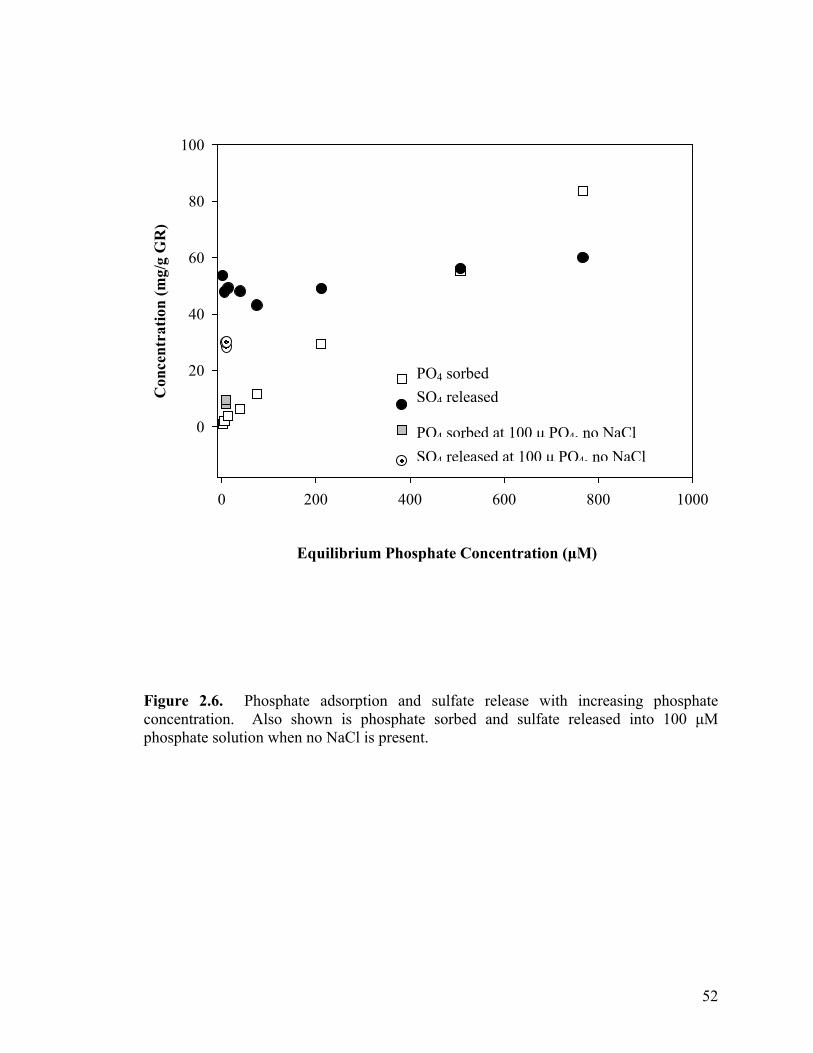
52
0 200 400 600 800 1000
Con
cent
ratio
n (m
g/g
GR
)
0
20
40
60
80
100
Figure 2.6. Phosphate adsorption and sulfate release with increasing phosphate concentration. Also shown is phosphate sorbed and sulfate released into 100 µM phosphate solution when no NaCl is present.
PO4 sorbed SO4 released
PO4 sorbed at 100 µ PO4, no NaCl SO4 released at 100 µ PO4, no NaCl
Equilibrium Phosphate Concentration (µM)
53
DISCUSSION
Sorption capacities for the ferric iron minerals examined in this study ranged from
1.65 to 6.31 µmols PO4/m2. Ferrihydrite coated sand had the greatest capacity (6.31
µmols PO4/m2), followed by ferrihydrite (5.19 µmols PO4/m2), goethite-coated sand (1.98
µmols PO4/m2), and lepidocrocite (1.65 µmols PO4/m2). A review by Torrent (1997)
listed the ranges of adsorption capacities for ferrihydrite (2.42 – 3.05 µmols PO4/m2),
goethite (2.42 – 4.63 µmols PO4/m2), and lepidocrocite (1.47 – 2.63 µmols PO4/m2). The
experimental results from this work are comparable with regard to lepidocrocite;
however, the results for the remaining ferric phases are not as easily compared to the
previously determined values.
The adsorption capacity determined in this study for ferrihydrite is higher than
those cited by Torrent (1997). This is likely the result of underestimating the surface
area, which has been found to range from 100 to 700 m2/g (Cornell and Schwertmann,
1996). A value of 200 m2/g was assumed during the data analysis of this work. Based
on the sorption capacity per weight of ferrihydrite in this study, a surface area of ~400
m2/g, well within the documented range, would have resulted in a value near that
previously published.
A batch sorption experiment conducted on uncoated silica sand indicated that the
sand alone adsorbed no measurable phosphate; therefore, phosphate adsorption by the
goethite- and ferrihydrite-coated sands is due entirely to the respective iron phase. This
is also reflected in the results of the surface area analyses. Uncoated silica had a surface
area of 0.14 m2/g, while ferrihydrite- and goethite-coated sand yielded values of 2.28
m2/g and 2.39 m2/g, respectively. Iron content of the sand (weight percent) was 0.35%
for the ferrihydrite-coated sand and 0.42% for the goethite-coated sand. When
comparing the sorption capacities of the ferrihydrite and ferrihydrite-coated sand
normalized to iron (weight percent), sorption by the coated-sand is much greater (~2000
µmols PO4/g Fe as compared to ~4100 µmols PO4/g Fe). This may be the result of
aggregation of the ferrihydrite slurry (no sand), which would decrease the number of
sorption sites readily available.
Phosphate sorption by all four ferric iron minerals was fit to a Langmuir isotherm.
The initial slopes of the adsorption curves for lepidocrocite, ferrihydrite, and goethite-

54
coated sand were quite steep; however, the initial section of ferrihydrite-coated sand
adsorption curve is more gradual. These observations are reflected in the values of the
binding coefficients (KL), which are 0.145 for ferrihydrite and goethite coated sand and
0.163 for lepidocrocite. The KL for ferrihydrite-coated sand was 0.042. The steep
adsorption curves and high binding coefficients indicate a high affinity for phosphate by
lepidocrocite, ferrihydrite, and goethite-coated sand, while the ferrihydrite-coated sand
has a lower affinity for phosphate on a mass basis.
The reduced and mixed valent iron phases studied exhibited sorption capacities
higher than the oxidized minerals when normalized to surface area, ranging from 15.16 to
343.27 µmols PO4/m2. Synthetic magnetite and synthetic siderite reach adsorption
maxima of 15.16 and 19.90 µmols PO4/m2, respectively. The binding coefficients are
similar to that of ferrihydrite-coated sand with the KL for siderite calculated at 0.040 and
magnetite at 0.0407. The slopes of the initial section of the adsorption curves reflect
these lower binding affinities, which are similar to that of ferrihydrite-coated sand.
The natural magnetite, natural siderite, and sulfate green rust conformed to the
Freundlich isotherm and thus no adsorption maximum was observed. This is likely
explained by surface precipitation and/or physical adsorption of phosphate in addition to
chemisorption at the mineral surface. To evaluate whether surface precipitation occurred,
samples of natural siderite, natural magnetite, and sulfate green rust were reacted with
1500 µM NaH2PO4 (pH 7 and ionic strength adjusted 0.1 M using NaCl) for 48 h, dried,
and analyzed using X-ray diffraction. The ending solution was analyzed for phosphate
and dissolved iron; the chemical speciation program MINTEQ was used to determine
saturation indices using parameters from Stumm and Morgan (1981) and Benjamin
(2002) (Table 2.5). X-ray diffraction patterns did not show evidence of iron phosphate
mineral phases; however, if surface precipitates were present as a small percentage of the
sample they would not be detected. Vivianite was found to be oversaturated in solutions
reacted with magnetite and siderite, so it is possible for precipitation to occur.
The solution reacted with sulfate green rust was slightly undersaturated with
respect to vivianite (Table 2.5); however, based on the work by Hansen and Poulsen
(1999) conversion of green rust to vivianite is a likely phosphate sink in these systems.
They reacted sulfate green rust with 50 mM Na2HPO4 (pH 9.3) for 60 d.
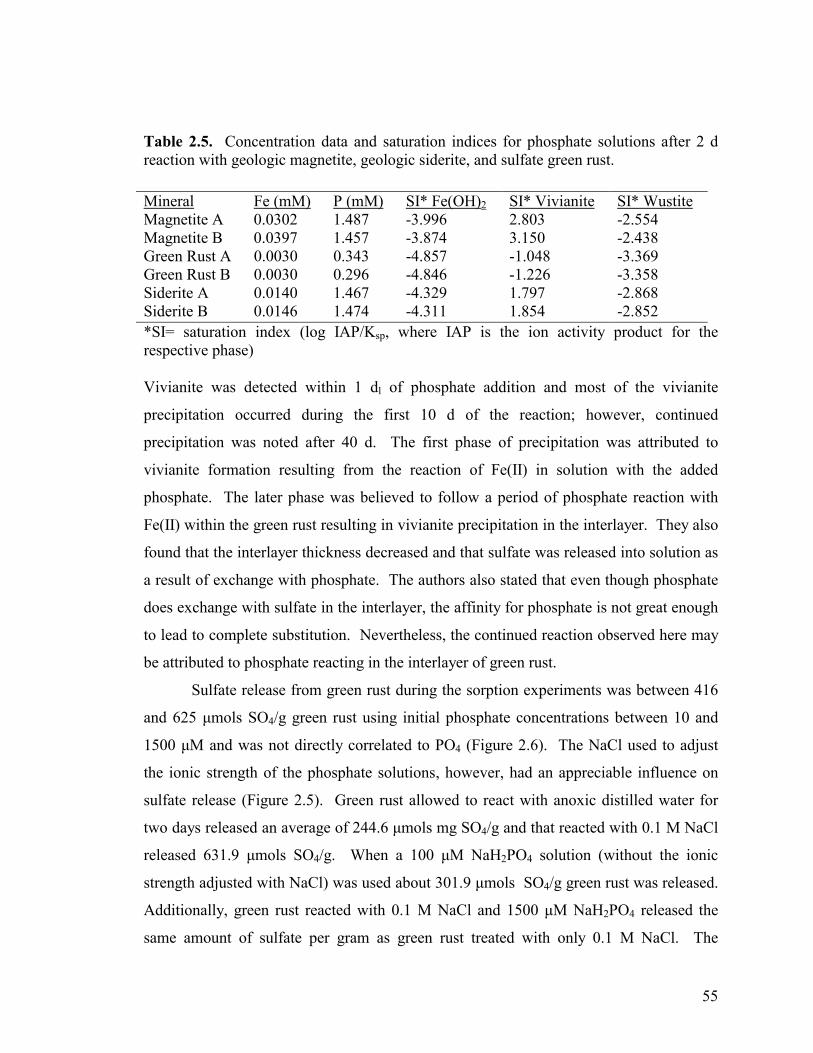
55
Table 2.5. Concentration data and saturation indices for phosphate solutions after 2 d reaction with geologic magnetite, geologic siderite, and sulfate green rust.
*SI= saturation index (log IAP/Ksp, where IAP is the ion activity product for the respective phase) Vivianite was detected within 1 dl of phosphate addition and most of the vivianite
precipitation occurred during the first 10 d of the reaction; however, continued
precipitation was noted after 40 d. The first phase of precipitation was attributed to
vivianite formation resulting from the reaction of Fe(II) in solution with the added
phosphate. The later phase was believed to follow a period of phosphate reaction with
Fe(II) within the green rust resulting in vivianite precipitation in the interlayer. They also
found that the interlayer thickness decreased and that sulfate was released into solution as
a result of exchange with phosphate. The authors also stated that even though phosphate
does exchange with sulfate in the interlayer, the affinity for phosphate is not great enough
to lead to complete substitution. Nevertheless, the continued reaction observed here may
be attributed to phosphate reacting in the interlayer of green rust.
Sulfate release from green rust during the sorption experiments was between 416
and 625 µmols SO4/g green rust using initial phosphate concentrations between 10 and
1500 µM and was not directly correlated to PO4 (Figure 2.6). The NaCl used to adjust
the ionic strength of the phosphate solutions, however, had an appreciable influence on
sulfate release (Figure 2.5). Green rust allowed to react with anoxic distilled water for
two days released an average of 244.6 µmols mg SO4/g and that reacted with 0.1 M NaCl
released 631.9 µmols SO4/g. When a 100 µM NaH2PO4 solution (without the ionic
strength adjusted with NaCl) was used about 301.9 µmols SO4/g green rust was released.
Additionally, green rust reacted with 0.1 M NaCl and 1500 µM NaH2PO4 released the
same amount of sulfate per gram as green rust treated with only 0.1 M NaCl. The
Mineral Fe (mM) P (mM) SI* Fe(OH)2 SI* Vivianite SI* Wustite Magnetite A 0.0302 1.487 -3.996 2.803 -2.554 Magnetite B 0.0397 1.457 -3.874 3.150 -2.438 Green Rust A 0.0030 0.343 -4.857 -1.048 -3.369 Green Rust B 0.0030 0.296 -4.846 -1.226 -3.358 Siderite A 0.0140 1.467 -4.329 1.797 -2.868 Siderite B 0.0146 1.474 -4.311 1.854 -2.852
56
presence of chloride is not only the predominant factor in how much sulfate is released,
but also is a factor in how much phosphate will be sorbed. Green rust was reacted with
100 µM NaH2PO4 solutions with and without the ionic strength adjusted; the samples
without NaCl sorbed more phosphate than those reacted with a solution containing 0.1 M
NaCl (66.3 vs. 95.8 µmols PO4/g green rust, respectively). These observations indicate a
preference by interlayer sulfate to exchange with chloride over phosphate. This
preference may only be due to the concentration gradient betweens Cl- and PO43-. Lewis
(1997) found that chloride green rust would convert to sulfate green rust when reacted
with solutions containing less than 100 mM SO4; however, the study did not examine
whether the reverse reaction would occur.
Generally, a decrease in adsorption is seen with increasing pH; however, this
decrease is minimal for the ferric oxides within the pH range found in most soils (4 – 7)
(Brady and Weil, 1999). The trends displayed by the goethite- and ferrihydrite-coated
sand are in agreement with the findings of Geelhoed (1997), Strauss et al. (1997),
Goldberg (1983), Willett and Cunningham (1983), Ryden et al. (1977a), and McLaughlin
et al. (1977). The maximum sorption on goethite and ferrihydrite may not have been
observed and may actually occur at pH near 2.5 (Strauss et al., 1997). Both magnetite
samples and the natural siderite had well defined adsorption envelopes, with adsorption
rapidly diminishing between pH 8 and 9 (Figure 2.4). The ferrihydrite and ferrihydrite-
coated sand behave differently with increased pH. Adsorption onto the coated sand
decreases much more rapidly with pH than does sorption onto the ferrihydrite slurry. The
calculated binding coefficients were 0.145 for the ferrihydrite slurry and 0.042 for the
coated sand. Since the ferrihydrite slurry has a greater affinity for phosphate, one would
expect the changes in phosphate adsorption with pH to be less dramatic than those of the
ferrihydrite-coated sand.
The trends in decreasing adsorption with increasing pH will have implications on
the fate and transport of phosphate in natural systems. When phosphate is adsorbed to a
ferric hydroxide, two hydroxyl groups are released to solution, resulting in an initial
removal of phosphate from a system along with an increase in pH. This pH increase will
slow the reaction kinetics of sorption (Shang et al., 1992) and even completely inhibit
adsorption - as observed in the case of both magnetite samples and the geologic siderite.
57
Inhibition of phosphate sorption may occur at pH higher than what was examined in this
study for other iron oxides. Hingston et al. (1972) showed that phosphate sorption onto
goethite decreased to zero at pH 13. In terms of practical application, if a permeable
reactive barrier utilizing iron oxides were to be used for phosphate removal, one would
need to consider ways to control the pH. In a system that is not well buffered, the initial
phosphate adsorption will lead to increased pH and subsequently inhibited phosphate
removal. The retention would be slowed or completely halted until the pH decreased
again; in either case, the result would be ineffective phosphate removal. However, in
most soil systems the buffering capacity is likely to be great enough to mitigate large pH
changes upon P sorption.
The sorption characteristics of the siderite and magnetite samples varied
considerably between the geologic and synthetic specimens. In the case of the magnetite,
both exhibited a well-defined adsorption envelope, but the synthetic magnetite reached an
apparent adsorption maximum and was fit with a Langmuir isotherm; the geologic
sample did not exhibit an adsorption maximum and was fit to the Freundlich equation.
Adsorption onto synthetic siderite did not appear to change dramatically with pH;
however, sorption by the natural sample decreased to insignificant amounts at pH 9.
Similarly to the magnetite, no adsorption maximum on geologic siderite was observed
and was fit with the Freundlich equation, whereas phosphate adsorption onto synthetic
siderite conformed to the Langmuir equation. Additionally, dissolved iron was detected
in phosphate solutions following a two-day reaction period with both natural samples.
These variations may be the result of a variety of factors. One consideration is mineral
purity; the synthetic specimens are likely to have a much more consistent composition.
Geologic magnetite is commonly found to have small amounts of Ca2+, Mn2+, and Mg2+
replacing Fe2+, and Al3+ can replace Fe3+. Other, less common, replacement elements
include Cr3+ and V3+ (for Fe3+) and Ni2+, Co2+, and Zn2+ (for Fe2+). Manganese and
magnesium are both common substitutions for Fe2+ in siderite since there is complete
solid solution between siderite and rhodochrosite and siderite and magnesite (Deer et al.,
1992). Ainsworth et al. (1985) found that Al-substitution in goethite had an appreciable
influence on the extent and rate of isotopic phosphate exchange. The siderite and
magnetite samples were treated with dilute acid prior to the experiments; however,

58
residual oxidative coatings and inclusions may have influenced the sorption behavior.
Magnetite has commonly been observed to convert to maghemite and hematite (Cornell
and Schwertmann, 1994), and magnetite crystals are often observed to contain detectable
amounts of maghemite (Deer et al., 1992). Siderite usually will alter to goethite and
sometimes hematite (Deer et al., 1992).
In general, phosphate adsorption changed very little over the range of ionic
strengths examined. Sorption by natural magnetite and ferrihydrite (slurry) decreased
slightly with ionic strength and the remaining minerals, with the exception of green rust,
increased in sorption capacity with ionic strength. Green rust, discussed previously,
exhibited a substantial decrease in phosphate adsorption with increased chloride
concentration. Ionic strength alone is likely to have less influence on phosphate retention
than the pH and substrate; however, competition of other ions in solution for binding sites
is a factor that must be considered. Ryden et al. (1977b) found that increased ionic
strength resulted in an increase in phosphate sorption in soils and that the increase was
more pronounced with Ca present than with Na in solution. Additionally, pH may
influence how dramatically fluctuations in ionic strength affect phosphate sorption. Arai
and Sparks (2001) found that from pH 4 to 7.5, phosphate adsorption on ferrihydrite was
unaffected by changes in ionic strength; however, at pH greater than 7.5, adsorption
increased with ionic strength.
Patrick and Khalid (1974) postulated that the reductive dissolution of ferric iron
minerals led to ferrous compounds having increased activities and surface areas but that
the ferric oxides had a higher affinity for phosphate. These postulates are supported by
the findings of our work. On a surface area basis, all the ferrous iron minerals had much
higher capacities to sorb phosphate (from 15.16 to 343.27 µmols PO4/g mineral) than the
ferric minerals (1.68 to 6.32 µmols PO4/g mineral). This would result in the increased
phosphate sorption capacity of reduced sediments and soils in many areas provided high
surface area phases developed; however, the calculated binding and distribution
coefficients indicate that the ferric minerals have a higher affinity for phosphate than do
the ferrous minerals. The findings of this research also help to explain other previous
observations and have implications in how excess phosphate could be removed from a
system. Patrick and Khalid (1974) also noted that even though anaerobic soils were
59
capable of sorbing more phosphate they also released more into the soil solution, an
observation believed to result from lower affinity for phosphate by the ferrous minerals.
The distribution and binding coefficients calculated during this work support that theory
(Table 3). The adsorption characteristics exhibited by the ferric and ferrous iron minerals
also help to explain why seasonally flooded soils have been observed to have higher
levels of non-labile (non-exchangeable/iron bound) phosphate (Reynolds et al. 1999).
When flooded soils are subsequently aerated the relatively fine-grained ferrous minerals
would re-oxidize resulting in ferric phases with higher surface area and thus more
sorption sites than the ferric minerals present prior to flooding. The higher affinities of
the ferric iron minerals result in more strongly held (less labile) phosphate in the soil.
Changes in pH have been observed to affect phosphate retention by numerous ferric
oxides (Geelhoed, 1997; Strauss et al., 1997, Shang et al., 1992; Willett and Cunningham,
1983; Ryden et al., 1977b; McLaughlin et al., 1977). The adsorption envelopes observed
in this study indicate pH could play a much larger role in influencing phosphate retention
in sub-oxic to anoxic soils than in well-aerated systems.
CONCLUSIONS
The results of this study indicate ferrous minerals have phosphate adsorption
capacities that are much greater than those of the ferric phases examined. However, the
ferrous minerals all had much lower binding coefficients and were more sensitive to
changes in pH. The high capacity for phosphate of the ferrous minerals, combined with
the relatively low affinity and sensitivity to pH suggests that the ferrous minerals
investigated may provide appreciable, although transitory phosphorus sinks in some
reductomorphic environments.

60
CHAPTER 2
APPENDIX: ISOTHERM DATA COLLECTED DURING SORPTION
EXPERIMENTS
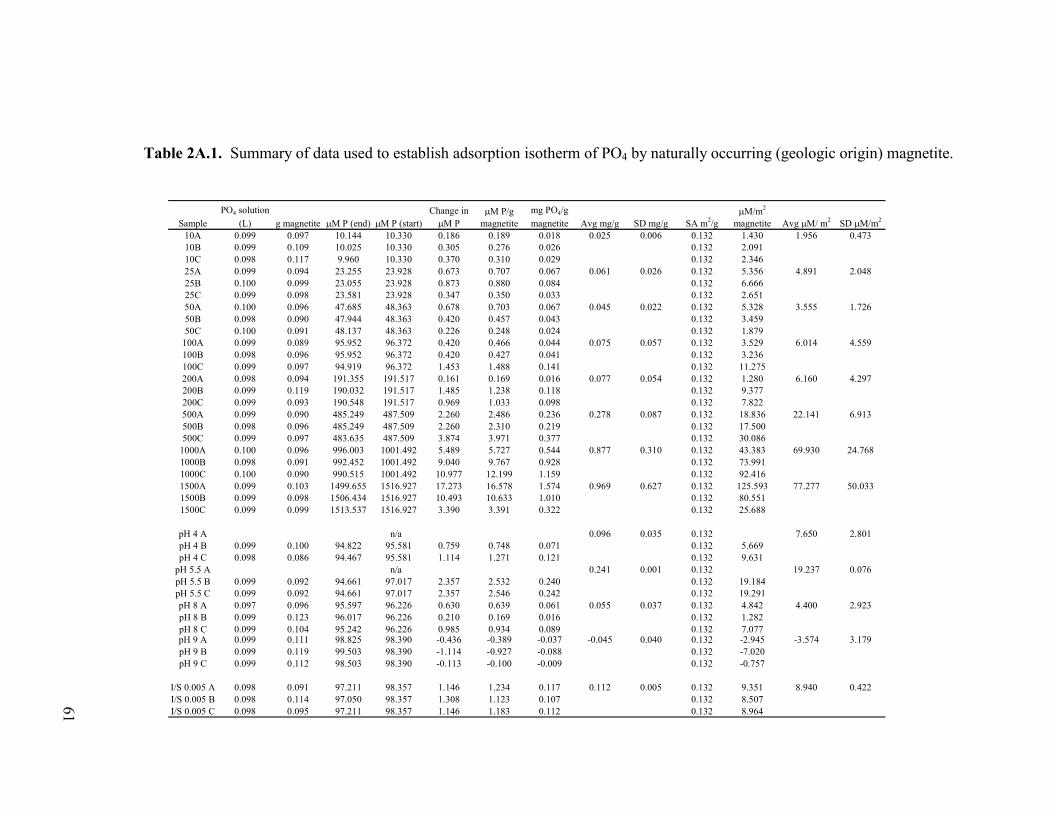
61
Table 2A.1. Summary of data used to establish adsorption isotherm of PO4 by naturally occurring (geologic origin) magnetite.
SamplePO4 solution
(L) g magnetite �M P (end) �M P (start)Change in �M P
�M P/g magnetite
mg PO4/g magnetite Avg mg/g SD mg/g SA m2/g
�M/m2
magnetite Avg �M/ m2 SD �M/m2
10A 0.099 0.097 10.144 10.330 0.186 0.189 0.018 0.025 0.006 0.132 1.430 1.956 0.47310B 0.099 0.109 10.025 10.330 0.305 0.276 0.026 0.132 2.09110C 0.098 0.117 9.960 10.330 0.370 0.310 0.029 0.132 2.34625A 0.099 0.094 23.255 23.928 0.673 0.707 0.067 0.061 0.026 0.132 5.356 4.891 2.04825B 0.100 0.099 23.055 23.928 0.873 0.880 0.084 0.132 6.66625C 0.099 0.098 23.581 23.928 0.347 0.350 0.033 0.132 2.65150A 0.100 0.096 47.685 48.363 0.678 0.703 0.067 0.045 0.022 0.132 5.328 3.555 1.72650B 0.098 0.090 47.944 48.363 0.420 0.457 0.043 0.132 3.45950C 0.100 0.091 48.137 48.363 0.226 0.248 0.024 0.132 1.879
100A 0.099 0.089 95.952 96.372 0.420 0.466 0.044 0.075 0.057 0.132 3.529 6.014 4.559100B 0.098 0.096 95.952 96.372 0.420 0.427 0.041 0.132 3.236100C 0.099 0.097 94.919 96.372 1.453 1.488 0.141 0.132 11.275200A 0.098 0.094 191.355 191.517 0.161 0.169 0.016 0.077 0.054 0.132 1.280 6.160 4.297200B 0.099 0.119 190.032 191.517 1.485 1.238 0.118 0.132 9.377200C 0.099 0.093 190.548 191.517 0.969 1.033 0.098 0.132 7.822500A 0.099 0.090 485.249 487.509 2.260 2.486 0.236 0.278 0.087 0.132 18.836 22.141 6.913500B 0.098 0.096 485.249 487.509 2.260 2.310 0.219 0.132 17.500500C 0.099 0.097 483.635 487.509 3.874 3.971 0.377 0.132 30.086
1000A 0.100 0.096 996.003 1001.492 5.489 5.727 0.544 0.877 0.310 0.132 43.383 69.930 24.7681000B 0.098 0.091 992.452 1001.492 9.040 9.767 0.928 0.132 73.9911000C 0.100 0.090 990.515 1001.492 10.977 12.199 1.159 0.132 92.4161500A 0.099 0.103 1499.655 1516.927 17.273 16.578 1.574 0.969 0.627 0.132 125.593 77.277 50.0331500B 0.099 0.098 1506.434 1516.927 10.493 10.633 1.010 0.132 80.5511500C 0.099 0.099 1513.537 1516.927 3.390 3.391 0.322 0.132 25.688
pH 4 A 0.096 0.035 0.132 7.650 2.801pH 4 B 0.099 0.100 94.822 95.581 0.759 0.748 0.071 0.132 5.669pH 4 C 0.098 0.086 94.467 95.581 1.114 1.271 0.121 0.132 9.631
pH 5.5 A 0.241 0.001 0.132 19.237 0.076pH 5.5 B 0.099 0.092 94.661 97.017 2.357 2.532 0.240 0.132 19.184pH 5.5 C 0.099 0.092 94.661 97.017 2.357 2.546 0.242 0.132 19.291pH 8 A 0.097 0.096 95.597 96.226 0.630 0.639 0.061 0.055 0.037 0.132 4.842 4.400 2.923pH 8 B 0.099 0.123 96.017 96.226 0.210 0.169 0.016 0.132 1.282pH 8 C 0.099 0.104 95.242 96.226 0.985 0.934 0.089 0.132 7.077pH 9 A 0.099 0.111 98.825 98.390 -0.436 -0.389 -0.037 -0.045 0.040 0.132 -2.945 -3.574 3.179pH 9 B 0.099 0.119 99.503 98.390 -1.114 -0.927 -0.088 0.132 -7.020pH 9 C 0.099 0.112 98.503 98.390 -0.113 -0.100 -0.009 0.132 -0.757
I/S 0.005 A 0.098 0.091 97.211 98.357 1.146 1.234 0.117 0.112 0.005 0.132 9.351 8.940 0.422I/S 0.005 B 0.098 0.114 97.050 98.357 1.308 1.123 0.107 0.132 8.507I/S 0.005 C 0.098 0.095 97.211 98.357 1.146 1.183 0.112 0.132 8.964
n/a
n/a

62
Table 2A.2. Summary of data used to establish adsorption isotherm of PO4 by sulfate green rust.
SamplePO4 solution
(L) g green rust �M P (end)�M P (start)
Change in �M P
�M P/g green rust
mg PO4/g green rust Avg mg/g SD mg/g SA m2/g
�M/m2
green rustAvg �M/
m2 SD �M/m2
10A 0.015 0.015 1.873 11.494 9.621 9.706 0.922 0.936 0.020 2.560 3.791 3.849 0.08110B 0.015 0.015 1.582 11.494 9.912 9.999 0.950 2.560 3.90625A 0.015 0.015 5.618 25.990 20.372 20.545 1.951 1.919 0.046 2.560 8.025 7.892 0.18825B 0.015 0.015 6.296 25.990 19.694 19.865 1.887 2.560 7.76050A 0.015 0.014 17.079 51.140 34.061 36.715 3.487 3.682 0.276 2.560 14.342 15.144 1.13550B 0.015 0.015 10.557 51.140 40.583 40.823 3.877 2.560 15.947
100A 0.015 0.014 36.967 100.843 63.877 68.905 6.544 6.315 0.324 2.560 26.916 25.975 1.331100B 0.015 0.014 41.551 100.843 59.292 64.086 6.086 2.560 25.034200A 0.015 0.015 75.354 199.749 124.395 125.109 11.882 11.563 0.450 2.560 48.871 47.561 1.851200B 0.015 0.016 74.095 199.749 125.655 118.406 11.245 2.560 46.252500A 0.015 0.015 234.198 506.557 272.359 273.757 25.999 29.252 4.601 2.560 106.936 120.318 18.924500B 0.015 0.014 189.031 506.557 317.526 342.271 32.505 2.560 133.700
1000A 0.015 0.013 533.677 1048.305 514.628 595.900 56.593 55.335 1.779 2.560 232.774 227.599 7.3171000B 0.015 0.015 481.052 1048.305 567.254 569.409 54.077 2.560 222.4251500A 0.015 0.013 739.657 1576.332 836.675 971.894 92.301 83.447 12.521 2.560 379.646 343.229 51.5021500B 0.015 0.015 794.542 1576.332 781.790 785.438 74.593 2.560 306.812
pH 4 A 0.015 0.014 23.601 100.004 76.403 82.139 7.801 7.748 0.075 2.560 32.086 31.867 0.309pH 4 B 0.015 0.013 30.122 100.004 69.882 81.020 7.694 2.560 31.648
pH 5.5 A 0.015 0.015 29.444 100.359 70.915 71.255 6.767 7.351 0.826 2.560 27.834 30.238 3.399pH 5.5 B 0.015 0.013 28.314 100.359 72.045 83.561 7.936 2.560 32.641pH 8 A 0.015 0.013 33.318 100.294 66.976 77.692 7.378 6.498 1.245 2.560 30.348 26.728 5.119pH 8 B 0.015 0.015 41.454 100.294 58.840 59.158 5.618 2.560 23.109pH 9 A 0.015 0.014 35.030 101.844 66.815 72.002 6.838 6.900 0.088 2.560 28.126 28.381 0.361pH 9 B 0.015 0.013 38.710 101.844 63.134 73.308 6.962 2.560 28.636
I/S 0.005 A 0.015 0.012 7.426 103.071 95.645 120.147 11.410 10.455 1.351 2.560 46.932 43.004 5.555I/S 0.005 B 0.015 0.014 9.686 103.071 93.385 100.036 9.500 2.560 39.076

63
Table 2A.3. Summary of data used to establish adsorption isotherm of PO4 by naturally occurring (geologic) siderite.
Sample PO4 solution
(L) g siderite �M P (end)�M P (start)
Change in �M P
�M P/g siderite
mg PO4/g siderite Avg mg/g SD mg/g SA m2/g
�M/m2
sideriteAvg �M/
m2 SD �M/m2
10A 0.100 0.145 10.160 10.330 0.169 0.116 0.011 0.076 0.062 0.270 0.431 2.977 2.40810B 0.100 0.097 8.962 10.330 1.367 1.409 0.134 0.270 5.21710C 0.100 0.093 9.505 10.330 0.825 0.886 0.084 0.270 3.28325A 0.099 0.097 22.635 23.928 1.293 1.321 0.125 0.081 0.055 0.270 4.892 3.164 2.16025B 0.099 0.106 23.714 23.928 0.215 0.200 0.019 0.270 0.74225C 0.100 0.115 22.726 23.928 1.203 1.042 0.099 0.270 3.85750A 0.098 0.099 46.007 48.363 2.357 2.341 0.222 0.220 0.006 0.270 8.672 8.588 0.21650B 0.100 0.102 45.942 48.363 2.421 2.362 0.224 0.270 8.74950C 0.098 0.104 45.974 48.363 2.389 2.252 0.214 0.270 8.342
100A 0.100 0.103 92.336 96.372 4.036 3.931 0.373 0.364 0.018 0.270 14.558 14.185 0.683100B 0.098 0.101 92.659 96.372 3.713 3.617 0.344 0.270 13.396100C 0.099 0.102 92.304 96.372 4.068 3.942 0.374 0.270 14.600200A 0.099 0.102 185.221 191.517 6.296 6.109 0.580 0.530 0.081 0.270 22.625 20.668 3.144200B 0.099 0.104 186.674 191.517 4.843 4.601 0.437 0.270 17.041200C 0.099 0.107 185.027 191.517 6.489 6.031 0.573 0.270 22.338500A 0.099 0.095 476.532 487.509 10.977 11.448 1.087 0.989 0.091 0.270 42.400 38.554 3.546500B 0.100 0.107 476.532 487.509 10.977 10.218 0.970 0.270 37.845500C 0.100 0.101 477.823 487.509 9.686 9.562 0.908 0.270 35.416
1000A 0.100 0.099 975.986 1001.492 25.505 25.803 2.450 2.187 0.228 0.270 95.566 85.309 8.8851000B 0.099 0.105 978.569 1001.492 22.923 21.708 2.062 0.270 80.3991000C 0.099 0.112 976.955 1001.492 24.537 21.590 2.050 0.270 79.9621500A 0.099 0.106 1485.449 1516.927 31.478 29.439 2.796 2.561 0.204 0.270 109.033 99.890 7.9521500B 0.100 0.100 1491.260 1516.927 25.667 25.539 2.425 0.270 94.5881500C 0.100 0.113 1487.709 1516.927 29.218 25.933 2.463 0.270 96.048
pH 4 A 0.099 0.110 92.175 95.581 3.406 3.051 0.290 0.307 0.049 0.270 11.298 11.978 1.908pH 4 B 0.098 0.099 92.724 95.581 2.857 2.836 0.269 0.270 10.503pH 4 C 0.099 0.115 91.142 95.581 4.439 3.816 0.362 0.270 14.133
pH 5.5 A 0.098 0.114 92.853 97.017 4.165 3.597 0.342 0.363 0.029 0.270 13.323 14.151 1.137pH 5.5 B 0.100 0.096 93.466 97.017 3.551 3.695 0.351 0.270 13.684pH 5.5 C 0.100 0.112 92.368 97.017 4.649 4.171 0.396 0.270 15.448pH 8 A 0.099 0.109 93.305 96.226 2.922 2.654 0.252 0.239 0.051 0.270 9.830 9.301 1.977pH 8 B 0.098 0.104 93.079 96.226 3.148 2.959 0.281 0.270 10.960pH 8 C 0.098 0.120 93.886 96.226 2.341 1.921 0.182 0.270 7.114pH 9 A 0.099 0.116 98.115 98.390 0.274 0.234 0.022 0.046 0.055 0.270 0.868 1.809 2.138pH 9 B 0.097 0.096 98.309 98.390 0.081 0.082 0.008 0.270 0.303pH 9 C 0.099 0.093 97.308 98.390 1.082 1.149 0.109 0.270 4.255
I/S 0.005 A 0.098 0.099 95.274 98.357 3.083 3.058 0.290 0.256 0.041 0.270 11.326 9.966 1.590I/S 0.005 B 0.099 0.112 95.855 98.357 2.502 2.219 0.211 0.270 8.219I/S 0.005 C 0.099 0.099 95.565 98.357 2.793 2.795 0.265 0.270 10.354

64
Table 2A.4. Summary of data used to establish adsorption isotherm of PO4 by ferrihydrite (as a slurry).
Sample PO4
solution (L) g HFO �M P (end)�M P (start)
Change in �M P
�M P/g HFO
mg PO4/g HFO Avg mg/g SD mg/g SA m2/g
�M/m2
HFO Avg �M/ m2 SD �M/m2
10A 0.098 0.088 0.010 9.458 9.448 11.622 1.104 1.108 0.006 200 0.058 0.058 0.00010B 0.099 0.088 0.000 9.458 9.458 11.733 1.114 200 0.05910C 0.098 0.088 0.000 9.458 9.458 11.648 1.106 200 0.05825A 0.098 0.088 0.000 21.526 21.526 26.495 2.516 2.531 0.023 200 0.132 0.133 0.00125B 0.100 0.088 0.000 21.526 21.526 26.926 2.557 200 0.13525C 0.098 0.088 0.000 21.526 21.526 26.520 2.519 200 0.13350A 0.099 0.088 0.349 43.350 43.002 53.145 5.047 5.094 0.051 200 0.266 0.268 0.00350B 0.100 0.088 0.000 43.350 43.350 54.200 5.147 200 0.27150C 0.099 0.088 0.000 43.350 43.350 53.554 5.086 200 0.268
100A 0.100 0.088 0.000 87.934 87.934 109.377 10.388 10.306 0.078 200 0.547 0.543 0.004100B 0.098 0.088 0.090 87.934 87.843 107.734 10.231 200 0.539100C 0.098 0.088 0.042 87.934 87.892 108.436 10.298 200 0.542200A 0.099 0.088 0.074 176.718 176.644 217.478 20.654 20.811 0.188 200 1.087 1.096 0.010200B 0.099 0.088 0.100 176.718 176.618 218.608 20.761 200 1.093200C 0.100 0.088 0.000 176.718 176.718 221.325 21.019 200 1.107500A 0.099 0.088 16.052 439.668 423.616 524.965 49.856 49.954 0.087 200 2.625 2.630 0.005500B 0.099 0.088 15.978 439.668 423.690 526.705 50.021 200 2.634500C 0.099 0.087 15.655 439.668 424.013 526.324 49.985 200 2.632
1000A 0.098 0.088 215.602 891.956 676.355 833.823 79.188 79.541 0.318 200 4.169 4.188 0.0171000B 0.098 0.087 212.567 891.956 679.389 840.311 79.804 200 4.2021000C 0.099 0.088 215.892 891.956 676.064 838.472 79.630 200 4.1921500A 0.099 0.088 527.865 1365.817 837.952 1037.376 98.520 98.536 0.101 200 5.187 5.188 0.0051500B 0.099 0.087 533.677 1365.817 832.140 1038.693 98.645 200 5.1931500C 0.098 0.087 532.708 1365.817 833.109 1036.580 98.444 200 5.183
pH 4 A 0.098 0.087 0.000 91.940 91.940 114.351 10.860 10.885 0.087 200 0.572 0.573 0.005pH 4 B 0.100 0.087 0.000 91.940 91.940 115.645 10.983 200 0.578pH 4 C 0.099 0.087 0.510 91.940 91.430 113.863 10.814 200 0.569
pH 5.5 A 0.099 0.087 0.000 87.347 87.347 108.736 10.327 10.240 0.085 200 0.544 0.539 0.004pH 5.5 B 0.098 0.087 0.000 87.347 87.347 107.806 10.238 200 0.539pH 5.5 C 0.097 0.087 0.000 87.347 87.347 106.942 10.156 200 0.535pH 8 A 0.098 0.087 0.000 88.110 88.110 109.698 10.418 10.347 0.065 200 0.548 0.545 0.003pH 8 B 0.098 0.088 0.116 88.110 87.993 108.789 10.332 200 0.544pH 8 C 0.097 0.087 0.000 88.110 88.110 108.353 10.290 200 0.542
I/S 0.005 A 0.099 0.088 0.039 90.384 90.346 111.881 10.625 10.649 0.029 200 0.559 0.561 0.002I/S 0.005 B 0.098 0.087 0.000 90.384 90.384 112.049 10.641 200 0.560I/S 0.005 C 0.100 0.088 0.000 90.384 90.384 112.468 10.681 200 0.562

65
Table 2A.5. Summary of data used to establish adsorption isotherm of PO4 by ferrihydrite-coated sand.
Sample PO4
solution (L)g HFO sand �M P (end)
�M P (start)
Change in �M P
�M P/g HFO sand
mg PO4/g HFO sand Avg mg/g SD mg/g SA m2/g
�M/m2
HFO sandAvg �M/
m2 SD �M/m2
10A 0.097 1.094 0.239 10.404 10.165 0.904 0.086 0.094 0.009 2.279 0.397 0.433 0.04110B 0.100 1.070 0.000 10.404 10.404 0.970 0.092 2.279 0.42510C 0.099 0.945 0.000 10.404 10.404 1.086 0.103 2.279 0.47725A 0.099 0.970 0.000 23.678 23.678 2.420 0.230 0.227 0.006 2.279 1.062 1.049 0.02725B 0.098 1.005 0.000 23.678 23.678 2.319 0.220 2.279 1.01725C 0.098 0.950 0.000 23.678 23.678 2.431 0.231 2.279 1.06750A 0.099 0.964 0.604 47.685 47.082 4.813 0.457 0.458 0.004 2.279 2.112 2.116 0.01750B 0.100 0.976 0.843 47.685 46.843 4.786 0.455 2.279 2.10050C 0.099 0.951 1.075 47.685 46.610 4.864 0.462 2.279 2.134
100A 0.098 0.968 26.045 96.727 70.682 7.126 0.677 0.690 0.019 2.279 3.127 3.189 0.087100B 0.099 0.949 24.760 96.727 71.967 7.494 0.712 2.279 3.288100C 0.100 0.980 26.435 96.727 70.292 7.182 0.682 2.279 3.151200A 0.097 0.913 99.729 194.390 94.661 10.035 0.953 0.934 0.017 2.279 4.403 4.313 0.079200B 0.100 1.014 95.080 194.390 99.310 9.761 0.927 2.279 4.283200C 0.099 1.025 93.918 194.390 100.472 9.695 0.921 2.279 4.254500A 0.099 0.952 367.730 483.635 115.904 12.023 1.142 1.140 0.003 2.279 5.275 5.267 0.014500B 0.097 1.009 359.013 483.635 124.621 12.020 1.142 2.279 5.274500C 0.100 1.072 355.462 483.635 128.173 11.966 1.136 2.279 5.251
1000A 0.098 0.982 849.428 981.152 131.724 13.195 1.253 1.215 0.042 2.279 5.790 5.612 0.1941000B 0.098 0.986 857.176 981.152 123.976 12.319 1.170 2.279 5.4061000C 0.099 0.989 852.656 981.152 128.496 12.855 1.221 2.279 5.6411500A 0.098 1.069 1349.851 1502.399 152.548 13.956 1.325 1.367 0.036 2.279 6.124 6.316 0.1671500B 0.099 1.059 1346.299 1502.399 156.100 14.601 1.387 2.279 6.4071500C 0.099 1.072 1343.393 1502.399 159.005 14.624 1.389 2.279 6.417
pH 4 A 0.097 0.993 2.486 101.134 98.648 9.685 0.920 0.921 0.014 2.279 4.250 4.255 0.064pH 4 B 0.099 0.990 5.786 101.134 95.348 9.556 0.908 2.279 4.193pH 4 C 0.099 0.949 6.299 101.134 94.835 9.849 0.935 2.279 4.322
pH 5.5 A 0.099 1.065 8.188 96.081 87.894 8.146 0.774 0.787 0.027 2.279 3.574 3.636 0.126pH 5.5 B 0.098 0.920 15.332 96.081 80.749 8.616 0.818 2.279 3.781pH 5.5 C 0.099 1.004 14.151 96.081 81.931 8.097 0.769 2.279 3.553pH 8 A 0.099 1.029 30.752 96.921 66.169 6.360 0.604 0.625 0.019 2.279 2.791 2.887 0.086pH 8 B 0.099 1.017 28.983 96.921 67.938 6.641 0.631 2.279 2.914pH 8 C 0.099 0.974 30.519 96.921 66.401 6.738 0.640 2.279 2.957
I/S 0.005 A 0.097 0.964 35.514 99.423 63.909 6.427 0.610 0.616 0.013 2.279 2.820 2.846 0.059I/S 0.005 B 0.097 0.978 34.997 99.423 64.425 6.391 0.607 2.279 2.805I/S 0.005 C 0.100 0.924 38.000 99.423 61.423 6.641 0.631 2.279 2.914

66
Table 2A.6. Summary of data used to establish adsorption isotherm of PO4 by goethite-coated sand.
SamplePO4 solution
(L)g goethite
sand�M P (end) �M P (start)
Change in �M P
�M P/g goethite
sand
mg PO4/g goethite
sandAvg mg/g SD mg/g SA m2/g
�M/m2
goethite sand
Avg �M/ m2 SD �M/m2
10A 0.100 0.972 0.216 9.492 9.276 0.954 0.091 0.086 0.007 2.394 0.398 0.380 0.03110B 0.099 0.987 0.000 9.492 9.492 0.951 0.090 2.394 0.39710C 0.100 1.131 0.161 9.492 9.330 0.823 0.078 2.394 0.34425A 0.100 1.206 0.142 23.266 23.124 1.914 0.182 0.199 0.027 2.394 0.800 0.874 0.11825B 0.099 0.923 0.749 23.266 22.517 2.419 0.230 2.394 1.01025C 0.100 1.177 0.449 23.266 22.818 1.946 0.185 2.394 0.81350A 0.100 1.032 12.233 48.751 36.518 3.535 0.336 0.340 0.026 2.394 1.477 1.496 0.11750B 0.099 1.230 7.203 48.751 41.548 3.328 0.316 2.394 1.39050C 0.098 0.971 10.502 48.751 38.248 3.880 0.368 2.394 1.621
100A 0.099 1.169 46.491 98.083 51.592 4.391 0.417 0.420 0.003 2.394 1.834 1.846 0.011100B 0.100 1.134 47.976 98.083 50.107 4.423 0.420 2.394 1.847100C 0.099 0.887 58.081 98.083 40.002 4.446 0.422 2.394 1.857200A 0.100 0.960 151.773 197.909 46.136 4.824 0.458 0.452 0.006 2.394 2.015 1.990 0.024200B 0.099 1.061 147.092 197.909 50.817 4.759 0.452 2.394 1.988200C 0.100 0.990 151.095 197.909 46.814 4.707 0.447 2.394 1.966500A 0.099 1.042 441.986 489.930 47.944 4.548 0.432 0.410 0.020 2.394 1.900 1.805 0.086500B 0.100 0.892 452.963 489.930 36.967 4.143 0.393 2.394 1.731500C 0.099 0.887 451.672 489.930 38.258 4.274 0.406 2.394 1.785
1000A 0.100 1.028 944.669 997.779 53.109 5.155 0.490 0.421 0.061 2.394 2.153 1.852 0.2701000B 0.099 1.021 957.584 997.779 40.195 3.907 0.371 2.394 1.6321000C 0.099 1.192 946.606 997.779 51.172 4.241 0.403 2.394 1.7711500A 0.099 1.006 1450.904 1501.915 51.011 5.013 0.476 0.449 0.034 2.394 2.094 1.975 0.1491500B 0.097 1.011 1457.038 1501.915 44.877 4.327 0.411 2.394 1.8071500C 0.100 1.052 1450.904 1501.915 51.011 4.841 0.460 2.394 2.022
pH 4 A 0.100 0.986 47.976 99.972 51.996 5.272 0.501 0.499 0.001 2.394 2.202 2.197 0.006pH 4 B 0.099 0.951 49.429 99.972 50.543 5.246 0.498 2.394 2.191pH 4 C 0.099 1.089 41.842 99.972 58.130 5.259 0.499 2.394 2.197
pH 5.5 A 0.099 1.020 50.301 99.584 49.284 4.770 0.453 0.459 0.006 2.394 1.993 2.018 0.027pH 5.5 B 0.099 0.986 51.301 99.584 48.283 4.827 0.458 2.394 2.016pH 5.5 C 0.099 0.990 50.849 99.584 48.735 4.897 0.465 2.394 2.046pH 8 A 0.099 1.066 57.855 99.600 41.745 3.878 0.368 0.370 0.009 2.394 1.620 1.629 0.040pH 8 B 0.099 1.055 58.759 99.600 40.841 3.816 0.362 2.394 1.594pH 8 C 0.100 0.884 64.183 99.600 35.417 4.004 0.380 2.394 1.672
I/S 0.005 A 0.099 1.051 59.179 103.814 44.634 4.200 0.399 0.385 0.014 2.394 1.754 1.691 0.063I/S 0.005 B 0.098 1.040 61.052 103.814 42.762 4.050 0.385 2.394 1.692I/S 0.005 C 0.098 0.817 71.318 103.814 32.495 3.897 0.370 2.394 1.628
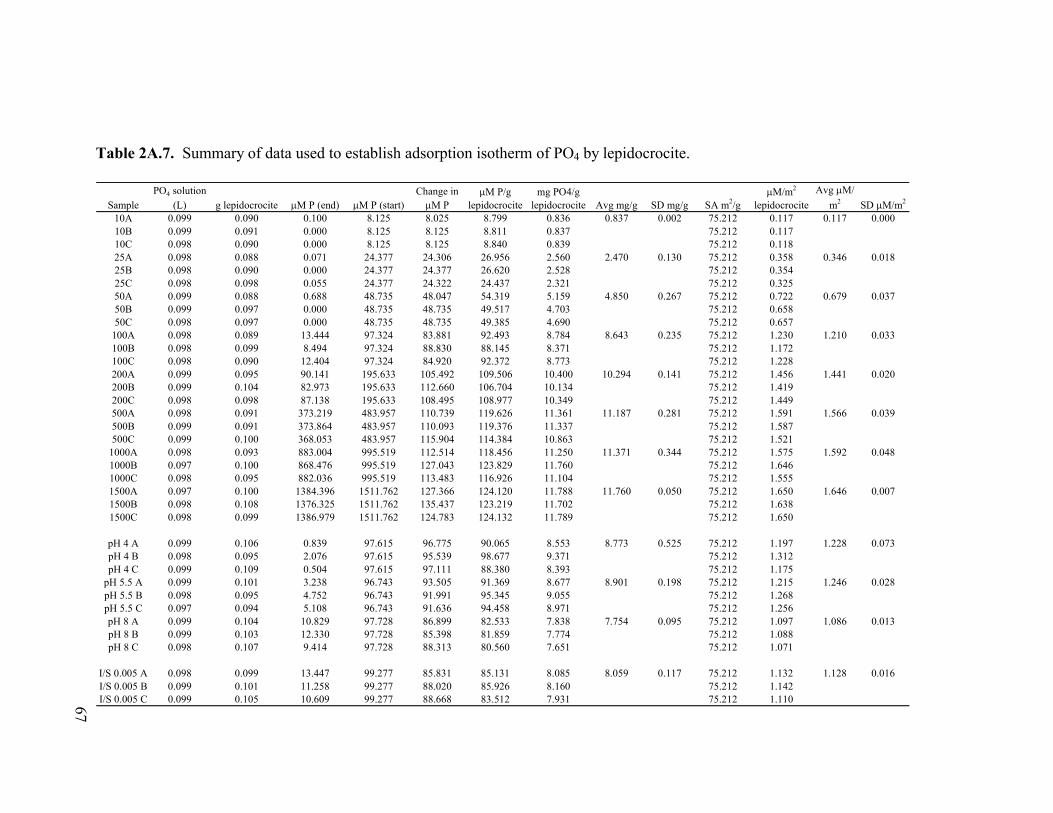
67
Table 2A.7. Summary of data used to establish adsorption isotherm of PO4 by lepidocrocite.
SamplePO4 solution
(L) g lepidocrocite �M P (end) �M P (start)Change in �M P
�M P/g lepidocrocite
mg PO4/g lepidocrocite Avg mg/g SD mg/g SA m2/g
�M/m2
lepidocrociteAvg �M/
m2 SD �M/m2
10A 0.099 0.090 0.100 8.125 8.025 8.799 0.836 0.837 0.002 75.212 0.117 0.117 0.00010B 0.099 0.091 0.000 8.125 8.125 8.811 0.837 75.212 0.11710C 0.098 0.090 0.000 8.125 8.125 8.840 0.839 75.212 0.11825A 0.098 0.088 0.071 24.377 24.306 26.956 2.560 2.470 0.130 75.212 0.358 0.346 0.01825B 0.098 0.090 0.000 24.377 24.377 26.620 2.528 75.212 0.35425C 0.098 0.098 0.055 24.377 24.322 24.437 2.321 75.212 0.32550A 0.099 0.088 0.688 48.735 48.047 54.319 5.159 4.850 0.267 75.212 0.722 0.679 0.03750B 0.099 0.097 0.000 48.735 48.735 49.517 4.703 75.212 0.65850C 0.098 0.097 0.000 48.735 48.735 49.385 4.690 75.212 0.657
100A 0.098 0.089 13.444 97.324 83.881 92.493 8.784 8.643 0.235 75.212 1.230 1.210 0.033100B 0.098 0.099 8.494 97.324 88.830 88.145 8.371 75.212 1.172100C 0.098 0.090 12.404 97.324 84.920 92.372 8.773 75.212 1.228200A 0.099 0.095 90.141 195.633 105.492 109.506 10.400 10.294 0.141 75.212 1.456 1.441 0.020200B 0.099 0.104 82.973 195.633 112.660 106.704 10.134 75.212 1.419200C 0.098 0.098 87.138 195.633 108.495 108.977 10.349 75.212 1.449500A 0.098 0.091 373.219 483.957 110.739 119.626 11.361 11.187 0.281 75.212 1.591 1.566 0.039500B 0.099 0.091 373.864 483.957 110.093 119.376 11.337 75.212 1.587500C 0.099 0.100 368.053 483.957 115.904 114.384 10.863 75.212 1.521
1000A 0.098 0.093 883.004 995.519 112.514 118.456 11.250 11.371 0.344 75.212 1.575 1.592 0.0481000B 0.097 0.100 868.476 995.519 127.043 123.829 11.760 75.212 1.6461000C 0.098 0.095 882.036 995.519 113.483 116.926 11.104 75.212 1.5551500A 0.097 0.100 1384.396 1511.762 127.366 124.120 11.788 11.760 0.050 75.212 1.650 1.646 0.0071500B 0.098 0.108 1376.325 1511.762 135.437 123.219 11.702 75.212 1.6381500C 0.098 0.099 1386.979 1511.762 124.783 124.132 11.789 75.212 1.650
pH 4 A 0.099 0.106 0.839 97.615 96.775 90.065 8.553 8.773 0.525 75.212 1.197 1.228 0.073pH 4 B 0.098 0.095 2.076 97.615 95.539 98.677 9.371 75.212 1.312pH 4 C 0.099 0.109 0.504 97.615 97.111 88.380 8.393 75.212 1.175
pH 5.5 A 0.099 0.101 3.238 96.743 93.505 91.369 8.677 8.901 0.198 75.212 1.215 1.246 0.028pH 5.5 B 0.098 0.095 4.752 96.743 91.991 95.345 9.055 75.212 1.268pH 5.5 C 0.097 0.094 5.108 96.743 91.636 94.458 8.971 75.212 1.256pH 8 A 0.099 0.104 10.829 97.728 86.899 82.533 7.838 7.754 0.095 75.212 1.097 1.086 0.013pH 8 B 0.099 0.103 12.330 97.728 85.398 81.859 7.774 75.212 1.088pH 8 C 0.098 0.107 9.414 97.728 88.313 80.560 7.651 75.212 1.071
I/S 0.005 A 0.098 0.099 13.447 99.277 85.831 85.131 8.085 8.059 0.117 75.212 1.132 1.128 0.016I/S 0.005 B 0.099 0.101 11.258 99.277 88.020 85.926 8.160 75.212 1.142I/S 0.005 C 0.099 0.105 10.609 99.277 88.668 83.512 7.931 75.212 1.110
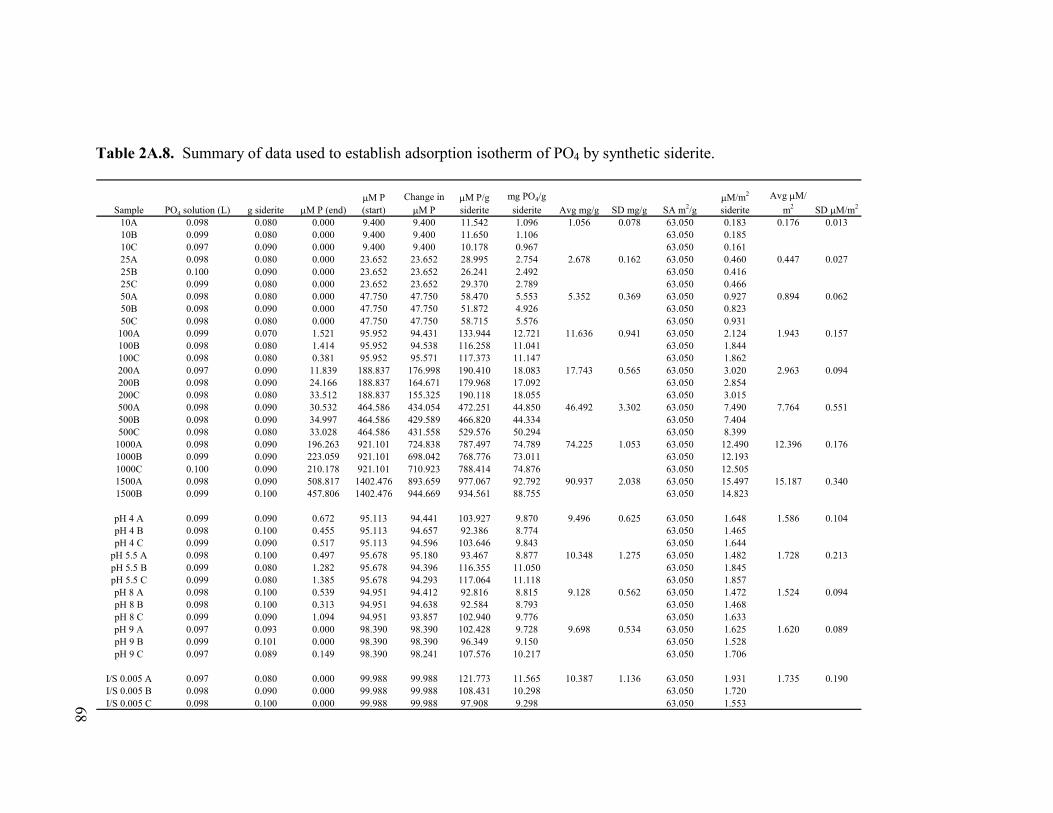
68
Table 2A.8. Summary of data used to establish adsorption isotherm of PO4 by synthetic siderite.
Sample PO4 solution (L) g siderite �M P (end)�M P (start)
Change in �M P
�M P/g siderite
mg PO4/g siderite Avg mg/g SD mg/g SA m2/g
�M/m2
sideriteAvg �M/
m2 SD �M/m2
10A 0.098 0.080 0.000 9.400 9.400 11.542 1.096 1.056 0.078 63.050 0.183 0.176 0.01310B 0.099 0.080 0.000 9.400 9.400 11.650 1.106 63.050 0.18510C 0.097 0.090 0.000 9.400 9.400 10.178 0.967 63.050 0.16125A 0.098 0.080 0.000 23.652 23.652 28.995 2.754 2.678 0.162 63.050 0.460 0.447 0.02725B 0.100 0.090 0.000 23.652 23.652 26.241 2.492 63.050 0.41625C 0.099 0.080 0.000 23.652 23.652 29.370 2.789 63.050 0.46650A 0.098 0.080 0.000 47.750 47.750 58.470 5.553 5.352 0.369 63.050 0.927 0.894 0.06250B 0.098 0.090 0.000 47.750 47.750 51.872 4.926 63.050 0.82350C 0.098 0.080 0.000 47.750 47.750 58.715 5.576 63.050 0.931
100A 0.099 0.070 1.521 95.952 94.431 133.944 12.721 11.636 0.941 63.050 2.124 1.943 0.157100B 0.098 0.080 1.414 95.952 94.538 116.258 11.041 63.050 1.844100C 0.098 0.080 0.381 95.952 95.571 117.373 11.147 63.050 1.862200A 0.097 0.090 11.839 188.837 176.998 190.410 18.083 17.743 0.565 63.050 3.020 2.963 0.094200B 0.098 0.090 24.166 188.837 164.671 179.968 17.092 63.050 2.854200C 0.098 0.080 33.512 188.837 155.325 190.118 18.055 63.050 3.015500A 0.098 0.090 30.532 464.586 434.054 472.251 44.850 46.492 3.302 63.050 7.490 7.764 0.551500B 0.098 0.090 34.997 464.586 429.589 466.820 44.334 63.050 7.404500C 0.098 0.080 33.028 464.586 431.558 529.576 50.294 63.050 8.399
1000A 0.098 0.090 196.263 921.101 724.838 787.497 74.789 74.225 1.053 63.050 12.490 12.396 0.1761000B 0.099 0.090 223.059 921.101 698.042 768.776 73.011 63.050 12.1931000C 0.100 0.090 210.178 921.101 710.923 788.414 74.876 63.050 12.5051500A 0.098 0.090 508.817 1402.476 893.659 977.067 92.792 90.937 2.038 63.050 15.497 15.187 0.3401500B 0.099 0.100 457.806 1402.476 944.669 934.561 88.755 63.050 14.823
pH 4 A 0.099 0.090 0.672 95.113 94.441 103.927 9.870 9.496 0.625 63.050 1.648 1.586 0.104pH 4 B 0.098 0.100 0.455 95.113 94.657 92.386 8.774 63.050 1.465pH 4 C 0.099 0.090 0.517 95.113 94.596 103.646 9.843 63.050 1.644
pH 5.5 A 0.098 0.100 0.497 95.678 95.180 93.467 8.877 10.348 1.275 63.050 1.482 1.728 0.213pH 5.5 B 0.099 0.080 1.282 95.678 94.396 116.355 11.050 63.050 1.845pH 5.5 C 0.099 0.080 1.385 95.678 94.293 117.064 11.118 63.050 1.857pH 8 A 0.098 0.100 0.539 94.951 94.412 92.816 8.815 9.128 0.562 63.050 1.472 1.524 0.094pH 8 B 0.098 0.100 0.313 94.951 94.638 92.584 8.793 63.050 1.468pH 8 C 0.099 0.090 1.094 94.951 93.857 102.940 9.776 63.050 1.633pH 9 A 0.097 0.093 0.000 98.390 98.390 102.428 9.728 9.698 0.534 63.050 1.625 1.620 0.089pH 9 B 0.099 0.101 0.000 98.390 98.390 96.349 9.150 63.050 1.528pH 9 C 0.097 0.089 0.149 98.390 98.241 107.576 10.217 63.050 1.706
I/S 0.005 A 0.097 0.080 0.000 99.988 99.988 121.773 11.565 10.387 1.136 63.050 1.931 1.735 0.190I/S 0.005 B 0.098 0.090 0.000 99.988 99.988 108.431 10.298 63.050 1.720I/S 0.005 C 0.098 0.100 0.000 99.988 99.988 97.908 9.298 63.050 1.553
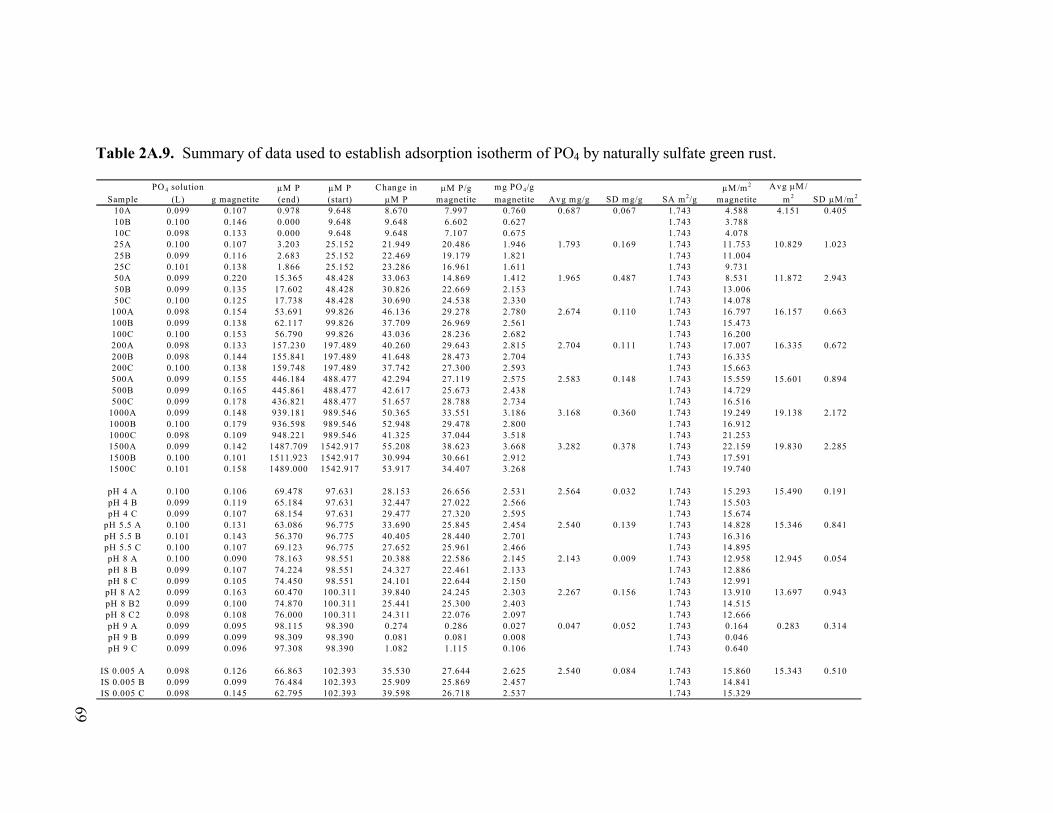
69
Table 2A.9. Summary of data used to establish adsorption isotherm of PO4 by naturally sulfate green rust.
SamplePO 4 solution
(L) g magnetite�M P (end)
�M P (start)
Change in �M P
�M P/g magnetite
mg PO 4/g magnetite Avg mg/g SD mg/g SA m2/g
�M /m 2
magnetiteAvg �M /
m 2 SD �M /m 2
10A 0.099 0.107 0.978 9.648 8.670 7.997 0.760 0.687 0.067 1.743 4.588 4.151 0.40510B 0.100 0.146 0.000 9.648 9.648 6.602 0.627 1.743 3.78810C 0.098 0.133 0.000 9.648 9.648 7.107 0.675 1.743 4.07825A 0.100 0.107 3.203 25.152 21.949 20.486 1.946 1.793 0.169 1.743 11.753 10.829 1.02325B 0.099 0.116 2.683 25.152 22.469 19.179 1.821 1.743 11.00425C 0.101 0.138 1.866 25.152 23.286 16.961 1.611 1.743 9.73150A 0.099 0.220 15.365 48.428 33.063 14.869 1.412 1.965 0.487 1.743 8.531 11.872 2.94350B 0.099 0.135 17.602 48.428 30.826 22.669 2.153 1.743 13.00650C 0.100 0.125 17.738 48.428 30.690 24.538 2.330 1.743 14.078
100A 0.098 0.154 53.691 99.826 46.136 29.278 2.780 2.674 0.110 1.743 16.797 16.157 0.663100B 0.099 0.138 62.117 99.826 37.709 26.969 2.561 1.743 15.473100C 0.100 0.153 56.790 99.826 43.036 28.236 2.682 1.743 16.200200A 0.098 0.133 157.230 197.489 40.260 29.643 2.815 2.704 0.111 1.743 17.007 16.335 0.672200B 0.098 0.144 155.841 197.489 41.648 28.473 2.704 1.743 16.335200C 0.100 0.138 159.748 197.489 37.742 27.300 2.593 1.743 15.663500A 0.099 0.155 446.184 488.477 42.294 27.119 2.575 2.583 0.148 1.743 15.559 15.601 0.894500B 0.099 0.165 445.861 488.477 42.617 25.673 2.438 1.743 14.729500C 0.099 0.178 436.821 488.477 51.657 28.788 2.734 1.743 16.516
1000A 0.099 0.148 939.181 989.546 50.365 33.551 3.186 3.168 0.360 1.743 19.249 19.138 2.1721000B 0.100 0.179 936.598 989.546 52.948 29.478 2.800 1.743 16.9121000C 0.098 0.109 948.221 989.546 41.325 37.044 3.518 1.743 21.2531500A 0.099 0.142 1487.709 1542.917 55.208 38.623 3.668 3.282 0.378 1.743 22.159 19.830 2.2851500B 0.100 0.101 1511.923 1542.917 30.994 30.661 2.912 1.743 17.5911500C 0.101 0.158 1489.000 1542.917 53.917 34.407 3.268 1.743 19.740
pH 4 A 0.100 0.106 69.478 97.631 28.153 26.656 2.531 2.564 0.032 1.743 15.293 15.490 0.191pH 4 B 0.099 0.119 65.184 97.631 32.447 27.022 2.566 1.743 15.503pH 4 C 0.099 0.107 68.154 97.631 29.477 27.320 2.595 1.743 15.674
pH 5.5 A 0.100 0.131 63.086 96.775 33.690 25.845 2.454 2.540 0.139 1.743 14.828 15.346 0.841pH 5.5 B 0.101 0.143 56.370 96.775 40.405 28.440 2.701 1.743 16.316pH 5.5 C 0.100 0.107 69.123 96.775 27.652 25.961 2.466 1.743 14.895pH 8 A 0.100 0.090 78.163 98.551 20.388 22.586 2.145 2.143 0.009 1.743 12.958 12.945 0.054pH 8 B 0.099 0.107 74.224 98.551 24.327 22.461 2.133 1.743 12.886pH 8 C 0.099 0.105 74.450 98.551 24.101 22.644 2.150 1.743 12.991
pH 8 A2 0.099 0.163 60.470 100.311 39.840 24.245 2.303 2.267 0.156 1.743 13.910 13.697 0.943pH 8 B2 0.099 0.100 74.870 100.311 25.441 25.300 2.403 1.743 14.515pH 8 C2 0.098 0.108 76.000 100.311 24.311 22.076 2.097 1.743 12.666pH 9 A 0.099 0.095 98.115 98.390 0.274 0.286 0.027 0.047 0.052 1.743 0.164 0.283 0.314pH 9 B 0.099 0.099 98.309 98.390 0.081 0.081 0.008 1.743 0.046pH 9 C 0.099 0.096 97.308 98.390 1.082 1.115 0.106 1.743 0.640
IS 0.005 A 0.098 0.126 66.863 102.393 35.530 27.644 2.625 2.540 0.084 1.743 15.860 15.343 0.510IS 0.005 B 0.099 0.099 76.484 102.393 25.909 25.869 2.457 1.743 14.841IS 0.005 C 0.098 0.145 62.795 102.393 39.598 26.718 2.537 1.743 15.329

71
REFERENCES
Ainsworth, C.C., M.E. Sumner, and V.J. Hurst. 1985. Effect of Aluminum Substitution in Goethite on Phosphorus Adsorption: I Adsorption and Isotopic Exchange. Soil Sci. Soc. Am. J. 49:1142-1153.
Arai, Y., and D.L. Sparks. 2001. ATR-FTIR spectroscopic investigation on phosphate
adsorption mechanisms at the ferrihydrite-water interface. J. Colloid Interface Sci. 241:317-326.
Berner, E.K., and R.A. Berner. 1996. Global Environment: Water, Air, and Geochemical
Cycles Prentice Hall, Upper Saddle River, NJ. Benjamin, M.M. 2002. Water Chemistry. McGraw-Hill Higher Education, New York. Blanchar, R.W., and M.D. Frazier. 1991. Soil model of iron phosphate solubility. Dev.
Plant Soil Sci. 45:99-105. Borggaard, O.K. 1983. Effect of surface area and mineralogy of iron oxides on their
surface charge and anion-adsorption. Clays Clay Miner. 31:230-232. Brady, N.C., and R.R. Weil. 1999. The Nature and Properties of Soils. 12th ed. Prentice
Hall, Upper Saddle River, NJ. Brunauer, S., P.H. Emmett, and E. Teller. 1938. Adsorption of gases in multi-molecular
layers. J. Am. Chem. Soc. 60:309-319. Celi, L., E. Barberis, and F.A. Marsan. 2000. Sorption of phosphate on goethite at high
concentrations. Soil Sci. 165:657-664. Colombo, C., V. Barron, and J. Torrent. 1994. Phosphate adsorption and desorption in
relation to morphology and crystal properties of synthetic hematites. Geochim. Cosmochim. Acta 58:1261-1269.
Cornell, R.M., and U. Schwertmann. 1996. The iron oxides: structure, properties,
reactions, occurrences and uses Weinhein: VCH, New York. Deer, W.A., R.A. Howie, and J. Zussman. 1995. An Introduction to the Rock Forming
Minerals. 2nd ed. Longman Group Limited, Essex. Enyard, A. 1994. Relationship of well- and poorly crystallized iron oxides with
phosphate and water retention by soils, a review. Mineral. Petrol. Acta 36:343-350.
Erbs, M., H.C.B. Hansen, and C.E. Olsen. 1999. Reductive dechlorination of carbon
tetrachloride using iron(II) iron(III) hydroxide sulfate (green rust). Environ. Sci. Technol. 33:307-311.
72
Filippelli, G.M., and C. Souch. 1999. Effects of climate and landscape development on
the terrestrial phosphorus cycle. Geology 27:171-174. Fredrickson, J.K., J.M. Zachara, D.W. Kennedy, H. Dong, T.C. Onstott, N.W. Hinman,
and S.M. Li. 1998. Biogenic iron mineralization accompanying the dissimilatory reduction of hydrous ferric oxide by a groundwater bacterium. Geochim. Cosmochim. Acta 62:3239-3257.
Geelhoed, J.S., T. Hiemstra, and W.H. VanRiemsdijk. 1997. Phosphate and sulfate
adsorption on goethite: single anion and competitive adsorption. Geochim. Cosmochim. Acta 61:2389-2396.
Gerke, J. 1993. Phosphate adsorption by humic/Fe-oxide mixtures aged at pH 4 and 7 and
by poorly ordered Fe-oxide. Geoderma 59:279-288. Goldberg, S. 1983. A chemical model of phosphate adsorption on oxide minerals and
soils. Doctoral, University of California, Riverside, Riverside, CA. Golterman, H.L. 1995. Theoretical aspects of the adsorption of o-phosphate onto iron-
hydroxide. Hydrobiologia 315:59-68. Hallbeck, L., F. Stahl, and K. Pedersen. 1993. Phylogeny and phenotypic characterization
of the stalk-forming and iron-oxidizing bacterium Gallionella ferruginea. J. Gen. Microbiol. 139:1531-1535.
Hansen, H.C.B., C.B. Koch, H. Nancke-Krogh, O.K. Borggaard, and J. Sorensen. 1996.
Abiotic Nitrate Reduction to Ammonium: Key Role of Green Rust. Environ. Sci. Technol. 30:2053-2056.
Hansen, H.C.B., and I.F. Poulsen. 1999. Interaction of synthetic sulphate "green rust"
with phosphate and the crystallization of vivianite. Clays Clay Miner. 47:312-318. Hingston, F.J., A.M. Posner, and J.P. Quirk. 1972. Anion adsorption by goethite and
gibbsite. I. The role of the proton in determining adsorption envelopes. J. Soil Sci. 23:177-192.
Lewis, D.G. 1997. Factors influencing the stability and properties of green rusts. Adv.
GeoEcology 30:345-372. Loyaux-Lawniczak, S., P. Refait, J.-J. Ehrhardt, P. Lecomte, and J. Genin. 2000.
Trapping of Cr by formation of ferrihydrite during the reduction of chromate ions by Fe(II) and Fe(III) Hydroxysalt Green Rusts. Environ. Sci. Technol. 34:438-443.

73
Madrid, L., and P. DeArambarri. 1985. Adsorption of phosphate by two iron oxides in relation to their porosity. J. Soil Sci. 36:523-530.
McLaughlin, J.R., J.C. Ryden, and J.K. Syers. 1977. Development and evaluation of a
kinetic model to describe phosphate sorption by hydrous ferric oxide. Geoderma 18:295-307.
McLaughlin, J.R., J.C. Ryden, and J.K. Syers. 1981. Sorption of inorganic phosphate by
iron- and aluminum-containing components. J. Soil Sci. 32:365-377. Miltenburg, J.C., and H.L. Golterman. 1998. The energy of adsorption of o-phosphate
onto ferric hydroxide. Hydrobiologia 364:93-97. Myneni, S.C.B., T.K. Tokunaga, and G.E.Brown, Jr. 1997. Abiotic selenium redox
transformations in the presence of Fe(II,III) oxides. Science 278:1106-1109. Noe, G.B., D.L. Childers, and R.D. Jones. 2001. Phosphorus biogeochemistry and the
impact of phosphorus enrichment: Why is the Everglades so unique? Ecosystems 4:603-624.
Olila, O.G., and K.R. Reddy. 1995. Influence of pH on Phosphorus Retention in Oxidized
Lake Sediments. Soil Sci. Soc. Am. J. 59:946-959. Parfitt, R.L., R.J. Atkinson, and R. St.C.Smart. 1975. The mechanism of phosphate
fixation by iron oxides. Soil Sci. Soc. Am. J. 39:837-841. Parfitt, R.L., and J.D. Russell. 1977. Adsorption on hydrous oxides. IV. Mechanisms of
adsorption of various ions on goethite. J. Soil Sci. 28:297-305. Patrick Jr., W.H., and R.A. Khalid. 1974. Phosphate release and sorption by soils and
sediments: effect of aerobic and anaerobic conditions. Science 186:53-55. Reddy, K.R., R.H. Kadlec, E. Flaig, and P.M. Gale. 1999. Phosphorus retention in
streams and wetlands--a review. Crit. Rev. Environ. Sci. Technol. 29:86-146. Reynolds, J.G., D.V. Naylor, and S.E. Fendorf. 1999. Arsenic sorption in phosphate-
amended soils during flooding and subsequent aeration. Soil Sci. Soc. Am. J. 63:1149-1156.
Ryden, J.C., J.R. McLaughlin, and J.K. Syers. 1977a. Mechanisms of phosphate sorption
by soils and hydrous ferric oxide gel. J. Soil Sci. 28:72-92. Ryden, J.C., J.K. Syers, and J.R. McLaughlin. 1977b. Effects of ionic strength on
chemisorption and potential-determining sorption of phosphate by soils. J. Soil Sci. 28:62-71.
74
Schlesinger, W.H. 1991. Biogeochemistry: An Analysis of Global Change. Academic Press, Inc., San Diego.
Schwertmann, U., and H. Fecther. 1994. The formation of green rust and its
transformation to lepidocrocite. Clay Mineral. 29:87-92. Shang, C., J.W.B. Stewart, and P.M. Huang. 1992. pH effect on kinetics of adsorption of
organic and inorganic phosphates by short-range ordered aluminum and iron precipitates. Geoderma 53:1-14.
Sparks, D.L. 1995. Environmental Soil Chemistry. Harcourt Brace and Company, San Diego, CA.
Strauss, R., G.W. Bruemmer, and N.J. Barrow. 1997. Effects of crystallinity of goethite
II: Rates of sorption and desorption of phosphate. Eur. J. Soil Sci. 48:101-114. Stumm, W., and J.J. Morgan. 1981. Aquatic Chemisty: An Introduction Emphasizing
Chemical Equilibria in Natural Waters John Wiley & Sons, Toronto. Torrent, J., V. Barron, and U. Schwertmann. 1990. Phosphate adsorption and desorption
by goethites differing in crystal morphology. Soil Sci. Soc. Am. J. 54:1007-1012. Torrent, J., U. Schwertmann, and V. Barron. 1994. Phosphate sorption by natural
hematites. Eur. J. Soil Sci. 45:45-51. Torrent, J. 1997. Interactions between phosphate and iron oxide. Adv. GeoEcology
30:321-344. Willett, I.R., and R.B. Cunningham. 1983. Influence of sorbed phosphate on the stability
of ferric hydrous oxide under controlled pH and Eh conditions. Aust. J. Soil Res. 21:301-308.
Williams, J.D.H., J.K. Syers, S.S. Shukla, and R.F. Harris. 1971. Levels of inorganic and
total phosphorus in lake sediments as related to other sediment parameters. Environ. Sci. Technol. 5:1113-1120.
Zachara, J.M., J.K. Fredrickson, S.M. Li, D.W. Kennedy, S.C. Smith, and P.L. Gassman.
1998. Bacterial reduction of crystalline Fe3+ oxides in single phase suspensions and subsurface materials. Am. Mineral. 83:1426-1443.

75
CHAPTER 3
Phosphate Adsorption by Heterogeneous Mixtures of Ferrous and Ferric Oxides Under Hydrodynamic Conditions
INTRODUCTION
I. Importance and cycling of phosphate in the natural environment
Phosphate is an essential component of ATP (adenosine tri-phosphate), DNA
(deoxyribonucleic acid), RNA (ribonucleic acid), and phospholipids as a result of its
unique chemical properties. The critical roles occupied by phosphate in combination
with relatively low availability leads to very rapid biological cycling and a high level of
phosphate conservation in undisturbed ecosystems (Schlesinger, 1991). Freshwater and
estuarine ecosystems are often nutrient limited and are particularly sensitive to increases
in phosphate (Reddy et al., 1999; Manahan, 1994). While phosphate is not directly toxic
to aquatic organisms, eutrophication and toxic algal blooms do cause fish kills.
Eutrophication occurs when a limiting nutrient is added to a water body. The resulting
algal blooms consume oxygen and prevent light infiltration. As the algae begin to die
and decompose the biological oxygen demand spikes, resulting in anoxia (Brady and
Weil, 1999). Recent studies in the Everglades document that small additions of
phosphate, due to increased runoff from agriculture, appear to be altering the ecology of
the area (DeBusk et al., 2001; Noe et al., 2001; DeBusk et al., 1994).
The prominent correlation between phosphorus and iron minerals in estuaries
(Pant and Reddy, 2001; Roden and Edmunds, 1997), lake and ocean sediments (Young
and Ross, 2001; Slomp et al., 1998; Olila and Reddy, 1997; Olila and Reddy, 1995;
Moore and Reddy, 1994), and soils (Golterman, 1999; DeMello et al., 1998; Szilas et al.,
1998; Willett and Higgens, 1978) has led to numerous examinations of P adsorption
capacities and mechanisms by iron oxides and hydroxides. The most commonly studied
ferric minerals have been hematite and goethite since they are the most stable and most
abundant, although not necessarily the most reactive, iron minerals found in soils
(Cornell and Schwertmann, 1996; Sparks, 1995; Torrent et al., 1994). The mechanism of
phosphate adsorption onto ferric oxides is dominated by ligand exchange in which two
singly coordinated hydroxyl groups or water molecules are replaced by a single
phosphate anion resulting in the formation of a bidentate, binuclear complex (Reddy et

76
al., 1999; Torrent, 1997; Colombo et al., 1994; Goldberg and Sposito, 1985; Parfitt and
Russell, 1977; Parfitt et al., 1975). The phosphate surface complexes are very stable and
result in slow exchange rates and an apparent irreversibility (hysterisis) of phosphorus
adsorption. The strength of these complexes leads to long-term phosphorus storage in
soils, sediments, and wetlands (Reddy et al., 1999; Goldberg and Sposito, 1985; Parfitt et
al., 1975). Phosphate sorption by soils and pure mineral phases occurs in two distinct
steps - rapid adsorption taking place during the first few minutes of the reaction followed
by a slower stage (Reddy et al., 1999; Strauss et al., 1997; McLaughlin et al., 1977).
Slow adsorption increases with specific surface area, porosity, and ferrihydrite impurities
(Strauss et al., 1997; Torrent 1997; Torrent et al., 1994), and it has also been attributed to
diffusion of phosphate into the structural pores and defects of soil minerals (Ryden et al.
1977a). The slow sorption step has also been associated with the irreversibility of
phosphate retention by soils and pure iron oxides (Madrid and DeArambarri, 1985;
Ryden and Syers, 1977). The phosphate adsorption capacity of iron oxides generally
averages 2.5 µM P/m2, but ranges from 1.5 to 3.5 µM/m2 (Reddy et al., 1999; Torrent
1997; Enyard, 1994; Torrent et al., 1990; Borggaard, 1983
Solution pH will determine the extent, rate, and mechanism of adsorption by iron
oxides. In general, it appears that phosphorus sorption by ferric oxides decreases with
increasing pH (Geelhoed, 1997; Willett and Cunningham, 1983; Ryden et al., 1977b;
McLaughlin et al., 1977; and Hingston et al., 1972). Strauss et al. (1997) and Shang et al.
(1992) noted that pH was a particularly important control on P adsorption kinetics during
the initial rapid reaction. Ionic strength and competition with other ions also influence
phosphate retention. Ryden et al. (1977b) and McLaughlin et al. (1977) found P
adsorption onto ferric hydroxide gel to increase with ionic strength. Ryden et al. (1977b)
also noted that the ionic strength effects on chemisorption were predominantly kinetic
and that the effects on physical adsorption were absolute. Arai and Sparks (2001) found
that at pH greater than 7.5, P adsorption by ferrihydrite increased with ionic strength.
Celi et al. (2000) observed increased phosphorus sorption by goethite with ionic strength
in agreement with Ryden et al. (1977b).
Phosphate transport is a concern in many areas, particularly locations where
sewage is primarily treated using septic system infiltration beds. Since P is a limiting
77
nutrient in most freshwater systems understanding the factors influencing P retention,
such as adsorption and mineral precipitation, are important considerations (Robertson et
al., 1998; Zanini et al., 1998; Robertson, 1995). Additionally, understanding the factors
inhibiting phosphate adsorption is necessary to predict the fate of P and for the design
and operation of remediation systems.
Walter et al. (1999) examined P transport in a glacial aquifer on Cape Cod; excess
P was derived from sewage disposal on a military base. They noted that P adsorption by
Al and Fe oxides has greatly retarded the movement of the plume relative to groundwater
flow rates. Phosphorus sorbs very strongly to surfaces of Fe and Al oxides, which
commonly coat sediment grains in glacial aquifers, thus retarding P transport; in many
areas, 90 to 99% of the P in a given volume of aquifer is contained on sediment surfaces.
Even though sorption processes are inhibiting P transport, continued loading is creating a
large P reservoir that might be released later. Increased loading also allows for P
breakthrough and inhibits retention. It is possible, however, that P desorption may occur
with the influx of fresh water.
Stollenwerk (1996) simulated P transport through the Cape Cod aquifer and
observed that the amount of P in solution is dependant upon P concentration and pH. He
also observed that even though P input had discontinued, a large reservoir remained in
the sediments, which could desorb later and affect nearby water bodies. During column
experiments, higher feed concentration resulted in more rapid saturation of adsorption
sites and earlier breakthrough. At lower concentrations, the breakthrough curve was
more gradual and complete saturation took longer.
P transport has also been observed in oxic and suboxic conditions. Oxic and sub
oxic sediments have the capacity to completely sorb inflowing P for long periods of time;
however this is dependant on pH and upon how long the column has been loaded (or how
near the adsorption capacity it is) (Walter et al., 1999).
Phosphorus transport is commonly associated with the reductive dissolution of
Fe(III) (hydr)oxides (Jensen et al., 1999; Szilas et al., 1998; Olila and Reddy, 1997).
Jensen et al. (1999) noted two steps of transport for reactive solutes through structured
soils. The initial loading step involves the transfer from source (solid phase) to solution
(mobile or percolating phase). The second step is translocation, or transport with the
78
mobile phase. They postulated that P associated with, Fe(III), a redox sensitive species,
under reducing conditions is released, and if surrounding solution is mobile, the initial
step is favored. During reductive dissolution the released Fe(II) was resorbed; however,
soil had less affinity for iron than phosphate.
II. Need and Research Objectives
The goal of this study is to specifically evaluate the interaction of iron and
phosphate in several controlled, dynamic systems. Since iron is a predominant sorbent of
phosphate in many systems (Pant and Reddy, 2001; Young and Ross, 2001; Golterman,
1999; DeMello et al., 1998; Slomp et al., 1998; Szilas et al., 1998; Olila and Reddy,
1997; Roden and Edmunds, 1997; Olila and Reddy, 1995; Moore and Reddy, 1994;
Willett and Higgens, 1978), the results from this study will help determine how nutrients,
specifically phosphate, interact with iron phases in dynamic, suboxic environments. This
research will also help to characterize interaction between iron and phosphate in riparian
and groundwater systems, which will lead to a better understanding of the fate and
transport of phosphate in the freshwater environment. These dynamic experiments are
necessary in order to evaluate phosphate retention under more realistic conditions. The
specific objectives of this project were to compare the phosphate adsorption of minerals
in static and flow conditions. The retention time and capacity of the columns were also
examined; in addition to assessing which iron phases were responsible for phosphate
retention within the columns. These experiments were also used to determine what other
factors are likely to influence phosphate retention in hydrodynamic systems.
A total of six hydrodynamic column experiments were run; three were anoxic and
three were oxic. The three oxic columns all contained only one iron phase, ferrihydrite-
coated sand, and two of the columns were replicates that were poorly buffered while the
third column was well buffered. The three anoxic columns consisted of heterogeneous
mixtures of iron oxides and hydroxides. In two of the anaerobic columns, the iron
reducing bacterium Shewanella putrefaciens (strain CN 32) was used to facilitate the
conversion of ferrihydrite to magnetite, lepidocrocite, and goethite. Ferrous chloride was
used to drive magnetite precipitation, as well as conversion of ferrihydrite to goethite and
lepidocrocite, in the third anoxic column.

79
MATERIALS AND METHODS
A total of six column experiments (ranging in complexity) were conducted to
evaluate the influence of iron oxides and hydroxides on phosphate retention and
transport. Three experiments utilized only ferrihydrite-coated sand and were carried out
under aerobic conditions at ambient temperature. Two of these columns were poorly
buffered while the third was buffered at pH 7 using MOPS. The remaining three
experiments were conducted in an anaerobic glovebox (Coy Products, Ann Arbor, MI)
having O2(g) levels less than 5 ppm. The first of the anaerobic experiments examined
phosphate transport through a FeCl2 reacted ferrihydrite column in which magnetite was
generated as a principal sorbent. The two remaining anaerobic columns, each with a
different feed solution composition, were inoculated with an iron reducing bacterium to
facilitate production of mixed and reduced iron phases such as siderite, magnetite, and
green rust, as well as conversion of ferrihydrite to goethite and lepidocrocite.
I. Ferrihydrite-coated sand preparation
Ferrihydrite (2-line) was made using the method described by Cornell and
Schwertmann (1996). A ferric chloride solution (2.3 L of 0.062 M FeCl36H2O, pH near
2) was titrated with 0.2 M NaOH to pH 7. The solution was then stirred and allowed to
stabilize for several hours, with pH maintained by base addition. Once the solution pH
was stable, the precipitate was allowed to settle and rinsed three times with deionized
water. Ferrihydrite coated sand was made by drying the slurry onto 660 g of Iota 6
Quartz Sand (Umimin Corporation). The sand was dried at room temperature and was
rinsed several times with and stored in deionized water.
II. General column set-up and sampling
Columns, made from acrylic, had dimensions of 25 cm length and 3.5 cm
diameter, with eight sampling ports located along the length of the column (Figure 3.1).
Sampling ports consisted of 16-guage needles held in place by Swage-Loc® fittings.
Prior to insertion, needles were blunted and filled with glass fiber to prevent sand from
escaping. A peristaltic pump was used to introduce feed solution to the bottom of the
column. Effluent was collected in a sampling vessel and excess solution was diverted to
80
a waste container (Figure 3.2). Influent, effluent, and side port samples were collected
and monitored for parameters specific to each column. Side port solution was collected
by closing the valve on the effluent end of the column and directing liquid into a test tube
or syringe.
III. Aerobic columns (ferrihydrite-coated sand only)
During all three aerobic flow experiments the columns were loaded such that
ferrihydrite-coated sand was situated between uncoated silica sand. Coated sand filled
the column between ports 5 through 7, a total length of ~7.5 cm. The remainder of the
column was packed with uncoated silica sand. The large amount of uncoated sand helped
to evenly disperse solution introduced to the column.
Two aerobic column experiments utilized a feed solution containing 100 µM
NaH2PO4 adjusted to pH 7 using NaOH. A third aerobic column was different only in
that the 100 µM NaH2PO4 solution was buffered (pH 7) using 10 mM MOPS (3-(N-
Morpholino) propane sulfonic acid). In all three aerobic experiments, a flow rate of ~0.4
mL/min was used. Flow was discontinued once complete, or near complete (>95%),
phosphate breakthrough was achieved. Initially, feed, effluent and port samples were
collected daily to measure pH and determine phosphate concentration. After 20 days,
sampling was conducted every other day. Samples for elemental analysis were
preserved with concentrated HCl and refrigerated until processed.
Upon experiment termination aliquots, of coated sand were reacted with 6 M HCl
overnight. The extract was diluted and analyzed for P and Fe.
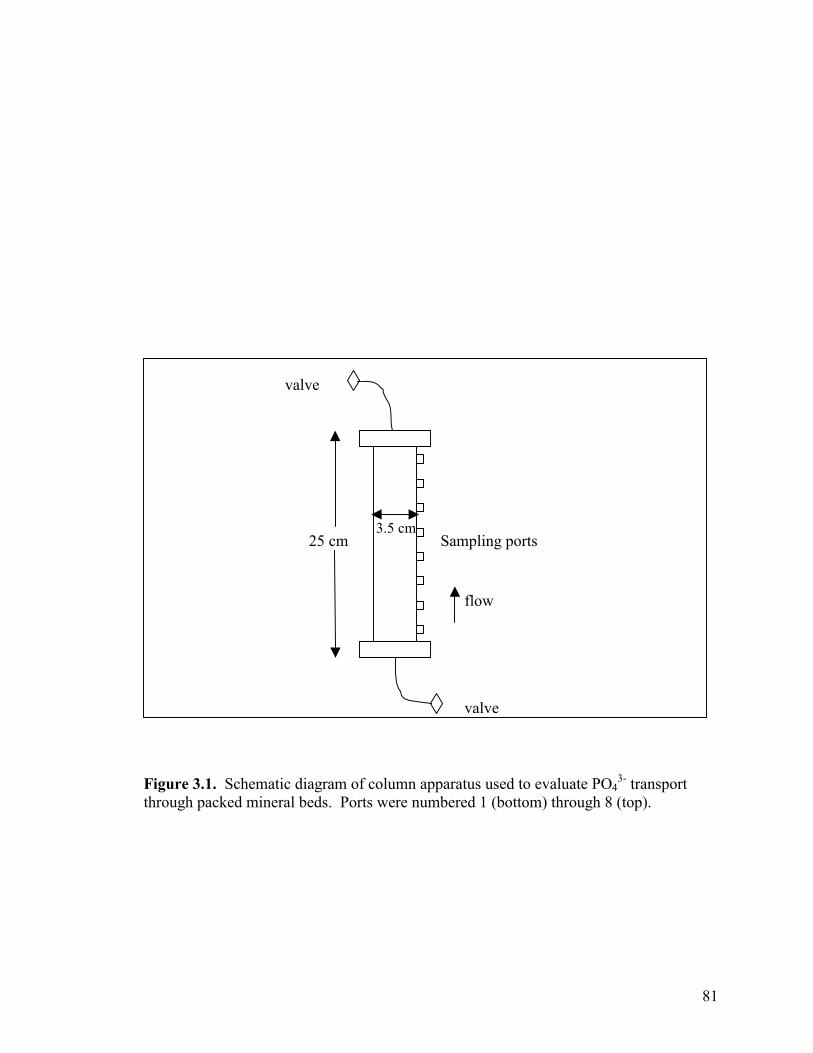
81
Figure 3.1. Schematic diagram of column apparatus used to evaluate PO4
3- transport through packed mineral beds. Ports were numbered 1 (bottom) through 8 (top).
Sampling ports 25 cm 3.5 cm
valve
valve
flow

82
IV. Anaerobic columns (multiple iron phases coating sand)
An initial anaerobic column experiment was conducted involving the abiotic synthesis of
magnetite. A 2 mM FeCl2 solution buffered (pH 7) with 10 mM PIPES (Piperazine-
N,N'-bis-[2-ethanesulfonic acid]) was used as the influent solution into ferrihydrite-
coated sand for the first 120 h to generate magnetite. After generation of magnetite, the
FeCl2 feed was discontinued and the column flushed with deionized water for 20 minutes.
A 100 µM NaH2PO4 solution adjusted to pH 7 (with NaOH) was then introduced and
flow continued until complete phosphate breakthrough was observed. A flow rate of
~0.45 mL/min was maintained throughout the experiment. Influent, effluent, and side
port samples were collected daily for Fe, P, and pH measurement.
When complete breakthrough was observed the column was disassembled and divided
based on obvious color differences. Four aliquots from each section were reacted with 6
M HCl overnight (total extraction). Two of these were used to determine Fe(II) by the
ferrozine method and the other two were used for total Fe and P analysis. Surface area
and solid phase analysis, using extended x-ray absorption fine structure spectroscopy,
were also performed.
Two additional anaerobic columns were used to evaluate phosphate retention
dynamics during the biologically induced reductive dissolution of ferric hydroxide. The
columns were packed so uncoated sand at ports 1 and 8 bracketed ferrihydrite-coated
sand. The coated sand was inoculated with the iron reducing bacterium Shewanella
putrefaciens (strain CN32) during the loading process (see Benner et al., 2002). A
solution representative of groundwater was used on one column and a more heavily
bicarbonate-buffered feed used on the other. Both feed solutions contained ~3.2 mM
lactate as an electron donor. Average feed compositions are listed in Table 3.1. These
two columns are referred to as GW (groundwater) and BC (bicarbonate buffered)
throughout the discussion. The flow velocity was equivalent to 0.5 m/day and the
columns were run for 50 d.
Influent, effluent, and side port samples were collected daily. Alkalinity and pH were
measured by standard procedures. Ion chromatography was used to analyze samples for
lactate, acetate, Cl-, and SO42-. Ferrous iron was determined using the ferrozine method,

83
and elemental concentrations of Ca, Fe, K, Mg, Na, P, S, and Si were measured by ICP-
OES.
Upon termination, material from the packed mineral bed was removed and
divided according to position within the column relative to the side ports. Sand was
homogenized and split into aliquots for bacterial cell counts, EXAFS analysis, total (6 M
HCl) and partial (0.5 M HCl) acid extractions, and wet/dry ratios. Acid extracts were
diluted and analyzed for Ca, Fe, K, Mg, Na, P, S, and Si using ICP-OES and Fe2+ using
the ferrozine method.
V. Static adsorption experiments (on sand)
Static adsorption experiments were conducted on the ferrihydrite-coated sand in
order to determine the adsorption maximum. Solutions used ranged from 500 µM to
1500 µM Na2HPO4. The adsorption maxima for both batches of sand were determined
with solutions having the ionic strength adjusted to 0.1 M with NaCl as well as with
solutions containing only Na2HPO4. The pH was adjusted to 7 using 0.05 M HCl or 0.05
M NaOH. All samples were run in triplicate. Upon completion, 8 mL of solution were
filtered through a 0.45µm filter and acidified using two drops of HNO3. Starting and
ending solutions were analyzed using inductively coupled plasma-optical emission
spectroscopy (ICP-OES). The amount of phosphate adsorbed was determined from the
difference between the initial and final concentrations.
VI. Surface Area Analysis
Specific surface area was determined by N2 adsorption, using the BET equation
(Brunauer et al., 1938). The adsorption curves were obtained using a Coulter SA 3100
surface area analyzer. Samples were degassed by heating for 3 h at 85˚C. Contact with
the atmosphere was avoided by maintaining positive pressure (helium) on the sample
containers.
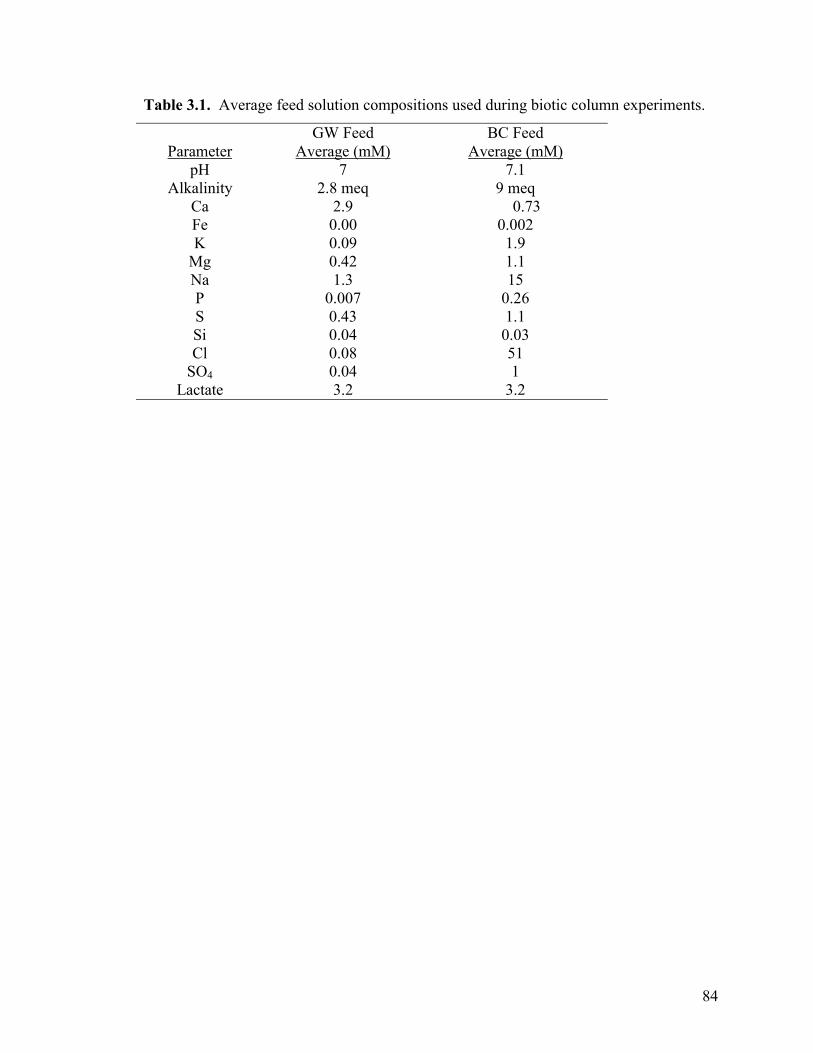
84
Table 3.1. Average feed solution compositions used during biotic column experiments.
GW Feed BC Feed Parameter Average (mM) Average (mM)
pH 7 7.1 Alkalinity 2.8 meq 9 meq
Ca 2.9 0.73 Fe 0.00 0.002 K 0.09 1.9
Mg 0.42 1.1 Na 1.3 15 P 0.007 0.26 S 0.43 1.1 Si 0.04 0.03 Cl 0.08 51
SO4 0.04 1 Lactate 3.2 3.2
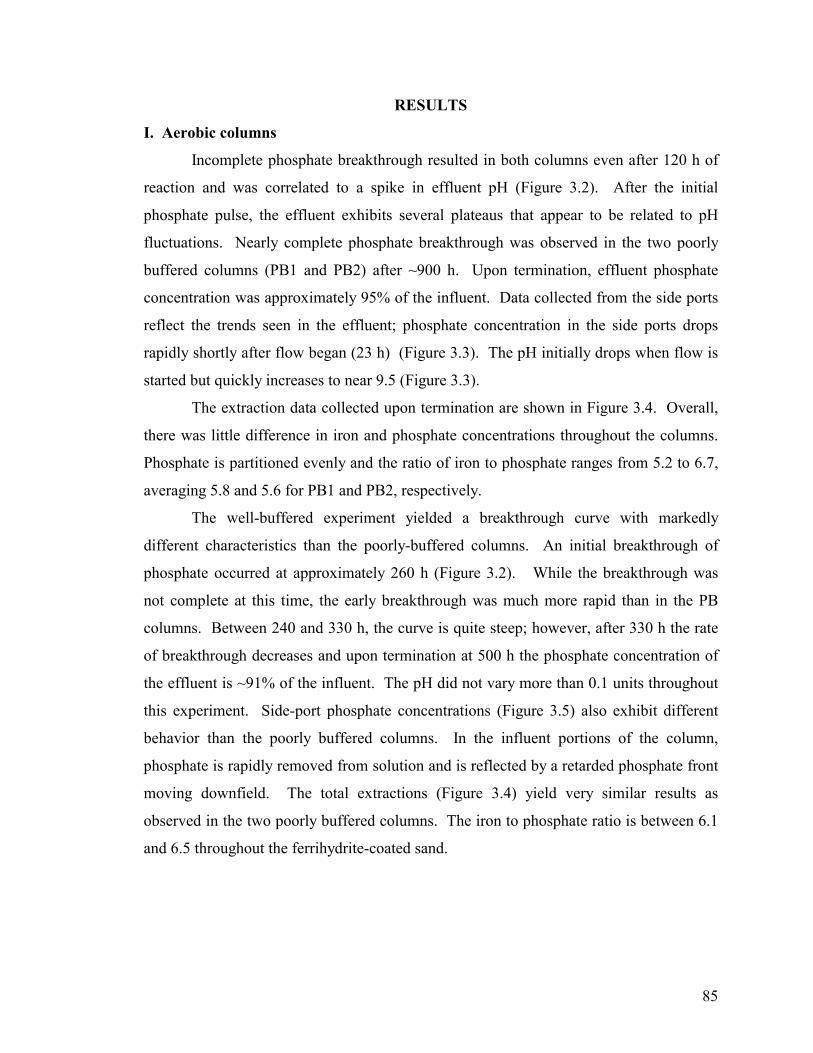
85
RESULTS
I. Aerobic columns
Incomplete phosphate breakthrough resulted in both columns even after 120 h of
reaction and was correlated to a spike in effluent pH (Figure 3.2). After the initial
phosphate pulse, the effluent exhibits several plateaus that appear to be related to pH
fluctuations. Nearly complete phosphate breakthrough was observed in the two poorly
buffered columns (PB1 and PB2) after ~900 h. Upon termination, effluent phosphate
concentration was approximately 95% of the influent. Data collected from the side ports
reflect the trends seen in the effluent; phosphate concentration in the side ports drops
rapidly shortly after flow began (23 h) (Figure 3.3). The pH initially drops when flow is
started but quickly increases to near 9.5 (Figure 3.3).
The extraction data collected upon termination are shown in Figure 3.4. Overall,
there was little difference in iron and phosphate concentrations throughout the columns.
Phosphate is partitioned evenly and the ratio of iron to phosphate ranges from 5.2 to 6.7,
averaging 5.8 and 5.6 for PB1 and PB2, respectively.
The well-buffered experiment yielded a breakthrough curve with markedly
different characteristics than the poorly-buffered columns. An initial breakthrough of
phosphate occurred at approximately 260 h (Figure 3.2). While the breakthrough was
not complete at this time, the early breakthrough was much more rapid than in the PB
columns. Between 240 and 330 h, the curve is quite steep; however, after 330 h the rate
of breakthrough decreases and upon termination at 500 h the phosphate concentration of
the effluent is ~91% of the influent. The pH did not vary more than 0.1 units throughout
this experiment. Side-port phosphate concentrations (Figure 3.5) also exhibit different
behavior than the poorly buffered columns. In the influent portions of the column,
phosphate is rapidly removed from solution and is reflected by a retarded phosphate front
moving downfield. The total extractions (Figure 3.4) yield very similar results as
observed in the two poorly buffered columns. The iron to phosphate ratio is between 6.1
and 6.5 throughout the ferrihydrite-coated sand.

86
Time (h)
0 100 200 300 400 500 600
pH
3
4
5
6
7
8
mM
P
0.0
0.1
0.2
0.3
0.4
0.5
pH (in) pH (out) P (in) P (out)
Time (h)
0 200 400 600 800 1000 1200
pH
3
4
5
6
7
8
9
10
mM
P
0.0
0.1
0.2
0.3
0.4
0.5
pH (in) pH (out) P (in) P (out)
a
b
Figure 3.2. Average influent and effluent P concentration and pH for aerobic columns PB1 and 2 (a) and aerobic well-buffered column (b).

87
P concentration (mM)
0.00 0.02 0.04 0.06 0.08 0.10 0.12 0.14
Dis
tanc
e al
ong
colu
mn
(cm
)
-2
0
2
4
6
8
10
pH
6.5 7.0 7.5 8.0 8.5 9.0 9.5 10.0-2
0
2
4
6
8
10
P concentration (mM)
0.00 0.02 0.04 0.06 0.08 0.10 0.12
Dis
tanc
e al
ong
colu
mn
(cm
)
-2
0
2
4
6
8
10
pH
6.5 7.0 7.5 8.0 8.5 9.0 9.5 10.0-2
0
2
4
6
8
10
23 h120.5 h262.5 h550 h884 h1210 h
a
c
b
d
Figure 3.3. Side-port solution P concentration and pH through time for aerobic columnsPB1 (a-b) and PB2 (c-d). The Y-axis is distance along the column from the beginning ofthe ferrihydrite- coated sand. Data points plotted at –1 and 9 cm represent solution collected from uncoated silica mineral bed. Ferrihydrite-coated sand was present along the column from 0 to 7.5 cm.
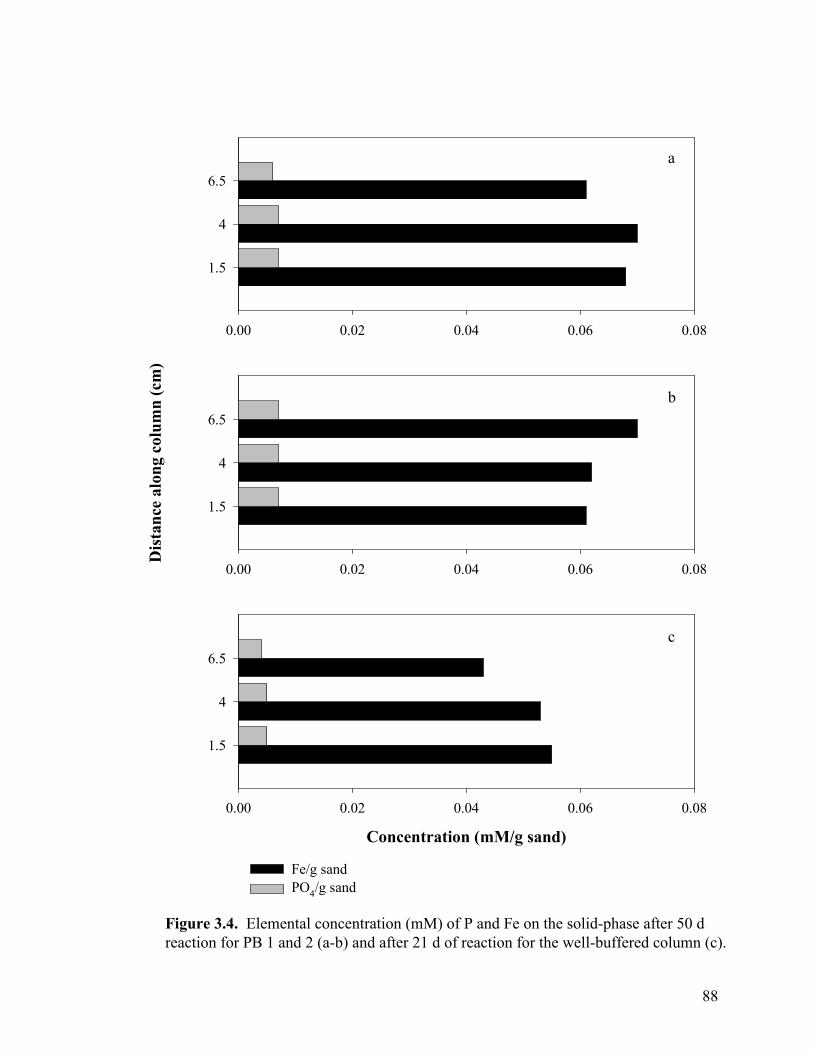
88
Concentration (mM/g sand)
0.00 0.02 0.04 0.06 0.08
1.5
4
6.5
0.00 0.02 0.04 0.06 0.08
Dis
tanc
e al
ong
colu
mn
(cm
)
1.5
4
6.5
0.00 0.02 0.04 0.06 0.08
1.5
4
6.5
Fe/g sandPO4/g sand
Figure 3.4. Elemental concentration (mM) of P and Fe on the solid-phase after 50 d reaction for PB 1 and 2 (a-b) and after 21 d of reaction for the well-buffered column (c).
a
c
b

89
P concentration (mM)
0.00 0.02 0.04 0.06 0.08 0.10 0.12
Dist
ance
alo
ng c
olum
n (c
m)
-2
0
2
4
6
8
1017.5 h 67 h164 h 284 h 334 h 498 h
Figure 3.5. Aqueous P concentrations along the flow-path of the well-buffered, aerobic column. Data points plotted at –1 and 9 cm represent solution collected from uncoated silica mineral bed. Ferrihydrite-coated sand was present along the column from 0 to 7.5 cm.

90
II. Anaerobic columns
An abiotic experiment was conducted to generate mixed-valent iron oxides
common to reduced systems without complications induced by microbial activity.
Previous experiments (Benner et al., 2002) illustrate the similarity in reaction products
between abiotic (Fe(II)) and biotic systems. In order to generate reduced and mixed-
valent iron oxides, an FeCl2 solution was reacted with the ferrihydrite-coated sand for
120 h. At that time the column had changed color due to magnetite precipitation. The
lower section of the column, from the beginning of the ferrihydrite coated sand to 3.5 cm
downfield, was dark black, while the remainder of the column (3.5 cm to 7.5 cm
downfield) was a medium gray (Figure 3.6a). Upon introduction of the phosphate
solution a downfield migration of magnetite was observed, and after 6 d a small (1-2 mm)
band at the bottom of the column had returned to a red-brown color. The band continued
to expand, reaching a length of ~6 mm at experiment termination (Figure 3.6b);
additionally, the darkened band migrated downfield and the top of the column became
darker in color throughout the experiment. Upon termination, the column was sectioned
according to distinct color differences. The small band of red-brown sand was designated
as sample A. Sample B consisted of the darkest band of material from the center portion
of the column. The remaining discolored material was designated sample C. The dashed
white line in Figure 3.6b illustrates the division between samples B and C.
Phosphate breakthrough in the anoxic, anaerobic column was observed after 1 d.
The breakthrough curve was gradual and appeared to be related to a corresponding pH
increase (Figure 3.7a). Phosphate appears to be retained in the lowest portion of the
column, where magnetite had been removed (Figure 3.7b). Additionally, dissolved iron
was detected in the port solutions after the introduction of phosphate and increased with
time (Figure 3.8). Once the P front surpassed 3.5 cm, nearly complete breakthrough
proceeded rapidly. The pH increased up to near 9.5 as soon as the phosphate solution
was introduced into the column (Figure 3.7c). When the ferrihydrite-coated sand was
saturated with P, the pH dropped back to near the influent value. Indeed, phosphate was
sequestered within the small band of ferrihydrite-coated sand at the bottom of the column
(0 - 0.6 cm) (Figure 3.9), consistent with the observed breakthrough characteristics. The

91
remaining sections of the column appear to have an appreciable amount of sorbed Fe(II).
The ratios of Fe(III) to Fe(II) in Samples B and C were 1.3 and 3.1, respectively.
EXAFS (x-ray absorption fine structure) spectroscopic analysis was used to
determine the approximate mineralogical compositions in the top (Sample C), middle
(Sample B), and bottom (Sample A) of the column (Figure 3.10) following procedures
described in Benner et al. (2002). Table 3.2 lists the approximate mole percentages of the
iron minerals in each section of the column. The error is +/- 7% and values below 10%
are estimated. The predominate iron phase in each section of the column is different.
Ferrihydrite dominates the bottom of the column while magnetite and lepidocrocite are
the primary phases in the middle and top of the column, respectively.
Table 3.2. Distribution of iron (mole percent) in abiotic, anaerobic column upon experiment termination. A represents the influent end of the column (0 – 0.6 cm), B represents 0.6 o 5 cm, and C represents 5 to 7.5 cm.
mole % (wt/wt)
Section Ferrihydrite Magnetite Goethite Lepidocrocite
C 15 18 13 54
B 13 67 11 8
A 90 10 0 0
Phosphate retention within the packed mineral beds was determined during the total
extraction. Sand at the bottom (0 – 0.6 cm) of the column contained 5.69 µmols PO4/g
sand, while that in the middle (0.6 – 5 cm) contained 0.63 µmols PO4/g sand and the top
section (5 – 7.5 cm) contained 0.74 µmols PO4/g.

92
9
6.5
4.0
1.5
-1
Figure 3.6. Schematic illustration of ripened anoxic, abiotic column before (a) andafter (b) introduction of phosphate solution. The dashed white line indicates thetransition from black to gray. In (b) A, B, and C indicate where samples were collected at experiment termination.
a. b.
9
6.5
4.0
1.5
-1
Dis
tanc
e (c
m) f
rom
beg
inni
ng o
f fer
rihyd
rite-
coat
ed sa
nd
C
A
B
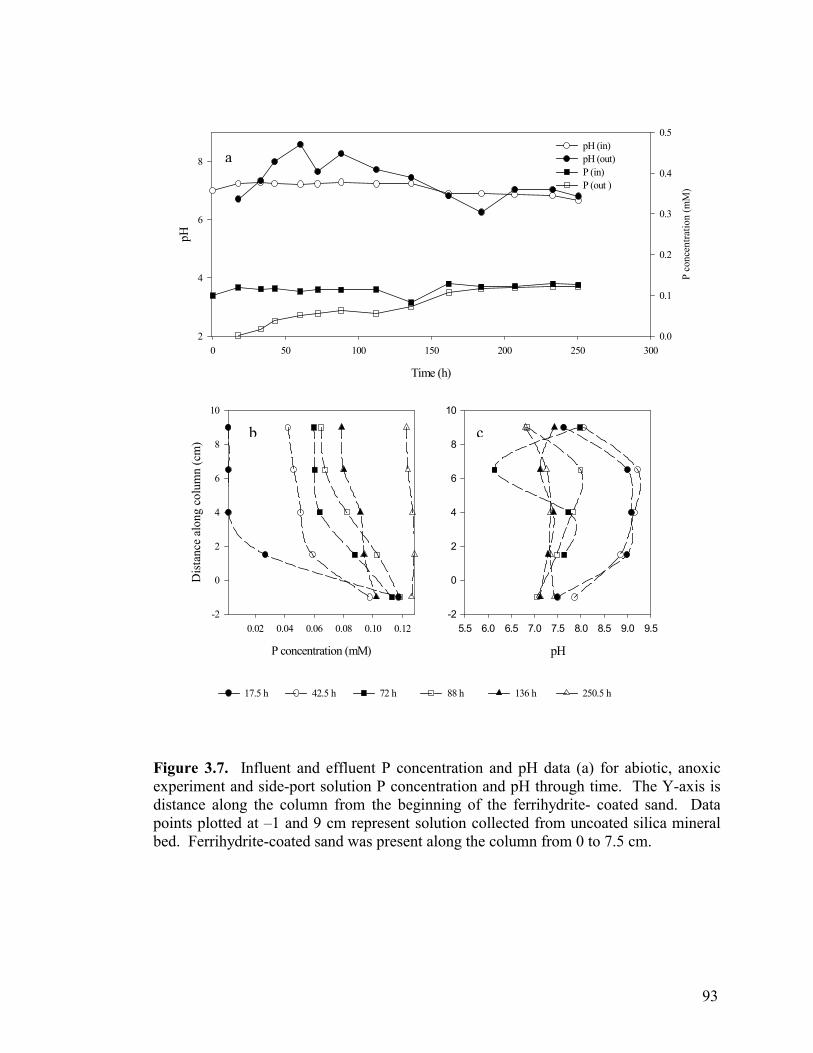
93
Time (h)
0 50 100 150 200 250 300
pH
2
4
6
8
P co
ncen
tratio
n (m
M)
0.0
0.1
0.2
0.3
0.4
0.5pH (in) pH (out) P (in) P (out )
P concentration (mM)
0.02 0.04 0.06 0.08 0.10 0.12
Dis
tanc
e al
ong
colu
mn
(cm
)
-2
0
2
4
6
8
10
pH
5.5 6.0 6.5 7.0 7.5 8.0 8.5 9.0 9.5-2
0
2
4
6
8
10
17.5 h 42.5 h 72 h 88 h 136 h 250.5 h
Figure 3.7. Influent and effluent P concentration and pH data (a) for abiotic, anoxicexperiment and side-port solution P concentration and pH through time. The Y-axis is distance along the column from the beginning of the ferrihydrite- coated sand. Data points plotted at –1 and 9 cm represent solution collected from uncoated silica mineralbed. Ferrihydrite-coated sand was present along the column from 0 to 7.5 cm.
a
b c
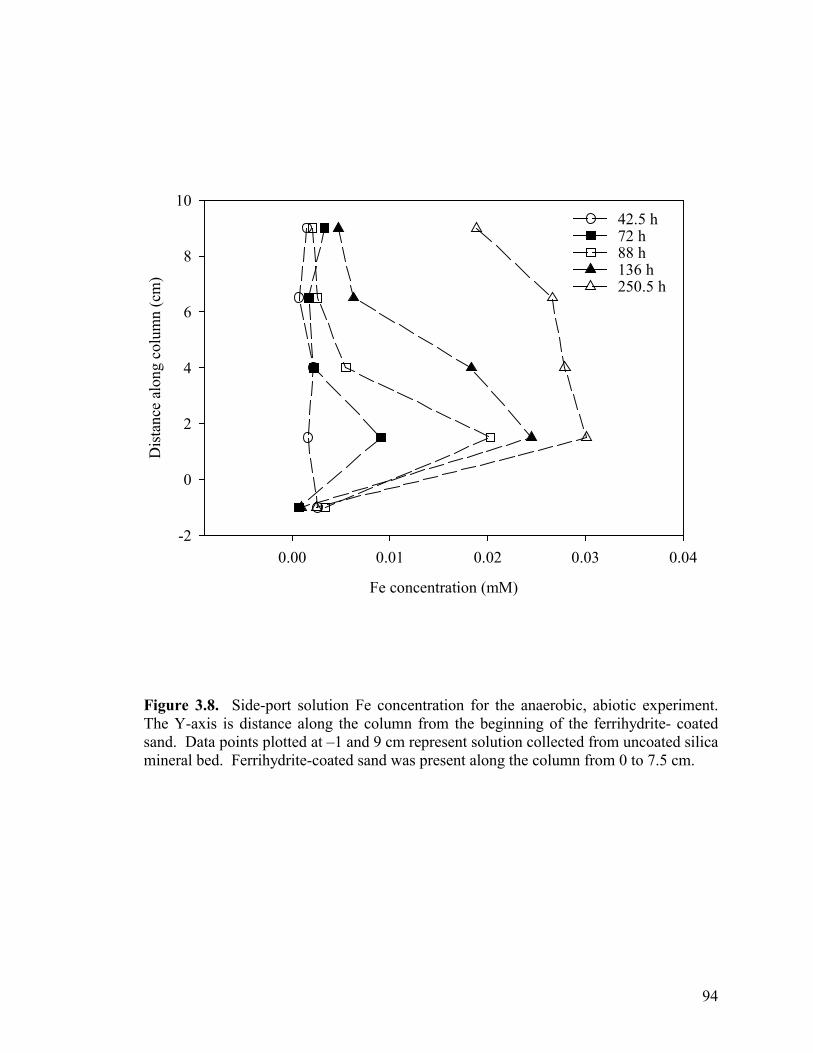
94
Fe concentration (mM)
0.00 0.01 0.02 0.03 0.04
Dist
ance
alo
ng c
olum
n (c
m)
-2
0
2
4
6
8
1042.5 h72 h88 h136 h250.5 h
Figure 3.8. Side-port solution Fe concentration for the anaerobic, abiotic experiment. The Y-axis is distance along the column from the beginning of the ferrihydrite- coated sand. Data points plotted at –1 and 9 cm represent solution collected from uncoated silica mineral bed. Ferrihydrite-coated sand was present along the column from 0 to 7.5 cm.
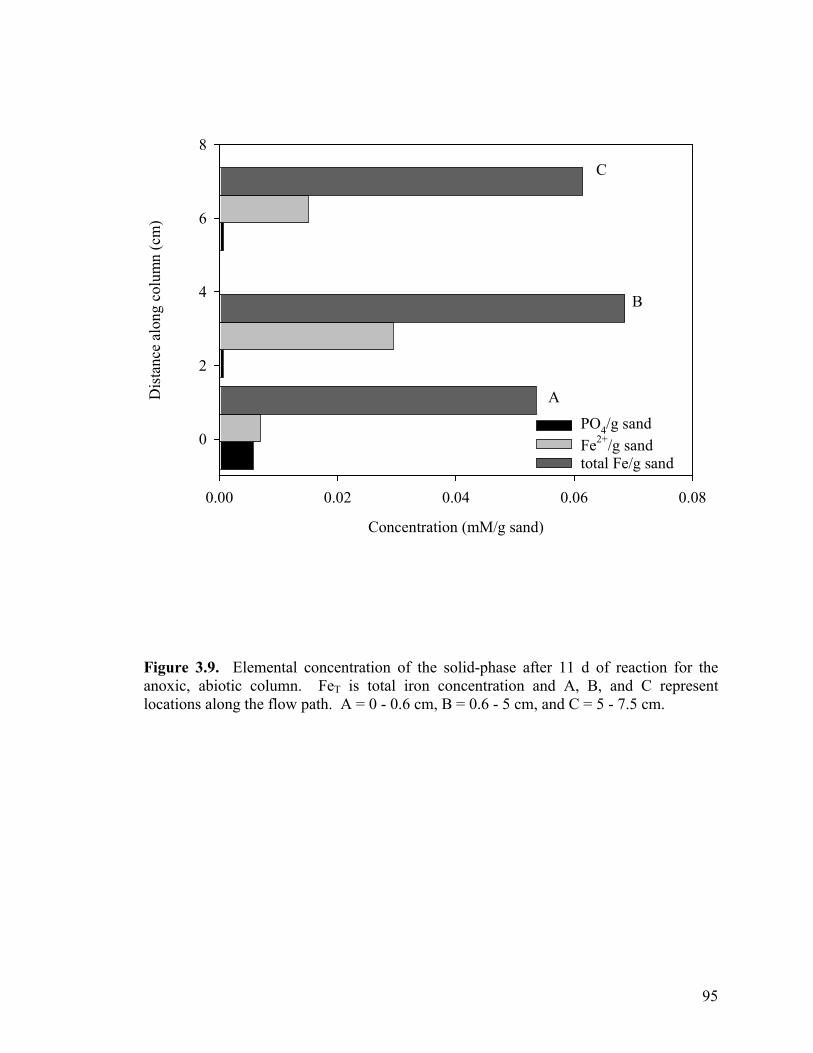
95
Concentration (mM/g sand)
0.00 0.02 0.04 0.06 0.08
Dis
tanc
e al
ong
colu
mn
(cm
)
0
2
4
6
8
PO4/g sand Fe2+/g sand total Fe/g sand
Figure 3.9. Elemental concentration of the solid-phase after 11 d of reaction for the anoxic, abiotic column. FeT is total iron concentration and A, B, and C represent locations along the flow path. A = 0 - 0.6 cm, B = 0.6 - 5 cm, and C = 5 - 7.5 cm.
A
C
B

96
Concentration (mole % Fe)
0 20 40 60 80 100-1
0
1
2
3
4
5
6
7
FerrihydriteMagnetiteGoethiteLepidocrocite
Figure 3.10. Mineralogical composition (mole % Fe, wt/wt) as determined by EXAFS analysis upon termination of anoxic, abiotic column.
Dis
tanc
e al
ong
colu
mn
(cm
)

97
The biotic columns behaved differently from the abiotic experiments. A detailed
discussion of these experiments can be found in Benner et al. (2002). In the groundwater
(GW) column (Figure 3.11a), phosphate was originally present in the effluent due to the
nutrient enriched media used to grow the bacteria. However, after that initial phosphate
spike, no further phosphate was observed in the effluent (i.e., complete retention of
phosphate was observed). The decrease in phosphate concentration in the GW feed
corresponds to a drop in calcium concentration, indicating possible precipitation within
the feed vessel. Phosphate breakthrough in the bicarbonate (BC) column was observed
after 430 h (Figure 3.11b). The initial phosphate concentration in the effluent peaked at
0.1 mM at 550 h and then dropped to ~0.07 mM for the remainder of the experiment.
The fluctuations in the BC effluent may, in part, be a reflection of changes in feed
chemistry. Phosphate levels in the feed were near 0.4 mM during the first 315 h of the
experiment and were then lowered to near 0.1 mM.
The extraction data on the sand also yielded differing trends. Within the GW
column (Figure 3.12a), phosphate was sequestered within the bottom 3–4 cm of the
ferrihydrite-coated sand and was removed only during the total extraction (6 M HCl).
Ferrous iron was also removed throughout the column, increasing downfield. Phosphate
was distributed throughout the BC column (Figure 3.12b), with the greatest amounts
retained from 8 to 12 cm downfield. Phosphate was removed both during the total and
partial extractions.
Upon termination, the porewater of the two columns also varied (Figures 3.13).
Phosphate was present in the BC porewater throughout the column and ranged in
concentration from 0.05 mM to 0.1 mM; however, phosphate was only detected in one
port about 6 cm downfield in the GW column. This observation may be due in part to the
different concentrations of phosphate in the respective feed solutions. The BC feed
contained much more phosphorus than did the GW feed (Table 3.1).
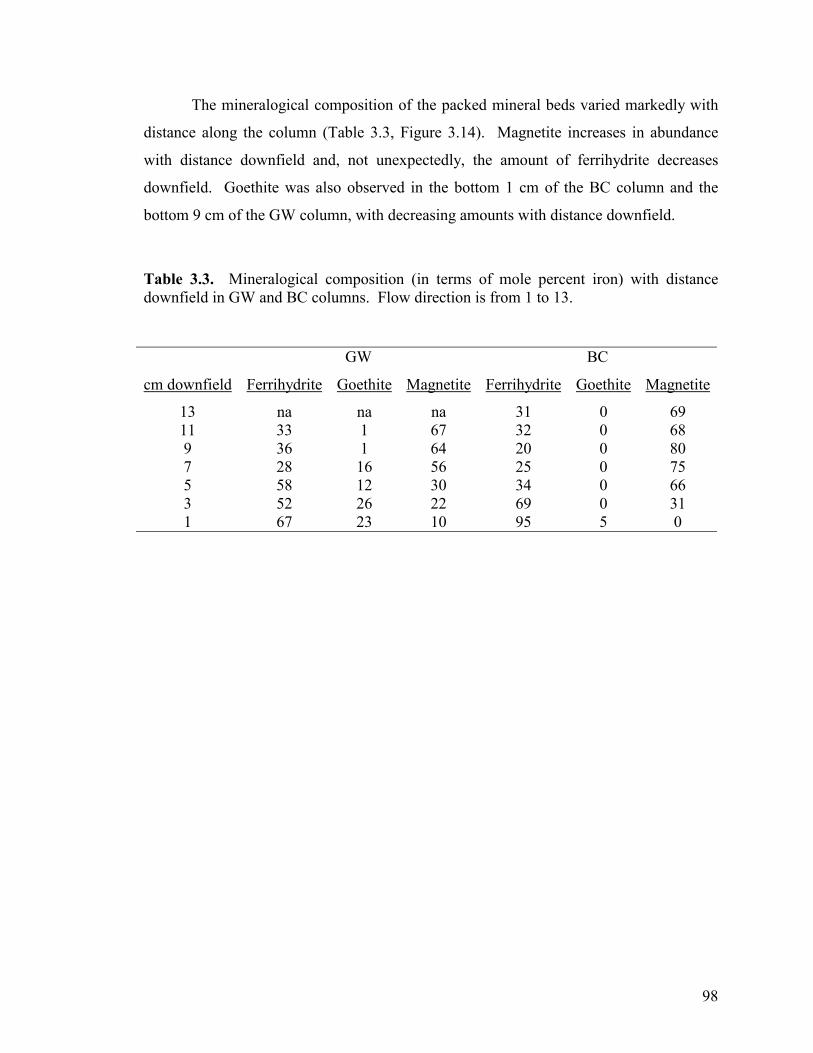
98
The mineralogical composition of the packed mineral beds varied markedly with
distance along the column (Table 3.3, Figure 3.14). Magnetite increases in abundance
with distance downfield and, not unexpectedly, the amount of ferrihydrite decreases
downfield. Goethite was also observed in the bottom 1 cm of the BC column and the
bottom 9 cm of the GW column, with decreasing amounts with distance downfield.
Table 3.3. Mineralogical composition (in terms of mole percent iron) with distance downfield in GW and BC columns. Flow direction is from 1 to 13.
GW BC
cm downfield Ferrihydrite Goethite Magnetite Ferrihydrite Goethite Magnetite
13 na na na 31 0 69 11 33 1 67 32 0 68 9 36 1 64 20 0 80 7 28 16 56 25 0 75 5 58 12 30 34 0 66 3 52 26 22 69 0 31 1 67 23 10 95 5 0
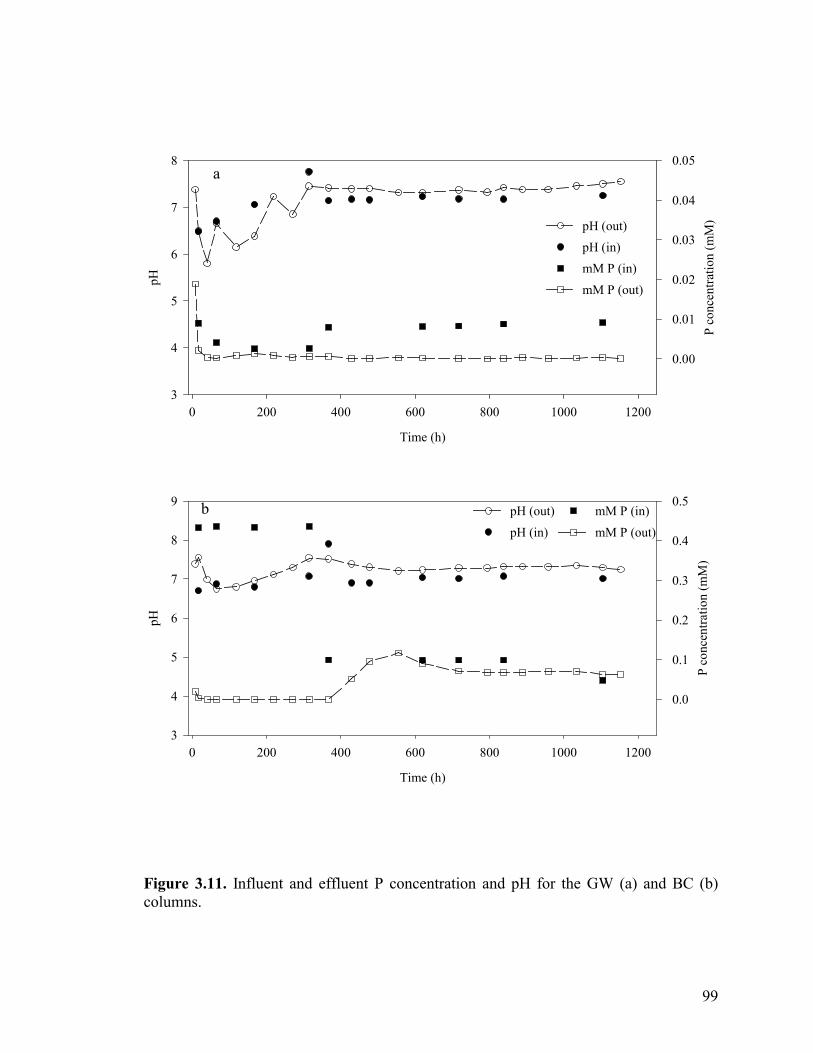
99
Time (h)
0 200 400 600 800 1000 1200
pH
3
4
5
6
7
8
P co
ncen
tratio
n (m
M)
0.00
0.01
0.02
0.03
0.04
0.05
Time (h)
0 200 400 600 800 1000 1200
pH
3
4
5
6
7
8
9
P co
ncen
tratio
n (m
M)
0.0
0.1
0.2
0.3
0.4
0.5
pH (in) pH (out)
mM P (in)
mM P (out)
pH (in)
pH (out) mM P (in)
mM P (out)
Figure 3.11. Influent and effluent P concentration and pH for the GW (a) and BC (b) columns.
a
b

100
Concentration (mM/g solid)
0.00 0.05 0.10 0.15 0.20 0.25
Dis
tanc
e al
ong
colu
mn
(cm
)
0
2
4
6
8
10
12
14
16
Concentration (mM/g solid)
0.00 0.05 0.10 0.15 0.20 0.25
Dis
tanc
e al
ong
colu
mn
(cm
)
0
2
4
6
8
10
12
14
16
mM PO4 (p) mM Fe (p)mM PO4 (t)mM Fe (t)
mM PO4 (p)mM Fe (p)mM PO4 (t) mM Fe (t)
Figure 3.12. Total (6 M HCl) and partial (0.5 M HCl) extraction data from GW (a) and BC (b) anaerobic, biotic columns. Concentrations are given in mM/g solid.
a
b

101
Concentration (mM)
0.00 0.02 0.04 0.06 0.08
Dis
tanc
e al
ong
colu
mn
(cm
)
0
2
4
6
8
10
12
14
16
Concentration (mM)
0.0 0.1 0.2 0.3 0.4
Dis
tanc
e al
ong
colu
mn
(cm
)
0
2
4
6
8
10
12
14
16
PO4 Fe
PO4 Fe
Figure 3.13. Fe and PO4 concentrations (mM) in pore water in GW (a) and BC (b) biotic columns at experiment termination.
a
b
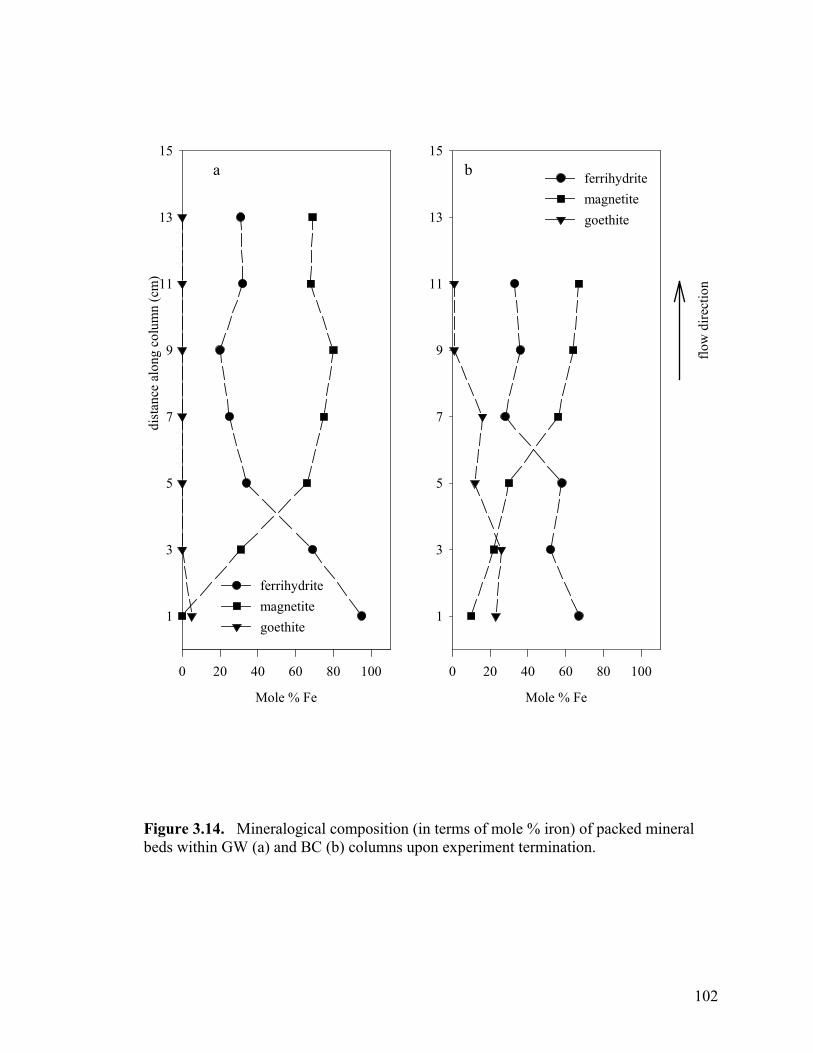
102
Mole % Fe
0 20 40 60 80 100
1
3
5
7
9
11
13
15di
stan
ce a
long
col
umn
(cm
)
Mole % Fe
0 20 40 60 80 100
1
3
5
7
9
11
13
15
flow
dire
ctio
n
ferrihydritemagnetitegoethite
ferrihydritemagnetitegoethite
Figure 3.14. Mineralogical composition (in terms of mole % iron) of packed mineral beds within GW (a) and BC (b) columns upon experiment termination.
a b
103
DISCUSSION
The distinct difference in the breakthrough curves of the poorly- and well-
buffered aerobic columns corresponds to changes, or lack thereof, in pH. As phosphate
sorbs to the ferrihydrite, hydroxyl ions are released to solution (Reddy et al., 1999;
Torrent, 1997; Colombo et al., 1994; Goldberg and Sposito, 1985; Parfitt and Russell,
1977; Parfitt et al., 1975); thus, as phosphate migrates through the column, hydroxyl ions
are displaced and a high pH front ensues. In the poorly buffered columns, the hydroxyl
release subsequently leads to an increase in pH, which may diminish both the extent and
rate of sorption (Geelhoed, 1997; Strauss et al., 1997; Willett and Cunningham, 1983;
Ryden et al., 1977a; McLaughlin et al., 1977; and Hingston et al., 1972). In the poorly
buffered columns (PB 1–2), P breakthrough occurs after 4 d of flow and is directly
related to a pH increase to near 9.5. In contrast, breakthrough is not observed until 11 d
in the well-buffered system. The influence of pH is also apparent within the pore-water
along the column. A well-defined P front, delineated by the steep gradient, is observed in
the well-buffered column (Figure 3.5). The P front observed in the PB columns is more
diffuse and becomes increasingly so as the pH increases with time. It therefore appears
that the transient pH spike delays P sequestration.
Buffering the pH did not have any appreciable influence on the amount of
phosphate retained by the ferrihydrite-coated sand; however, reaction times differed
within the columns. The well-buffered column was reacted for ~500 h, while the poorly-
buffered columns were reacted for over 1200 h. The effluent P concentration from the
poorly-buffered columns exhibits several plateaus prior to complete breakthrough,
indicating that sorption is still occurring, albeit at a slower rate than what was observed
within the well-buffered column. The effects of the increased pH within the poorly-
buffered columns appear to be counteracted by the rapid flow rate through the column.
As the pH increases, P sorption will be inhibited, but continuous influx of feed solution
(pH = 7) will moderate this effect.
Phosphate breakthrough was achieved when near-equilibrium conditions were
reached between the solution and ferrihydrite-coated sand. However, in all the aerobic
columns the effluent concentrations at the end of the experiment were between 90% and
95% of the influent. The continued removal of P from solution is likely the result of slow
104
diffusion into micro-pores of the iron oxides (Ryden et al. 1977a). The final solid–phase
phosphate concentrations in both the poorly- and well-buffered columns were less than
the maximum adsorption capacity determined during batch study, ~12.6 µmols PO4/g
sand. The PO4 concentrations on the solid within the three columns ranged from 3.9 to
7.1 µmols PO4/g and averaged 6.7 µmols PO4/g for the PB columns and 4.6 µmols PO4/g
for the well-buffered column. Extraction data illustrate that phosphate is partitioned
similarly in all three aerobic columns and the average iron to phosphate ratios in the three
columns were between 5.6 and 6.3 (Figure 3.4). The lower overall iron and phosphate
concentrations in the well-buffered column are likely due to the use of sand that was
coated in a different batch than that used in the poorly buffered columns
The anoxic, abiotic column behaved quite differently from the aerobic columns
due predominantly to different mineralogical compositions. When the ferrous chloride
solution was discontinued, a distinct dark band was observable in the section of iron-
coated sand nearest the influent end of the column. Upon introduction of the phosphate,
further mineralogical change occurred that resulted in a ~6 mm band composed
predominantly (~90%) of ferrihydrite (defined as Section A). The concentration of Fe(II)
in the pore-water solution increases after introduction of the phosphate solution (Figure
3.8), suggesting magnetite dissolution or the displacement of sorbed Fe(II) by phosphate.
The phosphate breakthrough curve is similar to that observed in the poorly
buffered aerobic columns, indicating that pH is one controlling factor of phosphate
retention within the column. The initial breakthrough is concurrent with an increase in
pH (Figure 3.7), though the pH increase in the anoxic column is not as dramatic as that in
the poorly buffered aerobic columns. Additionally, a well-defined phosphate front does
not propagate through the anoxic column (Figure 3.7). Pore water concentrations of P
drop very rapidly during the first day of reaction; however, after that initial period,
phosphate retention decreases dramatically. The immediate drop in retention and
incomplete removal of phosphate corresponds to pH increases to greater than 9.0 within
the column. On the basis of temporal trends in pore-water within the column, it appears
phosphate is being retained predominantly in the lowest section (A) of the column. Once
the material between 0 and 2 cm reaches equilibrium with the influent solution, nearly
complete phosphate breakthrough is observed.
105
The mineralogical composition of the anaerobic, abiotic column at the end of the
experiment varied markedly downfield from the lowest portion of the column (Table 3.2).
The change in iron mineralogy occurred during the initial 5 d period when FeCl2 was
reacted with the ferrihydrite-coated sand. Upon termination, the central, darkest section
(B) of the column was mostly magnetite (~67%) with lesser amounts of ferrihydrite,
goethite, and lepidocrocite. The section of the column furthest downfield (C) contained
~54% lepidocrocite and between ~13% and ~18% (each) ferrihydrite, goethite, and
magnetite. In the presence of low concentrations of Fe(II), ferrihydrite converts to
lepidocrocite or goethite; chloride will favor lepidocrocite formation, while its absence or
the presence of CO32- will favor ferrihydrite conversion to goethite. Magnetite, in
contrast, is formed at higher (>0.4 mM) Fe(II) concentrations at pH ~7 (Benner et al.,
2002; Zachara et al., 2002).
The total extraction data also reflect the variation in mineralogy throughout the
column. Most of the phosphate retained within the column is sequestered in Section A
(~90% ferrihydrite), having a final phosphate concentration of 5.89 µmols PO4/g solid,
slightly lower than the equilibrium value of 9.8 µmols PO4/g determined by batch
experiment for ferrihydrite-coated sand reacted with 200 µM PO4 (I = 0.1 M), which
reached an equilibrium solution concentration of ~100 µM PO4 after 2 d. The remaining
sections of the column retained comparatively little phosphate, 0.62 and 0.69 µmols
PO4/g solid for sections B and C, respectively; these values are similar to the equilibrium
adsorption of phosphate by geologic magnetite reacted with 100 µM PO4 (~0.7 µmols
PO4/g, equilibrium solution concentration ~95 µM PO4). Even though most of the iron is
sequestered within lepidocrocite in the effluent end of the column, the adsorption
characteristics are more similar to that of geologic magnetite. This may be the result of a
layer of magnetite coating the solid within the packed mineral bed or it may be due, in
part, to the sorption of ferrous iron, which would passivate reactive surfaces of
lepidocrocite with respect to phosphate (Roden et al., 2000). The increased iron in
column pore-water indicates that iron is being lost from the system, either from
dissolution of magnetite and/or from desorption of ferrous iron. In any case, sorption of
ferrous iron is likely to hinder phosphate retention within the column. The extraction
data from Section B support this idea. Within this section of the column the ratio of

106
ferric to ferrous iron is ~1.3, indicating that either the magnetite present is non-
stoichiometric or, more plausible, that ferrous iron is sorbed to the solids.
Batch experiments (Chapter 2) reveal that adsorption of P on magnetite is
particularly sensitive to pH, resulting in negligible sorption at pH 9. However, the lack of
P retention within sections B and C is not due entirely to pH restraints. While increased
pH may have prohibited P sorption in the early stages of the experiment, only minimal
quantities of P were removed downfield from Section A even after the pH had returned to
near neutral. The rapid breakthrough downfield from Section A indicate that only minor
amounts of P, if any, are retained within Sections B and C.
The surface area (SA) of the material in the column decreased over the reaction
period. The surface area of the solid matrix was initially ~4.6 m2/g; after reaction,
material in Section A had a SA of 2.65 m2/g, material from B had a SA of 0.741 m2/g,
and material from Section C had a SA of 0.488 m2/g. The low surface area of the
secondarily mineralized iron phases is consistent with the large grain-size observed for
abiotic transitions (Hansel and Benner, unpublished data).
Several important observations must be addressed regarding the biotic
experiments; an even more elaborate discussion can be found in Benner et al. (2002).
The effluent phosphate concentration trends are nearly opposite in the two columns. In
the GW column, P in the effluent immediately spikes to ~0.02 mM and rapidly drops to
below detection levels. The initial high P concentration in the effluent is an effect of the
nutrient enriched media used to grow the bacterial cultures. Conversely, P in the BC
effluent is not initially present, but after ~18 d of reaction the effluent concentrations
increase to ~0.1 mM and then appear to reach a stable value of ~0.07 mM. These
differing trends are, at least in part, due to the different feed solution chemistries. The
average P concentration in the BC feed is nearly 40 times that in the GW influent, which
would lead to saturation of available sorption sites and P breakthrough in the BC column
before the GW column. Phosphorus is partitioned along the length of the BC column,
whereas in the GW column P is retained only in the bottom 2 cm. In the BC column, the
maximum P retention observed is ~10.5 µmols PO4/g solid. However, magnetite is the
major iron-bearing mineral in the downfield section of the column (Figure 3.14). The
characteristics of P adsorption within the BC column are predominantly the result of

107
biomineralization processes. Biogenic minerals are likely to have very high surface areas
and may also incorporate phosphate during precipitation.
In the bottom section of the GW column the P concentration is ~4.2 µmols PO4/g
solid. The unexpectedly high adsorption capacity in this section of the GW column may
be explained by a variation in iron content of the solid, precipitation of a calcium
phosphate mineral phase, or a combination of the two. Comparison of the influent and
effluent solution chemistries from this column shows that appreciable amounts of
calcium and phosphate are removed from the influent during the first two days of
reaction.
In general, P sorption capacities within the aerobic columns are in agreement with
the experimental sorption capacities determined during static experiments. The solids in
the anaerobic columns behaved quite differently than predicted based on adsorption
isotherms. Possible reasons for this include passivation of surfaces by ferrous iron and
the conversion of ferrihydrite to goethite and lepidocrocite (the latter transition would
thus decrease surface area and micro-porosity). Magnetite precipitated within the
columns may also have different properties than that used to establish the isotherm.
Within the biotic column, incorporation into solid phases, precipitation as Ca-phosphates,
and competition with other ions, are possible factors affecting P retention. Finally, P
adsorption by ferrous minerals is, in general, much more sensitive to fluctuations in pH.
Even though ferrous minerals have relatively high capacities for phosphate retention, the
affinity for phosphate is much lower than for the ferric minerals. Given the lower
affinities, one would postulate that sorption by ferrous minerals would be fairly easily
reversed if the surrounding chemical conditions changed slightly (i.e. pH, ionic strength,
and concentration of P in solution).
CONCLUSIONS
Buffering the influent pH of the aerobic columns did not have any appreciable
influence on the amount of phosphate retained by the ferrihydrite-coated sand over a long
reaction period; however, pH was a determining factor in the characteristics of the
breakthrough curve. The anoxic, abiotic column behaved quite differently from the
aerobic columns predominantly due to different mineralogical composition. Most of the
108
phosphate sequestered within that column was sorbed by a narrow (0.6 cm) band of
ferrihydrite-coated sand near the influent end. The remainder of the anoxic column
exhibited sorption capacities similar to that of geologic magnetite, which may be
explained by passivation of reactive surfaces due to Fe(II) sorption or the precipitation of
a layer of magnetite upon the ferrihydrite.
The pH of a system can influence both the rate and extent of PO4 sorption — a
factor dependent on the specific mineral. The presence of elements such as Ca and Fe(II)
may promote the precipitation of phosphate minerals, which increases the apparent
adsorption capacity of a sorbent; however, they may equally serve as inhibitors of
phosphate adsorption.
Reductive dissolution of ferric oxides leading to the precipitation secondary
ferrous minerals create complicated mixtures of sorbents, each of which will exhibit
different sorption capacities and responses to changes in pH. Sorption of ferrous iron
may passivate reactive sites on the primary and secondary phases that could otherwise
sorb phosphate. This work has demonstrated that phosphate retention in dynamic
systems is dependant upon many interrelated factors, each of which must be considered
in order to fully understand and predict P retention, even in these relatively simple
geochemical systems.
The stability and capacity of phosphate retention in systems prone to transitions
from aerobic to anaerobic conditions will be determined by the characteristics of the
secondary ferrous minerals and the presence of other sorbates. In general, P sorption by
anoxic systems will be lower and less stable than that in aerobic systems. Secondary
ferrous minerals have lower surface areas and are easily passivated by the sorption of
ferrous iron or other ions. Additionally, all ferrous phases studied exhibited relatively
low affinities for phosphate, indicating that even small changes in geochemical
conditions would destabilize the system and lead to phosphate desorption.

109
REFERENCES
Arai, Y., and D.L. Sparks. 2001. ATR-FTIR spectroscopic investigation on phosphate adsorption mechanisms at the ferrihydrite-water interface. J. Colloid Interface Sci. 241:317-326.
Benner, S.G., C.M. Hansel, B.W. Wielinga, T.M. Barber, and S. Fendorf. 2002.
Reductive dissolution and biomineralization of iron hydroxide under dynamic flow conditions. Environ. Sci. Technol. 36:1705-1711.
Borggaard, O.K. 1983. Effect of surface area and mineralogy of iron oxides on their
surface charge and anion-adsorption. Clays Clay Miner. 31:230-232. Brady, N.C., and R.R. Weil. 1999. The Nature and Properties of Soils. Twelfth ed.
Prentice Hall., Upper Saddle River, NJ. Brunauer, S., P.H. Emmett, and E. Teller. 1938. Adsorption of gases in multi-molecular
layers. J. Am. Chem. Soc. 60:309-319. Celi, L., E. Barberis, and F.A. Marsan. 2000. Sorption of phosphate on goethite at high
concentrations. Soil Sci. 165:657-664. Colombo, C., V. Barron, and J. Torrent. 1994. Phosphate adsorption and desorption in
relation to morphology and crystal properties of synthetic hematites. Geochim. Cosmochim. Acta 58:1261-1269.
Cornell, R.M., and U. Schwertmann. 1996. The iron oxides: structure, properties,
reactions, occurrences and uses Weinhein: VCH, New York. DeBusk, W.F., S. Newman, and K.R. Reddy. 2001. Spatio-temporal patterns of soil
phosphorus enrichment in Everglades Water Conservation Area 2A. J. Environ. Qual. 30:1438-1446.
DeBusk, W.F., K.R. Reddy, M.S. Koch, and Y. Wang. 1994. Spatial distribution of soil
nutrients in a northern Everglades marsh: water conservation area 2A. Soil Sci. Soc. Am. J. 58:543-552.
DeMello, J.W.V., V. Barron, and J. Torrent. 1998. Phosphorus and Iron Mobilization in
Flooded Soils from Brazil. Soil Sci. 163:122-132. Enyard, A. 1994. Relationship of well- and poorly crystallized iron oxides with
phosphate and water retention by soils, a review. Mineral. Petrol. Acta 36:343-350.
Geelhoed, J.S., T. Hiemstra, and W.H. VanRiemsdijk. 1997. Phosphate and sulfate
adsorption on goethite: single anion and competitive adsorption. Geochim. Cosmochim. Acta 61:2389-2396.

110
Goldberg, S., and G. Sposito. 1985. On the mechanism of specific phosphate adsorption
by hydroxylated mineral surfaces: A review. Commun. Soil Sci. Plant Anal. 16:801-821.
Golterman, H.L. 1999. Quantification of P-flux through shallow, agricultural and natural
waters as found in wetlands of the Camargue, (S. France). Hydrobiologia 392:29-39.
Hingston, F.J., A.M. Posner, and J.P. Quirk. 1972. Anion adsorption by goethite and
gibbsite. I. The role of the proton in determining adsorption envelopes. J. Soil Sci. 23:177-192.
Jensen, M.B., H.C.B. Hansen, N.E. Nielsen, and J. Magid. 1999. Phosphate leaching
from intact soil column in response to reducing conditions. Water Air Soil Pollut 113:411-423.
Madrid, L., and P. DeArambarri. 1985. Adsorption of phosphate by two iron oxides in
relation to their porosity. J. Soil Sci. 36:523-530. Manahan, S.E. 1994. Environmental Chemistry. 6th ed. Lewis Publishers, Boca Raton,
FL. McLaughlin, J.R., J.C. Ryden, and J.K. Syers. 1977. Development and evaluation of a
kinetic model to describe phosphate sorption by hydrous ferric oxide gel. Geoderma 18:295-307.
Moore, P.A.J., and K.R. Reddy. 1994. Role of Eh and pH on phosphorus geochemistry in
sediments of Lake Okeechobee, Florida. J. Environ. Qual. 23:955-964. Noe, G.B., D.L. Childers, and R.D. Jones. 2001. Phosphorus biogeochemistry and the
impact of phosphorus enrichement: Why is the Everglades so unique? Ecosystems 4:603-624.
Olila, O.G., and K.R. Reddy. 1995. Influence of pH on Phosphorus Retention in Oxidized
Lake Sediments. Soil Sci. Soc. Am. J. 59:946-959. Olila, O.G., and K.R. Reddy. 1997. Influence of redox potential on phosphate uptake by
sediments in two sub-tropical eutrophic lakes. Hydrobiologia 345:45-57. Pant, H.K., and K.R. Reddy. 2001. Phosphorus sorption characteristics of estuarine
sediments under different redox conditions. J. Environ. Qual. 30:1474-1480. Parfitt, R.L., R.J. Atkinson, and R. St.C.Smart. 1975. The mechanism of phosphate
fixation by iron oxides. Soil Sci. Soc. Am. J. 39:837-841.

111
Parfitt, R.L., and J.D. Russell. 1977. Adsorption on hydrous oxides. IV. Mechanisms of adsorption of various ions on goethite. J. Soil Sci. 28:297-305.
Reddy, K.R., R.H. Kadlec, E. Flaig, and P.M. Gale. 1999. Phosphorus retention in
streams and wetlands--a review. Crit. Rev. Environ. Sci. Technol. 29:86-146. Robertson, W.D. 1995. Development of steady-state phosphate concentrations in septic
system plumes. J. Contam. Hydrol. 19:289-305. Robertson, W.D., S.L. Schiff, and C.J. Ptacek. 1998. Review of Phosphate Mobility and
Persistence in 10 Septic System Plumes. Ground Water 36:1000-1010. Roden, E.E., and J.W. Edmonds. 1997. P mobilization in Fe-rich anaerobic sediments.
Microbial Fe(III) oxide reduction versus iron-sulfide formation. Arch. Hydrobiol. 139:347-378.
Roden, E.E., M.M. Urrutia, and C.J. Mann. 2000. Bacterial Reductive Dissolution of
Crystalline Fe(III) Oxide in Continuous-Flow Column Reactors. App. Environ. Microbiol. 66:1062-1065.
Ryden, J.C., J.R. McLaughlin, and J.K. Syers. 1977a. Mechanisms of phosphate sorption
by soils and hydrous ferric oxide gel. J. Soil Sci. 28:72-92. Ryden, J.C., and J.K. Syers. 1977. Desorption and isotopic exchange relationships of
phosphate sorbed by soils and hydrous ferric oxide gel. J. Soil Sci. 28:596-609. Ryden, J.C., J.K. Syers, and J.R. McLaughlin. 1977b. Effects of ionic strength on
chemisorption and potential-determining sorption of phosphate by soils. J. Soil Sci. 28:62-71.
Schlesinger, W.H. 1991. Biogeochemistry: An Analysis of Global Change. Academic
Press, Inc., San Diego. Shang, C., J.W.B. Stewart, and P.M. Huang. 1992. pH effect on kinetics of adsorption of
organic and inorganic phosphates by short-range ordered aluminum and iron precipitates. Geoderma 53:1-14.
Slomp, C.P., S.J. Van der Gaast, and W. Van Raaphorst. 1996. Phosphorus binding by
poorly crystalline iron oxides in North Sea sediments. Mar. Chem. 52:55-73. Sparks, D.L. 1995. Environmental Soil Chemistry. Harcourt Brace and Company, San
Diego, CA. Stollenwerk, K.C. 1996. Simulation of phosphate transport in sewage-contaminated
groundwater, Cape Cod, Massachusetts. Appl. Geochem. 11:317-324.

112
Strauss, R., G.W. Bruemmer, and N.J. Barrow. 1997. Effects of crystallinity of goethite II: Rates of sorption and desorption of phosphate. Eur. J. Soil Sci. 48:101-114.
Szilas, C.P., O.K. Borgaard, and C.B. Hansen. 1998. Potential iron and phosphate
mobilization during flooding of soil material. Water Air Soil Pollut 106:97-109. Torrent, J. 1997. Interactions between Phosphate and Iron Oxide. Adv. GeoEcology
30:321-344. Torrent, J., U. Schwertmann, and V. Barron. 1994. Phosphate sorption by natural
hematites. Eur. J. Soil Sci. 45:45-51. Walter, D.A., D.R. LeBlanc, K.C. Stollenwerk, and K.W. Campo. 1999. Phosphorus
transport in sewage-contaminated ground-water, Massachusetts Military Reservation, Cape Cod, Massachusetts. Water-Resources Investigations Report 99-4018C. United States Geological Survey, Marlborough, MA.
Willett, I.R., and R.B. Cunningham. 1983. Influence of sorbed phosphate on the stability
of ferric hydrous oxide under controlled pH and Eh conditions. Aust. J. Soil Res. 21:301-308.
Willett, I.R., and M.L. Higgins. 1978. Phosphate sorption by reduced and reoxided rice
soils. Aust. J. Soil Res. 16:319-326. Young, E.O., and D.S. Ross. 2001. Phosphate release from seasonally flooded soils: A
laboratory microcosm study. J. Environ. Qual. 30:91-101. Zachara, J.M., R.K. Kukkadapu, J.K. Fredrickson, Y.A. Gorby, and S.C. Smith. 2002.
Biomineralization of Poorly Crystalline Fe(III) Oxides by Dissimilatory Metal Reducing Bacteria (DMRB). Geomicrobiol. J. 19:179-207.
Zanini, L., W.D. Robertson, C.J. Ptacek, S.L. Schiff, and T. Mayer. 1998. Phosphorus
characterization in sediments impacted by septic effluent at four sites in central Canada. J. Contam. Hydrol. 33:405-429.