phosphoketolase pathway contributes to carbon metabolism ... · the phosphoketolase pathway in the...
TRANSCRIPT

SUPPLEMENTARY INFORMATIONDOI: 10.1038/NPLANTS.2015.187
NATURE PLANTS | www.nature.com/natureplants 1
1
Supplementary Information
The phosphoketolase pathway in the central carbon metabolism of
cyanobacteria
Wei Xiong, Tai-Chi Lee, Sarah Rommelfanger, Erica Gjersing, Melissa Cano, Pin-Ching
Maness, Maria Ghirardi, Jianping Yu*
National Renewable Energy Laboratory, 15013 Denver West Parkway, Golden, CO 80401,
USA
*Corresponding author:
National Renewable Energy Laboratory, 15013 Denver West Parkway, Golden, CO 80401,
USA
Tel.: +1-303-384-6252; Fax: +1-303-384-7836; E-mail: [email protected]
Supplementary Information files include:
S u p p l e m e n t a r y M e t h o d s … … … … … … … … … … … … … … … … … … … … … … … … … … … … 2
Supplementary Da ta 1 ……………………………………………………………………………. . 6
Supplementary Table 1 to 2………………………………………………………………………9
Supplementary Figure 1 to 4……………………………………………………………………… 11
Supplementary References …………………………………………………………………….. . 17
Phosphoketolase pathway contributes to carbon metabolism in cyanobacteria

2 NATURE PLANTS | www.nature.com/natureplants
SUPPLEMENTARY INFORMATION DOI: 10.1038/NPLANTS.2015.187
2
Supplementary Methods
Construction of the ∆slr0453 mutants and complemented strains
The slr0453 open reading frame was disrupted by inserting an antibiotic-resistance gene
cassette, replacing part of the coding sequence. Specifically, regions of the Synechocystis
genome containing the start and the end of the slr0370 open reading frame (bases for
slr0370 is from 3500713 to 3503178; base numbering according to CyanoBase;
http://genome.microbedb.jp/cyanobase) were amplified via PCR with primers (P1:
5’GTGGGTTCTACCCTGGTAGGG3’ and P2: 5’CTAGAGGGGCCAGCGCCAATT3’). The PCR
products were directly inserted into pGEM-T vector (Promega), and then a 1024bp
chloramphenicol resistance gene (CmR)1 amplified by PCR with primers CmR-PF-AgeI and
CmR-PR-HindIII was used to replace the 383bp AgeI-HindIII fragments in slr0453 to create
the deletion plasmid pΔslr0453. Primer CmR-PF-AgeI was 5’
atatatACCGGTTATTTAACGACCCTGCCCTGAAC 3’ and primer CmR-PR-HindIII was 5’
atatatAAGCTTGTATCACGAGGCCCTTTCGTCTTC 3’, where underlines indicate AgeI and
HindIII restriction sites respectively, and lower cases indicate nucleotides added to protect
restriction sites. The plasmid pΔslr0453 was transformed into Synechocystis as previously
reported2. Host Synechocystis strains include the xylAB strain which is a xylose utilizer
expressing E.coli-derived xylose isomerase (XylA) and xylulokinase (XylB), and
∆glgC/xylAB which was further made deficient in glycogen biosynthesis by deleting the
glgC gene (slr1176)3. The detailed information on the construction of these strains are
described in Lee et al. 20154. Full segregation of Δslr0453 was confirmed by PCR with
genomic DNA isolated from parent Synechocystis and deletion strains as templates
(Supplementary Figure 2).
3
To express Slr0453 in the ∆slr0453 strains, the slr0453 open reading frame was cloned
into an expression cassette under the control of the Rubisco large subunit promoter (rbcL)5
(Supplementary Figure 2). The resulting plasmid pXW004 harboring the erythromycin
resistance gene (EmR) was transformed into the ∆slr0453 and xylAB/∆slr0453 mutants. The
expression cassette of slr0453 was integrated at a neutral site between slr1704 and sll1575
to generate the complemented stains. The genotypes of all strains constructed in this study
are summarized in Supplementary Table 1. The integration was verified by PCR using
genomic DNA and primer pairs P2 and P3 (sequence: 5’ CGGCAACAATCATTTCCGGTA3’)
(see Supplementary Figure 2).
Organic acids production assay
Synechocystis strains were cultivated in BG-11 medium until the OD730 reached 1.0. Cells
were collected by centrifugation at 3000 g for 10 minutes. Cell pellets were re-suspended
in either BG-11 medium or BG-11-N medium4, in the presence or absence of xylose/glucose.
The initial OD730 of each culture was adjusted to be identical. Cultures were shaken at 220
rpm either under 50 μEm-2s-1 fluorescent light or in the dark (culture tubes were covered
entirely by aluminum foil) and sampled over time for organic acid measurements. The
culture samples were collected and the medium was separated from cells by filtration
through 0.2 μM-diameter nylon membrane (Acrodisc®) and analyzed with HPLC (Agilent
Technologies1200 series) by injecting 100 μL samples into an HPLC column (Bio-Rad
Aminex HPX-87H), eluting with 5mM sulfuric acid at a flow rate of 0.6 ml/min, and
detecting by either a UV detector at 210 nm for 2-oxoglutarate (retention time: 8.8 min)
and pyruvate (retention time: 9.8 min) or by a Refractive Index Detector for acetate
(retention time: 15.2 min).

NATURE PLANTS | www.nature.com/natureplants 3
SUPPLEMENTARY INFORMATIONDOI: 10.1038/NPLANTS.2015.187
2
Supplementary Methods
Construction of the ∆slr0453 mutants and complemented strains
The slr0453 open reading frame was disrupted by inserting an antibiotic-resistance gene
cassette, replacing part of the coding sequence. Specifically, regions of the Synechocystis
genome containing the start and the end of the slr0370 open reading frame (bases for
slr0370 is from 3500713 to 3503178; base numbering according to CyanoBase;
http://genome.microbedb.jp/cyanobase) were amplified via PCR with primers (P1:
5’GTGGGTTCTACCCTGGTAGGG3’ and P2: 5’CTAGAGGGGCCAGCGCCAATT3’). The PCR
products were directly inserted into pGEM-T vector (Promega), and then a 1024bp
chloramphenicol resistance gene (CmR)1 amplified by PCR with primers CmR-PF-AgeI and
CmR-PR-HindIII was used to replace the 383bp AgeI-HindIII fragments in slr0453 to create
the deletion plasmid pΔslr0453. Primer CmR-PF-AgeI was 5’
atatatACCGGTTATTTAACGACCCTGCCCTGAAC 3’ and primer CmR-PR-HindIII was 5’
atatatAAGCTTGTATCACGAGGCCCTTTCGTCTTC 3’, where underlines indicate AgeI and
HindIII restriction sites respectively, and lower cases indicate nucleotides added to protect
restriction sites. The plasmid pΔslr0453 was transformed into Synechocystis as previously
reported2. Host Synechocystis strains include the xylAB strain which is a xylose utilizer
expressing E.coli-derived xylose isomerase (XylA) and xylulokinase (XylB), and
∆glgC/xylAB which was further made deficient in glycogen biosynthesis by deleting the
glgC gene (slr1176)3. The detailed information on the construction of these strains are
described in Lee et al. 20154. Full segregation of Δslr0453 was confirmed by PCR with
genomic DNA isolated from parent Synechocystis and deletion strains as templates
(Supplementary Figure 2).
3
To express Slr0453 in the ∆slr0453 strains, the slr0453 open reading frame was cloned
into an expression cassette under the control of the Rubisco large subunit promoter (rbcL)5
(Supplementary Figure 2). The resulting plasmid pXW004 harboring the erythromycin
resistance gene (EmR) was transformed into the ∆slr0453 and xylAB/∆slr0453 mutants. The
expression cassette of slr0453 was integrated at a neutral site between slr1704 and sll1575
to generate the complemented stains. The genotypes of all strains constructed in this study
are summarized in Supplementary Table 1. The integration was verified by PCR using
genomic DNA and primer pairs P2 and P3 (sequence: 5’ CGGCAACAATCATTTCCGGTA3’)
(see Supplementary Figure 2).
Organic acids production assay
Synechocystis strains were cultivated in BG-11 medium until the OD730 reached 1.0. Cells
were collected by centrifugation at 3000 g for 10 minutes. Cell pellets were re-suspended
in either BG-11 medium or BG-11-N medium4, in the presence or absence of xylose/glucose.
The initial OD730 of each culture was adjusted to be identical. Cultures were shaken at 220
rpm either under 50 μEm-2s-1 fluorescent light or in the dark (culture tubes were covered
entirely by aluminum foil) and sampled over time for organic acid measurements. The
culture samples were collected and the medium was separated from cells by filtration
through 0.2 μM-diameter nylon membrane (Acrodisc®) and analyzed with HPLC (Agilent
Technologies1200 series) by injecting 100 μL samples into an HPLC column (Bio-Rad
Aminex HPX-87H), eluting with 5mM sulfuric acid at a flow rate of 0.6 ml/min, and
detecting by either a UV detector at 210 nm for 2-oxoglutarate (retention time: 8.8 min)
and pyruvate (retention time: 9.8 min) or by a Refractive Index Detector for acetate
(retention time: 15.2 min).

4 NATURE PLANTS | www.nature.com/natureplants
SUPPLEMENTARY INFORMATION DOI: 10.1038/NPLANTS.2015.187
4
1H-NMR analysis for acetate identification
1H-NMR spectra were collected on a Bruker Avance III spectrometer at 14.1T and
600.16MHz. A Bruker 5mm BBO probe was employed with a presaturation water
suppression sequence using an 85dB pulse. A 90° pulse of 15.3us and a recycle delay of 1s
were employed and 512 scans were collected. Automatic phase correction and baseline
correction were applied along with 0.3Hz line broadening. Acetate standard solutions were
prepared at 5, 10, and 20mM and the NMR spectra collected to confirm the chemical shift
assignment of acetate at 1.83ppm. All samples included 10% (by volume) D2O for locking.
13C-labeling and GC-MS analysis
The xylAB and xylAB/∆slr0453 strains were cultivated in BG-11 medium to an OD730 of 1.0.
Cells were then re-inoculated in BG-11 medium supplemented with 100mM sodium
bicarbonate and 10mM unlabeled D-xylose, 1-13C-D-xylose or U-13C-D-xylose, respectively.
Cultures with an initial OD730 of 0.05 were sealed and shaken at 220 rpm under 50 µEm-2 s-1
fluorescent illumination. When OD730 reached 0.8-1, the cultures were sampled. To check
whether the isotope steady state had been reached, cultures were re-sampled at 3 hours
and 6 hours afterwards as well. The isotope steady state allowed constant fractional
labeling of proteinogenic amino acids from biomass harvested at interval time points.
The sample treatment and GC-MS analysis were done as previously reported6, with a few
modifications. Briefly, 5mL of sampled cultures were centrifuged at 10,000 g for 1 minute,
and the cell pellets were digested in 500μL 6M HCl at 105°C for 12 hours. The hydrolysate
was dried under nitrogen gas flow at 65°C, and then dissolved in 50 μL water-free
dimethylformamide. The proteinogenic amino acids were derivatized prior to GC-MS
analysis. The dried hydrolysate, dissolved in N, N-Dimethylformamide was derivatized by
5
N-tert-butyldimethylsilyl-N-methyltrifluoroacetamide (TBDMS) with 1% tert-butyl-
dimethylchlorosilane at 85°C for 60 min. 1 μL of the sample in the organic phase was
loaded onto the GC–MS instrument (Agilent GC-6890 gas chromatography equipped with a
Agilent 19091J-413 column (30m×0.32mm×0.25μm) directly connected to a MS-5975C
mass spectrometer). Helium was used as the carrier gas. The oven temperature was
initially held at 50℃ for 2 min; then raised to 150℃ at 5℃/min and held at that value for 2
min; finally it was raised to 320℃ at 7℃/min, and held at that final value for 2 min. Other
settings included splitless and electron impact ionization (EI) at 70 eV. The amino acids
including alanine, aspartate, glutamate, glycine, histidine, isoleucine, leucine, phenylalanine,
proline, serine, threonine, tyrosine and valine were separated and analyzed.
To analyze the isotope labeling pattern of amino acids, a mass isotopomer distribution
vector, MDVα, was assigned according to Nanchen et al 7.
(1)
where m0 is the fractional abundance of molecules with mono-isotopic mass and mi>0 is the
abundance of fragments with heavier masses. The GC-MS data were corrected for the
naturally occurring isotopes of oxygen (O), hydrogen (H) and carbon (C) atoms using a
correction matrix (Eq. 2) as described by Nanchen et al7.
MDVα* = Ccorr,COH-1. MDVα (2)

NATURE PLANTS | www.nature.com/natureplants 5
SUPPLEMENTARY INFORMATIONDOI: 10.1038/NPLANTS.2015.187
4
1H-NMR analysis for acetate identification
1H-NMR spectra were collected on a Bruker Avance III spectrometer at 14.1T and
600.16MHz. A Bruker 5mm BBO probe was employed with a presaturation water
suppression sequence using an 85dB pulse. A 90° pulse of 15.3us and a recycle delay of 1s
were employed and 512 scans were collected. Automatic phase correction and baseline
correction were applied along with 0.3Hz line broadening. Acetate standard solutions were
prepared at 5, 10, and 20mM and the NMR spectra collected to confirm the chemical shift
assignment of acetate at 1.83ppm. All samples included 10% (by volume) D2O for locking.
13C-labeling and GC-MS analysis
The xylAB and xylAB/∆slr0453 strains were cultivated in BG-11 medium to an OD730 of 1.0.
Cells were then re-inoculated in BG-11 medium supplemented with 100mM sodium
bicarbonate and 10mM unlabeled D-xylose, 1-13C-D-xylose or U-13C-D-xylose, respectively.
Cultures with an initial OD730 of 0.05 were sealed and shaken at 220 rpm under 50 µEm-2 s-1
fluorescent illumination. When OD730 reached 0.8-1, the cultures were sampled. To check
whether the isotope steady state had been reached, cultures were re-sampled at 3 hours
and 6 hours afterwards as well. The isotope steady state allowed constant fractional
labeling of proteinogenic amino acids from biomass harvested at interval time points.
The sample treatment and GC-MS analysis were done as previously reported6, with a few
modifications. Briefly, 5mL of sampled cultures were centrifuged at 10,000 g for 1 minute,
and the cell pellets were digested in 500μL 6M HCl at 105°C for 12 hours. The hydrolysate
was dried under nitrogen gas flow at 65°C, and then dissolved in 50 μL water-free
dimethylformamide. The proteinogenic amino acids were derivatized prior to GC-MS
analysis. The dried hydrolysate, dissolved in N, N-Dimethylformamide was derivatized by
5
N-tert-butyldimethylsilyl-N-methyltrifluoroacetamide (TBDMS) with 1% tert-butyl-
dimethylchlorosilane at 85°C for 60 min. 1 μL of the sample in the organic phase was
loaded onto the GC–MS instrument (Agilent GC-6890 gas chromatography equipped with a
Agilent 19091J-413 column (30m×0.32mm×0.25μm) directly connected to a MS-5975C
mass spectrometer). Helium was used as the carrier gas. The oven temperature was
initially held at 50℃ for 2 min; then raised to 150℃ at 5℃/min and held at that value for 2
min; finally it was raised to 320℃ at 7℃/min, and held at that final value for 2 min. Other
settings included splitless and electron impact ionization (EI) at 70 eV. The amino acids
including alanine, aspartate, glutamate, glycine, histidine, isoleucine, leucine, phenylalanine,
proline, serine, threonine, tyrosine and valine were separated and analyzed.
To analyze the isotope labeling pattern of amino acids, a mass isotopomer distribution
vector, MDVα, was assigned according to Nanchen et al 7.
(1)
where m0 is the fractional abundance of molecules with mono-isotopic mass and mi>0 is the
abundance of fragments with heavier masses. The GC-MS data were corrected for the
naturally occurring isotopes of oxygen (O), hydrogen (H) and carbon (C) atoms using a
correction matrix (Eq. 2) as described by Nanchen et al7.
MDVα* = Ccorr,COH-1. MDVα (2)

6 NATURE PLANTS | www.nature.com/natureplants
SUPPLEMENTARY INFORMATION DOI: 10.1038/NPLANTS.2015.187
6
where MDVα* is the corrected mass isotopomer distribution vector and Ccorr,COH−1 is the
correction matrix. According to Equation 3, the resulting MDVα* values were then used to
assess the fractional labeling enrichment of serine and alanine whose carbon skeletons are
derived from phosphoglycerate and pyruvate, respectively.
FL = ∑ 𝑖𝑖.𝑚𝑚𝑖𝑖𝑛𝑛𝑖𝑖=0
𝑛𝑛.∑ 𝑚𝑚𝑖𝑖𝑛𝑛𝑖𝑖=0
(3)
where n represents the number of carbon atoms in AKG or pyruvate and i is the mass
isotopomer.
The fractional contribution of phosphoketolase pathway (fa) is calculated based on
Equation 4.
FLPGA1-3 = fa × FLA + fb × FLB + fc × FLC (4)
where FLPGA1-3 is the fractional labeling of 3-P-glycerate with all three carbons during 1-
13C-xylose labeling; FLA , FLB , and FLC are the fractional labeling resulted from the
phosphoketolase pathway, the pentose phosphate pathway and the CBB cycle respectively;
fb and fc are fractional contribution of pentose phosphate pathway and CBB cycle to the
triose pool. The principle of this calculation is illustrated in Supplementary Figure 3b.
Supplementary Data 1
Blast Analysis of Slr0453 against well-characterized phosphoketolase from
Bifidobacterium
7
Query: Phosphoketolase from Bifidobacterium breve (Length = 825) Subject: Slr0453 from Synechocystis sp. PCC 6803 (Length = 821) Score = 760 bits (1962), Expect = 0.0, Method: Compositional matrix adjust. Identities = 380/814 (46%), Positives = 526/814 (64%), Gaps = 27/814 (3%) Query: 1 MTSPVIGTPWKKLNA-----PVSEESLEGVDKYWRVANYLSIGQIYLRSNPLMKAPFTRE 55 +TSP +P+ + + P+ L + +WR ANYL++G IYLR NPL++ P E Sbjct: 18 VTSPFSLSPFGQARSTVTGNPLDPTELNQMHGFWRAANYLAVGMIYLRDNPLLREPLQPE 77 Query: 56 DVKHRLVGHWGTTPGLNFLIGHINRFIADHGQNTVIIMGPGHGGPAGTSQSYLDGTYTET 115 +KHRL+GHWG++PG++FL H+NR I Q+ + ++GPGHG P YL+G+Y+ Sbjct: 78 QIKHRLLGHWGSSPGISFLYTHLNRIIRKFDQDMLYMVGPGHGAPGFLGPCYLEGSYSRF 137 Query: 116 FPKITKDEAGLQKFFRQFSYPGGIPSHFAPETPGSIHEGGELGYALSHAYGAIMDNPSLF 175 F + ++DE G+++FF+QFS+PGGI SH PETPGSIHEGGELGY LSHAYGA DNP+L Sbjct: 138 FAECSEDEDGMKRFFKQFSFPGGIGSHCTPETPGSIHEGGELGYCLSHAYGAAFDNPNLI 197 Query: 176 VPAIVGDGEAETGPLATGWQSNKLVNPRTDGIVLPILHLNGYKIANPTILSRISDEELHE 235 V + GDGE+ETGPLAT W SNK +NP DG VLP+LHLNGYKI NP++LSRIS EEL Sbjct: 198 VVGLAGDGESETGPLATSWHSNKFINPIRDGAVLPVLHLNGYKINNPSVLSRISHEELKA 257 Query: 236 FFHGMGYEPYEFVAGFDDEDHMSIHRRFAELWETIWDEICDIKAAAQTDNVH-RPFYPML 294 F G GY PY FV G D E S+H+ A + EI I+ A++ + RP +PM+ Sbjct: 258 LFEGYGYTPY-FVEGSDPE---SMHQAMAATLDHCVSEIHQIQQEARSTGIAVRPRWPMV 313 Query: 295 IFRTPKGWTCPKYIDGKKTEGSWRAHQVPLASARDTEAHFEVLKNWLESYKPEELFDANG 354 + RTPKGWT P Y+DG K EG WR+HQVP+ + AH + L+ W+ SYKPEELFD G Sbjct: 314 VMRTPKGWTGPDYVDGHKVEGFWRSHQVPMGGMHENPAHLQQLEAWMRSYKPEELFDEQG 373 Query: 355 AVKDDVLAFMPKGELRIGANPNANGGVIRDDLKLPNLEDYEVKEVAEYGHGWGQLEA--T 412 +K A P+G+ R+G+ P ANGG++R LK+P+ Y + G +EA T Sbjct: 374 TLKPGFKAIAPEGDKRLGSTPYANGGLLRRGLKMPDFRQYGIDVDQP-----GTIEAPNT 428 Query: 413 RRLGVYTRDIIKNNPRDFRIFGPDETASNRLQASYEVTNKQWDAGYISDEVD-EHMHVSG 471 LGV+ RD++ NN +FR+FGPDE +SN+L A YEV+ K W A Y+ ++ D + G Sbjct: 429 APLGVFLRDVMANNMTNFRLFGPDENSSNKLHAVYEVSKKFWIAEYLEEDQDGGELSPDG 488 Query: 472 QVVEQLSEHQMEGFLEAYLLTGRHGIWSSYESFVHVIDSMLNQHAKWLEATVREIPWRKP 531 +V+E LSEH +EG+LEAYLLTGRHG +++YESF HVI SM+NQHAKWL+ R + WR Sbjct: 489 RVMEMLSEHTLEGWLEAYLLTGRHGFFATYESFAHVITSMVNQHAKWLD-ICRHLNWRAD 547 Query: 532 IASMNLLVSSHVWRQDHNGFSHQDPGVTSVLLNKCFHNDHVIGIYFATDANMLLAIAEKC 591 I+S+N+L++S VWRQDHNGF+HQDPG V+LNK + V+ IY D N LL++A+ C Sbjct: 548 ISSLNILMTSTVWRQDHNGFTHQDPGFLDVILNK---SPDVVRIYLPPDVNSLLSVADHC 604 Query: 592 YKSTNKINAIIAGKQPAATWLTLDEARAELAKGAAAWDWASTAKNNDEAEVVLAAAGDVP 651 +S N IN I+ KQ + + A KG W+WAS E +VV+AAAGD+P Sbjct: 605 LQSKNYINIIVCDKQAHLQYQDMTSAIRNCTKGVDIWEWASNDAGT-EPDVVMAAAGDIP 663

NATURE PLANTS | www.nature.com/natureplants 7
SUPPLEMENTARY INFORMATIONDOI: 10.1038/NPLANTS.2015.187
6
where MDVα* is the corrected mass isotopomer distribution vector and Ccorr,COH−1 is the
correction matrix. According to Equation 3, the resulting MDVα* values were then used to
assess the fractional labeling enrichment of serine and alanine whose carbon skeletons are
derived from phosphoglycerate and pyruvate, respectively.
FL = ∑ 𝑖𝑖.𝑚𝑚𝑖𝑖𝑛𝑛𝑖𝑖=0
𝑛𝑛.∑ 𝑚𝑚𝑖𝑖𝑛𝑛𝑖𝑖=0
(3)
where n represents the number of carbon atoms in AKG or pyruvate and i is the mass
isotopomer.
The fractional contribution of phosphoketolase pathway (fa) is calculated based on
Equation 4.
FLPGA1-3 = fa × FLA + fb × FLB + fc × FLC (4)
where FLPGA1-3 is the fractional labeling of 3-P-glycerate with all three carbons during 1-
13C-xylose labeling; FLA , FLB , and FLC are the fractional labeling resulted from the
phosphoketolase pathway, the pentose phosphate pathway and the CBB cycle respectively;
fb and fc are fractional contribution of pentose phosphate pathway and CBB cycle to the
triose pool. The principle of this calculation is illustrated in Supplementary Figure 3b.
Supplementary Data 1
Blast Analysis of Slr0453 against well-characterized phosphoketolase from
Bifidobacterium
7
Query: Phosphoketolase from Bifidobacterium breve (Length = 825) Subject: Slr0453 from Synechocystis sp. PCC 6803 (Length = 821) Score = 760 bits (1962), Expect = 0.0, Method: Compositional matrix adjust. Identities = 380/814 (46%), Positives = 526/814 (64%), Gaps = 27/814 (3%) Query: 1 MTSPVIGTPWKKLNA-----PVSEESLEGVDKYWRVANYLSIGQIYLRSNPLMKAPFTRE 55 +TSP +P+ + + P+ L + +WR ANYL++G IYLR NPL++ P E Sbjct: 18 VTSPFSLSPFGQARSTVTGNPLDPTELNQMHGFWRAANYLAVGMIYLRDNPLLREPLQPE 77 Query: 56 DVKHRLVGHWGTTPGLNFLIGHINRFIADHGQNTVIIMGPGHGGPAGTSQSYLDGTYTET 115 +KHRL+GHWG++PG++FL H+NR I Q+ + ++GPGHG P YL+G+Y+ Sbjct: 78 QIKHRLLGHWGSSPGISFLYTHLNRIIRKFDQDMLYMVGPGHGAPGFLGPCYLEGSYSRF 137 Query: 116 FPKITKDEAGLQKFFRQFSYPGGIPSHFAPETPGSIHEGGELGYALSHAYGAIMDNPSLF 175 F + ++DE G+++FF+QFS+PGGI SH PETPGSIHEGGELGY LSHAYGA DNP+L Sbjct: 138 FAECSEDEDGMKRFFKQFSFPGGIGSHCTPETPGSIHEGGELGYCLSHAYGAAFDNPNLI 197 Query: 176 VPAIVGDGEAETGPLATGWQSNKLVNPRTDGIVLPILHLNGYKIANPTILSRISDEELHE 235 V + GDGE+ETGPLAT W SNK +NP DG VLP+LHLNGYKI NP++LSRIS EEL Sbjct: 198 VVGLAGDGESETGPLATSWHSNKFINPIRDGAVLPVLHLNGYKINNPSVLSRISHEELKA 257 Query: 236 FFHGMGYEPYEFVAGFDDEDHMSIHRRFAELWETIWDEICDIKAAAQTDNVH-RPFYPML 294 F G GY PY FV G D E S+H+ A + EI I+ A++ + RP +PM+ Sbjct: 258 LFEGYGYTPY-FVEGSDPE---SMHQAMAATLDHCVSEIHQIQQEARSTGIAVRPRWPMV 313 Query: 295 IFRTPKGWTCPKYIDGKKTEGSWRAHQVPLASARDTEAHFEVLKNWLESYKPEELFDANG 354 + RTPKGWT P Y+DG K EG WR+HQVP+ + AH + L+ W+ SYKPEELFD G Sbjct: 314 VMRTPKGWTGPDYVDGHKVEGFWRSHQVPMGGMHENPAHLQQLEAWMRSYKPEELFDEQG 373 Query: 355 AVKDDVLAFMPKGELRIGANPNANGGVIRDDLKLPNLEDYEVKEVAEYGHGWGQLEA--T 412 +K A P+G+ R+G+ P ANGG++R LK+P+ Y + G +EA T Sbjct: 374 TLKPGFKAIAPEGDKRLGSTPYANGGLLRRGLKMPDFRQYGIDVDQP-----GTIEAPNT 428 Query: 413 RRLGVYTRDIIKNNPRDFRIFGPDETASNRLQASYEVTNKQWDAGYISDEVD-EHMHVSG 471 LGV+ RD++ NN +FR+FGPDE +SN+L A YEV+ K W A Y+ ++ D + G Sbjct: 429 APLGVFLRDVMANNMTNFRLFGPDENSSNKLHAVYEVSKKFWIAEYLEEDQDGGELSPDG 488 Query: 472 QVVEQLSEHQMEGFLEAYLLTGRHGIWSSYESFVHVIDSMLNQHAKWLEATVREIPWRKP 531 +V+E LSEH +EG+LEAYLLTGRHG +++YESF HVI SM+NQHAKWL+ R + WR Sbjct: 489 RVMEMLSEHTLEGWLEAYLLTGRHGFFATYESFAHVITSMVNQHAKWLD-ICRHLNWRAD 547 Query: 532 IASMNLLVSSHVWRQDHNGFSHQDPGVTSVLLNKCFHNDHVIGIYFATDANMLLAIAEKC 591 I+S+N+L++S VWRQDHNGF+HQDPG V+LNK + V+ IY D N LL++A+ C Sbjct: 548 ISSLNILMTSTVWRQDHNGFTHQDPGFLDVILNK---SPDVVRIYLPPDVNSLLSVADHC 604 Query: 592 YKSTNKINAIIAGKQPAATWLTLDEARAELAKGAAAWDWASTAKNNDEAEVVLAAAGDVP 651 +S N IN I+ KQ + + A KG W+WAS E +VV+AAAGD+P Sbjct: 605 LQSKNYINIIVCDKQAHLQYQDMTSAIRNCTKGVDIWEWASNDAGT-EPDVVMAAAGDIP 663

8 NATURE PLANTS | www.nature.com/natureplants
SUPPLEMENTARY INFORMATION DOI: 10.1038/NPLANTS.2015.187
8
Query: 652 TQEIMAASDKLKEL--GVKFKVVNVADLLSLQSAKENDEALSDEEFADIFTADKPVLFAY 709 T+E +AA+ L++ ++ + V+V DLL LQ E+ LSD +F +FT DKP++F + Sbjct: 664 TKEALAATAMLRQFFPNLRIRFVSVIDLLKLQPESEHPHGLSDRDFDSLFTTDKPIIFNF 723 Query: 710 HSYAHDVRGLIYDRPNHDNFNVHGYEEEGSTTTPYDMVRVNRIDRYELTAEALRMIDADK 769 H+Y + L Y R NH N +V GY+E+G+ TP D+ N+IDR+ L + + + + Sbjct: 724 HAYPWLIHRLTYRRTNHGNLHVRGYKEKGNINTPMDLAIQNQIDRFSLAIDVIDRLPQLR 783 Query: 770 YADK-IDELEK-FRDEAFQFAVDKGYDHPDYTDW 801 A I E+ K + + +A + G D P+ +W Sbjct: 784 VAGAHIKEMLKDMQIDCTNYAYEHGIDMPEIVNW 817
Note: Yellow boxed residues are key sites in Bifidobacterium phosphoketolase for interaction with the sugar-
derived hydroxyl groups. Green boxed residues recognize the distal phosphate group of F6P or Xu5p. All
these residues are conserved in Slr0453.The gray shaded sequences Gly116-to-Pro342, Thr428-to-Ser607,
and Lys618-to-Trp817 are conserved, and correspond to the TPP-binding module, phosphoketolase (XFP)
domain and XFP C-terminal domain, respectively.
9
Supplementary Table
Supplementary Table 1 Doubling times of strains used in this study
Doubling Time1 (h) Genotype/Characterization Reference or
source Wild-type 10.4±0.2 Synechocystis PCC. 6803 Gift from Teruo
Ogawa ∆slr0453 11.6±0.3 slr0453::CmR This study
∆slr0453/slr0453c 16.6±1.0 slr0453::CmR,rbcL-slr0453-EmR This study
xylAB 10.7±0.2 slr0168::psbA-xylAB-SpR 4 xylAB/∆slr0453 11.8±0.4 slr0168::psbA-xylAB-SpR, slr0453::CmR This study
xylAB/∆slr0453/slr0453c 16.9±0.9 slr0168::psbA-xylAB-SpR, slr0453::CmR,rbcL-slr0453-EmR This study
∆glgC/xylAB 12.1±0.2 slr1176::GenR, slr0168::psbA-xylAB-SpR 4 ∆glgC/xylAB/∆slr0453 13.3±0.1 slr1176::GenR, slr0168::psbA-xylAB-SpR,
slr0453::CmR This study
1: The doubling times were measured from triplicate experiments done with cells grown
photoautotrophically under fluorescent light at the intensity of 50 μEm-2s-1 without
antibiotics supplementation to the BG11 medium.

NATURE PLANTS | www.nature.com/natureplants 9
SUPPLEMENTARY INFORMATIONDOI: 10.1038/NPLANTS.2015.187
8
Query: 652 TQEIMAASDKLKEL--GVKFKVVNVADLLSLQSAKENDEALSDEEFADIFTADKPVLFAY 709 T+E +AA+ L++ ++ + V+V DLL LQ E+ LSD +F +FT DKP++F + Sbjct: 664 TKEALAATAMLRQFFPNLRIRFVSVIDLLKLQPESEHPHGLSDRDFDSLFTTDKPIIFNF 723 Query: 710 HSYAHDVRGLIYDRPNHDNFNVHGYEEEGSTTTPYDMVRVNRIDRYELTAEALRMIDADK 769 H+Y + L Y R NH N +V GY+E+G+ TP D+ N+IDR+ L + + + + Sbjct: 724 HAYPWLIHRLTYRRTNHGNLHVRGYKEKGNINTPMDLAIQNQIDRFSLAIDVIDRLPQLR 783 Query: 770 YADK-IDELEK-FRDEAFQFAVDKGYDHPDYTDW 801 A I E+ K + + +A + G D P+ +W Sbjct: 784 VAGAHIKEMLKDMQIDCTNYAYEHGIDMPEIVNW 817
Note: Yellow boxed residues are key sites in Bifidobacterium phosphoketolase for interaction with the sugar-
derived hydroxyl groups. Green boxed residues recognize the distal phosphate group of F6P or Xu5p. All
these residues are conserved in Slr0453.The gray shaded sequences Gly116-to-Pro342, Thr428-to-Ser607,
and Lys618-to-Trp817 are conserved, and correspond to the TPP-binding module, phosphoketolase (XFP)
domain and XFP C-terminal domain, respectively.
9
Supplementary Table
Supplementary Table 1 Doubling times of strains used in this study
Doubling Time1 (h) Genotype/Characterization Reference or
source Wild-type 10.4±0.2 Synechocystis PCC. 6803 Gift from Teruo
Ogawa ∆slr0453 11.6±0.3 slr0453::CmR This study
∆slr0453/slr0453c 16.6±1.0 slr0453::CmR,rbcL-slr0453-EmR This study
xylAB 10.7±0.2 slr0168::psbA-xylAB-SpR 4 xylAB/∆slr0453 11.8±0.4 slr0168::psbA-xylAB-SpR, slr0453::CmR This study
xylAB/∆slr0453/slr0453c 16.9±0.9 slr0168::psbA-xylAB-SpR, slr0453::CmR,rbcL-slr0453-EmR This study
∆glgC/xylAB 12.1±0.2 slr1176::GenR, slr0168::psbA-xylAB-SpR 4 ∆glgC/xylAB/∆slr0453 13.3±0.1 slr1176::GenR, slr0168::psbA-xylAB-SpR,
slr0453::CmR This study
1: The doubling times were measured from triplicate experiments done with cells grown
photoautotrophically under fluorescent light at the intensity of 50 μEm-2s-1 without
antibiotics supplementation to the BG11 medium.

10 NATURE PLANTS | www.nature.com/natureplants
SUPPLEMENTARY INFORMATION DOI: 10.1038/NPLANTS.2015.187
10
Supplementary Table 2 Stoichiometry and theoretical yields for acetate, pyruvate and 2-
oxoglutarate production from phosphoketolase-dependent and -independent pathways
No.1 Product Substrate Phospho-ketolase2 Theoretical yield3 Stoichiometry
a acetate CO2 + ∞ 2 CO2 + 5 ATP + 4 NADPH = 1 Acetate
b acetate CO2 - ∞ 2 CO2 + 6 ATP + 4 NADPH = 1 Acetate
c acetate xylose + 100% 2 Xylose = 5 Acetate + 3 ATP
d acetate xylose - 66.67% 3 Xylose = 5 Acetate + 5 CO2 + 10 ATP + 10 NADPH
e pyruvate CO2 - ∞ 3 CO2 + 7 ATP + 5 NADPH = 1 Pyruvate
f pyruvate xylose - 100.00% 3 Xylose = 5 ATP + 5 NADPH + 5 Pyruvate
g 2-oxoglutarate CO2 + ∞ 5 CO2 + 14 ATP + 8 NADPH = 1 2-
oxoglutarate h 2-
oxoglutarate CO2 - ∞ 5 CO2 + 15 ATP + 8 NADPH = 1 2-oxoglutarate
i 2-oxoglutarate xylose + 100% 1 Xylose = 2 NADPH + 1 2-
oxoglutarate
j 2-oxoglutarate xylose - 83.33% 6 Xylose = 20 NADPH + 5 ATP + 5 2-
oxoglutarate + 5 CO2 1. The No. of each line corresponds to the panel with identical No. in Supplementary Figure
4.
2. The operation of the phosphoketolase pathway can improve acetate and 2-oxoglutarate
but not pyruvate production by enhancing theoretical yield (c, i) or reducing ATP cost (a, g).
3. Theoretical yield = C product / C substrate (organic). The CO2-utilization pathways do not consume
organic carbon, thus are treated here as having theoretical yield of infinity.
11
Supplementary Figures
Supplementary Figure 1 Phosphoketolase pathway and genome information. a. The
phosphoketolase pathway towards acetate production bypasses pyruvate. XI: xylose
isomerase, XK: xylulokinase, PDH: pyruvate dehydrogenase, PAT: phosphate
acetyltransferase, AK: acetate kinase, ACS: acetyl CoA synthetase; XFP: D-xylulose 5-
phosphate/D-Fructose 6-phosphate phosphoketolase. Red arrows denote the
phosphoketolase pathway and dotted arrows denote conversions catalyzed by multi-step
enzymatic reactions. b. Arrangements of putative phosphoketolase genes in cyanobacterial
genomes. Red, purple and blue arrows denote putative genes encoding phosphoketolase,
acetate kinase, and glyceraldehyde 3-phosphate dehydrogenase, respectively. Grey arrows
indicate other predicted open reading frames surrounding phosphoketolase genes.

NATURE PLANTS | www.nature.com/natureplants 11
SUPPLEMENTARY INFORMATIONDOI: 10.1038/NPLANTS.2015.187
10
Supplementary Table 2 Stoichiometry and theoretical yields for acetate, pyruvate and 2-
oxoglutarate production from phosphoketolase-dependent and -independent pathways
No.1 Product Substrate Phospho-ketolase2 Theoretical yield3 Stoichiometry
a acetate CO2 + ∞ 2 CO2 + 5 ATP + 4 NADPH = 1 Acetate
b acetate CO2 - ∞ 2 CO2 + 6 ATP + 4 NADPH = 1 Acetate
c acetate xylose + 100% 2 Xylose = 5 Acetate + 3 ATP
d acetate xylose - 66.67% 3 Xylose = 5 Acetate + 5 CO2 + 10 ATP + 10 NADPH
e pyruvate CO2 - ∞ 3 CO2 + 7 ATP + 5 NADPH = 1 Pyruvate
f pyruvate xylose - 100.00% 3 Xylose = 5 ATP + 5 NADPH + 5 Pyruvate
g 2-oxoglutarate CO2 + ∞ 5 CO2 + 14 ATP + 8 NADPH = 1 2-
oxoglutarate h 2-
oxoglutarate CO2 - ∞ 5 CO2 + 15 ATP + 8 NADPH = 1 2-oxoglutarate
i 2-oxoglutarate xylose + 100% 1 Xylose = 2 NADPH + 1 2-
oxoglutarate
j 2-oxoglutarate xylose - 83.33% 6 Xylose = 20 NADPH + 5 ATP + 5 2-
oxoglutarate + 5 CO2 1. The No. of each line corresponds to the panel with identical No. in Supplementary Figure
4.
2. The operation of the phosphoketolase pathway can improve acetate and 2-oxoglutarate
but not pyruvate production by enhancing theoretical yield (c, i) or reducing ATP cost (a, g).
3. Theoretical yield = C product / C substrate (organic). The CO2-utilization pathways do not consume
organic carbon, thus are treated here as having theoretical yield of infinity.
11
Supplementary Figures
Supplementary Figure 1 Phosphoketolase pathway and genome information. a. The
phosphoketolase pathway towards acetate production bypasses pyruvate. XI: xylose
isomerase, XK: xylulokinase, PDH: pyruvate dehydrogenase, PAT: phosphate
acetyltransferase, AK: acetate kinase, ACS: acetyl CoA synthetase; XFP: D-xylulose 5-
phosphate/D-Fructose 6-phosphate phosphoketolase. Red arrows denote the
phosphoketolase pathway and dotted arrows denote conversions catalyzed by multi-step
enzymatic reactions. b. Arrangements of putative phosphoketolase genes in cyanobacterial
genomes. Red, purple and blue arrows denote putative genes encoding phosphoketolase,
acetate kinase, and glyceraldehyde 3-phosphate dehydrogenase, respectively. Grey arrows
indicate other predicted open reading frames surrounding phosphoketolase genes.

12 NATURE PLANTS | www.nature.com/natureplants
SUPPLEMENTARY INFORMATION DOI: 10.1038/NPLANTS.2015.187
12
Supplementary Figure 2 Construction of ∆slr0453 mutants. a. Cassettes constructed for
disrupting slr0453. b. Cassettes constructed for slr0453 complementation. c. PCR analysis of
wild-type Synechocystis and mutants using the primer pairs: lane 1-4, P1 and P2, lane 5-7, P2
and P3, and genomic DNA as template: lane 1, wild-type Synechocystis; 2, Δslr0453; 3,
xylAB/Δslr0453; 4, xylAB /ΔglgC/Δslr0453; 5, wild-type; 6, Δslr0453/slr0453c; 7, xylAB
/Δslr0453/slr0453c. The construction procedures and sequences for P1, P2, and P3 are
shown in Supplementary Methods. CmR: Chloramphenicol resistance gene, rbcL: the Rubisco
large subunit promoter, EmR: Erythromycin resistance gene.
13
Supplementary Figure 3 The 13C-xylose tracer experiment quantitatively estimates
the flux of the phophoketolase pathway in the central carbon metabolism. a. Carbon
fate of 1-13C xylose metabolized through phosphoketolase pathway (black arrows), the PPP
(red arrows) and the CBB cycle (green arrows). The solid circles denote 13C-labeled carbon
atoms. b. Calculation of metabolic flux ratios through phosphoketolase pathway. fa
, fb and f
c
are the fractional contribution of the alternative pathways via phosphoketolase, the PPP
and the CBB cycle, respectively. Fractional labeling (FL) is calculated according to Eq. 3 (see
Supplementary Methods). c. Experimental design using U-13C-xylose and 1-13C-xylose to
feed xylAB and xylAB/∆slr0453 strains in the purpose of determining fc
and fa
respectively.

NATURE PLANTS | www.nature.com/natureplants 13
SUPPLEMENTARY INFORMATIONDOI: 10.1038/NPLANTS.2015.187
12
Supplementary Figure 2 Construction of ∆slr0453 mutants. a. Cassettes constructed for
disrupting slr0453. b. Cassettes constructed for slr0453 complementation. c. PCR analysis of
wild-type Synechocystis and mutants using the primer pairs: lane 1-4, P1 and P2, lane 5-7, P2
and P3, and genomic DNA as template: lane 1, wild-type Synechocystis; 2, Δslr0453; 3,
xylAB/Δslr0453; 4, xylAB /ΔglgC/Δslr0453; 5, wild-type; 6, Δslr0453/slr0453c; 7, xylAB
/Δslr0453/slr0453c. The construction procedures and sequences for P1, P2, and P3 are
shown in Supplementary Methods. CmR: Chloramphenicol resistance gene, rbcL: the Rubisco
large subunit promoter, EmR: Erythromycin resistance gene.
13
Supplementary Figure 3 The 13C-xylose tracer experiment quantitatively estimates
the flux of the phophoketolase pathway in the central carbon metabolism. a. Carbon
fate of 1-13C xylose metabolized through phosphoketolase pathway (black arrows), the PPP
(red arrows) and the CBB cycle (green arrows). The solid circles denote 13C-labeled carbon
atoms. b. Calculation of metabolic flux ratios through phosphoketolase pathway. fa
, fb and f
c
are the fractional contribution of the alternative pathways via phosphoketolase, the PPP
and the CBB cycle, respectively. Fractional labeling (FL) is calculated according to Eq. 3 (see
Supplementary Methods). c. Experimental design using U-13C-xylose and 1-13C-xylose to
feed xylAB and xylAB/∆slr0453 strains in the purpose of determining fc and f
a respectively.

14 NATURE PLANTS | www.nature.com/natureplants
SUPPLEMENTARY INFORMATION DOI: 10.1038/NPLANTS.2015.187
14
15
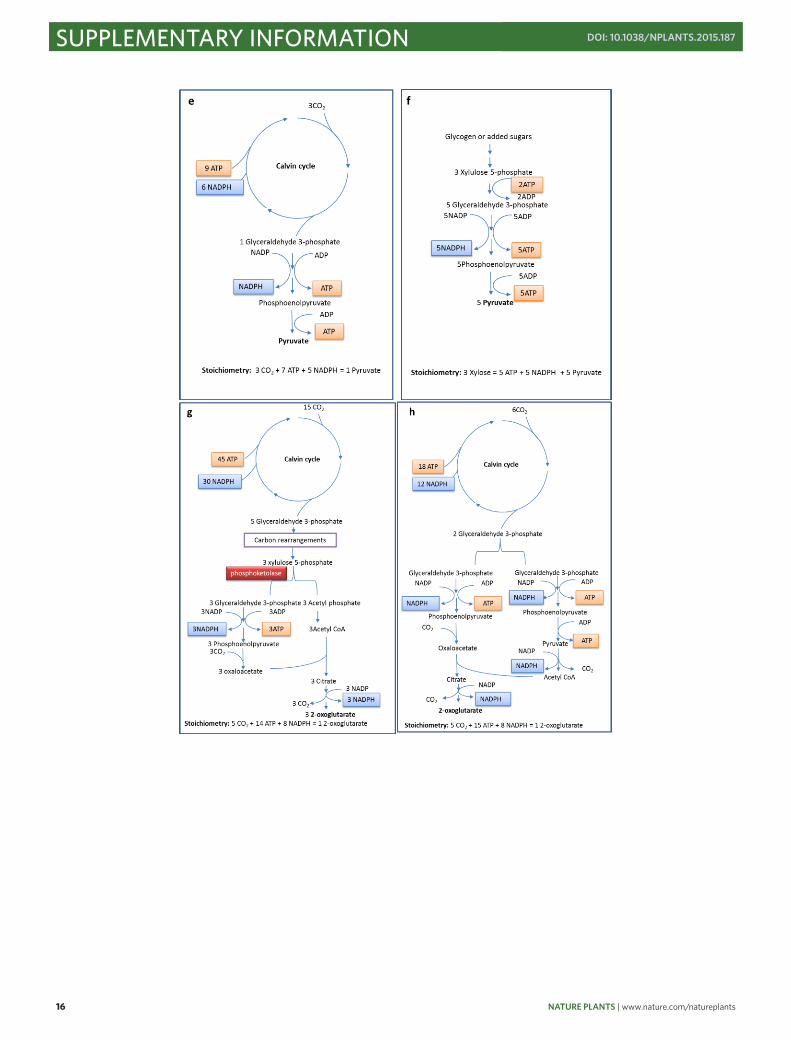
Supplementary Figure 4 Phosphoketolase-dependent (Panel a, c, g, h) and independent
(Panel b, d, e, f, h, j) pathways for the production of acetate (Panel a-d), pyruvate (Panel e,
f), and 2-oxoglutarate (Panel g-j) from CO2 (Panel a, b, e, g, h ) or sugars (Panel c, d, f, i, j).
The respective ATP and co-factor costs are summarized in Supplementary Table 2.

NATURE PLANTS | www.nature.com/natureplants 15
SUPPLEMENTARY INFORMATIONDOI: 10.1038/NPLANTS.2015.187
14
15
Supplementary Figure 4 Phosphoketolase-dependent (Panel a, c, g, h) and independent
(Panel b, d, e, f, h, j) pathways for the production of acetate (Panel a-d), pyruvate (Panel e,
f), and 2-oxoglutarate (Panel g-j) from CO2 (Panel a, b, e, g, h ) or sugars (Panel c, d, f, i, j).
The respective ATP and co-factor costs are summarized in Supplementary Table 2.
16 NATURE PLANTS | www.nature.com/natureplants
SUPPLEMENTARY INFORMATION DOI: 10.1038/NPLANTS.2015.187
16
17
References
1. Close TJ, Rodriguez RL. Construction and characterization of the chloramphenicol-
resistance gene cartridge: a new approach to the transcriptional mapping of
extrachromosomal elements. Gene 20, 305-316 (1982).
2. Vermaas WFJ, J. G. K. Williams, and C. J. Arntzen. Sequencing and modification of psbB, the
gene encoding the CP-47 protein of photosystem II, in the cyanobacterium Synechocystis sp.
PCC 6803. Plant Mol Biol 8, 317-326 (1987).
3. Carrieri D, Paddock T, Maness PC, Seibert M, Yu JP. Photo-catalytic conversion of carbon
dioxide to organic acids by a recombinant cyanobacterium incapable of glycogen storage.
Energ Environ Sci 5, 9457-9461 (2012).
4. Lee T-C, et al. Engineered xylose utilization enhances bio-products productivity in the
cyanobacterium Synechocystis sp. PCC 6803. Metab Eng 30, 179-189 (2015).

NATURE PLANTS | www.nature.com/natureplants 17
SUPPLEMENTARY INFORMATIONDOI: 10.1038/NPLANTS.2015.187
16
17
References
1. Close TJ, Rodriguez RL. Construction and characterization of the chloramphenicol-
resistance gene cartridge: a new approach to the transcriptional mapping of
extrachromosomal elements. Gene 20, 305-316 (1982).
2. Vermaas WFJ, J. G. K. Williams, and C. J. Arntzen. Sequencing and modification of psbB, the
gene encoding the CP-47 protein of photosystem II, in the cyanobacterium Synechocystis sp.
PCC 6803. Plant Mol Biol 8, 317-326 (1987).
3. Carrieri D, Paddock T, Maness PC, Seibert M, Yu JP. Photo-catalytic conversion of carbon
dioxide to organic acids by a recombinant cyanobacterium incapable of glycogen storage.
Energ Environ Sci 5, 9457-9461 (2012).
4. Lee T-C, et al. Engineered xylose utilization enhances bio-products productivity in the
cyanobacterium Synechocystis sp. PCC 6803. Metab Eng 30, 179-189 (2015).

18 NATURE PLANTS | www.nature.com/natureplants
SUPPLEMENTARY INFORMATION DOI: 10.1038/NPLANTS.2015.187
18
5. Onizuka T, et al. CO2 response for expression of ribulose-1,5-bisphosphate
carboxylase/oxygenase genes is inhibited by AT-rich decoy in the cyanobacterium. FEBS
letters 542, 42-46 (2003).
6. Xiong W, Liu L, Wu C, Yang C, Wu Q. 13C-tracer and gas chromatography-mass spectrometry
analyses reveal metabolic flux distribution in the oleaginous microalga Chlorella
protothecoides. Plant Physiol 154, 1001-1011 (2010).
7. Nanchen A, Fuhrer T, Sauer U. Determination of metabolic flux ratios from 13C-experiments
and gas chromatography-mass spectrometry data: protocol and principles. Methods Mol Biol
358, 177-197 (2007).