photo-physical properties of 2-(1-ethynylpyrene)-adenosine ... · adenosine: influence of hydrogen...
TRANSCRIPT

This journal is© the Owner Societies 2014 Phys. Chem. Chem. Phys., 2014, 16, 13875--13888 | 13875
Cite this:Phys.Chem.Chem.Phys.,
2014, 16, 13875
Photo-physical properties of 2-(1-ethynylpyrene)-adenosine: influence of hydrogen bonding onexcited state properties†
P. Trojanowski,a J. Plotner,a C. Grunewald,b F. F. Graupner,c C. Slavov,a A. J. Reuss,a
M. Braun,a J. W. Engelsb and J. Wachtveitl*a
The photo-physical properties of 2-(1-ethynylpyrene)-adenosine (PyA), a fluorescent probe for RNA dynamics,
were examined by solvation studies. The excited-state dynamics display the influence of the vicinity on
the spectral features. Combining improved transient absorption and streak camera measurements along
with a new analysis method provide a detailed molecular picture of the photophysics. After intramolecular
vibrational energy redistribution (IVR), two distinct states are observed. Solvent class (protic/aprotic) and
permittivity strongly affect the properties of these states and their population ratio. As a result their emission
spectrum is altered, while the fluorescence quantum yield and the overall lifetime remain nearly unchanged.
Consequently, the hitherto existing model of the photophysics is herein refined and extended. The findings
can serve as basis for improving the information content of measurements with PyA as a label in RNA.
Introduction
Monitoring dynamics of proteins, membranes or DNA/RNAdepends on specific and versatile probes. Molecular fluores-cence can be very sensitive depending on the molecule and itssurroundings covering a great variety of lifetimes or spectralcharacteristics.1 Therefore fluorophores are perfectly suitedand thus ubiquitously applied as molecular probes. Pyrene isused often among the large number of fluorophores. The basicspectral characteristics and photo-dynamics of the monomer2–8 aswell as its excimer characteristics2,9,10 are well studied. Numerousderivatives of pyrene were synthesized to examine the influence ofsubstitutions,8,11 artificial donor–acceptor systems,12–15 its aggre-gation behaviour and ISC/IC dynamics.16,17 A number of groupsintroduced pyrene into DNA to investigate electron transferinto nucleobases via photo-excitation of pyrene,15,18–24 specificbase/structure recognition,25–30 FRET-pair studies,30–32 molecular
beacons,33–35 hybridization probes36–42 etc. and accomplished aremarkable understanding of the photo-physics and dynamicsof pyrene coupled to deoxyribonucleic acid nucleosides. A greatvariety of fluorophores as probes for RNA were also synthesized,aiming for a structural and functional probe with minimalstructural perturbation and optimal photo-physical properties,43
which is challenging due to the greater structural flexibility andcomplexity of RNA.44–47 Pyrene as a label has a small share of thisvariety in RNA. It was introduced with different linkers at differentpositions to the RNA nucleosides. One favoured position is theC20 of ribose to detect ribonucleic acid48–53 as well as to monitorhybridization42,53,54 and folding.55 C20 was chosen because the labelshould point out of a typical A-helix structure motif. Anotherapproach is the direct modification of the nucleobase and wasapplied to DNA nucleosides by groups like Wagenknecht,15,18–24,36,39
Netzel,56,57 Kim37 and Berlin.58
We previously presented the 2-(1-ethynylpyrene)-adenosine(PyA, Fig. 1), a pyrene modified RNA nucleoside, where pyrene isattached at the 2-position of adenine.59 This position was chosenin order to locate the pyrene in the minor groove of a RNA A-helix.
The photo-physics of a protected nucleoside form60 as wellas the applicability and the characteristics of PyA in modified15-mer oligonucleotides61 as a RNA folding probe were investi-gated.62 Based on spectroscopic characteristics of CT states12,63 andfindings of other groups, which observed ICT states in similarsystems24,64 the proposed model of the photophysics involved anintramolecular charge transfer process (ICT).61 This intramolecularcharge transfer was suggested to take place from the pyrene to theadenine64 and to be followed by a proton transfer to adenine.60
a Institute for Physical and Theoretical Chemistry, Goethe University Frankfurt,
Max-von-Laue-Straße 7, 60438 Frankfurt/Main, Germany.
E-mail: [email protected]; Fax: +496979829709;
Tel: +496979829351b Institute for Organic Chemistry and Chemical Biology, Goethe University
Frankfurt, Max-von-Laue-Straße 7, 60438 Frankfurt/Main, Germanyc Faculty of Physics, Center for Integrative Protein Science, Ludwig Maximilians
University Munich, Oettingenstrasse 67, 80538 Munich, Germany
† Electronic supplementary information (ESI) available: Em. spectra of PyA at376 nm and 421 nm (Fig. S1), exc. spectra in MeOH and DMSO (Fig. S2), TAspectra of PyA in all solvents (Fig. S3) and comparison of experimental absorptionspectra of PyA in DMSO with QC calculations (Fig. S4). See DOI: 10.1039/c4cp01148a
Received 17th March 2014,Accepted 14th May 2014
DOI: 10.1039/c4cp01148a
www.rsc.org/pccp
PCCP
PAPER
Ope
n A
cces
s A
rtic
le. P
ublis
hed
on 1
4 M
ay 2
014.
Dow
nloa
ded
on 3
0/01
/201
5 13
:10:
33.
Thi
s ar
ticle
is li
cens
ed u
nder
a C
reat
ive
Com
mon
s A
ttrib
utio
n 3.
0 U
npor
ted
Lic
ence
.
View Article OnlineView Journal | View Issue

13876 | Phys. Chem. Chem. Phys., 2014, 16, 13875--13888 This journal is© the Owner Societies 2014
However, it remained unclear whether a proton transfer indeedtakes place and how the surrounding contributes to the spectralproperties and dynamics of 2-(1-ethynylpyrene)-adenosine.
This study reports on the solvent dependence of the photo-induced dynamics by using steady-state, transient absorptionand streak camera measurements as well as quantum chemicalcalculations and leads to a more complete picture of the photo-induced processes of 2-(1-ethynylpyrene)-adenosine.
Material and methodsSample preparation
2-(1-Ethynylpyrene)-adenosine (PyA) was synthesized using metho-dologies described earlier for the synthesis of protected PyA.59
In summary, a solvent mixture of 60 ml of dimethylforma-mide and 5 ml of triethylamine was degassed thoroughlyto exclude oxygen in the reaction mixture. 1.00 g (2.55 mmol,1.00 eq.) of 2-iodoadenosine, 0.751 g (3.32 mmol, 1.30 eq.) of1-ethynylpyrene, 84 mg (0.44 mmol, 17 mol%) of copper(I)iodideand 176 mg of bis(triphenylphosphine)palladium(II)chloride(0.25 mmol, 10 mol%) were added to the solvent mixture.The orange reaction mixture was stirred under argon for 19 hat room temperature. The mixture was filtered off to removecopper(I)iodide, the solution was adsorbed on silica gel andpurified by column chromatography. Elution with a solventmix of dichloromethane and methanol (9 : 1) and subsequentcrystallization from methanol afforded 2-(1-ethynylpyrene)-adenosine as yellow powder in 80% yield.
A DMSO stock solution was diluted to prepare the samplesin other solvents and therefore a remaining amount of 1%-DMSOis present in all solvents. As a side effect tBuOH remains liquid atroom temperature (B23 1C).
Steady-state spectroscopy
Absorption spectra were recorded on a JASCO V670 absorptionspectrometer between 300 nm and 600 nm using a fused silicacuvette with 1 mm optical path length. All spectra were back-ground corrected for solvent absorption. In acetone, the spectrumwas limited to 340 nm due to strong solvent absorption. Theconcentration of PyA for all absorption measurements variedbetween 150–200 mM.
Fluorescence spectra were taken on a JASCO FP-8500 fluori-meter between 360 nm and 700 nm using a fused silica cuvette
with the dimensions 3 � 3 � 3 mm3. The excitation wavelengthvaried between 371 nm and 376 nm depending on the exactposition of the absorption maximum. The concentration wasadjusted to approximately 0.1 OD/3 mm (B10 mM) to minimizereabsorption effects. The spectra were corrected for remainingreabsorption and the spectral properties of the detection system.Fluorescence quantum yields (Ffl) were obtained by a relativemethod with quinine bisulfate (10 mM, Ffl = 0.60 � 0.02 at350 nm in 0.5 M H2SO4 (ref. 65 and 66)). A cross reference withquinine bisulfate (10 mM) in 0.05 M H2SO4 at 366 nm was done toaccount for excitation wavelength and H2SO4 concentrationspecific variations.
Vis-pump–probe spectroscopy
The time resolved transient absorption (TA) measurementswere performed using a self-built pump–probe setup.67 Ultrashort laser pulses (150 fs) were provided by a laser–amplifiersystem (Clark, MXR-CPA-2001) operating at a repetition rate of1 kHz at a central wavelength of 775 nm. For the probe pulses, asingle filament white light (WL) was generated by focusing thelaser fundamental in a CaF2 crystal of 5 mm thickness. The WLcovered a spectral range between 350 nm and 700 nm and wasfocused to a diameter of B100 mm at the sample position. Thepump pulses at 388 nm were produced by second harmonicgeneration (SHG) in a 0.1 mm BBO crystal (200 fs pulseduration) and focused to a diameter of B200 mm at the sampleposition. The pump pulse energy was adjusted to 100 nJ toavoid two-photon absorption processes (total amount of excitedmolecules o6%), even though no changes in dynamics wereobserved for pulse energies up to 250 nJ. Difference spectra ofexcited and unexcited samples were recorded by blocking everysecond laser pulse in the excitation pulse pathway using achopper. Probe pulses were dispersed using a spectrometerresulting in a spectral resolution of 4 nm and recorded by agated detection system. This detection system is composed of a128 channel photodiode array (PDA) combined with a signalprocessing chip (Hamamatsu Photonics, S8865-128), a drivercircuit (Hamamatsu Photonics, C9118) and a data acquisition card(National Instruments, NI-6120), which digitizes the analog PDAsignals at 16 bits. The experiments were performed under magicangle conditions (54.71 pump–probe polarization angle difference)and continuous movement of the sample in the plane perpendicularto the direction of pulse propagation. The signal to noise ratio was103 for an average of 6 scans (2.5 � 103 pulses per scan).
Streak camera spectroscopy
A Hamamatsu streak camera system (C5680-24 C) was employedto measure time-resolved fluorescence. For the femtosecondexcitation pulses a CPA laser system (Clark, MXR-CPA-2001) at780 nm was frequency doubled (390 nm) by second harmonicgeneration in a BBO crystal. The excitation energy variedbetween 40 nJ and 200 nJ depending on the sample and thetime frame. It was focused onto the sample and detected underan angle of 151 to avoid excitation light to be collected. Theexcitation beam diameter was about 15 mm at the sampleposition. The induced fluorescence light was collected by an
Fig. 1 Lewis structure of the pyrene modified adenosine 2-(1-ethynylpyrene)-adenosine (PyA).
Paper PCCP
Ope
n A
cces
s A
rtic
le. P
ublis
hed
on 1
4 M
ay 2
014.
Dow
nloa
ded
on 3
0/01
/201
5 13
:10:
33.
Thi
s ar
ticle
is li
cens
ed u
nder
a C
reat
ive
Com
mon
s A
ttrib
utio
n 3.
0 U
npor
ted
Lic
ence
.View Article Online

This journal is© the Owner Societies 2014 Phys. Chem. Chem. Phys., 2014, 16, 13875--13888 | 13877
air-gap achromat ( f = 80 mm, 20 mm diameter, Type OUV 4.20,Bernhard Halle Nachfl. GmbH). The collimated fluorescencelight passed a wire-grid polarizer (Moxtek UBB01C, diameter36 mm) positioned at the magic angle before being focusedwith a second achromatic lens ( f = 75 mm NUV, diameter25 mm, Edmund Optics) onto the entrance slit of the spectro-graph (Princeton Instruments, Acton Series SP2356, f = 300 mm,50 lines per mm grating blazed at 600 nm). The slit widths wereheld to a minimum in order to achieve best temporal andspectral resolution. For further details of the setup see ref. 68.The spectrometer slit width was set between 5 mm and 15 mmcorresponding to an overall wavelength resolution of 1.3 nm to2 nm, respectively. The focal plane of the spectrograph coincidedwith the photocathode of the streak camera system. Thetime window was set by a fast single-sweep unit (Hamamatsu,M5677-01) with sweep velocities chosen accordingly to theinvestigated process. In the nanosecond regime, data wereacquired in continuous sweeping mode. For detailed observationof the spectral shift in the picosecond regime time resolutionwas improved by deploying single sweeping combined with jittercorrection using a fraction of excitation light as a temporalfix point in each frame. Therefore an overall time resolution ofo5 ps, 6–20 ps, 40–50 ps and 80–100 ps was achieved for thecorresponding time windows of 0.12 ns, 0.48 ns, 4.27 ns and10.33 ns, respectively. For a more detailed explanation of thestreak camera operation see ref. 69. All data were collected inphoton-counting mode, typically yielding between 104 and 103
counts for one detection bin at the emission peak (bin definedby: wavelength width = spectral resolution, temporal width =effective width of instrumental response function). To collectsufficient fluorescence intensity for an adequate signal andreasonable statistics, excitation energy was chosen individually.However, in all experiments the photon flux was kept lowenough to avoid pile-up artefacts. The total acquisition timefor each measurement amounted to B15 min for the continuousstreaking and B1 h for single sweep measurements. The samplesolutions were pumped through a flow cell (fused silica, 0.5 mmlight path length) to exchange the excited sample volumebetween consecutive laser pulses. All samples were prepared toyield less than 0.15 OD/mm absorbance required to match linearconditions avoiding reabsorption. The same sample preparationwas used for all time frames. Therefore the total number ofexcitation shots accumulated for B2 ml of sample preparationwith concentrations B70 mM typically amounted to 5 � 105. Toprove intactness of the sample throughout the whole streakingexperiment stationary absorption spectra were recorded using aspectrophotometer (LAMBDA 750, Perkin Elmer) and comparedbefore and after the time resolved measurements.
Data analysis
Transient absorption. Transient absorption data were analysedfirst by conventional global lifetime analysis (GLA)70 using asmall number of discrete exponentials (typically r6). However,the high amount of spectrally and temporally interfering signalsas well as the potential presence of non-exponential processesmade the interpretation and the comparison of the resulting
decay-associated spectra (DAS) very difficult. Thus, we do notpresent any of these results here. Instead, we have performed alifetime density analysis (LDA), where the pre-exponential ampli-tudes in a sum of a large number (450, typically B100) ofexponential functions with fixed lifetimes are determined. Sincethe analysis is performed over the complete dataset it can beviewed as a more sophisticated extension of the GLA. In contrastto GLA, the LDA is model independent and naturally takes careof non-exponential or stretched exponential kinetics.71
The LDA was performed with the help of OPTIMUS – a newlydeveloped time-resolved data analysis program in our group. Thedetails about the program and the analysis methods used will bepresented in detail elsewhere. Here we give only a short descriptionof the LDA method to facilitate the discussion of the results.
The time-resolved data are quantitatively described by aspectrum of lifetimes, t:
IðtÞ ¼ð10
FðtÞe�t=tdt
where t is the time, I(t) is the normalized decay function andF(t) is the spectral density function. In practice, the model isrepresented as a discrete sum of exponentials. In GLA the sumof less than 10 exponentials is used and thus F(t) becomesa spectrum (DAS) indicating roughly the maximum of eachdistribution, rather than a spectral density. In LDA, the usedlarge set of exponentials is quasi-continuous and hence thespectral density function (F(t)) can be obtained. Nevertheless,it is apparent that an inverse Laplace transform of I(t) needs tobe performed to recover the distribution (F(t)) present in thetransient. However, the inverse transform of the experimentaldataset, which is inevitably incomplete and contains a certainamount of noise, is ill conditioned and will result in a highlyambiguous distribution (F(t)) often with strongly oscillatingvalues not justified by the experimental data. This problem isaddressed by employing different regularization procedures toperform the numerical Laplace inversion. While in the typicalleast squares routines the sum of squared residuals is beingminimized, the regularization introduces a second penalty termwhich improves the conditioning of the problem. Thus a functionof the following form is iteratively minimized instead:
M ¼Xnj¼1
Sj � Sfit;j
� �2þl2P2
where S and Sfit are the experimental data and the fit, P is thepenalty function which takes a specific form depending on thetype of regularization used and l is a Lagrange multiplierdefining the relative importance of the two constraints.
Most commonly, in time-resolved spectroscopy (see ref. 72–77and references therein) variants of the maximum entropy method78
and Tikhonov regularization79 are used. Currently OPTIMUSperforms Tikhonov regularization and allows selection betweenseveral penalty functions. The search of the Lagrange multipliercan be performed either manually or with the help of dedicatedsearch methods – the L-curve criterion,80,81 the minimal productmethod82,83 and generalized cross-validation.75,84,85 The results
PCCP Paper
Ope
n A
cces
s A
rtic
le. P
ublis
hed
on 1
4 M
ay 2
014.
Dow
nloa
ded
on 3
0/01
/201
5 13
:10:
33.
Thi
s ar
ticle
is li
cens
ed u
nder
a C
reat
ive
Com
mon
s A
ttrib
utio
n 3.
0 U
npor
ted
Lic
ence
.View Article Online

13878 | Phys. Chem. Chem. Phys., 2014, 16, 13875--13888 This journal is© the Owner Societies 2014
shown here were obtained using the identity matrix as asmoothing norm and an optimal value for the regularizationparameter, determination based on the L-curve and generalizedcross-validation methods.
The LDA recovers the lifetime distribution at each detectionwavelength and thus the results can be presented in theform of a contour map, which, similarly to ref. 72, we call thelifetime density map (LDM). The reading of the maps isstraightforward following the convention for DAS from GLA oftransient absorption – positive pre-exponential amplitudes(red) describe either decay of absorption or the increase ofbleaching/stimulated emission, while negative pre-exponentialamplitudes (blue) reflect either decay of bleaching/stimulatedemission or the increase of absorption. LDM allows easiercomparison between different samples and different experi-mental conditions.
We should mention here that the de-convolution of theinstrument response function and the fitting of the coherentoscillations at time zero caused by the interaction of thetemporarily overlapping pump and probe beams are performedsimultaneously using the numerical inverse Laplace transform.In OPTIMUS, the deconvolution of the IRF is implementedsimilarly to the procedure described in ref. 70, taking into accountthe wavelength dependent chirp. The coherent contributions attime zero are modelled as a sum of a Gaussian function and itsfirst and second derivatives as in ref. 86.
Streak camera. The time-resolved fluorescence was analysedusing a global Levenberg–Marquardt fitting procedure. By thisnonlinear least-squares method the measured data were approxi-mated with a linear combination of exponential decay functionsconvoluted with a Gaussian, accounting for the instrumentalresponse function. The evaluation yields the time constants withcorresponding decay associated spectra of the involved radiatingprocesses (for a more detailed explanation of the general fittingprocedure see ref. 87). Although the physical effect of a spectralshift might not be precisely represented as an exponential decayfunction, the phenomenon is sufficiently described by the approxi-mation in the fluorescence analysis of this work to determinethe time range and spectral characteristics. Due to the photon-counting method, noise or background signals are discrimi-nated within the data acquisition process and do not have to beconsidered in the data processing.
Quantum-chemical calculations
All quantum-chemical calculations have been performed usingthe Turbomole88 program package and the Q-Chem program.89
In this study, we use time-dependent density-functionaltheory (TDDFT)90,91 and configuration-interaction singlesmethods (CIS)92 (for an overview see e.g. ref. 93 and referencestherein). Both single reference methods are often used to studyexcited states of large molecules due to their relatively lowcomputational cost.
TDDFT suffers from the electron-transfer self-interaction(SI) error, which results in an underestimation of the excitationenergies of charge-transfer (CT) and Rydberg states.94–99 The SIerror is influenced by the amount of Hartree–Fock (HF) exchange
in the used exchange correlation (xc) functional. This waspointed out by Dreuw et al.94 To evaluate the influence of theSI error for the PyA system an exchange correlation (xc) func-tional study applying xc-functionals with different amounts ofHF exchange has been performed (B-LYP: pure DFT functional,0% HF exchange; B3-LYP: hybrid functional, 20% HF exchange;BH-LYP: hybrid functional, 50% HF exchange).
The outcome has been compared with the results of a CIScalculation, which does not suffer from the SI error and there-fore gives the correct ordering of the excited states in theframework of the single-reference methods and does not under-estimate the excitation energy of CT states.
Single-reference methods neglect doubly or higher excitedconfigurations of the wave function, which are needed for acorrect description of electron correlation energy. It is known thatfor conjugated systems like pyrene, the influence of doubly excitedconfigurations is significant. To clarify the influence of the higherexcited configurations, we used a variant of configuration inter-action singles doubles (CISD) named ‘scaled opposite spin CIS(D)0
(SOS-CIS(D)) methods100 as implemented in Q-Chem.
Experimental resultsSteady-state characterization
Absorption and fluorescence spectra (Fig. 2) were taken for thepyrene-modified adenosine (PyA, Fig. 1) in eight different solvents,subdivided into two classes, protic (MeOH, EtOH, iPrOH andtBuOH) and aprotic (DMSO, DMF, acetone and EtOAc) solvents.The solvents of each class were chosen to cover a broadpermittivity range (Table 1).
Absorption. Absorption spectra of PyA show a structuredabsorption band in the range from 325 nm to 420 nm for eachsolvent with two main maxima and several minor absorptionshoulders (Table 1 and Fig. 2). The low energetic absorption
Fig. 2 Normalized absorption (solid lines) and normalized fluorescence(dashed lines) spectra for pyrene modified adenosine (150 mM and 10 mM,respectively) in four protic (upper panel) and four aprotic (lower panel)solvents. For the fluorescence spectra PyA was excited at labs2: MeOH –372 nm, EtOH, iPrOH and tBuOH – 373 nm, DMSO – 376 nm, DMF – 374 nm,Acetone and EtOAc – 372 nm.
Paper PCCP
Ope
n A
cces
s A
rtic
le. P
ublis
hed
on 1
4 M
ay 2
014.
Dow
nloa
ded
on 3
0/01
/201
5 13
:10:
33.
Thi
s ar
ticle
is li
cens
ed u
nder
a C
reat
ive
Com
mon
s A
ttrib
utio
n 3.
0 U
npor
ted
Lic
ence
.View Article Online

This journal is© the Owner Societies 2014 Phys. Chem. Chem. Phys., 2014, 16, 13875--13888 | 13879
maximum (labs1) is located at approx. 396 nm, while theenergetically higher one (labs2) is around 374 nm. Above400 nm, the absorption steeply drops. No dimerization of PyAcould be observed up to a concentration of 2 mM. In proticsolvents, the ratio of the main absorption peaks changesslightly in favour of the second absorption peak. The secondabsorption maximum (labs2) shows no significant change in thespectral position. For aprotic solvents, we observe with increas-ing solvent permittivity from EtOAc to DMSO a bathochromicshift of 5 nm. Additionally, a slight amplitude ratio changeoccurs in favour of the second absorption maximum.
Emission. Emission spectra of PyA were taken for each solventby exciting the absorption band around 374 nm (Table 1, labs2). Nochanges in spectral behavior were observed for other excitationwavelengths between 350 nm and 450 nm. In all solvents, PyAshows intense fluorescence between 390 nm and 600 nm. Thespectral properties strongly depend on the solvent type and thepermittivity (Fig. 2). Increasing permittivity leads to a bathochromicshift of the fluorescence maxima for both solvent classes (Table 1).
In protic solvents, the fluorescence is in general broad andunstructured with weak shoulders, which get more pronounced
with decreasing permittivity. Accordingly, the fluorescencesplits into two clearly distinguishable maxima at 412 nm and426 nm in tBuOH.
In aprotic solvents, a fine structure is visible in the fluores-cence spectra, which undergoes a bathochromic shift byB10 nm with increasing permittivity.
Fluorescence quantum yields are around 0.8 for both solventclasses (Table 1, Ffl). In aprotic solvents, the fluorescence quantumyield shows no clear tendency with respect to the solventpermittivity, whereas protic solvents cause a slight increase ofthe fluorescence quantum yield with increasing permittivity.
Transient absorption of PyA in MeOH
TA measurements were performed to further elucidate thesolvent and permittivity dependence of PyA in all eight solvents.They revealed a complex time-dependent behaviour with the samenumber of components, which differ only in their amplitude andtemporal progression in each solvent. Therefore, we will point outour course of analysis exemplary for the methanol dissolvedsample. The spectral characteristics and lifetimes in the othersolvents are described thereafter and are summarized in Table 2.
In MeOH, the TA spectrum (Fig. 3B) shows three differentmain signals that cannot be separated clearly. The ground-statebleach (GSB, negative amplitude) is visible from 371 nm toB410 nm. The GSB signal partially overlaps with a structuredstimulated emission (SE, negative amplitude), which dominatesthe spectrum between 400 nm and 500 nm. At longer wave-lengths (4500 nm), broad and structured excited-state absorp-tion (ESA, positive amplitude) is present, which extends beyondthe spectral window of the measurements (B690 nm).
ESA characteristics. The steady state fluorescence andabsorption spectra (Fig. 3B, upper panel) indicate no relevantcontributions of SE and GSB are in the ESA spectral regionabove 550 nm. Thus, all spectral characteristics and dynamicsabove 550 nm solely belong to the excited state absorption.The maximum at 663 nm (lESA1) and the two shoulders at623 nm and 639 nm (Fig. 3A, lower panel) can be assigned to
Table 1 PyA steady-state spectral characteristics measured in differentsolvents. er: permittivity of pure solvent without the 1% DMSO fraction.101
labs2 and labs1: main absorption peaks. lfl1 and lfl2: main fluorescencepeaks. * estimated by center of mass at half amplitude. Ffl: fluorescencequantum yield
PyA in er101
Abs./nm Fluor./nm
Ffllabs2 labs1 lfl1 lfl2
Aprotic DMSO 47.2 376 399 410 432 0.79DMF 38.3 374 397 407 428 0.76
Acetone 21.0 371 394 405 424 0.84EtOAc 6.1 371 394 399 422 0.78
Protic MeOH 33.0 371 394 440* 0.79EtOH 25.3 372 395 437* 0.79iPrOH 20.2 372 395 434* 0.76tBuOH 12.5 372 395 431* 0.72
Table 2 Time resolved properties of PyA in different solvents. li (i = ESA1/2 and SE1/2): wavelengths or wavelength ranges of the respective bandsobserved in the TA. lESA2 and lSE2 were selected by the isosbestic points between SE1, SE2, ESA2 and ESA1 within the first 10 ps. lESA2S: spectral position ofthe ESA2 maximum at 1500 ps. ltrfl1: fluorescence intensity maxima at time zero (SC measurements), ltrfl2: after the spectral shift (SC measurements). t1
(IVR), t2 (S1x population) and t3 (solvent dependent stabilization of S1x) estimated through LDM. t4 overall liftetime of PyA fluorescence measured with thestreak camera.* t4 was not exactly determinable by TA measurements, but is larger than 1 ns
PyA in
Time resolved data Lifetimes
Transient absorption (TA) Streak camera (SC)
TA/ps SC/nsExcited state abs./nm Stimulated emission/nm Fluorescence/nm
lESA1 lESA2 lESA2S lSE1 lSE2 ltrfl1 ltrfl2 t1 t2 t3 t4*
Aprotic DMSO 666 575–n.d. 403 450–575 410 432 0.2 3.7 2.1DMF 661 545–n.d. 401 430–545 n.d. n.d. 0.3 3.7 n.d.
Acetone 664 515–660 398 420–515 n.d. n.d. 0.3 3.7 n.d.EtOAc 662 515–670 398 420–515 399 422 0.2 3.7 1.8
Protic MeOH 663 515–630 608 399 435–515 432 440 0.3 2–10 10–20 2.4EtOH 663 515–650 611 399 425–515 n.d. n.d. 0.2 9.6 76 n.d.iPrOH 663 520–655 613 398 420–520 n.d. n.d. 0.2 17 130 n.d.tBuOH 662 520–655 614 398 420–520 427 430 0.2 11 170 1.8
PCCP Paper
Ope
n A
cces
s A
rtic
le. P
ublis
hed
on 1
4 M
ay 2
014.
Dow
nloa
ded
on 3
0/01
/201
5 13
:10:
33.
Thi
s ar
ticle
is li
cens
ed u
nder
a C
reat
ive
Com
mon
s A
ttrib
utio
n 3.
0 U
npor
ted
Lic
ence
.View Article Online

13880 | Phys. Chem. Chem. Phys., 2014, 16, 13875--13888 This journal is© the Owner Societies 2014
one ESA band (ESA1), which arises during the first 500 fs.Subsequently, an unstructured excited state absorption (ESA2)arises within 6 ps with a maximum intensity around 614 nm(lESA2), while the ESA1 band slightly loses amplitude. The ESA2band then shifts spectrally towards 608 nm (lESA2S) (Fig. 3A,upper panel). By plotting the spectral position of the ESA2maximum against the delay time after excitation, two timeconstants (lESA2a = 1.8 � 0.3 ps, lESA2b = 22 � 3 ps) were foundfor the hypsochromic spectral shift (Fig. 4B, red curve). Theshort one (lESA2a) is related to the appearance of the ESA2 andthe long one (lESA2b) describes the spectral shift of the ESA2.Finally, both ESA bands decay with time constants beyond theexperimental accessible time range of 1.5 ns.
GSB and SE characteristics. The GSB minima at 395 nm(labs1) and at 375 nm (labs2) (Fig. 3A, lower panel) correspond tothe positions of the steady state absorption maxima. The signalat 375 nm reflects primarily the GSB dynamics while theminimum at 395 nm is superimposed by SE (Fig. 3A). Thus,the amplitude at 395 nm is at early times higher than anticipatedby the steady-state absorption spectra. Around 400 nm (lSE1) aspectral shift of the SE is observable during the first few 100 fs(Fig. 3A, inset lower panel), resulting in a structured SE band(SE1). Within 6 ps, another stimulated emission band (SE2)arises between 435 nm and 515 nm with a maximal amplitudeat B443 nm, while the SE1 loses amplitude (Fig. 3A, lowerpanel). This second stimulated emission band subsequentlyshifts bathochromically (SE2S) into the ESA region. Due to this,the expected amplitude ratio of the GSB minima, based on thesteady-state absorption spectra, is observed.
ESA in the SE region. Because of the spectral overlap of ESAand SE, strong compensation of the different contributions inthe spectral region around 500 nm occurs.
Since the SE signal is negative in TA, the slightly positivesignal after 50 ps at 411 nm (Fig. 3A) means that we observe a
broad ESA1 band. A broad ESA in this region is typical forpyrene and its derivatives.6,8,16,19,23,56 This ESA, which is super-imposed by the SE, prevents a proper quantification of thespectral shift and the determination of the exact spectralposition of the SE2 band.
Streak camera measurements
Streak camera measurements were performed to obtain thefluorescence dynamics without the disturbing contributions ofESA and GSB (Fig. 3C). DMSO, EtOAc, MeOH and tBuOH werechosen as representative solvents with the largest change inpermittivity for each solvent class.
The time frame of B0.5 ns revealed a transient spectral shiftof B8 nm (B420 cm�1) from 432 nm to 440 nm with a timeconstant of 17 � 1 ps (Fig. 4B, tSE2b, blue curve). The spectralshift occurs with a similar time constant like the slow compo-nent of the ESA2 shift (tESA2b = 22 ps), so these two timeconstants should describe the same process. The lack of thefast time constant obtained for the ESA2 shift (tESA2a = 1.8 ps) canbe explained by the limited time resolution of the streak camera.
Streak camera measurements with a time frame of B5 nsrevealed an overall lifetime (t4) of 2.0� 0.1 ns (Fig. 3C, upper plot).
Summary of the time-resolved behaviour
After photo-excitation, the appearance of structured bandsESA1 and SE1 during the first 500 fs is observed. Within lessthan 6 ps, ESA1 and SE1 slightly lose amplitude. At the sametime, the unstructured ESA2 and SE2 bands gain amplitude.The ESA1 band is correlated with the SE1 band and the ESA2band with the SE2 band, respectively. Both ESA bands and SEbands are energetically close. ESA2 and SE2 spectrally shifttowards each other within 10–20 ps. The spectral shift is alsovisible in the time-resolved fluorescence measurements andcould be analysed in detail only in MeOH, because of the
Fig. 3 Dataset for PyA in MeOH and 1% DMSO excited at 388 nm. (A) Time slices between 0 ps and 6 ps (lower panel) as well as 10 ps and 1500 ps (upperpanel). Inset shows GSB with superimposed SE. (B) Contour plot between �1 ps and 1000 ps, with highlighted positions of time slices (dashed lines). (C)Streak camera measurements with a B5 ns decay window (upper panel) and a B0.5 ns decay window (lower panel).
Paper PCCP
Ope
n A
cces
s A
rtic
le. P
ublis
hed
on 1
4 M
ay 2
014.
Dow
nloa
ded
on 3
0/01
/201
5 13
:10:
33.
Thi
s ar
ticle
is li
cens
ed u
nder
a C
reat
ive
Com
mon
s A
ttrib
utio
n 3.
0 U
npor
ted
Lic
ence
.View Article Online

This journal is© the Owner Societies 2014 Phys. Chem. Chem. Phys., 2014, 16, 13875--13888 | 13881
spectroscopically hardly separable emitting states. All signalsdecay with a lifetime of approximately 2 ns, as determined bythe streak camera measurements.
LDM of PyA in MeOH
In methanol, the LDM for PyA (Fig. 4A) shows a first time constant(t1) around 200 to 300 fs, which is within our time resolution.Minima at 395 nm, 419 nm, 611 nm and 662 nm and a maximumat 445 nm are observable. These extremes represent a change inamplitude due to IVR, observable in the SE1 and ESA1 bands.
Between B2 ps and B30 ps, elongated extremes at 445 nm and611 nm are visible. The maximal intensity of these extremes shiftstowards each other with increasing lifetime. They are composed oftwo separate lifetimes, which are hardly distinguishable in MeOH.This conclusion is supported by the LDM of PyA in other solvents,where the separation is clearly visible (Fig. 5). Furthermore, the fitof the spectral ESA shift (Fig. 4B) also shows two lifetimes. Theshorter of these two lifetimes (t2, B2–10 ps) describes the increaseof the ESA2. The longer one (t3, B10–20 ps) dominates the signalsand describes the spectral shift. The signals around 20 ps at404 nm and 663 nm are a consequence of the spectral shift (Fig. 4).
Lifetimes between 1 ns and 3 ns show a broad distribution at452 nm, 606 nm and 626 nm, which describe the decay of both,SE and ESA bands. The longest lifetimes cannot be completelyrecovered from the LDMs, due to the limited amount of datapoints and limited time range. Therefore, the overall decay life-time t4 was determined by fluorescence measurements (Table 2).
Comparison of the spectral behavior of PyA in different solvents
After the fast spectral shift of the ESA1 band (Fig. 5 and Table 2,t1 = 0.2–0.3 ps), strong solvent class and permittivity
Fig. 4 Analysis of PyA in MeOH and 1% DMSO excited at 388 nm.(A) Lifetime density amplitude map. (B) Spectral shift of the unstructuredESA2 maximum (cubes) and biexponential fit (red line, tESA2a = 1.8 � 0.3 psand tESA2b = 22 � 3 ps), as well as spectral shift of the fluorescencemaximum (circles) measured with the streak camera and monoexponentialfit (blue line, tSE2b = 17 � 1 ps).
Fig. 5 Transient absorption spectra (lexc = 388 nm) and LDM of PyA in protic solvents (MeOH and tBuOH, left side) and in aprotic solvents (DMSO andEtOAc, right side). MeOH and DMSO as the upper limit of the measured permittivity range of each solvent class and tBuOH and EtOAc as the lower limit.
PCCP Paper
Ope
n A
cces
s A
rtic
le. P
ublis
hed
on 1
4 M
ay 2
014.
Dow
nloa
ded
on 3
0/01
/201
5 13
:10:
33.
Thi
s ar
ticle
is li
cens
ed u
nder
a C
reat
ive
Com
mon
s A
ttrib
utio
n 3.
0 U
npor
ted
Lic
ence
.View Article Online
13882 | Phys. Chem. Chem. Phys., 2014, 16, 13875--13888 This journal is© the Owner Societies 2014
dependencies are visible. The spectral position of ESA1 changesslightly to longer wavelengths with increasing permittivity inaprotic solvents (Table 2, lESA1). This is also the case for theground state absorption (Fig. 2 and Table 1, labs1).
In protic solvents, strong mostly unstructured ESA2 and SE2bands appear within 20 ps (Table 2, t2). A higher solventpermittivity leads to slightly larger amplitudes of ESA2 andSE2 bands. Additionally, the following hypsochromic shift ofESA2 and bathochromic shift of SE2 is stronger and becomeslinearly faster with increasing permittivity (Table 2, t3).
In aprotic solvents, a weak unstructured ESA2 (SE2) bandappears with a time constant of B3.7 ps, which is slightly fasterthan in protic solvents (Table 2, t2). In DMSO and DMF, the ESA2band is largely superimposed by the ESA1 band, while spectrallyseparated in EtOAc and acetone. Like in protic solvents, the ESA2(SE2) amplitude increases with increasing permittivity, but is ingeneral low when compared to protic solvents (Fig. 5). A spectralshift of the SE2 band is observable only in DMSO and DMF, butnot visible in their ESA2 bands. This can be explained by thespectrally close and strong ESA1 band, which is superimposed onthe much weaker ESA2 in aprotic solvents. However, a spectralshift of the SE2 is assumed for all solvents due to the spectralshift observed in the steady-state emission spectra.
The overall lifetime was determined via streak camerameasurements for representatives of both solvent classes withthe highest and lowest permittivity. In both solvent classes, t4 isin the range of 2 ns and increases with the solvent permittivity(Table 2, Dtprotic
4 E 0.6 ns, Dtaprotic4 E 0.3 ns).
Results of quantum chemicalcalculations of PyAGround state geometry optimization
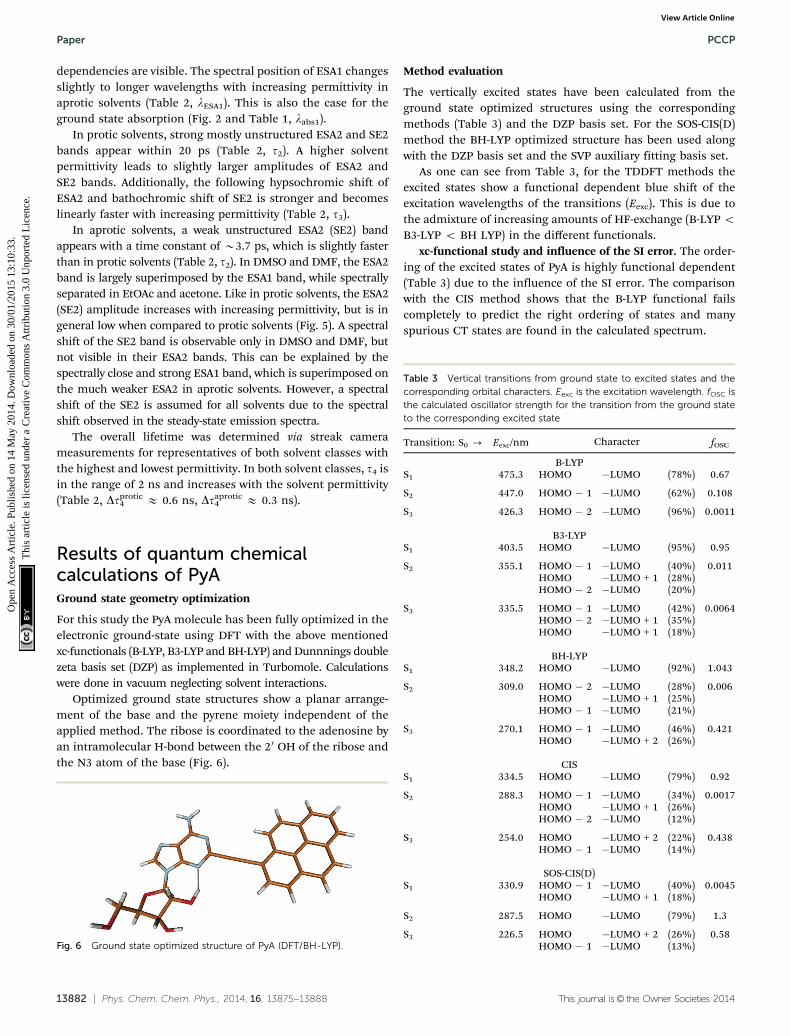
For this study the PyA molecule has been fully optimized in theelectronic ground-state using DFT with the above mentionedxc-functionals (B-LYP, B3-LYP and BH-LYP) and Dunnnings doublezeta basis set (DZP) as implemented in Turbomole. Calculationswere done in vacuum neglecting solvent interactions.
Optimized ground state structures show a planar arrange-ment of the base and the pyrene moiety independent of theapplied method. The ribose is coordinated to the adenosine byan intramolecular H-bond between the 20 OH of the ribose andthe N3 atom of the base (Fig. 6).
Method evaluation
The vertically excited states have been calculated from theground state optimized structures using the correspondingmethods (Table 3) and the DZP basis set. For the SOS-CIS(D)method the BH-LYP optimized structure has been used alongwith the DZP basis set and the SVP auxiliary fitting basis set.
As one can see from Table 3, for the TDDFT methods theexcited states show a functional dependent blue shift of theexcitation wavelengths of the transitions (Eexc). This is due tothe admixture of increasing amounts of HF-exchange (B-LYP oB3-LYP o BH LYP) in the different functionals.
xc-functional study and influence of the SI error. The order-ing of the excited states of PyA is highly functional dependent(Table 3) due to the influence of the SI error. The comparisonwith the CIS method shows that the B-LYP functional failscompletely to predict the right ordering of states and manyspurious CT states are found in the calculated spectrum.
Fig. 6 Ground state optimized structure of PyA (DFT/BH-LYP).
Table 3 Vertical transitions from ground state to excited states and thecorresponding orbital characters. Eexc is the excitation wavelength. fOSC isthe calculated oscillator strength for the transition from the ground stateto the corresponding excited state
Transition: S0 - Eexc/nm Character fOSC
B-LYPS1 475.3 HOMO �LUMO (78%) 0.67
S2 447.0 HOMO � 1 �LUMO (62%) 0.108
S3 426.3 HOMO � 2 �LUMO (96%) 0.0011
B3-LYPS1 403.5 HOMO �LUMO (95%) 0.95
S2 355.1 HOMO � 1 �LUMO (40%) 0.011HOMO �LUMO + 1 (28%)HOMO � 2 �LUMO (20%)
S3 335.5 HOMO � 1 �LUMO (42%) 0.0064HOMO � 2 �LUMO + 1 (35%)HOMO �LUMO + 1 (18%)
BH-LYPS1 348.2 HOMO �LUMO (92%) 1.043
S2 309.0 HOMO � 2 �LUMO (28%) 0.006HOMO �LUMO + 1 (25%)HOMO � 1 �LUMO (21%)
S3 270.1 HOMO � 1 �LUMO (46%) 0.421HOMO �LUMO + 2 (26%)
CISS1 334.5 HOMO �LUMO (79%) 0.92
S2 288.3 HOMO � 1 �LUMO (34%) 0.0017HOMO �LUMO + 1 (26%)HOMO � 2 �LUMO (12%)
S3 254.0 HOMO �LUMO + 2 (22%) 0.438HOMO � 1 �LUMO (14%)
SOS-CIS(D)S1 330.9 HOMO � 1 �LUMO (40%) 0.0045
HOMO �LUMO + 1 (18%)
S2 287.5 HOMO �LUMO (79%) 1.3
S3 226.5 HOMO �LUMO + 2 (26%) 0.58HOMO � 1 �LUMO (13%)
Paper PCCP
Ope
n A
cces
s A
rtic
le. P
ublis
hed
on 1
4 M
ay 2
014.
Dow
nloa
ded
on 3
0/01
/201
5 13
:10:
33.
Thi
s ar
ticle
is li
cens
ed u
nder
a C
reat
ive
Com
mon
s A
ttrib
utio
n 3.
0 U
npor
ted
Lic
ence
.View Article Online

This journal is© the Owner Societies 2014 Phys. Chem. Chem. Phys., 2014, 16, 13875--13888 | 13883
B3-LYP performs better than the B-LYP functional, but stillthe ordering of states differs from the CIS results. For examplethe third excited state (S3) can be identified as an intruder state,which has been calculated at much too low energy compared tothe CIS method. This is a result of its high CT character andthe SI error of TDDFT.
The increased amount of HF exchange in the BH-LYPfunctional corrects for this error and so the state ordering isin agreement with the CIS results.
Influence of double excitations. The picture changes drama-tically looking at the SOS-CIS(D) results (Table 3). The double-excitation method stabilizes the dark PyA S2 state by almost1 eV, but still only one bright and one dark state are observed,while the transition to the bright state remains a HOMO toLUMO transition. The influence is much lower for the bright S1
and S3 states. They get slightly destabilized by 0.06 eV and0.03 eV, respectively. As a result, the ordering of the states isreversed, compared to the results of the single referencemethods discussed above. Hence, the dark state of PyA nowbecomes the lowest excited state. The SOS-CIS(D) methodpredicts the ordering of the first two excited states of PyA tobe the same as for the unsubstituted pyrene. This finding is notin agreement with the experimental excitation spectra of PyA(see ESI†). There are no signs of a low lying dark state in theexcitation spectra (Fig. S2, ESI†) and only a weak Stokes shift isobservable. The SOS-CIS(D) method probably over-stabilizes thedark state, but it shows that the impact of the double excitationmethod is large for this state. Unfortunately, it is not feasible totreat big systems like PyA with quantum mechanical methodsthat explicitly include higher excitations (like e.g. CISDT, whichaccounts for singly, doubly and triply excited configurations) toverify the exact energetics of the optically forbidden state.However, the exact energy of the dark state is not critical forthe further discussion of the excited state dynamics. For thefollowing discussion we refer to the BH-LYP results, which arein good agreement with our experimental data.
Comparison with experimental data
All DFT calculations and the CIS method show an optically allowedS0 - S1 transition with a high oscillator strength of 0.7–1 (Table 3),which corresponds to a HOMO–LUMO transition.
The second excited state (S2) is a dark state. For the BH-LYPmethod, the S0 - S2 transition has a complex character andpossesses three dominant contributions, namely a HOMO � 1to LUMO, a HOMO to LUMO + 1 and a HOMO � 2 to LUMOtransition.
The optically allowed transition to the third excited state (S3)corresponds to a HOMO � 1 to LUMO and a HOMO to LUMO +2 transition.
It should be noted that the energy difference between the twoallowed transitions (S0 - S1 and S0 - S3) calculated with theBH-LYP and CIS methods is in reasonable agreement with theexperimental data. A comparison between the calculated andmeasured absorption spectra can be found in the ESI† (Fig. S4).
Comparison between PyA and pyrene. In the case of pyrene,102
the S0 - S1 transition has practically zero oscillator strength
and corresponds to a mixture of a HOMO � 1 to LUMO and aHOMO to LUMO + 1 transition with equal contributions. TheS0 - S2 has high oscillator strength and is described by aHOMO to LUMO transition.
In contrast to this the PyA S0 - S1 transition has highoscillator strength (Table 3) and corresponds to a HOMO toLUMO transition. Comparing the molecular orbitals (MOs) ofPyA with the ones of pyrene (Table 4) this transition is similarto the bright S0 - S2 transition of pyrene. The contributingmolecular orbitals for the transition to the S1 state in PyA andS2 state in pyrene are only slightly influenced by substitution onthe pyrene 1 position, Table 4.
The second excited state (S2) of PyA is a dark state like the S1
state of pyrene. The S0 - S2 transition has a complex characterlike the S0 - S1 transition of pyrene, but possesses an addi-tional third dominant contribution, namely a HOMO � 2 toLUMO transition. The PyA HOMO � 2 is similar to the pyreneHOMO � 1 orbital, but the PyA HOMO � 1 orbital is not compar-able to any of the pyrene orbitals. The additional transition showsthe strong influence of the substitution on the transition character.Thus in the case of PyA, the original pyrene S1 state gets destabilizedand becomes the PyA S2 state.
Summing up these findings, we can conclude that within theframework of the single reference methods the ordering of the
Table 4 Molecular orbitals of PyA and pyrene (DFT/BH-LYP orbitalsdisplayed, the orbitals are independent of the chosen method). Note:Pyrene HOMO � 1 orbital corresponds to the PyA HOMO � 2 orbital
PyA Pyrene
LUMO + 1
LUMO
HOMO
HOMO � 1
HOMO � 2
PCCP Paper
Ope
n A
cces
s A
rtic
le. P
ublis
hed
on 1
4 M
ay 2
014.
Dow
nloa
ded
on 3
0/01
/201
5 13
:10:
33.
Thi
s ar
ticle
is li
cens
ed u
nder
a C
reat
ive
Com
mon
s A
ttrib
utio
n 3.
0 U
npor
ted
Lic
ence
.View Article Online

13884 | Phys. Chem. Chem. Phys., 2014, 16, 13875--13888 This journal is© the Owner Societies 2014
excited states of PyA is reversed with respect to the excitedstates of pyrene. Accordingly, the fluorescent state of PyA is theS1 state which explains the observed small Stokes shift of thePyA fluorescence, compared to the large Stokes shift for pyrene.
Discussion
The model of the photophysics shown in Fig. 7 summarizes,extends and adjusts the originally proposed one61 with newinsights into the nature of the states and the photo-dynamics.
Ground state properties
In general, the substitution pattern of pyrene strongly influ-ences the spectral position as well as the oscillator strength forS0 - S1 and S0 - S2 transitions in absorption and fluorescencespectra depending on the position11,15,103 and the electro-chemical nature of the substituent.103,104 Especially, the 1-positionof pyrene (Fig. 1) shows strong electronic coupling with itssubstituents.11,15,23 Therefore, the absorption spectrum of PyAstrongly differs from that of pyrene.
Quantum chemical calculations revealed one opticallyallowed and one forbidden transition in the spectral rangebetween 325 nm to 420 nm, but were not able to describe aclear order of the states. In the case of pyrene, fluorescence(according to Kasha’s rule) occurs from the S1 state, which hasvery low oscillator strength. Therefore, pyrene fluorescenceshows a pronounced Stokes shift (B40 nm) and is long-lived(B238 ns in DMSO).3 PyA shows a weak Stokes shift (B10 nm inDMSO, Table 2) of the emission and is short-lived (t4, B2 ns). In
addition with the structural similarity to the pyrene emission,this indicates that we observe a S0 - S1 transition. The highfluorescence quantum yield (B0.8) implies that this transitionhas high oscillator strength. This rules out excitation into higherenergetic states at 388 nm. Therefore, the fine structure of theabsorption band between 325 nm and 420 nm (Fig. 2) is theresult of a superimposed vibrational fine structure like in thecase of unsubstituted pyrene.
A change of the absorption ratio from the first (labs1) towardsthe second (labs2) maximum, which is accompanied by a batho-chromic shift, is observed in aprotic solvents with increasingpermittivity. No spectral shift and a much weaker change of theabsorption ratio is observed in protic solvents, this indicates aintermolecular hydrogen-bond based alteration of the ground-state electron-density distribution, which reduces the influenceof the permittivity on PyA. In aprotic solvents, the changes inthe absorption spectra are a result of the changing solventpermittivity, which is due to the lack of solvent hydrogenbonding. In particular, the hydrogen bond between N3 and the20OH group observed in the quantum chemical calculationsshould influence the photo-dynamics.
Excited state dynamics
In agreement with our previous findings,61 two excited statesand four time constants describe the photo-physics of PyA inMeOH sufficiently. The values of t1, t2 and t4 remain in thesame time range. The time constant t3 (10–20 ps), whichdescribes the spectral shift, differs by one order of magnitude(t3 = 470 ps).60 This difference in the new datasets is a result ofthe higher spectral resolution and the improved analysisapproach. By using lifetime density maps, the shortcoming ofan exponential global fit analysis for spectral shifts, which areinfluenced linearly by time, was overcome.
Development of S1 substates
The S1 state is spectrally represented by the ESA1 and SE1 signals.Between 325 nm to 420 nm higher vibronic S1 states are excited,therefore the first time constant (t1) can be attributed to intra-molecular vibrational energy redistribution (IVR). The IVR is notinfluenced by the varying solvents and lies around 0.2 ps to 0.3 psin all solvents, which is a typical value for pyrene.6,8,12 The spectralpositions of the ESA1 and the ground state absorption bands shiftweakly (B10 nm) to longer wavelengths with increasing solventpermittivity. This indicates that the S0 and the S1 state differ onlyslightly in their dipole moment. This explains why the S1 state andtherefore the ESA1 and the SE1 bands do not show significantsolvent dependencies. The molecule in the S1 state can partiallyadopt another conformation within t2, which belongs to thesame potential energy surface. The conformation of this sub-state is unknown, but energetically close to the initial con-formation. This conformational substate is further on calledthe S1x state. The S1x state manifests itself in the TA by the ESA2and the SE2 bands.
In aprotic solvents, the ESA1 signal is dominant andtherefore the S1 state is mostly populated. Streak camera andsteady-state spectra are dominated by a structured emission in
Fig. 7 Model of relaxation pathways and observed signals in the TA forPyA in aprotic (left side) and protic (right side) solvents.
Paper PCCP
Ope
n A
cces
s A
rtic
le. P
ublis
hed
on 1
4 M
ay 2
014.
Dow
nloa
ded
on 3
0/01
/201
5 13
:10:
33.
Thi
s ar
ticle
is li
cens
ed u
nder
a C
reat
ive
Com
mon
s A
ttrib
utio
n 3.
0 U
npor
ted
Lic
ence
.View Article Online

This journal is© the Owner Societies 2014 Phys. Chem. Chem. Phys., 2014, 16, 13875--13888 | 13885
aprotic solvents, showing that the S1 state is the origin of thestructured emission.
In protic solvents, both bands possess high amplitudes andtherefore a significantly populated S1x state can be assumed.A high S1x state population is accompanied by an unstructuredred-shifted emission (Fig. 2).
Emission wavelengths which represent either mostly the S1
state (410 nm) or the S1x state (450 nm) do not differ in theirexcitation spectra (Fig. S2, ESI†). This finding supports themodel that the relaxed S1 state populates the S1x state (Fig. 7).
S1x state properties
Either the S1 state or the S1x state emission dominate thespectra, while no significant differences in the fluorescencequantum yields are noticeable in the different solvent classes.This implies that S1 and S1x exhibit similar fluorescence quan-tum yields. This rules out a strong intramolecular chargetransfer character of the S1x state, because this would resultin a strong reduction of the fluorescence quantum yield and amuch stronger bathochromic shift of the emission maximumwith increasing solvent permittivity.14,22,105,106 Then again, asmall transfer of electron density, which is not localized on afunctional group, does not strongly alter the fluorescenceproperties.106 The HOMO and LUMO (S0 - S1) show partialelectron density contributions on the nucleobase. A weakdelocalized CT character of the S1x state also explains thespectral shift of the SE2 band (t3). This bathochromic shiftreflects a solvent-permittivity dependent stabilization of the S1x
state due to solvent reorganization. Higher solvent permittivityleads to a stronger spectral shift of the S1x state (Fig. 5).The acceleration of the spectral shift with increasing solventpermittivity (Table 2, t3) is a result of faster solvent reorganiza-tion, due to the stronger electrostatic interactions between PyAand the solvents with a high permittivity.
Thus, a slight electron density transfer, which leads to aslightly more polar S1x state, is sufficient to explain the experi-mental findings. The reaction coordinate, which describes thetransition to the S1x state, could not be determined by quantumchemical calculations due to the size of the system.
Solvent dependence of equilibrium population
As mentioned above, a high solvent permittivity and proticsolvents, which are able to form hydrogen bonds, lead to ahigher S1x population. This is visible in the reduced share ofstructured emission. The exact population ratio between the S1
state and the S1x state is not quantifiable, due to the strongoverlap of the SE with the ESA bands and because of the (mostprobably) different transition dipole-moments of the ESA1 andthe ESA2 transitions. Nevertheless, the solvent class and thesolvent permittivity allow the control of the population ratio.Increased S1x population results from an energetic stabilizationof the S1x state (Fig. 7). The influence of the solvent class on thepopulation ratio is much stronger than the permittivity. Inaprotic solvents, the S1 state is favoured even for solvents withhigh permittivity. In protic solvents, the situation is reversedand the S1x state is more highly populated even in solvents
with a low permittivity (Fig. 5). Therefore, the S1x state has tobe energetically more stable than the S1 state (Fig. 7).Even though the energetic position of the S1x state varies, thespectral position of the SE2 band is only weakly affected. Thismeans that the ground state has to be equally affected in itsenergetic position.
Interestingly, only one decay time for S1 and S1x is observedin the streak camera measurements, which is in the same rangefor both solvent classes and varies only slightly with permittivity(Table 2, t4). In tBuOH for example, S1 and S1x are nearly equallypopulated, but do not show an additional decay lifetime in thestreak camera measurements. This indicates, in combinationwith the energetic proximity of both states, that S1 and S1x
undergo fast population exchange (t2), which leads to an equili-brium at the nanosecond timescale.
Hydrogen bond variation in the excited states
The intramolecular hydrogen bond between N3 and the 2’OHgroup in the ground state (S0) restricts the glycosidic torsionand is also present in the S1 state. The above mentioned solventdependent behaviour leads us to the assumption that by reachingthe S1x state this bond is weakened by forming the conformation,which is connected to the S1x state and influences the electrondensity on the adenine.
In the case of aprotic solvents (the S1x state energeticallyhigher than the S1 state), the intramolecular hydrogen bondhinders the formation and makes this conformation unfavour-able. The corresponding ground state is also destabilized withrespect to the original S0 state.
In protic solvents, the S1x state is now energetically favouredrelative to the S1 state. This means that the surrounding solventmolecules probably form intermolecular hydrogen bonds withthe N3 of adenine instead of the 2’OH group. The result is thatthe conformation of the S1x state is now able to form andtherefore energetically favoured.
Conclusions
Our systematic spectroscopic study provides detailed evidencethat hydrogen bonding as well as the solvent permittivitystrongly influence the photo-dynamics of PyA. Compared to aslightly different derivative of PyA60 and PyA modified RNA,61
the ultrafast dynamics vary in the excited state characteristics,assignments of time constants and provide new insights intothe role of intramolecular hydrogen bonds (Fig. 7).
Higher vibronic states of the S1 are excited between 325 nmto 420 nm and no contributions of other states are detectable.After IVR (t1), the locally excited S1 state populates the con-formational substate S1x within t2. This S1x state does not have astrong charge transfer character, but is slightly more polar thanthe S1 state and hence gets stabilized by solvents with a highpermittivity. The polar character of the S1x state has to be theresult of a restricted delocalized electron density distributionover the nucleobase. Due to that, t3 describes the solventpermittivity dependent stabilization of the S1x state, rather than
PCCP Paper
Ope
n A
cces
s A
rtic
le. P
ublis
hed
on 1
4 M
ay 2
014.
Dow
nloa
ded
on 3
0/01
/201
5 13
:10:
33.
Thi
s ar
ticle
is li
cens
ed u
nder
a C
reat
ive
Com
mon
s A
ttrib
utio
n 3.
0 U
npor
ted
Lic
ence
.View Article Online

13886 | Phys. Chem. Chem. Phys., 2014, 16, 13875--13888 This journal is© the Owner Societies 2014
the (previously assumed) decay of the S1 state.61 Therefore, thedifference in magnitude of t3 to previous data is a result of thebetter resolved datasets and the improved analysis approach.Both emitting states (S1 and S1x) are in equilibrium and decaywith the same time constant (t4).
However, the ground state and population ratio between theS1 state and the S1x state are strongly influenced by hydrogenbonds. A hydrogen bond between the 2’OH of the ribose andthe N3 of the adenine for PyA was revealed by the quantumchemical calculations. This hydrogen bond influences theenergetic position of the S1x state depending on the solventclass. In aprotic solvents, the S1x state is energetically destabi-lized relative to the S1 state. This leads to the population ratioin favour of the S1 state and therefore a structured fluorescenceband. Protic solvents disturb this hydrogen bond by interferingvia intermolecular hydrogen bonds. As a result, the S1x state isenergetically stabilized relative to the S1 state and an unstruc-tured fluorescence band is observed. In both solvent classes, ahigh permittivity further stabilizes the S1x state independent ofthe S0 state due to solvent reorganization, which results in aspectral shift and less structured fluorescence. No additionalproton transfer could be observed.
These findings allow addressing even slight changes in theemission structure to permittivity changes in the surroundingsof PyA upon e.g. ligand binding in RNA or to solvent inacces-sible PyA positions.
Funding
The authors thank the Deutsche Forschungsgemeinschaft forfunding via the Collaborative Research Center 902 ‘MolecularPrinciples of RNA-based Regulation’.
Acknowledgements
The authors thank Prof. Dr Wolfgang Zinth for the possibility tomeasure streak camera spectra. The authors would also like tothank Prof. Irene Burghardt and Prof. Andreas Dreuw for providingcomputational resources and financial support.
References
1 J. R. Lakowicz, Principles of Fluorescence Spectroscopy,Springer, New York, 3rd edn, 2010.
2 M. F. M. Post, J. Langelaar and J. D. W. van Voorst, Chem.Phys. Lett., 1971, 10, 468–472.
3 A. Nakajima, Bull. Chem. Soc. Jpn., 1973, 46, 2602–2604.4 T. Kubota, K. Kano, B. Uno and T. Konse, Bull. Chem. Soc.
Jpn., 1987, 60, 3865–3877.5 P. Foggi, L. Pettini, I. Santa, R. Righini and S. Califano,
J. Phys. Chem., 1995, 99, 7439–7445.6 F. V. R. Neuwahl and P. Foggi, Laser Chem., 1999, 19,
375–379.7 D. S. Karpovich and G. J. Blanchard, J. Phys. Chem., 1995,
99, 3951–3958.
8 M. Raytchev, E. Pandurski, I. Buchvarov, C. Modrakowskiand T. Fiebig, J. Phys. Chem. A, 2003, 107, 4592–4600.
9 T. Forster, Angew. Chem., 1969, 81, 364–374.10 N. J. Turro, Modern Molecular Photochemistry, University
Science Books, Sausalito, California, 1991.11 A. G. Crawford, A. D. Dwyer, Z. Liu, A. Steffen, A. Beeby,
L. O. Pålsson, D. J. Tozer and T. B. Marder, J. Am. Chem.Soc., 2011, 133, 13349–13362.
12 T. Fiebig, K. Stock, S. Lochbrunner and E. Riedle, Chem.Phys. Lett., 2001, 345, 81–88.
13 E. Pandurski and T. Fiebig, Chem. Phys. Lett., 2002, 357,272–278.
14 J. Sung, P. Kim, Y. O. Lee, J. S. Kim and D. Kim, J. Phys.Chem. Lett., 2011, 2, 818–823.
15 C. Wanninger-Weiss and H.-A. Wagenknecht, Eur. J. Org.Chem., 2008, 64–69.
16 C. E. Crespo-Hernandez, G. Burdzinski and R. Arce, J. Phys.Chem. A, 2008, 112, 6313–6319.
17 Y. Niko, Y. Hiroshige, S. Kawauchi and G. Konishi, Tetra-hedron, 2012, 68, 6177–6185.
18 N. Amann, E. Pandurski, T. Fiebig and H.-A. Wagenknecht,Angew. Chem., Int. Ed., 2002, 41, 2978–2980.
19 N. Amann, E. Pandurski, T. Fiebig and H.-A. Wagenknecht,Chem. – Eur. J., 2002, 8, 4877–4883.
20 A. Trifonov, I. Buchvarov, H.-A. Wagenknecht and T. Fiebig,Chem. Phys. Lett., 2005, 409, 277–280.
21 A. Trifonov, M. Raytchev, I. Buchvarov, M. Rist, J. Barbaric,H.-A. Wagenknecht and T. Fiebig, J. Phys. Chem. B, 2005,109, 19490–19495.
22 C. Wagner and H.-A. Wagenknecht, Chem. – Eur. J., 2005,11, 1871–1876.
23 P. Kaden, E. Mayer-Enthart, A. Trifonov, T. Fiebig andH.-A. Wagenknecht, Angew. Chem., Int. Ed., 2005, 44,1637–1639.
24 C. Wanninger-Weiß, L. Valis and H.-A. Wagenknecht,Bioorg. Med. Chem., 2008, 16, 100–106.
25 A. Okamoto, K. Kanatani and I. Saito, J. Am. Chem. Soc.,2004, 126, 4820–4827.
26 K. Kawai, H. Yoshida, T. Takada, S. Tojo and T. Majima,J. Phys. Chem. B, 2004, 108, 13547–13550.
27 Y. J. Seo, J. H. Ryu and B. H. Kim, Org. Lett., 2005, 7,4931–4933.
28 Y. J. Seo, I. J. Lee, J. W. Yi and B. H. Kim, Chem. Commun.,2007, 2817–2819.
29 M. Nakamura, Y. Fukunaga, K. Sasa, Y. Ohtoshi,K. Kanaori, H. Hayashi, H. Nakano and K. Yamana, NucleicAcids Res., 2005, 33, 5887–5895.
30 H. Kashida, T. Takatsu, K. Sekiguchi and H. Asanuma,Chem. – Eur. J., 2010, 16, 2479–2486.
31 T. Kato, H. Kashida, H. Kishida, H. Yada, H. Okamoto andH. Asanuma, J. Am. Chem. Soc., 2013, 135, 741–750.
32 I. K. Astakhova, T. Santhosh Kumar, M. A. Campbell,A. V. Ustinov, V. A. Korshun and J. Wengel, Chem. Commun.,2013, 49, 511–513.
33 N. Venkatesan, Y. Jun Seo and B. Hyean Kim, Chem. Soc.Rev., 2008, 37, 648–663.
Paper PCCP
Ope
n A
cces
s A
rtic
le. P
ublis
hed
on 1
4 M
ay 2
014.
Dow
nloa
ded
on 3
0/01
/201
5 13
:10:
33.
Thi
s ar
ticle
is li
cens
ed u
nder
a C
reat
ive
Com
mon
s A
ttrib
utio
n 3.
0 U
npor
ted
Lic
ence
.View Article Online

This journal is© the Owner Societies 2014 Phys. Chem. Chem. Phys., 2014, 16, 13875--13888 | 13887
34 K. Huang and A. Martı, Anal. Bioanal. Chem., 2012, 402,3091–3102.
35 R. Zhang, L. Yang, M. Zhao, J. Dong, H. Dong, Y. Wen,X. Zhan, H. Yang and G. Wang, Polymer, 2013, 54,1289–1294.
36 E. Mayer, L. Valis, C. Wagner, M. Rist, N. Amann andH.-A. Wagenknecht, ChemBioChem, 2004, 5, 865–868.
37 G. T. Hwang, Y. J. Seo, S. J. Kim and B. H. Kim, TetrahedronLett., 2004, 45, 3543–3546.
38 G. T. Hwang, Y. J. Seo and B. H. Kim, Tetrahedron Lett.,2005, 46, 1475–1477.
39 L. Valis, E. Mayer-Enthart and H.-A. Wagenknecht, Bioorg.Med. Chem., 2006, 16, 3184–3187.
40 I. V. Astakhova, A. V. Ustinov, V. A. Korshun and J. Wengel,Bioconjugate Chem., 2011, 22, 533–539.
41 J. Huang, Y. Wu, Y. Chen, Z. Zhu, X. Yang, C. J. Yang,K. Wang and W. Tan, Angew. Chem., Int. Ed., 2011, 50,401–404.
42 S. P. Sau and P. J. Hrdlicka, J. Org. Chem., 2012, 77, 5–16.43 S. Srivatsan and A. Sawant, Pure Appl. Chem., 2010, 83,
213–232.44 I. Tinoco Jr and C. Bustamante, J. Mol. Biol., 1999, 293,
271–281.45 J. A. Cruz and E. Westhof, Cell, 2009, 136, 604–609.46 K. S. Karunatilaka and D. Rueda, Chem. Phys. Lett., 2009,
476, 1–10.47 A. D. Garst, A. L. Edwards and R. T. Batey, Cold Spring
Harbor Perspect. Biol., 2010, 1–13.48 A. Mahara, R. Iwase, T. Sakamoto, K. Yamana, T. Yamaoka
and A. Murakami, Angew. Chem., Int. Ed., 2002, 41,3648–3650.
49 A. Mahara, R. Iwase, T. Sakamoto, T. Yamaoka, K. Yamanaand A. Murakami, Bioorg. Med. Chem., 2003, 11, 2783–2790.
50 O. A. Krasheninina, D. S. Novopashina and A. G. Venyaminova,Russ. J. Bioorg. Chem., 2011, 37, 244–248.
51 R. Waki, A. Yamayoshi, A. Kobori and A. Murakami, Chem.Commun., 2011, 47, 4204–4206.
52 K. K. Karlsen, A. Pasternak, T. B. Jensen and J. Wengel,ChemBioChem, 2012, 13, 590–601.
53 T. Ueda, A. Kobori, A. Yamayoshi, H. Yoshida, M. Yamaguchiand A. Murakami, Bioorg. Med. Chem., 2012, 20, 6034–6039.
54 G. Wang, G. V. Bobkov, S. N. Mikhailov, G. Schepers,A. Van Aerschot, J. Rozenski, M. Van der Auweraer,P. Herdewijn and S. De Feyter, ChemBioChem, 2009, 10,1175–1185.
55 S. K. Silverman and T. R. Cech, Biochemistry, 1999, 38,14224–14237.
56 T. L. Netzel, K. Nafisi, J. Headrick and B. E. Eaton, J. Phys.Chem., 1995, 99, 17948–17955.
57 T. L. Netzel, M. Zhao, K. Nafisi, J. Headrick, M. S. Sigmanand B. E. Eaton, J. Am. Chem. Soc., 1995, 117, 9119–9128.
58 A. Malakhov, E. Malakhova, S. Kuznitsova, I. Grechishnikova,I. Prokhorenko, M. Skorobogatyi, V. Korshun and Y. Berlin,Russ. J. Bioorg. Chem., 2000, 26, 34–44.
59 C. Grunewald, T. Kwon, N. Piton, U. Forster, J. Wachtveitland J. W. Engels, Bioorg. Med. Chem., 2008, 16, 19–26.
60 U. Forster, N. Gildenhoff, C. Grunewald, J. W. Engels andJ. Wachtveitl, J. Lumin., 2009, 129, 1454–1458.
61 U. Forster, C. Grunewald, J. W. Engels and J. Wachtveitl,J. Phys. Chem. B, 2010, 114, 11638–11645.
62 U. Forster, K. Lommel, D. Sauter, C. Grunewald,J. W. Engels and J. Wachtveitl, ChemBioChem, 2010, 11,664–672.
63 S. Techert, S. Schmatz, A. Wiessner and H. Staerk, J. Phys.Chem. A, 2000, 104, 5700–5710.
64 R. Huber, T. Fiebig and H.-A. Wagenknecht, Chem. Com-mun., 2003, 1878–1879.
65 K. Suzuki, A. Kobayashi, S. Kaneko, K. Takehira,T. Yoshihara, H. Ishida, Y. Shiina, S. Oishi and S. Tobita,Phys. Chem. Chem. Phys., 2009, 11, 9850–9860.
66 A. M. Brouwer, Pure Appl. Chem., 2011, 83, 2213–2228.67 L. Dworak, V. V. Matylitsky and J. Wachtveitl, Chem-
PhysChem, 2009, 10, 384–391.68 F. J. Lederer, F. F. Graupner, B. Maerz, M. Braun and
W. Zinth, Chem. Phys., 2014, 428, 82–89.69 G. Ryseck, T. Schmierer, K. Haiser, W. Schreier, W. Zinth
and P. Gilch, ChemPhysChem, 2011, 12, 1880–1888.70 I. H. M. van Stokkum, D. S. Larsen and R. van Grondelle,
Biochim. Biophys. Acta, Bioenerg., 2004, 1657, 82–104.71 A. A. Istratov and O. F. Vyvenko, Rev. Sci. Instrum., 1999, 70,
1233–1257.72 R. Croce, M. G. Muller, R. Bassi and A. R. Holzwarth,
Biophys. J., 2001, 80, 901–915.73 Z. Ablonczy, A. Lukacs and E. Papp, Biophys. Chem., 2003,
104, 249–258.74 V. A. Lorenz-Fonfrıa and H. Kandori, Appl. Spectrosc., 2007,
61, 74–84.75 V. K. Mulligan, K. C. Hadley and A. Chakrabartty, Anal.
Biochem., 2012, 421, 181–190.76 V. A. Voelz and V. S. Pande, Proteins: Struct., Funct., Bioinf.,
2012, 80, 342–351.77 R.-J. Kutta, T. Langenbacher, U. Kensy and B. Dick, Appl.
Phys. B: Lasers Opt., 2013, 111, 203–216.78 E. T. Jaynes, Phys. Rev., 1957, 106, 620–630.79 A. N. Tikhonov, Dokl. Akad. Nauk SSSR, 1963, 151, 501–504.80 K. Miller, SIAM J. Math. Anal., 1970, 1, 52–74.81 P. Hansen, BIT Numer. Math., 1990, 30, 658–672.82 J. Lian, D. Yao and B. He, in Engineering in Medicine and
Biology Society, 1998. Proceedings of the 20th Annual Inter-national Conference of the IEEE, 1998, vol. 4, pp. 2155–2158.
83 J. Lian and B. He, Brain Topogr., 2001, 13, 209–217.84 G. H. Golub, M. Heath and G. Wahba, Technometrics, 1979,
21, 215–223.85 V. A. Lorenz-Fonfrıa and H. Kandori, Appl. Spectrosc., 2007,
61, 428–443.86 A. L. Dobryakov, S. A. Kovalenko, A. Weigel, J. L. Perez-
Lustres, J. Lange, A. Muller and N. P. Ernsting, Rev. Sci.Instrum., 2010, 81, 113106.
87 H. Satzger and W. Zinth, Chem. Phys., 2003, 295, 287–295.88 R. Ahlrichs, TurboMole V 5.10, 2007.89 J. Kong, C. White, A. Krylov, D. Sherrill, R. Adamson, T. Furlani,
M. Lee, A. Lee, S. Gwaltney, T. Adams, C. Ochsenfeld,
PCCP Paper
Ope
n A
cces
s A
rtic
le. P
ublis
hed
on 1
4 M
ay 2
014.
Dow
nloa
ded
on 3
0/01
/201
5 13
:10:
33.
Thi
s ar
ticle
is li
cens
ed u
nder
a C
reat
ive
Com
mon
s A
ttrib
utio
n 3.
0 U
npor
ted
Lic
ence
.View Article Online

13888 | Phys. Chem. Chem. Phys., 2014, 16, 13875--13888 This journal is© the Owner Societies 2014
A. Gilbert, G. Kedziora, V. Rassolov, D. Maurice, N. Nair,Y. Shao, N. Besley, P. Maslen, J. Dombroski, H. Daschel,W. Zhang, P. Korambath, J. Baker, E. Byrd, T. Van Voorhis,M. Oumi, S. Hirata, C. Hsu, N. Ishikawa, J. Florian, A. Warshel,B. Johnson, P. Gill, M. Head-Gordon and J. Pople, J. Comput.Chem., 2000, 21, 1532–1548.
90 E. Runge and E. K. U. Gross, Phys. Rev. Lett., 1984, 52,997–1000.
91 M. E. Casida, Recent Advances in Density Functional Methods,Part I, World Scientific, Singapore, 1995.
92 J. E. D. Bene, R. Ditchfield and J. A. Pople, J. Chem. Phys.,1971, 55, 2236–2241.
93 A. Dreuw and M. Head-Gordon, Chem. Rev., 2005, 105,4009–4037.
94 A. Dreuw, J. L. Weisman and M. Head-Gordon, J. Chem.Phys., 2003, 119, 2943–2946.
95 A. Dreuw and M. Head-Gordon, J. Am. Chem. Soc., 2004,126, 4007–4016.
96 J. Plotner and A. Dreuw, Chem. Phys., 2008, 347, 472–482.
97 D. J. Tozer, J. Chem. Phys., 2003, 119, 12697–12699.98 N. T. Maitra, J. Chem. Phys., 2005, 122, 234104.99 J. Neugebauer, O. Gritsenko and E. J. Baerends, J. Chem.
Phys., 2006, 124, 214102.100 D. Casanova, Y. M. Rhee and M. Head-Gordon, J. Chem.
Phys., 2008, 128, 164106.101 D. R. Lide, Handbook of Chemistry and Physics, CRC Press,
Boca Ranton, New York, London, Tokyo, 81st edn, 2000.102 I. S. K. Kerkines, I. D. Petsalakis, G. Theodorakopoulos and
W. Klopper, J. Chem. Phys., 2009, 131, 224315.103 H. Maeda, T. Maeda, K. Mizuno, K. Fujimoto, H. Shimizu
and M. Inouye, Chem. – Eur. J., 2006, 12, 824–831.104 C. Yao, H.-B. Kraatz and R. P. Steer, Photochem. Photobiol.
Sci., 2005, 4, 191–199.105 Z. R. Grabowski, K. Rotkiewicz and W. Rettig, Chem. Rev.,
2003, 103, 3899–4032.106 A. Morimoito, T. Yatsuhashi, T. Shimada, L. Biczok,
D. A. Tryk and H. Inoue, J. Phys. Chem. A, 2001, 105,10488–10496.
Paper PCCP
Ope
n A
cces
s A
rtic
le. P
ublis
hed
on 1
4 M
ay 2
014.
Dow
nloa
ded
on 3
0/01
/201
5 13
:10:
33.
Thi
s ar
ticle
is li
cens
ed u
nder
a C
reat
ive
Com
mon
s A
ttrib
utio
n 3.
0 U
npor
ted
Lic
ence
.View Article Online