photodegradation of phenolic compounds from water in the
TRANSCRIPT

applied sciences
Article
Photodegradation of Phenolic Compounds fromWater in the Presence of a Pd-ContainingExhausted Adsorbent
Lavinia Lupa 1 , Laura Cocheci 1,* , Bogdan Trica 2, Adina Coroaba 3 and Adriana Popa 4
1 Faculty of Industrial Chemistry and Environmental Engineering, Politehnica University Timisoara,6 V. Parvan Blv, RO-300223 Timisoara, Romania; [email protected]
2 National Institute for Research & Development in Chemistry and Petrochemistry—ICECHIM,202 Spl. Independentei, RO-060021 Bucuresti, Romania; [email protected]
3 Centre of Advanced Research in Bionanoconjugates and Biopolymers, “Petru Poni” Institute ofMacromolecular Chemistry Iasi, Grigore Ghica Voda Alley, No.41 A, 700487 Iasi, Romania;[email protected]
4 Institute of Chemistry Timisoara of Romanian Academy, 24 Mihai Viteazul Blv., RO-300223 Timisoara,Romania; [email protected]
* Correspondence: [email protected]
Received: 18 October 2020; Accepted: 22 November 2020; Published: 26 November 2020 �����������������
Abstract: A closed-cycle technology regarding the use of an exhausted Pd-based adsorbent as aphotocatalyst in the degradation process of phenol is presented. Pd (II) represents a precious metalof great economic importance. Its obtained from natural sources become more difficult to achieve.Therefore, also considering the regulations of the “circular economy,” its recovery from secondarysources turn out to be a stringent issue in the last years. Pd(II) ions are removed from aqueous solutionthrough adsorption onto Florisil (an inorganic solid support—magnesium silicate) impregnated withCyphos IL 101 (trihexyl tetradecyl phosphonium chloride). It was observed that the presence of theionic liquid (IL) in the adsorbent structure doubles the adsorption efficiency of the studied materials.The newly obtained Pd-based photocatalyst was exhaustively characterized and was used in thedegradation process of phenol from aqueous solutions. The phenol degradation process was studiedin terms of the nature of the photocatalyst used, time of photodegradation and solid: liquid ratio.It was observed that both the presence of IL and Pd lead to an increase in the efficiency of the phenoldegradation process. The new Pd-based photocatalyst could be efficiently used in more cycles ofphenol photodegradation processes. When is used as a photocatalyst the Florisil impregnated withIL and loaded with 2 mg/g of Pd, a degree of mineralization of 93.75% is obtained after 180 min ofirradiation of a phenol solution having a concentration of 20 mg/L and using a solid:liquid ratio = 1:1.
Keywords: palladium; adsorption; ionic liquid; phenol; photodegradation
1. Introduction
Palladium (Pd) is one of the precious metals of great economic importance. Its specific physicaland chemical properties make it useful in many fields such as electrical and electronic industries,corrosion-resistant materials, jewelry or as catalysts in various chemical processes [1,2]. Due to itsimportance and the rare ore deposits which make a high price for this metal, it is essential to developefficient recovery methods for this element, especially from water containing trace amounts of Pd. There arenumerous methods for palladium recovery from different waste, such as solvent extraction [3–5],ion exchange [6–8], electrometallurgy [9] and adsorption [10–12]. From all the mentioned methods,adsorption proved to be the most efficient for the recovery of precious metals from aqueous solutions
Appl. Sci. 2020, 10, 8440; doi:10.3390/app10238440 www.mdpi.com/journal/applsci

Appl. Sci. 2020, 10, 8440 2 of 15
due to easy operation, the existence of versatile adsorbents (such as activated carbon, chitosan, calciumalginate, graphene oxide, titanate nanotubes, etc.) and high efficiency even in case of solutionscontaining trace amounts of metal ions [11–17]. Since the ionic liquids (IL) were successfully used inthe liquid–liquid extraction of precious metals [18,19], in the last years, new attention has been givento the use of ionic liquids for obtaining different adsorbents for palladium removal from aqueoussolutions [20–22]. The immobilization of the ionic liquids in suitable solid support prevents thedrawbacks of the liquid–liquid extraction, such as the loss of the ionic liquid in water and a possibleoccurrence of an ion-exchange between the metal ion and the cation of the ionic liquid. Throughimpregnation of the ionic liquid onto a suitable solid support, higher efficiency in the removal processof metal ions from aqueous solutions is achieved because it favorably combines the properties of ILswith the advantages of the solid supports [23,24]. In a previous study, the adsorption performance ofthe Florisil impregnated with Cyphos IL 101 (trihexyl tetradecyl phosphonium chloride) in the removalprocess of Pd(II) ions from residual solutions was studied [25]. It was observed that the impregnatedFlorisil with Cyphos IL-101 develops a maximum adsorption capacity in the removal process of Pd(II)ions from an aqueous solution of 126 mg/g, which is two times higher than the adsorption capacitydeveloped by the raw Florisil [25]. The Circular Economy Action Plan of EU intends to close the loop ofproduct lifecycles through sustainable consumption and production by improving waste managementwith greater recycling and reuse in order to create benefits for the environment, the economy and thesociety [26]. In all the adsorption studies, the major problem is, “What happened with the exhaustedadsorbent?”. Very few papers answer this question. In order to respond to the European Union targetsand to create benefits for the environment, economy and society and to respond to this frequentlyasked question in adsorption processes treatment, the aim of this paper is to study the possible use as aphotocatalyst of an exhausted adsorbent from the removal process of Pd(II) ions from aqueous solutions.Many Pd-based composites are synthesized and studied as photocatalysts in various degradationprocesses [27–30]. However, in all cases, the obtaining method is very complicated, involving severalsteps of synthesis and using expensive resources. By using a waste resulted from another process as aphotocatalyst, the Pd ions from secondary sources were capitalized. Consequently, the use of Pd ions fromprime materials is avoided, which led to a minimization of the cost of treatment. The method proposedin this paper represents a closed cycle technology, and it is advantageous from both economic andenvironmental protection perspectives. The Pd-based photocatalysts obtained through Pd adsorptiononto Cyphos IL 101 impregnated Florisil have been used in the degradation process of phenol fromaqueous solutions. The phenolic compounds deserve the entire attention because it is found in manyindustrial wastewaters and even in some water resources due to the fact that it is used in severalindustrial branches. At concentrations higher than 0.001 mg/L, it is very toxic and carcinogenic [28–31].The technologies utilized for removing phenols from industrial wastewater could be classified asdestructive or non-destructive. The non-destructive technologies (distillation, adsorption, extraction,membrane separation) are feasible when the main concern is the recovery of the phenolic compounds.Otherwise, the destructive technologies (chemical or electrochemical oxidation, advanced oxidationprocesses, biological treatment) are more feasible due to the fact that not implies the transport ofpollutants from one phase to another. Each of these technologies has advantages and drawbacks,and the feasibility of utilization one or another removal process of phenolic compounds must takeinto account the initial concentration, the pH and salinity of wastewater and the costs of treatment.Advanced oxidation processes (ozonation, wet air oxidation, Fenton oxidation, photo-assisted catalyticoxidation) are feasible in the tertiary process of water treatment in order to remove recalcitrant organicpollutants from water and to reach the physicochemical characteristics required by the regulations.

Appl. Sci. 2020, 10, 8440 3 of 15
2. Materials and Methods
2.1. Obtaining and Characterization of the Pd-Based Photocatalyst
The Pd-based photocatalyst was obtained through Pd(II) adsorption from residual solution ontothe Florisil impregnated with Cyphos IL-101. The Florisil and the Cyphos IL-101 were purchasedfrom Sigma–Aldrich, Darmstadt, Germany. The adsorption of Pd (II) ions was studied in a previouswork, and the dependence of the maximum adsorption capacity of the impregnated Florisil function ofsolid:liquid (S:L) ratio, pH, contact time and initial concentration of the Pd(II), was established [25].It was put in evidence that the ionic liquid (Cyphos IL 101) enhance the adsorption capacity of Florisilin the removal process of Pd(II) ions from aqueous solutions. The adsorbent was obtained throughimpregnation of Florisil with trihexyl tetradecyl phosphonium chloride using the ultrasonicationmethod of impregnation. Then, 0.1 g of IL was impregnated onto 1 g of Florisil. The sample wasentitled F-IL). The maximum adsorption capacity developed by F-IL, of 133.3 mg/g, was obtained in thefollowing conditions: solid:liquid ratio (S:L) of 2 g/L, pH = 3 and stirring time of 60 min [25]. Therefore,in the present paper, the same conditions were used to obtain the Pd-based photocatalyst. Were preparedhigher quantities of photocatalyst containing different amount of Pd ions (1 mg Pd/g of F-IL—thesample being entitled F-IL-Pd1 and 2 mg Pd/g of F-IL—the sample being entitled F-IL-Pd2, respective).
The used photocatalyst was analyzed by Fourier-transform infrared spectroscopy (FTIR), scanningelectron microscopy (SEM) and transmission electron microscopy (TEM), which was coupled withenergy-dispersive X-ray analysis (EDX) and by XPS analysis.
The FTIR spectra (KBr pellets) of the samples were recorded on a Shimadzu IR Prestige-21 FTIRspectrophotometer (Shimadzu, Kyoto, Japan) in the range 400–4000 cm−1. SEM micrographs wererecorded using a Quanta FEG 250 microscope (Thermo Fisher Scientific, Waltham, MA, USA).
TEM micrographs were obtained using an FEI Tecnai F20 G2 TWIN Cryo-TEM (Thermo FisherScientific, Waltham, MA, USA). Initially, the samples were ground to reduce the size of the particlesso as to make them compatible with TEM analysis. The powdered samples were placed over laceycarbon copper grids. After removing the excess powder, the samples were analyzed. The scanningtransmission electron microscopy (STEM) feature of the microscope, together with the EDX detector(X-MaxN 80T model from Oxford Instruments, Abingdon, UK), allowed identifying elements presentin the sample.
X-ray photoelectron spectroscopy (XPS) was performed on a KRATOS Axis Nova (Kratos Analytical,Manchester, UK), using AlKα radiation, with 20 mA current and 15 kV voltage (300 W). The XPSsurvey spectra for the Pd-based photocatalyst sample were collected in the range of −10–1200 eV with aresolution of 1 eV and a pass energy of 160 eV. The high-resolution spectra for all the elements identifiedfrom the survey spectra were collected using a pass energy of 20 eV and a step size of 0.1 eV. Data wereanalyzed using the Vision Processing software (Vision2 software, Version 2.2.10). The binding energy ofthe C1s peak was normalized to 285 eV.
2.2. Application of the Pd-Based Photocatalyst in the Degradation Process of Phenol
The obtained Pd-based photocatalyst was used in the degradation process of phenol from aqueoussolutions, using a photoreactor PhotoLAB B400-700 Basic Batch-L (provided by Peschl-Ultraviolet,Mainz, Germany). The photocatalytic effect of the obtained Pd-based photocatalyst containingdifferent amount of Pd loaded (F-IL-Pd1—impregnated Florisil with IL and 1 mg Pd/g andF-IL-Pd2—impregnated Florisil with IL and 2 mg Pd/g) was compared with the effect of raw Florisil (F)and impregnated Florisil with Cyphos IL-101 (F-IL). A well-defined quantity of the photocatalysts (0.7 g)was treated with 700 mL of phenol solution containing 20 mg/L phenol. Initially, the phenol solutionwas stirred for 30 min with the photocatalyst in the dark in order to achieve the adsorption–desorptionequilibrium between the phenol and the surface of the photocatalyst. After this time, the samplewas irradiated for 3 h with a UV-vis lamp type TQ 150. The samples were collected at differenttime intervals (5, 15, 30, 45, 60, 120 and 180 min), and the photodegradation profiles of phenol were

Appl. Sci. 2020, 10, 8440 4 of 15
monitoring by realizing the UV-vis absorption spectra using a Varian Cary 100 spectrophotometer(Agilent Technologies, Santa Clara, CA, USA). The degradation degree of phenol was determined fromthe absorbance recorded at λ = 270 nm, which is one of the two maximum local excitation bands ofhydroxyl-monosubstituted phenyl:
Degradation degree (%) =A270
i − A270t
A270i
100
where A270i is the initial absorbance of the phenol solution, recorded at 270 nm and A270
t is the absorbanceof the solution after time t, recorded at 270 nm.
To determine both the degree of phenol degradation and the degree of mineralization, total organiccarbon (TOC) was measured by using a TOC analyzer (provided by Shimadzu, Kyoto, Japan).
Experiments were triplicate, and the results are presented as a mean.The phenol degradation efficiency was determined as a function of the nature of the used
photocatalyst and the S:L (solid:liquid) ratio.
3. Results and Discussion
3.1. Characterization of the Pd-Based Photocatalyst
The FTIR, SEM, TEM and XPS analysis were used to prove the fact that the studied solid support,Florisil, was impregnated with the studied IL, Cyphos IL-101. This structural characterization wasuseful to understand what happened with the solid support during functionalization and which is thereason for its efficiency increasing, and how IL and Pd ions are bounded onto the Florisil surface inorder to be sure of the photocatalyst stability.
The FTIR spectra of the studied photocatalysts are presented in Figure 1. From the FTIR spectrum,the impregnation is confirmed by the appearance in the spectrum of the solid support of the vibrationalbands characteristic for the ionic liquid, namely: the intense bands between 2950 and 2800 cm−1 occurdue to –CH3 (methyl) and –CH2– (methylene) vibrations.
Appl. Sci. 2020, 10, x FOR PEER REVIEW 4 of 15
using a Varian Cary 100 spectrophotometer (Agilent Technologies, Santa Clara, CA, USA). The degradation degree of phenol was determined from the absorbance recorded at λ = 270 nm, which is one of the two maximum local excitation bands of hydroxyl-monosubstituted phenyl:
Degradation degree (%) = 100
where 𝐴 is the initial absorbance of the phenol solution, recorded at 270 nm and 𝐴 is the absorbance of the solution after time t, recorded at 270 nm.
To determine both the degree of phenol degradation and the degree of mineralization, total organic carbon (TOC) was measured by using a TOC analyzer (provided by Shimadzu, Kyoto, Japan).
Experiments were triplicate, and the results are presented as a mean. The phenol degradation efficiency was determined as a function of the nature of the used
photocatalyst and the S:L (solid:liquid) ratio.
3. Results and Discussion
3.1. Characterization of the Pd-Based Photocatalyst
The FTIR, SEM, TEM and XPS analysis were used to prove the fact that the studied solid support, Florisil, was impregnated with the studied IL, Cyphos IL-101. This structural characterization was useful to understand what happened with the solid support during functionalization and which is the reason for its efficiency increasing, and how IL and Pd ions are bounded onto the Florisil surface in order to be sure of the photocatalyst stability.
The FTIR spectra of the studied photocatalysts are presented in Figure 1. From the FTIR spectrum, the impregnation is confirmed by the appearance in the spectrum of the solid support of the vibrational bands characteristic for the ionic liquid, namely: the intense bands between 2950 and 2800 cm−1 occur due to –CH3 (methyl) and –CH2– (methylene) vibrations.
Figure 1. FTIR spectra of the studied materials.
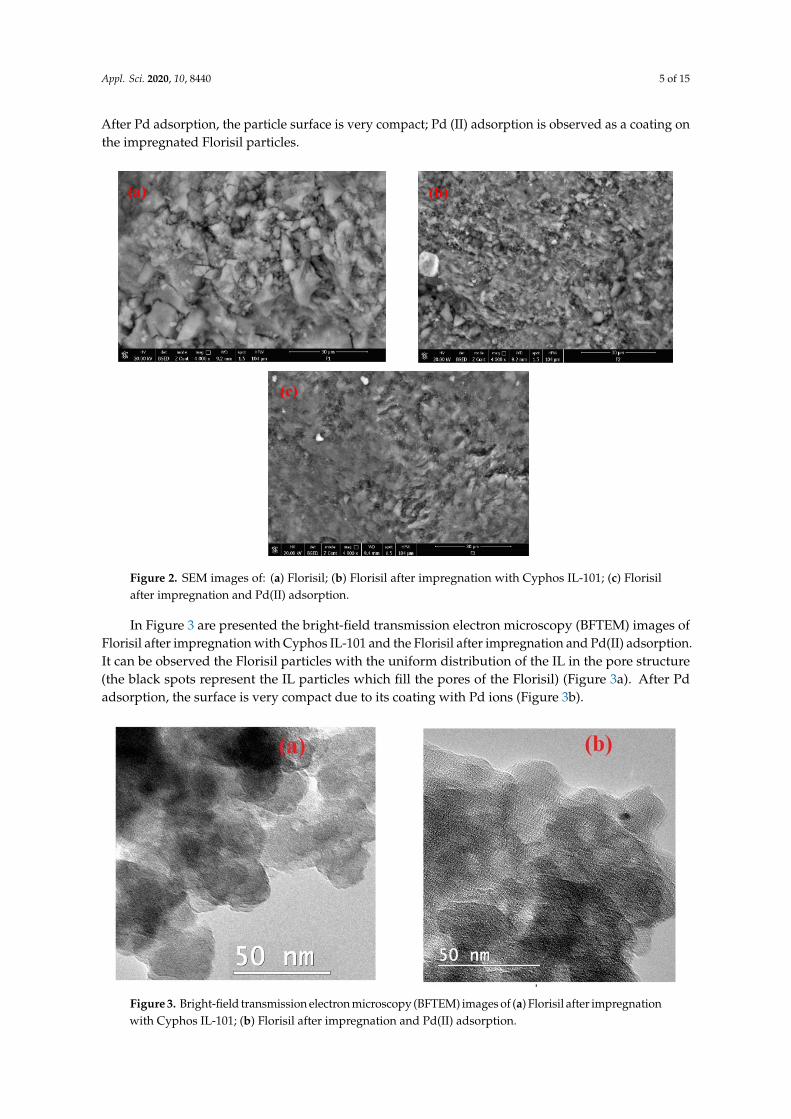
The SEM images are presented in Figure 2. From the SEM images, it can be observed that the Florisil particles before impregnation are in various sizes and shapes, with many microcracks and network defects. After the impregnation, the surface of the Florisil particles is much more uniform. It can be observed the distribution of the ionic liquid particles on their surface by filling the microcracks. After Pd adsorption, the particle surface is very compact; Pd (II) adsorption is observed as a coating on the impregnated Florisil particles.
Figure 1. FTIR spectra of the studied materials.
The SEM images are presented in Figure 2. From the SEM images, it can be observed that theFlorisil particles before impregnation are in various sizes and shapes, with many microcracks andnetwork defects. After the impregnation, the surface of the Florisil particles is much more uniform.It can be observed the distribution of the ionic liquid particles on their surface by filling the microcracks.
Appl. Sci. 2020, 10, 8440 5 of 15
After Pd adsorption, the particle surface is very compact; Pd (II) adsorption is observed as a coating onthe impregnated Florisil particles.Appl. Sci. 2020, 10, x FOR PEER REVIEW 5 of 15
Figure 2. SEM images of: (a) Florisil; (b) Florisil after impregnation with Cyphos IL-101; (c) Florisil after impregnation and Pd(II) adsorption.
In Figure 3 are presented the bright-field transmission electron microscopy (BFTEM) images of Florisil after impregnation with Cyphos IL-101 and the Florisil after impregnation and Pd(II) adsorption. It can be observed the Florisil particles with the uniform distribution of the IL in the pore structure (the black spots represent the IL particles which fill the pores of the Florisil) (Figure 3a). After Pd adsorption, the surface is very compact due to its coating with Pd ions (Figure 3b).
Figure 3. Bright-field transmission electron microscopy (BFTEM) images of (a) Florisil after impregnation with Cyphos IL-101; (b) Florisil after impregnation and Pd(II) adsorption.
The impregnation of Florisil with trihexyl tetradecyl phosphonium chloride is proven by the EDX spectra (Figure 4), where besides the specific peaks of Florisil (Mg, O, Si), the specific peaks for
(a) (b)
(c)
Figure 2. SEM images of: (a) Florisil; (b) Florisil after impregnation with Cyphos IL-101; (c) Florisilafter impregnation and Pd(II) adsorption.
In Figure 3 are presented the bright-field transmission electron microscopy (BFTEM) images ofFlorisil after impregnation with Cyphos IL-101 and the Florisil after impregnation and Pd(II) adsorption.It can be observed the Florisil particles with the uniform distribution of the IL in the pore structure(the black spots represent the IL particles which fill the pores of the Florisil) (Figure 3a). After Pdadsorption, the surface is very compact due to its coating with Pd ions (Figure 3b).
Appl. Sci. 2020, 10, x FOR PEER REVIEW 5 of 15
Figure 2. SEM images of: (a) Florisil; (b) Florisil after impregnation with Cyphos IL-101; (c) Florisil after impregnation and Pd(II) adsorption.
In Figure 3 are presented the bright-field transmission electron microscopy (BFTEM) images of Florisil after impregnation with Cyphos IL-101 and the Florisil after impregnation and Pd(II) adsorption. It can be observed the Florisil particles with the uniform distribution of the IL in the pore structure (the black spots represent the IL particles which fill the pores of the Florisil) (Figure 3a). After Pd adsorption, the surface is very compact due to its coating with Pd ions (Figure 3b).
Figure 3. Bright-field transmission electron microscopy (BFTEM) images of (a) Florisil after impregnation with Cyphos IL-101; (b) Florisil after impregnation and Pd(II) adsorption.
The impregnation of Florisil with trihexyl tetradecyl phosphonium chloride is proven by the EDX spectra (Figure 4), where besides the specific peaks of Florisil (Mg, O, Si), the specific peaks for
(a) (b)
(c)
Figure 3. Bright-field transmission electron microscopy (BFTEM) images of (a) Florisil after impregnationwith Cyphos IL-101; (b) Florisil after impregnation and Pd(II) adsorption.

Appl. Sci. 2020, 10, 8440 6 of 15
The impregnation of Florisil with trihexyl tetradecyl phosphonium chloride is proven by the EDXspectra (Figure 4), where besides the specific peaks of Florisil (Mg, O, Si), the specific peaks for the usedionic liquid (C, Cl and P) can be observed. For the sample obtained after Pd adsorption characteristicpeak of this element is observed, evidencing its adsorption onto the studied material.
Appl. Sci. 2020, 10, x FOR PEER REVIEW 6 of 15
the used ionic liquid (C, Cl and P) can be observed. For the sample obtained after Pd adsorption characteristic peak of this element is observed, evidencing its adsorption onto the studied material.
Figure 4. Energy-dispersive X-ray analysis (EDX) spectra of (a) Florisil after impregnation with Cyphos IL-101; (b) Florisil after impregnation and Pd(II) adsorption.
In order to establish the elemental composition of the sample that will be used as a photocatalyst (Florisil impregnated with Cyphos IL-101 and loaded with Pd ions), the XPS wide scan was used (Figure 5a and Table 1).
1400 1200 1000 800 600 400 200 00
50000
100000
150000
200000
250000
Cl 2
p P 2p
Si 2
p
C 1
sPd
3d
O 1
s
Na
1s
Inte
nsity
(cps
)
Binding Energy(eV)
Mg
1s
(a)
(a)
(b)
Figure 4. Energy-dispersive X-ray analysis (EDX) spectra of (a) Florisil after impregnation with CyphosIL-101; (b) Florisil after impregnation and Pd(II) adsorption.
In order to establish the elemental composition of the sample that will be used as a photocatalyst(Florisil impregnated with Cyphos IL-101 and loaded with Pd ions), the XPS wide scan was used(Figure 5a and Table 1).
Appl. Sci. 2020, 10, x FOR PEER REVIEW 6 of 15
the used ionic liquid (C, Cl and P) can be observed. For the sample obtained after Pd adsorption characteristic peak of this element is observed, evidencing its adsorption onto the studied material.
Figure 4. Energy-dispersive X-ray analysis (EDX) spectra of (a) Florisil after impregnation with Cyphos IL-101; (b) Florisil after impregnation and Pd(II) adsorption.
In order to establish the elemental composition of the sample that will be used as a photocatalyst (Florisil impregnated with Cyphos IL-101 and loaded with Pd ions), the XPS wide scan was used (Figure 5a and Table 1).
1400 1200 1000 800 600 400 200 00
50000
100000
150000
200000
250000
Cl 2
p P 2p
Si 2
p
C 1
sPd
3d
O 1
s
Na
1s
Inte
nsity
(cps
)
Binding Energy(eV)
Mg
1s
(a)
(a)
(b)
Figure 5. Cont.

Appl. Sci. 2020, 10, 8440 7 of 15
Appl. Sci. 2020, 10, x FOR PEER REVIEW 7 of 15
294 292 290 288 286 284 282 280 278 276
0
1000
2000
3000
4000
5000
6000
Inte
nsity
(cps
)
Binding Energy(eV)
Caliphatic
Chetero
355 350 345 340 335 330
2000
4000
6000
8000
10000
12000
Inte
nsity
(cps
)
Binding Energy(eV) Figure 5. XPS characterization of the studied Pd-based photocatalyst: (a) XPS wide scan; (b) C 1s and (c) Pd 3D high-resolution spectra.
Table 1. Elemental concentration resulted from the XPS wide scan spectrum of the studied Pd-based photocatalyst.
Element Atomic Conc. (%)
Mass Conc. (%)
C 20.25 11.91 Pd 2.76 14.39 O 53.68 42.06 Si 19.40 26.68
Mg 1.85 2.20 P 0.32 0.48 Cl 0.52 0.90 Na 1.22 1.38
The XPS wide scan spectrum proves that the Florisil (which is a magnesium silicate with trace concentration of sodium) was impregnated with the studied IL (Cyphos IL-101—trihexyl (tetradecyl) phosphonium chloride) and also it could be observed the presence of the Pd ions.
By analyzing the high-resolution spectra of the elements, XPS allows the identification of the chemical structure. The high-resolution XPS spectra for C 1s and Pd 3d were analyzed in detail for the Pd-based photocatalyst (Figure 5b,c). The signal corresponding to C 1s was divided into two distinct components corresponding to the Caliphatic at 284.5 eV and Chetero at 286.6 eV. The signal corresponding to Pd 3d was decomposed into two distinct components corresponding to the Pd2+ at 337.2 eV and to the Pd4+ at 338.5 eV (Table 2).
Table 2. Experimental binding energies in eV for the Pd-based photocatalyst (*reference peak).
Element Assignment Binding Energy (eV)
Relative Conc. (%)
C 1 s Caliphatic 285* 98.25 Chetero 286.6 1.75
Pd 3d Pd2+ 337.2 86.27 Pd4+ 338.5 13.73
3.2. Application of the Pd-Based Photocatalyst in the Degradation Process of Phenol
The characterized materials were used as photocatalysts in the degradation process of phenols from aqueous solutions through UV-vis irradiation. From the characterization section, it was observed that the Florisil support after IL impregnation presented a higher available active site, which led to a higher adsorption degree in the removal process of Pd ions from aqueous solutions
(b) (c)
Figure 5. XPS characterization of the studied Pd-based photocatalyst: (a) XPS wide scan; (b) C 1s and(c) Pd 3D high-resolution spectra.
Table 1. Elemental concentration resulted from the XPS wide scan spectrum of the studied Pd-based photocatalyst.
Element AtomicConc. (%)
MassConc. (%)
C 20.25 11.91Pd 2.76 14.39O 53.68 42.06Si 19.40 26.68
Mg 1.85 2.20P 0.32 0.48Cl 0.52 0.90Na 1.22 1.38
The XPS wide scan spectrum proves that the Florisil (which is a magnesium silicate with traceconcentration of sodium) was impregnated with the studied IL (Cyphos IL-101—trihexyl (tetradecyl)phosphonium chloride) and also it could be observed the presence of the Pd ions.
By analyzing the high-resolution spectra of the elements, XPS allows the identification of thechemical structure. The high-resolution XPS spectra for C 1s and Pd 3d were analyzed in detail for thePd-based photocatalyst (Figure 5b,c). The signal corresponding to C 1s was divided into two distinctcomponents corresponding to the Caliphatic at 284.5 eV and Chetero at 286.6 eV. The signal correspondingto Pd 3d was decomposed into two distinct components corresponding to the Pd2+ at 337.2 eV and tothe Pd4+ at 338.5 eV (Table 2).
Table 2. Experimental binding energies in eV for the Pd-based photocatalyst (* reference peak).
Element Assignment BindingEnergy (eV)
RelativeConc. (%)
C 1 sCaliphatic 285 * 98.25Chetero 286.6 1.75
Pd 3dPd2+ 337.2 86.27Pd4+ 338.5 13.73
3.2. Application of the Pd-Based Photocatalyst in the Degradation Process of Phenol
The characterized materials were used as photocatalysts in the degradation process of phenolsfrom aqueous solutions through UV-vis irradiation. From the characterization section, it was observedthat the Florisil support after IL impregnation presented a higher available active site, which led to a

Appl. Sci. 2020, 10, 8440 8 of 15
higher adsorption degree in the removal process of Pd ions from aqueous solutions [25]. The exhaustedadsorbent resulted after Pd adsorption presented a more compact surface. This means that the samplewith Pd content presents higher stability, and it is expected to present also a higher photocatalyticactivity. The photocatalytic activity of the studied sample was determined in the degradation processof phenol from aqueous solution through UV-vis irradiation.
3.2.1. Influence of the Photocatalyst Nature
UV-vis molecular spectrometry allows both qualitative and quantitative analysis. The correlationbetween the UV absorption bands and the structure of the compounds (both for phenols and for theproducts resulting from the oxidation of phenols), so the qualitative analysis is a fast and economicalidentification technique. The shifting of the absorption maxima at a certain wavelength givesinformation about the functional groups that appear or disappear at a certain time of reaction.
The UV-vis spectra of phenol at a different time of the photodegradation process for all the studiedmaterials are presented in Figure 6. Initially, the phenol solutions were stirred for 30 min with thephotocatalyst in the dark to achieve the adsorption–desorption equilibrium between the phenol andthe surface of the photocatalysts.
Appl. Sci. 2020, 10, x FOR PEER REVIEW 8 of 15
[25]. The exhausted adsorbent resulted after Pd adsorption presented a more compact surface. This means that the sample with Pd content presents higher stability, and it is expected to present also a higher photocatalytic activity. The photocatalytic activity of the studied sample was determined in the degradation process of phenol from aqueous solution through UV-vis irradiation.
3.2.1. Influence of the Photocatalyst Nature
UV-vis molecular spectrometry allows both qualitative and quantitative analysis. The correlation between the UV absorption bands and the structure of the compounds (both for phenols and for the products resulting from the oxidation of phenols), so the qualitative analysis is a fast and economical identification technique. The shifting of the absorption maxima at a certain wavelength gives information about the functional groups that appear or disappear at a certain time of reaction.
The UV-vis spectra of phenol at a different time of the photodegradation process for all the studied materials are presented in Figure 6. Initially, the phenol solutions were stirred for 30 min with the photocatalyst in the dark to achieve the adsorption–desorption equilibrium between the phenol and the surface of the photocatalysts.
(a) (b)
(c) (d)
(e)
Figure 6. UV-vis spectra of the photodegradation process of phenol: (a) photolysis; and photocatalysis in the presence of (b) F; (c) F-IL; (d) F-IL-Pd1; (e) F-IL-Pd2.
Figure 6. UV-vis spectra of the photodegradation process of phenol: (a) photolysis; and photocatalysisin the presence of (b) F; (c) F-IL; (d) F-IL-Pd1; (e) F-IL-Pd2.

Appl. Sci. 2020, 10, 8440 9 of 15
It is noted that in all the cases, the adsorption profile of phenol does not undergo any changesduring this time. After the irradiation starts, a hyperchromic effect and a hypsochromic (blue shift)effect of the absorption maximum occur. This means that the photodegradation process of phenolstarted, and the intermediate compounds are forming [32,33]. At higher irradiation time occur thehypochromic effect when impregnated Florisil and impregnated Florisil and loaded with differentamounts of Pd are used as photocatalysts.
The degradation degree of phenol versus the photocatalyst nature at two different treatment timeis presented in Figure 7. It is noted that both the presence of IL in the catalyst structure and the Pd leadsto an increase in the degree of phenol degradation from aqueous solutions. In addition, increasingthe amount of Pd from the catalyst has a positive influence on the process of phenol degradation.Further studies were performed using F-IL-Pd2 as a photocatalyst. Maybe a 10% increase of efficiencydoes not represent a significant increase, but it is a great increase taking into account the fact that F-ILis a prime material that could be used for Pd adsorption, and F-IL-Pd is a waste resulted from anotherprocess. Furthermore, if the photocatalyst contains Pd ions, it represents much higher stability in thedegradation process of phenols because Pd ions are bounded on the IL and, in this case, is avoided thedegradation of IL from the surface of Florisil during the photolysis process. If it is used as photocatalystonly the F-IL the TOC concentration increase during the treatment process, which suggest that apart of IL from the Florisil surface is degraded by the UV-vis irradiation, so the efficiency of thismaterial decrease continuously, especially when is used in more cycles of treatment until it present,no photocatalytic activity. Furthermore, the increased efficiency of the F-IL-Pd is underlined by thefact that this efficiency for the phenol degradation is obtained much quickly (at 120 min) than in thecase of using only F-IL as photocatalyst when this efficiency if obtained only after 180 min of treatment.This means that a shorter time is needed for treatment, which leads to decreasing treatment costs.
Appl. Sci. 2020, 10, x FOR PEER REVIEW 9 of 15
It is noted that in all the cases, the adsorption profile of phenol does not undergo any changes during this time. After the irradiation starts, a hyperchromic effect and a hypsochromic (blue shift) effect of the absorption maximum occur. This means that the photodegradation process of phenol started, and the intermediate compounds are forming [32,33]. At higher irradiation time occur the hypochromic effect when impregnated Florisil and impregnated Florisil and loaded with different amounts of Pd are used as photocatalysts.
The degradation degree of phenol versus the photocatalyst nature at two different treatment time is presented in Figure 7. It is noted that both the presence of IL in the catalyst structure and the Pd leads to an increase in the degree of phenol degradation from aqueous solutions. In addition, increasing the amount of Pd from the catalyst has a positive influence on the process of phenol degradation. Further studies were performed using F-IL-Pd2 as a photocatalyst. Maybe a 10% increase of efficiency does not represent a significant increase, but it is a great increase taking into account the fact that F-IL is a prime material that could be used for Pd adsorption, and F-IL-Pd is a waste resulted from another process. Furthermore, if the photocatalyst contains Pd ions, it represents much higher stability in the degradation process of phenols because Pd ions are bounded on the IL and, in this case, is avoided the degradation of IL from the surface of Florisil during the photolysis process. If it is used as photocatalyst only the F-IL the TOC concentration increase during the treatment process, which suggest that a part of IL from the Florisil surface is degraded by the UV-vis irradiation, so the efficiency of this material decrease continuously, especially when is used in more cycles of treatment until it present, no photocatalytic activity. Furthermore, the increased efficiency of the F-IL-Pd is underlined by the fact that this efficiency for the phenol degradation is obtained much quickly (at 120 min) than in the case of using only F-IL as photocatalyst when this efficiency if obtained only after 180 min of treatment. This means that a shorter time is needed for treatment, which leads to decreasing treatment costs.
Figure 7. The degradation degree of phenol function of the photocatalyst nature.
3.2.2. Influence of the S:L Ratio
From the economic point of view, it is desired to use as little photocatalyst amount as possible. For this reason, it is important to know which is the optimum amount of photocatalyst which could be used with good results in the degradation process of phenol from aqueous solutions. The degradation degree of phenol versus the S:L ratio is presented in Figure 8. With the increase of the S: L ratio, the efficiency of the process of phenol degradation from aqueous solutions increase. Further increase of the photocatalyst amount did not lead to a higher efficiency increasing; therefore, it is not recommended to use an S:L ratio higher than 1:1.
Figure 7. The degradation degree of phenol function of the photocatalyst nature.
3.2.2. Influence of the S:L Ratio
From the economic point of view, it is desired to use as little photocatalyst amount as possible.For this reason, it is important to know which is the optimum amount of photocatalyst which could beused with good results in the degradation process of phenol from aqueous solutions. The degradationdegree of phenol versus the S:L ratio is presented in Figure 8. With the increase of the S:L ratio,the efficiency of the process of phenol degradation from aqueous solutions increase. Further increase ofthe photocatalyst amount did not lead to a higher efficiency increasing; therefore, it is not recommendedto use an S:L ratio higher than 1:1.

Appl. Sci. 2020, 10, 8440 10 of 15
Appl. Sci. 2020, 10, x FOR PEER REVIEW 10 of 15
Figure 8. The degradation degree of phenol versus the solid:liquid (S:L) ratio.
3.2.3. Influence of the Photocatalyst Reuse
An important factor that characterizes a photocatalyst is its stability. It is desired that after a treatment process, the photocatalyst to be recovered and reused in other treatment processes, with the same efficiency to minimize the treatment costs. The photocatalyst obtained by Pd adsorption on IL impregnated Florisil showed stability in the sense that the Pd ions were not detached from the solid support following a photocatalysis process. This was determined by analyzing them in the solution resulting from the photocatalysis process when a concentration below the detection limit was obtained. At the S:L = 0.5:1, after a photocatalytic process, the catalyst was reused in two new degradation processes of phenol from aqueous solutions. It is noted that the efficiency of the photocatalyst decreases by 5% after the first cycle because a part of the IL impregnated onto Florisil is degraded by the UV-vis irradiation. In the further cycle, the efficiency of phenol degradation remains constant (Figure 9). These results underlined the efficiency of using as photocatalyst of F-IL-Pd compared with the sample of F-IL, where the probability of IL degradation from the Florisil surface is much higher.
Figure 8. The degradation degree of phenol versus the solid:liquid (S:L) ratio.
3.2.3. Influence of the Photocatalyst Reuse
An important factor that characterizes a photocatalyst is its stability. It is desired that after atreatment process, the photocatalyst to be recovered and reused in other treatment processes, with thesame efficiency to minimize the treatment costs. The photocatalyst obtained by Pd adsorption on ILimpregnated Florisil showed stability in the sense that the Pd ions were not detached from the solidsupport following a photocatalysis process. This was determined by analyzing them in the solutionresulting from the photocatalysis process when a concentration below the detection limit was obtained.At the S:L = 0.5:1, after a photocatalytic process, the catalyst was reused in two new degradationprocesses of phenol from aqueous solutions. It is noted that the efficiency of the photocatalyst decreasesby 5% after the first cycle because a part of the IL impregnated onto Florisil is degraded by the UV-visirradiation. In the further cycle, the efficiency of phenol degradation remains constant (Figure 9).These results underlined the efficiency of using as photocatalyst of F-IL-Pd compared with the sampleof F-IL, where the probability of IL degradation from the Florisil surface is much higher.Appl. Sci. 2020, 10, x FOR PEER REVIEW 11 of 15
Figure 9. The degradation degree of phenol versus the photocatalyst reuse.
Even if a part of IL is degraded from the surface of the photocatalyst, the efficiency of the Pd based photocatalyst is not influenced only by 5% because the Pd ions are still coating the surface of Florisil. As it is mentioned in the literature, the photoirradiation led to the greater deposition of Pd ions onto the surface of the solid support [34–36]. This good deposition of Pd ions onto the surface of Florisil, even after one photodegradation process, can be seen from the BFTEM image and EDX spectrum of the reused photocatalyst presented in Figure 10. From the BFTEM images, it can be observed that a part of IL from the Florisil surface is degraded (the black spots are in a smaller amount), but there is still a very good coating with the Pd ions. This conclusion can be raised from the EDX spectrum where the peaks specific for the studied IL (C, P and Cl) are not so evident, but the Pd ions are very well-identified.
Figure 10. BFTEM image and EDX spectrum of the reused photocatalyst.
3.2.4. Mechanism of Phenol Degradation
Figure 11 presents the kinetic plot (C/C0 at λ = 270 nm vs. time) of phenol photodegradation. At different times of contact, the UV-vis absorption profiles of solutions together with the measured TOC concentrations were presented. The UV-vis absorption profiles of solutions allow making qualitative analysis for identification of the intermediate compounds of phenol oxidation.
From the kinetic study and the absorption profiles at different time intervals, as well as by the correlation of our results with results reported in the literature, a mechanism of phenol degradation was proposed [32,33]. At the same time, the TOC was measured in order to determine the degree of
Figure 9. The degradation degree of phenol versus the photocatalyst reuse.
Even if a part of IL is degraded from the surface of the photocatalyst, the efficiency of the Pd basedphotocatalyst is not influenced only by 5% because the Pd ions are still coating the surface of Florisil.As it is mentioned in the literature, the photoirradiation led to the greater deposition of Pd ions onto

Appl. Sci. 2020, 10, 8440 11 of 15
the surface of the solid support [34–36]. This good deposition of Pd ions onto the surface of Florisil,even after one photodegradation process, can be seen from the BFTEM image and EDX spectrum of thereused photocatalyst presented in Figure 10. From the BFTEM images, it can be observed that a part ofIL from the Florisil surface is degraded (the black spots are in a smaller amount), but there is still a verygood coating with the Pd ions. This conclusion can be raised from the EDX spectrum where the peaksspecific for the studied IL (C, P and Cl) are not so evident, but the Pd ions are very well-identified.
Appl. Sci. 2020, 10, x FOR PEER REVIEW 11 of 15
Figure 9. The degradation degree of phenol versus the photocatalyst reuse.
Even if a part of IL is degraded from the surface of the photocatalyst, the efficiency of the Pd based photocatalyst is not influenced only by 5% because the Pd ions are still coating the surface of Florisil. As it is mentioned in the literature, the photoirradiation led to the greater deposition of Pd ions onto the surface of the solid support [34–36]. This good deposition of Pd ions onto the surface of Florisil, even after one photodegradation process, can be seen from the BFTEM image and EDX spectrum of the reused photocatalyst presented in Figure 10. From the BFTEM images, it can be observed that a part of IL from the Florisil surface is degraded (the black spots are in a smaller amount), but there is still a very good coating with the Pd ions. This conclusion can be raised from the EDX spectrum where the peaks specific for the studied IL (C, P and Cl) are not so evident, but the Pd ions are very well-identified.
Figure 10. BFTEM image and EDX spectrum of the reused photocatalyst.
3.2.4. Mechanism of Phenol Degradation
Figure 11 presents the kinetic plot (C/C0 at λ = 270 nm vs. time) of phenol photodegradation. At different times of contact, the UV-vis absorption profiles of solutions together with the measured TOC concentrations were presented. The UV-vis absorption profiles of solutions allow making qualitative analysis for identification of the intermediate compounds of phenol oxidation.
From the kinetic study and the absorption profiles at different time intervals, as well as by the correlation of our results with results reported in the literature, a mechanism of phenol degradation was proposed [32,33]. At the same time, the TOC was measured in order to determine the degree of
Figure 10. BFTEM image and EDX spectrum of the reused photocatalyst.
3.2.4. Mechanism of Phenol Degradation
Figure 11 presents the kinetic plot (C/C0 at λ = 270 nm vs. time) of phenol photodegradation.At different times of contact, the UV-vis absorption profiles of solutions together with the measured TOCconcentrations were presented. The UV-vis absorption profiles of solutions allow making qualitativeanalysis for identification of the intermediate compounds of phenol oxidation.
Appl. Sci. 2020, 10, x FOR PEER REVIEW 12 of 15
mineralization, not only the photodegradation degree of phenol. It can be observed that during the period of establishing the adsorption–desorption equilibrium between the phenol and the surface of the photocatalyst, it is adsorbed about 10% of the phenol present in the solution. At the start of the UV lamp, a change in the sample absorbance profile is observed due to the hyperchromic effect. This effect suggests that phenol passes into degradation intermediates: catechol, hydroquinone and p-benzoquinone [32,33].
Up to a 30 min irradiation time, there is no mineralization of these intermediate compounds. This can be seen from the TOC analysis, which shows that even after 30 min of irradiation, the TOC concentration is approximately equal to the initial TOC. Or it is possible that the TOC concentration to remain constant because a part of the IL is detached and degraded from the surface of the Florisil. After this time, in the sample spectrum appear a decrease in absorbance (hypochromic effect), so we can conclude that the process of mineralization has begun, besides the photodegradation process, also proven by the TOC concentration which after 60 min has reached a value of 2.69 mg/L (Figure 11).
By further irradiating the solution in the presence of the photocatalyst, the aromatic ring breaks with the formation of aliphatic organic acids with the short molecule (maleic acid, oxalic acid, formic acid) [32,33]. Its formation is indicated by the hypsochromic effect (a blue shift) by displacing the maximum adsorption from 270 nm to 265 nm. After 180 min, the TOC is 1.1 mg/L, which means a 93.75% efficiency of mineralization (Figure 11).
Figure 11. Degradation kinetics (C/C0 vs. time) of phenol photodegradation process, UV-vis absorption profiles and total organic carbon (TOC) measurements of solutions at certain time intervals.
Comparing the performance of the studied materials with other photocatalysts reported in the literature (Table 3) could be concluded that the studied materials, which actually consist of a waste resulted from other processes, presents good photocatalytic activity in the degradation process of phenol from aqueous solutions.
Figure 11. Degradation kinetics (C/C0 vs. time) of phenol photodegradation process, UV-vis absorptionprofiles and total organic carbon (TOC) measurements of solutions at certain time intervals.
From the kinetic study and the absorption profiles at different time intervals, as well as by thecorrelation of our results with results reported in the literature, a mechanism of phenol degradation

Appl. Sci. 2020, 10, 8440 12 of 15
was proposed [32,33]. At the same time, the TOC was measured in order to determine the degreeof mineralization, not only the photodegradation degree of phenol. It can be observed that duringthe period of establishing the adsorption–desorption equilibrium between the phenol and the surfaceof the photocatalyst, it is adsorbed about 10% of the phenol present in the solution. At the start ofthe UV lamp, a change in the sample absorbance profile is observed due to the hyperchromic effect.This effect suggests that phenol passes into degradation intermediates: catechol, hydroquinone andp-benzoquinone [32,33].
Up to a 30 min irradiation time, there is no mineralization of these intermediate compounds.This can be seen from the TOC analysis, which shows that even after 30 min of irradiation, the TOCconcentration is approximately equal to the initial TOC. Or it is possible that the TOC concentrationto remain constant because a part of the IL is detached and degraded from the surface of the Florisil.After this time, in the sample spectrum appear a decrease in absorbance (hypochromic effect), so wecan conclude that the process of mineralization has begun, besides the photodegradation process,also proven by the TOC concentration which after 60 min has reached a value of 2.69 mg/L (Figure 11).
By further irradiating the solution in the presence of the photocatalyst, the aromatic ring breakswith the formation of aliphatic organic acids with the short molecule (maleic acid, oxalic acid, formicacid) [32,33]. Its formation is indicated by the hypsochromic effect (a blue shift) by displacing themaximum adsorption from 270 nm to 265 nm. After 180 min, the TOC is 1.1 mg/L, which means a93.75% efficiency of mineralization (Figure 11).
Comparing the performance of the studied materials with other photocatalysts reported in theliterature (Table 3) could be concluded that the studied materials, which actually consist of a wasteresulted from other processes, presents good photocatalytic activity in the degradation process ofphenol from aqueous solutions.
Table 3. Comparison of the photocatalytic efficiency developed by various materials in the degradationprocess of phenol from aqueous solutions.
Photocatalyst Phenol InitialConcentration, mg/L
Degradation Degree,%
Treatment Time,min References
Titanium dioxide-coated on the innerand outer quartz glass tubes 30 50 300 [37]
Titanium dioxide (TiO2) Degussa P25(80% anatase, 20% rutile) 20 83.9 360 [38]
ZnO 25 78.2 90 [39]
0.5% Pd-0.5% Au/TiO2 94.11 69 5520 [40]
F-IL-Pd 20 78.6 180 Present work
4. Conclusions
The exhausted adsorbent could be efficiently used as a Pd-based photocatalyst in the degradationprocess of phenol. The presence of the IL on solid support increases the adsorption efficiency of Pdions from aqueous solutions. In addition, it was found that both the presence of ionic liquid and Pd (II)ions result in an increase in the efficiency of the phenol degradation process. Furthermore, increasingthe amount of Pd (II) from the catalyst structure and increasing the S: L ratio has a positive effect onthe degradation process. The obtained photocatalyst could be efficiently used in several cycles ofdegradation processes. A part of the IL from the Florisil surface is degraded during the first process ofphotodegradation, but at the same time, the Pd ions are more fixed on the solid support. The efficiencyof the catalyst decreased only by 5%, and then the efficiency is maintained. These results underlinedthe efficiency and stability as photocatalyst of the sample F-Il-Pd compared with the sample F-IL in thedegradation process of phenol from aqueous solutions.
The results of the present manuscript underline the efficiency of waste resulted from an adsorbentprocess to be used as a photocatalyst. These results are in the frame of the closed cycle technologyresponding to the actual need of circular economy.

Appl. Sci. 2020, 10, 8440 13 of 15
Author Contributions: Conceptualization, L.L. and L.C.; methodology, L.L. and A.P.; formal analysis, L.L., B.T.and A.C.; investigation, L.L.; writing—original draft preparation, L.L. and L.C.; supervision, A.P. All authors haveread and agreed to the published version of the manuscript.
Funding: This research received no external funding.
Acknowledgments: The research infrastructure developed at ICECHIM through the POS-CCE “AGRI-FLUX”project, nr. 645/18.03.2014, cod SMIS-CSNR 48695 was partially used to obtain the results presented in this study.
Conflicts of Interest: The authors declare no conflict of interest.
References
1. Xie, F.; Fan, R.; Yi, Q.; Fan, Z.; Zhang, Q.; Luo, Z. Adsorption recovery of Pd(II) from aqueous solutions bypersimmon residual based bio-sorbent. Hydrometallurgy 2016, 165, 323–328. [CrossRef]
2. Seo, Y.; Morimoto, S. Analyzing Platinum and Palladium Consumption and Demand Forecast in Japan.Resources 2017, 6, 61. [CrossRef]
3. Cieszynska, A.; Wisniewski, M. Selective extraction of palladium(II) from hydrochloric acid solutions withphosphonium extractants. Sep. Purif. Technol. 2011, 80, 385–389. [CrossRef]
4. Paiva, A.P.; Ortet, O.; Carvalho, G.I.; Nogueira, C.A. Recovery of palladium from a spent industrial catalystthrough leaching and solvent extraction. Hydrometallurgy 2017, 171, 394–401. [CrossRef]
5. Cieszynska, A.; Regel-Rosocka, M.; Wisniewski, M. Extraction of Palladium(II) Ions from Chloride Solutionswith Phosphonium Ionic Liquid Cyphos®IL101. Pol. J. Chem. Technol. 2007, 9, 99–101. [CrossRef]
6. Schoeman, E.; Bradshaw, S.M.; Akdogan, G.; Eksteen, J.J. The recovery of platinum, palladium, and goldfrom a cyanide heap solution, with use of ion exchange resins. In Proceedings of the 5th InternationalPlatinum Conference “A Catalyst for Change”, Sun City, South Africa, 18–20 September 2012; pp. 729–742.
7. Els, E.; Lorenzen, L.; Aldrich, C. The recovery of palladium with the use of ion exchange resins. Miner. Eng.1997, 10, 1177–1181. [CrossRef]
8. Wołowicz, A.; Hubicki, Z. Comparison of strongly basic anion exchange resins applicability for the removalof palladium(II) ions from acidic solutions. Chem. Eng. J. 2011, 171, 206–215. [CrossRef]
9. Kim, S.; Lee, C.K.; Lee, J.-C.; Rhee, K.-I.; Sohn, H.-J.; Kang, T. Electrowinning of Platinum Using a ModifiedCyclone Reactor. Resour. Process. 2004, 51, 48–51. [CrossRef]
10. Di Natale, F.; Orefice, M.; La Motta, F.; Erto, A.; Lancia, A. Unveiling the potentialities of activated carbon inrecovering palladium from model leaching solutions. Sep. Purif. Technol. 2017, 174, 183–193. [CrossRef]
11. Das, N. Recovery of precious metals through biosorption—A review. Hydrometallurgy 2010, 103, 180–189.[CrossRef]
12. Mack, C.; Wilhelmi, B.; Duncan, J.; Burgess, J.E. Biosorption of precious metals. Biotechnol. Adv. 2007, 25, 264–271.[CrossRef]
13. Snyders, C.; Bradshaw, S.; Akdogan, G.; Eksteen, J. The effect of temperature, cyanide and base metals on theadsorption of Pt, Pd and Au onto activated carbon. Hydrometallurgy 2014, 149, 132–142. [CrossRef]
14. Nagireddi, S.; Katiyar, V.; Uppaluri, R. Pd(II) adsorption characteristics of glutaraldehyde cross-linkedchitosan copolymer resin. Int. J. Biol. Macromol. 2017, 94, 72–84. [CrossRef]
15. Cataldo, S.; Gianguzza, A.; Pettignano, A. Sorption of Pd(II) ion by calcium alginate gel beads at differentchloride concentrations and pH. A kinetic and equilibrium study. Arab. J. Chem. 2016, 9, 656–667. [CrossRef]
16. Kochkar, H.; Turki, A.; Bergaoui, L.; Berhault, G.; Ghorbel, A. Study of Pd(II) adsorption over titanatenanotubes of different diameters. J. Colloid Interface Sci. 2009, 331, 27–31. [CrossRef] [PubMed]
17. Liu, L.; Liu, S.; Zhang, Q.; Li, C.; Bao, C.; Liu, X.; Xiao, P. Adsorption of Au(III), Pd(II), and Pt(IV) from AqueousSolution onto Graphene Oxide. J. Chem. Eng. Data 2012, 58, 209–216. [CrossRef]
18. Cieszynska, A.; Wisniewski, M. Extraction of palladium(II) from chloride solutions with Cyphos®IL101/toluene mixtures as novel extractant. Sep. Purif. Technol. 2010, 73, 202–207. [CrossRef]
19. Regel-Rosocka, M.; Rzelewska, M.; Baczynska, M.; Janus, M.; Wisniewski, M. Removal of palladium(II) fromaqueous chloride solutions with Cyphos phosphonium ionic liquids as metal ion carriers for liquid-liquidextraction and transport across polymer inclusion membranes. Physicochem. Probl. Miner. Process 2015,51, 621–631. [CrossRef]

Appl. Sci. 2020, 10, 8440 14 of 15
20. Sharma, S.; Wu, C.-M.; Koodali, R.T.; Rajesh, N. An ionic liquid-mesoporous silica blend as a novel adsorbentfor the adsorption and recovery of palladium ions, and its applications in continuous flow study and as anindustrial catalyst. RSC Adv. 2016, 6, 26668–26678. [CrossRef]
21. Sharma, S.; Rajesh, N. Synergistic influence of graphene oxide and tetraoctylammonium bromide (frozenionic liquid) for enhanced adsorption and recovery of palladium from an industrial spent catalyst. J. Environ.Chem. Eng. 2016, 4, 4287–4298. [CrossRef]
22. Jouannin, C.; Vincent, C.; Dez, I.; Gaumont, A.-C.; Vincent, T.; Guibal, E. Study of Alginate-Supported IonicLiquid and Pd Catalysts. Nanomaterials 2012, 2, 31–53. [CrossRef] [PubMed]
23. Lupa, L.; Popa, A.; Vodă, R.; Negrea, P.; Ciopec, M.; Vasile, A. Strontium adsorption on ionic liquidimpregnated Florisil: Fixed-bed column studies. Sep. Sci. Technol. 2016, 51, 2554–2564. [CrossRef]
24. Lupa, L.; Negrea, A.; Ciopec, M.; Negrea, P.; Vodă, R. Ionic liquids impregnated onto inorganic support usedfor thallium adsorption from aqueous solutions. Sep. Purif. Technol. 2015, 155, 75–82. [CrossRef]
25. Lupa, L. Palladium Adsorption on Ionic Liquid Impregnated Florisil. Available online: https://search.proquest.com/openview/bf90ac3233e145b6bb595911461326f8/1?pq-origsite=gscholar&cbl=1536338 (accessed on23 January 2020).
26. Decision No 1386/2013/EU of the European Parlament and of the Council of 20 November 2013—On a GeneralUnion Environment Action Programme to 2020 ‘Living Well, within the Limits of Our Planet’. Available online:https://eur-lex.europa.eu/legal-content/EN/TXT/?uri=CELEX%3A32013D1386 (accessed on 15 November 2020).
27. Lin, H.; Liu, Y.; Deng, J.; Zhang, K.; Zhang, X.; Xie, S.; Zhao, X.; Yang, J.; Han, Z.; Dai, H. Au−Pd/mesoporousFe2O3: Highly active photocatalysts for the visible-light-driven degradation of acetone. J. Environ. Sci. 2018,70, 74–86. [CrossRef]
28. Meng, X.; Li, Z.; Zhang, Z. Highly efficient degradation of phenol over a Pd-BiOBr Mott–Schottky plasmonicphotocatalyst. Mater. Res. Bull. 2018, 99, 471–478. [CrossRef]
29. Meng, X.; Meng, X. Pd-doped Bi2MoO6 plasmonic photocatalysts with enhanced visible light photocatalyticperformance. Appl. Surf. Sci. 2017, 392, 169–180. [CrossRef]
30. Zhang, K.; Liu, Y.; Deng, J.; Xie, S.; Zhao, X.; Yang, J.; Han, Z.; Dai, H. Co–Pd/BiVO4: High-performancephotocatalysts for the degradation of phenol under visible light irradiation. Appl. Catal. B Environ. 2018,224, 350–359. [CrossRef]
31. Lupa, L.; Cocheci, L.; Pode, R.; Hulka, I. Phenol adsorption using Aliquat 336 functionalized Zn-Al layereddouble hydroxide. Sep. Purif. Technol. 2018, 196, 82–95. [CrossRef]
32. Seftel, E.; Puscasu, M.; Mertens, M.; Cool, P.; Carja, G. Assemblies of nanoparticles of CeO2–ZnTi-LDHs andtheir derived mixed oxides as novel photocatalytic systems for phenol degradation. Appl. Catal. B Environ.2014, 157–166. [CrossRef]
33. Seftel, E.; Puscasu, M.; Mertens, M.; Cool, P.; Carja, G. Fabrication of CeO2/LDHs self-assemblies withenhanced photocatalytic performance: A case study on ZnSn-LDH matrix. Appl. Catal. B Environ. 2015,164, 251–260. [CrossRef]
34. Selishchev, D.; Kolobov, N.; Bukhtiyarov, A.; Gerasimov, E.; Gubanov, A.; Kozlov, D. Deposition of Pdnanoparticles on TiO2 using a Pd(acac) 2 precursor for photocatalytic oxidation of CO under UV-LEDirradiation. Appl. Catal. B Environ. 2018, 235, 214–224. [CrossRef]
35. Fan, Q.; He, S.; Hao, L.; Liu, X.; Zhu, Y.; Xu, S.; Zhang, F. Photodeposited Pd Nanoparticles with DisorderedStructure for Phenylacetylene Semihydrogenation. Sci. Rep. 2017, 7, 42172. [CrossRef] [PubMed]
36. Maicu, M.; Hidalgo, M.; Colón, G.; Navío, J.A. Comparative study of the photodeposition of Pt, Au and Pdon pre-sulphated TiO2 for the photocatalytic decomposition of phenol. J. Photochem. Photobiol. A Chem. 2011,217, 275–283. [CrossRef]
37. Nickheslat, A.; Amin, M.-M.; Izanloo, H.; Fatehizadeh, A.; Mousavi, S.M. Phenol Photocatalytic Degradationby Advanced Oxidation Process under Ultraviolet Radiation Using Titanium Dioxide. J. Environ. Public Heal.2013, 2013, 815310. [CrossRef]
38. Laoufi, N.A.; Tassalit, D.; Bentahar, F. The degradation of phenol in water solution by TiO2 photocatalysis ina helical reactor. Glob. NEST J. 2013, 10, 404–418. [CrossRef]

Appl. Sci. 2020, 10, 8440 15 of 15
39. Dewidar, H.; Nosier, S.; El-Shazly, A. Photocatalytic degradation of phenol solution using Zinc Oxide/UV.J. Chem. Heal. Saf. 2018, 25, 2–11. [CrossRef]
40. Yilleng, M.T.; Gimba, E.C.; Ndukwe, G.I.; Bugaje, I.M.; Rooney, D.W.; Manyar, H.G. Batch to continuousphotocatalytic degradation of phenol using TiO2 and Au-Pd nanoparticles supported on TiO2. J. Environ.Chem. Eng. 2018, 6, 6382–6389. [CrossRef]
Publisher’s Note: MDPI stays neutral with regard to jurisdictional claims in published maps and institutionalaffiliations.
© 2020 by the authors. Licensee MDPI, Basel, Switzerland. This article is an open accessarticle distributed under the terms and conditions of the Creative Commons Attribution(CC BY) license (http://creativecommons.org/licenses/by/4.0/).