photoelectrochemical degradation of methylene blue dye
TRANSCRIPT
Int. J. Electrochem. Sci., 14 (2019) 9982 – 10001, doi: 10.20964/2019.10.41
International Journal of
ELECTROCHEMICAL SCIENCE
www.electrochemsci.org
Photoelectrochemical degradation of methylene blue dye under
visible light irradiation using EG/Ag-ZrO2 nanocomposite
electrodes
Onoyivwe Monday Ama1,2, Anku William Wilson3,*, Suprakas Sinha Ray1,2
1 Department of Chemical Sciences, University of Johannesburg, Doornfontein, 2028, Johannesburg,
South Africa. 2 DST-CSIR National Center for Nanostructured Materials, Council for Scientific and Industrial
Research, Pretoria 0001, South Africa. 3 CSIR- Water Research Institute, P. O. Box M.32, Accra, Ghana. *E-mail: [email protected]
Received: 6 June 2019 / Accepted: 9 July 2019 / Published: 30 August 2019
The present study reports the application of three electrodes, consisting of exfoliated graphite (EG), EG
and zirconium oxide (EG-ZrO2), and EG and silver-doped zirconium oxide (EG/Ag-ZrO2) in a
comparative photoelectrochemical degradation of methylene blue (MB) dye in water under visible light
irradiation. The Ag-ZrO2 is prepared using a sol-gel method and used in the fabrication of EG/Ag-ZrO2
electrodes via a wet solution method. The morphologies, crystalline structures, and
surface/physicochemical properties of the nanocomposites are characterized by SEM, TEM, XRD, and
UV-Vis, FTIR, and Raman spectroscopies. The SEM results show that ZrO2 and Ag-ZrO2 are evenly
dispersed on the surfaces of EG. The XRD and Raman analyses reveal that ZrO2 exists in the tetragonal
phase. The modification of ZrO2 with EG and Ag results in electrodes with strong absorption in the
visible light region. All fabricated electrodes display the capacity to degrade MB, with EG/Ag-ZrO2
exhibiting the highest degradation efficiency and EG the lowest. The electrode with the highest
efficiency (EG/Ag-ZrO2) is used in optimization studies, which identify the optimum conditions required
for maximizing the efficiency of the degradation process. In addition, the EG/Ag-ZrO2 is used in the
degradation of MB via photolysis, as well as electrochemical and photoelectrochemical methods. The
photoelectrochemical method exhibits superior performance when compared to photolysis and
photocatalytic methods in the degradation of MB. The synergistic effects of Ag and ZrO2 enhance the
efficiency of EG/Ag-ZrO2 toward the degradation of MB.
Keywords: Exfoliated graphite, Ag, ZrO2, electrode, photoelectrochemical degradation, dye
1. INTRODUCTION
Synthetic dyes have considerable commercial significance and are widely used in different
industries, including the paper, leather, and textile industries [1, 2]. As a consequence, wastewater

Int. J. Electrochem. Sci., Vol. 14, 2019
9983
emanating from these industries can contain large quantities of a variety of dyes (e.g., methylene blue
and methyl orange). The presence of these dyes in the environment is a matter of great concern since
most of them are toxic and pose therefore a serious threat to both aquatic life and human health [3–5].
Even at low concentration, these dyes change the colour of the receiving water body. This phenomenon
affects the photosynthetic processes in the water adversely, disturbing thus aquatic ecosystems [6, 7].
Industrial wastewater polluted with toxic dyes must, therefore, be treated prior to its final release into
the environment.
To date, a number of conventional water treatment technologies, including chemical
precipitation, adsorption, and chemical oxidation, have been adopted, albeit with minimal success as far
as their industrial application is concerned [3]. These treatment methods either end up causing secondary
pollution or are extremely capital intensive [8]. Therefore, there is an urgent need for more economical
and effective methods to replace conventional water treatment methods. The efforts directed at resolving
the above-mentioned problems have led to the development of photocatalytic oxidation [9–11] and
electrochemical oxidation [12–14] methods, which are considered to be more effective in the conversion
of organic pollutants to carbon dioxide and water [15]. However, these methods are also associated with
certain inherent limitations. The photocatalytic oxidation method, for example, suffers from rapid
recombination of the photogenerated electrons and holes, which are responsible for the initiation of the
pollutant degradation process [4]. In addition, as a result of the large band gap that is characteristic for
most of the photocatalysts used in this process, the photocatalytic degradation of the pollutants tends to
occur under ultraviolet (UV) light instead of the more abundant visible light [16–18]. By contrast, direct
electrochemical degradation of the pollutants is a slow process, and the degradation of dye molecules
requires the application of high current densities [19].
One of the possible ways to improve the overall efficiencies of the described methods is to
enhance their visible light activities and reduce the recombination rates of the electrons and holes. These
objectives can be achieved by the doping of wide-band-gap metal oxides such as zirconium oxide (ZrO2)
with metals such as silver [15]. The metal dopants capture the photogenerated electrons and prevent
them from recombining with the holes [20, 21]. Ag has been identified as one of the metal dopants
capable of acting as an electron acceptor in the host material and has been reported to alter positively the
optical and electrical properties of the host material [22, 23]. Silver can trap the electrons from ZrO2,
thus leaving the holes free to participate in the degradation process [11]. Another method for achieving
the described objectives involves the use of exfoliated graphite (EG) [24]. EG is a low-density
conductive carbon material with a large specific surface area, high flexibility, profound electrical
conductivity, and the ability to withstand aggressive media [25]. EG can be loaded with a photoactive
metal oxide catalyst to serve as an appropriate anode for an effective electrochemical degradation
process [26, 27]. ZrO2 is a photoactive metal oxide catalyst with a significant content of oxygen
vacancies, whose wide band gap can be reduced by doping with Ag. In addition, ZrO2 possess high
mechanical, thermal, chemical and photocatalytic stability [28, 29], and can, therefore, be combined with
the EG to serve as an anode in photoelectrochemical processes.
The combination of photocatalytic and electrochemical methods to afford a holistic
photoelectrochemical degradation method has also been proposed and represents one of the most
effective means of attaining the degradation of dye pollutants [30–32]. The synergistic effect of the two
Int. J. Electrochem. Sci., Vol. 14, 2019
9984
processes is known to suppress the drawbacks of the individual methods and produce outstanding results
[33].
The motive of this work was to investigate the photoelectrochemical degradation of methylene
blue (MB) dye using a nanocomposite electrode consisting of EG and Ag-doped ZrO2. The degradation
of MB was also done by photolysis and electrochemical methods. The results were compared with those
achieved via the photoelectrochemical method. Finally, optimization studies were performed to detect
the optimal settings for maximizing the efficiency of the degradation process.
2. EXPERIMENTAL
2.1 Materials and methods
All the chemicals used in this study, namely, silver nitrate (AgNO3), zirconium nitrate
[Zr(NO3)4], nitric acid (HNO3), ethylene glycol, 25% aqueous ammonium solution (NH4OH), natural
graphite flakes, sulfuric acid (H2SO4), and MB dye were procured from Sigma-Aldrich (South Africa).
A standard solution of the MB dye was prepared by dissolving the appropriate mass of the dye in
deionized water (1000 mL). The desired dye concentration (20 mg/L) was obtained by diluting the
standard solution.
2.2 Synthesis of Ag-doped ZrO2 (Ag-ZrO2)
The Ag-ZrO2 nanoparticles were synthesized using a simple sol-gel method at 60 °C.
Specifically, 0.05 g of silver nitrate was poured into deionized water (400 mL). The mixture was stirred
until the solid became completely dissolved. Separately, 1 g of Zr(NO3)4 was dissolved in a beaker
containing 10 mL of 0.1 M HNO3 and the solution was stirred for 30 min. AgNO3 solution and 0.6 mL
of ethylene glycol were added sequentially in a dropwise manner. The ensuing solution was stirred for
1 h after which the pH was adjusted to 7.5 using 25% ammonium solution leading to the formation of
an Ag-ZrO2 precipitate. The solution was stirred for further 30 min before the reaction was stopped. The
precipitate was separated by centrifugation (500 rpm), oven dried at room temperature, calcined at 500
°C, and pulverized to obtain the powdered Ag-ZrO2 nanoparticles.
2.3 Synthesis of EG
Natural graphite (20 g) was soaked in H2SO4: HNO3 (3:1, v/v) mixture overnight. The material
was subsequently washed with copious amounts of deionized water until pH 7 was attained. The resultant
material (graphite intercalated compound, GIC) was oven dried at 100 °C for 12 h and heated in an
electric furnace at 800 °C for about 1 min. The thermal treatment disrupted the intercalation in the
graphite lattice, producing ruptured graphite layers. This procedure afforded a puffed material referred
to as EG.

Int. J. Electrochem. Sci., Vol. 14, 2019
9985
2.4 Fabrication of composite electrodes
In order to synthesize the EG/Ag-ZrO2 electrode, the EG was first dispersed in deionized water
in a 1:1 ratio forming a mixture which was continuously stirred for 12 h and subsequently subjected to
6 h of sonication. The Ag-ZrO2 (1 g) was mixed with the dispersed EG. The mixture was sonicated for
another 4 h, oven dried for 6 h at 100 °C. The EG/Ag-ZrO2 nanocomposites were pelleted and used to
produce the electrode. The EG and EG-ZrO2 electrodes were also fabricated following this procedure.
2.5. Characterization
The surface morphologies of the samples were studied using scanning electron microscopy
(SEM). Details of the elemental compositions of the samples were obtained using energy dispersive X-
ray spectrometer (EDS) attached to the SEM. Surface area, pore size, and pore volume information were
acquired through the use of micromeritics Trista II surface area and porosity analyzer. The optical
properties were examined via UV-Vis absorbance and diffuse reflectance spectroscopy studies using dry
powders with LAMBDA 750 Perkin Elmer as the internal standard. The X-ray diffraction (XRD)
patterns were obtained through the use of an X’PERT PRO Wide ANGLE diffractometer with Cu-kα
radiation. The XRD data were used to identify the crystallinities, phases, and particles sizes of the
composites. Raman spectroscopy analysis was performed using a Raman spectroscope.
2.6. Photoelectrochemical degradation experiments
The photoelectrochemical degradation of MB dye was executed in a 100 mL photoreactor using
each of the fabricated materials (EG, EG/ZrO2, and EG/Ag-ZrO2) with the same surface area of 0.7855
cm2 as the working electrodes. Ag/AgCl (3.0 M KCl) was used as the reference electrode, while a
platinum foil was used as the counter electrode. The power requirements of the degradation experiment
were met using a potentiostat that provided voltage and current ranges of 1–3 V and 7.5–15 mA,
respectively. A solar simulator (250 W) fitted with a UV filter was used to provide the visible light for
the experiment. A 100 mL of an aqueous solution containing MB dye at a concentration of 20 mg/L in
a 0.1 M Na2SO4 supporting electrode was poured into the reactor, and the electrodes were connected to
the electrochemical instrument. The system was switched on and the degradation experiment was
performed for 4 h under continuous magnetic stirring. Aliquots of the dye under degradation (5 mL)
were withdrawn from the reactor every 30 min and the concentration of the dye remaining in each sample
was determined using UV-Vis spectroscopy. The effects of the solution pH, current density, and applied
potential on the degradation efficiencies of the electrodes were also investigated.
2.7. HPLC analysis
The test samples (dye degradation products, 1mL) were taken at specific time intervals (15 min)
and analysed using HPLC-photodiode array detector (UltiMate 3000). The pollutant degradation was

Int. J. Electrochem. Sci., Vol. 14, 2019
9986
monitored at 225 nm. Elution of the samples was achieved by a gradient method at a 0.2 mL min-1 flow
rate using a Phenomenex LUNA 5 mm C18 reversed phase column (150 x 4.60 mm). Initially, the sample
was eluted for 6 min using 70 % ultra-pure water and 30 % acetonitrile. Subsequently, the acetonitrile’s
ratio was increased within 2 min from 30% to 90 % and held for 1 min. The ratio was then reduced back
to 30 % within 8 min and was held constant for 3 min. Analysis of the intermediates products was
achieved using LC/MS/MS. They were separated using an LC-20Ad XR model liquid chromatography
(LC). The column and the mobile phase used in the LC were the same as those used in the HPLC analysis.
3. RESULT AND DISCUSSIONS
3.1. SEM, TEM and EDX Analysis
Figures 1a to 1c show the SEM images of EG, EG-ZrO2, and EG/Ag-ZrO2 nanocomposites,
respectively. Natural graphite exhibits an ordered structure, however, in the EG (Figure 1a), the structure
has become raptured. Figures 1b and 1c show the surface of the EG visibly modified with ZrO2 Ag-ZrO2
nanoparticles, respectively. The ZrO2 and Ag-ZrO2 particles are observed as white particles, uniformly
distributed on the EG surface. Figure 3d shows the TEM image of the evenly distributed Ag-ZrO2
nanoparticles. As observed in Figure 1c, the TEM image of EG/Ag-ZrO2 nanocomposites (Fig 1e)
reveals that the surface of the EG is modified/covered with EG/Ag-ZrO2 nanoparticles. The EDX
spectrum of EG/Ag-ZrO2 (Figure 1d) demonstrates that the composite contains O, C, Ag, and Zr. The
presence of these elements confirms that the EG/Ag-ZrO2 composites have been successfully
synthesised.
Figure 1. SEM Images of (a) EG, (b) EG/ZrO2, (c) EG/Ag-ZrO2, TEM images of (d) Ag-ZrO2, (e) and
(d) EG/Ag-ZrO2 and (f) EDS of EG/Ag-ZrO2
a
d

Int. J. Electrochem. Sci., Vol. 14, 2019
9987
3.2 XRD analysis
Figure 2 represents the X-ray diffractograms of ZrO2, EG-ZrO2, and EG/Ag-ZrO2 composites.
The XRD pattern of ZrO2 (Figure 2a) exhibits peaks at 2θ of 30.3°, 50.3°, and 60.2°, which correspond
to (011), (112), and (121) reflection planes, respectively. The intensities and the positions of these peaks
(Figure 2a) indicate that the synthesized nanocomposite is crystalline and exist in the tetragonal phase
of ZrO2 according to JCPDs card No. 50-1089 [34]. Apart from the identifiable peaks of pure ZrO2, the
EG-ZrO2 (Figure 2b) and EG/Ag-ZrO2 (Figure 2c) samples display additional peaks at 2θ = 26.4° (002),
38.1° (100), 44.2° (101), 54.7° (004), 64.3° (110), and 77.3° (112), which represent peaks arising from
EG [35]. No peak characteristic for Ag appears in the XRD spectrum as a result of the small
concentration of Ag (0.5w %) when compared to that of ZrO2 [36]. The average crystallite size of the
nanocomposites was calculated to be 44 nm. These values were calculated based on the Debye–Scherrer
equation (Equation 1) using the peaks with the highest intensities:
𝐷 =𝐾𝜆
𝛽cos𝜃 (1)
Where D is the crystallite size, λ is the wavelength of the radiation (1.54 nm), K is shape factor
(0.9), β is the full width at half maximum of the highest intensity peak, and θ is the Bragg angle of the
most intense peak at a specific phase.
Figure 2. XRD patterns of (a) ZrO2, (b) Ag-ZrO2, and (c) EG/Ag-ZrO2
3.3 Raman spectroscopy analysis
The tetragonal phase of zirconia has six Raman active modes [37]. The Raman spectrum of ZrO2
(Figure 3a) displays Raman active modes that are unique to tetragonal ZrO2. These bands appear at 186
cm–1, 312 cm–1, 374 cm–1, 399 cm–1, 644 cm–1, and 729 cm–1 and correspond to the tetragonal Raman
20 40 60 80
Inte
nsi
ty
2Theta Degree
a
b
c
011
112 121
002
100
101
004
110 112

Int. J. Electrochem. Sci., Vol. 14, 2019
9988
vibrational modes of ZrO2. Figure 3b represents Raman spectra of EG, EG/ZrO2, and EG/Ag-ZrO2
composites. Graphite displayed two exclusive Raman bands known as D (disorder) and G (graphitic)
bands [38]. The peak at 1639 cm–1, which is the G band, represents the scattering on E2g phonon vibration
of sp2 bonded carbon atoms [39]. The D band of these samples (EG, EG/ZrO2, and EG/Ag-ZrO2) appears
at 1533 cm–1. The appearance of this peak specifies the presence of disorder in the hexagonal lattice of
graphite, caused by internal structural defects and/or dangling bonds [38]. The comparatively high
intensity of the G band in the EG/Ag-ZrO2 composite indicates the existence of C–C sp2 bonds, whereas
the low intensity of the D band suggested that EG was not disrupted significantly by the incorporation
of Ag-ZrO2. The Raman spectroscopic analysis does not only support the successful fabrication of the
EG/Ag-ZrO2 electrode but corroborates also the results of XRD analysis, which showed that ZrO2 is
composed mainly of the tetragonal phase.
Figure 3. Raman spectra of ZrO2, EG, EG-ZrO2, and EG/Ag-ZrO2
200 400 600 800
200200
300
400400
500
600600
700
Inte
nsi
ty (
a.u
)
ZrO2
Raman Shift (cm-1) A
0 500 1000 1500 2000 2500 3000
0
10000
20000
30000
Inte
nsit
y
Raman Shift cm -1
EG
DG
EG/ZrO2
EG/Ag-ZrO2
1200 1240 1280 1320 1360 1400 1440 1480 1520
G
D
B
Int. J. Electrochem. Sci., Vol. 14, 2019
9989
3.4 Thermogravimetric analysis (TGA)
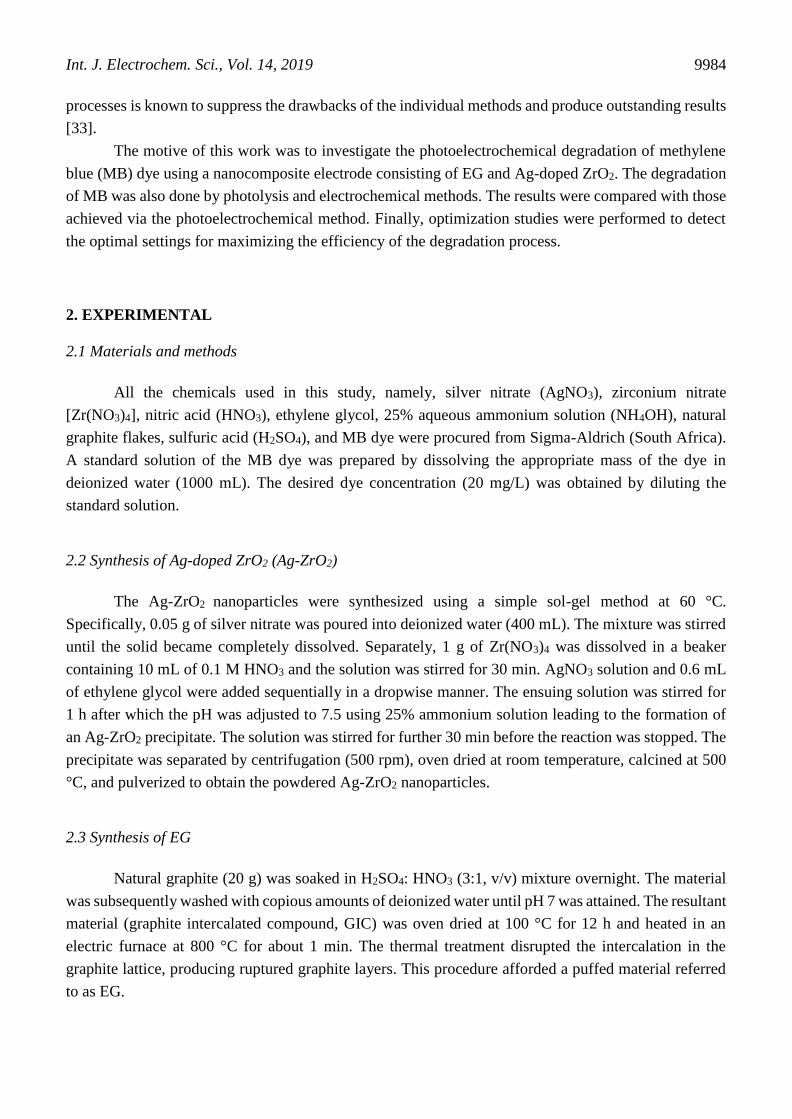
TGA was executed to examine the thermal stabilities of the as-synthesized samples (Figure 4).
The losses in weight observed in temperature ranges from about 10 °C to 200 °C for ZrO2 sample (Figure
4a), and from about 50 °C to 100 °C for EG-ZrO2 and EG/Ag-ZrO2 samples (Figures 4b & 4c) are caused
by the evaporation of water/moisture from the surfaces of the samples. The slight weight loss observed
from 100 °C to about 380 °C for all the samples is attributed to active pyrolysis. The significant weight
loss detected for all samples in the 380–900 °C range is attributed to the decomposition of EG in the
composites.
Figure 4. TGA plots of (a) ZrO2, (b) EG/ZrO2, and (c) EG/Ag-ZrO2
3.5 Fourier transforms infrared spectroscopy analysis
The presence and nature of different functional groups in the nanocomposite samples were
determined using Fourier transform infrared (FTIR) spectroscopy (Figure 5). For all the samples, all
peaks observed below 100 cm–1 were accredited to Zr–O bonding. The FTIR peak appearing at around
1380 cm–1 is allocated to O–H bonding, while the peak at 1553 cm–1 is associated with adsorbed moisture
on the surface of the nanocomposites. The appearance of the peak between 3425 and 3445 cm–1 confirms
the presence of hydroxyl groups [40]. The peaks characteristic for C=O stretching vibrations in EG are
observed at around 1720 cm–1. Other peaks arising from EG appear at 500 cm–1, 1060 cm–1, and 2400
cm–1 and correspond to C=C bending vibrations, C–O stretching vibrations, and CH2 stretching and
deformation vibrations, respectively [41]. The peak located at about 2950 cm–1 represents the C–H
group.
0 200 400 600 800 1000
70
75
80
85
90
95
100
Wei
gh
t L
oss
%
Temperature (C)
a. EG/ZrO2
b. ZrO2
c. EG/Ag-ZrO2c
b
a

Int. J. Electrochem. Sci., Vol. 14, 2019
9990
Figure 5. FTIR spectra of (a) ZrO2, (b) EG/ZrO2, and (c) EG/Ag-ZrO2
3.6 Optical analysis
Figure 6. UV-Vis absorption spectra of (a) ZrO2 (b) EG/ZrO2, and (c) EG/Ag-ZrO2
The samples’ visible light activities were probed using UV-Vis spectroscopy. The UV-Vis
absorption spectra of the samples (Figure 6) revealed that the visible light absorptivity of ZrO2 was
enhanced by the introduction of EG. Thus, the EG/ZrO2 demonstrated higher visible light absorption
ability than pure ZrO2. A further increase in the visible light absorption of ZrO2 occurred with the
introduction of Ag. Thus, the increased visible light activity of the EG/Ag-ZrO2 electrode is caused by
1000 1500 2000 2500 3000 3500
96
97
98
99
100
101
% T
ran
smit
tan
ce
Wavenumber (cm-1
)
300 400 500 600 700 800
14
16
18
20
22
24
26
28
Ab
sorb
an
ce (
a.u
)
Wavelength (nm)
c
b
a

Int. J. Electrochem. Sci., Vol. 14, 2019
9991
the synergistic effects of both Ag and EG presence of Ag most likely leads to the creation of impurities
in the intrinsic bands, causing thus a change in the optical band gap of ZrO2. By contrast, the EG behaved
as a photosensitizer to improve the light absorption of the sample in the visible light region. High visible
light activity implies enhanced pollutant degradation ability [24]. The EG/Ag-ZrO2 electrode, which
exhibits the highest visible light activity, is expected therefore to demonstrate the highest efficiency in
the degradation of the pollutants.
The band gaps of the synthesized electrodes were calculated using the Kubelka–Munk Equation
2:
F(𝑅) =(1−𝑅)
2𝑅 (2)
which was obtained from the diffuse reflectance data. The reflectance (R) is equal to
Rsample/Rreference. The Kubelka–Munk equation was used to construct a Tauc plot (([(F(R)*hν]n vs. photo
energy (hν)), where n is an integer and its value is dependent on the nature of the semiconductor used.
The Tauc plots for the three materials synthesized in the present study are depicted in Figure 7. The band
gaps were calculated through extrapolation of the Kubelka–Munk function to F(R) = 0. The results show
a reduction in the band gap of ZrO2 upon introduction of EG and a further reduction caused by the
incorporation of Ag as a dopant. Thus, the presence of EG and Ag facilitates a reduction in ZrO2 band
gap, which in turn produces an improvement in the photoactivity observed. The results of this analysis
corroborate the outcomes determined using UV-Vis absorption spectroscopy analysis.
Figure 7. Tauc plots for (a) ZrO2 (b) EG/ZrO2, and (c) EG/Ag-ZrO2
2 3 4 5 6
0.0
0.5
1.0
1.5
0.0
0.5
1.0
0.0
0.2
0.4
0.6
Photoenergy (eV)
ZrO2
5.42 eV
[F (
R)*
hv]
1/2
(eV
)1/2
EG/ZrO2
5.30 eV
EG/Ag-ZrO2
5.16 eV

Int. J. Electrochem. Sci., Vol. 14, 2019
9992
3.7 Brunauer–Emmett–Teller (BET) analysis
BET surface area analysis was aimed at determining the surface areas and pore volumes of the
synthesized electrodes. Typically, catalysts possessing large surface areas and pore volumes display
enhanced capacity to adsorb a variety of organic pollutants onto their surfaces, facilitating improved
photoelectrochemical degradation of the pollutants. The results of the BET analysis of the EG, EG/ZrO2,
and EG/Ag-ZrO2 electrodes (Table 1) show that all the electrodes possess large surface areas, and pore
volumes with EG/Ag-ZrO2 exhibiting the highest surface area (16.99 m2 g–1) and pore volume (0.07996
cm3 g−1). All of the prepared electrodes are therefore expected to exhibit high pollutant degradation
efficiencies, with EG/Ag-ZrO2 potentially showing the highest efficiency.
Table 1. BET data obtained for EG, ZrO2, Ag-ZrO2, and EG/Ag-ZrO2
Sample BET surface area Pore volume
(m2 g–1) (cm3 g–1)
EG 11. 98 0. 03697
ZrO2 15.67 0. 06992
EG/ZrO2 16.42 0. 07868
EG/Ag-ZrO2 16.99 0. 07996
3.8 Electrochemical characterization of EG and EG/Ag-ZrO2 electrodes
Figure 8(i) shows the cyclic voltammograms of EG and EG/Ag-ZrO2 electrodes. The
voltammograms were acquired using a 10-mM potassium ferricyanide ([Fe(CN)6]−3/−4) solution to probe
the electrochemical potentials of the fabricated electrodes at 20 mV s−1. Comparatively, the EG/Ag-ZrO2
electrode displayed a higher current than the EG electrode as a result of the larger specific surface area
of the EG/Ag-ZrO2 caused by the presence of ZrO2 nanoparticles in the composite.
The electrochemical impedance spectroscopy (EIS) measurements (Figure 8 (ii)) was conducted
to characterize the charge transfer resistance (Rct) between the electrolyte and interfaces of EG, Ag-
ZrO2, and EG/Ag-ZrO2 electrodes. The open circuit potential (0.0 V) and at the frequency range of 0.1-
100 kΩ were used in this measurement. As can be seen in Figure 8(ii), particularly at a higher frequency,
the semicircle for EG/Ag-ZrO2 shows lower semicircle arc radius than those of EG and Ag-ZrO2
semicircles. This observation is attributed to predominant electron transport property and ionic
conduction at the interface between the EG/Ag-ZrO2 electrode and the electrolyte [42, 43]. Furthermore,
in the fitting of the EIS data using an electrical equivalent circuit (EEC) shown in Figure 8 (iii), the
calculated Rct values were 834.3 Ω, 539.2 Ω and 115.1 Ω for EG, Ag-ZrO2, and EG/Ag-ZrO2,
respectively. The suppression of Rct observed when EG is incorporated to Ag-ZrO2 shows an ideal
photoanode which provides efficient photoelectrochemical process. Furthermore, both bode modulus

Int. J. Electrochem. Sci., Vol. 14, 2019
9993
and phase plots which are shown in Figure 8 (iii) and (iv) also corroborate the Nyquist diagrams as the
impedance and phase angles at the region pin-pointing Rct behaviour (at low-frequency range) are low
for EG/Ag-ZrO2. All these show a better separation rate of electrons and holes leading to a relatively
efficient Rct ideal for good photoelectrochemical processes at the electrolyte and electrode interface [44,
45].
Figure 8. Figure 8 (i) Cyclic voltammogram (ii) Nyquist diagrams (ii) (iii) impedance modulus and (iv)
phase plot of EG, Ag-ZrO2 and EG/Ag-ZrO2 electrodes.
3.9 Photoelectrochemical degradation studies
The capacities of the fabricated electrodes (EG, EG-ZrO2, and EG/Ag-ZrO2) to
photoelectrochemically degrade organic pollutants in water were determined by the application of the
electrodes to the degradation of MB (100 mL, 20 mg/L) under visible light irradiation. The degradation
experiments were first conducted in order to identify the most efficient catalyst. Once identified, the
performance of the most efficient catalyst was optimized by examining the efficiency of the dye
degradation process as a function of pH, current density, and voltage.
(i)(ii)
(iii) (iv)
-0.2 -0.1 0.0 0.1 0.2 0.3 0.4 0.5 0.6 0.7-4.0x10
-2
-3.0x10⁻²
-2.0x10⁻²
-1.0x10⁻²
0.0
1.0x10⁻²
2.0x10⁻²
3.0x10⁻²
4.0x10⁻²
5.0x10⁻²
6.0x10⁻²
I/A
E/V
b
aa. EG/Ag-ZrO2
b. EG
0 20 40 60 80 100
0
50
100
150
200
250
300
350
b
c
a. EG
b. Ag-ZrO2
c. EG/Ag-ZrO2
a
0.1 1 10 100 1000 10000 100000
1
10
100
1000
c
a
Impedance Modulus
a. EG
b. Ag-ZrO2
c. EG/Ag-ZrO2
log (f/Hz)
b
1 10 100 1000 10000 100000
10
20
30
40
50
60
70
80
90
100
a
b
a. EG
b. Ag-ZrO2
c. EG/Ag-ZrO2
- P
ha
se
log (f/Hz)
c
Int. J. Electrochem. Sci., Vol. 14, 2019
9994
3.9.1 Effect of catalyst modification
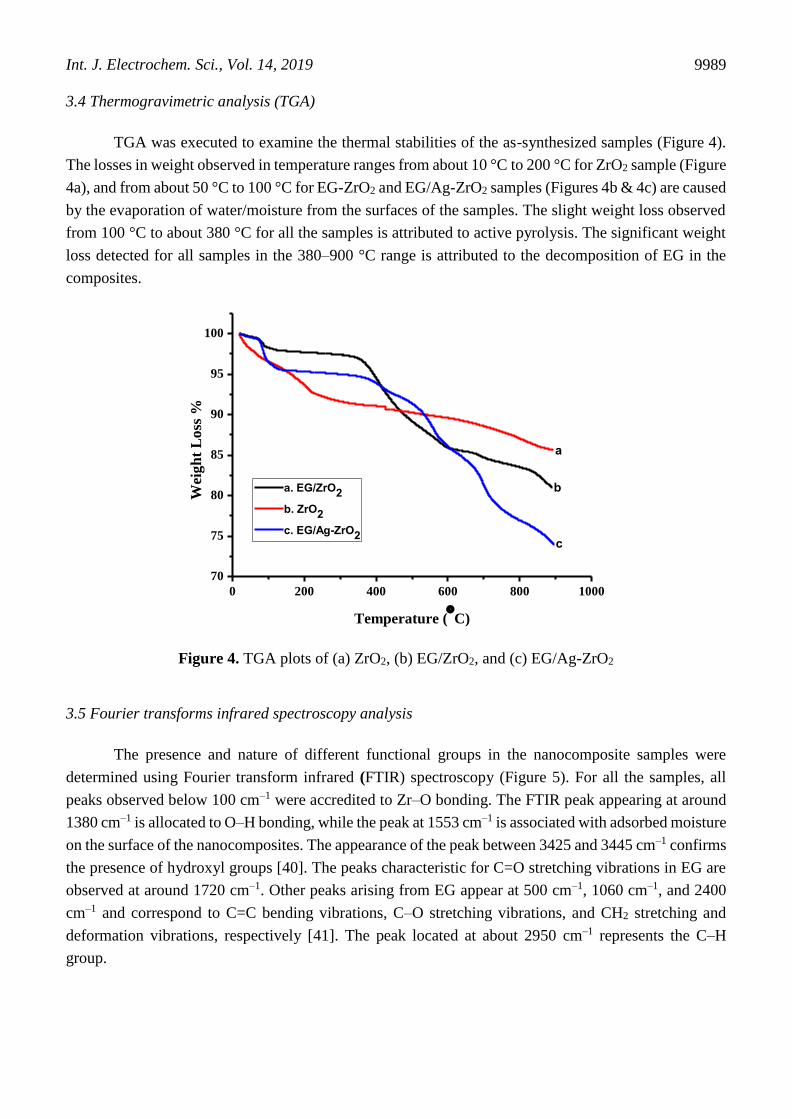
The photoelectrochemical degradation profiles of MB dye obtained using the EG, EG/ZrO2, and
EG/Ag-ZrO2 electrodes are depicted in Figure 9a.
Figure 9. Methylene blue degradation profiles observed in the presence of (A) EG, EG-ZrO2, and
EG/Ag-ZrO2 electrodes and (B) EG/Ag-ZrO2 electrode, at current and voltage ranges of 7.5–15
mA and 1–3 V, respectively
The results showed that the degradation efficiencies of the electrodes toward MB were in the
following order: EG < EG-ZrO2 < EG/Ag-ZrO2. Thus, the modification of EG with ZrO2 and Ag
improved the MB degradation efficiency of the electrode, and EG/Ag-ZrO2 afforded the most efficient
electrode with about 99.7% efficiency owing to the synergistic effects of Ag and ZrO2 incorporation.
Doping of metal oxides with Ag has been shown to enhance both optical and electrical characteristics of
0 50 100 150 200 2500
10
20
30
40
50
60
70
80
90
100
Deg
rad
ati
on
(%
)
Time (min)
EG
EG/ZrO2
EG/Ag-ZrO2
400 500 600 700 800-0.04
-0.02
0.00
0.02
0.04
0.06
0.08
0.10
0.12
Ab
so
rban
ce
Wavelength / nm
A
0 min
50 min
100 min
150 min
200 min
250 min
(A)
(B)

Int. J. Electrochem. Sci., Vol. 14, 2019
9995
catalysts [46]. Meanwhile, EG is known to improve the optical activity of catalysts by acting as a
photosensitizer [24]. In addition, EG can also reduce the electron-hole recombination rate, and increase
the surface area of the electrode for enhanced pollutant adsorption. Figure 9b further ascertains the
appropriateness of the EG/Ag-ZrO2 for the degradation of MB at the voltage and current ranges of 1–3
V and 7.5–15 mA. The gradual reductions in the intensities of the peaks characteristic for MB at 609 nm
and 668 nm over time confirm the gradual degradation of the dye. This result is comparable to that
obtained by Feng et al [47] where Ag doping enhanced the visible light and photocatalytic activities of
ZnO mesoporous nanowall arrays (MNWAs).
3.9.2 Effect of pH on the photoelectrochemical degradation of MB
The solution pH is an important factor that needs to be considered during the
photoelectrochemical degradation of dyes in wastewater solutions. Specifically, the pH determines the
surface charge characteristics of the metal oxide catalysts, which in turn influences the effectiveness of
the degradation process. In this study, the pH was varied from 2 to 11 and its effect on the rate of the
degradation of MB by the EG/Ag-ZrO2 electrode (Figure 10) was examined. The dye degradation
efficiency increased with increasing pH, and the highest and lowest efficiencies were detected at a pH
of 11 and 2, respectively.
Figure 10. Effect of pH on the photoelectrochemical degradation of 20 mg/L solution of methylene blue
dye by EG/Ag-ZrO2 at current and voltage ranges of 7.5–15 mA and 1–3 V, respectively
The pH-dependency of the MB degradation process can be explained in terms of the surface
charges in acidic and basic media. The surface of the electrode becomes negatively charged at higher
pH values (basic medium) as a result of the accumulation of OH– ions on the electrode surface [48].
0 50 100 150 200 2500.0
0.2
0.4
0.6
0.8
1.0
Ct
/ C
o
Time / min
pH 11
pH 4
pH 4
pH 2

Int. J. Electrochem. Sci., Vol. 14, 2019
9996
Meanwhile, according to literature [49], the aqueous solution of MB is positively charged. There is,
therefore, an electrostatic attraction between the negatively charged EG/Ag-ZrO2 electrode surface and
the positively charged methylene blue dye. This attraction leads to enhanced adsorption of dye molecules
on the electrode surface, which is a necessary pre-requisite for efficient photoelectrochemical
degradation. The enhanced absorption explains the high degradation efficiency in the basic medium. By
contrast, the surface of the electrode becomes positively charged at low pH values (acidic medium) as a
result of the presence of H+ ions on its surface. The positively charged electrode surface repels the
positively charged dye molecules, causing them to be sparingly adsorbed onto the electrode, and
resulting in low degradation efficiency.
3.9.3 Effect of current density on the photoelectrochemical degradation of MB
Figure 11 shows the relationship between current density and MB concentration decay. An
improvement in the dye removal efficiency was realised upon increasing the density of the current from
2 mA m–2 to 10 mA m–2. The increase in the current density increases the frequency of electron excitation
from the valence band to the conduction band of ZrO2 upon light irradiation. This increase leads
subsequently to the generation of a higher number of holes and reactive oxygen species, as well as
HO• radicals, all of which are excellent oxidizing agents, and enhance thus the degradation rate.
Figure 11. Effect of current density on the photoelectrochemical degradation of 20 mg/L solution of
methylene blue at pH 11 by EG/Ag-ZrO2 in a voltage range of 1–3 V
3.9.4 Effect of potential on the photoelectrochemical degradation of MB
The relationship between applied potential and MB degradation efficiency of the EG/Ag-ZrO2
electrode is displayed in Figure 12. The results showed that a direct relationship between the dye
0 50 100 150 200 2500.0
0.2
0.4
0.6
0.8
1.0
Ct
/ C
o
Time / min
10 mAm-2
4 mAm-2
2 mAm-2

Int. J. Electrochem. Sci., Vol. 14, 2019
9997
degradation efficiency and the applied potential exists. This relationship is caused by the effective
separation of the photogenerated electrons and holes as a result of the external photoanode electric field.
An increase in the applied potential causes enhanced separation of charge carriers, which in turn results
in the generation of high concentration of OH radicals in the solution. From the present results, the
applied potential of 2 V was found to be optimal, affording a degradation efficiency of 93%.
Figure 12. Effect of voltage on the photoelectrochemical degradation of 20 mg/L solution of methylene
blue dye by EG/Ag-ZrO2 at pH 11 and current of 10 mA m–2
3.10 Photolysis, electrochemical, and photoelectrochemical degradation studies
The EG/Ag-ZrO2 was applied to the degradation of MB electrochemical and
photoelectrochemical methods, and the results, together with those obtained via simple photolysis, are
compared in Figure 13. The photolysis procedure was performed with visible light only, i.e., no electrode
was employed. The electrochemical degradation was executed with the electrode in the absence of light,
and the photoelectrochemical degradation was carried out with the electrode in the presence of light. The
result demonstrated the superiority of the photoelectrochemical process for the degradation of MB over
both photolysis and the electrochemical method. These results confirm that the efficiency of the MB
degradation process is highest in the presence of both visible light and the EG/Ag-ZrO2 electrode.
The kinetics of the MB dye degradation by electrodes under the various conditions were studied
using pseudo-first-order reaction kinetics (eqn 2).
In𝐶o
𝐶t= 𝑘𝑡 (2)
where Co and Ct represent the initial dye concentration and the dye concentration at time t
respectively, while k represents the first-order rate constant.
Notable linear fits were detected for all the electrodes (EG, EG/ZrO2, and EG/Ag-ZrO2). The rate
constant values (Table 2) for the three electrodes under photoelectrochemical degradation are present in
0 50 100 150 200 2500.0
0.2
0.4
0.6
0.8
1.0
Ct
/Co
Time / min
2 v
1 v

Int. J. Electrochem. Sci., Vol. 14, 2019
9998
the following order: EG< EG/ZrO2< EG/Ag-ZrO2, indicating that the EG/Ag-ZrO2 degraded the dye at
the fastest rate. The rate of degradation of the dye with the EG/Ag-ZrO2 electrode is also faster under
photoelectrochemical degradation compared to electrochemical and photolysis.
Figure 13. Normalized concentration decay curves obtained during the (a) photolysis (+ light, no
electrode), (b) electrochemical (no light, + electrode), and (c) photoelectrochemical degradation
(+ light and electrode) of 20 mg/L solution of methylene blue dye. The electrode was comprised
of EG/Ag-ZrO2
3.11 comparison of the effectiveness of the as-synthesized electrode (EG/Ag-ZrO2) with other published
results of EG-based electrodes
In order to ascertain its superiority over other EG based electrodes, the efficiency of the as-
synthesized EG/Ag-ZrO2 electrode has been matched with other published data involving different EG
based electrodes (Table 3). The result evidenced that the EG/Ag-ZrO2 is an effective electrode as it
showed a much higher degradation efficiency in comparison to the other EG based electrodes used.
Table 2. Rate constant values for MB degradation
Sample K (min-1)
EG (photoelectrochemical) 0.2736
EG/ZrO2 (photoelectrochemical) 0.9825
EG/Ag-ZrO2 (a) photoelectrochemical 2.9427
(b) electrochemical 0.0481
(c) photolysis 0.0320
0 50 100 150 200 2500.0
0.2
0.4
0.6
0.8
1.0C
t / C
o
Time / Min
a. Photoylsis
b. Electrochemical
c. Photoelectrochemical Oxidation
a
b
c

Int. J. Electrochem. Sci., Vol. 14, 2019
9999
Table 3. Comparison of the effectiveness of different EG based electrodes
Names of catalysts Dyes used % degradation References
EG-diamond Anthraquinone 81 [50]
EG/Se-ZnO Methylene blue 98.5 [51]
EG-ZnO Methylene blue 96 [52]
EG-TiO2 Methylene blue 85 [53]
EG-WO3 Orange II 82 [54]
EG/Ag-ZrO2 Methylene blue 98.8 [This work]
3.11 HPLC analysis
HPLC analysis was performed to identify the by-products of MB formed during its
photoelectrochemical degradation mediated by EG/Ag-ZrO2 (Figure 14A). As shown by UV-Vis
analysis (Figure 14B), the concentration of MB decreased with increasing time (monitored at 668 nm).
This decrease was accompanied by the appearance of new peaks in the HPLC chromatogram (Figure
14A), which indicates significant destruction of the MB dye and the formation of different by-products.
Five peaks assigned to MB, and the intermediate products (Azura B, Azura A, Azura C, and Thoinin),
with retention times of 15.6, 9.3, 8.1, 6.7, and 5.6 min, respectively, are observed. Peaks with similar
retention times were previously observed for the same dyes by Rauf et al. [55].
Figure 14. (A) UV-Vis spectrum and (B) HPLC chromatograms of methylene blue
photoelectrochemical degradation by EG/Ag-ZrO2 obtained at a wavelength of 668 nm.
4. CONCLUSIONS
Electrodes comprised of EG, EG-ZrO2, and EG/Ag-ZrO2 have been successfully synthesized in
this study, as evidenced by the results of FTIR spectroscopy and EDX analyses. The SEM revealed that
in the images of EG-ZrO2 and EG/Ag-ZrO2 electrodes, ruptured EG is evenly covered by ZrO2 and Ag-
ZrO2 nanoparticles, respectively. The XRD and Raman spectroscopy analyses showed that ZrO2 exists
0 5 10 15 20-5000
0
5000
10000
15000
20000
25000
30000
35000
40000
15.6
min
9.3
min
8.1
min
6.7
min
Inte
nsit
y (
a.u
)
Time (min)
5.6
min
(A)
12 14 16 18 20
0
40000
80000
120000
160000
200000
240000
280000
320000
360000
0
Inte
nsit
y (
a.u
)
Time (min)
250
(B)

Int. J. Electrochem. Sci., Vol. 14, 2019
10000
in the tetragonal phase. The visible light activity of EG was improved by the introduction of Ag and EG,
and EG/Ag-ZrO2 was identified as the most effective electrode for the degradation of MB. In contrast to
photolysis and photocatalytic degradation, which exhibited minimal degradation efficiencies, the
photoelectrochemical method resulted in significant degradation of MB. The high efficiency of the
EG/Ag-ZrO2 electrode toward the degradation of MB is attributed to the synergistic effects of Ag and
EG, which enhance the photocatalytic performance of the electrode by improving its visible light
absorption and increase its pollutant adsorption capacity by increasing the specific surface area.
ACKNOWLEDGEMENT
The authors wish to acknowledge Abesach Motlatle for SEM Characterization. The Faculty of
Science/PDRF at the University of Johannesburg is acknowledged for financial supports, South Africa,
and DST-CSIR National Center for Nanostructured Materials, Council for Scientific and Industrial
Research, South Africa.
References
1. H. Chaudhuri, S. Dash, A. Sarkar, J of Porous Mater., 23 (2016) 1227-1237.
2. A. Slampova, D. Smela, A. Vondrackova, I. Jancarova, V. Kuban, Feedback., 91 (1997)
3. U.G Akpan, B.H Hameed, J Hazard Mater., 170(2009) 520-529.
4. X. Li, D. Pletcher, F.C Walsh, Chem Soci Rev., 40 (2011) 3879-3894.
5. D. Ravelli, D. Dondi, M. Fagnoni, A. Albini, Chem Soci Rev., 38 (2009)1999-2011.
6. J.S. Bae, H.S Freeman, Dyes Pigm., 73 (2007) 81-85.
7. L.S. Andrade, T.T. Tasso, D.L da Silva, R.C Rocha Filho, N. Bocchi, S.R Biaggio Electrochim
Acta., 54 (2009) 2024-2030.
8. J.H. Jou, Y.X. Lin, S.H. Peng, C.J Li, Y.M Yang, C.L. Chin, M.C. Liu Adv Funct Mater., 24
(2014) 555-562.
9. M. Muruganandham, M. Swaminathan., Dyes Pigm, 62(2004) 269-275.
10. F. Han, V.S.R. Kambala, M. Srinivasan, D. Rajarathnam, R. Naidu., Appl Catal A-Gen 359 (2009)
25-40.
11. U.G. Akpan, B.H. Hameed., J Hazard Mater 170 (2009) 520-529.
12. M. Zhou, J. He., J. Hazard Mater 153 (2008) 357-363.
13. M. Panizza, G. Cerisola, J Hazard Mater., 153 (2008) 83-88.
14. M.T. Fukunaga, J.R. Guimarães, R. Bertazzoli, Chem Eng J., 136 (2008) 236-241.
15. M. Harikishore, M. Sandhyarani, K. Venkateswarlu, T.A. Nellaippan, N. Rameshbabu, Procedia
Mater Sci., 6 (2014) 557-566.
16. A. Hassanvand, M. Sohrabi, S.J. Royaee, M. Jafarikajour, Adv Mater Res., 875 (2014) 28-33
17. M. Zhang, C. Chen, Ma W, J. Zhao, Angew Chem., 120 (2008) 9876-9879.
18. E. Casbeer, V.K. Sharma, X.Z. Li, a review. Sep. Purif. Technol., 87 (2012) 1-14.
19. L.J.J. Janssen, L. Koene, Chem Eng J 85 (2002) 137-146.
20. L. Fan, Y. Zhou, W. Yang, G. Chen, F. Yang, Dyes Pig., 76 (2008) 440-446.
21. B.K. Körbahti, S. Taşyürek, Desalin Water Treat., 57 (2016) 2522-2533.
22. H.S. Kang, B.D. Ahn, J.H. Kim, G.H. Kim, S.H. Lim, H.W. Chang, S.Y. Lee, Appl Phy Lett., 88
(2006) 202108.
23. L. Shi, L.H. Reid, W.D. Jones, R. Shippy, J.A. Warrington, S.C. Baker, Y. Luo, Nature
Biotechnol., 24 (2006) 1151.
24. O.M. Ama, N. Mabuba, O.A. Arotiba, Electrocatalysis., 6 (2015) 390-397.
25. F. Zhang, Q. Zhao, X. Yan, H. Li, P. Zhang, L. Wang, L. Ding, Food Chem., 197 (2016) 943-949.

Int. J. Electrochem. Sci., Vol. 14, 2019
10001
26. T. Ndlovu, O.A. Arotiba, S. Sampath, R.W. Krause, B.B. Mamba, J Appl Electrochem., 41 (2011)
1389-1396.
27. C.A. Martinez-Huitle, S. Ferro, Chem Soci Rev., 35 (2006) 1324-1340.
28. M. Mazur,Electrochem Commun., 6 (2004) 400-403.
29. I. Capek, Adv. Colloid Interface Sci., 110 (2004) 49-74.
30. C.M. Fan, B. Hua, Y. Wang, Z.H. Liang, X.G. Hao, S.B. Liu, Y.P. Sun Desalination., 249 (2009)
736-741.
31. M. Tian, B. Adams, J. Wen, R.M. Asmussen, A. Chen, Electrochim Acta., 54 (2009) 3799-3805.
32. M. Tian, B. Adams, J. Wen, R.M. Asmussen, A. Chen, Electrochim Acta., 54 (2009) 3799-3805.
33. R.T. Pelegrini, R.S. Freire, N. Duran, R. Bertazzoli, Environ Sci Technol., 35 (2001) 2849-2853.
34. W.W. Anku, S.O.B. Oppong, S.K. Shukla, E.S. Agorku, P.P. Govender, Nat Sci-Mater., 26 (2016)
Pro 354-361.
35. M. Epifani, C. Giannini, L. Tapfer, L. Vasanelli, J Am Ceram Soc., 83 (2000) 2385-2393.
36. H.M. Yates, L.A. Brook, I.B. Ditta, P. Evans, H.A. Foster, D.W. Sheel, A. Steele J Photochem
Photobiol A Chem., 197 (2008) 197-205.
37. W.W. Anku, S.O.B. Oppong, S.K. Shukla, E.S. Agorku, P.P. Govender, Pro Nat Sci-Mater., 26
(2016) 354-361.
38. I.M. Clegg, N.J. Everall, B. King, Melvin H, C. Norton, Appl. Spectrosc., 55 (2001) 1138-1150.
39. B. Debelak, K. Lafdi, Carbon., 45 (2007) 1727-1734.
40. S. Rani, S. Verma, S. Kumar Appl Phys A., (2017) 123: 539.
41. S.N. Alam, L. Kumar, N. Sharma, Graphene., 4 (2015) 91.
42. X. Hao, Y. Quansheng, S. Dan., Y. Honghui, L. Jidong, F. Jiangtao, Y. Wei, J. Hazard. Mater., 286
(2015) 509-516.
43. Y.C. Yen, C.C. Lin, P.Y.Chen, W.Y. Ko, T.R. Tien, K.J. Lin, Royal Soc. Open Sci., 4 (2017)
161051.
44. Y. Zhou, W. Fang, Y. Deng, L. Pan, B. Shen, H. Li, J. Zhang, RSC Adv., 7 (2017) 55927-55934.
45. C. Wang, F. Wang, M. Xu, C. Zhu, W. Fang, Y. Wei, J Electroanal Chem., 759(2015) 158-166.
46. S.N. Alam, L. Kumar, N. Sharma, Graphene., 4 (2015) 91.
47. Y. Feng, G. Wang, J. Liao, W. Li, C. Chen, M. Li, Z. Li, Sci Rep., 7 (2017) 11622.
48. H.S. Kang, B.D. Ahn, J.H. Kim, G.H. Kim, S.H. Lim, H.W. Chang, S.Y. Lee, Appl Phys Lett., 88
(2006) 202108.
49. T. Santhi, S. Manonmani, Sustain Environ Res., 22 (2012) 45-51.
50. M.G. Peleyeju, E.H. Umukoro, J.O. Babalola, O.A. Arotiba, Electrocatalysis 2 (2016) 132–139.
51. S.O. Idowu, M.G. Peleyeju, F.O. Oladoyinbo, O. Adejare, A.A. Tajudeen, A.A. Hameed, A.A.
Omotayo, E.O. Dare, J Nanoanalysis., 4 (2017) 41-47.
52. O.M. Ama, O.A. Arotiba, Int J Nano Med Eng., 2 (2017) 145-151.
53. O.M. Ama, O.A. Arotiba, J. Electroanal. Chem., 803 (2017) 157-164.
54. E.H.Umukoro, G.M. Peleyeju, C.J. Ngila, O.A. Arotiba, Chem. Eng. J. 317 (2017) 290–301.
55. G.W. Smith, T. Salman, Can Metall Quart., 5 (1966) 93-107.
© 2019 The Authors. Published by ESG (www.electrochemsci.org). This article is an open access
article distributed under the terms and conditions of the Creative Commons Attribution license
(http://creativecommons.org/licenses/by/4.0/).