photoelectron imaging of vibrational autodetachment from nitromethane anions chris l. adams, holger...
TRANSCRIPT

Photoelectron Imaging of Vibrational Autodetachment from Nitromethane Anions
Chris L. Adams, Holger Schneider, J. Mathias Weber
JILA, University of Colorado, Boulder, CO 80309-0440
OSU International Symposium on Molecular Spectroscopy
June 23, 2009

Novel Approach to studying intramolecular vibrational relaxation (IVR).
Motivation

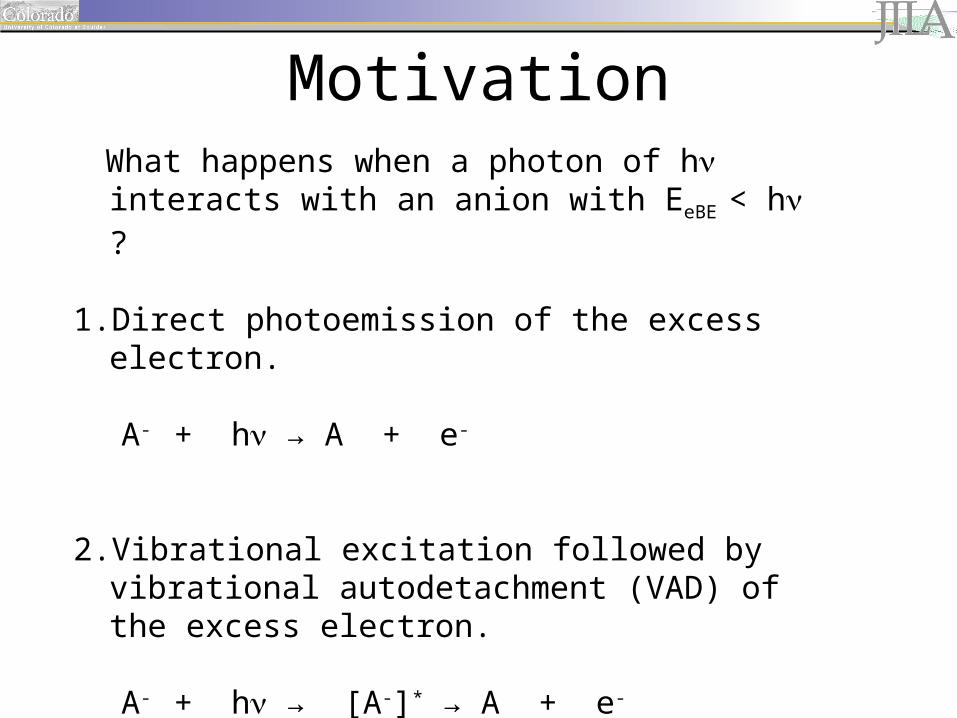
What happens when a photon of hn interacts with an anion with EeBE < hn ?
Motivation

What happens when a photon of hn interacts with an anion with EeBE < hn ?
1. Direct photoemission of the excess electron.
A- + hn → A + e-
Motivation
What happens when a photon of hn interacts with an anion with EeBE < hn ?
1. Direct photoemission of the excess electron.
A- + hn → A + e-
2. Vibrational excitation followed by vibrational autodetachment (VAD) of the excess electron.
A- + hn → [A-]* → A + e-
First example: NH- (Lineberger and coworkers, 1985)
Motivation
• The excess electron is largely localized on the nitro group.
Nitroalkane Anions: A Model System

Nitroalkane Anions: A Model System
• The excess electron is largely localized on the nitro group.

Nitroalkane Anions: A Model System
• The excess electron is largely localized on the nitro group.
• The fundamental CH vibrational transitions have energies in excess of the adiabatic electronic affinity (AEA) ~200 meV (1600 cm-1).
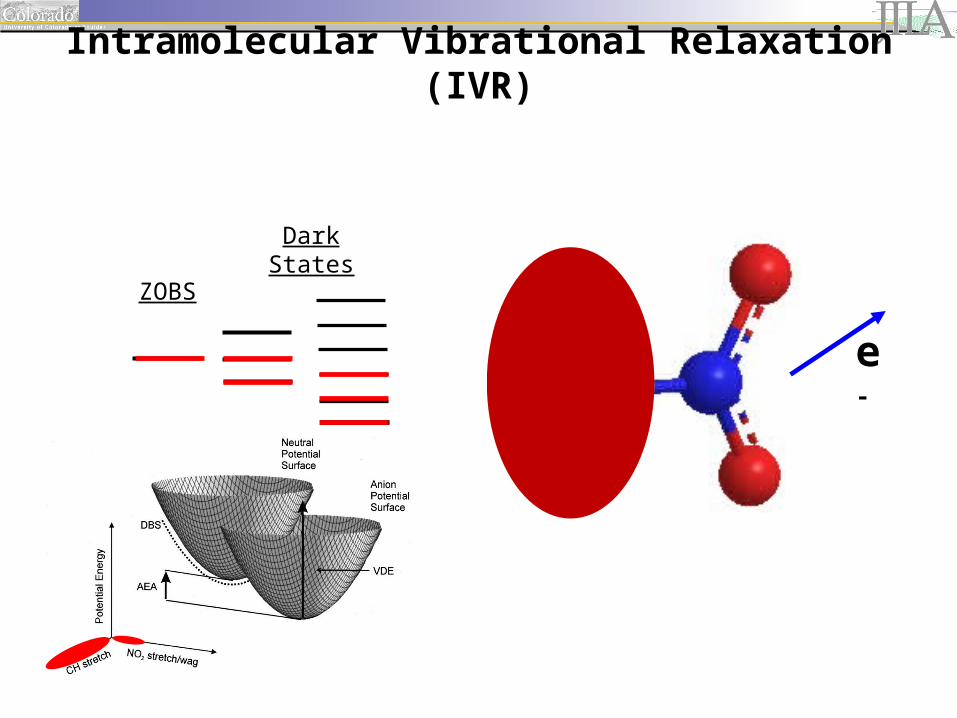
ZOBS
Dark States
Intramolecular Vibrational Relaxation (IVR)
e-

2800 3000 3200
0.0
0.5
1.0
1.5
2.0
2.5
Ph
oto
ne
utr
al Y
ield
Photon Energy (cm-1)
IR Spectrum of MeNO2-
Autodetachment spectrum CH3NO2
- + hn CH3NO2 + e-

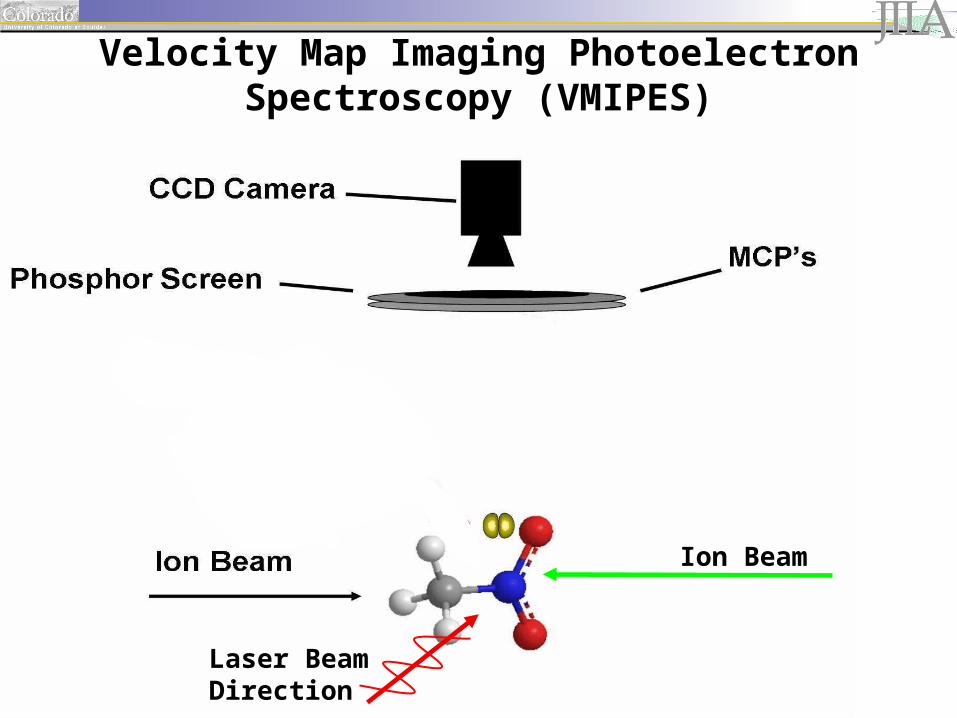
Ion Beam
Laser Beam Direction
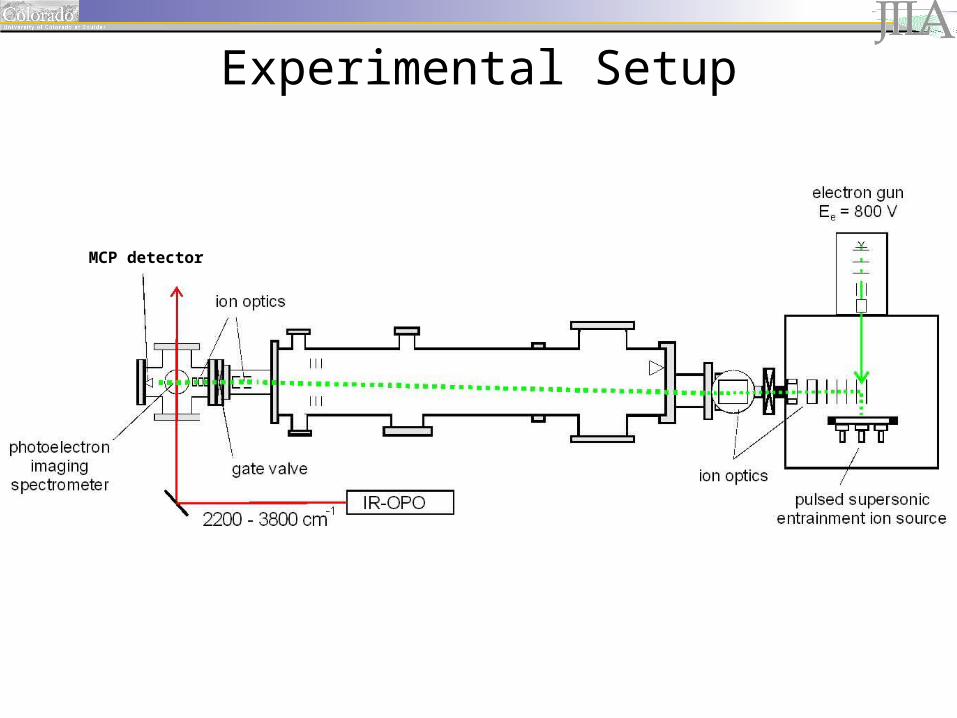
Velocity Map Imaging Photoelectron Spectroscopy (VMIPES)
0 50 100 150 200 250
Ph
oto
ele
ctro
n Y
ield
[arb
. un
its]
Pixels
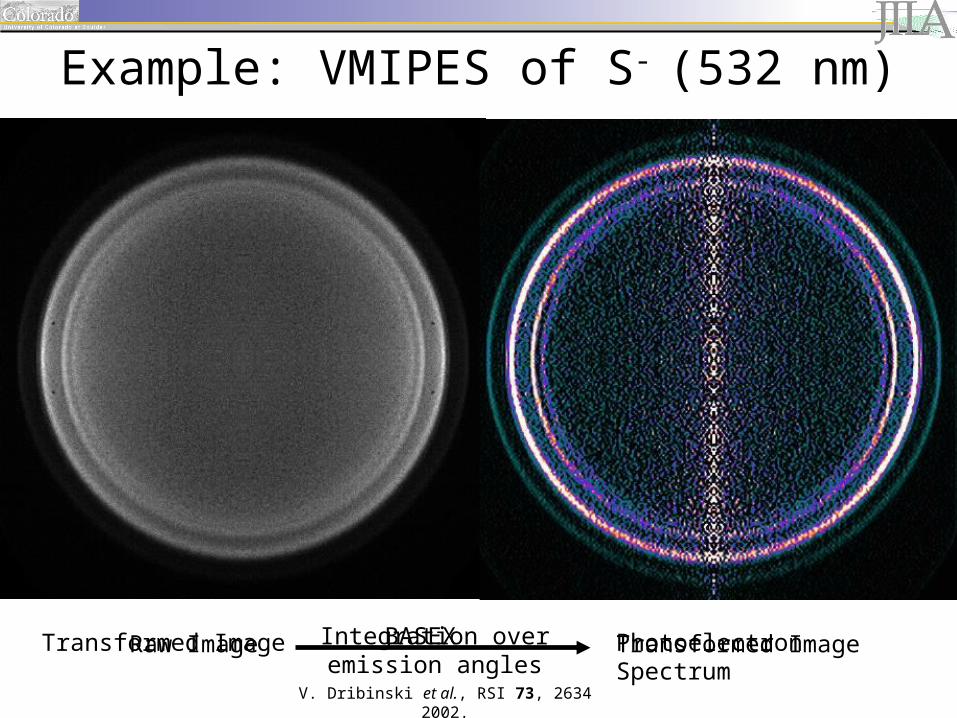
Raw Image Transformed ImageBASEXTransformed Image Integration over emission angles
Photoelectron Spectrum
Example: VMIPES of S- (532 nm)
V. Dribinski et al., RSI 73, 2634 2002.

2800 3000 3200
0.0
0.5
1.0
1.5
2.0
2.5
Ph
oto
ne
utr
al Y
ield
Photon Energy (cm-1)
IR Spectrum of MeNO2-
Autodetachment spectrum CH3NO2
- + hn CH3NO2 + e-

What do we expect from the direct photodetachment PES?

Ө = 14° Ө = 0°
Anion Neutral
What is the Geometry of the Anion and the Neutral?

•The wagging vibration of the neutral should give the most prominent vibrational progression in the PES.
Dominant FCF Active Modes

•The wagging vibration of the neutral should give the most prominent vibrational progression in the PES.
NO2 Wag ~ 655 cm-1 (81 meV )
Dominant FCF Active Modes

•The wagging vibration of the neutral should give the most prominent vibrational progression in the PES.
•Upon emission the methyl rotor goes from being hindered to a free rotor.
NO2 Wag ~ 655 cm-1 (81 meV )
Dominant FCF Active Modes

•The wagging vibration of the neutral should give the most prominent vibrational progression in the PES.
•Upon emission the methyl rotor goes from being hindered to a free rotor.
NO2 Wag ~ 655 cm-1 (81 meV )
Dominant FCF Active Modes

0 100 200 300 400
Phot
oele
ctro
n Yi
eld
Binding Energy [meV]
1MeNO2- at 3200 cm-1

0 50 100 150 200 250 300 350 400
Binding Energy [meV]
Pho
toel
ectron
Yie
ld
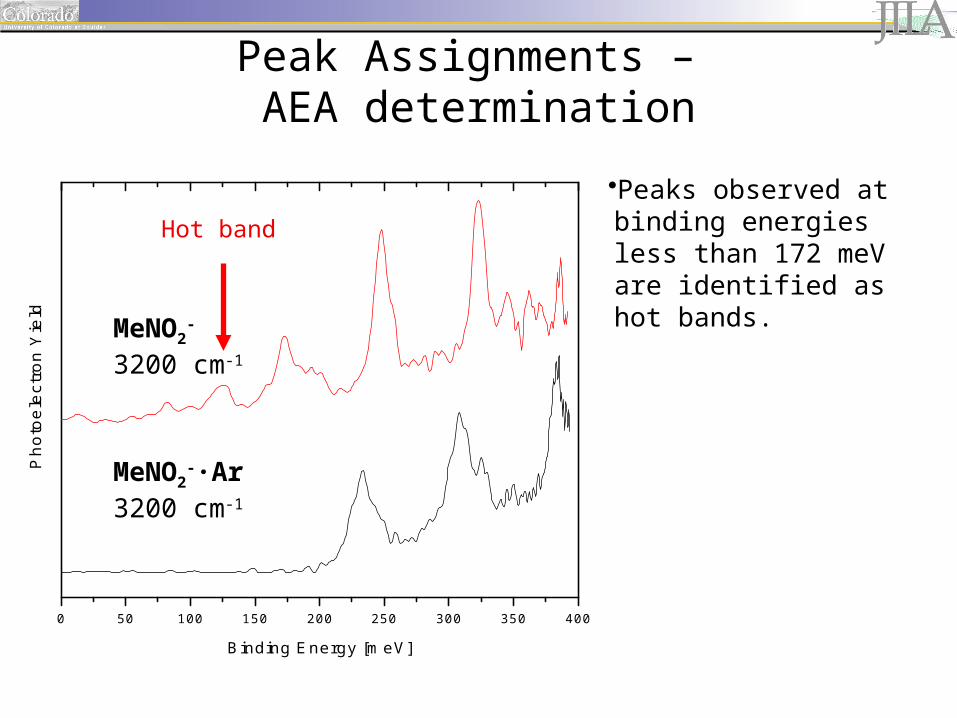
MeNO2-·Ar
3200 cm-1
MeNO2-
3200 cm-1
Peak Assignments – AEA determination
•Peaks are spaced by~ 645 cm-1 (80 meV), corresponding to the wagging motion of the neutral.

0 50 100 150 200 250 300 350 400
Binding Energy [meV]
Pho
toel
ectron
Yie
ld
•Peaks are spaced by~ 645 cm-1 (80 meV), corresponding to the wagging motion of the neutral.
•The first prominent peak, located at (172±6) meV, is identified as the origin of the vibrational progression (vanion=0, vneutral=0).
Peak Assignments – AEA determination
MeNO2-·Ar
3200 cm-1
MeNO2-
3200 cm-1

0 50 100 150 200 250 300 350 400
Binding Energy [meV]
Pho
toel
ectron
Yie
ld
•Peaks are spaced by~ 645 cm-1 (80 meV), corresponding to the wagging motion of the neutral.
•The first prominent peak, located at (172±6) meV, is identified as the origin of the vibrational progression (vanion=0, vneutral=0).
• Argon solvation shifts the vibrational progression by ~63 meV (508 cm-1).
Peak Assignments – AEA determination
MeNO2-·Ar
3200 cm-1
MeNO2-
3200 cm-1
0 50 100 150 200 250 300 350 400
Binding Energy [meV]
Pho
toel
ectron
Yie
ld
Hot band
Peak Assignments – AEA determination
•Peaks observed at binding energies less than 172 meV are identified as hot bands.
MeNO2-·Ar
3200 cm-1
MeNO2-
3200 cm-1

0 50 100 150 200 250 300 350 400
Binding Energy [meV]
Pho
toel
ectron
Yie
ld
Peak Assignments – AEA determination
•Peaks observed at binding energies less than 172 meV are identified as hot bands.
•The difference in binding energies of the hot band and origin of the vibrational progression matches the energy of the anionic wag.MeNO2
-·Ar3200 cm-1
MeNO2-
3200 cm-1

0 50 100 150 200 250 300 350 400
Binding Energy [meV]
Pho
toel
ectron
Yie
ld
•Peaks observed at binding energies less than 172 meV are identified as hot bands.
•The difference in binding energies of the hot band and origin of the vibrational progression matches the energy of the anionic wag.
•The hot bands are suppressed upon Ar solvation.
Peak Assignments – AEA determination
MeNO2-·Ar
3200 cm-1
MeNO2-
3200 cm-1

Comparison of Experiment and Theory
0 100 200 300 400
electron binding energy [meV]
Franck-Condon Simulation (PESCAL)by Kent M. Ervin
• B3LYP/6-311++G(2df,2p) for anion and neutral geometries
• Independent Harmonic Oscillator Approximation with Duschinsky rotation
• 14 vibrational modes treated in simulation
• CH3 torsion treated separately

-400 -200 0 200 400
phot
oele
ctro
n yi
eld
[ar.
units
]
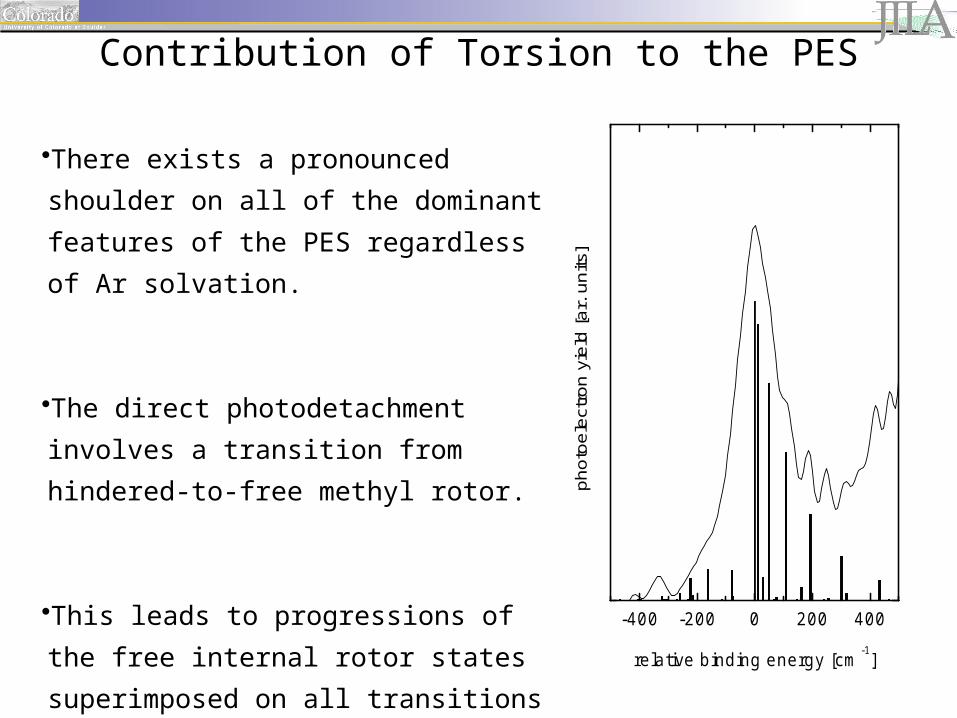
relative binding energy [cm-1]
•There exists a pronounced shoulder on all
of the dominant features of the PES
regardless of Ar solvation.
Contribution of Torsion to the PES

-400 -200 0 200 400
phot
oele
ctro
n yi
eld
[ar.
units
]
relative binding energy [cm-1]
•There exists a pronounced shoulder on all
of the dominant features of the PES
regardless of Ar solvation.
•The direct photodetachment involves a
transition from hindered-to-free methyl
rotor.
Contribution of Torsion to the PES
-400 -200 0 200 400
phot
oele
ctro
n yi
eld
[ar.
units
]
relative binding energy [cm-1]
•There exists a pronounced shoulder on all
of the dominant features of the PES
regardless of Ar solvation.
•The direct photodetachment involves a
transition from hindered-to-free methyl
rotor.
•This leads to progressions of the free
internal rotor states superimposed on all
transitions
Contribution of Torsion to the PES

2700 2800 2900 3000
ph
oto
ne
utr
al y
ield
[a
rb. u
nits
]
photon energy [cm-1]
CH Stretching Vibrations
ν13 = 2775 cm-1
ν14= 2922 cm-1
ν15= 2965 cm-1
n14 n15
n13
Autodetachment spectrum CH3NO2
- + hn CH3NO2 + e-
IR Spectrum of MeNO2-

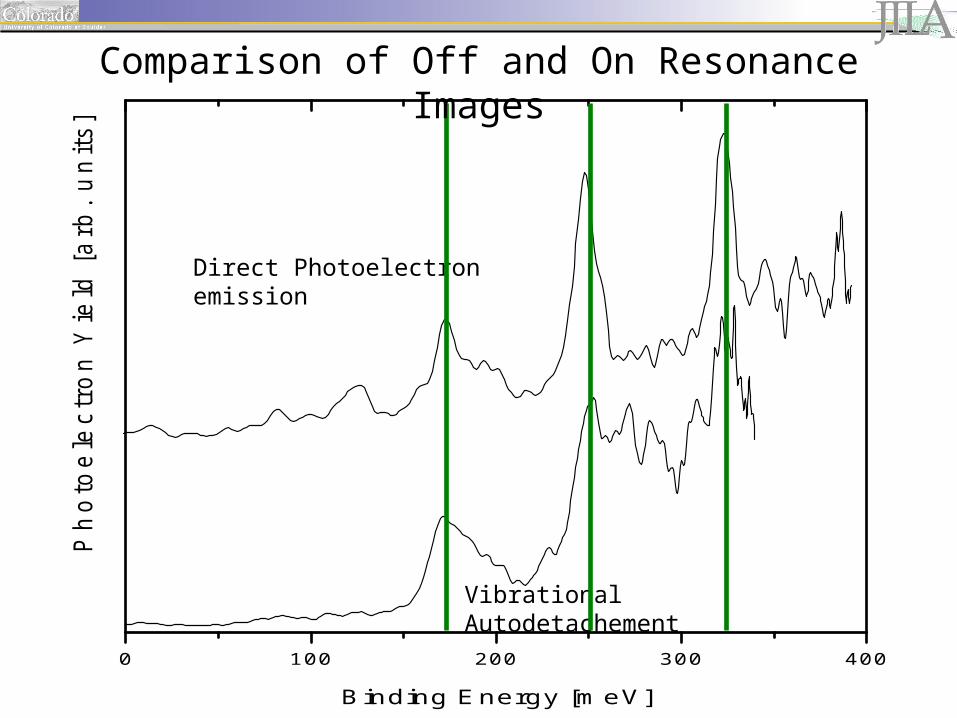
Vibrational Autodetachement Direct Photoelectron Emission
Comparison of Off and On Resonance Images

0 100 200 300 400
P
ho
toe
lectr
on
Yie
ld [a
rb. u
nits]
Binding Energy [meV]
Vibrational Autodetachement
Direct Photoelectron emission
Comparison of Off and On Resonance Images
0 100 200 300 400
P
ho
toe
lectr
on
Yie
ld [a
rb. u
nits]
Binding Energy [meV]
Vibrational Autodetachement
Direct Photoelectron emission
Comparison of Off and On Resonance Images

0 40 80 120 160
po
pu
latio
n [
arb
. u
nits]
energy left in neutral [meV]
On-Resonance Interpretation
Both on-resonant and direct detachment contributions
® subtract contribution of direct photodetachment
0 100 200 300 400
Ph
oto
ele
ctr
on
Yie
ld
Binding Energy [meV]
0 100 200 300 400
Pho
toel
ectr
on Y
ield
Binding Energy [meV]

Compare with vibrational states of the neutral, neglecting torsion
Without Torsion
On-Resonance Interpretation
0 40 80 120 160
po
pu
latio
n [
arb
. u
nits]
energy left in neutral [meV]

0 40 80 120 160
po
pu
latio
n [
arb
. u
nits]
energy left in neutral [meV]
With Torsion
On-Resonance Interpretation
Compare with vibrational states of the neutral, including torsion

0 40 80 120 160
popula
tion [arb
. units]
energy left in neutral [meV]
Inconsistencies with purely statistical argument.• Some states preferentially occupied• Nonstatistical population
With Torsion
On-Resonance Interpretation
• Considerable differences between direct detachment and
vibrational autodetachment
Summary

• Considerable differences between direct detachment and
vibrational autodetachment
• Redistribution of vibrational energy before electron emission
Summary

• Considerable differences between direct detachment and
vibrational autodetachment
• Redistribution of vibrational energy before electron emission
• Retention of vibrational energy in the molecule, leading to
emission
of low-energy electrons.
Summary

• Considerable differences between direct detachment and
vibrational autodetachment
• Redistribution of vibrational energy before electron emission
• Retention of vibrational energy in the molecule, leading to
emission
of low-energy electrons.
• Methyl torsion very important for IVR
Summary
Continue the study with the larger nitroalkane chains:
Summary

Continue the study with the larger nitroalkane chains:
• Determine AEA and assign the vibrational features in the direct photodetachment spectra
Summary

Continue the study with the larger nitroalkane chains:
• Determine AEA and assign the vibrational features in the direct photodetachment spectra
• Monitor the evolution of the VAD PES as the site of initial excitation is moved further away from the nitro group
Summary

Acknowledgements
Mathias Weber
Holger Schneider
Jesse Marcum
Kent Ervin (UN Reno)
Carl Lineberger
and the Lineberger Lab

0 25 50 75 100 125
0
20
40
60
Inte
nsi
ty [a
rb. u
nits]
Energy Left in Neutral Molecule [meV]
On-Resonance Interpretation
NO2 rocking (475 cm-1)
NO2 Wag (603 cm-1)
NO2 Scissor (657 cm-1)
CN stretch (918 cm-1)
2 quanta NO2 rocking (475X2 cm-1)
1 quanta NO2 rocking (475 cm-1) and 1 quanta NO2 Wag (603 cm-1)
CH3 rocking (1096 cm-1)
1 quanta NO2 rocking (475 cm-1) and 1 quanta NO2 Scissor (657 cm-1)

Averaging in the Lab Frame along the Transition Dipole of the CH Stretch Vibration (2775 cm-1)