photogrammetric and gis techniques for the development … · photogrammetric and gis techniques...
TRANSCRIPT
Photogrammetric and GIS techniques for the development
of vegetation databases of mountainous areas:
Great Smoky Mountains National Park
Roy Welch*, Marguerite Madden, Thomas Jordan
Center for Remote Sensing and Mapping Science (CRMS), Department of Geography, The University of Georgia, Athens, GA 30602 USA
Received 15 January 2002; accepted 23 August 2002
Abstract
Detailed vegetation databases and associated maps of the Great Smoky Mountains National Park, a rugged, forested area of
more than 2000 km2, were constructed to support resource management activities of the U.S. National Park Service (NPS).
These detailed vegetation databases and associated maps have a terrain relief exceeding 1700 m and a continuous forest cover
over 95% of the Park. The requirement to use 1:12,000- and 1:40,000-scale color infrared aerial photographs as the primary data
source for mapping overstory and understory vegetation, respectively, necessitated the integration of analog photointerpretation
with both digital softcopy photogrammetry and geographic information system (GIS) procedures to overcome problems
associated with excessive terrain relief and a lack of ground control. Applications of the vegetation database and associated
large-scale maps include assessments of vegetation patterns related to management activities and quantification of forest fire
fuels.
D 2002 Elsevier Science B.V. All rights reserved.
Keywords: vegetation mapping; softcopy photogrammetry; GIS; mountainous terrain; fuel modeling
1. Introduction
The Appalachian Mountain chain in eastern United
States reaches elevations of over 2000 m and extends
for more than 2000 km from Maine in the northeast to
Alabama in the southeast (Fig. 1a). Much of this scenic
region is under the jurisdiction of the Federal Govern-
ment and the 14 states through which the chain passes.
One very rugged area, the Great Smoky Mountains
National Park, which encompasses approximately
2070 km2 of continuous forest cover with few roads,
but over 1290 km of hiking trails, is located along the
North Carolina–Tennessee border in southeastern
United States (Fig. 1b). This national park receives
as many as 10 million visitors each year, contains one
of the most diverse collection of plants and animals in
the world and has been designated as an International
Biosphere Reserve and a World Heritage Site.
Although the Great Smoky Mountains National
Park was mapped at 1:24,000 scale by the U.S. Geo-
logical Survey (USGS) in the 1960s and 1970s, these
topographic maps, while essential, do not provide the
detailed information and flexibility required to manage
0924-2716/02/$ - see front matter D 2002 Elsevier Science B.V. All rights reserved.
PII: S0924 -2716 (02 )00118 -1
* Corresponding author.
E-mail address: [email protected] (R. Welch).
www.elsevier.com/locate/isprsjprs
ISPRS Journal of Photogrammetry & Remote Sensing 57 (2002) 53–68
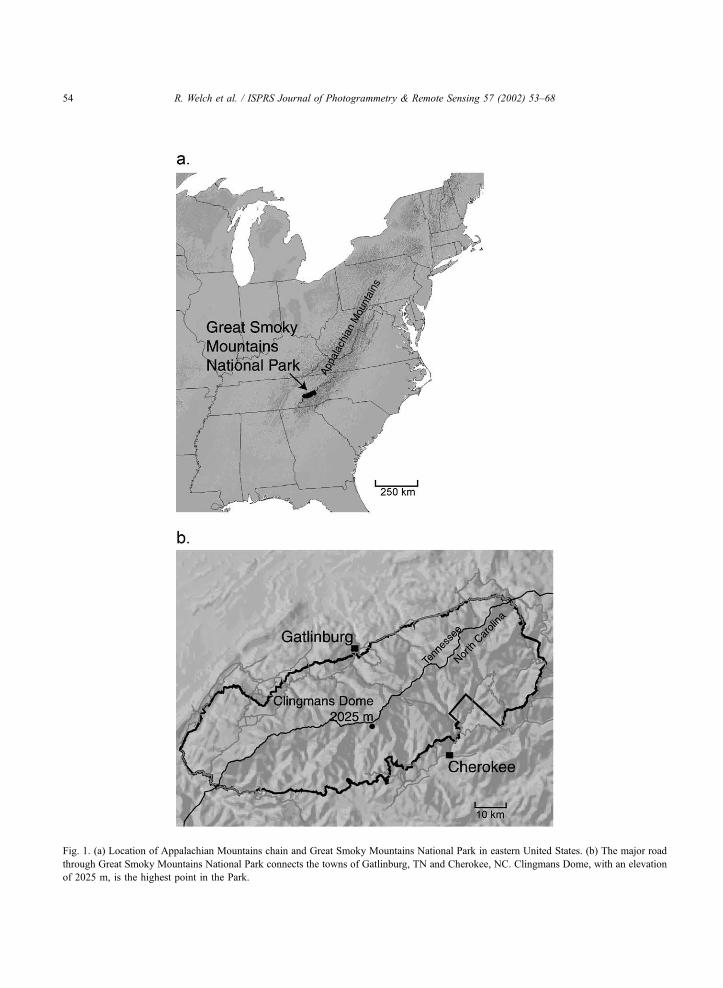
Fig. 1. (a) Location of Appalachian Mountains chain and Great Smoky Mountains National Park in eastern United States. (b) The major road
through Great Smoky Mountains National Park connects the towns of Gatlinburg, TN and Cherokee, NC. Clingmans Dome, with an elevation
of 2025 m, is the highest point in the Park.
R. Welch et al. / ISPRS Journal of Photogrammetry & Remote Sensing 57 (2002) 53–6854

the Park, protect it from threats due to fire and pop-
ulation pressure or to monitor changes caused by air
pollution and invasive exotic plants and animals. These
problems at Great SmokyMountains National Park and
other parks have led the USGS and the U.S. National
Park Service (NPS) to sponsor the development of
detailed vegetation databases in digital format from
remotely sensed data that can be used in a geographic
information system (GIS) environment to create large-
scale map products and conduct analyses of change
(Welch et al., 1995, 1999, 2000; USGS, 2002).
The objectives of this paper are to demonstrate: (1)
how digital photogrammetry, photointerpretation and
GIS techniques were refined, adapted and integrated
to permit the construction of a geocoded vegetation
database from more than 1000 large-scale aerial
photographs of the rugged, high relief Great Smoky
Mountains National Park; and (2) the possibilities for
undertaking GIS analyses of vegetation and the devel-
opment of fuel models for the management and
control of forest fires. Because Great Smoky Moun-
tains National Park is considered one of the most
difficult terrain areas to map in the United States due
to high relief and nearly continuous forest cover, it is
envisioned that the techniques discussed below can be
modified as necessary and applied to rugged and
remote forested lands in other areas of the world.
2. Study area
Great Smoky Mountains National Park was estab-
lished in 1934 in an attempt to halt the damage to
forests caused by erosion and fires associated with
logging activities of the 1800s and early 1900s (Houk,
2000). By the 1920s, nearly two-thirds of the lands
that would become Great Smoky Mountains National
Park had been logged or burned. The Park now
protects a large tract of forestland within the southern
Appalachian Mountains—among the oldest mountain
ranges on earth. Elevations in Great Smoky Moun-
tains National Park range from approximately 250 m
along the outside boundary of the Park up to 2025 m
at Clingmans Dome (Figs. 1b and 2). Rock formations
in the region are sedimentary, the result of silt, sand
and gravel deposits into a shallow sea that covered the
area approximately 600 million years ago (Moore,
1988). More than 900 km of streams and rivers that
flow within the Park are replenished by over 200 cm
of rainfall per year. High rates of evaporation and
transpiration of moisture through the leaves of the
Park’s vast forest produce a blue haze from which the
Smoky Mountains gets its name.
Environmental conditions within Great Smoky
Mountains National Park result in a variety of habitats
that support a high diversity of mountain flora and
fauna. More than 1570 species of flowering plants,
10% of which are considered rare, and over 4000
species of nonflowering plants are found in the Park
(Walker, 1991). The forestlands include over 100
different species of trees and contain the most exten-
sive virgin hardwood forest in the eastern United
States (Kemp, 1993).
Scientists estimate that the flora and fauna cur-
rently identified in the Park represent only 10% of the
species documented to date (Kaiser, 1999). In order to
discover the full range of life in Great Smoky Moun-
tains National Park, an ambitious project led by the
National Park Service and a nonprofit organization,
Discover Life, is underway. Known as the All Taxa
Biodiversity Inventory (ATBI), the project aims to
identify every life form in the Park (possibly over
100,000 species) over the next 10–15 years (White
and Morse, 2000). The efforts of ATBI participants
rely heavily on map information in order to locate
various habitats, conduct fieldwork and establish
sample plots.
Natural resource managers at Great Smoky Moun-
tains National Park realized early on the value of
producing a detailed vegetation database that could
be used to map habitats and aid researchers in their
quest for identifying new mountain species. They
also required a vegetation database for providing
baseline information for future monitoring and man-
agement tasks. Facing threats by air pollution, inva-
sive exotic plants and animals, large numbers of Park
visitors and forest fires, Park managers needed
analysis tools to assist them in the preservation of
valuable resources. Consequently, in 1999, the Cen-
ter for Remote Sensing and Mapping Science at
the University of Georgia entered into a cooperative
agreement with the NPS to create a detailed digital
database for Great Smoky Mountains National Park
that includes both overstory and understory vegeta-
tion and an analysis of fuels that can cause forest
fires in the Park.
R. Welch et al. / ISPRS Journal of Photogrammetry & Remote Sensing 57 (2002) 53–68 55
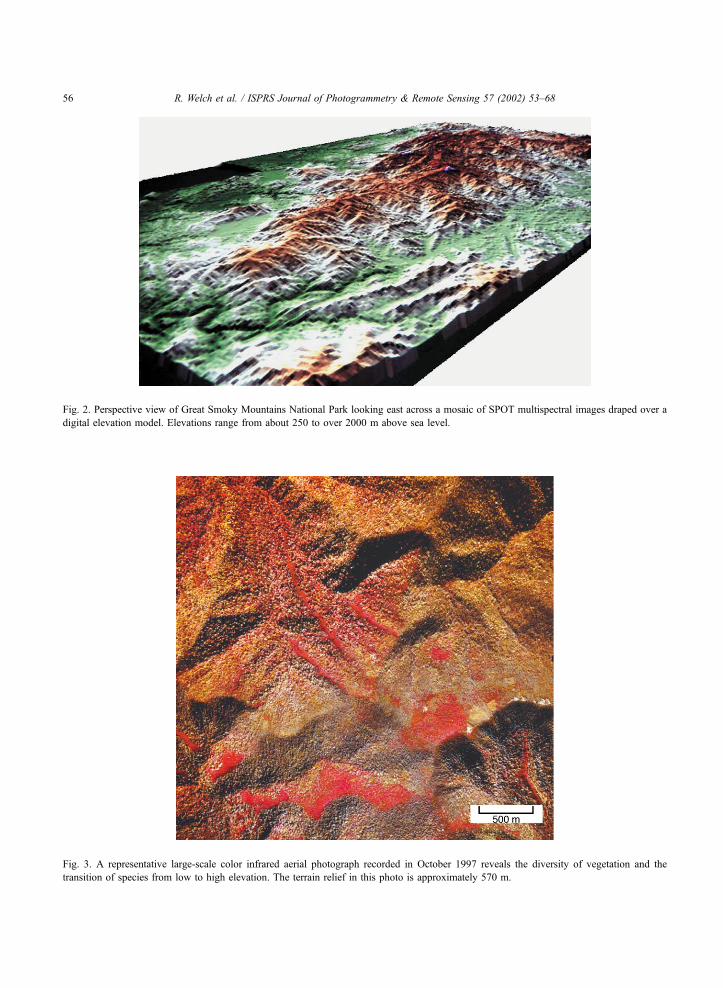
Fig. 2. Perspective view of Great Smoky Mountains National Park looking east across a mosaic of SPOT multispectral images draped over a
digital elevation model. Elevations range from about 250 to over 2000 m above sea level.
Fig. 3. A representative large-scale color infrared aerial photograph recorded in October 1997 reveals the diversity of vegetation and the
transition of species from low to high elevation. The terrain relief in this photo is approximately 570 m.
R. Welch et al. / ISPRS Journal of Photogrammetry & Remote Sensing 57 (2002) 53–6856
3. Methodology
The main requirement for the project was to
produce a vegetation database and associated maps
in vector format that contained polygons for over 100
overstory and 70 understory plant communities plot-
ted to within approximately F 5 to F 10 m of their
true ground locations. Overstory vegetation was to be
mapped using more than 1000 color infrared aerial
photographs of 1:12,000 scale in film transparency
format recorded from a flying height of approximately
1800 m for the NPS by a commercial contractor
(using a Wild RC20 photogrammetric camera, f = 15
cm) in late October of 1997 and 1998 when the leaves
were still on the trees (leaf-on) and displayed a color
diversity that allowed the vegetation communities/
species to be identified (Table 1, Fig. 3). Displace-
ments due to terrain relief were a major problem, in
some cases reaching more than 40 mm on the
23� 23-cm format photographs. Unfortunately, the
photographs were acquired before the Center for
Remote Sensing and Mapping Science became
involved in the project and little, if any, consideration
appeared to have been given to terrain relief in
relation to mapping and/or GIS database construction.
The understory vegetation was less complex than
the overstory vegetation and could be mapped sepa-
rately from available 1:40,000-scale color infrared pho-
tographs recorded (with a Wild RC30 camera, f= 15
cm) in the early spring of 1998 as part of the USGS
National Aerial Photography Program (NAPP). At that
time of year, deciduous trees have lost their leaves
(leaf-off) and it is possible to delineate the understory
evergreen shrubs and trees that are both combustible
and sufficiently dense to restrict crews combating fires
or conducting search and rescue missions.
With the dense forest cover, steep slopes, absence
of ground control and relief often exceeding 30% of
the flying height for the 1:12,000-scale photographic
coverage, the construction of a vegetation database
accurate in both the spatial and thematic context
necessitated a combination of softcopy photogramme-
try, photointerpretation and GIS procedures organized
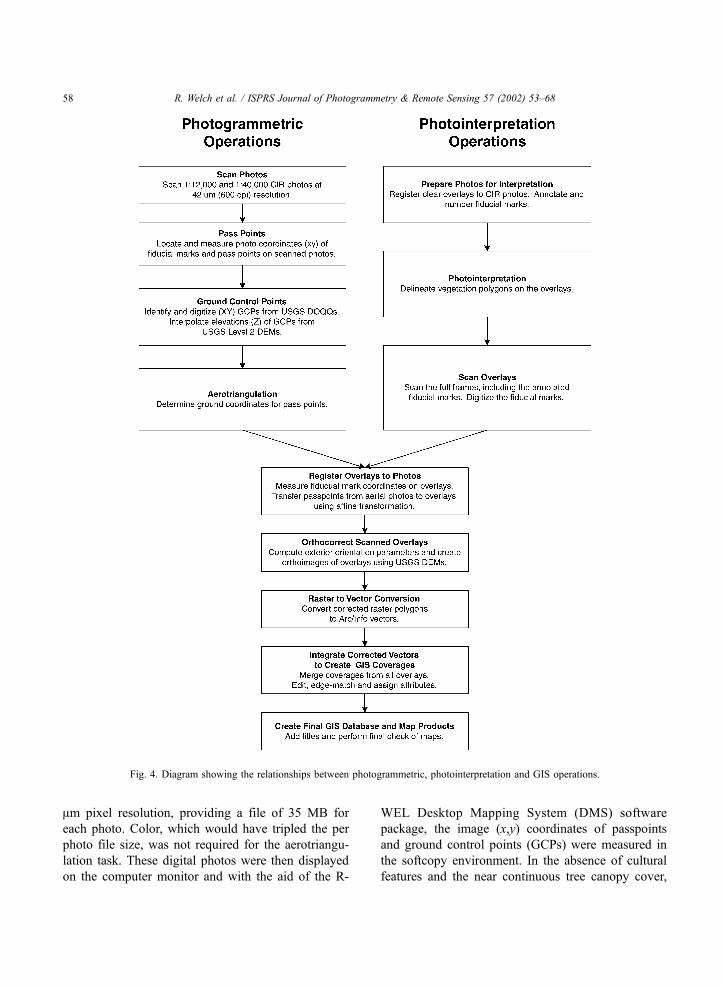
in parallel as shown in Fig. 4. These are discussed
below.
3.1. Photogrammetric operations
The main objective of the photogrammetric proce-
dure was to densify the sparse ground control in the
Park by means of aerotriangulation. At the outset, the
1:12,000-scale color infrared film transparencies were
scanned using an Epson Expression 836xl desktop
scanner to create black and white digital photos of 42-
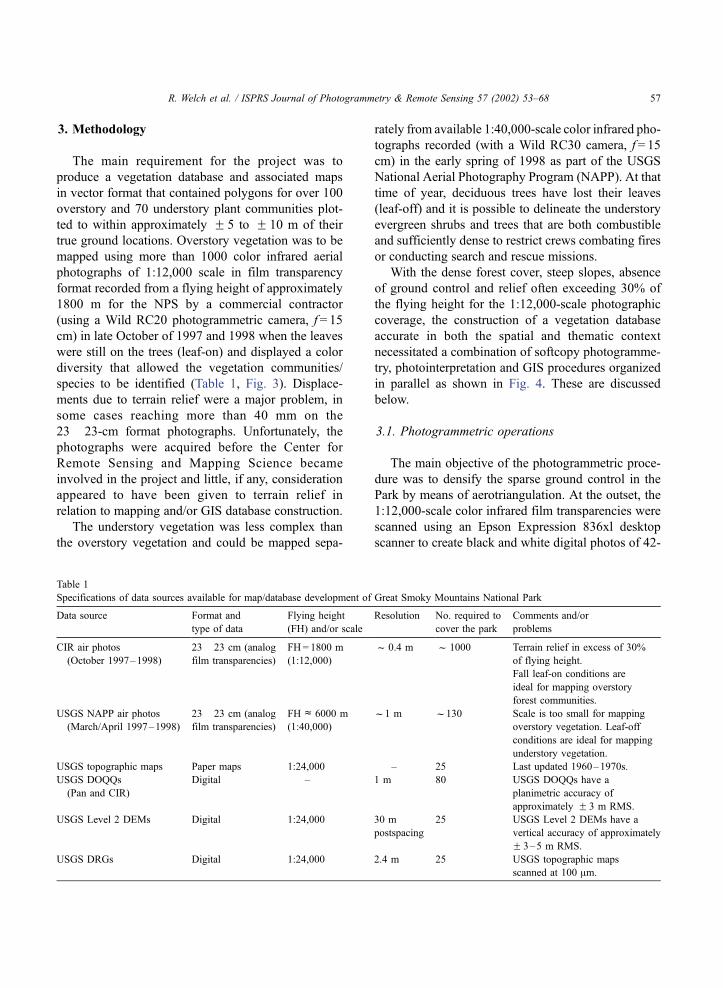
Table 1
Specifications of data sources available for map/database development of Great Smoky Mountains National Park
Data source Format and
type of data
Flying height
(FH) and/or scale
Resolution No. required to
cover the park
Comments and/or
problems
CIR air photos
(October 1997–1998)
23� 23 cm (analog
film transparencies)
FH= 1800 m
(1:12,000)
f 0.4 m f 1000 Terrain relief in excess of 30%
of flying height.
Fall leaf-on conditions are
ideal for mapping overstory
forest communities.
USGS NAPP air photos
(March/April 1997–1998)
23� 23 cm (analog
film transparencies)
FHc 6000 m
(1:40,000)
f1 m f130 Scale is too small for mapping
overstory vegetation. Leaf-off
conditions are ideal for mapping
understory vegetation.
USGS topographic maps Paper maps 1:24,000 – 25 Last updated 1960–1970s.
USGS DOQQs
(Pan and CIR)
Digital – 1 m 80 USGS DOQQs have a
planimetric accuracy of
approximately F 3 m RMS.
USGS Level 2 DEMs Digital 1:24,000 30 m
postspacing
25 USGS Level 2 DEMs have a
vertical accuracy of approximately
F 3–5 m RMS.
USGS DRGs Digital 1:24,000 2.4 m 25 USGS topographic maps
scanned at 100 Am.
R. Welch et al. / ISPRS Journal of Photogrammetry & Remote Sensing 57 (2002) 53–68 57
Am pixel resolution, providing a file of 35 MB for
each photo. Color, which would have tripled the per
photo file size, was not required for the aerotriangu-
lation task. These digital photos were then displayed
on the computer monitor and with the aid of the R-
WEL Desktop Mapping System (DMS) software
package, the image (x,y) coordinates of passpoints
and ground control points (GCPs) were measured in
the softcopy environment. In the absence of cultural
features and the near continuous tree canopy cover,
Fig. 4. Diagram showing the relationships between photogrammetric, photointerpretation and GIS operations.
R. Welch et al. / ISPRS Journal of Photogrammetry & Remote Sensing 57 (2002) 53–6858
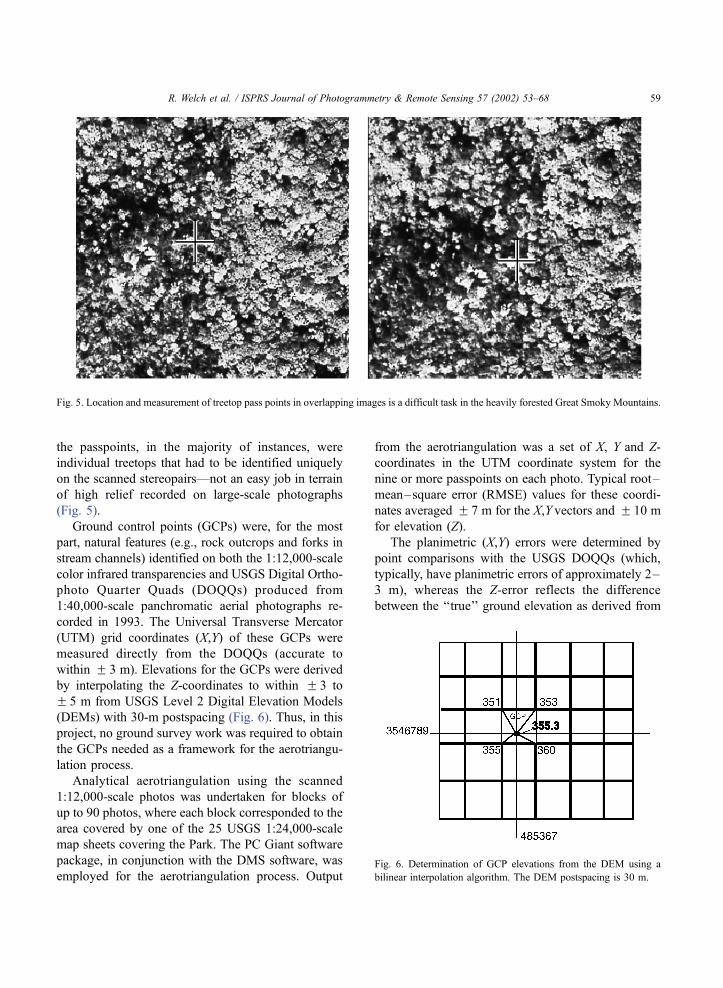
the passpoints, in the majority of instances, were
individual treetops that had to be identified uniquely
on the scanned stereopairs—not an easy job in terrain
of high relief recorded on large-scale photographs
(Fig. 5).
Ground control points (GCPs) were, for the most
part, natural features (e.g., rock outcrops and forks in
stream channels) identified on both the 1:12,000-scale
color infrared transparencies and USGS Digital Ortho-
photo Quarter Quads (DOQQs) produced from
1:40,000-scale panchromatic aerial photographs re-
corded in 1993. The Universal Transverse Mercator
(UTM) grid coordinates (X,Y) of these GCPs were
measured directly from the DOQQs (accurate to
within F 3 m). Elevations for the GCPs were derived
by interpolating the Z-coordinates to within F 3 to
F 5 m from USGS Level 2 Digital Elevation Models
(DEMs) with 30-m postspacing (Fig. 6). Thus, in this
project, no ground survey work was required to obtain
the GCPs needed as a framework for the aerotriangu-
lation process.
Analytical aerotriangulation using the scanned
1:12,000-scale photos was undertaken for blocks of
up to 90 photos, where each block corresponded to the
area covered by one of the 25 USGS 1:24,000-scale
map sheets covering the Park. The PC Giant software
package, in conjunction with the DMS software, was
employed for the aerotriangulation process. Output
from the aerotriangulation was a set of X, Y and Z-
coordinates in the UTM coordinate system for the
nine or more passpoints on each photo. Typical root–
mean–square error (RMSE) values for these coordi-
nates averaged F 7 m for the X,Y vectors and F 10 m
for elevation (Z).
The planimetric (X,Y) errors were determined by
point comparisons with the USGS DOQQs (which,
typically, have planimetric errors of approximately 2–
3 m), whereas the Z-error reflects the difference
between the ‘‘true’’ ground elevation as derived from
Fig. 5. Location and measurement of treetop pass points in overlapping images is a difficult task in the heavily forested Great Smoky Mountains.
Fig. 6. Determination of GCP elevations from the DEM using a
bilinear interpolation algorithm. The DEM postspacing is 30 m.
R. Welch et al. / ISPRS Journal of Photogrammetry & Remote Sensing 57 (2002) 53–68 59
the USGS Level 2 DEMs and the treetops which
correspond to the passpoints. Consequently, it must
be noted that: (1) the elevation errors computed for the
passpoints are much less than 10 m; and (2) Z-
coordinate errors of a few metres at the passpoints
have no noticeable influence on planimetric accuracy
or the production of orthophotos—which were the
only issues of significant concern.
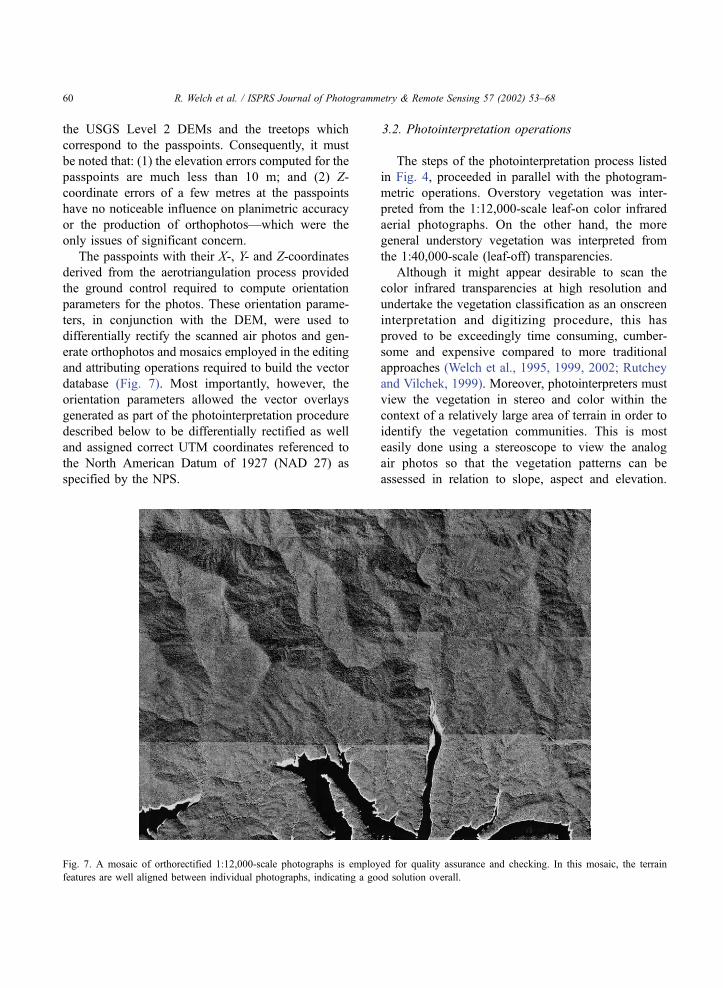
The passpoints with their X-, Y- and Z-coordinates
derived from the aerotriangulation process provided
the ground control required to compute orientation
parameters for the photos. These orientation parame-
ters, in conjunction with the DEM, were used to
differentially rectify the scanned air photos and gen-
erate orthophotos and mosaics employed in the editing
and attributing operations required to build the vector
database (Fig. 7). Most importantly, however, the
orientation parameters allowed the vector overlays
generated as part of the photointerpretation procedure
described below to be differentially rectified as well
and assigned correct UTM coordinates referenced to
the North American Datum of 1927 (NAD 27) as
specified by the NPS.
3.2. Photointerpretation operations
The steps of the photointerpretation process listed
in Fig. 4, proceeded in parallel with the photogram-
metric operations. Overstory vegetation was inter-
preted from the 1:12,000-scale leaf-on color infrared
aerial photographs. On the other hand, the more
general understory vegetation was interpreted from
the 1:40,000-scale (leaf-off) transparencies.
Although it might appear desirable to scan the
color infrared transparencies at high resolution and
undertake the vegetation classification as an onscreen
interpretation and digitizing procedure, this has
proved to be exceedingly time consuming, cumber-
some and expensive compared to more traditional
approaches (Welch et al., 1995, 1999, 2002; Rutchey
and Vilchek, 1999). Moreover, photointerpreters must
view the vegetation in stereo and color within the
context of a relatively large area of terrain in order to
identify the vegetation communities. This is most
easily done using a stereoscope to view the analog
air photos so that the vegetation patterns can be
assessed in relation to slope, aspect and elevation.
Fig. 7. A mosaic of orthorectified 1:12,000-scale photographs is employed for quality assurance and checking. In this mosaic, the terrain
features are well aligned between individual photographs, indicating a good solution overall.
R. Welch et al. / ISPRS Journal of Photogrammetry & Remote Sensing 57 (2002) 53–6860
Recognizing the need to augment manual procedures
with automated techniques, the steps described below
integrate conventional photointerpretation procedures
with digital processing technology in an attempt to
streamline the database and map compilation process.
At the beginning of the Great Smoky Mountains
National Park mapping project, the photointerpreters,
in conjunction with NPS plant specialists, conducted
field investigations to collect data on the forest com-
munities and correlate signatures evident on the color
infrared aerial photographs with ground observations.
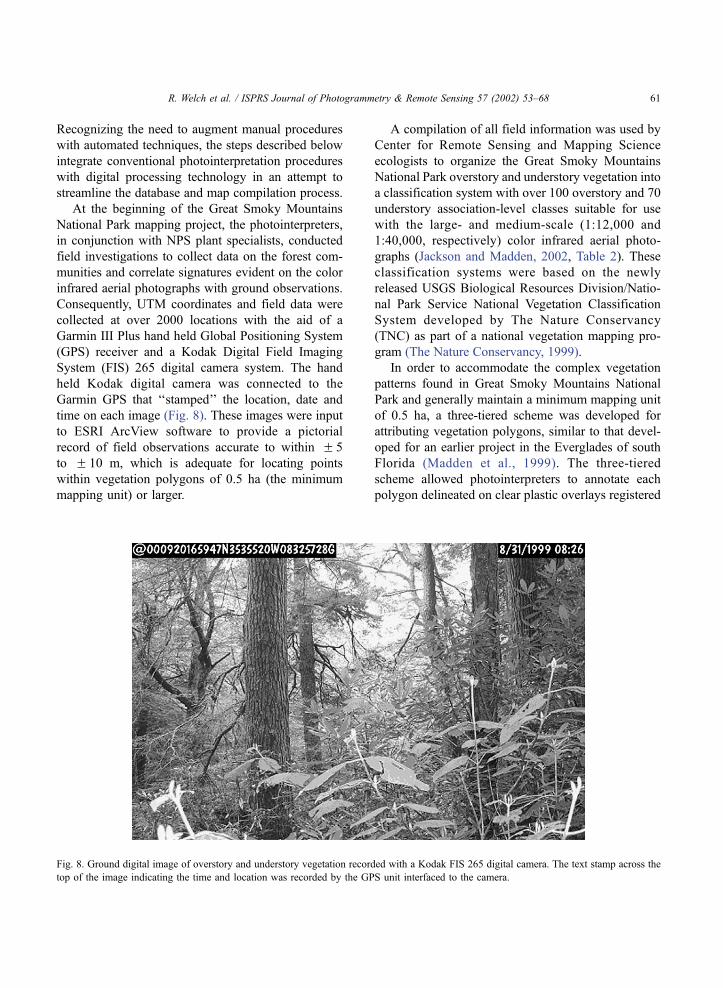
Consequently, UTM coordinates and field data were
collected at over 2000 locations with the aid of a
Garmin III Plus hand held Global Positioning System
(GPS) receiver and a Kodak Digital Field Imaging
System (FIS) 265 digital camera system. The hand
held Kodak digital camera was connected to the
Garmin GPS that ‘‘stamped’’ the location, date and
time on each image (Fig. 8). These images were input
to ESRI ArcView software to provide a pictorial
record of field observations accurate to within F 5
to F 10 m, which is adequate for locating points
within vegetation polygons of 0.5 ha (the minimum
mapping unit) or larger.
A compilation of all field information was used by
Center for Remote Sensing and Mapping Science
ecologists to organize the Great Smoky Mountains
National Park overstory and understory vegetation into
a classification system with over 100 overstory and 70
understory association-level classes suitable for use
with the large- and medium-scale (1:12,000 and
1:40,000, respectively) color infrared aerial photo-
graphs (Jackson and Madden, 2002, Table 2). These
classification systems were based on the newly
released USGS Biological Resources Division/Natio-
nal Park Service National Vegetation Classification
System developed by The Nature Conservancy
(TNC) as part of a national vegetation mapping pro-
gram (The Nature Conservancy, 1999).
In order to accommodate the complex vegetation
patterns found in Great Smoky Mountains National
Park and generally maintain a minimum mapping unit
of 0.5 ha, a three-tiered scheme was developed for
attributing vegetation polygons, similar to that devel-
oped for an earlier project in the Everglades of south
Florida (Madden et al., 1999). The three-tiered
scheme allowed photointerpreters to annotate each
polygon delineated on clear plastic overlays registered
Fig. 8. Ground digital image of overstory and understory vegetation recorded with a Kodak FIS 265 digital camera. The text stamp across the
top of the image indicating the time and location was recorded by the GPS unit interfaced to the camera.
R. Welch et al. / ISPRS Journal of Photogrammetry & Remote Sensing 57 (2002) 53–68 61
to the photos with a primary or dominant vegetation
class accounting for more than 50% of the vegetation
in the polygon. Where appropriate, secondary and
tertiary vegetation classes are added to describe
mixed-plant communities within the polygon.
A separate classification system containing over 70
classes was developed to map the understory vegeta-
tion from the 1:40,000-scale photographs. The term
‘‘understory’’ denotes woody vegetation of medium
height (3–5 m) that does not reach the forest canopy
level of roughly 20 m. Understory classes were also
assigned density values of light (l), medium (m) or
heavy (h). These understory densities are important
considerations for conducting search and rescue mis-
sions in the Park, as well as for describing fuel classes,
as explained in more detail below.
Once the overstory and understory vegetation clas-
sification systems were established, the photointerpre-
tation proceeded by taping transparent plastic overlays
to the film transparencies and transferring the photo
numbers and fiducial marks to the overlays by means
of a Rapidograph technical pen. The film transparen-
cies, with plastic overlays, were then placed on a high
Table 2
Sample hierarchy of subalpine forest classes within the overstory
vegetation classification system for Great Smoky Mountains
National Park
Subalpine forest
(1) Fraser Fir F
(a) Formerly Fraser Fir (F)
(2) Red Spruce–Fraser Fir S–Fa, S/F, F/S
(a) Red Spruce–Fraser Fir/
Rhododendron
S–F/R
(b) Red Spruce–Fraser Fir/
Low Shrub–Herb
S–F/Sb
(3) Red Spruce S
(a) Red Spruce/Rhododendron S/R
(b) Red Spruce/Birch S/NHxB
(c) Red Spruce/Northern
Hardwoods/Rhododendron
S/NHx
(4) Exposed Northern Hardwoods NHxE
(a) Exposed Northern
Hardwoods/Red Spruce
NHxE/S
(5) Beech Forest Be
(a) Beech Gap Forest NHxBe
(b) North Slope Tall Herb Type NHxBe/Hb
(c) South Slope Sedge Type NHxBe/G
a Symbols: (– ) designates an equal mix and (/) designates the
first class listed is dominant (>50 percent) over the second class that
is listed.
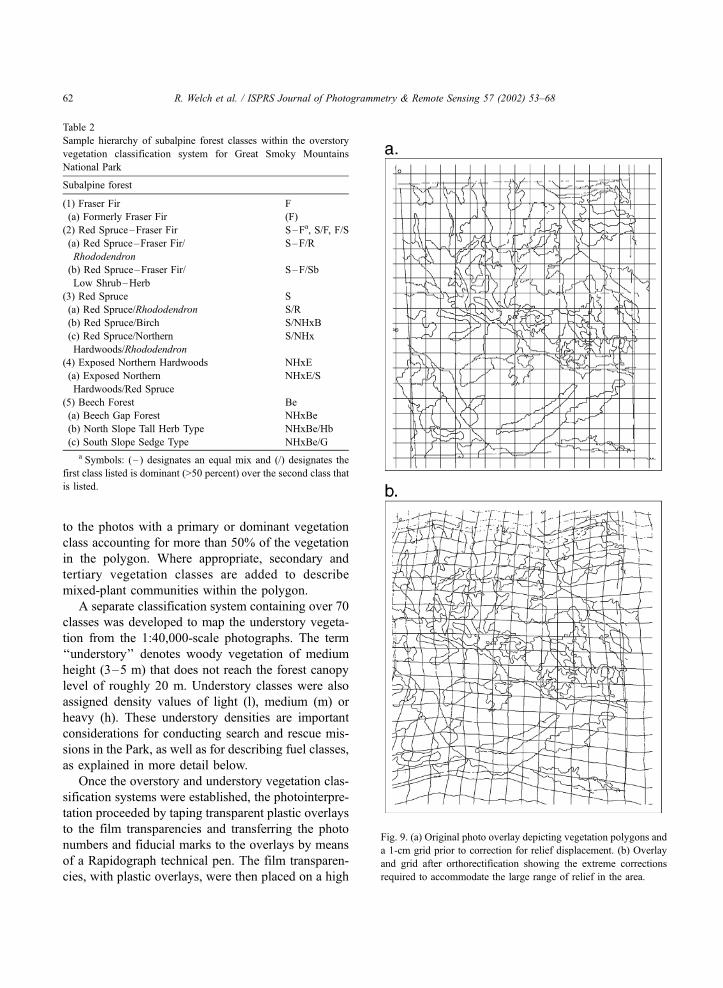
Fig. 9. (a) Original photo overlay depicting vegetation polygons and
a 1-cm grid prior to correction for relief displacement. (b) Overlay
and grid after orthorectification showing the extreme corrections
required to accommodate the large range of relief in the area.
R. Welch et al. / ISPRS Journal of Photogrammetry & Remote Sensing 57 (2002) 53–6862
intensity light table and the polygons corresponding to
the vegetation classes outlined on the overlay using
the Rapidograph pen while viewing the photographs
through a stereoscope and correlating the photo sig-
nature, slope, aspect and elevation with ground truth
vegetation information. This is a simple, fast, inex-
pensive and flexible method of creating a vegetation
overlay that can be scanned to create a raster file.
The scanning process for delineated overlays again
involved the use of the desktop Epson 836xl scanner,
at a resolution set to 42 Am. All annotated point, line
and polygon information on the overlay was con-
verted to raster format. The parameters derived from
the differential rectification of the scanned 1:12,000-
scale photos were applied to the scanned overlay files
via registration with the transferred fiducial marks.
Fig. 9 illustrates the magnitude of polygon displace-
ment, as well as distortion in polygon shape and size,
due to variable relief displacements across the photo-
graph.
After differential rectification of the scanned raster
overlay files, these files were converted to vector
format with the software package R2V by Able
Software and saved in ArcInfo line format. Vector
files from approximately 45 photographs needed to be
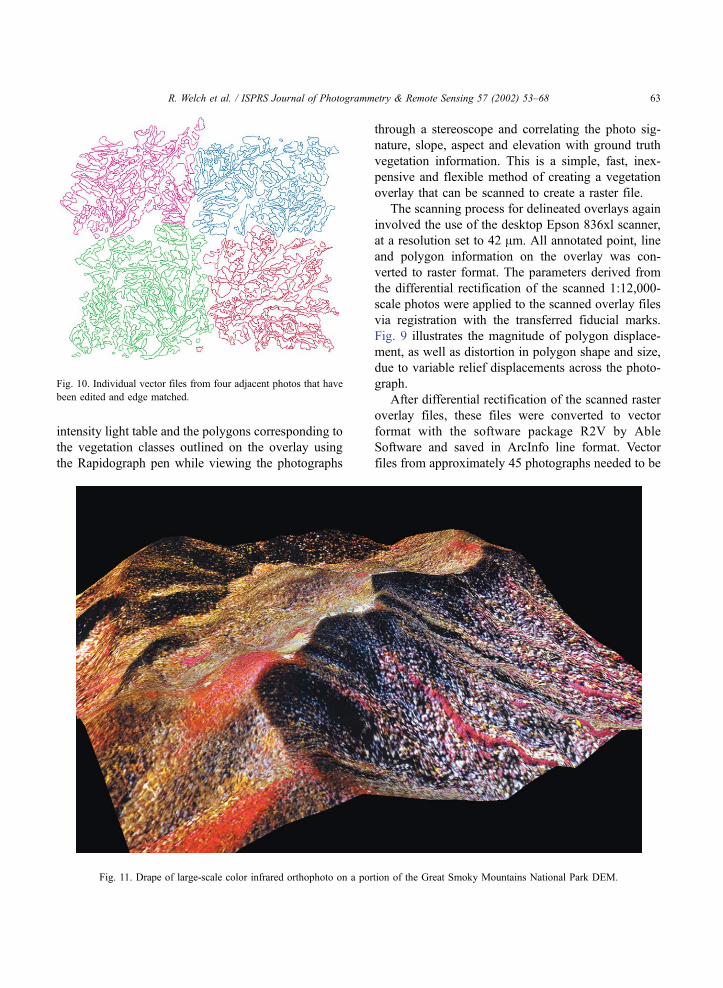
Fig. 10. Individual vector files from four adjacent photos that have
been edited and edge matched.
Fig. 11. Drape of large-scale color infrared orthophoto on a portion of the Great Smoky Mountains National Park DEM.
R. Welch et al. / ISPRS Journal of Photogrammetry & Remote Sensing 57 (2002) 53–68 63
edited, edge matched and incorporated into a single
ArcInfo coverage in order to produce a vegetation
map corresponding to a single USGS topographic
quadrangle (Fig. 10). A typical coverage for the area
corresponding to a USGS 1:24,000-scale map can
contain over 4500 polygons that must be attributed
with a dominant vegetation class, and possibly sec-
ondary and tertiary vegetation classes. More than 700
man hours were required to produce an overstory
vegetation map from the 1:12,000-scale photos,
including quality control checks of labels/line work
within and between adjacent maps.
Understory maps corresponding to a USGS topo-
graphic quadrangle were much less complex and
typically required the use of only four 1:40,000-scale
aerial photographs, resulting in the delineation of
approximately 2000 polygons. Approximately 100
man hours were needed to generate an understory
vegetation map.
Although the funds available for the project pre-
cluded an exhaustive check of thematic accuracy, draft
maps of both overstory and understory vegetation
were taken into the field when completed and eval-
uated for classification accuracy by resource manag-
ers. Any discrepancies in vegetation identification
were noted in the field and corrected in the vegetation
databases. Overall, the thematic classification accu-
racy of all map products has been found to be better
than 85% correct—a figure considered acceptable by
the NPS for large area thematic maps and databases.
4. Map and database products and applications
Final products included separate seamless GIS
databases of both overstory and understory vegetation
communities for the entire park, along with corre-
sponding hardcopy maps plotted at 1:15,000 scale.
Each map sheet contains a color-coded legend and
brief description of all vegetation classes found in
Great Smoky Mountains National Park. Additional
digital/hardcopy products that can be created for
particular areas of interest as a result of the vegetation
database development are color orthophoto mosaics
and drapes of maps/images on the USGS DEM to
enhance visualization of vegetation patterns with
respect to the terrain (Madden and Jordan, 2001,
Fig. 11).
The overstory and understory maps are used in
Great Smoky Mountains National Park for daily
assessment of vegetation patterns in relation to man-
agement activities. For example, the maps target areas
that require exotic vegetation eradication in order to
maintain healthy, native vegetation communities. The
vegetation database also can be queried to identify
areas of interest, such as, Fraser fir (Abies fraseri) die-
off and damage caused by the non-native balsam
woolly adelgid (Adelges piceae), or pure stands of
high elevation table mountain pine (Pinus pungens)
requiring controlled burning to eliminate hardwood
invasion.
Fire managers in Great Smoky Mountains National
Park are especially interested in assessing the over-
story and understory vegetation in terms of fuels for
potential forest fires. Until recently, all fires in the Park
were historically suppressed, resulting in the accumu-
lation of flammable woody debris and the potential for
intense wild fires. To this end, the vegetation databases
and maps are being employed with GIS modeling
techniques to assess forest fire fuels within Great
Smoky Mountains National Park (Dukes, 2001). A
well-tested and popular fuel classification system,
known as the Anderson Fuel Classification System,
contains 13 fuel models originally defined for fire
behavior prediction as applied to the more xeric
vegetation of the western United States (Anderson,
1982). These fuel models were re-evaluated by NPS
fire managers to relate fire behavior to vegetation of
eastern deciduous forests.
The vegetation database with 100 overstory classes
was generalized to facilitate fire fuel assessment by
using a lookup table to reclassify polygons and create
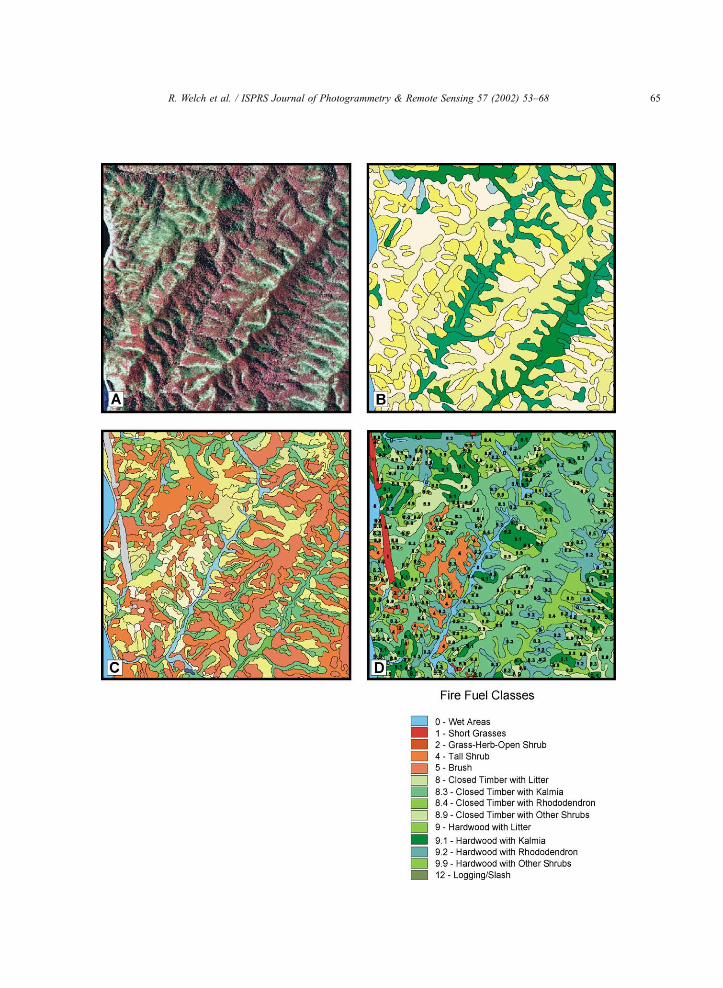
Fig. 12. (A) Color infrared orthophoto mosaic for a portion of Great Smoky Mountains National Park created from leaf-off 1:40,000-scale air
photos. (B) Map of understory vegetation prepared from 1:40,000-scale color infrared air photos depicting generalized classes of deciduous
shrubs (white), pine and Kalmia (light tans and yellows) and Rhododendron with hemlock (dark greens). (C) Map of overstory vegetation
prepared from large-scale 1:12,000 color infrared air photos depicting generalized xeric oak/pine forest (oranges), xeric oak/pine woodland (tans
and yellows), Kalmia shrubland (light beige) communities. (D) Composite map of fuel classes based on overstory vegetation (numbered 1–13)
with added decimal values denoting the type and density of understory vegetation.
R. Welch et al. / ISPRS Journal of Photogrammetry & Remote Sensing 57 (2002) 53–6864
R. Welch et al. / ISPRS Journal of Photogrammetry & Remote Sensing 57 (2002) 53–68 65
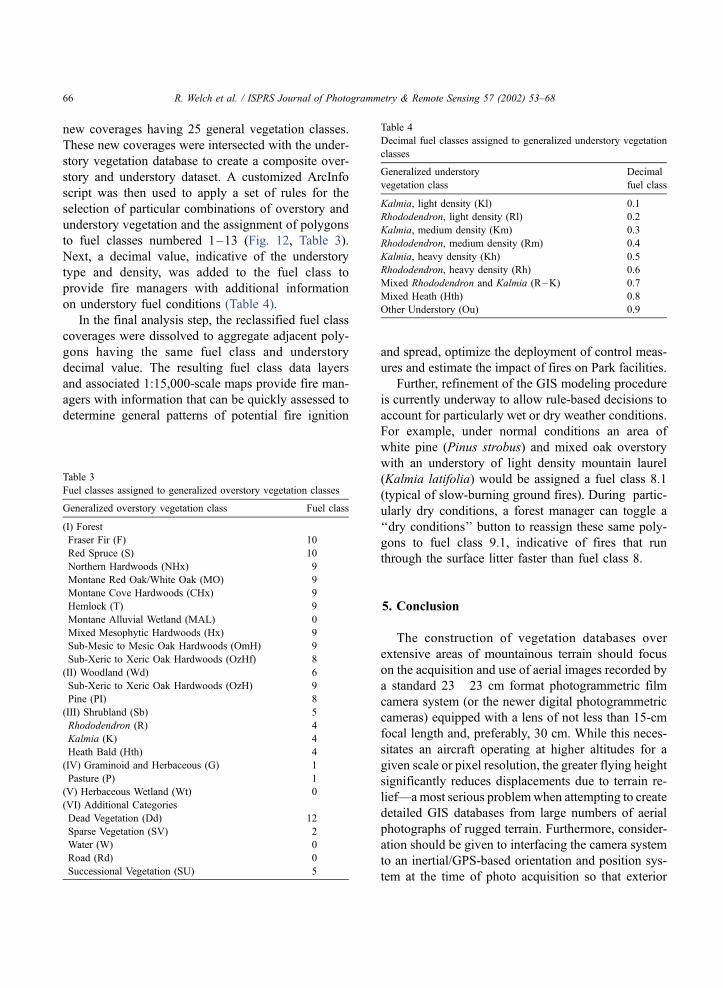
new coverages having 25 general vegetation classes.
These new coverages were intersected with the under-
story vegetation database to create a composite over-
story and understory dataset. A customized ArcInfo
script was then used to apply a set of rules for the
selection of particular combinations of overstory and
understory vegetation and the assignment of polygons
to fuel classes numbered 1–13 (Fig. 12, Table 3).
Next, a decimal value, indicative of the understory
type and density, was added to the fuel class to
provide fire managers with additional information
on understory fuel conditions (Table 4).
In the final analysis step, the reclassified fuel class
coverages were dissolved to aggregate adjacent poly-
gons having the same fuel class and understory
decimal value. The resulting fuel class data layers
and associated 1:15,000-scale maps provide fire man-
agers with information that can be quickly assessed to
determine general patterns of potential fire ignition
and spread, optimize the deployment of control meas-
ures and estimate the impact of fires on Park facilities.
Further, refinement of the GIS modeling procedure
is currently underway to allow rule-based decisions to
account for particularly wet or dry weather conditions.
For example, under normal conditions an area of
white pine (Pinus strobus) and mixed oak overstory
with an understory of light density mountain laurel
(Kalmia latifolia) would be assigned a fuel class 8.1
(typical of slow-burning ground fires). During partic-
ularly dry conditions, a forest manager can toggle a
‘‘dry conditions’’ button to reassign these same poly-
gons to fuel class 9.1, indicative of fires that run
through the surface litter faster than fuel class 8.
5. Conclusion
The construction of vegetation databases over
extensive areas of mountainous terrain should focus
on the acquisition and use of aerial images recorded by
a standard 23� 23 cm format photogrammetric film
camera system (or the newer digital photogrammetric
cameras) equipped with a lens of not less than 15-cm
focal length and, preferably, 30 cm. While this neces-
sitates an aircraft operating at higher altitudes for a
given scale or pixel resolution, the greater flying height
significantly reduces displacements due to terrain re-
lief—amost serious problemwhen attempting to create
detailed GIS databases from large numbers of aerial
photographs of rugged terrain. Furthermore, consider-
ation should be given to interfacing the camera system
to an inertial/GPS-based orientation and position sys-
tem at the time of photo acquisition so that exterior
Table 3
Fuel classes assigned to generalized overstory vegetation classes
Generalized overstory vegetation class Fuel class
(I) Forest
Fraser Fir (F) 10
Red Spruce (S) 10
Northern Hardwoods (NHx) 9
Montane Red Oak/White Oak (MO) 9
Montane Cove Hardwoods (CHx) 9
Hemlock (T) 9
Montane Alluvial Wetland (MAL) 0
Mixed Mesophytic Hardwoods (Hx) 9
Sub-Mesic to Mesic Oak Hardwoods (OmH) 9
Sub-Xeric to Xeric Oak Hardwoods (OzHf) 8
(II) Woodland (Wd) 6
Sub-Xeric to Xeric Oak Hardwoods (OzH) 9
Pine (PI) 8
(III) Shrubland (Sb) 5
Rhododendron (R) 4
Kalmia (K) 4
Heath Bald (Hth) 4
(IV) Graminoid and Herbaceous (G) 1
Pasture (P) 1
(V) Herbaceous Wetland (Wt) 0
(VI) Additional Categories
Dead Vegetation (Dd) 12
Sparse Vegetation (SV) 2
Water (W) 0
Road (Rd) 0
Successional Vegetation (SU) 5
Table 4
Decimal fuel classes assigned to generalized understory vegetation
classes
Generalized understory
vegetation class
Decimal
fuel class
Kalmia, light density (Kl) 0.1
Rhododendron, light density (Rl) 0.2
Kalmia, medium density (Km) 0.3
Rhododendron, medium density (Rm) 0.4
Kalmia, heavy density (Kh) 0.5
Rhododendron, heavy density (Rh) 0.6
Mixed Rhododendron and Kalmia (R–K) 0.7
Mixed Heath (Hth) 0.8
Other Understory (Ou) 0.9
R. Welch et al. / ISPRS Journal of Photogrammetry & Remote Sensing 57 (2002) 53–6866
orientation parameters are collected automatically and
available for input to softcopy photogrammetric soft-
ware. This will provide a potential for minimizing
ground control and aerotriangulation over rugged,
forested terrain, and reduce the time required to com-
plete the project.
The spatial accuracy requirements for constructing
GIS databases and mapping vegetation polygons are
appropriately based on the reliability to which the
photointerpreters can delineate individual vegetation
community boundaries and the smallest polygons to
be mapped in rough terrain—that is, the minimum
mapping unit, which in this study was 0.5 ha. In
general, the coordinate accuracy requirements for GIS
database and/or thematic maps of vegetation in rugged
terrain will not be as stringent as those for low relief
areas with a good distribution of readily identifiable
features and where it is possible to premark control
points. Thus, when planning a vegetation mapping
project, it is appropriate to note that photogrammet-
rists can use color infrared photographs of relatively
small-scale and/or coarse pixel resolution for control
generation tasks, whereas the photointerpreters may
insist on photographs of larger scale and/or higher
resolution more suitable for the extraction of thematic
detail. It pays to use the smallest scale possible that is
acceptable for both control generation and photointer-
pretation. This recommendation will help to reduce
the burden of aerotriangulation, interpretation, editing,
edge matching and attributing polygons associated
with large numbers of photographs having extraordi-
nary displacements due to terrain relief.
The construction of vegetation databases in moun-
tainous areas such as Great SmokyMountains National
Park can be facilitated by the integration of traditional
analog and newer digital data processing techniques.
For example, in this instance softcopy photogrammet-
ric techniques offered significant advantages for con-
trol extension, generation of orientation parameters and
the production of digital orthophoto mosaics employed
in the editing process to finalize vegetation polygons
delineated by the photointerpreters. Traditional analog
photointerpretations techniques permit the rapid delin-
eation of vegetation polygons on transparent overlays
registered to the color infrared film transparencies.
These overlays can then be scanned, and in raster
digital format, rectified based on known camera ori-
entation parameters and an available DEM, to place the
polygons in the map or ground coordinate system. The
rectified polygons may then be converted to digital
vector format for input to GIS software, where editing,
edge matching and attributing operations are con-
ducted to form a vegetation database.
Once a vegetation database is in place, it provides
baseline information on vegetation community distri-
butions and heterogeneity that can be employed with
GIS software for a variety of inventory and analysis
tasks, including the production of large-scale thematic
maps, assessment of growth patterns and changes over
time, and the quantification of fuels and fire risk. The
ability to drape maps and images over DEMs is useful
in planning search and rescue missions and for depict-
ing vegetation patterns as a function of elevation.
Terrain visualization is also an attractive mechanism
for displaying the beauty of the natural environment to
visitors and tourists.
In summary, this study integrated traditional fea-
ture extraction with new digital data processing tech-
niques to produce vegetation databases and associated
large-scale map products of high spatial and thematic
accuracy for a rugged, forested national park in east-
ern United States. It is anticipated that the method-
ologies established for this project can be adapted to
meet the requirements of vegetation mapping efforts
in other mountainous areas of the world.
Acknowledgements
This study was sponsored by the U.S. Department
of Interior, National Park Service, Great Smoky
Mountains National Park (Cooperative Agreement
no. 1443-CA-5460-98-019). The authors wish to
express their appreciation for the devoted efforts of
the staff at the Center for Remote Sensing and
Mapping Science, The University of Georgia, and
Great Smoky Mountains National Park.
References
Anderson, H.E., 1982. Aids to determining fuel models for estimat-
ing fire behavior. U.S. Department of Agriculture Forest Service
Research Note, INT-122. National Wildfire Coordinating
Group. 22 pp.
Dukes, R., 2001. A geographic information systems approach to
fire risk assessment in Great Smoky Mountains National Park.
Master’s thesis, The University of Georgia, Athens, GA. 131 pp.
R. Welch et al. / ISPRS Journal of Photogrammetry & Remote Sensing 57 (2002) 53–68 67

Houk, R., 2000. Great Smoky Mountains National Park: The Range
of Life Great Smoky Mountains Natural History Association,
Gatlinburg, TN. 47 pp.
Jackson, P., Madden, M., 2002. Mapping Vegetation Classification
System for Great Smoky Mountains National Park. Center for
Remote Sensing and Mapping Science, Department of Geogra-
phy, The University of Georgia, Athens, G.A. 7 pp.
Kaiser, J., 1999. Great Smokies species census under way. Science
284 (5421), 1747–1748.
Kemp, S., 1993. Trees and Familiar Shrubs of the Smokies. Great
Smoky Mountains Natural History Association, Gatlinburg, TN.
126 pp.
Madden, M., Jordan, T., 2001. Spatiotemporal analysis and visual-
ization for environmental studies. International Archives of Pho-
togrammetry and Remote Sensing 34 (Part 4/W5), 71–72.
Madden, M., Jones, D., Vilchek, L., 1999. Photointerpretation key
for the Everglades Vegetation Classification System. Photo-
grammetric Engineering and Remote Sensing 65 (2), 171–177.
Moore, H.L.A., 1988. A Roadside Guide to the Geology of the
Great Smoky Mountains National Park. University of Tennessee
Press, Knoxville, TN. 178 pp.
Rutchey, K., Vilchek, L., 1999. Air photointerpretation and satellite
imagery analysis techniques for mapping cattail coverage in a
northern Everglades impoundment. Photogrammetric Engineer-
ing and Remote Sensing 65 (2), 185–191.
The Nature Conservancy, 1999. BRD–NPS Vegetation Mapping
Program: Vegetation Classification of Great Smoky Mountains
National Park (Cades Cove and Mount Le Conte Quadran-
gles). Final Report, The Nature Conservancy, Chapel Hill,
NC. 195 pp.
U.S. Geological Survey, 2002. USGS–NPS Vegetation Mapping
Program. http://biology.usgs.gov/npsveg/standards.html (ac-
cessed February 17, 2002).
Walker, S.L., 1991. Great Smoky Mountains: The Splendor of the
Southern Appalachians. Elan Publications, Charlottesville, VA.
63 pp.
Welch, R., Remillard, M., Doren, R., 1995. GIS database devel-
opment for South Florida’s National Parks and Preserves. Pho-
togrammetric Engineering and Remote Sensing 61 (11),
1371–1381.
Welch, R., Madden, M., Doren, R., 1999. Mapping the Everglades.
Photogrammetric Engineering and Remote Sensing 65 (2),
163–170.
Welch, R., Jordan, T., Madden, M., 2000. GPS surveys, DEMs and
scanned aerial photographs for GIS database construction and
thematic mapping of Great Smoky Mountains National Park.
International Archives of Photogrammetry and Remote Sensing
33 (Part B4/3), 1181–1183.
Welch, R., Madden, M., Doren, R.F., 2002. Maps and GIS data-
bases for environmental studies of the Everglades. In: Porter, J.,
Porter, K. (Eds.), The Everglades, Florida Bay and Coral Reefs
of the Florida Keys: An Ecosystem Sourcebook, vol. 9. CRC
Press, Boca Raton, FL, pp. 259–279.
White, P., Morse, J., 2000. The science plan for the All Taxa Bio-
diversity Inventory in Great Smoky Mountains National Park,
North Carolina and Tennessee. Discover Life in America, Gat-
linburg, TN, http://www.discoverlife.org/sc/science_plan.html
(accessed February 17, 2002).
R. Welch et al. / ISPRS Journal of Photogrammetry & Remote Sensing 57 (2002) 53–6868