photogrammetric measurements of cross-sections for pay...
TRANSCRIPT
Photogrammetric Measurements of Cross-Sections For Pay Quantities R. K. SHEIK, Engineer of Photogrammetry, Ohio Department of Highways
This paper presents the experience of the Ohio Department of Highways in the use of aerial photography and photogrammetric methods for computing earthwork quantities on final cross-sections.
Progressive steps from the development stage to the present universal use of these methods are outlined. The experience of the Department covers four years of application with satisfactory results.
Comparison between photogrammetric methods of computing final cross-sections and actual ground surveys indicates that photogrammetry is generally more accurate, much more economical in both time and money, and safer in all respects.
• THE TIME-CONSUMING METHODS of measuring cross-sections of major highway projects has always presented a perplexing problem. Ohio is meeting this problem today by photogrammetric measurements to determine earthwork quantities. Final payments to contractors are now based on information obtained in this manner.
The Ohio Department of Highways, a pioneer in aerial surveys, began measuring cross-sections for pay quantities by photogrammetry in 1956. It is believed this was the first attempt made on a highway project to secure such measurements by this method.
The test was made that year on a 1. 8-mi highway project. The site was selected in an area having exceptionally rough terrain so that it would offer a multitude of problems. The results proved satisfactory in every respect. The were accurate and efficient, conserved engineering manpower, and above all, offered considerable savings in time.
The full import of this operation was not realized until the advent of electronic computers and digitizmg readout devices for stereo plotters in the highway field. Its necessity became acutely apparent as projects neared completion in Ohio's huge highway program. From January to October in 1960, cross-sections were measured by photogrammetric methods on 230 mi of major highways, mostly on the four-lane interstate system for determination of pay quantities.
Aerial photogrammetry has proven to be of exceptional value in several respects. It is considerably more economical than ground surveys in saving the Highway Department both time and money. Final payments to contractors have been expedited as a direct result of this process. The safety risk in field personnel formerly involved in making surveys on the ground has been greatly reduced. Finally, aerial photogrammetry has demonstrated a greater accuracy, in general, than ground survey.
EVOLUTION OF METHODS In the beginning, the photogrammetric instrument operator recorded elevation read
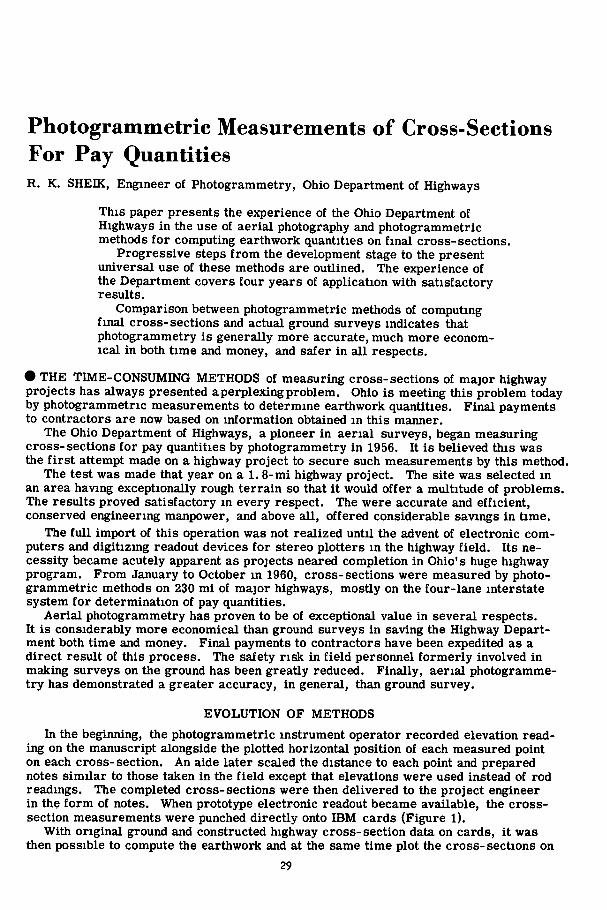
ing on the manuscript alongside the plotted horizontal position of each measured point on each cross- section. An aide later scaled the distance to each point and prepared notes similar to those taken in the field except that elevations were used instead of rod readings. The completed cross-sections were then delivered to the project engineer in the form of notes. When prototype electronic readout became available, the cross-section measurements were punched directly onto IBM cards (Figure 1),
With original ground and constructed highway cross- section data on cards, it was then possible to compute the earthwork and at the same time plot the cross-sections on
29
30
an electronic line plotter, which had now been introduced. It was thought that a plotting of the constructed highway cross-sections on tracing paper could be superimposed over the corresponding cross-^sections of the original plans in order to determine any deviations. Its main use was to indicate graphically the fit of the sections and to point up errors.
During this stage of development the project engineer received a tab list of the original sections, a tab list of the constructed highway sections, a data line plotted on tracing paper of those sections, and tabulated earthwork quantities from which he determined pay quantities. .,
F i g u r e 1. Prototype readout I n o p e r a t i o n a l p o s i t i o n .
31
This procedure was adequate because of the time lag. It was impossible to obtain electronically plotted sections in the time needed. A very real urgency existed in processing earthwork quantities for final payment and so it became expedient to plot the sections by hand. This was accomplished, at the time, by using an extra man in the plotting booth whose job was to plot each reading onto a black and white copy of the plan cross-section. He also guided the stereoplotter operator by taking only those cross-sections necessary to shape the draft and at the same time calling his attention to necessary readings that might have been passed. By this method, closures were made at the ends of each cross-section with very little forcing.
It was found that the best closure adjustment could be made at the stereoplotter by making use of all the data accumulated. In some cases the original notes may have been incorrectly reduced or incorrectly plotted. In other cases, the "feel" for accuracy in the original sections gave an indication of the best way to make a closure. It was also possible to take sufficient readings at the ends of each cross-section to extrapolate the original ground. It was rarely necessary to refer to preconstruction photography.
With this procedure there was also developed the terrain edit program for checking cards as punched for computation. Most errors were caught before punching and the balance was corrected on the validity check before compilation.
These methods provided an improved service to theproject engineer. Cross-sections were now plotted on a black and white print suitable for field check, adjustment of quantities, or use as an exhibit of the constructed highway cross-sections. The computations for end areas and accumulated volume were now reliable because every point on both the original and constructed highway cross-sections had been checked for validity.
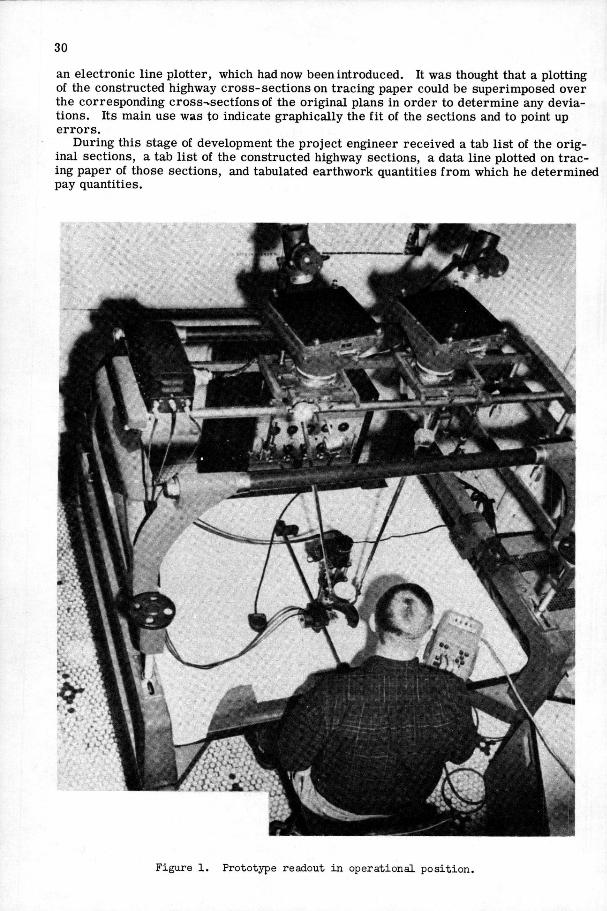
F i g u r e 2. Prototype bar w i t h mechanica l readout .
32
Only two readout machines were available at this time, so it became necessary to develop parallel manual methods to'obtain cross-section information on the completed highway. At present, the procedure consists of caUing off readings from a cross-section scale to engineer aides who keep notes and plot the cross-sections. The cross-section scale is numbered both ways from zero and consists of a photographic reproduction on mylar or cronaflex. The notes must be hand-punched if computation is desired. This method is especiaUy useful on ramps and side roads.
A horizontal bar with a mechanical read-out, developed by Photronix, Inc., is an important feature of the procedure. Figure 2 shows that the bar has two dials, one for reading the distance right of the centerline and one for left of the center. Covers on the dials automatically open and close according to the direction in which the tracing table is moved making it impossible to read the wrong dial. By this method, the operator caUs out his cross-section measurement readings to the aide, who in turn records them in the form of field notes. These readings are later key punched and verified. PREPARATION OF PROJECT FOR MEASURING CONSTRUCTION CROSS-SECTIONS
Preparation of projects begin in the office with scheduling, preflight planmng, marking the job for flight, and punching and verifying IBM cards.
When machine computation of earthwork is caUed for, it is necessary to obtain the original cross-section field notes. If preconstruction sections were taken or chaise orders processed, these two must be obtained. The sections are punched on cards and verified.
Preflight preparations are important. Each project is visited and carefuUy analyzed and, with the assistance of the project engineer, a report is made of the findings. The report covers information on side roads, ramps, channel chaises, borrow pits, and any changes made from the original plans. Changes in ditches and slopes are noted and waste areas and batch plant sites located. Each project is reviewed station-by-station and the job marked for photographic identification.
for cone pov'f use block point (or flspholt pov't use whito polnl
PREFUGHT SIGNALS Accuracy is greatly increased and succeeding operations greatly simplified if the
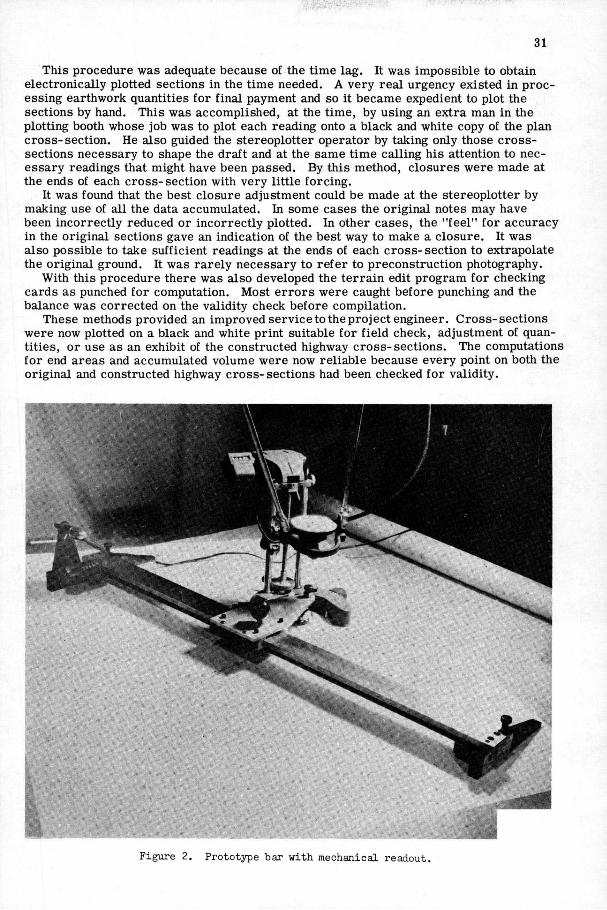
project is properly marked with photographic targets on the ground before the aerial photography flight is made. This is imperative for horizontal control and helpful tor vertical. Existing points that control alignment should be marked by targets. It is advisable to offset the targets of centerlines or survey lines to the inside edge of divided pavements, as station targets painted in this location wiU hold up for several months in usable condition (Figure 3).
Practically aU signaling with targets on completed construction projects is done with fast-drying paint. The targets are made bold in order to be readUy visible in the photography for assignment and for checking scale. The most important quality of each target is contrast. This is obtained by using black paint for concrete pavement and white paint on asphalt. Natural features are used whenever possible for wing points. At times, it is more efficient to pre-mark these points with panels of unbleached muslin. Target markers for curve points, points on tangent, points of intersection, and vertical control points are distinguished from each other by shape.
turn OV TAMtOm SMO
SIGNALS AT EDGE OF PAVEMENT
~1
Figure 3. Divided highway station markers on pavement for photo identification.
33
FLIGHT PLAN After an inspection of the job has revealed the full extent of the project, the flight
plan is formulated by reference to the highway plan. In general the aerial photography flight plan should cover these points: 1. Breaking the project mto tangents, 2. Assigning flight altitudes for each tangent, and 3. Planning flights of intersecting roads along their centerline to msure adequate
photographic coverage. The most important features of an aerial photography flight include excellent light,
good overlap, absence of crab due to high wind velocity, and careful control tor good results.
The pilot and photographer are guided in their coverage of the project by bold, adequately target-marked control.
PROCESSING, INSPECTION, AND PHOTOGRAPHY SELECTION Negatives are usually processed and inspection prints made available within 24 hours
after flight. If acceptable, the photographs best covering the project are selected for preparation of photographic transparencies on glass plates.
The plates are exposed in an automatic dodging logetronic printer, holding desired density.
CONTROL It I S essential that ground control be taken and measured on the ground accurately.
However, it is desirable to reduce the amount of control, but not at the expense of accuracy.
In Ohio, the control is generally selected in the office by identifying the targets on aU pre-marked points and identifying and describing natural features to be used for vertical control.
When a highway project is to be designed by use of survey data obtained by photogrammetric methods, the ground control points should be measured and identified in such a manner that they can be used later tor measurement of cross-sections once construction I S completed. Design photographs are obtained during the winter or spring and cross-sectioning photographs are taken during the growing season. Thus, many ground control points do not appear the same m the two sets of photographs and are sometimes neither identifiable nor usable for the second flight. The most usable ground control points are natural features that will not be obscured by growth. For the highway design map manuscript, the stereoplotter operator can locate additional control pass points for use later in cross-section measuring. This procedure will help reduce control costs. The original control is appraised and, if found suitable, is transferred to the cross-section manuscript.
Edge-of-pavement elevations are used for control wherever possible. Where differences from construction plans are found, further check-in becomes necessary.
One week is usually alotted for controlling the average construction project in the field to prepare for measurement of cross-sections to determine construction quantities.
PREPARATION OF PLOTTING MANUSCRIPT A plotting manuscript covering the highway construction project is used, if available.
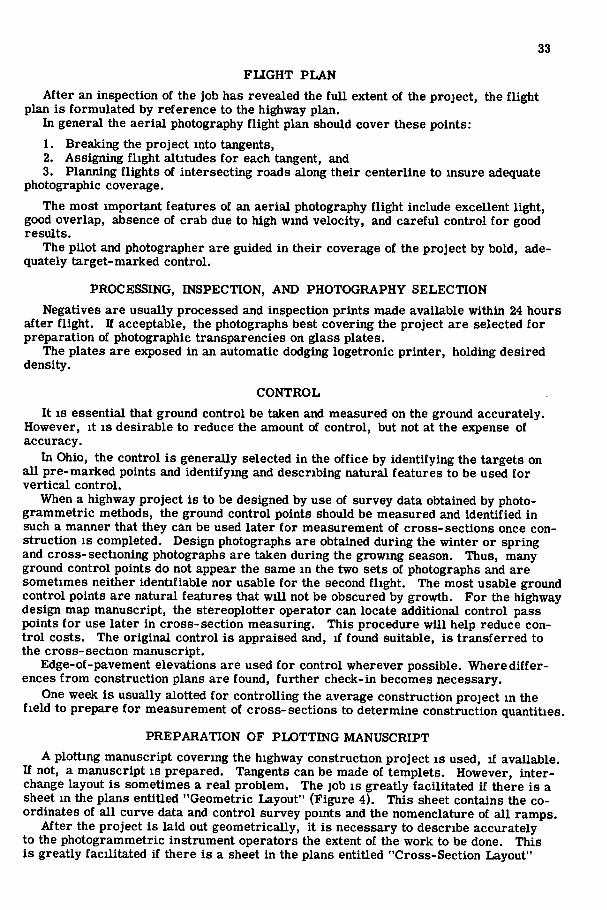
If not, a manuscript is prepared. Tangents can be made of templets. However, interchange layout is sometimes a real problem. The job is greatly facilitated if there is a sheet in the plans entitled "Geometric Layout" (Figure 4). This sheet contains the coordinates of all curve data and control survey points and the nomenclature of all ramps.
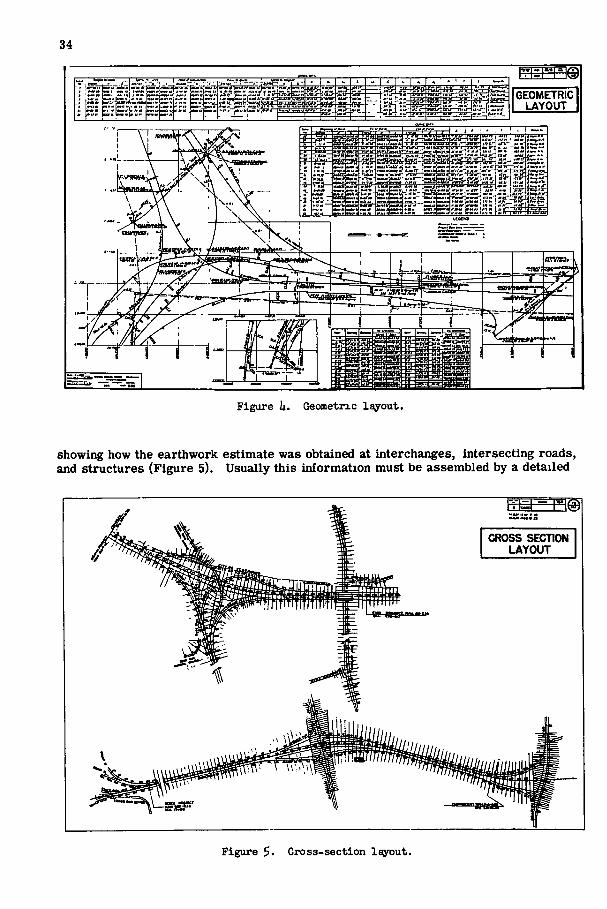
After the project is laid out geometrically, it is necessary to describe accurately to the photogrammetric instrument operators the extent of the work to be done. This is greatly facilitated it there is a sheet in the plans entitled "Cross-Section Layout"
34
GEOMETRIC LAYOUT
Mm
Figure It. Geometric layout.
showing how the earthwork estimate was obtained at interchanges, intersecting roads, and structures (Figure 5). Usually this information must be assembled by a detailed
CROSS SECTION LAYOUT
Figure $. Cross-section layout.
35
inspection of the plans. Each section to be plotted must be indicated and numbered on the manuscript and its match point plotted it it intersects other cross- sections. Finally, edge-of-pavement elevations and the marked control are indicated.
PLOTTING After clearing, each stereoscopic model is scaled by fitting the marked control to
its plotted position on the manuscript. It can then be leveled to wing and previous pass points and, finally, to the edge-of-pavement and constructed-grade elevations. Since the area of interest is between the right-of-way lines, it is essential that this area of each stereoscopic model be parallel clear and level and that the height index be representative of the area and not an average of the entire model. In cases of difficulty, re-indexing should be earned out as often as necessary.
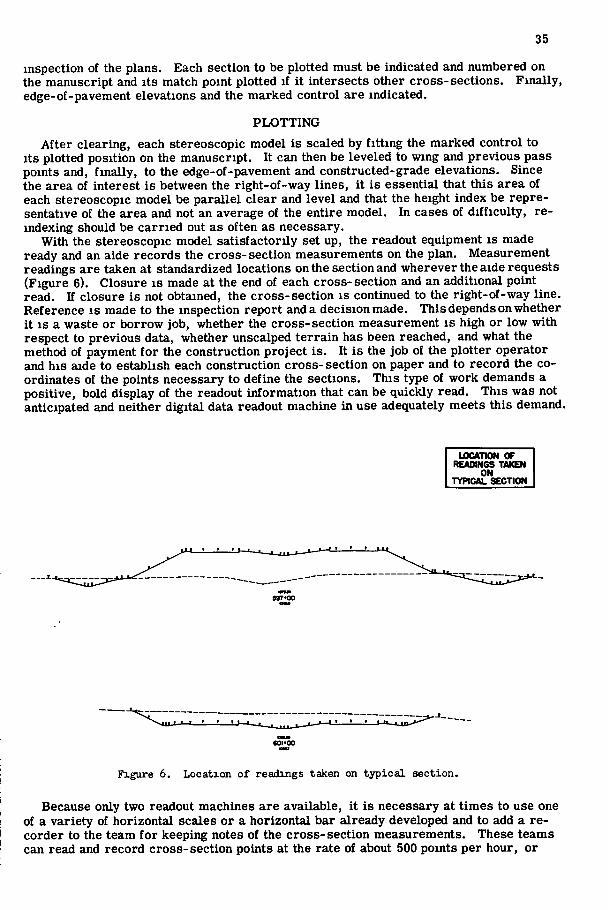
With the stereoscopic model satisfactorily set up, the readout equipment is made ready and an aide records the cross- section measurements on the plan. Measurement readings are taken at standardized locations on the section and wherever the aide requests (Figure 6). Closure is made at the end of each cross-section and an additional point read. If closure is not obtained, the cross-section is continued to the right-of-way line. Reference is made to the inspection report and a decision made. This depends on whether it I S a waste or borrow job, whether the cross-section measurement is high or low with respect to previous data, whether unscalped terrain has been reached, and what the method of payment for the construction project is. It is the job of the plotter operator and his aide to establish each construction cross- section on paper and to record the coordinates of the points necessary to define the sections. This type of work demands a positive, bold display of the readout information that can be quickly read. This was not anticipated and neither digital data readout machine in use adequately meets this demand.
LKATION OF REAOrNGS TAKEN
ON TYPICAL SECTION
Figure 6. Location of readings taken on typical section.
Because only two readout machines are available, it is necessary at times to use one of a variety of horizontal scales or a horizontal bar already developed and to add a recorder to the team for keeping notes of the cross- section measurements. These teams can read and record cross-section points at the rate of about 500 points per hour, or
36
about the speed of a key-punch operator. Records for the past year indicate that it has been necessary to punch manually and verify only 20 percent of the cross-section data measured on construction-projfects.
COMPUTATION Machine computations are made to give the differences between cross-sections of the
original terrain and cross-sections of the constructed highway. These computations are also used as a check of the planimetered plan quantities and as a basis for making small planimetered adjustments in case extra work or deductions were allowed by the project engineer. Structure areas are cropped out and, in general, side roads and ramps are not machme computed.
One of the most valuable features of the machine computation program is the terrain edit program which developed out of a need to check original ground and constructed highway cross-section data for validity before determining earthwork quantities moved during construction. With this program all points on each cross-section are checked and more than one error can be detected at any station. Six possible types of errors are identified and located if they occur, as well as improbable values for verification or correction.
VOLUME AND ACCURACY OF CONSTRUCTED HIGHWAY CROSS-SECTIONS By far the greatest volume of photogrammetric cross- sections of constructed high
ways has been accomplished in the past year since the aerial survey and electronic computer sections were requested to help furnish terrain data on interstate projects awarded in 1957 and 1958. In that period, 52 construction projects with a total contract value of $150, 276, 000 and a total work length of 231 mi were photographed, controUed, plotted" and, on 45 projects, computed.
Production of these cross-sections takes approximately one-half the capacity of the State's plotting section, which is geared to making the cross-section measurements each week for about one highway construction project, at an average construction cost of $3, 000, 000. Elapsed time between the preparation of the project for aerial photography and the delivery of plotted black and white prints of the cross-sections is approximately one month.
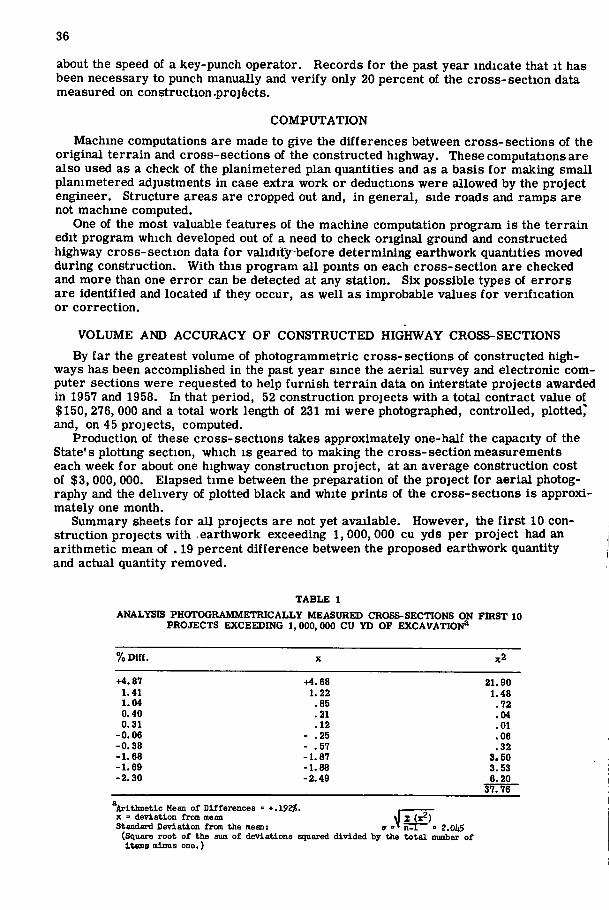
Summary sheets for aU projects are not yet available. However, the first 10 construction projects with .earthwork exceeding 1,000,000 cu yds per project had an arithmetic mean of . 19 percent difference between the proposed earthwork quantity and actual quantity removed.
T A B L E 1
ANALYSIS PHOTOGRAMMETRICALLY MEASURED CROSS-SECTIONS ON FIRST 10 PROJECTS EXCEEDING 1,000,000 CU YD OF EXCAVATION*
% Dlff. X x2
+4.87 44.68 21.90 1.41 1.22 1.48 1.04 .85 .72 0.40 .21 .04 0.31 .12 .01
-0.06 - .25 .06 -0.38 - .57 .32 -1.88 -1.87 3.50 -1.69 -1.88 3.53 -2.30 -2.49 6.20
37.76
Arithmetic Mean of Differences = * . l $ 2 f . . X = deviation from mean *j 2 (x^) Standard Deviation from the mean: a =' E I I = 2,0hS
(Square root of the sum of deviations squared divided by the to t a l number of Items minus one.)
37
In order to analyze the data in Table 1 it is necessary to ascertain the extent to which the differences vary from chance. A difference, to be sigmficant at the . 05 level of confidence, would have to be at least + 4.01 percent (2.045 x 1.96). Only the difference in the first project listed could be considered as occurring no more frequently than 5 times out of 100. A difference, to be significant at the . 01 level of confidence, would have to be at least ± 5. 28 percent (2. 045 x 2. 58). None of the observed differences, then, is significant at this confidence level. It may be stated that in 9 of the 10 projects considered, differences were not significant between proposed earthwork quantities and earthwork removed. That is, such differences could very easily have occurred as a result of chance. When a reasonably significant difference occurs, such as in the case of the first project listed, an explanation other than chance behavior may be sought. Such an explanation, among other things, might consider the variability of one contractor from another, the lack of precision of work on the part of a particular contractor, and difficulty in necessary estimations relative to the nature of the terrain involved in the project.
Again, Table 1 shows that in no case did the removed earthwork quantity equal the amount proposed to be removed. This becomes more apparent when 22 projects of 100, 000 cu yd and up are examined. The average difference in this group is + 2. 38 percent. Twice as many projects had excess excavation as were overestimated.
That this I S by no means umque to projects processed by photogrammetry is illustrated by 16 projects not processed by photogrammetric measurement of cross-sections. Eliminatmg projects of less than 100, 000 cu yd and 3 projects of -24. 07 percent, +34. 34 percent, and -44.90 percent, the arithmetic mean difference of 11 projects was +1.11 percent. Only one project within this group was within + 1 percent of its estimated quantity.
Some years ago a study was made of 10 construction projects with excavation of over 100, 000 cu yd. Each project was estimated from photogrammetrically measured cross-sections of the original ground and processed by ground survey methods. The arithmetic mean was +3. 71 percent with only one project less than estimated.
It can safely be said that photogrammetric measurement of earthwork on construction projects is fully competent tor revealing reasonable compliance with the specifications and when combined with electronic computer calculations gives satisfactory results and permits reasonable scheduling of operations.
COSTS Final engineering charges are available for some projects tor which construction
cross-section data were obtained by photogrammetry. Average Length of Project: 5. 260 mi (22 projects) Average Contract Cost: $652, 000 per mi (52 projects) Photogrammetry Cost:
Field: $177.00 per mi (Approximate average) Office: $246. 58 per mi Total: $423. 58 (22 projects)
Electronic Computation: $63. 74 per mi (45 projects)
SEEDING Seeding areas are determined by use of photogrammetry and the electronic computer
during the processing ot construction cross-sections. This service has been enthusiastically received by the project engineers.
CONCLUSIONS Photogrammetrically measured cross-sections of constructed highways are more
accurate than cross- sections of the original ground that were measured by photogrammetry because advantage is taken of more and better control data not previous available.
Photogrammetrically measured cross-sections ot the original ground are generally agreed to be better than the same cross-sections measured by conventional surveys on
38
the ground over difficult terrain. Therefore, photogrammetrically measured cross-sections of newly constructed highways are entirely adequate.
Information is provided in proper form for computation both by analog and digital methods.
Alterations to original plans caused by change orders are not always incorporated into the plans tor reference. Therefore, data computed from photogrammetrics provide a progressive record of construction.
Central processing of construction pay quantities measured by photogrammetric methods has emphasized the necessity tor further standardizing plan presentation. This is especially true tor more efficient computations of pay.
Savings in time, economy, safety, and accuracy are the most notable features of photogrammetric methods.
Discussion G. P. KATIBAH, Supervising Photogrammetrist, California Division of Highways— Terrain data necessary for the calculation of earthwork quantities must be sufficient in density to be an adequate statistical sample. It makes little difference whether the acquisition of the data is by field methods or by photogrammetric methods provided the result has "statistical" accuracy.
The belief that field methods for this objective are naturally better than photogrammetric methods is frequently misleading. Because the size of the sample requires that a great many points be measured, such as points on cross-section lines, it is not economically justifiable to attempt high-order accuracy for each point. Investigative evidence indicates that photogrammetric measurements fulfill the fundamental requirement of "statistical" accuracy, and in some types of terrain are probably superior to measurements made by the routine type of field survey. This has been reported by L. L . Funk (l , 2).
The Ohio Department of Highways has introduced the concept of electronic recording of photogrammetric measurements directly on punched cards. The imaginations of many individuals in the business of highway engineering have been stimulated, and now many highway organizations are engaged in similar endeavors. There are, however, some differences in approach, the major difference being concerned with the basis for calculation of quantities used for payment.
Many State highway departments pay tor the quantities as staked on the ground before any excavation of earthwork. Thus, the computed quantities are based on the original terrain data combined with the design template tor roadbed and slopes.
The Ohio method requires that pay quantities be based on the amount of earth removed as determined by "as built" roadbed and slopes. Photogrammetry is used for original terrain and also for "as buUt" terrain.
The significant photogrammetric data with regard to accuracy is the original terrain before construction. After that step is taken, the basis for pay quantities is a matter of organizational policy;, i. e., a cross-section template composed of original terrain and "proposed" terrain (adjusted for changes in plans during construction), or origmal terrain and "as built" terrain.
One would expect that the number of elevations recorded along "as built" cross-section would be the same whether measured by field methods or measured by photogrammetric methods. The breaks in finished slopes should be just as apparent in the stereomodel as on the ground.
On the other hand, the number of elevations recorded along an original terrain cross-section before construction seems to be greater when measured photogrammetrically than when measured in the field. Thus, the size of the statistical sample is increased when photogrammetry is used. Experience shows that break points are more readily defined in the stereomodel than on the ground. The operator is, therefore, able to define more completely the ground profile along the cross-section line. It is also significant that the operator can more exactly follow the cross- section line because he is not obliged to offset tor trees or other objects, and he does not drift downhill (a real problem with rod-men). Photogrammetric measurements, especially when electronically recorded, are not subject to the gross errors found in routine field cross-section surveys.
39
The one factor that stiU plagues photogrammetry, and promises to continue to do so, is the existence of vegetative cover. When the cover makes it impossible to realize sufficient elevation accuracy of photogrammetric work, field surveys should be employed.
REFERENCES 1. Funk, L . L . , "Terrain Data for Earthwork Quantities." HRB BuU. 228, 49-65
(1959). 2. Funk, L. L . , "Adjustment of Photogrammetric Surveys." HRB BuU 228, 21-27
(1959).