photometric microtitrations ix.* direct and successive ... sensitive reagent of all metallochromic...
TRANSCRIPT

Photometric microtitrations IX.* Direct and successive chelatometric determination of scandium and lanthanoides in micromolar solutions using
Xylenol Orange
V. MACH, S. KOTRLÝ, and К. VYTŘAS
Department of Analytical Chemistry, Institute of Chemical Technology, CS-53210 Pardubice
Received 10 February 1988
Microgram amounts of scandium (chloroacetate buffer, pH = 2.4—3.4, Я = 540 nm) and erbium (acetate buffer, pH = 4.6—5.6, Я = 560 nm) can be determined precisely with a very dilute titrant, c(EDTA) > 1 x 10~4moldm~3, owing to the sensitive colour transition of Xylenol Orange. The relative standard deviations and systematic errors are smaller than 1 % for the two metals if they are titrated separately. In a successive titration first scandium is determined at pH about 2.3 and Я = 540 nm and then, after adjusting the pH value to « 5 with acetate, erbium is titrated at Я = 560 nm. An adequate precision has been achieved for mixtures of the two metals (c(Er3+)/c(Sc3+) = = 0.6 to 4.6); however, the end-points are liable to certain systematic deviations in the range of micromolar concentrations.
Микрограммовые количества скандия (хлорацетатный буферный раствор с pH = 2,4—3,4, Я = 540 нм) и эрбия (ацетатный буферный раствор с pH = 4,6—5,6, Я = 560 нм) возможно определить очень точно даже применяя разбавленный титрующий раствор, с(ЭДТА) > > 1 10"4 моль д м - 3 , благодаря чувствительному индикаторному переходу Ксиленового оранжевого. Величины относительных стандартных отклонений и систематических ошибок меньше 1 % для обоих металлов, если их титрация проводится раздельно. При последовательной титрации сначала определяется скандий при pH около 2,3 и Я = 540 нм, а затем, после приведения pH до значения « 5 посредством добавления раствора ацетата, происходит титрация эрбия при Я = 560 нм. При определении обоих металлов в смесях (c(Er3+)/c(Sc3+) = 0,6—4,6) можно достичь удовлетворительной точности. В микромолярных растворах, однако, при установлении конца титрования проявляются систематические отклонения.
The need of reliable standardizations of dilute solutions of metals for modern
spectrometnc methods has newly stimulated investigation of precise instru-
* For Part VIII see Chem. Papers 41, 57 (1987).
Chem. Papers 43 (3) 377—387 (1989) 377
V MACH. S. KOTRLÝ. K. VYTŘAS
mental titrations. The technique of photometric end-point indication has been found to be suitable for exact determinations of microgram amounts of metals [1] and has also been recommended for EDTA standardizations [2, 3]. Moreover this technique can be used for the study of colour transitions of metallochromic indicators [4].
An interesting case of the use of photometric titration is represented by the successive chelatometric determination of two metal ions at different pH values. Sulfonephthaleins with iminobis(methylenecarboxylic) acid functional groups can be applied with advantage for this purpose. For example, Xylenol Orange was used for a successive photometric microtitration of bismuth and lead [5]. Methylxylenol Blue was found useful for the investigation of conditions for the successive titration of scandium and a lanthanoide (M) with 0.01 M-EDTA [6]. This case is noteworthy, for the two metals have identical charges but the stability of their complexes with EDTA is sufficiently different [7]: log/?(Sc edta) = = 23.1, whereas log ß(M edta) for the lanthanoide ions varies from 15.50 (La) to 19.83(Lu); / = 0 . 1 m o l d m - 3 (KN03) at 20°C. The method was further developed for the determination of microgram amounts of scandium and lanthanoides [8].
Recently Hafez and Emam have recommended Semixylenol Orange as indicator for a similar determination [9]; however, this indicator is not commercially available and its preparation from a reaction mixture or from a commercial reagent of Xylenol Orange is not easy at all [10]. The parent compound, Xylenol Orange (XO), can also be considered as a suitable indicator for the successive titration of scandium and lanthanoides, as suggested by results of some previous investigations. Thus Kornev [11] has reported that photometric titration of scandium is feasible at pH = 2.5—3.0. Onosova and Aleksashina [12] investigated the effects of various reagents used for masking, etc.: it was possible to titrate scandium selectively with XO as indicator between pH 2 and 4. A sharp colour change was also reported for visual titrations of the lanthanoide ions using XO at pH = 5. The results were so precise that the method was recommended for standardizations [13].
In our preliminary experiments Xylenol Orange proved to be the most sensitive reagent of all metallochromic indicators and was chosen, therefore, for a detailed investigation of the successive determination of Sc(III) and the lanthanoides. Erbium was selected as a representative element in spite of a high value of the stability constant of its complex with EDTA (log/? = 18.85) [7]. On consideration of the data for the other lanthanoide ions similar results can be expected for other analogous combinations. In the present paper the results of successive photometric titrations are reported and compared with the precision and accuracy attainable in titrations of the individual metals.
378 Chcm. Papers 43 (3) 377 387 (1989)
PHOTOMETRIC MICROTITRATIONS. IX
Experimental
Reagents and solutions
Chemicals of guaranteed reagent grade and redistilled water were used for the preparation of all solutions and in all experiments.
For microtitrations the EDTA solutions of the concentration 5 x 10~4 and 1 x x I0 _ 4moldm 3 were prepared by dilution of a stock solution (c = 1 mmol dm - 3 ) which was standardized by visual titration of recrystallized and dried lead chloride [14] using XO as indicator.
Standard solution of reagent-grade scandium chloride (c(Sc3+) = 1 mmol dm - 3 ) was acidified with nitric acid (c(HN03) % 5 mmol dm - 3 ) to prevent hydrolysis. Visual titration with 0.001 M-EDTA was used for standardization (indicator XO, pH = 2.5 adjusted with a chloroacetate buffer, cf. Ref. [15]). A stock solution of reagent-grade erbium nitrate (c(Er3+) = 1 mmol dm - 3 ) was also standardized chelatometrically with XO as indicator in a similar way. The best results were obtained at pH about 5.3 (acetate buffer). Micromolar solutions of the two metals for photometric titrations were prepared by exact dilutions of the stock solutions.
Chloroacetate, chloroacetate—acetate (c % 1 mol dm - 3), and acetate (c = 0.2 mol dm"3) buffers were prepared by mixing chloroacetic or acetic acid with sodium hydroxide and sodium acetate, respectively.
The solution of Xylenol Orange (0.01 %, i.e. c(XO) % 2.4 x 10~ 4 тоЫт- 3 ) was prepared from a purified reagent [16]. In order to increase the stability óf the indicator solution about 10 drops of 1 M-HN03 per 100 cm3 were added. This stock solution was diluted ten times for photometric titrations.
Apparatus and equipment
Photometric titrations were performed with a Zeiss Specol 10 spectrophotometer and a microtitration attachment of special design [17]. Glass cuvettes (type C, Zeiss, Jena) of a 50-mm path-length and a volume of approximatively 20 cm3 were used for titrations.
A micrometer syringe burette of our design was calibrated gravimetrically. The glass piston displacement of 25 mm corresponded to ä delivery of 0.5661 ± 0.0002 cm3 (n = 5, sr = 0.03 %).
A Radelkis OP-201/2 pH-meter with a glass and saturated calomel electrode was calibrated with the buffer solutions of the operational pH scale [18].
Procedures for photometric microtitrations
Determination of individual metals
Transfer a 5-cm3 aliquot of a slightly acidic solution containing at least 1 p.g of the metal to the titration cuvette. Add 4 cm3 of the XO indicator solution (c = 2 x x 10~5moldm~3), 2 cm3 of a chloroacetate buffer of pH = 3 for Sc(III) (or for Er(III)
Chem. Papers 43 (3) 377—387 (1989) 379
V MACH, S. KOTRLÝ, K. VYTŔAS
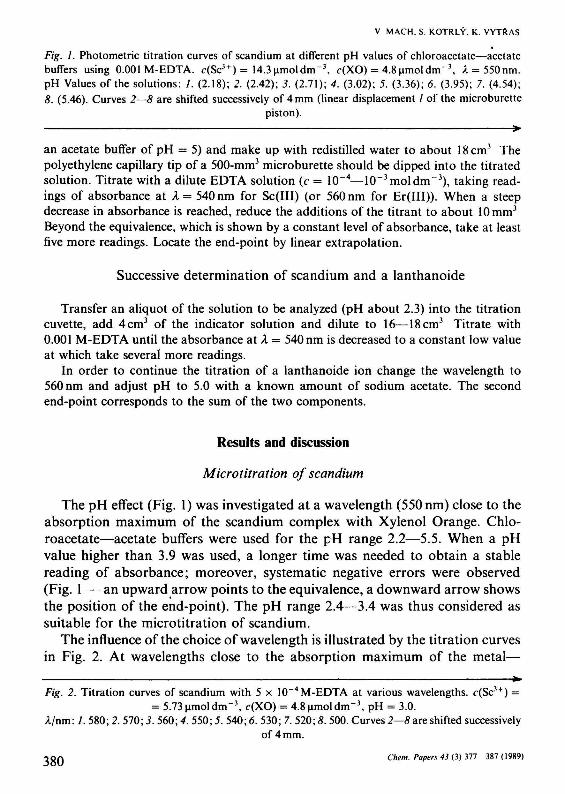
Fig. 1. Photometric titration curves of scandium at different pH values of chloroacetate—acetate buffers using 0.001 M-EDTA. <?(Sc3+) = 14.3umoldm-\ c(XO) = 4.8umoldm \ A=550nrn. pH Values of the solutions: /. (2.18); 2. (2.42); 3. (2.71); 4. (3.02); 5. (3.36); 6. (3.95); 7. (4.54); 8. (5.46). Curves 2—8 are shifted successively of 4 mm (linear displacement / of the microburette
piston). >
an acetate buffer of pH = 5) and make up with redistilled water to about 18 cm3 The polyethylene capillary tip of a 500-mm3 microburette should be dipped into the titrated solution. Titrate with a dilute EDTA solution (c = 10~4—10~3moldm 3), taking readings of absorbance at Я = 540 nm for Sc(III) (or 560 nm for Er(III)). When a steep decrease in absorbance is reached, reduce the additions of the titrant to about 10 mm3
Beyond the equivalence, which is shown by a constant level of absorbance, take at least five more readings. Locate the end-point by linear extrapolation.
Successive determination of scandium and a lanthanoide
Transfer an aliquot of the solution to be analyzed (pH about 2.3) into the titration cuvette, add 4 cm3 of the indicator solution and dilute to 16—18 cm3 Titrate with 0.001 M-EDTA until the absorbance at Я = 540 nm is decreased to a constant low value at which take several more readings.
In order to continue the titration of a lanthanoide ion change the wavelength to 560 nm and adjust pH to 5.0 with a known amount of sodium acetate. The second end-point corresponds to the sum of the two components.
Results and discussion
Microtitration of scandium
The pH effect (Fig. 1) was investigated at a wavelength (550 nm) close to the absorption maximum of the scandium complex with Xylenol Orange. Chloroacetate—acetate buffers were used for the pH range 2.2—5.5. When a pH value higher than 3.9 was used, a longer time was needed to obtain a stable reading of absorbance; moreover, systematic negative errors were observed (Fig. 1 — an upward arrow points to the equivalence, a downward arrow shows the position of the end-point). The pH range 2.4—3.4 was thus considered as suitable for the microtitration of scandium.
The influence of the choice of wavelength is illustrated by the titration curves in Fig. 2. At wavelengths close to the absorption maximum of the metal—
Fig. 2. Titration curves of scandium with 5 x 10 4 M-EDTA at various wavelengths. c(Sc3+) = = 5.73 umoldm"3, c(XO) = 4.8 umoldm"3, pH = 3.0.
A/nm: /. 580; 2. 570; 3. 560; 4. 550; 5. 540; 6. 530; 7. 520; 8. 500. Curves 2—8 are shifted successively of 4 mm.
380 them. Papers 43 (3) 377 387 (1989)

PHOTOMETRIC MICROTÍTRATIONS. IX
//mm
Chem. Papers 43 (3) 377—387 (1989) 381
V MACH. S. KOTRLÝ. K. VYTŘAS
—indicator complex, an S-shape of the titration curve becomes apparent. The linear extrapolation of the descending section of the curve is then uncertain. For example, even two end-points can be obtained by drawing straight lines through subsequent parts of the curve 3 measured at Я = 560 nm. The pre-equivalence curvature is compensated at A = 540 nm and, despite of a lower initial value of absorbance, a sufficiently long linear part of the curve is obtained to allow a safe end-point evaluation. It is also worth to notice that the systematic error becomes negligible at this wavelength. Such compensation of the curvature has been observed in some previous cases (cf. Ref. [5]), always when a consecutive complex formation is involved in the indicator transition close to the equivalence. According to the theory [19] the pre-equivalence bend of the curve disappears at a certain wavelength at which the molar absorption coefficients of the indicator species are compensated to such extent that the resulting titration curve resembles that of only one metal—indicator complex formation.
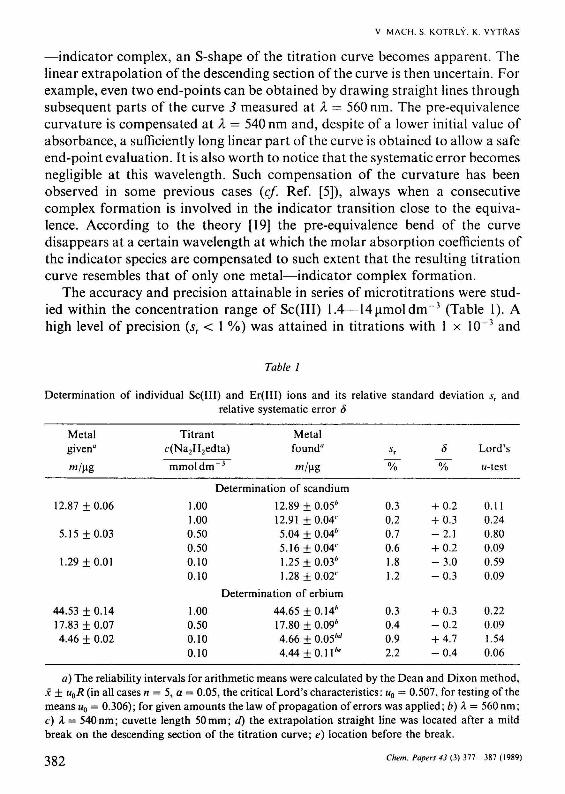
The accuracy and precision attainable in series of microtitrations were studied within the concentration range of Sc(III) 1.4—14|imoldm~3 (Table 1). A high level of precision (sr < 1 %) was attained in titrations with 1 x 10~3 and
Table 1
Determination of individual Sc(III) and Er(III) ions and its relative standard deviation sT and relative systematic error ô
Metal given"
w/ug
12.87 ±0.06
5.15 ±0.03
1.29 ±0.01
44.53 ±0.14 17.83 ±0.07 4.46 ± 0.02
Titrant c(Na2H2edta)
mmol dm
]
1.00 1.00 0.50 0.50 0.10 0.10
1.00 0.50 0.10 0.10
- 3
Metal found*
™/Hg
Determination of scandium
12.89 ±0.05* 12.91 ±0.04' 5.04 ± 0.04* 5.16 ±0.04' 1.25±0.03л
1.28 ±0.02'
Determination of erbium
44.65 ±0.14л
17.80 ±0.09л
4.66 ± 0.05м
4.44 ± 0 . 1 1 *
*г
~%~
0.3 0.2 0.7 0.6 1.8 1.2
0.3 0.4 0.9 2.2
ô
~%
+ 0.2 + 0.3 - 2 . 1 + 0.2 - 3 . 0 - 0 . 3
+ 0.3 - 0 . 2 + 4.7 - 0 . 4
Lord's
//-test
0.11 0.24 0.80 0.09 0.59 0.09
0.22 0.09 1.54 0.06
a) The reliability intervals for arithmetic means were calculated by the Dean and Dixon method, x ± u0R (in all cases n = 5, a = 0.05, the critical Lord's characteristics: w0 = 0.507, for testing of the means щ = 0.306); for given amounts the law of propagation of errors was applied; b) Я = 560 nm; с) Я = 540nm; cuvette length 50mm; d) the extrapolation straight line was located after a mild break on the descending section of the titration curve; e) location before the break.
382 Chem. Papers 43 (3) 377-387 (1989)

PHOTOMETRIC MICROTITRATIONS. IX
5 x 10~4 M-EDTA, respectively, and the results were not much affected by a change of wavelength. The standard deviations for given and found amounts of scandium were calculated by the law of propagation of errors taking into account the calibration and standardization. However, if a wavelength of 560 nm is used, a systematic deviation with respect to the amount given is beginning to show (cf. Fig. 3 and the percentage error in Table 1). This negative error is distinctly noticeable if a micromolar concentration of scandium is titrated with 5 x 10"4 M-EDTA. The results of the titration series at Я = 540 nm and pH = 3 are somewhat more precise and, what is more important, free of systematic errors.
A
0.6
0.5
0.4
0.3
0.2
0.1
0.0
I
—
—
-
4
I
I
C X ^ Q 2
I
I
1 t 1 f
1
\?
1 t
1
з 100 mm
I 4
4 4
n n n r V b ^ l r 0
1 •
-
-
-
-
-
-
-
10 15 20 25 í/mm
Fig. 3. The effect of the change of wavelength for two different concentrations of scandium. c(XO) = 4.8umoldm-3, pH = 3.0.
/, 2. Solution of Sc(III), concentration 1.43^imoldm"3, titrated with 1 x 10⁻⁴ M-EDTA. 3, 4. Solution of Sc(III), concentration 5.73umoldm"3, titrated with 5 x 10~4M-EDTA. A/nm: 1, 3.
540; 2, 4. 560. Curves 2—4 are shifted each of 6 mm.
Microtitration of erbium
Selection of optimum conditions for the determination of erbium was based on similar experiments. At the concentration level of 10 |imol dm"3 there was no difficulty in extrapolating the end-point when the titration curve was measured at Я = 570 nm, i.e. at the absorption maximum of the erbium complex with
Chem. Papers 43 (3) 377-387 (1989) 383

V M A C H , S. KOTRLÝ, K. VYTŘAS
Xylenol Orange. Within the pH range 4.1—5.7 (acetate buffers) a close agreement was obtained between the evaluated end-point and the calculated equivalence. As the deformation of the titration curve before the equivalence was detectable when a very dilute titrant was used, the influence of wavelength was studied in detail between 540 and 590 nm (c(Er3+) = 5jimoldm - 3) with the use of 5 x 10~4M-EDTA. On large-scale plots of the titration curves measured at A = 570 and 580 nm, respectively, slight bends before the equivalence were noticeable; thus two different end-points could be extrapolated. This curvature practically disappeared at Я = 560 nm and it was then possible to locate the end-point safely. The bend compensation was found to be reliable between pH 4.6 and 5.6. These conditions are valid for the use of a pure preparation of Xylenol Orange. Paradoxically, the titrations with a commercial, nonpurified XO are less liable to such end-point deviations, but the optimum wavelength should be verified experimentally for any reagent-grade XO.
The precision attainable in microtitrations of erbium was studied in detail for three series of five titrations (Table 1) in the concentration range of Sc(III) 1.3— 13nmoldirr3 (pH = 5.0, c(XO) = 4.3|imoldm-3, A = 560nm). Each of the three series of titrations is represented by one curve in Fig. 4. It can be seen
A
0.6
0.5
0.A
0.3
0.2
0.1
0,0
-
I
X*
I
I i
L 2
•l
I
I
I
100 mm3
1 3
* 1
-
-
-
-
-
-
-
-
10 15 20 25 í/mm
Fig. 4. Titration curves of erbium for different concentrations of the metal. c(XO) = 4.3 umol dm -3 , pH = 5.0, A = 560 nm.
Concentration of erbium and of EDTA (c/umoldm-3): 1. 1.33, 100; 2. 5.33, 500; 3. 13.3, 1000. Curves 2 and 3 are shifted each of 6 mm.
384 Chem. Papers 43 (3) 377—387 (1989)

PHOTOMETRIC MICROTITRATIONS. IX
that the error of a photometric titration of Er(III) is influenced predominantly only by inherent volumetric errors. Relative standard deviation was less than 1 % down to the concentration c(Er3 +) = 5.3|imoldm~3 and within this concentration range the systematic error was also negligible and statistically insignificant. However, when a micromolar concentration of erbium was titrated with 1 x 10"4M-EDTA (cf. Table 1 and curve 1 in Fig. 4), the steep section of the curve was found to be broken again into two nearly linear parts. The end-point evaluated by extrapolation of the section close to the equivalence was subject to a systematic and statistically significant error. When the upper part of the curve was used for the extrapolation, the results were somewhat less precise but free from any systematic error. The influence of blanks on the accuracy was found negligible with the buffers used in this work.
Successive titration of scandium and erbium
The accuracy and precision attained in determinations of the individual metal ions permitted to study more thoroughly the successive titration based on the pH adjustment.
For microtitrations of scandium in the presence of erbium it was necessary to adjust pH to 2.4 in order to achieve a complete conversion of Xylenol Orange into its free form. The resulting titration curve at Я = 540 nm was less steep than that at an optimum pH = 3.0 for pure scandium solutions, but the accuracy of the end-point evaluation was not affected. A typical titration curve of Sc(III) in the presence of Er(III) is illustrated in Fig. 5. When the titration of scandium
Fig. 5. Successive microtitration of scandium and erbium with 5.4 x 10"4M-EDTA.
c('XO) = 4.3umoldm-3; c(Sc3+) = 2.3umoldm-\ pH = 2.35, Я = 540nm; с(Ег3+) = 11 umoldm"3,
pH = 4.95, Я =560 nm.
Chem. Papers 43 (3) 377—387 (1989)
A
0.6
0.5
0.4
0.3
0.2
0.1
0.0
-
^
\
I I
l L —-P-ooo r • I I
i
,_ 100 ^ Q h —
i
i
mm3
H
I •
-
-
-
-
-
-
-
10 15 20 í/mm
385

V. M A C H , S. KOTRLÝ, K. VYTŔAS
Table 2
Successive determination of scandium(HI) and erbium(III) in mixtures
Metal
Sc(III) Er(III) Sc(III) Er(III) Sc(III) Er(III)
m(given)/ugü
2.06 + 0.01 35.53 ±0.11
5.15 + 0.03 17.83 ±0.07 5.15 ±0.03
10.73 ± 0.04
w(found)/ug"
2.01 ± 0.03 35.93 ± 0.28
5.09 ± 0.02 18.50 ±0.15 5.11 ±0.02
11.41 ±0.06
1.0 0.7 0.3 0.7 0.3 0.4
8
- 2 . 2 + 1.1 - 1.1 + 3.8 -0 .9 + 6.3
Lord's
w-test
0.67 0.52 0.74 1.58 0.51 3.61
Titrated with 5 x 10~4 M-EDTA, Sc(III) at pH = 2.35 and A = 540 nm, Er(III) at pH = 5.0 and A = 560 nm.
a) See the note to Table 1.
was completed, the solution was adjusted to pH = 5.0 by adding sodium acetate solution (c = 0.2 mol dm - 3 ) to continue the titration of erbium at Я = 560 nm.
On comparison with the titrations performed with the use of Methylxylenol Blue as indicator [8] under similar conditions the titration curves obtained with Xylenol Orange were much steeper. It was thus possible to consider a successive determination with a more dilute titrant than the common 0.001 M-EDTA. As shown by the statistical data in Table 2, it was possible to achieve precise results even with 5 x 10~4 M-EDTA; however, the end-points were subject to systematic deviations when the concentration of erbium titrated was lower than 5|imoldm - 3 The differences for both scandium and erbium were found to be statistically significant. In the three series of titrations with different mole ratio of the two metals the amount of scandium found was always lower, whereas that of erbium was systematically higher than the given amount. It is also interesting to note that the observed systematic error cannot be explained in the obvious way that a certain amount of scandium is left free in solution when the first end-point is reached to be then titrated together with erbium. Namely, the positive error for erbium (in |imol) is greater than the corresponding deviation for scandium. In our experiments the possibility to ascribe these deviations to the blank values at both pH values, as suggested by Hafez and Emam [9], was carefully eliminated. Contrarily, these systematic deviations were actually detectable owing to a high degree of precision attained in titrations of individual metal ions.
It may be assumed that in similar situations such small systematic errors are encountered; however, they are usually explained vaguely, e.g. as due to inaccurate visual end-point location. A further investigation of the equilibria involved
386 Chem. Papers 43 (3) 377—387 (1989)

PHOTOMETRIC MICROTITRATIONS. IX
in such successive chelatometric titrations may help to elucidate the phenomena limiting the accuracy attainable in chelatometry.
References
1. Kotrlý, S., Mach, V., Říha, V., Vytřas, K., and Zimáková, M., Sb. Ved. Pr., Vys. Sk. Chemicko-technoi, Pardubice 35, 9 (1976).
2. Analytical Methods Committee, Analyst (London) 100, 675 (1975). 3. Analytical Methods Committee, Analyst (London) 103, 93 (1978). 4. Kotrlý, S. and Vytras, K., in Analytical Chemistry, Essays in Memory of Anders Ringbom.
(Wänninen, E., Editor.) P. 259. Pergamon Press, Oxford, 1977. 5. Kotrlý, S. and Vřešťál, J., Collect. Czechoslov. Chem. Commun. 25, 1148 (1960). 6. Vytras, K., Malcová, M., and Kotrlý, S., Chem. Zvesti 29, 599 (1975). 7. Schwarzenbach, G., Gut, R., and Anderegg, A., Helv. Chim. Acta 37, 937 (1954). 8. Kotrlý, S., Mach, V., and Vytras, K., Chem. Zvesti 33, 499 (1979). 9. Hafez, M. A. H. and Emám, M. S. M., Analyst (London) ///, 1435 (1986).
10. Šrámková, J., Hafez, M. A. H., Kotrlý, S. et al., unpublished results. 11. Kornev, V. L, Zh. Anal. Khim. 32, 1533 (1977). 12. Onosova, S. P. and Aleksashina, N. A., Zh. Anal. Khim. 33, 489 (1978). 13. Lyle, S. J. and Rahman, M. M., Talanta 10, 1177 (1963). 14. Vřešťál, J., Havíř, J., Brandštetr, J., and Kotrlý, S., Collect. Czechoslov. Chem. Commun. 24, 360
(1959). 15. Přibil, R., Applied Complexometry, p. 105. Pergamon Press, Oxford, 1982. 16. Kotrlý, S. and Vytřas, K., Sb. Ved. Pr., Vys. Sk. Chemickotechnoi, Pardubice 19, 21 (1969). 17. Kotrlý, S. and Říha, V., Czechoslov. 169941 (1972). 18. Definition of pH Scales, Standard Reference Values, Measurement of pH and Related Ter
minology. Pure Appl. Chem. 55, 1467 (1983). 19. Kotrlý, S., Anal. Chim. Acta 29, 552 (1963).
Translated by S. Kotrlý
Chem. Papers 43 (3) 377—387 (1989) 387