photoreceptor death: spatiotemporal patterns arising from one-hit death kinetics and a diffusible...
TRANSCRIPT

Available online at http://www.idealibrary.com ondoi:10.1006/bulm.2002.0320Bulletin of Mathematical Biology(2002)64, 1117–1145
Photoreceptor Death: Spatiotemporal Patterns Arisingfrom One-hit Death Kinetics and a Diffusible Cell DeathFactor
JONATHAN BURNS
Department of Mathematics,
University of Toronto,
Toronto, Ontario,
Canada M5S 3G3
GEOFF CLARKE AND CHARLES J. LUMSDEN∗
Department of Medicine,
MSB 7313, University of Toronto,
Toronto, Ontario,
Canada M5S 1A8E-mail: [email protected]
Retinitis pigmentosa (RP) is an inherited disease affecting approximately 1 : 4000individuals in North America. It is characterized clinically by the gradual apoptoticdeath of photoreceptor cells that occurs nonuniformly across the surface of theretina. Recently, it has been demonstrated that the time of death of many individualphotoreceptors is random, a fact that must be reconciled with the spatiotemporalpatterns of photoreceptor degeneration that are observed in patients with RP.One possible explanation is that a diffusible toxic factor is released by dyingphotoreceptors and induces adjacent cells to likewise undergo apoptosis. Todetermine if such a mechanism can result in patchy distributions of photoreceptordeath, as frequently observed in RP patients, we studied cell attrition produced bya bistable biochemical switch in an idealized one-dimensional retina. We foundthat with a reasonable choice of parameter values, our model was able to producepatterns of cell death resembling those observed in RP. In the context of this model,patches on the order of histologically observable size could develop from a singlerelease event, but their rates of formation were independent of the concentration oftoxic factor released. Instead, factor concentration affected the overall rate of celldeath, the number of degenerating patches, and their distribution across the retina.
c© 2002 Society for Mathematical Biology. Published by Elsevier Science Ltd. Allrights reserved.
∗Author to whom correspondence should be addressed.E-mail: [email protected]
0092-8240/02/061117 + 29 $35.00/0 c© 2002 Society for Mathematical Biology. Published byElsevier Science Ltd. All rights reserved.

1118 J. Burnset al.
NOMENCLATURE
MSS mutant steady statePACF photoreceptor apoptosis commitment factor (extracellular agent)C PACF concentration, molc C/κ4
c0 initial value ofccmax the maximum c givenx for t ∈ [0, ∞)
ccrit saddle-node bifurcation point of equation (6)c∗ a constant value of PACF concentration> ccrit
S concentration of apoptosis activation factor (intracellular agent),mol
s S/√
κ6
s01, s0
2, s03 fixed points of equation (6) atc = 0
s1, s2, s3 fixed points of equation (6) atc 6= 0scrit threshold of obligatory cell death∀cA0 delta function burst amplitude ofc0
L length unit (= diameter 10 photoreceptors), mX spatial variable, mx X/Lx0 position of an initial PACF releaseD PACF diffusion constant, m2 s−1
T time variable, st DT/L2
1tsw time fors to increase from 0 toscrit atc ≡ c∗
tmax time at which c reachescmax at xt∗
m times at whichc(x, t) = c∗ at x during multiple PACF releasestTotabove total time thatc ≥ c∗ during multiple PACF releasesδtMax
above largest single interval of time such thatc ≥ c∗ during multiplePACF releases
M number of timesc = c∗ at x during multiple PACF releasesJ number of time intervals for whichc ≥ c∗ at x during multiple
PACF releasesNsw number of cells recruited to apoptosisκ PACF uptake gain parameterK κκ4/
√κ6
k Kk3
κ2 rate constant PACF degradation, s−1
k2 κ2L2/Dκ4
κ3 maximal PACF uptake rate, mol s−1
k3 κ3L2/Dκ4
κ4 PACF concentration at half-maximal uptake rate, molk1 nondimensionalized PACF sink rate, combining degradation and
uptake
Spatial Patterns in Retinal Cell Death 1119
κ5 maximal rateSactive feedback, mol s−1
k5 κ5L2/√
k6Dκ6 Sconcentration2 at half-maximal feedback rate, mol2
κ7 switch molecule degradation rate constant, s−1
k7 κ7L2/D
1. INTRODUCTION
The human retina is affected by numerous inherited diseases which result inblindness. Over 130 discrete genetic loci have been associated with retinaldegeneration in humans (Daiger et al., 2002). Many of these diseases affectthe primary neurons of the retina, the rod and cone photoreceptor cells thatare responsible for converting light into a neural signal. In most progressivephotoreceptor degenerations, the function of both cone and rod photoreceptorsis compromised, but the degree to which these cell types are affected variesamong disorders. For example, retinitis pigmentosa (RP), a heterogeneous groupof disorders that affect approximately one in every 4000 individuals (Pagon,1988; Berson, 1993), is characterized by a specific and predominant loss of rodfunction. As the disease advances, the preferential loss of rod photoreceptors inthe peripheral retina leads to tunnel vision, which is followed by a complete lossof vision as the cone photoreceptors in the central retina ultimately degenerate(Pagon, 1988; Milam et al., 1998).
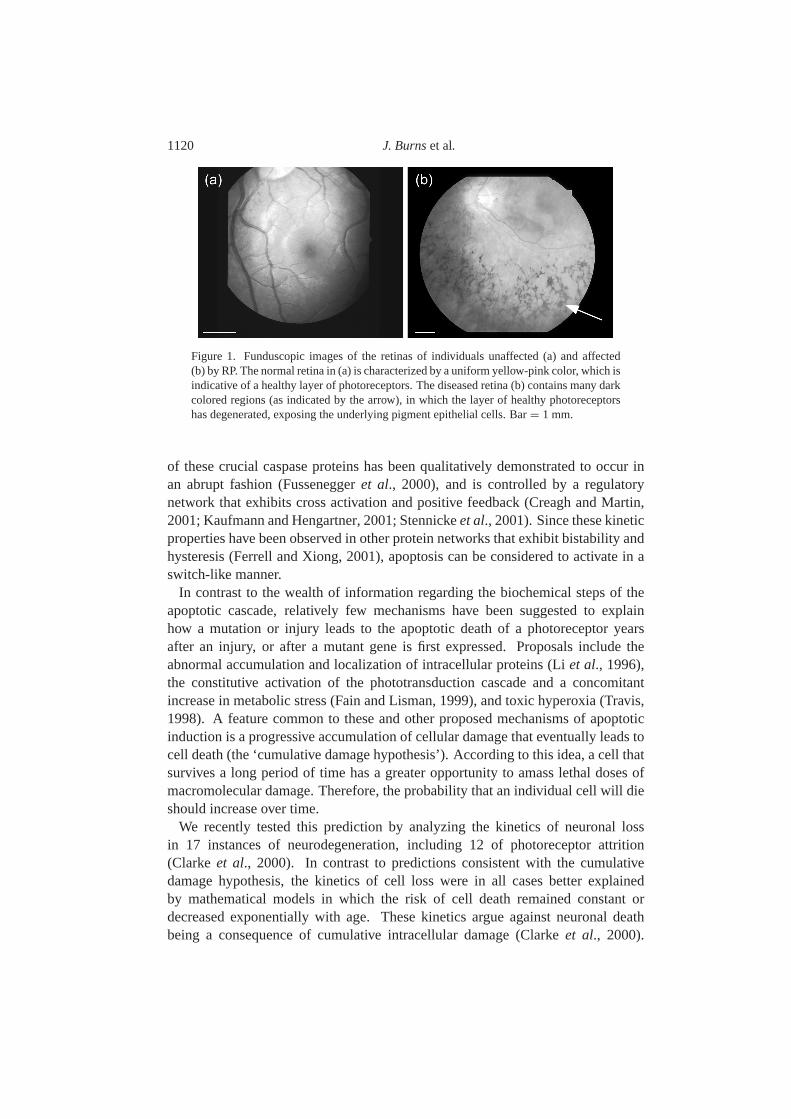
During the course of photoreceptor degeneration, cells do not always dieuniformly over the surface of the retina. Rather, photoreceptors initially succumbto the disease in spatially isolated patches [Fig.1; see alsoCampochiaroet al.(1996), Cideciyanet al. (1998), Ma et al. (1998)]. These patches coalesce asmore cells die, eventually resulting in the complete loss of photoreceptors acrossthe retina. While the identification of the factors responsible for producing thisspatial patterning may lead to methods that can ameliorate their formation andtherefore partially mitigate the effects of photoreceptor degeneration on patients,their precise nature currently remains unknown.
Histological analysis has revealed that a common feature of the retinas of RPpatients, and of numerous animal models of RP, is that photoreceptors undergoapoptotic cell death (Reme et al., 1998). Apoptosis, a process that can takeon the order of 1 h (Jacobsonet al., 1997) to 24 h (Kerr et al., 1972) tocomplete, is characterized by the active initiation of specific biochemical signalingpathways that lead to cellular degeneration, and is thus often described as ‘cellularsuicide’ (Yuan and Yankne, 2000). Structurally, apoptotic cells exhibit plasmamembrane blebbing, chromatin and cytoplasmic condensation, and the activationof intracellular proteases (the caspases) that degrade key proteins before the cellis ultimately disposed of by macrophages or adjacent cells (Kerr et al., 1972;Reme et al., 1998). The transition between the inactivated and activated forms
1120 J. Burnset al.
Figure 1. Funduscopic images of the retinas of individuals unaffected (a) and affected(b) by RP. The normal retina in (a) is characterized by a uniform yellow-pink color, which isindicative of a healthy layer of photoreceptors. The diseased retina (b) contains many darkcolored regions (as indicated by the arrow), in which the layer of healthy photoreceptorshas degenerated, exposing the underlying pigment epithelial cells. Bar= 1 mm.
of these crucial caspase proteins has been qualitatively demonstrated to occur inan abrupt fashion (Fusseneggeret al., 2000), and is controlled by a regulatorynetwork that exhibits cross activation and positive feedback (Creagh and Martin,2001; Kaufmann and Hengartner, 2001; Stennickeet al., 2001). Since these kineticproperties have been observed in other protein networks that exhibit bistability andhysteresis (Ferrell and Xiong, 2001), apoptosis can be considered to activate in aswitch-like manner.
In contrast to the wealth of information regarding the biochemical steps of theapoptotic cascade, relatively few mechanisms have been suggested to explainhow a mutation or injury leads to the apoptotic death of a photoreceptor yearsafter an injury, or after a mutant gene is first expressed. Proposals include theabnormal accumulation and localization of intracellular proteins (Li et al., 1996),the constitutive activation of the phototransduction cascade and a concomitantincrease in metabolic stress (Fain and Lisman, 1999), and toxic hyperoxia (Travis,1998). A feature common to these and other proposed mechanisms of apoptoticinduction is a progressive accumulation of cellular damage that eventually leads tocell death (the ‘cumulative damage hypothesis’). According to this idea, a cell thatsurvives a long period of time has a greater opportunity to amass lethal doses ofmacromolecular damage. Therefore, the probability that an individual cell will dieshould increase over time.
We recently tested this prediction by analyzing the kinetics of neuronal lossin 17 instances of neurodegeneration, including 12 of photoreceptor attrition(Clarke et al., 2000). In contrast to predictions consistent with the cumulativedamage hypothesis, the kinetics of cell loss were in all cases better explainedby mathematical models in which the risk of cell death remained constant ordecreased exponentially with age. These kinetics argue against neuronal deathbeing a consequence of cumulative intracellular damage (Clarke et al., 2000).

Spatial Patterns in Retinal Cell Death 1121
Subsequently, we have extended this finding to a provisional analysis of neuronalloss in amyotrophic lateral sclerosis and found the same pattern of neuronal celldeath over time (Clarkeet al., 2001).
To account for the random occurrence of neuronal death, we have proposed amodel in which mutant or injured cells enter an abnormal homeostatic state referredto as the mutant steady state (MSS) (Clarkeet al., 2000, 2001). The MSS differsfrom the normal cell state in that it is associated with an increased risk of a cellundergoing apoptosis. In our proposal, exit from the MSS and commitment tocell death takes place when random fluctuations in the level of mutant responseproteins, genes, or metabolites exceed a critical threshold. Once this thresholdis crossed, the cell becomes irreversibly committed to apoptosis. According tothe MSS model, intracellular biochemical fluctuations drive the random nature ofneuronal cell death.
It is not yet understood if, or how, the MSS mechanism of random photoreceptorloss could produce the patches of cell death that sometimes accompany photore-ceptor degeneration (Campochiaroet al., 1996; Cideciyanet al., 1998; Ma et al.,1998). In the MSS study six examples of photoreceptor degeneration exhibitedan exponentially decreasing risk of cell death with age (Clarkeet al., 2000). Wehave argued that this pattern of cell death could result from a progressive increasein the concentration of a diffusible survival factor that is critical to photorecep-tor viability, or by a gradual decrease in the concentration of a factor that is toxicto photoreceptors. In this report, we will consider whether the production of dif-fusible factors that influence the rate of cell death in the retina may also provide aroute by which patches of apoptotic photoreceptors form.
Evidence supporting a role for diffusible factors during photoreceptor degenera-tion has been provided by numerous studies. For example, chimeric mice have beenderived in which some photoreceptors are genetically normal, while other photore-ceptors carry a specific mutation that results in their death (Huanget al., 1993).Remarkably, normal photoreceptors in these animals die at roughly the same rateas the mutant cells, indicating that photoreceptors produce either diffusible survivalor toxic factors. Similarly, when retinas isolated from mutant animals are grown inco-cultures with normal retinas, a significantly greater proportion of cones survivein the mutant retinas when compared to cultures containing mutant retinas alone(Mohand-Saidet al., 1998). This result indicates that normal retinas produce adiffusible substance that promotes survival of cone photoreceptors.
Analyses, both in tissue culture andin vivo, have led to the identification ofseveral factors capable of altering the kinetics of photoreceptor degeneration.For example, when basic fibroblast growth factor (FGF-2) is added to culturesof normal photoreceptors (Fontaineet al., 1998), or injected directly into thephotoreceptor extracellular space in mutant rats (Faktorovich, 1990), a dramaticincrease in photoreceptor survival was observed in comparison to control retinas.However, it remains unclear whether or not the concentration of known trophicfactors increases over time in the degenerating retina, and can therefore result in a

1122 J. Burnset al.
decreasing risk of photoreceptor death of the kind we have observed. Arguingagainst this possibility is the fact that some of these factors, such as FGF-2(Gao and Hollyfield, 1995), are produced by the photoreceptors themselves.Consequently, as photoreceptor numbers declined, less of the trophic factor wouldbe produced.
In contrast, the involvement of a toxic factor that is produced by injured ormutant photoreceptors themselves seems an appealing alternative, since less ofthis factor would be produced as more photoreceptors die. Supporting thismechanism of generating decreasing risk is the observation that epidermal growthfactor (EGF) can enhance the rate of photoreceptor cell death in culture (Fontaineet al., 1998). Additionally, dying retinal progenitor cells have been shown torelease a heat-labile, diffusible factor into the extracellular medium that caninduce apoptosis in normal photoreceptors (Seigel and Liu, 1997), providingdirect evidence that photoreceptor death-inducing factors are produced duringphotoreceptor degeneration, and that they can affect the kinetics of cell death.
The original conception of the MSS model was developed to explain the kineticsof cell death observed within an entire population of neurons. To determinewhether the principles inherent in the MSS also support the generation of patches ofphotoreceptor death, we studied a mathematical model based both on the principlesof the MSS proposal (Clarke et al., 2000, 2001) and on the diffusion of anapoptosis promoting factor that is released from dying photoreceptors. The caseof extaneuronal discharge of survival factors, rather than cell death factors, will betreated subsequently.
2. MODEL ASSUMPTIONS
2.1. Kinetic properties. We consider a mechanism involving a bistable switch incell state from the viable MSS to activation of the cell’s apoptosis pathway. Thetransition from one state to the other is driven by transient changes in the attractorstructure of the switch kinetics. These temporary changes arise from intercellularsignaling events that, for brief periods, destroy the stability of the MSS attractorand make apoptosis activation the global attractor of cytoplasmic function. The cellis then drawn from the MSS to a state of apoptosis commitment. Earlier work hasestablished that such kinetic switches, driven by events which briefly reorganize theattractor structure, can sustain complex spatiotemporal pattern formation (Lewiset al., 1977; Murray, 1981, 1989). However, the time intervals involved in thedynamics of attractor reorganization and ensuing state changes, and the patternformation characteristics of such models in the presence of factor release viarandom cell death, have not as yet been intensively studied.
The relevant cell state is determined in our model by the concentrationS of anintracellular factor that activates the photoreceptor’s apoptotic cascade. (Wherethere can be no confusion from ambiguity we will also use the symbolS to denote
Spatial Patterns in Retinal Cell Death 1123
the intracellular factor itself.) The level of expression or activation ofS is in turncontrolled byC, the extracellular concentration of a diffusible factor released intothe retinal extracellular space by dying photoreceptors. This photoreceptor apop-tosis commitment factor (PACF hereafter) interacts with receptors on the retinalcells. The PACF may thereby induce changes in the kinetics and intracellular lev-els of S that take the cell from the MSS to the cell death state. Once in this state,genomic and cytoplasmic activity mobilize the molecular apparatus required forapoptotic disassembly of the cell.
So that we may represent the interaction of retinal cell apoptosis, death factorrelease, processing, and the transition to cell death commitment in the simplestpossible terms, we deal here with a one-dimensional retina in which all photore-ceptors start out in the MSS and therefore exhibit an increased risk of randomlyundergoing apoptosis compared with normal photoreceptors (for which the risk ofattrition through apoptosis is negligible over a normal life span). The spatiotem-poral pattern of PACF release and concentration in this one-dimensional array ofcells will determine whether a particular photoreceptor, or region of photorecep-tors, commits to apoptosis. We will see that the time intervals over which photo-receptors are exposed to critical concentrations of PACF play a prominent role inunderstanding the relation between retinal PACF dynamics and the subsequent pat-terns of cell death commitment.
Empirically, the exact timing of diffusible factor release within the contextof photoreceptor cell death is not yet fully clarified.Seigel and Liu(1997)reported a diffusible apoptosis-promoting factor released by cultured photoreceptorprogenitor cells that exhibited significant cell death. It is not as yet known if factorsof this kind are produced by cells actively undergoing apoptosis, or if they arereleased by photoreceptors not yet committed to die, as a mechanism to expeditethe removal of dying photoreceptors from the surrounding medium (Seigel and Liu,1997). Since the latter possibility would result in a rapid, catastrophic degenerationof photoreceptor cells within a mutant retina, we will assume here that PACFis released only by those photoreceptors actively undergoing the final stages ofapoptosis.
The photoreceptor state behavior is described by the equations
∂C
∂T(X, T) = D
∂2C
∂ X2− κ2C −
κ3C
κ4 + C(1)
∂S
∂T(X, T) = κ
κ3C
κ4 + C+
κ5S2
κ6 + S2− κ7S (2)
where X denotes position in the retina andT is the time. Equation (1) governsthe spatiotemporal behavior of the PACF concentrationC(X, T), and containsa diffusion term, with coefficientD, plus two sink terms. The first sink termexpresses the PACF degradation rate in the retinal extracellular space. The secondis the removal of the death factor from the extracellular space by uptake into the

1124 J. Burnset al.
photoreceptors.κ3 is the maximal rate of uptake andκ4 is the concentration ofC(X, T) at half-maximal uptake rate.
Equation (2) controls the intracellular concentrationS(X, T) of apoptosis path-way activation factor. Our dynamics forS is based on Mitchison’s irreversiblethreshold model (Lewis et al., 1977; Murray, 1981, 1989) generalized to includephotoreceptor uptake of PACF.κ5 is the maximal rate of positive feedback exhib-ited by S, κ6 is the level ofS at which positive feedback is at half maximal rate,andκ7 is the degradation rate constant. The gain parameterκ models the impactof PACF uptake on change in cell state. As we noted in Section1, considerableevidence, from both empirical and modeling studies, now supports the idea thatpositive feedback has a key role in the kinetics of apoptosis pathways within thecell. The Mitchison model captures the role of positive feedback in bistable kineticswitching in an idealized but highly tractable form.
It is convenient to work with the dynamics expressed in nondimensionalizedform. Since PACF diffusion drives cellular recruitment to apoptosis in this model,it is natural to nondimensionalize time in terms of the PACF diffusion constant.Similarly, we define a spatial scale in which one length unitL suffices to containa small patch of apoptotic cells. We setL = the diameter of 10 photoreceptors.Accordingly, the new space and time variables aret = DT/L2 and x = X/L.Then withc(x, t) ≡ C(X, T)/κ4 ands(x, t) ≡ S(X, T)/
√κ6
∂c
∂t(x, t) =
∂2c
∂x2− k2c −
k3c
1 + c(3)
∂s
∂t(x, t) = K
k3c
1 + c+
k5s2
1 + s2− k7s (4)
with the κ j mapped to thek j . If PACF uptake into photoreceptors normallyapproached saturation, we would expect accumulation of the factor over time in theretinal extracellular matrix space. Since this accumulation has not been observed,we assume for the purposes of this model that PACF uptake is unsaturated andthe corresponding uptake function effectively linear inc(x, t). The two sourcesof PACF elimination from the extracellular environment (degradation and uptake)may then be combined into one term governed by an effective rate constantk1. Theresulting dynamics is
∂c
∂t(x, t) =
∂2c
∂x2− k1c (5)
∂s
∂t(x, t) = k c+
k5s2
1 + s2− k7s, (6)
where k denotesKk3. To return for a moment to the case of PACF uptakesaturation, it is clear that asc → ∞ the leading term in (4) approaches theautonomous positive inputKk3. As noted, current evidence does not support the
Spatial Patterns in Retinal Cell Death 1125
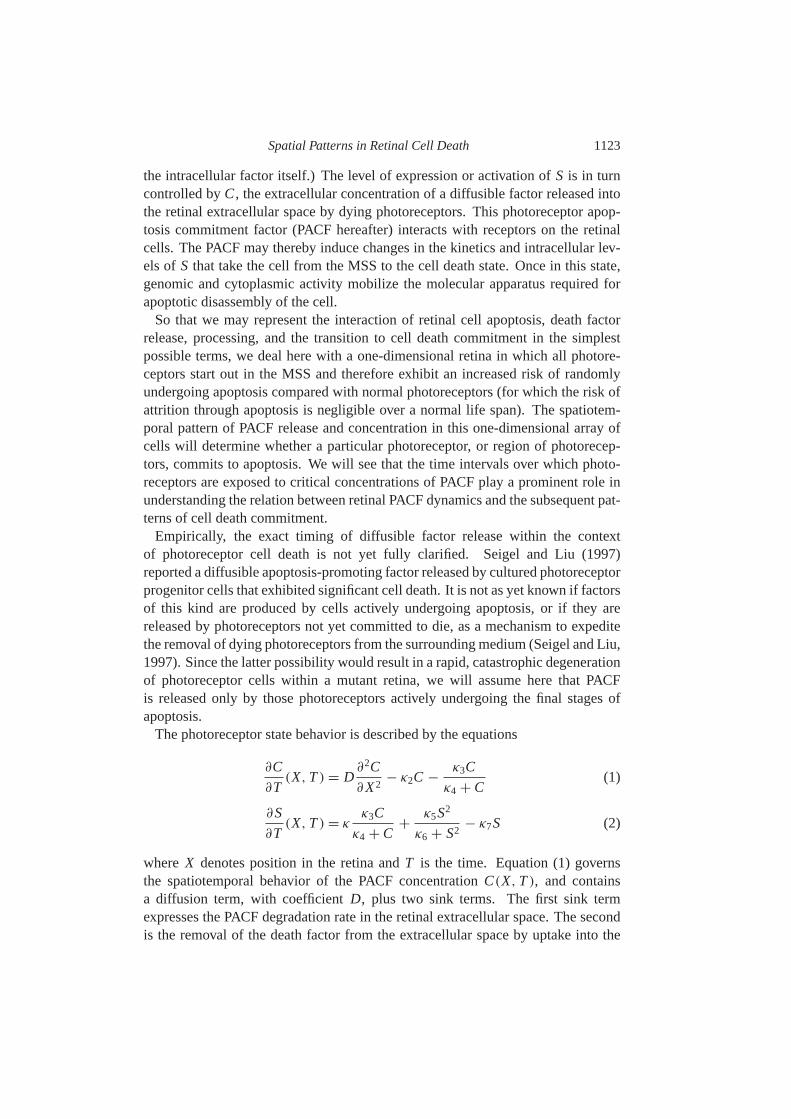
Figure 2. The time rate of change∂s/∂t of apoptosis activation factor forms a one-parameter family of nonintersecting curves parameterized by the extracellular PACFconcentrationc. Curve a.,c = 0; curve b., 0< c < ccrit; curve c.,c = ccrit; curved.,c ≡ c∗ > ccrit. The number of roots∂s/∂t ≡ 0 runs 3→ 2 → 1 asc goes 0→ ccrit →
c∗. Solid dots, stable attractor points; open, unstable; open with interior dot, mixed. Thesolid arrowheads depict the direction of local change in∂s/∂t ands for a givenc; the openarrowheads show the direction in which the attractorss1, s2, ands3 shift along thes axisasc changes.
existence of such massive extracellular buildups of PACF during RP. However,rapidly propagating fronts of cell death associated with abrupt massive releasesof PACF, and transport channel saturation, may be of interest for retinal lesionscaused by sudden severe insult (such as retinal detachment following blunt traumaand large-scale photoreceptor destruction induced by drug toxicity). These will beconsidered elsewhere.
At c = 0 equation (6) has three fixed points, given by
s01 = 0, s0
2,3 =1
2
(k5
k7∓
√(k5
k7
)2
− 4
)(7)
with s01 < s0
2 < s03 (Fig. 2, Curve a.). The fixed pointss0
1 ands03 are stable, whereas
the intermediate points02 is unstable [Burns(2000); see alsoLewis et al. (1977),
Murray (1981)]. If three real roots exist, i.e., whenk5 > 2k7, the system willexhibit bistable switching behaviors0
1 ↔ s03 characterized by thresholds0
2.The last two components in equation (6) sum to the value of∂s/∂t evaluated at
c = 0, i.e.,
∂s
∂t
∣∣∣∣c=0
=k5s2
1 + s2− k7s. (8)
Since all parameters and variables are positive, it follows that in general
∂s
∂t
∣∣∣∣c6=0
= kc+∂s
∂t
∣∣∣∣c=0
>∂s
∂t
∣∣∣∣c=0
, (9)
1126 J. Burnset al.
so for c 6= 0 the rate of switching to the apoptotic state uniformly exceeds therate if c is once more removed from the extracellular environment. We concludethat if c 6= 0 and three real roots—call thems1, s2 ands3 for this value ofc >
0—persist, it must be thats1 > 0 , s2 < s02 ands3 > s0
3. Furthermore, sincekc isitself monotonically increasing withc, the rate∂s/∂t of switching at a death factorconcentrationc + 1 will always exceed the rate atc if 1 > 0. Hence for fixedvalues ofc, ∂s(x, t |c)/∂t forms a one parameter family of nonintersecting curvesparameterized by c (Fig.2).
Let ccrit denote the critical PACF concentration at which the right-hand side ofequation (6) has just two real roots (Fig.2, Curve c.). Atccrit, s1 ands2 merge intoan unstable fixed point whiles3 remains stable. The switching dynamics undergoesa saddle-node bifurcation. When the local concentrationc of death factor exceedsccrit, s3 is stable and is the only fixed point (Fig.2, Curve d.). This follows fromthe observation thats3 > s0
3 for all values ofc > 0. Considering the desiredresponse of the model to increases in PACF concentrationc, it is therefore naturalto associate the fixed points1 with the pre-apoptotic cell state (the MSS) ands3
with the state of commitment to apoptosis. The unstable fixed points2 marks thethreshold between thes1 ands3 basins of attraction.
The c = 0 value ofs2, s02, has the interesting property of defining a border of
obligatory commitment to apoptosis for all values ofc in this model. We cansee this by considering some value ofs2 < s0
2 corresponding to a nonzero PACFconcentration, such thats(x, t) ∈ (s2, s0
2) at timet . If the diffusion, uptake, release,and degradation of cell death factor conspire to hold PACF concentration more orless constant for a period of time—an additionalτ time units, for example—thens(x, t + τ) will approachs3. But if the concentration of PACF drops atx so thats2
moves to a new values′
2 > s2, it is possible thats(x, t + τ) may no longer lie in thebasin of attraction surroundings′
3. This will be so ifs(x, t + τ) < s′
2; the cell states will then be attracted back tos′
1. Defining a boundary of obligatory commitmentto cell death asscrit = s0
2 ensures that onces(x, t) > scrit, thens is attracted tos′
3for all c.
When PACF is released by a dying photoreceptor, its concentrationc increaseslocally as death factor diffuses into neighboring elements of the photoreceptor cellpopulation. Before their response to PACF, these neighboring cells are in the MSS,i.e., s0
1 ≡ 0. Unless the PACF concentrationc subsequently exceedsccrit the s3
attractor, which corresponds to apoptosis activation, can exert no influence on cellfate: s(t) remains in thes1 basin of attraction. Ifc does exceedccrit, s1 ands2
annihilate ands(t) begins to move towards3. However, as we see from Fig.2,the ambient PACF concentrationc must remain aboveccrit long enough fors(t) toincrease froms(t = 0) = 0 and pass the values2(ccrit) beforec falls back belowccrit. In fact, oncec < ccrit ands1 ands2 reform,s(t) must increase fast enough tostay ahead of the ‘MSS capture front’ defined bys2(c) for falling c. If it does not,there will be some timet for which s(t) < s2(c(t)) ands(t) will be re-capturedby thes1 attractor basin and return to the MSS. Although in general the conditions

Spatial Patterns in Retinal Cell Death 1127
for s(t) to evade capture bys2(c(t)) will not have a concise form, the situationsimplifies greatly if∂s/∂t suffices to drives > scrit while c > ccrit. As we have justseen, the cell state established bys(t) commits obligatorily to apoptosis once theconcentration of apoptosis activation factor exceedsscrit, irrespective of subsequenttrends in ambientc(t). Thus it is clear that a switch from the MSS to apoptosis viaexposure to PACF must occur if the cell seesc > ccrit long enough fors to crossscrit at x beforec(x, t) falls back belowccrit. We will call this time interval1tsw.Once the physical parameters of the model are specified, it is possible to establishboth analytic and numerical estimates for the transition time1tsw, and clarify itskey role in characterizing the response of the photoreceptor population to dyingcells and bursts of PACF release.
2.2. Death factor bursts. To set the equation of motion for the response ofsto bursts of PACF released by the apoptosis of nearby photoreceptors, we firstconsidered equation (5) for the case of a single burst (single photoreceptor death).In (5) we tookc → ceat so that
∂c
∂t=
∂2c
∂x2− (k1 + a)c. (10)
Whena = −k1 we are left with the fundamental solution (Evans, 1998)
φ(x, t) =e−k1t
√4π t
e−x24t . (11)
For an initial retinal PACF patternc(x, 0) = c0(x) on R × (t = 0) for thephotoreceptor arrayR and with a fundamental solution given by (11), the initialvalue problem for equation (5) then is solved by the convolution
c(x, t) =
∫R
φ(x − x′, t)c0(x′)dx′ (12)
=e−k1t
√4π t
∫R
e−(x−x′)2
4t c0(x′)dx′. (13)
Given the small size of a single dying cell relative to the degenerative patchesobserved in RP (Fig.1), release of PACF from an individual photoreceptor at celldeath is conveniently modeled as a Dirac delta function, so thatc0(x) = A0δ(•)
and the PACF function corresponding to a single release atx = x0, time t = 0 is
c(x, t) =A0
√4π t
e−
((x−x0)2
4t +k1t), t > 0. (14)
For a cell death event atx = x0 the PACF concentration subsequently attains amaximum value
cmax(x) = A0(k1/πα)12 e
12
(−4k1η2
α+1)
(15)

1128 J. Burnset al.
for any locationx in the retina such that|x−x0| = η, whereα = −1+√
1 + 4k1η2.The time elapsed fromt = 0 to attain this maximal death factor concentrationcmax
at x is
tmax(x) = α(x)/4k1. (16)
The extension of (14) to patterns involving multiple cell deaths occurring simulta-neously att = 0 is straightforward.
The dynamics of apoptosis activation in a photoreceptor exposed to a localburst (14) in PACF concentration then follows the rate equation
ds
dt= k
A0√
4π te−
((x−x0)2
4t +k1t)
+k5s2
1 + s2− k7s, t > 0, (17)
and similarly for multiple PACF bursts originating from various retinal positionsand release times. Since in this model changes ins(x, t) are confined to the interiorof the photoreceptors and so occur only locally,∂s/∂t is completely equivalent tods/dt at eachx. Cell deaths induced by PACF releases with initial burst amplitudes0.5 ≤ A0 ≤ 2.5 were studied.
2.3. Random photoreceptor death and recruitment to death cascades.Toexplore the effects that the induced bursts of PACF release may exert on thespatial patterns of retinal degeneration, we simulated cascades of PACF-inducedphotoreceptor death in the one-dimensional retina. Each cell death event releaseda PACF burst and the cell state dynamics were then solved numerically for all cellsin the retina while tracking their exposure to the net PACF concentration resultingfrom all bursts. Thus for each simulation, the totalc(x, t) from primary releasesand induced death events was calculated via (14) etc. for all cell positionsx in theretina at each time step and the numerical solution for thes(x, t) dynamics (17) ateachx calculated as photoreceptor apoptosis continued.
Each photoreceptor switching to the apoptosis commitment states3 was assigneda lifetime in s3. This lifetime represented the time elapsed between the cell’scommitment to apoptosis and the completion of its apoptotic breakdown process,including PACF release. Current data suggest that transit along the apoptosispathway takes a cell about 1–24 h. For example, apoptosis that occurs naturallyduring development may take place in 1 h or less (Jacobsonet al., 1997), whereascultured adult rat cardiomyocytes that are exposed to apoptosis-inducing factorsrequire approximately 24±4 h (mean± s.d.) to complete (Maruyamaet al., 2001).Accordingly, a lifetime in thes3 state was assigned to each switched photoreceptorusing stochastic simulation procedures (Gillespie, 1976, 1977).
One battery of simulations was run in which thes3 lifetimes followed anormal (Gaussian) distribution. Two parameterizations of the Gaussian lifetimedistribution were considered. The first parameterization set thes3 mean± s.d. to

Spatial Patterns in Retinal Cell Death 1129
12±2 h and allowed us to follow the formation of small, focal patches of cell deathin detail. The second parameterization, withs3 mean± s.d.= 125± 21 min, alsokept the mean-to-s.d. ratio observed experimentally but allowed us to follow celldeath across much larger regions via the computational resources available to us.The total numbers of recruited and apoptotic cells were calculated as a functionof time. We were thus able to study the progression from primary PACF releaseto the recruitment of surrounding photoreceptors to thes3 state, followed by thesubsequent PACF release from thes3-induced cells that resulted from each celldeath and PACF burst event.
We also performed a second battery of photoreceptor death simulations. Inthese runs the characteristic lifetime ofs3 was calculated according to the recentlyobserved exponential distribution of photoreceptor drop-out (Clarkeet al., 2000,2001). As in the battery of simulations based on the Gaussian distribution ofs3 lifetimes, these exponential simulations used a parameterization (cell deathrate constant= 7 × 10⁻⁵) sufficient to produce statistically nontrivial amountsof photoreceptor death per run. The results were compared to those yielded bythe simulations performed with the normal distribution, to determine which modelof s3 transit times could best reproduce the observed patterns of photoreceptordegeneration and overall rate of photoreceptor apoptosis.
2.4. Parameter values. The basic unit of length characterizing the model’snondimensionalized behavior isL, which as noted is taken here as the width of10 photoreceptors (∼10 µm). Diffusion coefficients for intercellular signalingfactors in the retina itself are not as yet available. However, we can approximate therequired values by noting that the brain and retina are tissues composed of similarcell types, and that the diffusion coefficient of human recombinant NGF in the ratbrain has been estimated to be 4× 10⁻¹¹ m2 s−1 (Krewsonet al., 1995), so thatt ∼ 0.4 s−1
× T . Additionally, a first-order rate constant∼4× 10⁻⁴ s−1 (Krewsonet al., 1995) for NGF removal in brain neurophil gives a nondimensionalized PACFelimination ratek1 = 0.001.
It is clear from equation (7) that the MSS states01, the thresholds0
2, and theapoptosis commitment states0
3 exist in this model whenk5 > 2k7. Ask5/k7 → ∞,however,s0
2 → s01 and the time required for the cell to transition from the MSS
to apoptosis commitment approaches zero. The value ofk5/k7 is therefore animportant determinant of the model’s response to PACF release. Functionally, theresponse cannot be considered switch-like if it takes as long as, or longer than, theapoptotic breakdown process itself. Similarly, switches that are instantaneous orotherwise too fast (as they will be e.g., whenk5 � k7) are also of no biologicalinterest. We noted above that apoptotic breakdown operates with characteristictimes on the order of hours, so for the purposes of this study we stipulated thatthe transition in cell state happens faster, requiring times of seconds to minutes—times that accord with current model-based empirical estimates of switch times incytoplasmic signaling systems. By numerical survey we found thatk5 = 2.5k7

1130 J. Burnset al.
gave reasonable behavior of this kind. Once the rate constantsk5 andk7 are sorelated, the equation determiningccrit becomes
ccrit = 0.1046k7
k. (18)
If the flip from s1 to s3 is characterized by such time scales then so, necessarily,is the transition time1tsw, since1tsw is the time needed fors(t) to move froms1
pastscrit and become trapped in thes3 basin of attraction (obligatory commitmentto apoptosis). Numerical surveys of parameter variation, discussed further below,suggested thatk = k7 = 2.5 provides a reasonable upper bound on1tsw for theanalytical treatments of the switching time discussed next.
3. RESULTS
3.1. Single PACF releases.Let us consider first the readily analyzed case inwhich a photoreceptor is exposed to a long-lived, slowly varying PACF pulse.During its transition froms1 to s3, the photoreceptor sees negligible change in theambient concentration of death factor following some initial increase. To modelthis situation we take ambient PACF concentration as 0 fort < 0 and then steadyat some nonzero value fort ≥ 0. Prior tot = 0, the cell state is the fixed points0
1 = 0. For t > 0, s = 0 is no longer a fixed point of the cell state dynamicsands(t) increases. If the ambient PACF concentration is somec∗ > ccrit, thens3
is now the sole attractor (e.g., Fig.2) and after an elapsed time of1tsw the cellstates(t) has by definition reachedscrit, the threshold of obligatory commitment toapoptosis, such that
1tsw =
∫ scrit
0
(k c∗
+ k5s2
1 + s2− k7s
)−1
ds. (19)
Clearly, while this point is so for anyc∗ > ccrit, not all values ofc∗ aboveccrit are ofbiological interest. If|c∗
−ccrit| is very small then1tsw is very large and thes1 → s3
transition is not switch-like; conversely, if|c∗−ccrit|
−1→ 0 then1tsw → 0 and the
flip from s1 to s3 is unrealistically fast. To illustrate, setc∗= 1.1ccrit = 0.115k7/k,
i.e., 10% in excess ofccrit; then
1tsw ∼ 7.45 (20)
dimensionless time units, or∼19 s of clock time. Switch times of this magnitudeagree reasonably with current data. For larger values ofc∗ however, the timeintervals predicted by equation (19) decrease rapidly:1tsw ∼ 1.1 atc∗
= 2.2ccrit,0.2 at 11ccrit, 0.015 at 100ccrit, and so on.
Spatial Patterns in Retinal Cell Death 1131
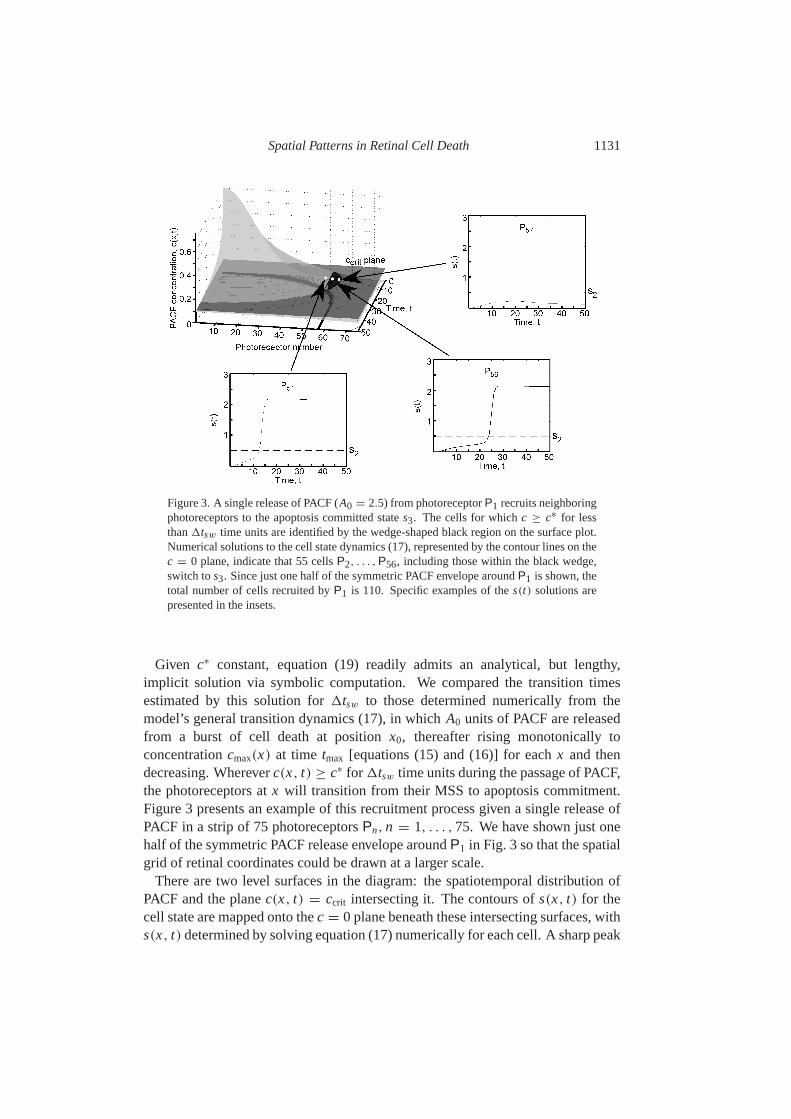
Figure 3. A single release of PACF (A0 = 2.5) from photoreceptorP1 recruits neighboringphotoreceptors to the apoptosis committed states3. The cells for whichc ≥ c∗ for lessthan1tsw time units are identified by the wedge-shaped black region on the surface plot.Numerical solutions to the cell state dynamics (17), represented by the contour lines on thec = 0 plane, indicate that 55 cellsP2, . . . , P56, including those within the black wedge,switch tos3. Since just one half of the symmetric PACF envelope aroundP1 is shown, thetotal number of cells recruited byP1 is 110. Specific examples of thes(t) solutions arepresented in the insets.
Given c∗ constant, equation (19) readily admits an analytical, but lengthy,implicit solution via symbolic computation. We compared the transition timesestimated by this solution for1tsw to those determined numerically from themodel’s general transition dynamics (17), in which A0 units of PACF are releasedfrom a burst of cell death at positionx0, thereafter rising monotonically toconcentrationcmax(x) at time tmax [equations (15) and (16)] for eachx and thendecreasing. Whereverc(x, t) ≥ c∗ for 1tsw time units during the passage of PACF,the photoreceptors atx will transition from their MSS to apoptosis commitment.Figure3 presents an example of this recruitment process given a single release ofPACF in a strip of 75 photoreceptorsPn, n = 1, . . . , 75. We have shown just onehalf of the symmetric PACF release envelope aroundP1 in Fig. 3 so that the spatialgrid of retinal coordinates could be drawn at a larger scale.
There are two level surfaces in the diagram: the spatiotemporal distribution ofPACF and the planec(x, t) = ccrit intersecting it. The contours ofs(x, t) for thecell state are mapped onto thec = 0 plane beneath these intersecting surfaces, withs(x, t) determined by solving equation (17) numerically for each cell. A sharp peak

1132 J. Burnset al.
at P1 marks the release of PACF. The concentration envelope broadens rapidlyas the death factor diffuses through the retina. The region of greatest interest isthe border marking the intersection of the PACF concentration surface and theccrit plane. It is evident that equation (19), though based on the special case ofa fixed ambient PACF concentrationc∗, does remarkably well in accounting forthe cell state transitions: up to photoreceptorP52, c ≥ c∗ for 1tsw = 7.45 timeunits [equation (20)] and all photoreceptors withx ∈ [0.1, 5.2] (i.e., P2, . . . , P52)commit to apoptosis. Only a small region, marked by the black wedge, containscells that also switch, even though they seec ≥ c∗ for less than1tsw time units.This region contains less than 5% of all the cells that switch froms1 to s3 inresponse to the PACF bolus released att = 0, and similarly across other valuesof the rate constant and bolus parameter values we examined.
The insets to Fig.3 track the time course of the cell states(t) for several positionschosen relative to this region’s leading edge atP53. According to the1tsw esti-mate (20), the cell state switches from MSS to apoptosis commitment atP50, doesnot switch atP60, and falls within the region of indeterminacy for{P53, . . . , P58}.Comparing these predictions to the cell states(t) obtained by direct numericalsolution of equation (17), we find that switching in fact occurs until photoreceptorP56, at which pointc is never larger thanc∗. Thus, as anticipated, the value of1tswestimated by applying the approximation of constant ambient PACF concentrationgives a somewhat conservative estimate of this small region’s maximum extent.Indeed,c exceedsccrit at P56. At P57, however, the maximum valuecmax of c isapproximately 0.106, attained att ∼ 15. From equation (19), it is apparent that atleast 15 time units are needed fors(t) to transition froms = 0 to s = scrit for ac∗
= 0.106. AtP57 and beyondc does not exceedccrit for that amount of time.The transition to apoptosis commitment atP56 provides a nice illustration of the
process by which a photoreceptor can switch even thoughc has not exceededccrit
for the 1tsw time units estimated through equation (19). What has happened isthat, as noted above, even forc > 0 the bifurcating fixed points1 is an attractorso long as 0≤ c < ccrit. Whenc > 0, s1 > 0 too. Asc increases above 0,salso increases. At timet = 11, c(t) = ccrit for P56 and the cell state variable hasthe values(t) = 0.18. By t = 15, the PACF concentration atP56 has reached itspeak valuecmax = 0.108, for whichs(t) = 0.22. Whenc(t) passes back downthroughccrit at t = 21, s(t) = 0.317 (Fig.3). Whenc = ccrit there are only twofixed points controlling thes dynamic, the first of which is ats = 0.22. As thePACF concentrationc decreases further, the two fixed pointss1 ands2 reform fromthis singleton and move, respectively, towards = 0 ands0
2. Provided thats(t)remains to the right ofs2, it will continue to increase. We recall thats(t) mustreachscrit = 0.5 before being overtaken by the movings2. This is exactly whatis taking place atP56: as itss(t) reaches 0.5, the graph ofs(t) vs. t steepens asattraction to the apoptosis commitment states3 takes over. In contrast,P57 andbeyond do not commit to cell death; atP57, for example,s(t) peaks at 0.216 att = 20 andc(t) > ccrit for just 12< t < 19.
Spatial Patterns in Retinal Cell Death 1133
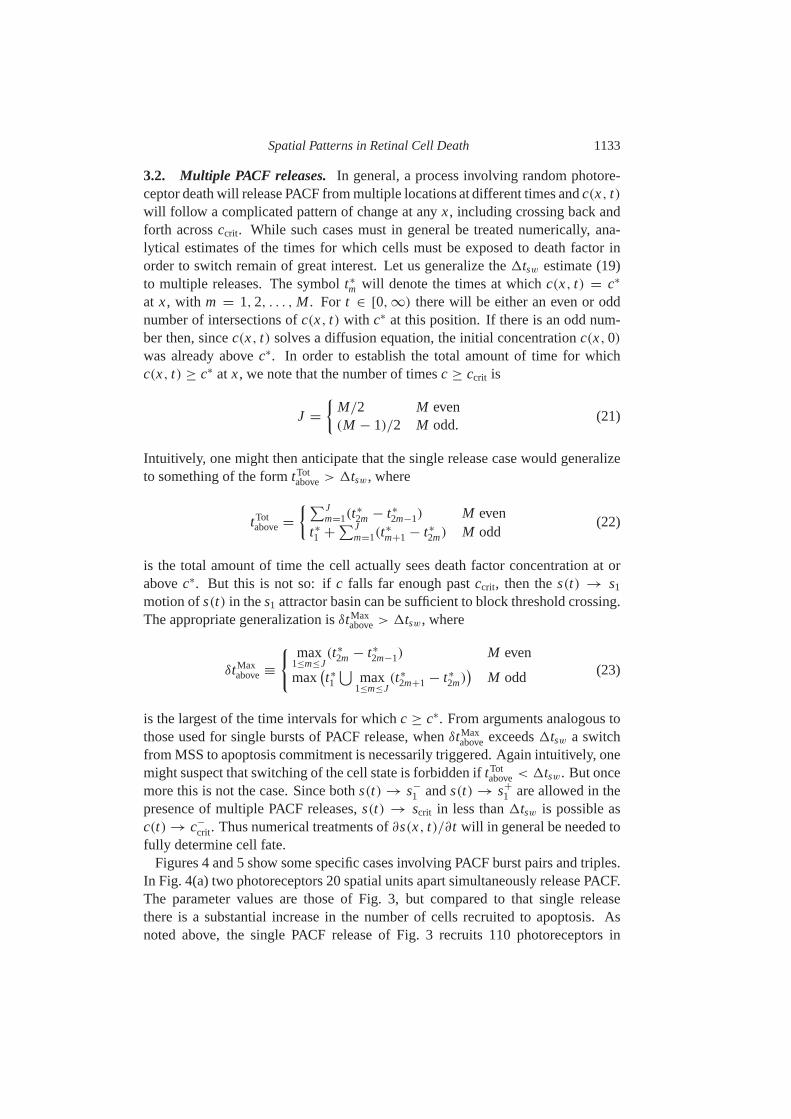
3.2. Multiple PACF releases. In general, a process involving random photore-ceptor death will release PACF from multiple locations at different times andc(x, t)will follow a complicated pattern of change at anyx, including crossing back andforth acrossccrit. While such cases must in general be treated numerically, ana-lytical estimates of the times for which cells must be exposed to death factor inorder to switch remain of great interest. Let us generalize the1tsw estimate (19)to multiple releases. The symbolt∗
m will denote the times at whichc(x, t) = c∗
at x, with m = 1, 2, . . . , M . For t ∈ [0, ∞) there will be either an even or oddnumber of intersections ofc(x, t) with c∗ at this position. If there is an odd num-ber then, sincec(x, t) solves a diffusion equation, the initial concentrationc(x, 0)
was already abovec∗. In order to establish the total amount of time for whichc(x, t) ≥ c∗ at x, we note that the number of timesc ≥ ccrit is
J =
{M/2 M even(M − 1)/2 M odd.
(21)
Intuitively, one might then anticipate that the single release case would generalizeto something of the formtTot
above> 1tsw, where
tTotabove=
{∑Jm=1(t
∗
2m − t∗
2m−1) M event∗
1 +∑J
m=1(t∗
m+1 − t∗
2m) M odd(22)
is the total amount of time the cell actually sees death factor concentration at orabovec∗. But this is not so: ifc falls far enough pastccrit, then thes(t) → s1
motion ofs(t) in thes1 attractor basin can be sufficient to block threshold crossing.The appropriate generalization isδtMax
above> 1tsw, where
δtMaxabove≡
{ max1≤m≤J
(t∗
2m − t∗
2m−1) M even
max(t∗
1
⋃max
1≤m≤J(t∗
2m+1 − t∗
2m))
M odd (23)
is the largest of the time intervals for whichc ≥ c∗. From arguments analogous tothose used for single bursts of PACF release, whenδtMax
above exceeds1tsw a switchfrom MSS to apoptosis commitment is necessarily triggered. Again intuitively, onemight suspect that switching of the cell state is forbidden iftTot
above< 1tsw. But oncemore this is not the case. Since boths(t) → s−
1 ands(t) → s+
1 are allowed in thepresence of multiple PACF releases,s(t) → scrit in less than1tsw is possible asc(t) → c−
crit. Thus numerical treatments of∂s(x, t)/∂t will in general be needed tofully determine cell fate.
Figures4 and5 show some specific cases involving PACF burst pairs and triples.In Fig. 4(a) two photoreceptors 20 spatial units apart simultaneously release PACF.The parameter values are those of Fig.3, but compared to that single releasethere is a substantial increase in the number of cells recruited to apoptosis. Asnoted above, the single PACF release of Fig.3 recruits 110 photoreceptors in

1134 J. Burnset al.
Figure 4. Amplification of recruitment by simultaneous PACF releases. (a) A single releaserecruits 110 cells tos3 (Fig. 3), but the superposition of the PACF concentration envelopesfrom two simultaneous releases (eachA0 = 2.5), 200 cells apart, recruits all 309 cellslocated within thes-contour shown on thec = 0 plane. (b) When the magnitude of theinitial release is decreased toA0 = 1.0, no additional recruitment is observed, with 72 cellsin total recruited.
total. With the two simultaneous releases of Fig.4(a), however, 309 cells committo apoptosis—substantially more than expected on the basis of the two releasesoccurring separately. Photoreceptors near the retinal mid-point,x = 20 (cellP200), being the farthest removed from either initial release, are the last to berecruited. As the amount of PACF released per cell death falls, the effects of theoverlapping releases swiftly diminish and the number of photoreceptors recruited

Spatial Patterns in Retinal Cell Death 1135
Figure 5. Temporal offset of multiple PACF releases limits recruitment tos3. (a) Threereleases are depicted, occurring at(x, t) = (20, 0), (40, 10) and (60, 5). When releasesoccur five (center and right peaks) or 10 time steps (center and left peaks) apart, allintervening positions switch tos3. (b) When the center release is delayed untilt = 30,not all intervening positions switch tos3.
to apoptosis rapidly approaches that expected from the sum determined by eachrelease considered on its own [Fig.4(b), A0 = 1].
Figure 5 illustrates recruitment involving three PACF releases in a regioncontaining 800 photoreceptors. The distance between adjacent PACF release pointsis 20 spatial units, i.e., the apoptotic cells are atx = 20, 40, 60. The parametervalues are again those used in Fig.3, but compared to that single release there is

1136 J. Burnset al.
Figure 6. Sensitivity analysis of model parameters. See text for discussion.
again a substantial synergetic increase in the number of cells recruited to apoptosis.The cases shown differ in how the releases are staggered in time and highlight theimportance of temporal offset, along with spatial offset, to the consequences ofneighboring releases of cell death factor.
3.3. Sensitivity analysis. We examined the effects of individually varyingA0,k7, k, k5 andk1. Unless otherwise noted, aside from the parameter being varied themodel was parameterized as in Fig.3.
3.3.1. A0. This parameter represents the amount of initial PACF releasethrough thec0 delta function. We numerically solved equation (17) for s(x, t)and determined the numberNsw of photoreceptors switched from the MSS intocell death commitment by a release forA0 ∈ (1, 10) in the retinal strip depictedin Fig. 3. The relationship was essentially linear [Fig.6(a); the dashed line is thelinear regression best fitNsw = 4.35+ 19.8A0, r 2
= 0.998], with approximately20 additional photoreceptors recruited per unit increase inA0.
3.3.2. k7 and k. These two parameters affect bothccrit and1tsw. 1tsw wasdetermined fork7 = k ∈ (0.25, 25) and decreased ask−1
7 over that domain[Fig. 6(b)]. k7 and k were then varied independently. Changes ink had nosignificant effect on1tsw; changes ink7 produced the power law response.Recalling equation (6), the contribution ofk to the rate of change ofs is linearvia the productk c. In 1tsw, c is fixed atc∗
= 0.115k7/k and hence the switch
Spatial Patterns in Retinal Cell Death 1137
time interval is independent ofk. Changes ink7 andk also affectccrit, but in astraightforward manner [equation (18)] since this property is linearly proportionalto k7 and linearly inversely proportional tok.
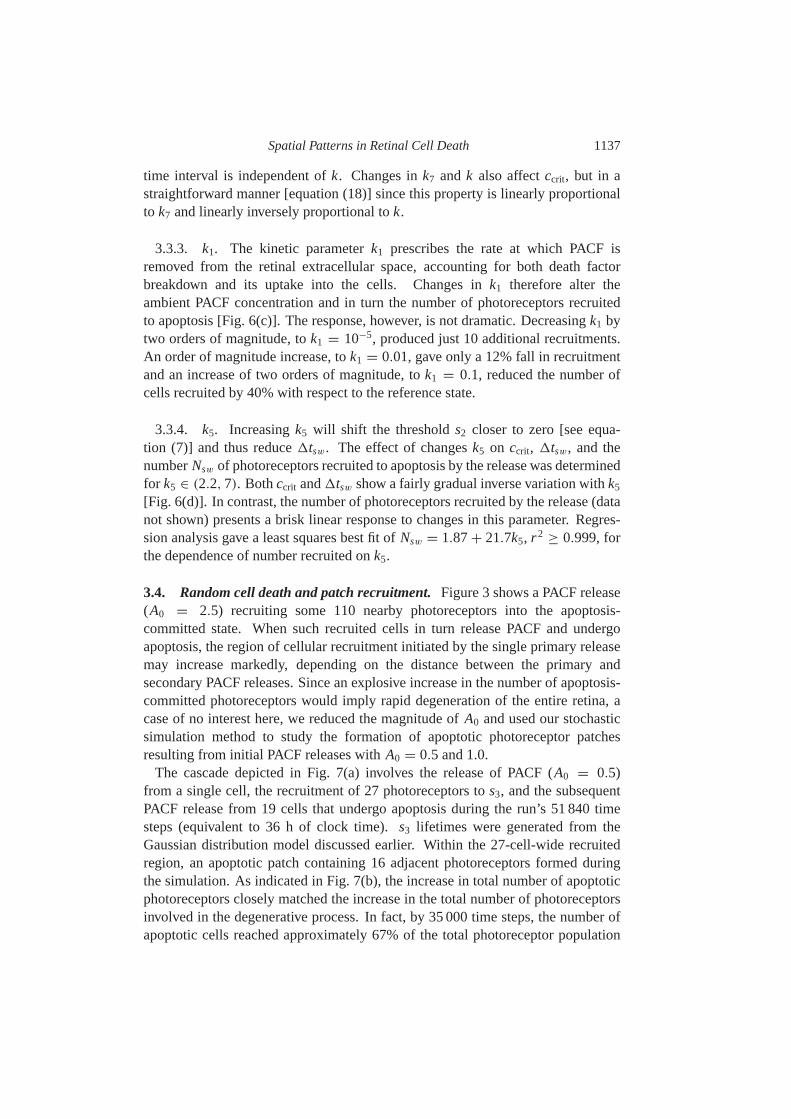
3.3.3. k1. The kinetic parameterk1 prescribes the rate at which PACF isremoved from the retinal extracellular space, accounting for both death factorbreakdown and its uptake into the cells. Changes ink1 therefore alter theambient PACF concentration and in turn the number of photoreceptors recruitedto apoptosis [Fig.6(c)]. The response, however, is not dramatic. Decreasingk1 bytwo orders of magnitude, tok1 = 10−5, produced just 10 additional recruitments.An order of magnitude increase, tok1 = 0.01, gave only a 12% fall in recruitmentand an increase of two orders of magnitude, tok1 = 0.1, reduced the number ofcells recruited by 40% with respect to the reference state.
3.3.4. k5. Increasingk5 will shift the thresholds2 closer to zero [see equa-tion (7)] and thus reduce1tsw. The effect of changesk5 on ccrit, 1tsw, and thenumberNsw of photoreceptors recruited to apoptosis by the release was determinedfor k5 ∈ (2.2, 7). Bothccrit and1tsw show a fairly gradual inverse variation withk5
[Fig. 6(d)]. In contrast, the number of photoreceptors recruited by the release (datanot shown) presents a brisk linear response to changes in this parameter. Regres-sion analysis gave a least squares best fit ofNsw = 1.87+ 21.7k5, r 2
≥ 0.999, forthe dependence of number recruited onk5.
3.4. Random cell death and patch recruitment.Figure3 shows a PACF release(A0 = 2.5) recruiting some 110 nearby photoreceptors into the apoptosis-committed state. When such recruited cells in turn release PACF and undergoapoptosis, the region of cellular recruitment initiated by the single primary releasemay increase markedly, depending on the distance between the primary andsecondary PACF releases. Since an explosive increase in the number of apoptosis-committed photoreceptors would imply rapid degeneration of the entire retina, acase of no interest here, we reduced the magnitude ofA0 and used our stochasticsimulation method to study the formation of apoptotic photoreceptor patchesresulting from initial PACF releases withA0 = 0.5 and 1.0.
The cascade depicted in Fig.7(a) involves the release of PACF (A0 = 0.5)from a single cell, the recruitment of 27 photoreceptors tos3, and the subsequentPACF release from 19 cells that undergo apoptosis during the run’s 51 840 timesteps (equivalent to 36 h of clock time).s3 lifetimes were generated from theGaussian distribution model discussed earlier. Within the 27-cell-wide recruitedregion, an apoptotic patch containing 16 adjacent photoreceptors formed duringthe simulation. As indicated in Fig.7(b), the increase in total number of apoptoticphotoreceptors closely matched the increase in the total number of photoreceptorsinvolved in the degenerative process. In fact, by 35 000 time steps, the number ofapoptotic cells reached approximately 67% of the total photoreceptor population

1138 J. Burnset al.
Figure 7. Stochastic simulation of photoreceptor recruitment into thes3 state, with thesubsequent formation of degenerative patches. (a) Recruitment cascade initiated by a singlePACF release,A0 = 0.5, from photoreceptorP250, and other parameters set as in Figs3–5. The time at which recruited cells subsequently underwent apoptosis and released PACFwas calculated via a Gaussian distribution (see text) with mean± s.d.= 12 ± 2 h. Theseparameter values gave a degenerative patch spanning 27 photoreceptors. (b) Number ofphotoreceptors in various states: R, cells remaining in the MSS; D, number of degeneratingcells (D= S+ A, where A is the number of apoptotic cells and S is the number of cells ins3, the switched state). (c) Accelerated degenerative process for ans3 lifetime distributionwith mean± s.d. = 2 h ± 20 min in the central hundred cells of (a). The formationand growth of degenerative patches is more pronounced. (d) The number R of remainingphotoreceptors for (c) indicates sigmoidal cell loss kinetics.
recruited tos3, a proportion that was maintained throughout the remainder of thesimulation run. That the rate of cell death was closely matched by the rate at whichnew photoreceptors were recruited tos3 indicates that, at these parameter values,a normal distribution of cell death times does not yield a rapid recruitment anddegeneration of large regions of the model retina.
Although the rate at which photoreceptors underwent apoptosis appeared togradually increase, the small number of cells involved in the degenerative processin a typical simulation run at these settings precluded a definitive visualizationof the cell loss kinetics on our computer. We subsequently explored simulationsin which thes3 mean± s.d. were decreased to 3000± 500 time steps (125±21 min) and considered a retinal strip containing the central 100 cells of Fig.7(a).

Spatial Patterns in Retinal Cell Death 1139
Figure 8. As in Fig.7, but with an exponential distribution ofs3 lifetimes. (a) Recruitmentcascade resulting from an initial PACF release,A0 = 0.5, from P250. A total of 37photoreceptors switch to thes3 state and a degenerative patch encompassing 14 cellsforms after approximately 8 h. (b) Number of cells in various states; cells are lost tos3 at a higher rate than in the Gaussian model ofs3 lifetimes. (c) Initial PACF releaseincreased toA0 = 1.0. The size of the recruited region rapidly expands to cover theentire 500-cell retina. Within this region, several small apoptotic patches on the order of10–15 photoreceptors appear. (d) The degenerative process in (c) followed exponentialkinetics (r 2 > 0.98) consistent with experimental and clinical neuronal degenerationkinetics (Clarkeet al., 2000, 2001); >70% of the cells had released PACF and undergoneapoptosis by 12 h.
All photoreceptors in these simulations [Fig.7(c)] were recruited to thes3 state by8720 time steps, and underwent apoptosis before 12 000 time steps had elapsed.
Secondary PACF releases in these runs tended to occur in groups and resultedin bursts of recruitment separated by time intervals in which the size of thepatch of recruited cells did not change. Importantly, the decline in photoreceptornumber was sigmoidal [Fig.7(d)], a pattern that became more apparent at higherconcentrations of PACF (A0 = 1.0, data not shown). This result conflicts withthe strikingly exponential decline in cell number recently observed by us in manyexamples of photoreceptor degeneration (Clarkeet al., 2000, 2001), and suggeststhat a normally distributed time of cell death following recruitment may be aninappropriate representation for the timing mechanisms regulating apoptosis.
Notably different cell loss kinetics and patch dynamics were observed when wecalculateds3 lifetimes according to the exponential distribution model. Figure8(a)

1140 J. Burnset al.
illustrates the effect of an initial PACF release withA0 = 0.5 on a one-dimensionalretina containing 500 photoreceptors. After approximately 12 000 time steps,corresponding to just over 8 h of clock time, a small patch spanning 37 cells hadtransitioned tos3. Of a total of 21 cells that had released PACF and undergoneapoptosis, 14 were localized to a small patch in the interior of the switched region.Although cells within the switched region continued to undergo apoptosis andrelease PACF, the overall size of the degenerating patch did not increase overthe remainder of the simulation, and the number of cells in thes3 switched stateremained roughly constant after 200 time steps [Fig.8(b)].
When the initial PACF release was increased toA0 = 1.0, a rapid andcatastrophic degeneration was observed [Fig.8(c) and8(d)]. The entire 500-cellretina transitioned tos3 within 1350 time steps. Small patches of degeneratingphotoreceptors, the largest of which spanned 15 cell diameters, were apparent by17 280 time steps (12 h). By then, more than 70% of the cells had released PACFand undergone apoptosis. Importantly, the kinetics of photoreceptor loss in thisversion of the model appeared to follow an exponential decline [Fig.8(d)], a resultconsistent with the observations made byin vivoandin vitro studies (Clarkeet al.,2000, 2001).
4. DISCUSSION
Our model of induced cell death, in which photoreceptors are switched to anapoptosis-committed state by exposure to a diffusible factor, was able to producepatches of degenerating cells similar in size to those observed by histological ana-lysis of diseased retinas. Such analyses have identified irregularly shaped patchesof degenerating photoreceptors on the order of 150µm in diameter (Cideciyanet al., 1998). The irregular shape of these patches is consistent with their formingby the coalescence of a number of smaller patches. Moreover, theoretical analysisof the responses of neurons that are post-synaptic to photoreceptors predicts thatpatches as small as 40µm can be detected by electrophysiological methods(Cideciyanet al., 1998). According to results presented in Fig.8, the diameter ofthese regions would correspond to PACF releases on the order of 0.5 ≤ A0 ≤ 1.0.
The extremes of this PACF concentration range would be expected to producequalitatively different patterns of cell death across the retina. Values on the orderof A0 = 0.5 resulted in regions ofs3-recruited photoreceptors that increased insize at a rate comparable to the rate of cell death within the patch [Fig.8(a)and8(b)], as illustrated by the observation that the number of photoreceptors in thes3 state remains relatively constant during most of the simulation. Consequently,we would expect that PACF releases in this range would result in the formationof isolated degenerative patches that would be scattered across the surface of theretina in a pattern that reflects the location of the primary PACF releases. Moreover,the dynamics of the cell-state switch dominate over the kinetics controlling thecharacteristic lifetime that a cell spends within thes3 state.

Spatial Patterns in Retinal Cell Death 1141
Values on the order ofA0 = 1.0 produced levels of apoptosis commitmentcorrelated positively with the higher concentration of PACF released [Fig.8(c)and 8(d)]. Substantial regions of retina enter thes3 state in a short period oftime and the retina degenerates at a correspondingly high rate. In contrast tophotoreceptor degeneration at lower PACF levels, the kinetics of cell loss aredominated by the characteristic lifetime of the cell commited to apoptosis, andreflect the kinetics of the apoptotic cascade rather than the rate at which cells arerecruited tos3. This higher PACF level would be expected to yield a more diffusepattern of apoptosis with small degenerative patches randomly scattered across theretina [cf., for example, the spatial organization of cell death in Fig.8(a) and8(c)at t = 4000 time steps].
It is important to note that a patchy distribution of photoreceptor death isobserved in roughly half of all cases of RP [43%,Cideciyan et al. (1998)].This suggests that either the circumscribed regions normally are too small to bedetected with the methods currently used, a possibility consistent with diffuseapoptosis resulting from high PACF concentrations, or that toxic factors such asPACF are not produced in all of cases of RP.
Several methods for determining the time course of apoptotic events within cellpopulations have been utilized experimentally. Electron and video microscopyhave visualized morphological changes associated with cell death, and assays ofDNA fragmentation and endonuclease activity have been performed to determinethe timing of specific biochemical alterations (Eastman, 1995; Mills , 1995; Schmittet al., 1998; Maruyamaet al., 2001). In each case known to us, however, thetechniques assume that apoptotic processes are initiated simultaneously when thecell population is first exposed to the death-inducing agent.
We explored this assumption in our analysis by studying the patterns of celldeath that result when the time at which an induced cell releases PACF andundergoes apoptosis is randomly distributed, rather than a fixed universal constantof the cell population. Although our normal (Gaussian) distribution version ofs3 lifetimes gave patches of degenerating photoreceptors [Fig.7(a) and7(c)],the resulting kinetics of cell loss was sigmoidal [Fig.7(d)], suggesting that bell-shaped distributions ofs3 lifetimes do not reproduce the general patterns (Clarkeet al., 2000) of retinal cell apoptosis. Only theRd−/− mutant mouse is known toexhibit photoreceptor degeneration consistent with sigmoidal degeneration kinetics(Clarkeet al., 2000, 2001). Intriguingly, the equivalent kinetics for RP itself remainto be determined.
In contrast, a model in which the time of cell death was determined accordingto an exponential distribution gave both patch formation and kinetics in linewith the experimental evidence (Fig.8). Exponential kinetics of photoreceptorapoptosis might reflect diverse molecular mechanisms of cell death. For example,once a death signal is received by the induced cell, variations in the abundanceor localization of regulatory molecules might lead to variations in the time atwhich apoptosis is completed or principal waypoints on the apoptotic cascade
1142 J. Burnset al.
passed. This possibility is supported by recent evidence indicating that cytochromec, a molecule known to be critical in the apoptosis cascade, is released fromintracellular stores at a variable time after exposure to the apoptosis-inducingagents TNF-α and cycloheximide (Leutjenset al., 2001).
In this study we have begun to explore ways in which cell–cell interactions can becombined with the MSS hypothesis (Clarkeet al., 2000) to provide insights into thespatiotemporal dynamics of photoreceptor loss. Further work aimed at improvedmodels will have an opportunity to consider simplifying assumptions that wereimportant to the initial model reported here. First, we have studied patterns result-ing from single primary PACF releases in our simulations, making the implicitassumption that the rate and kinetics of these primary releases were dominated bythose of the PACF-induced secondary releases. It will also be important to con-sider variations in kinetics of primary PACF release, and the degeneration patternsthat result from them, as may occur among different retinal diseases or betweendifferent stages in the progression of the same disease (Clarkeet al., 2001).
Second, we considered only the effects of a diffusible toxic factor on cell suicidewithin the retina. It is now well established that photoreceptors also producetrophicfactors, which can delay cell death to a limited extent [e.g., FGF-2;Fontaineet al. (1998), Faktorovich(1990)]. Since these substances appear to be producedand distributed more or less uniformly across the retina (Gao and Hollyfield, 1995),we assumed for the purposes of this study that such growth factors affect all cellsmore or less equally, and that we could ignore their effects in order to simplify ouranalysis. Models explicitly incorporating multiple interacting death and trophicfactors will be of great interest in future work.
There are also exciting issues about tissue architecture. We modeled a simplifiedone-dimensional retina made up of just one cell type. The human retina ofcourse contains two major types of photoreceptors, the rods and cones, distributednonuniformly throughout a thin layer 10–12 cell bodies deep (Curcio et al.,1990). More complex models could consider the effects of interactions betweenneighboring but different cell types distributed in 3-space, exploring the possibilitythat nearby photoreceptors may not exhibit identical responses to the local releaseof PACF and trophic factors. Moreover, diffusible factors are also released by manyof the nonphotoreceptor cells of the retina (Morimotoet al., 1993; Hicks, 1996), sosuch models might advance the hypothesis that diverse populations of interactingcell types underlie the mechanisms of degenerative retinal disease.
ACKNOWLEDGEMENTS
J B thanks the Mitchell Trust Fund for financial support during the work reportedhere. G C is a Postdoctoral Fellow of the Canadian Institutes of Health Research(the CIHR). C J L thanks the CIHR and the Natural Sciences and EngineeringResearch Council of Canada (NSERC) for operating grant support. We are

Spatial Patterns in Retinal Cell Death 1143
indebted to Dr Elise Heon for the use of the images shown in Fig.1. We alsothank Dr Randall Pyke and Dr Catherine Sulem for their input and encouragement.
REFERENCES
Berson, E. L. (1993). Retinitis pigmentosa.Invest. Ophthalmol. Vis. Sci.34, 1659–1676.Burns, J. (2000). A mathematical study of retinal cell death.MSc Qualifying Research
Report. C. J. Lumsden, supervisor. Department of Mathematics, University of Toronto.Campochiaro, P. A., M. Chang, M. Ohsato, S. A. Vinores, Z. Nie, L. Hjelmeland, A.
Mansukhani, C. Basilico and D. J. Zack (1996). Retinal degeneration in transgenicmice with photoreceptor-specific expression of a dominant-negative fibroblast growthfactor receptor.J. Neurosci.16, 1679–1688.
Cideciyan, A. V., D. C. Hood, Y. Huang, E. Banin, Z. Y. Li, E. M. Stone, A. H. Milam andS. G. Jacobson (1998). Disease sequence from mutant rhodopsin allele to rod and conephotoreceptor degeneration in man.Proc. Natl. Acad. Sci. USA95, 7103–7108.
Clarke, G., R. A. Collins, B. R. Leavitt, D. F. Andrews, M. R. Haydon, C. J. Lumsden andR. R. McInnes (2000). A one-hit model of cell death in inherited neuronal degenerations.Nature406, 195–199.
Clarke, G., C. J. Lumsden and R. R. McInnes (2001). Inherited neurodegenerativediseases: The one-hit model of neurodegeneration.Hum. Mol. Gen.10, 2269–2275.
Creagh, E. M. and S. J. Martin (2001). Caspases: cellular demolition experts.Biochem.Soc. Trans.29, 696–702.
Curcio, C. A., K. R. Sloan, R. E. Kalina and A. E. Hendrickson (1990). Humanphotoreceptor topography.J. Comp. Neurol.292, 497–523.
Daiger, S. P., L. S. Sullivan and B. J. F. Rossiter (2002). RetNetM : retinal information net-work: cloned and/or mapped human genes causing retinal degeneration or related dis-eases.http://www.sph.uth.tmc.edu/Retnet/home.htm.
Eastman, A. (1995). Assays for DNA fragmentation, endonucleases, and intracellular pHand Ca2+associated with apoptosis.Methods Cell Biol.46, 41–55.
Evans, L. C. (1998).Partial Differential Equations,Graduate Studies in Mathemat-ics, Vol. 19, Providence, RI: American Mathematical Society.
Fain, G. L. and J. E. Lisman (1999). Light, Ca2+, and photoreceptor death, new evidencefor the equivalent-light hypothesis from arrestin knockout mice.Invest. Ophthalmol. Vis.Sci.40, 2770–2772.
Faktorovich, E. G., R. H. Steinberg, D. Yasumura, M. T. Matthes and M. M. LaVail (1990).Photoreceptor degeneration in inherited retinal dystrophy delayed by basic fibroblastgrowth factor.Nature347, 83–86.
Ferrell, J. E. and W. Xiong (2001). Bistability in cell signaling: how to make acontinuous process discontinuous, and reversible processes irreversible.Chaos 11,227–236.
Fontaine, V., N. Kinkl, J. Sahel, H. Dreyfus and D. Hicks (1998). Survival of purified ratphotoreceptors in vitro is stimulated directly by fibroblast growth factor-2.J. Neurosci.18, 9662–9672.

1144 J. Burnset al.
Fussenegger, M., J. E. Bailey and J. Varner (2000). A mathematical model of caspasefunction in apoptosis.Nat. Biotech.18, 768–774.
Gao, H. and J. G. Hollyfield (1995). Basic fibroblast growth factor in retinal develop-ment: differential levels of bFGF expression and content in normal and retinal degener-ation (rd) mutant mice.Dev. Biol.169, 168–184.
Gillespie, D. T. (1976). A general method for numerically simulating the stochastic timeevolution of coupled chemical reactions.J. Comput. Phys.22, 413–424.
Gillespie, D. T. (1977). Exact stochastic simulation of coupled chemical reactions.J. Phys.Chem.81, 2340–2361.
Hicks, D. (1996). Characterization and possible roles of fibroblast growth factors in retinalphotoreceptor cells.Keio J. Med.45, 140–154.
Huang, P. C., A. E. Gaitin, Y. Hao, R. M. Petters and F. Wong (1993). Cellular interactionsimplicated in the mechanism of widespread photoreceptor degeneration in transgenicmice expressing a mutant rhodopsin gene.Proc. Natl. Acad. Sci. USA90, 8484–8488.
Jacobson, M. D., M. Weil and M. C. Raff (1997). Programmed cell death in animaldevelopment.Cell 88, 347–354.
Kaufmann, S. H. and M. O. Hengartner (2001). Programmed cell death: alive and well inthe new millennium.Trends Cell Biol.11, 526–534.
Kerr, J. F. R., A. H. Wyllie and A. R. Currie (1972). Apoptosis: a basic biologicalphenomenon with wide-ranging implications in tissue kinetics.Br. J. Cancer26,239–255.
Krewson, C. E., M. L. Klarman and M. W. Saltzman (1995). Distribution of nerve growthfactor following direct delivery to brain interstitium.Brain Res.680, 196–206.
Leutjens, C., D. Kogel, C. Reimertz, H. Dußmann, A. Renz, K. Schulze-Osthoff,A.-L. Nieminen, M. Poppe and J. Prehn (2001). Multiple kinetics of mitochondrialcytochrome c release in drug-induced apoptosis.Mol. Pharmacol.60, 1008–1019.
Lewis, J., J. M. W. Slack and L. Wolpert (1977). Thresholds in development.J. Theor. Biol.65, 579–590.
Li, T., W. K. Snyder, J. E. Olsson and T. P. Dryja (1996). Transgenic mice carryingthe dominant rhodopsin mutation P347S: evidence for defective vectorial transport ofrhodopsin to the outer segments.Proc. Natl. Acad. Sci. USA93, 14176–14181.
Ma, C., D. Papermaster and C. L. Cepko (1998). A unique pattern of photoreceptordegeneration in cyclin D1 mutant mice.Proc. Natl. Acad. Sci. USA95, 9938–9943.
Maruyama, R.et al. (2001). Dynamic process of apoptosis in adult rat cardiomyocytes ana-lyzed using 48-hour videomicroscopy and electron microscopy.Am. J. Pathol.159,683–691.
Milam, A., Z. Li and R. Fariss (1998). Histopathology of the human retina in retinitispigmentosa.Prog. Ret. Eye Res.17, 175–205.
Mills, J., S. Wang, M. Erecinska and R. Pittman (1995). Use of cultured neuronsand neuronal cell lines to study morphological, biochemical, and molecular changesoccurring in cell death.Methods Cell Biol.46, 218–242.
Mohand-Said, S., A. Deudon-Combe, D. Hicks, M. Simonutti, V. Forster, A. C. Fintz, T.Leveillard, H. Dreyfus and J. A. Sahel (1998). Normal retina releases a diffusible factorstimulating cone survival in the retinal degeneration mouse.Proc. Natl. Acad. Sci. USA95, 8357–8362.
Spatial Patterns in Retinal Cell Death 1145
Morimoto, A., S. Matsuda, K. Uryu, H. Fujita, N. Okumura and M. Sakanaka (1993).Light- and electron-microscopic localization of basic fibroblast growth factor in adultretina.Okajimas Folia Anat. Jpn.70, 7–12.
Murray, J. D. (1981). On pattern formation mechanisms for lepidopteran wing patternsand mammalian coat markings.Phil. Trans. R. Soc. Lond. B295, 473–496.
Murray, J. D. (1989).Mathematical Biology, New York: Springer.Pagon, R. A. (1988). Retinitis pigmentosa.Surv. Opthalmol.33, 137–177.Reme, C. E., C. Grimm, F. Hafezi, A. Marti and A. Wenzel (1998). Apoptotic cell death in
retinal degenerations.Prog. Ret. Eye Res.17, 443–464.Schmitt, E., A. Steyaert, G. Cimoli and R. Bertrand (1998). Bax-alpha promotes apoptosis
induced by cancer chemotherapy and accelerates the activation of caspase 3-like cys-teine proteases in p53 double mutant B lymphoma Namalwa cells.Cell Death Diff.5,506–516.
Seigel, G. M. and L. Liu (1997). Inducible apoptosis-promoting activity in retinal cell-conditioned medium.Mol. Vision3, 14–14.http://www.molvis.org/molvis/
Stennicke, H. R., C. A. Ryan and G. S. Salvesen (2002). Reprival from execution: themolecular basis of caspase inhibition.Trends Biochem. Sci.27, 94–101.
Travis, G. H. (1998). Mechanisms of cell death in the inherited retinal degenerations.Am.J. Hum. Genet.62, 503–508.
Yuan, J. and B. A. Yankne (2000). Apoptosis in the nervous system.Nature407, 802–809.
Received 16 May 2002 and accepted 28 August 2002