photovoltaic recycling planning: macro and micro...
TRANSCRIPT

PHOTOVOLTAIC RECYCLING PLANNING: MACRO AND MICRO PERSPECTIVES
Jun-Ki Choi1 and Vasilis Fthenakis2 1 Assistant Professor, University of Dayton, USA 2 Professor, Columbia University and Brookhaven National Laboratory, USA
IEA PVPS TASK 12 Workshop, Sept. 23, 2014, Amsterdam, Netherlands
Disclaimer: results shown in this presentation do not represent views of
any industries and associations

Motivation
PV industries will face challenging material separation decisions
• Volume of defective and EoL module is increasing
• Various cell & module production technologies
• Fluctuation of material prices
• Environmental legislations
Must evaluate the trade-offs between different cost and revenue structures
• Spatial and temporal issues
• Dynamic modeling is required
PV Take Back Center (PVTBC) will need quantitative decision tools to evaluate the optimal level of processing
• Encourage research opportunities for technology, recycling process design, and controls.
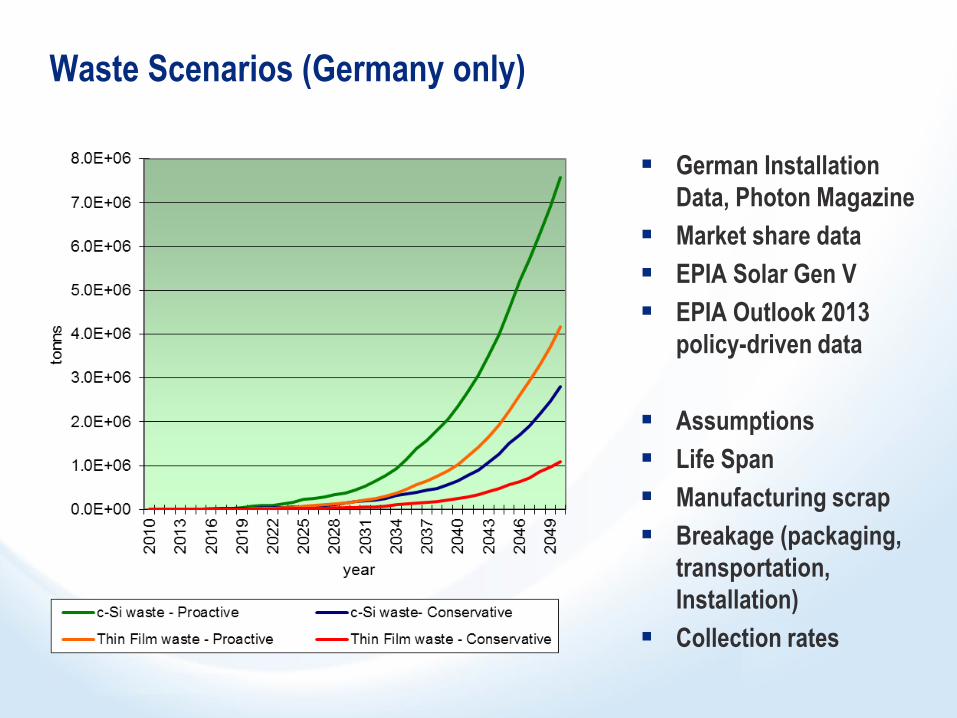
Waste Scenarios (Germany only)
German Installation
Data, Photon Magazine
Market share data
EPIA Solar Gen V
EPIA Outlook 2013
policy-driven data
Assumptions
Life Span
Manufacturing scrap
Breakage (packaging,
transportation,
Installation)
Collection rates

Time Horizon for PV Recycling Infrastructure Planning
This presentation focuses on… short term planning + recycling of c-Si + manufacturing scrap only + as of 2010

Economic challenges of PV recycling
1. Macro level: Logistics/transportation: Where to locate the recycling center?
• How many PV take back centers needed
• Efficient routing/ logistics
• Optimized location
2. Micro level: Recycling Process: How to maximize the revenue of each recycling plant?
• Cost and benefit of process improvement
• Fluctuation of Incoming module and market price of materials
Generic mathematical models are developed

Logistics Study: German PV Manufacturing Cluster
90%
c-Si
PV mfg

General model for optimal PVTBC location
MILP
Objective function: minimize the total system cost
min.
Determine the optimal locations of PVTBCs by optimizing the economic
trade-off of:
• Max. capacity of a designated PVTBC
• Capital cost to open up PVTBC
• Distance, Transportation cost, fuel price, labor, service fee..
• Amount of incoming waste
1 1 1
( )I J J
ij ij ij j j
i j j
z X f
Transportation and logistics Capital costs for setting PVTBC
J. -K. Choi, and V.M. Fthenakis, “Design and Optimization of Photovoltaic Recycling Infrastructure”,
Environmental Science and Technology, 44(22), 2010.
s.t. constraints

Amount of PV waste generated from each facility for 5yrs
0 5000 10000 15000 20000 25000
R1
R2
R3
R4
R5
R6
R7
R8
R9
R10
R11
R12
R13
R14
R15
R16
Tonne

$0.0
$0.5
$1.0
$1.5
$2.0
$2.5
$3.0
$3.5
R1 R2 R3 R4 R5 R6 R7 R8 R9 R10 R11 R12 R13 R14 R15 R16
Millio
nen
Sole PVTBC
Reverse logistic costs
What if: Single sole PVTBC case – no optimization

Optimization results: selection of PVTBC candidates
Model allocates optimal locations:
Decision is based on the quantity of
manufacturing scraps from each collection points and the distances between
the collection points to recycling points, subject to capital cost constraints

Emission reduction from transportation

PV recycling process planning
Take back
Recycling
Reclaimed
Material
Photo credit: K. Wambach et al. 2010, IEA Hamburg

k=1
Auto feeder
k=2
Separation of
junction box
k=3
Thermal Treatment
k=4
Automatic
Separation
k=5
Chemical treatmentSilicon
Waste
Glass
Copper Wire
Aluminum Frame
Logistics company deliver
modules from various
collection points
j=4
j= 8
j=3
Collection by
a logistics
company
Uninstall by a local
Engineering company/
Installer
Junction box
Plastic
Market /
Secondary
Processors
Landfill
j=2
j=6
j=11
j=7
j= 9
j= 10
j= 5
j=1 (bal 1,1 =1)
(bal 2,2 =0.9767)
(bal 3,2 =0.0233)
(bal 4,3 =0.8724)
(bal 5,3 =0.1043)
(bal 6,4 =0.0210)
(bal 10,4 =0.01)
(bal 9,4 =0.1754)
(bal 8,4 =0.6206)
Crystalline Silicon Recycling Process (Solar World Automated Plant)
Automated
Loading
System
Automated
Sorting
System
Advanced
Chemical
Process
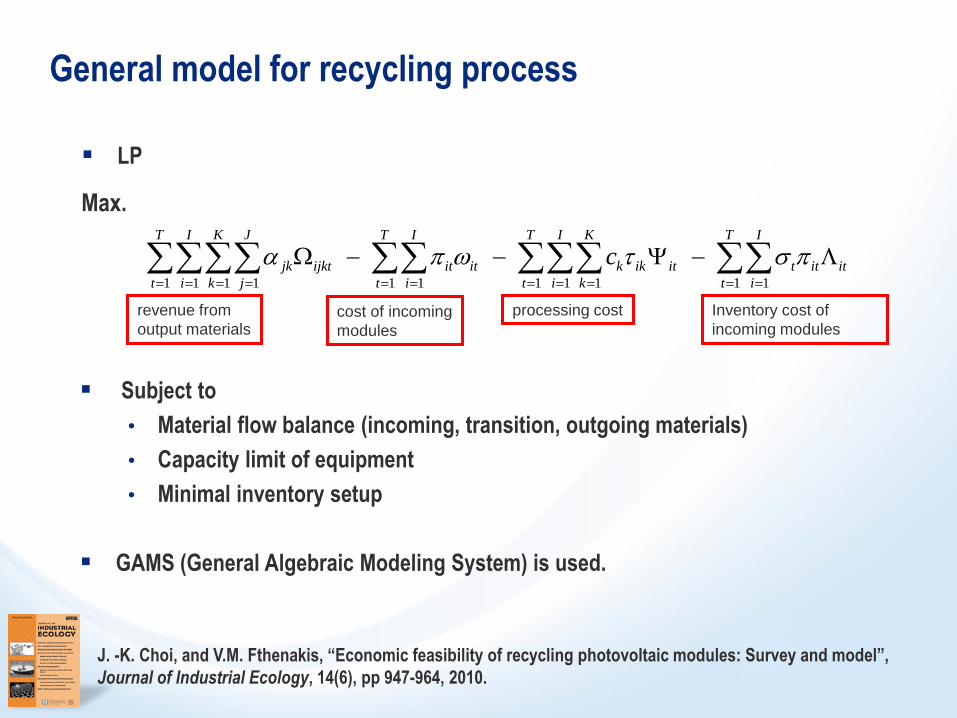
General model for recycling process
LP
Max.
Subject to
• Material flow balance (incoming, transition, outgoing materials)
• Capacity limit of equipment
• Minimal inventory setup
GAMS (General Algebraic Modeling System) is used.
revenue from
output materials cost of incoming
modules
processing cost Inventory cost of
incoming modules
1 1 1 1 1 1 1 1 1 1 1
T I K J T I T I K T I
jk ijkt it it k ik it t it it
t i k j t i t i k t i
c
J. -K. Choi, and V.M. Fthenakis, “Economic feasibility of recycling photovoltaic modules: Survey and model”,
Journal of Industrial Ecology, 14(6), pp 947-964, 2010.

Key parameters
Exogenous parameters
• Cost of incoming upstream modules
• Shipping costs for downstream materials
• Market price of materials
• Secondary handling fees
Endogenous parameters
• Capacity of equipment
• Processing time
• Processing costs (thermal, mechanical, chemical and automated treatments)
• Capital and labor costs (hourly or annual salary based)
Experimental Design
• Sensitivity analysis for comparing different scenario
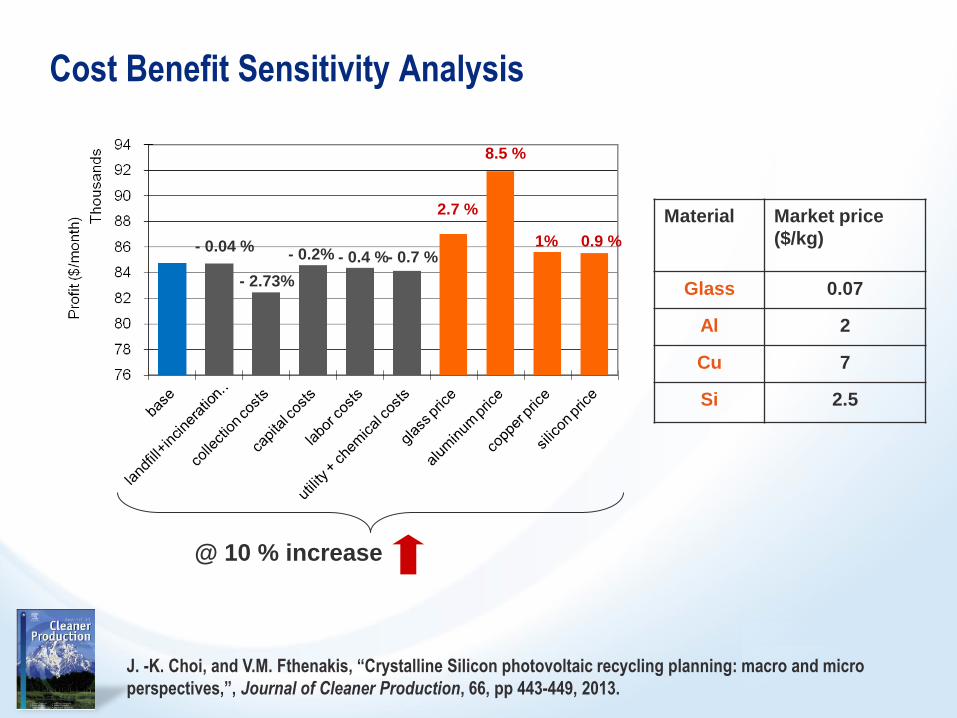
Cost Benefit Sensitivity Analysis
- 0.04 %
- 2.73%
- 0.2% - 0.4 % - 0.7 %
2.7 %
8.5 %
1% 0.9 %
@ 10 % increase
Material Market price
($/kg)
Glass 0.07
Al 2
Cu 7
Si 2.5
J. -K. Choi, and V.M. Fthenakis, “Crystalline Silicon photovoltaic recycling planning: macro and micro
perspectives,”, Journal of Cleaner Production, 66, pp 443-449, 2013.

17
Conclusion
Models are developed for a near-term (2010-2015) forward analysis of recycling manufacturing waste from c-Si PV production facilities in Germany
Real process model can be readily developed for various technological scenarios by using real data
Logistics modeling can be extended to larger geographical area (i.e. EU, USA)
Detailed downstream modeling is necessary for future works (i.e. optimizing shipping of reclaimed materials and waste)
Work is in progress on developing an integrated framework that can guide policy planners/non profit organization who wish to set up an economically feasible PV recycling infrastructure in any region.
