phpp fact sheet 0811 final - environmental protection...
TRANSCRIPT

Exhibit 7

U.S. ENVIRONMENTAL PROTECTION AGENCY REGION IX
FACT SHEET AND AMBIENT AIR QUALITY IMPACT REPORT
For a Clean Air Act Prevention of Significant Deterioration Permit
Palmdale Hybrid Power Project PSD Permit Number SE 09-01
August 2011

This page left intentionally blank.
PROPOSED PREVENTION OF SIGNIFICANT DETERIORATION PERMIT PALMDALE HYBRID POWER PROJECT
Fact Sheet and Ambient Air Quality Impact Report (PSD Permit SE 09-01)
Table of Contents Acronyms & Abbreviations .......................................................................................................... i Executive Summary..................................................................................................................... 1 1. Purpose of this Document...................................................................................................... 1 2. Applicant ............................................................................................................................... 1 3. Project Location .................................................................................................................... 2 4. Project Description ................................................................................................................ 3 5. Emissions from the Proposed Project ..................................................................................... 7 6. Applicability of the Prevention of Significant Deterioration Regulations ................................. 9 7. Best Available Control Technology...................................................................................... 12
7.1 BACT for Natural Gas Combustion Turbine Generators ................................................ 16 7.1.1 Nitrogen Oxide Emissions ...................................................................................... 16 7.1.2 Carbon Monoxide Emissions .................................................................................. 20 7.1.3 PM, PM10 and PM2.5 Emissions ............................................................................... 23 7.1.4 GHG Emissions ..................................................................................................... 27 7.1.5 BACT During Startup and Shutdown ..................................................................... 31
7.2. BACT for Auxiliary Boiler and Heater ..................................................................... 32 7.2.1 Nitrogen Oxide Emissions ...................................................................................... 32 7.2.2 Carbon Monoxide Emissions .................................................................................. 33 7.2.3 PM, PM10 and PM2.5 Emissions ........................................................................... 34 7.2.4 GHG Emissions ..................................................................................................... 37
7.3 BACT for Emergency Internal Combustion Engines....................................................... 38 7.3.1 NOX, CO, PM, PM10, PM2.5, and GHG Emissions ............................................... 38
7.4 BACT for Cooling Tower .............................................................................................. 40 7.5 BACT for Fugitive Road Dust ....................................................................................... 43 7.6 BACT for Circuit Breakers ............................................................................................ 45 7.6.1 GHG ...................................................................................................................... 45
8. Air Quality Impacts ............................................................................................................. 46 8.1 Introduction ................................................................................................................... 47 8.1.1 Overview of PSD Air Impact Requirements ........................................................... 47 8.1.2 Identification of PHPP Modeling Documentation ................................................... 48
8.2. Background Ambient Air Quality ............................................................................. 49 8.3 Modeling Methodology for Class II areas ...................................................................... 50 8.3.1 Model selection ...................................................................................................... 50 8.3.2 Meteorology model inputs...................................................................................... 51 8.3.3 Land characteristics model inputs ........................................................................... 51 8.3.4 Model receptors ..................................................................................................... 52 8.3.5 Load screening and stack parameter model inputs .................................................. 53

ii
8.3.6 Good Engineering Practice (GEP) Analysis ........................................................... 54 8.4 National Ambient Air Quality Standards and PSD Class II Increment Consumption Analysis ............................................................................................................................... 55 8.4.1 Pollutants with significant emissions ....................................................................... 55 8.4.2 Preliminary analysis: Project-only impacts .............................................................. 55 8.4.3 Cumulative impact analysis..................................................................................... 56
8.5 Class I Area Analysis ..................................................................................................... 62 8.5.1 Class I Increment Consumption Analysis ................................................................ 63 8.5.2 Visibility and Deposition in Class I areas ................................................................ 63
9. Additional Impact Analysis .................................................................................................. 65 9.1 Soils and Vegetation ...................................................................................................... 66 9.2 Visibility Impairment...................................................................................................... 68 9.3 Growth .......................................................................................................................... 68
10. Endangered Species ............................................................................................................. 69 11. Environmental Justice Analysis ............................................................................................ 70 12. Clean Air Act Title IV (Acid Rain Permit) and Title V (Operating Permit) ........................... 70 13. Comment Period, Hearing, Public Information Meeting, Procedures for Final Decision, and EPA Contact.............................................................................................................................. 70 14. Conclusion and Proposed Action ......................................................................................... 73

Acronyms & Abbreviations
Act Clean Air Act [42 U.S.C. Section 7401 et seq.] ACC Air Cooled Condenser AFC Application for Certification Agency U.S. Environmental Protection Agency AQMD Air Quality Management District bext Light extinction coefficient BA Biological Assessment BACT Best Available Control Technology BTU British thermal units CAA Clean Air Act [42 U.S.C. Section 7401 et seq.] CEC California Energy Commission CEMS Continuous Emissions Monitoring System CFR Code of Federal Regulations CO Carbon Monoxide CT Combustion Turbine CTG Combustion Gas Turbine DLN Dry Low NOx GE General Electric GHG Greenhouse Gas (Greenhouse Gases) g/hp-hr grams per horsepower-hour gr/scf Grains per Standard Cubic Feet EAB Environmental Appeals Board EPA U.S. Environmental Protection Agency ESA Endangered Species Act ESP Electrostatic Precipitator FWS U.S. Fish and Wildlife Service HHV Higher Heating Value HP Horsepower HRSG Heat Recovery Steam Generator HTF Heat Transfer Fluid IRIS Integrated Risk Information System ISO International Organization for Standards km Kilometers kW Kilowatts of electrical power kWhr Kilowatt-hour mg/L Milligrams per liter µg/m3 Microgram per Cubic Meter MMBTU Million British thermal units MW Megawatts of electrical power NAAQS National Ambient Air Quality Standards NESHAPS National Emission Standards for Hazardous Air Pollutants NMHC Non-methane Hydrocarbons
ii
NO Nitrogen oxide or nitric oxide NO2 Nitrogen dioxide NOx Oxides of Nitrogen (NO + NO2) NP National Park NSPS New Source Performance Standards, 40 CFR Part 60 NSR New Source Review O2 Oxygen PHPP Palmdale Hybrid Power Project PM Total Particulate Matter PM2.5 Particulate Matter less than 2.5 micrometers (μm) in diameter PM10 Particulate Matter less than 10 micrometers (μm) in diameter PPM Parts per Million PPMVD Parts per Million by Volume, on a Dry basis PSD Prevention of Significant Deterioration PTE Potential to Emit PUC Public Utilities Commission RATA Relative Accuracy Test Audit RBLC U.S. EPA RACT/BACT/LAER Information Clearinghouse SIL Significant Impact Level SF6 Sulfur Hexafluoride SNCR Selective Non-Catalytic Reduction SO2 Sulfur Dioxide SOx Oxides of Sulfur STG Steam Turbine Generator TDS Total Dissolved Solids TPY Tons per Year VV2 Victorville 2 (Hybrid Power Project) WA Wilderness Area

1
Proposed Prevention of Significant Deterioration (PSD) Permit Fact Sheet and Ambient Air Quality Impact Report
PALMDALE HYBRID POWER PROJECT
Executive Summary The City of Palmdale has applied to EPA Region 9 (EPA) for authorization under the Clean Air Act (CAA) Prevention of Significant Deterioration (PSD) program to construct a new power plant that will generate 570 megawatts (MW, nominal) of electricity using natural gas and solar energy. The power plant, known as the Palmdale Hybrid Power Project (PHPP or Project), will be located in the town of Palmdale, in Los Angeles County, California. EPA is issuing a proposed PSD permit for the PHPP, which is consistent with the requirements of the PSD program for the following reasons:
§ The proposed PSD permit requires the Best Available Control Technology
(BACT) to limit emissions of nitrogen oxides (NOx), carbon monoxide (CO), total particulate matter (PM), particulate matter under 10 micrometers (μm) in diameter (PM10), particulate matter under 2.5 (μm) in diameter (PM2.5), and greenhouse gases (GHG), to the greatest extent feasible;
§ The proposed emission limits will protect the National Ambient Air Quality
Standards (NAAQS) for nitrogen dioxide (NO2), CO, PM10, and PM2.5. There are no NAAQS for PM or Greenhouse Gases.
§ The facility will not adversely impact soils and vegetation, or air quality, visibility,
and deposition in Class I areas, which are parks or wilderness areas given special protection under the Clean Air Act.
1. Purpose of this Document
This document serves as the Fact Sheet and Ambient Air Quality Impact Report (Fact Sheet/AAQIR) for the proposed PSD permit for the City of Palmdale’s Project. This document describes the legal and factual basis for the proposed PSD permit, including requirements under the CAA, including CAA section 165 and the PSD regulations at Title 40 of the Code of Federal Regulations (CFR) section 52.21. This document also serves as a Fact Sheet for the proposed PSD permit per 40 CFR section 124.8.
2. Applicant
The name and address of the applicant is as follows:

2
City of Palmdale 38300 Sierra Highway, Suite A Palmdale, CA 93550
3. Project Location The proposed location for the Palmdale Hybrid Power Project is 950 East Avenue M, Palmdale, California 93550. It is located on an approximately 333-acre parcel west of the northwest corner of Air Force Plant 42, and east of the intersection of Sierra Highway and East Avenue M. The City of Palmdale is located within the Antelope Valley Air Quality Management District (District). The map below shows the approximate location of the proposed Project.
3
4. Project Description
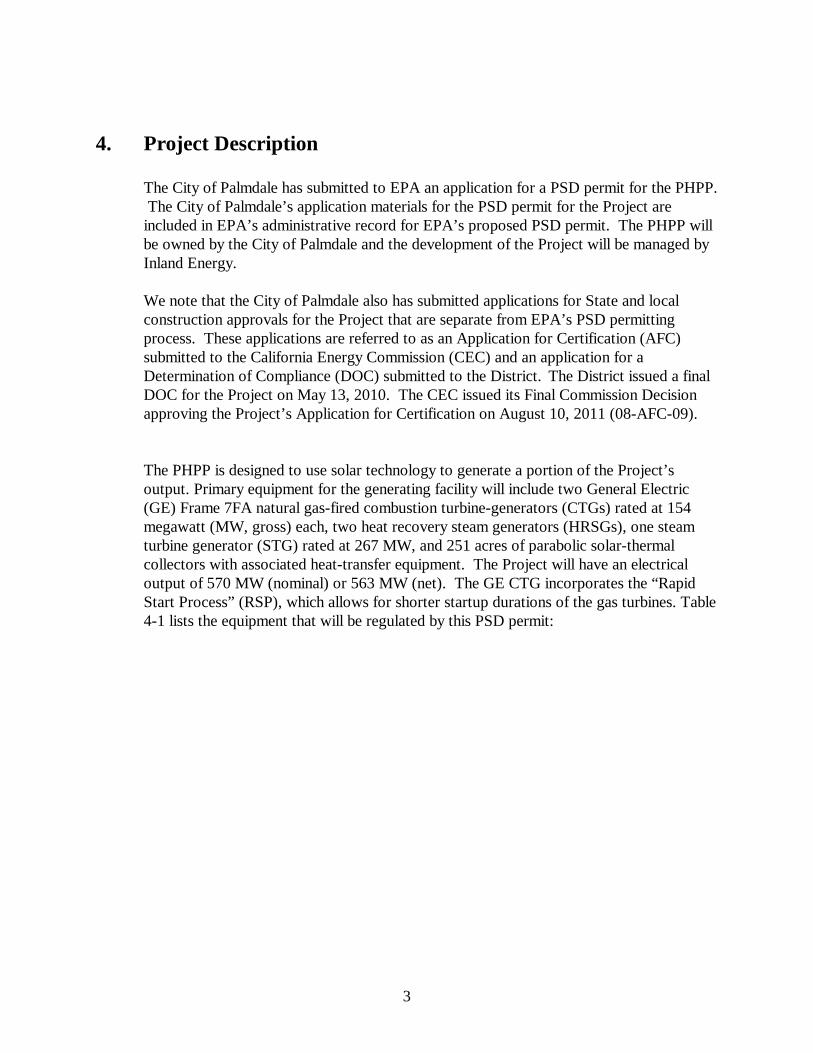
The City of Palmdale has submitted to EPA an application for a PSD permit for the PHPP. The City of Palmdale’s application materials for the PSD permit for the Project are included in EPA’s administrative record for EPA’s proposed PSD permit. The PHPP will be owned by the City of Palmdale and the development of the Project will be managed by Inland Energy. We note that the City of Palmdale also has submitted applications for State and local construction approvals for the Project that are separate from EPA’s PSD permitting process. These applications are referred to as an Application for Certification (AFC) submitted to the California Energy Commission (CEC) and an application for a Determination of Compliance (DOC) submitted to the District. The District issued a final DOC for the Project on May 13, 2010. The CEC issued its Final Commission Decision approving the Project’s Application for Certification on August 10, 2011 (08-AFC-09). The PHPP is designed to use solar technology to generate a portion of the Project’s output. Primary equipment for the generating facility will include two General Electric (GE) Frame 7FA natural gas-fired combustion turbine-generators (CTGs) rated at 154 megawatt (MW, gross) each, two heat recovery steam generators (HRSGs), one steam turbine generator (STG) rated at 267 MW, and 251 acres of parabolic solar-thermal collectors with associated heat-transfer equipment. The Project will have an electrical output of 570 MW (nominal) or 563 MW (net). The GE CTG incorporates the “Rapid Start Process” (RSP), which allows for shorter startup durations of the gas turbines. Table 4-1 lists the equipment that will be regulated by this PSD permit:

4
Table 4-1: Equipment List
Equipment Description Two natural gas-fired GE 7FA Rapid Start Process combustion turbine generators (CTG) with Heat Recovery Steam Generators (HRSG)
• Each 154 MW (gross) CTG, with a maximum heat input rate of 1,736 MMBtu/hr (HHV)
• Equipped with natural gas duct burners, rated at 500 MMBtu/hr (HHV) for each turbine system
• Each CTG vented to a dedicated Heat Recovery Steam Generator (HRSG) and a shared 267 MW Steam Turbine Generator (STG)
• Emissions of NOX and CO controlled by Dry Low-NOX (DLN) Combustors, Selective Catalytic Reduction (SCR), and an Oxidation Catalyst (Ox-Cat)
Auxiliary Boiler • 110 MMBtu/hr (HHV) with ultra low-NOX burner, fired on natural gas
Emergency Diesel-fired Internal Combustion (IC) Engine
• 2,000 kW (2,683 hp) • 40 CFR Part 60, Subpart IIII emission standards • California Air Resources Board Tier 2 emission standards
Emergency Diesel-fired IC Firewater Pump Engine
• 182 hp (135 kW) • 40 CFR Part 60, Subpart IIII emission standards • California Air Resources Board Tier 3 emission standards
Auxiliary Heater • 40 MMBtu/hr (HHV) with ultra low-NOX burner, fired on natural gas
Cooling Tower • 130,000 gallons per minute maximum circulation rate • Total dissolved solids (TDS) concentration in makeup
water of 5,000 ppm (531 mg/L) • Drift eliminator with drift losses less than or equal to
0.0005 percent based on circulation rate Circuit Breakers • Enclosed-pressure SF6 Circuit Breakers
• 0.5% (by weight) annual leakage rate • 10% (by weight) leak detection system
Maintenance Vehicle Traffic Generating Fugitive Road Dust
• Maintenance vehicles generating fugitive road dust when traveling on paved and unpaved roadways in the solar field with the Project
• Project Fugitive Dust Control Plan
Electricity will be generated by the combustion turbine generators when the combustion of natural gas turns the turbine blades. The spinning blades will drive an electric generator with the potential to generate up to 154 megawatts (MW) of electricity from each turbine.
5
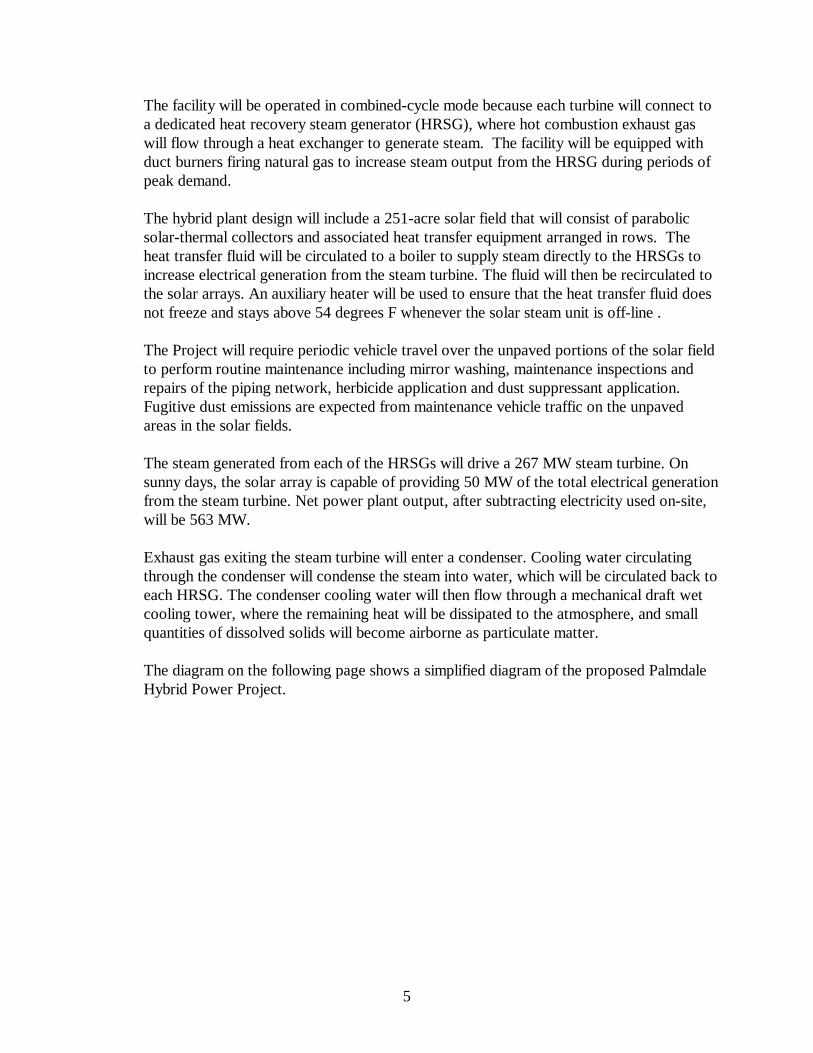
The facility will be operated in combined-cycle mode because each turbine will connect to a dedicated heat recovery steam generator (HRSG), where hot combustion exhaust gas will flow through a heat exchanger to generate steam. The facility will be equipped with duct burners firing natural gas to increase steam output from the HRSG during periods of peak demand. The hybrid plant design will include a 251-acre solar field that will consist of parabolic solar-thermal collectors and associated heat transfer equipment arranged in rows. The heat transfer fluid will be circulated to a boiler to supply steam directly to the HRSGs to increase electrical generation from the steam turbine. The fluid will then be recirculated to the solar arrays. An auxiliary heater will be used to ensure that the heat transfer fluid does not freeze and stays above 54 degrees F whenever the solar steam unit is off-line . The Project will require periodic vehicle travel over the unpaved portions of the solar field to perform routine maintenance including mirror washing, maintenance inspections and repairs of the piping network, herbicide application and dust suppressant application. Fugitive dust emissions are expected from maintenance vehicle traffic on the unpaved areas in the solar fields. The steam generated from each of the HRSGs will drive a 267 MW steam turbine. On sunny days, the solar array is capable of providing 50 MW of the total electrical generation from the steam turbine. Net power plant output, after subtracting electricity used on-site, will be 563 MW. Exhaust gas exiting the steam turbine will enter a condenser. Cooling water circulating through the condenser will condense the steam into water, which will be circulated back to each HRSG. The condenser cooling water will then flow through a mechanical draft wet cooling tower, where the remaining heat will be dissipated to the atmosphere, and small quantities of dissolved solids will become airborne as particulate matter. The diagram on the following page shows a simplified diagram of the proposed Palmdale Hybrid Power Project.

6
7
Air Pollution Control The PHPP will use Selective Catalytic Reduction (SCR) to reduce NOX emissions from the combustion turbine generators. The SCR will use aqueous ammonia as the reagent, where the catalyst facilitates the reaction of the ammonia with NOX to create atmospheric nitrogen (N2) and water. The PHPP will use an oxidation catalyst to reduce emissions of CO and volatile organic compounds (VOCs). Although CO is regulated in this proposed PSD permit, VOCs are regulated by the New Source Review (NSR) permit issued by the District, as explained in Section 6 below. Pipeline quality natural gas fuel and good combustion practices will be used to minimize particulate emissions. Thermal efficiency will be used to minimize GHG emissions. Additional equipment includes a natural gas-fired auxiliary boiler equipped with an ultra low-NOX burner, a natural gas-fired auxiliary heater equipped with an ultra low-NOX burner, a diesel-fired emergency generator and a diesel-fired emergency firewater pump engine both fired with ultra-low sulfur diesel fuel and compliant with federal NSPS requirements, and SF6 circuit breakers with leak detection systems. Power Plant Startup In a typical combined-cycle gas turbine power plant, components of the steam cycle cannot withstand rapid temperature changes, limiting how fast the steam turbine may be started. The “rapid start" design of the PHPP is expected to reduce the time required for the steam cycle to start up. This is important to air quality for two reasons. First, the exhaust gas temperature when the steam cycle is not operating is higher than the design temperature window for the SCR and oxidation catalysts. Second, the plant will generate more electricity for the amount of fuel burned when the hot gas turbine exhaust is used to power the steam generator in combined cycle.
The auxiliary boiler is primarily designed to shorten the duration of startups as part of GE’s RSP technology, thus minimizing emissions during CTG startup.
5. Emissions from the Proposed Project
This section describes the pollutants that are covered by the PSD program within the Antelope Valley Air Quality Management District (District), which is the area in which the Project is proposed to be located. The Clean Air Act’s New Source Review (NSR) provisions include two preconstruction permitting programs. First, the PSD program is intended to protect air quality in “attainment areas,”1 which are areas that meet the National Ambient Air Quality Standards (NAAQS). EPA is responsible for issuing PSD permits for major new stationary sources emitting pollutants that are in attainment with (or unclassifiable for) the NAAQS, in
1 PSD also applies to pollutants where the status of the area is uncertain (unclassifiable) for NAAQS.

8
general, and within the District. Second, the nonattainment NSR program applies in areas where pollutant concentrations exceed the NAAQS (“nonattainment areas”). The District implements the nonattainment NSR program for facilities within its boundaries emitting nonattainment pollutants and their precursors (e.g., volatile organic compounds and nitrogen oxides are precursors to ambient ozone). Therefore, pollutants that are in nonattainment with the NAAQS within the District are regulated under a separate nonattainment NSR permit issued by the District. Table 5-1 below describes the regulated pollutants that will be emitted by the Project and their attainment status within the District.
Table 5-1: National Ambient Air Quality Standard Attainment Status for Antelope Valley Air Quality Management District
Pollutant Attainment Status Permit Program
Nitrogen Dioxide (NO2) Attainment/Unclassifiable PSD Sulfur Dioxide (SO2) Attainment/Unclassifiable PSD
Carbon Monoxide (CO) Attainment PSD Particulate Matter (PM) n/a2 PSD
Particulate matter under 10 micrometers diameter (PM10)
Unclassifiable PSD
Particulate Matter under 2.5 micrometers diameter (PM2.5)
Attainment/Unclassifiable PSD
Ozone Nonattainment3 NA-NSR Lead (Pb) Attainment4 PSD
Sulfuric Acid Mist (H2SO4) n/a2 PSD Hydrogen Sulfide (H2S) n/a2 PSD
Total Reduced Sulfur (TRS) n/a2 PSD Fluorides n/a2 PSD
Greenhouse Gases (GHG) n/a2 PSD
The PSD program (40 CFR § 52.21) applies to “major” new sources of pollutants for which an area has been designated attainment or is unclassifiable. A fossil fuel-fired steam
2 There are no national ambient air quality standards (NAAQS) for PM, H2SO4, H2S, TRS, fluorides, or GHGs. However, in addition to other pollutants for which no NAAQS have been set, these pollutants are listed as regulated pollutants with a defined applicability threshold under the PSD regulations (40 CFR § 52.21). 3 Because NOx is also a precursor to ozone in this area, it will also be regulated by the separate District ozone non-attainment New Source Review permit in addition to this PSD permit. 4 Area has not yet been designated for lead and is therefore treated as an attainment area.

9
electric plant with a heat input capacity of 250 MMBtu/hr or greater, such as the PHPP, that emits or has the potential to emit (PTE) 100 tons per year (tpy) or more of any pollutant regulated under the Clean Air Act5, is defined as a “major source.”
6. Applicability of the Prevention of Significant Deterioration Regulations This section describes the PSD applicability thresholds, and our conclusion that NO2, CO, PM, PM10, PM2.5, and GHG will be regulated by EPA’s proposed PSD permit. The estimated emissions in Table 6-1 show that the PHPP will be a major source for NOx, CO, PM, PM10, PM2.5 and GHG. The annual emission data in Table 3 (based on allowable operation up to 8,760 hours per year) are based on the applicant’s maximum expected emissions, including emissions from startup and shutdown cycles. The applicant assumes that all combustion-related emissions of PM10 are of diameter less than 2.5 microns (i.e., PM2.5), which is a conservative estimate, as some particulate emissions may fall in the size fraction between 2.5 and 10 micrometers. Once a source is considered major for a PSD pollutant, PSD also applies to any other regulated pollutant that is emitted in a significant amount. The data in Table 3 show that emissions of sulfur dioxide (SO2) will be less than the major source threshold and less than the significant emission rate. Therefore, PSD does not apply for SO2. Estimated emissions of the PSD-regulated pollutants from each emission unit are listed in Table 6-1.
5 Other types of “source categories” are subject to either the same 100 tpy threshold, or else a 250 tpy threshold.

10
Table 6-1: Estimated Emissions and PSD Applicability
Pollutant Estimated Annual Emissions (tons/year)
Major Source Threshold (tons/year)
Significant Emission Rate
(tons/year)
Does PSD apply?
CO 250.2 100 100 Yes
NO2 114.9 100 40 Yes
PM 79.1 100 25 Yes
PM10 62.5 100 15 Yes
PM2.5 56.0 100 15 Yes
SO2 8.9 100 40 No
Pb 0 0.6 0.6 No
H2SO4 3.4 7 7 No
H2S (incl. TRS) 0 10 10
No
Fluorides 0 3 3 No
GHG (incl. CO2e) 1,913,000 100,000 75,000 Yes

11
Table 6-2: Estimated Emissions of PSD-Regulated Pollutants by Emission Unit
CO NOX PM PM10 PM2.5 GHG (a) CO2e (b)
Total Facility 250.2 tpy 114.9 tpy 79.1 tpy 62.5 tpy 56.0 1,913,376 1,913,000
CTG+HRSG (2) 248.0 113.7 47.8 47.8 47.8 1,908,074 1,908,000
Auxiliary Heater 0.74 0.22 0.15 0.15 0.15 2,340 2,000
Auxiliary Boiler 1.01 0.30 0.20 0.20 0.20 2,920 3,000 Emergency Diesel
Engine 0.39 0.67 0.02 0.02 0.02 27.6 0
Emergency Diesel Firewater Pump 0.03 0.03 0.002 0.002 0.002 4.41 0
Cooling Tower n/a n/a 7.13 7.13 7.13 n/a n/a Circuit Breakers n/a n/a n/a n/a n/a 9.56 0
Maintenance Vehicles (c) n/a n/a 23.80 7.16 0.72 n/a n/a
Notes:
(a) Represents all GHG emissions on a mass basis. (b) Represents the carbon dioxide equivalent (CO2e) of all GHG emissions, rounded to the nearest 1,000 tons. (c) This category represents fugitive road dust emissions (e.g., particulate matter emissions) that are expected from maintenance
vehicle traffic on the unpaved areas in the solar fields.
12
7. Best Available Control Technology
This section describes EPA’s Best Available Control Technology (BACT) analysis for the control of NOx, CO, PM, PM10, PM2.5, and GHG emissions from this facility. Section 169(3) of the Clean Air Act defines BACT as follows:
"The term 'best available control technology' means an emission limitation based on the maximum degree of reduction of each pollutant subject to regulation under the Clean Air Act emitted from or which results from any major emitting facility, which the permitting authority, on a case-by-case basis, taking into account energy, environmental, and economic impacts and other costs, determines is achievable through application of production processes and available methods, systems, and techniques, including fuel cleaning or treatment or innovative fuel combustion techniques for control of each such pollutant. In no event shall application of ‘best available control technology’ result in emissions of any pollutants which will exceed the emissions allowed by any applicable standard established pursuant to section 111 [New Source Performance Standards or NSPS] or 112 [or NESHAPS] of the Clean Air Act."
See also 40 CFR 52.21(b)(12). In accordance with 40 CFR 52.21(j), a new major stationary source is required to apply BACT for each regulated NSR pollutant that it would have the potential to emit (PTE) in significant amounts. EPA outlines the process it generally uses to do this case-by-case analysis (referred to as a “top-down” BACT analysis) in a June 13, 1989 memorandum. The top-down BACT analysis is a well-established procedure that EPA’s Environmental Appeals Board (EAB) has consistently followed in adjudicating PSD permit appeals. See, e.g., In re Knauf, 8 E.A.D. 121, 129-31 (EAB 1999); In re Maui Electric, 8 E.A.D. 1, 5-6 (EAB 1998).
In brief, under the top-down process, all available control technologies are ranked in descending order of control effectiveness. The PSD applicant first examines the most stringent technology. That technology is established as BACT unless it is demonstrated that technical considerations, or energy, environmental, or economic impacts justify a conclusion that the most stringent technology is not achievable for the case at hand. If the most stringent technology is eliminated, then the next most stringent option is evaluated until BACT is determined. The top-down BACT analysis is a case-by-case exercise for the particular source under evaluation. In summary, the five steps involved in a top-down BACT evaluation are:
1. Identify all available control options with practical potential for application to
the specific emission unit for the regulated pollutant under evaluation; 2. Eliminate technically infeasible technology options;

13
3. Rank remaining control technologies by control effectiveness; 4. Evaluate the most effective control alternative and document results,
considering energy, environmental, and economic impacts as appropriate; if top option is not selected as BACT, evaluate next most effective control option; and
5. Select BACT, which will be the most stringent technology not rejected based
on technical, energy, environmental, and economic considerations.
The proposed Project is subject to BACT for NOx, CO, PM, PM10, PM2.5, and GHG emissions. A BACT analysis was conducted for each of the following emission units: the two natural gas combustion turbines, the 40 MMBtu/hr auxiliary process heater, the 110 MMBtu/hr auxiliary boiler, the two diesel-fired internal combustion engines, the fugitive road dust emissions, the cooling tower and the circuit breakers. Tables 7-1 and 7-2 provide a summary of the BACT determinations for NOX, CO, PM, PM10, PM2.5, and GHG from the emission units listed above.

14
Table 7-1: Summary of NOX, CO, PM, PM10, and PM2.5 BACT Limits and Requirements for Testing and Monitoring6
NOX CO PM, PM10, and PM2.5
Restrictions on Usage
2 Combustion Turbines (each, no duct burning)
• 11.55 lb/hr • 1-hr average • 2.0 ppmvd, 15% O2 • CEMS • Quarterly and Annual
RATA for CEMs
• 5.74 lb/hr7 • 1-hr average • 1.5 ppmvd, 15% O2
8 • CEMS • Quarterly and Annual
RATA for CEMs
• 4.7 lb/hr • 3-hr average • 0.0027 lb/MMBtu • PUC natural gas (Sulfur
<0.20 gr/100 dscf on 12-month average and not exceed 1.0 gr/dscf at anytime)
• Annual Performance Testing
n/a
2 Combustion Turbines (each, with duct burning)
• 14.6 lb/hr • 1-hr average • 2.0 ppmvd, 15% O2
• 8.90 lb/hr • 1-hr average • 2.0 ppmvd,15% O2
• 8.0 lb/hr • 3-hr average • 0.0035 lb/MMBtu • PUC natural gas (Sulfur
<0.20 gr/100 dscf on 12-month average and not exceed 1.0 gr/dscf at anytime)
• Annual Performance Testing
• Total duct burning (D3 & D4) < 2,000 hrs/yr
2 Combustion Turbines (each, startup and shutdown)
• Cold Start - 52.4 lb/hr, 96 lb/event
• Warm/Hot – 30 lb/hr, 40 lb/event
• Shutdown – 114 lb/hr, 57 lb/event
• 1-hr average
• Cold Start - 224 lb/hr, 410 lb/event
• Warm/Hot – 247 lb/hr, 329 lb/event
• Shutdown – 674 lb/hr, 337 lb/event
• 1-hr average
n/a • Cold Start –110 minutes
• Warm/Hot – 80 minutes
• Shutdown – 674 30 minutes
Heater 40 MMBtu/hr (HHV)
• 9.0 ppm, 3% O2 • 3-hr average • Initial Performance
Testing and at least every 5 years
• 50.0 ppm, 3% O2 • 3-hr average • Initial Performance
Testing and at least every 5 years
• 0.3 lb/hr for Heater • 0.8 lb/hr for Boiler • 3-hr average • PUC natural gas (Sulfur
<0.20 gr/100 dscf on 12-month average and not exceed 1.0 gr/dscf at anytime)
• 1,000 hr/yr • Non-resettable
elapsed time meter
Boiler 35 MMBtu/hr (HHV)
• 500 hr/yr • Non-resettable
elapsed time meter
6 PHPP must keep all records of all testing, fuel use, and fuel testing requirements for a period of five (5) years and must report excess emissions to EPA semi-annually, except when: more frequent reporting is specifically required by an applicable subpart; or the Administrator, on a case-by-case basis, determines that more frequent reporting is necessary to accurately assess the compliance status of the source. . 7 During the initial 3-year demonstration period, the limit will be 7.65 lb/hr. 8 During the initial 3-year demonstration period, the limit will be 2.0 ppmvd, 15% O2.

15
NOX CO PM, PM10, and PM2.5
Restrictions on Usage
Emergency Generator 2000 KW (2,683 hp)
• 6.4 g/KW-hr, (4.8 g/hp-hr)9
• 3-hr average • Initial Performance
Testing
• 3.5 g/KW-hr, (2.6 g/hp-hr)
• 3-hr average • Initial Performance
Testing
• 0.20 g/KW-hr, (0.15 g/hp-hr)
• 3-hr average • Exclusive use of ultra
low sulfur fuel, not to exceed 15 ppmvd sulfur
• Fuel Supplier Certification
• Initial Performance Testing
• 50 hr/year • Non-resettable
elapsed time meter
Firewater Pump Engine 135 KW (182 hp)
• 4.0 g/KW-hr, (3.0 g/hp-hr)10
• 3-hr test average • Initial Performance
Testing
• 50 hr/year • As required for
fire testing • Non-resettable
elapsed time meter
Cooling tower 130,000 gpm
n/a n/a • 1.6 lb/hr (total PM) • < 0.0005% drift
eliminators • < 5000 ppm total
dissolved solids • Weekly water quality
testing
n/a
Circuit Breakers
na/ n/a n/a n/a
Maintenance Vehicle
n/a n/a • Fugitive Dust Control Plan
n/a
9 Emission standards for NOx in the New Source Performance Standard for stationary compression ignition internal combustion engines (40 CFR Part 60 Subpart IIII) and the California Tier Emission Standards are based on the sum of NOx and non-methane hydrocarbons (NMHC). For the NOx emission limits, the applicant assumes NMHC + NOx emissions from the engine are 95% NOX. 10 Ibid.

16
Table 7-2: Summary of GHG BACT Limits
and Requirements for Testing and Monitoring
GHG Testing and Monitoring
Restrictions on Usage
2 Combustion Turbines (each, no duct burning)
• 774 lb CO2/MWh source-wide net output
• 117 lb CO2/MMBtu heat input, each at ISO standard day conditions
• 30-day rolling average
• CEMS
n/a
2 Combustion Turbines (each, with duct burning)
• Total duct burning (D3 & D4) < 2,000 hrs/yr
2 Combustion Turbines (each, startup and shutdown)
• Cold Start –110 minutes
• Warm/Hot – 80 minutes
Heater 40 MMBtu/hr (HHV)
• Annual tune-ups
• Non-resettable elapsed time meter
• 1,000 hr/yr
Boiler 35 MMBtu/hr (HHV)
• Non-resettable elapsed time meter
• 500 hr/yr
Circuit Breakers
• 9.56 tpy CO2e • 0.5% maximum
annual leakage rate
• 10% leak detection system
• Monthly pounds of dielectric fluid added
n/a
7.1 BACT for Natural Gas Combustion Turbine Generators The PHPP will have two combined-cycle, natural gas-fired combustion turbines (CTs). Each CT has a maximum heat input capacity of 1,736 MMBtu/hr (at ISO conditions) and will have a dedicated heat recovery steam generator (HRSG) with a 550 MMBtu/hr duct burner. Each duct burner will be limited to 2,000 hours of operation per year. The CTs are subject to BACT for NOX, CO, PM, PM10, PM2.5, and GHGs. A top-down BACT analysis for each pollutant has been performed and is summarized below.
7.1.1 Nitrogen Oxide Emissions Step 1 - Identify All Control Technologies The following inherently lower-emitting control options for NOX emissions include:
• Low NOX burner design (e.g., dry low NOX (DLN) combustors)

17
• Water or steam injection • Inlet air coolers
The available add-on NOX control technologies include:
• Selective Catalytic Reduction (SCR) system • EMxTM system (formerly SCONOx) • Selective non-catalytic reduction (SNCR)
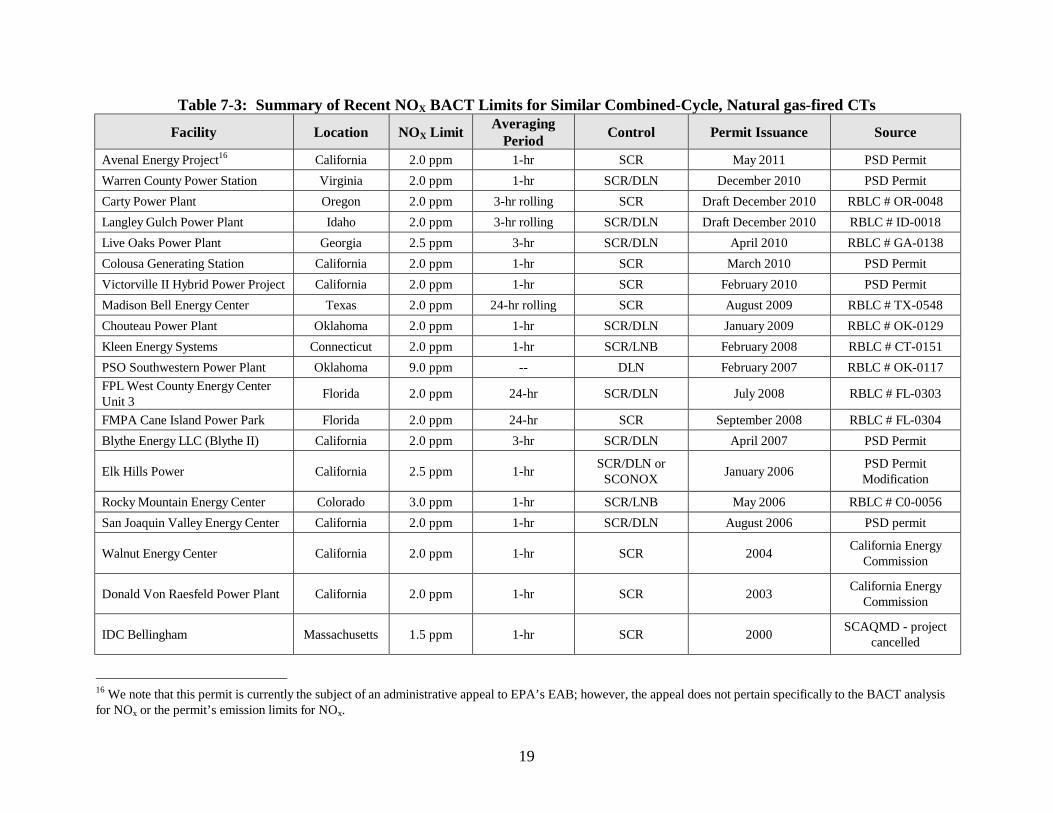
Step 2 – Eliminate Technically Infeasible Options All of the available control options identified in Step 1 are technically feasible. Step 3 – Rank Control Technologies A summary of recent BACT limits for similar combined-cycle, natural gas-fired CTs is provided in Table 7-3. There is one facility that was permitted with a BACT limit less than the limit proposed by the applicant. The IDC Bellingham facility in Massachusetts was permitted in 2000 with a limit of 1.5 ppm. However, this project was cancelled, so this limit has never been demonstrated as achievable. All recently issued permits indicate that a limit of 2.0 ppm based on a 1-hr average represents the highest level of NOX control. The available control technologies are ranked according to control effectiveness in Table 7-4. SCR and EMxTM for NOX Emissions Selective catalytic reduction (SCR) is a well-demonstrated technology for NOX control and has specifically achieved NOX emissions of 2.0 ppm on a 1-hr average on large CTs (greater than 100 MW). EMxTM technology (formerly SCONOx) is a relatively newer technology that has yet to be demonstrated in practice on CTs larger than 50 MW. The manufacturer has stated that it is a scalable technology and that NOX guarantees of <1.5 ppm are available.11 As a result, EMxTM is considered technically feasible for this facility. However, it is unclear what NOX emission levels can actually be achieved by the technology. We found only one BACT analysis that determined that EMxTM/SCONOx was BACT for a large CT. However, the accompanying permit for the facility, Elk Hills Power in California, allowed the use of SCR or SCONOx (the former name of EMxTM) to meet a permit limit of 2.5 ppm, and the actual technology that was installed in that case was SCR. We also note that the Redding Power Plant in California, a 43 MW gas-fired CT, was permitted with a 2.0 ppm demonstration limit using SCONOx. In a letter dated June 23, 2005 from the Shasta County Air Quality Management District (Shasta County AQMD) to the Redding Electric Utility, however, it was determined that the unit could not meet the demonstration limit and, as a result, the limit was revised to 2.5 ppm. Based on these two examples, it appears EMxTM has been demonstrated to achieve only 2.5 ppm and we are therefore evaluating it at this limit.
11 Information available at http://emerachemnew.ciplex.us/emx-product.html. See EMx White Paper 2008.

18
Table 7-4: NOX Control Technologies Ranked by Control Effectiveness
NOX Control Technology Emission Rate (ppmvd @ 15% O2, 1-hr average)
SCR with dry low NOX combustors and inlet air coolers
2.0
EMxTM with dry low NOX combustors and inlet air coolers
2.5
SNCR with dry low NOX combustors and inlet air coolers
~4.512
Dry low NOX combustors and inlet air coolers 9 Water or steam injection >9
Step 4 – Economic, Energy and Environmental Impacts The applicant has proposed SCR, the top-ranked technology, as BACT. We have determined that it is appropriate to consider the collateral environmental impacts associated with SCR. The SCR system requires onsite ammonia storage and will result in relatively small amounts of ammonia slip from the CTs’ exhaust gases. Ammonia has the potential to be a toxic substance with harmful side effects, if exposed through inhalation, ingestion, skin contact, or eye contact.13 Ammonia has not been identified as a carcinogen. It is noted that the applicant will use aqueous ammonia, which is considered the safer storage method. Additionally, we note that the California Energy Commission’s Presiding Member’s Proposed Decision proposes to include Conditions of Certification to ensure the safe receipt and storage of aqueous ammonia at the PHPP.14
Ammonia slip emissions for the proposed source are limited to 5 ppm by the nonattainment New Source Review (NSR) permit issued by the District. The District conducted a Health Risk Assessment (HRA) that included ammonia slip emissions. The results of the assessment showed that the maximum non-cancer chronic and acute hazard indices were both less than the significance level of 1.0 (0.0008 and 0.028, respectively).15
Considering the above factors, the possible risks associated with onsite storage and use of ammonia do not appear to outweigh the benefits associated with significant NOX reductions.
Step 5 – Select BACT Based on a review of the available control technologies for NOX emissions from natural gas-fired combustion turbines, we have concluded that BACT for CTs is 2.0 ppm at 15% O2 based on a 1-hr average. Additionally, we are adding a mass emission limit of 11.55 lb/hr without duct firing and 14.6 lb/hr with duct firing based on a 1-hr average. 12 This is an approximate value that was estimated considering that the control effectiveness of SNCR has been demonstrated to be between 40 and 60 percent. 13 Information is available from the Agency for Toxics Substances and Disease Registry at http://www.atsdr.cdc.gov/phs/phs.asp?id=9&tid=2. 14 This information is available at http://www.energy.ca.gov/2011publications/CEC-800-2011-005/CEC-800-2011-005-PMPD.pdf. See conditions HAZ-1 through HAZ-6. 15 See Final Determination of Compliance for Palmdale Hybrid Power Project issued by the District on May 13, 2010, Section 8.
19
Table 7-3: Summary of Recent NOX BACT Limits for Similar Combined-Cycle, Natural gas-fired CTs
Facility Location NOX Limit Averaging Period Control Permit Issuance Source
Avenal Energy Project16 California 2.0 ppm 1-hr SCR May 2011 PSD Permit Warren County Power Station Virginia 2.0 ppm 1-hr SCR/DLN December 2010 PSD Permit Carty Power Plant Oregon 2.0 ppm 3-hr rolling SCR Draft December 2010 RBLC # OR-0048 Langley Gulch Power Plant Idaho 2.0 ppm 3-hr rolling SCR/DLN Draft December 2010 RBLC # ID-0018 Live Oaks Power Plant Georgia 2.5 ppm 3-hr SCR/DLN April 2010 RBLC # GA-0138 Colousa Generating Station California 2.0 ppm 1-hr SCR March 2010 PSD Permit Victorville II Hybrid Power Project California 2.0 ppm 1-hr SCR February 2010 PSD Permit Madison Bell Energy Center Texas 2.0 ppm 24-hr rolling SCR August 2009 RBLC # TX-0548 Chouteau Power Plant Oklahoma 2.0 ppm 1-hr SCR/DLN January 2009 RBLC # OK-0129 Kleen Energy Systems Connecticut 2.0 ppm 1-hr SCR/LNB February 2008 RBLC # CT-0151 PSO Southwestern Power Plant Oklahoma 9.0 ppm -- DLN February 2007 RBLC # OK-0117 FPL West County Energy Center Unit 3 Florida 2.0 ppm 24-hr SCR/DLN July 2008 RBLC # FL-0303
FMPA Cane Island Power Park Florida 2.0 ppm 24-hr SCR September 2008 RBLC # FL-0304 Blythe Energy LLC (Blythe II) California 2.0 ppm 3-hr SCR/DLN April 2007 PSD Permit
Elk Hills Power California 2.5 ppm 1-hr SCR/DLN or SCONOX January 2006 PSD Permit
Modification
Rocky Mountain Energy Center Colorado 3.0 ppm 1-hr SCR/LNB May 2006 RBLC # C0-0056 San Joaquin Valley Energy Center California 2.0 ppm 1-hr SCR/DLN August 2006 PSD permit
Walnut Energy Center California 2.0 ppm 1-hr SCR 2004 California Energy Commission
Donald Von Raesfeld Power Plant California 2.0 ppm 1-hr SCR 2003 California Energy Commission
IDC Bellingham Massachusetts 1.5 ppm 1-hr SCR 2000 SCAQMD - project cancelled
16 We note that this permit is currently the subject of an administrative appeal to EPA’s EAB; however, the appeal does not pertain specifically to the BACT analysis for NOx or the permit’s emission limits for NOx.
20
7.1.2 Carbon Monoxide Emissions Step 1 – Identify All Control Technologies The inherently lower-emitting control options for CO emissions include:
• Good combustion practices The available add-on CO control technologies include:
• Oxidation catalyst • EMxTM
Step 2 – Eliminate Technically Infeasible All of the available control options identified in Step 1 are technically feasible. Step 3 – Rank Remaining Control Technologies A summary of recent BACT limits for similar combined-cycle, natural-gas fired CTs is provided in Table 7-5. The applicant proposed using oxidation catalyst with a limit of 2.0 ppm (with and without duct burning) based on a 1-hr average. Currently, the lowest permitted limit for oxidation catalyst is the Kleen Energy facility in Connecticut, which has a limit of 0.9 ppm (1.8 ppm with duct firing) based on a 1-hr average. The Kleen Energy facility has recently begun commercial operation, but results from compliance demonstration testing are not available at this time.17 The next most stringent permitted limit is the Avenal Energy Project in California, which has a limit of 1.5 ppm following a demonstration period18 (2.0 ppm with duct burning) and also uses oxidation catalyst. The Avenal Energy Project has not begun construction at this time. Based on this information, oxidation catalyst is being evaluated at the most stringent control option. Oxidation Catalyst and EMxTM Oxidation catalyst is a well-demonstrated technology for large CTs. As discussed in the NOX BACT analysis, it is clear that EMxTM is an available and technically feasible technology. However, it is unclear what level of control would be achieved by the technology on a long-term basis with a short (1-hr) averaging period. The manufacturer claims that emission rates below 1 ppm are achievable, but there is a lack of information that demonstrates this on large CTs. We are not aware of any BACT determinations that have required EMxTM for CO emissions. Based on the lack of information for similar units, EMxTM is conservatively being compared as equivalent to oxidation catalyst.
17 See August 4, 2011 email from Louis Corsino to Lisa Beckham – “Kleen Energy – Middletown, CT”. 18 This limit becomes effective after a 3-year demonstration period, during which the limit is 2.0 ppm. As noted above, this permit is currently the subject of an administrative appeal to EPA’s EAB; however, the appeal does not pertain specifically to the BACT analysis for CO or the permit’s emission limits for CO..

21
The available control technologies are ranked according to control effectiveness in Table 7-6.
Table 7-6: CO Control Technologies Ranked by Control Effectiveness
CO Control Technology
Emission Rate (ppmvd @ 15% O2, 1-hr average, without
duct firing)
Emission Rate (ppmvd @ 15% O2, 1-hr average, with
duct firing) Oxidation catalyst and good combustion practices
0.9-2.0 ppm 2.0-2.4 ppm
EMxTM and good combustion practices
0.9–2.0 ppm 2.0-2.4 ppm
Good combustion practices 8.0 ppm 8.0 ppm Step 4 – Economic, Energy and Environmental Impacts Although EMxTM is being considered equivalent to oxidation catalyst for controlling CO emissions, it was determined to be inferior to SCR for controlling NOX emissions. Because EMxTM would not ensure BACT is achieved for NOX, it is being eliminated in this step due to environmental impacts. Overall, better and more reliable pollution control for NOX and CO will be achieved for the Project with SCR and oxidation catalyst than with EMX
TM. We are not aware of any significant or unusual adverse environmental impacts associated with good combustion practices and an oxidation catalyst. Step 5 – Select BACT Based on the review of the available control technologies, we have concluded that BACT for CO is good combustion practices and an oxidation catalyst with a limit of 1.5 ppm at 15% O2 based on a 1-hr average without duct firing, and 2.0 ppm with duct firing. Additionally, we are adding a mass emission limit of 5.74 lb/hr without duct firing and 8.90 lb/hr with duct firing based on a 1-hr average. However, given the lack of long-term compliance data for the lower limits that would apply without duct firing, we feel it is appropriate to include permit provisions establishing a three-year demonstration period for those limits, during which time the limit will be 2.0 ppm at 15% O2 and 7.65 lb/hr based on a 1-hr average without duct firing. Demonstration period permit provisions will require that, prior to construction, the permittee submit design specifications as proof that the gas turbines were designed to achieve 1.5 ppm. The permittee must also submit a plan that sets forth the measures that will be taken to maintain the system and optimize its performance. The permittee must operate the gas turbines according to the design specifications and within the design parameters, and consistent with the maintenance and performance optimization plan. Following the first three years of commercial operation, the limits of 1.5 ppm (1-hour average) without duct firing will take effect unless the emissions and operating data collected by the applicant indicates that these limits are not feasible, and the applicant submits an application to EPA no later than the end of the 3-year period requesting a revision to the limit. If such a revision is requested but EPA determines that a revision is not warranted, the lower emission limit will become applicable.

22
Table 7-5: Summary of Recent CO BACT Limits for Similar Combined-Cycle, Natural gas-fired CTs
Facility Location CO Limit (CO Limit with duct
firing) Averaging Period Control Permit Issuance Source
Avenal Energy Project California 1.5 ppm19 (2.0 ppm) 1-hr Oxidation
catalyst June 2011 PSD Permit
Warren County Power Station Virginia 1.5 ppm (2.4
ppm with duct burning)
1-hr Oxidation catalyst/GCP December 2010 PSD Permit
Langley Gulch Power Plant Idaho 2.0 ppm 3-hr rolling Oxidation catalyst/GCP
Draft December 2010 RBLC # ID-0018
Live Oaks Power Plant Georgia 2.0 ppm 3-hr Oxidation catalyst/GCP April 2010 RBLC # GA-0138
Colousa Generating Station California 3.0 ppm 3-hr Oxidation catalyst March 2010 PSD Permit
Victorville II Hybrid Power Project California 2.0 ppm (3.0
ppm) 1-hr Oxidation catalyst February 2010 PSD Permit
Madison Bell Energy Center Texas 17.5 ppm 1-hr rolling GCP August 2009 RBLC # TX-0548
Chouteau Power Plant Oklahoma 8.0 ppm 1-hr GCP January 2009 RBLC # OK-0129 Lamar Power Partners II Texas 15 ppm 24-hr rolling GCP June 2009 RBLC # TX-0547
Patillo Branch Power Plant Texas 2.0 ppm 3-hr rolling Oxidation catalyst June 2009 RBLC # TX-0546
Cane Island Power Park Florida 8 ppm 24-hr GCP September 2008 RBLC # FL-0304
Elk Hills Power California 4.0 ppm 1-hr Oxidation catalyst January 2006 PSD Permit
Modification
Kleen Energy Systems Connecticut 0.9 ppm (1.8
ppm with duct firing)
1-hr Oxidation catalyst February 2008 RBLC # CT-0151
19 This limit becomes effective after a 3-year demonstration period. During the demonstration period, the limit is 2.0 ppm.
23
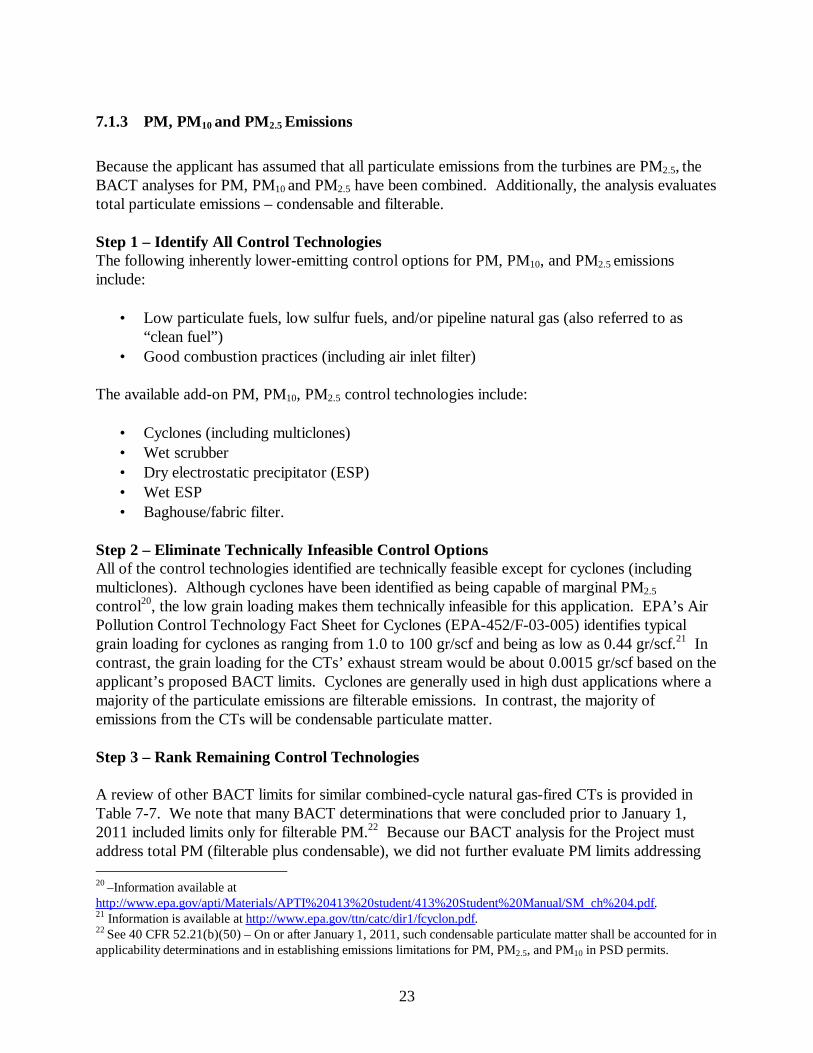
7.1.3 PM, PM10 and PM2.5 Emissions Because the applicant has assumed that all particulate emissions from the turbines are PM2.5, the BACT analyses for PM, PM10 and PM2.5 have been combined. Additionally, the analysis evaluates total particulate emissions – condensable and filterable. Step 1 – Identify All Control Technologies The following inherently lower-emitting control options for PM, PM10, and PM2.5 emissions include:
• Low particulate fuels, low sulfur fuels, and/or pipeline natural gas (also referred to as “clean fuel”)
• Good combustion practices (including air inlet filter) The available add-on PM, PM10, PM2.5 control technologies include:
• Cyclones (including multiclones) • Wet scrubber • Dry electrostatic precipitator (ESP) • Wet ESP • Baghouse/fabric filter.
Step 2 – Eliminate Technically Infeasible Control Options All of the control technologies identified are technically feasible except for cyclones (including multiclones). Although cyclones have been identified as being capable of marginal PM2.5 control20, the low grain loading makes them technically infeasible for this application. EPA’s Air Pollution Control Technology Fact Sheet for Cyclones (EPA-452/F-03-005) identifies typical grain loading for cyclones as ranging from 1.0 to 100 gr/scf and being as low as 0.44 gr/scf.21 In contrast, the grain loading for the CTs’ exhaust stream would be about 0.0015 gr/scf based on the applicant’s proposed BACT limits. Cyclones are generally used in high dust applications where a majority of the particulate emissions are filterable emissions. In contrast, the majority of emissions from the CTs will be condensable particulate matter. Step 3 – Rank Remaining Control Technologies A review of other BACT limits for similar combined-cycle natural gas-fired CTs is provided in Table 7-7. We note that many BACT determinations that were concluded prior to January 1, 2011 included limits only for filterable PM.22 Because our BACT analysis for the Project must address total PM (filterable plus condensable), we did not further evaluate PM limits addressing 20 –Information available at http://www.epa.gov/apti/Materials/APTI%20413%20student/413%20Student%20Manual/SM_ch%204.pdf. 21 Information is available at http://www.epa.gov/ttn/catc/dir1/fcyclon.pdf. 22 See 40 CFR 52.21(b)(50) – On or after January 1, 2011, such condensable particulate matter shall be accounted for in applicability determinations and in establishing emissions limitations for PM, PM2.5, and PM10 in PSD permits.
24
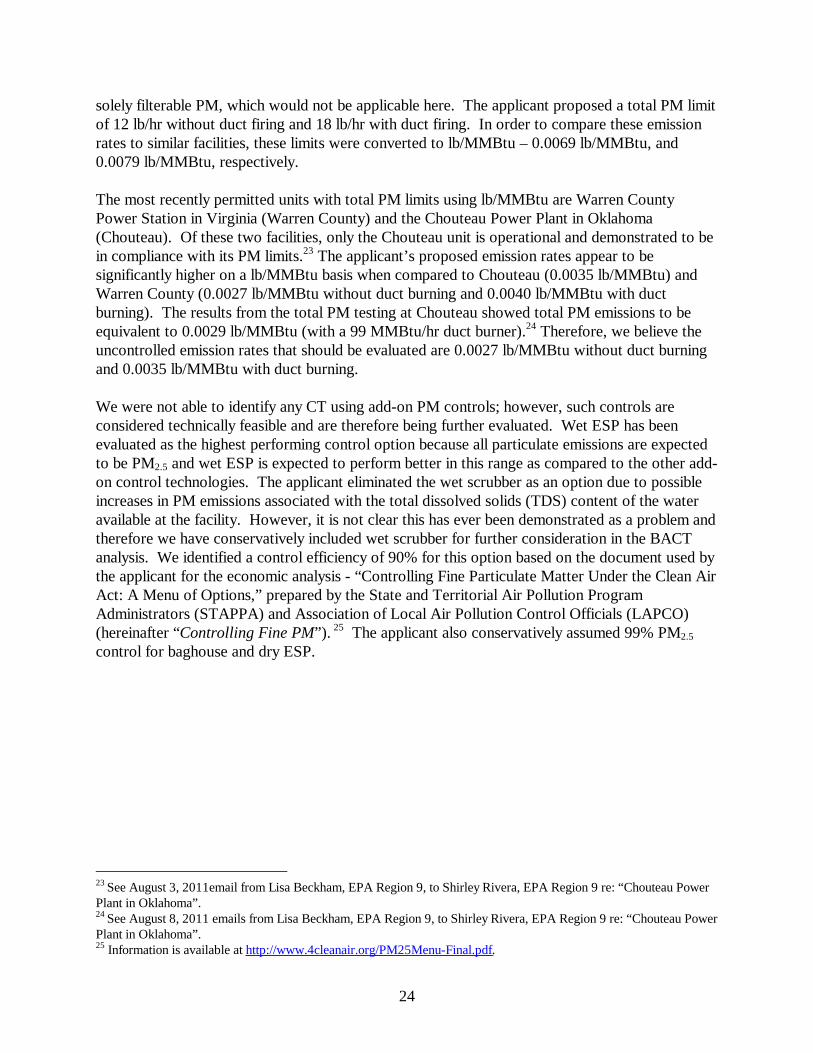
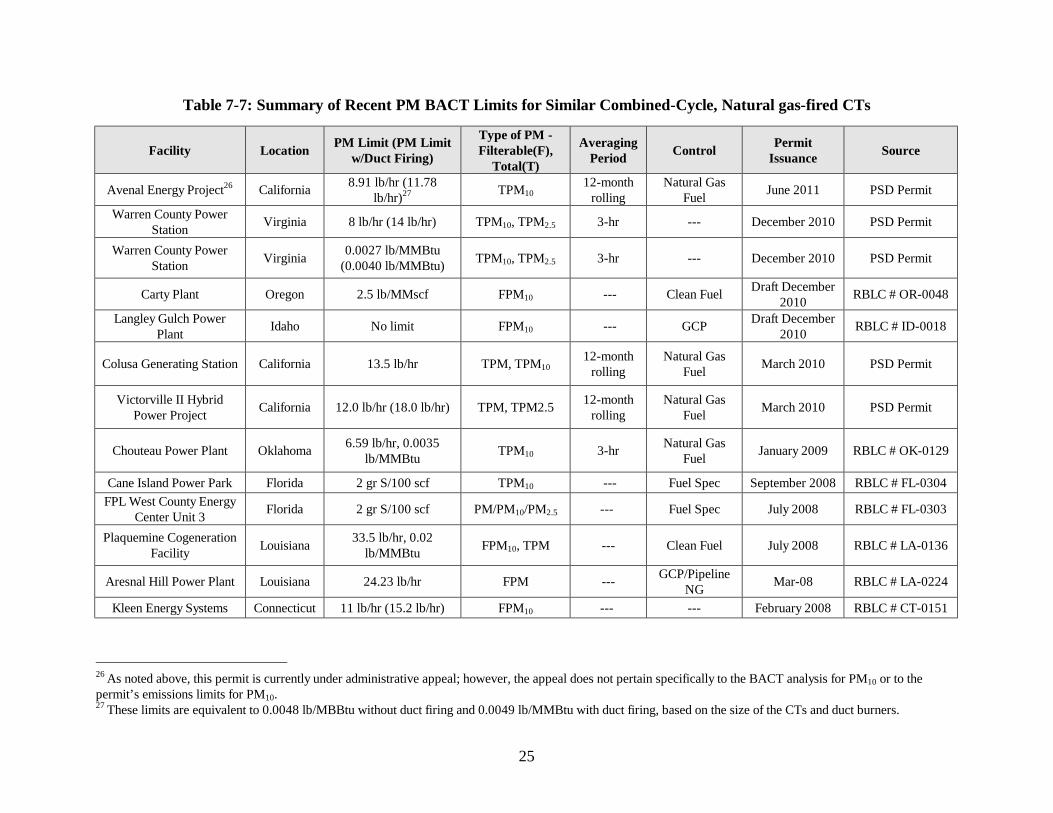
solely filterable PM, which would not be applicable here. The applicant proposed a total PM limit of 12 lb/hr without duct firing and 18 lb/hr with duct firing. In order to compare these emission rates to similar facilities, these limits were converted to lb/MMBtu – 0.0069 lb/MMBtu, and 0.0079 lb/MMBtu, respectively. The most recently permitted units with total PM limits using lb/MMBtu are Warren County Power Station in Virginia (Warren County) and the Chouteau Power Plant in Oklahoma (Chouteau). Of these two facilities, only the Chouteau unit is operational and demonstrated to be in compliance with its PM limits.23 The applicant’s proposed emission rates appear to be significantly higher on a lb/MMBtu basis when compared to Chouteau (0.0035 lb/MMBtu) and Warren County (0.0027 lb/MMBtu without duct burning and 0.0040 lb/MMBtu with duct burning). The results from the total PM testing at Chouteau showed total PM emissions to be equivalent to 0.0029 lb/MMBtu (with a 99 MMBtu/hr duct burner).24 Therefore, we believe the uncontrolled emission rates that should be evaluated are 0.0027 lb/MMBtu without duct burning and 0.0035 lb/MMBtu with duct burning. We were not able to identify any CT using add-on PM controls; however, such controls are considered technically feasible and are therefore being further evaluated. Wet ESP has been evaluated as the highest performing control option because all particulate emissions are expected to be PM2.5 and wet ESP is expected to perform better in this range as compared to the other add-on control technologies. The applicant eliminated the wet scrubber as an option due to possible increases in PM emissions associated with the total dissolved solids (TDS) content of the water available at the facility. However, it is not clear this has ever been demonstrated as a problem and therefore we have conservatively included wet scrubber for further consideration in the BACT analysis. We identified a control efficiency of 90% for this option based on the document used by the applicant for the economic analysis - “Controlling Fine Particulate Matter Under the Clean Air Act: A Menu of Options,” prepared by the State and Territorial Air Pollution Program Administrators (STAPPA) and Association of Local Air Pollution Control Officials (LAPCO) (hereinafter “Controlling Fine PM”). 25 The applicant also conservatively assumed 99% PM2.5 control for baghouse and dry ESP.
23 See August 3, 2011email from Lisa Beckham, EPA Region 9, to Shirley Rivera, EPA Region 9 re: “Chouteau Power Plant in Oklahoma”. 24 See August 8, 2011 emails from Lisa Beckham, EPA Region 9, to Shirley Rivera, EPA Region 9 re: “Chouteau Power Plant in Oklahoma”. 25 Information is available at http://www.4cleanair.org/PM25Menu-Final.pdf.
25
Table 7-7: Summary of Recent PM BACT Limits for Similar Combined-Cycle, Natural gas-fired CTs
Facility Location PM Limit (PM Limit w/Duct Firing)
Type of PM - Filterable(F),
Total(T)
Averaging Period Control Permit
Issuance Source
Avenal Energy Project26 California 8.91 lb/hr (11.78 lb/hr)27 TPM10
12-month rolling
Natural Gas Fuel June 2011 PSD Permit
Warren County Power Station Virginia 8 lb/hr (14 lb/hr) TPM10, TPM2.5 3-hr --- December 2010 PSD Permit
Warren County Power Station Virginia 0.0027 lb/MMBtu
(0.0040 lb/MMBtu) TPM10, TPM2.5 3-hr --- December 2010 PSD Permit
Carty Plant Oregon 2.5 lb/MMscf FPM10 --- Clean Fuel Draft December 2010 RBLC # OR-0048
Langley Gulch Power Plant Idaho No limit FPM10 --- GCP Draft December
2010 RBLC # ID-0018
Colusa Generating Station California 13.5 lb/hr TPM, TPM10 12-month
rolling Natural Gas
Fuel March 2010 PSD Permit
Victorville II Hybrid Power Project California 12.0 lb/hr (18.0 lb/hr) TPM, TPM2.5 12-month
rolling Natural Gas
Fuel March 2010 PSD Permit
Chouteau Power Plant Oklahoma 6.59 lb/hr, 0.0035 lb/MMBtu TPM10 3-hr Natural Gas
Fuel January 2009 RBLC # OK-0129
Cane Island Power Park Florida 2 gr S/100 scf TPM10 --- Fuel Spec September 2008 RBLC # FL-0304 FPL West County Energy
Center Unit 3 Florida 2 gr S/100 scf PM/PM10/PM2.5 --- Fuel Spec July 2008 RBLC # FL-0303
Plaquemine Cogeneration Facility Louisiana 33.5 lb/hr, 0.02
lb/MMBtu FPM10, TPM --- Clean Fuel July 2008 RBLC # LA-0136
Aresnal Hill Power Plant Louisiana 24.23 lb/hr FPM --- GCP/Pipeline NG Mar-08 RBLC # LA-0224
Kleen Energy Systems Connecticut 11 lb/hr (15.2 lb/hr) FPM10 --- --- February 2008 RBLC # CT-0151
26 As noted above, this permit is currently under administrative appeal; however, the appeal does not pertain specifically to the BACT analysis for PM10 or to the permit’s emissions limits for PM10. 27 These limits are equivalent to 0.0048 lb/MBBtu without duct firing and 0.0049 lb/MMBtu with duct firing, based on the size of the CTs and duct burners.
Palmdale (SE 09-01) Fact Sheet/Ambient Air Quality Impact Report August 2011
26
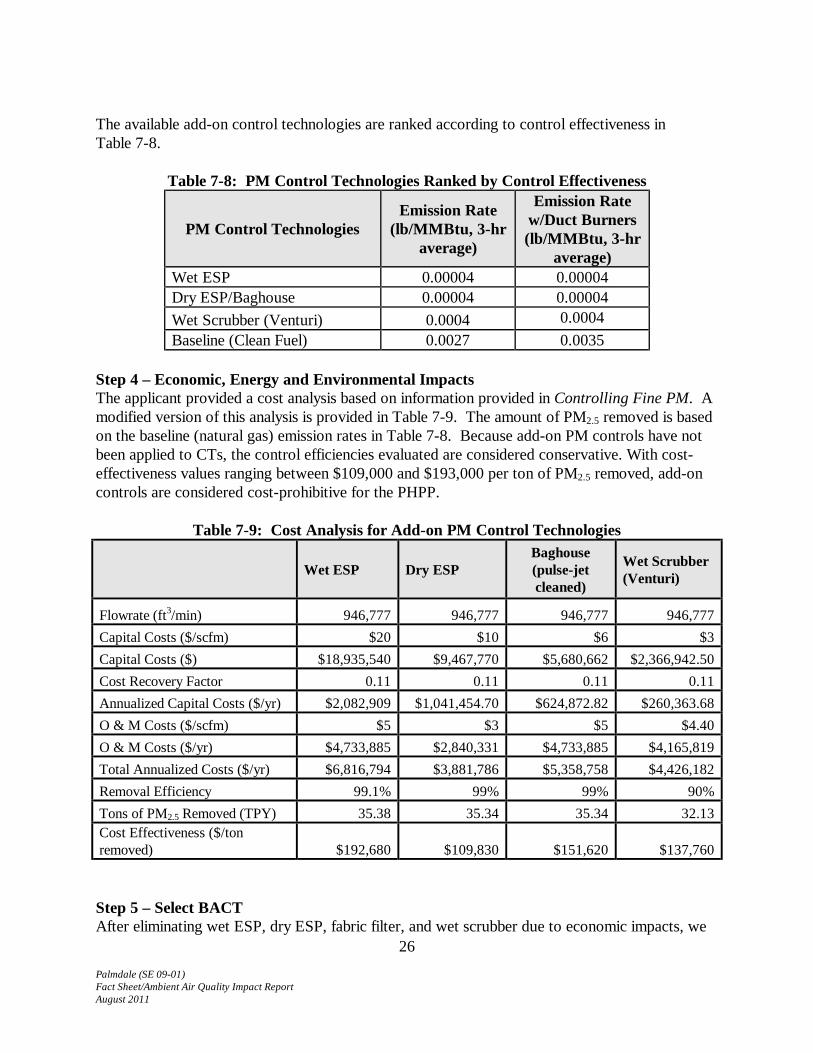
The available add-on control technologies are ranked according to control effectiveness in Table 7-8.
Table 7-8: PM Control Technologies Ranked by Control Effectiveness
PM Control Technologies Emission Rate
(lb/MMBtu, 3-hr average)
Emission Rate w/Duct Burners (lb/MMBtu, 3-hr
average) Wet ESP 0.00004 0.00004 Dry ESP/Baghouse 0.00004 0.00004 Wet Scrubber (Venturi) 0.0004 0.0004 Baseline (Clean Fuel) 0.0027 0.0035
Step 4 – Economic, Energy and Environmental Impacts The applicant provided a cost analysis based on information provided in Controlling Fine PM. A modified version of this analysis is provided in Table 7-9. The amount of PM2.5 removed is based on the baseline (natural gas) emission rates in Table 7-8. Because add-on PM controls have not been applied to CTs, the control efficiencies evaluated are considered conservative. With cost-effectiveness values ranging between $109,000 and $193,000 per ton of PM2.5 removed, add-on controls are considered cost-prohibitive for the PHPP.
Table 7-9: Cost Analysis for Add-on PM Control Technologies
Wet ESP Dry ESP Baghouse (pulse-jet cleaned)
Wet Scrubber (Venturi)
Flowrate (ft3/min) 946,777 946,777 946,777 946,777 Capital Costs ($/scfm) $20 $10 $6 $3 Capital Costs ($) $18,935,540 $9,467,770 $5,680,662 $2,366,942.50 Cost Recovery Factor 0.11 0.11 0.11 0.11 Annualized Capital Costs ($/yr) $2,082,909 $1,041,454.70 $624,872.82 $260,363.68 O & M Costs ($/scfm) $5 $3 $5 $4.40 O & M Costs ($/yr) $4,733,885 $2,840,331 $4,733,885 $4,165,819 Total Annualized Costs ($/yr) $6,816,794 $3,881,786 $5,358,758 $4,426,182 Removal Efficiency 99.1% 99% 99% 90% Tons of PM2.5 Removed (TPY) 35.38 35.34 35.34 32.13 Cost Effectiveness ($/ton removed) $192,680 $109,830 $151,620 $137,760 Step 5 – Select BACT After eliminating wet ESP, dry ESP, fabric filter, and wet scrubber due to economic impacts, we
Palmdale (SE 09-01) Fact Sheet/Ambient Air Quality Impact Report August 2011
27
have determined that BACT is clean fuel, good combustion practices, a PM, PM10, and PM2.5 limit of 0.0027 lb/MMBtu without duct burning and a limit of 0.0035 lb/MMBtu with duct burning based on a 3-hr average. Additionally, we are setting mass emission limits of 4.7 lb/hr without duct firing and 8.0 lb/hr with duct firing based on a 3-hr average. By “clean fuel” we mean Public Utilities Commission (PUC)-quality natural gas. PUC-quality pipeline natural gas shall not exceed a sulfur content of 0.20 grains per 100 dry standard cubic feet on a 12-month rolling average and shall not exceed a sulfur content of 1.0 grains per 100 dry standard cubic feet, at any time. This limit is lower than the limit proposed by the applicant. However, when comparing the applicant’s proposed emission rates to other recently permitted sources, the applicant’s values are in some cases twice as high. The applicant relied solely on the Victorville II facility in California in proposing emission rates. While the two facilities are very similar, a BACT analysis should be more comprehensive in evaluating proposed limits. A broader review of recent BACT determinations demonstrates that BACT is lower than the limits proposed by the applicant.
7.1.4 GHG Emissions Step 1 – Identify all control technologies The inherently lower-emitting control options for GHG emissions include28:
• Use of new thermally efficient combined cycle gas turbines – A combined-cycle gas turbine recovers the waste heat from the gas turbine using a heat recovery steam generator (HRSG). The use of the HRSG allows more energy to be produced without additional fuel use.
The add-on control options for GHG emissions include: • Carbon capture and sequestration (CCS) – CCS is a technology that involves capture and
storage of CO2 emissions to prevent their release to the atmosphere. For a gas turbine, this includes removal of CO2 emissions from the exhaust stream, transportation of the CO2 to an injection site, and injection of the CO2 into available sequestration sites. Potential CO2 sequestration sites include geological formations (including oil and gas fields for enhanced recovery) and ocean storage.
Step 2 – Eliminate technically infeasible control technologies CCS As described briefly above, CCS involves three main components: capturing the CO2 emissions from the exhaust stream, transporting the captured CO2 to the sequestration site, and injection of the CO2 into a geologic reservoir for long-term sequestration. All three of these aspects are relevant when determining whether CCS is technically feasible for a particular project.
28 In addition to the measures discussed here specifically for the gas turbines, we note that the project design includes 50 MW of potential solar thermal power generation, which represents an inherently lower-emitting technology for the facility as a whole.
Palmdale (SE 09-01) Fact Sheet/Ambient Air Quality Impact Report August 2011
28
The applicant proposed to eliminate CCS because CO2 capture is not technically feasible for CTs. The applicant identified three potential processes for capturing CO2 from flue gas: solvent-based processes, sorbent-based processes, and membrane-based processes. The applicant concluded that these processes were not technically feasible due to limited experience in the energy industry and lack of commercial demonstrations. However, commercial CO2 recovery plants have been in existence since the late 1970s, with at least one plant capturing CO2 from gas turbines.29,30 The applicant also identified as a hurdle that commercial demonstrations have only captured a fraction of the CO2 in flue gas. This consideration appears to be less of a technical feasibility issue than one of cost, which would be more appropriately addressed in Step 4 of the BACT analysis. Based on available information, we consider carbon capture from gas turbines to be technically feasible for the Project. In its application, the applicant identified several geological formations in the lower San Joaquin Valley and Ventura County that could potentially provide a suitable site for geologic sequestration; a map of those sites provided in the Project application is provided in Figure 7-1. While geotechnical analyses have not been conducted to verify the suitability of these sites, other proposals have been made to capture and sequester CO2 emissions in the San Joaquin Valley; as a result, there is a reasonable presumption that suitable sequestration sites do exist in these areas despite the lack of extensive studies prepared for this Project. Nevertheless, the primary issue with the feasibility of CCS in this case lies with the location of the PHPP in relation to the sequestration sites and the surrounding geography. As shown in the figure above, significant mountain ranges lie between the project location and the potential sequestration sites (oil fields, gas fields, and ocean storage). Sequestration of CO2 emissions from the Project would require construction of CO2 pipelines through these mountains. The offsite logistical barriers of constructing such a pipeline (e.g., land acquisition, permitting, liability, etc.) make this technology technically infeasible for the Project. Because constructing a new CO2 pipeline was determined to be technically infeasible, the applicant also evaluated whether CO2 pipelines were already available near the proposed Project. The Technical Advisory Committee for the California Carbon Capture and Storage Review Panel stated in an August 2010 report that there are no existing CO2 pipelines in California.31 In addition, based on a search of the California Environmental Quality Act (CEQA) State Clearinghouse database maintained by the California Office of Planning and Research, there are no CO2 pipeline projects underway in California subject to CEQA. Last, the applicant also contacted the Department of Oil, Gas and Geothermal Resources and facilities operating in Kern County, and again, found no existing pipelines in California. 29 Herzog, H.J., “An Introduction to CO2 Separation and Capture Technologies,” Energy Laboratory Working Paper, (1999). Available at http://sequestration.mit.edu/pdf/introduction_to_capture.pdf. 30 Johnson, D., Reddy, S., & Brown, J.H. (2009), Commercially Available CO2 Capture Technology. Power. Retrieved from http://www.powermag.com/coal/2064.html. 31 This information is available at http://climatechange.ca.gov/carbon_capture_review_panel/meetings/2010-08-18/white_papers/Carbon_Dioxide_Pipelines.pdf.

Palmdale (SE 09-01) Fact Sheet/Ambient Air Quality Impact Report August 2011
29
Figure 7-1 Potential CO2 Sequestration Sites in Southern California
Data source: National Energy Technology Laboratory, Department of Energy. 2010 Carbon
Sequestration Atlas of the United States and Canada, Third Edition
In sum, while we have determined that CO2 capture and storage is technically feasible, we conclude that transport of the captured CO2 to the potential sequestration sites is not feasible. As a result, CCS is not technically feasible for the Project and will not be considered further in the BACT analysis. We note that evaluation of long-term CO2 storage is an important part of the

Palmdale (SE 09-01) Fact Sheet/Ambient Air Quality Impact Report August 2011
30
technical feasibility analysis. However, because transport of CO2 is not technically feasible, it is not necessary to evaluate the feasibility of CO2 storage. Step 3 – Rank remaining control technologies After elimination of CCS as a potential control technology, the use of a thermally efficient combined-cycle gas turbine and a combined-cycle facility are the only control methods remaining. The expected emissions from a facility with these control options is compared with the emissions from a simple-cycle gas turbine in Table 7-10. Currently, the only other similar facility with a GHG BACT limit is the Russell City Energy Center, to be located in Hayward, California. The PSD permit for this facility has a voluntary GHG limit of a heat rate not to exceed 7,730 Btu/kWh for each CT and HRSG.
Table 7-10: GHG Control Technologies Ranked by Control Effectiveness
GHG Control Technologies Emission Rate (lb CO2/MWh)
New combined-cycle gas CT 774 Existing combined-cycle CTs32 824-996 Simple-cycle CTs33 1,319
Step 4 – Economic, Energy, and Environmental Impacts The applicant has chosen the highest ranked control option for each unit, and we are not aware of any significant or unusual adverse environmental impacts associated with the chosen technology. Step 5 – Select BACT Based on a review of the available control technologies for GHG emissions from natural gas-fired combustion turbines, we have concluded that BACT for this source is the use of new thermally efficient CTs and emission limits of 774 lb CO2/MWh for source-wide net output, and 117 lb CO2/MMBtu heat input for each gas turbine and duct burner (both based on a 30-day rolling average). The emission limits are based on the emission factor provided by the applicant of 53.06 kg/MMBtu, the 1,736 MMBtu/hr heat input of each CT operating 8,760 hours per year, and the 550 MMBtu/hr duct burner for each CT operating 2,000 hours per year. A number of issues regarding these limits bear clarification. First, the pollutant that is subject to regulation under the Clean Air Act for PSD permitting purposes is a group of six gases: carbon dioxide, methane, nitrous oxide, hydrofluorocarbons, perfluorocarbons, and sulfur hexafluoride. As a general matter, it may thus be appropriate to establish BACT limits on a CO2e basis. In this case, however, we have elected to establish the BACT limit for CO2 specifically. The purpose of this is to enable the use of CO2 CEMS for monitoring purposes. Because the CEMS are required for other regulatory purposes, they offer a cost-effective and reliable method for monitoring
32 These figures are based on GHG performance information provided by the applicant in Tables 3 and 4 to the PHPP GHG BACT Analysis dated May 2011. These values are derived from 2008 data from the California Energy Commission for similar facilities with energy output of at least 3,000 GWh per year. 33 These numbers are based on the proposed CTs operating in simple cycle with a gross output of 154 MW each.

Palmdale (SE 09-01) Fact Sheet/Ambient Air Quality Impact Report August 2011
31
compliance. Using CO2 as a surrogate for the total emissions on a CO2e basis is appropriate in this case because nitrous oxide and methane are emitted from CTs in minor amounts and the majority of the GHG emissions actually are CO2. For example, EPA’s emission factors for CO2, methane, and nitrous oxide from the combustion of natural gas are 53.06 kg/MMBtu, 0.0059 kg/MMBtu, and 0.0001 kg/MMBtu, respectively. The emission factor for all GHGs on a CO2e basis is 53.21 kg/MMBtu. Thus, even after accounting for the global warming potential of methane and nitrous oxide, the CO2 emission factor accounts for 99.7% of the emission on a CO2e basis. Further, an emission limitation that limits CO2 emissions from the combustion of natural gas inherently limits the emission of methane and nitrous oxide. As a result, we believe that for this particular source, formulating the emission limits and monitoring requirements in terms of CO2 rather than on a CO2e basis is appropriate. The applicant has proposed a BACT limit of 1,020,000 tons of CO2 per year for each CT. However, a limit based on the amount of CO2 generated per MWh will ensure that the CTs are operating at peak efficiency. An input-based limit is also necessary to ensure peak operating efficiency of the gas turbine because the solar thermal operation will at times contribute to the electric output.
7.1.5 BACT During Startup and Shutdown It is not technically feasible to use SCR and oxidation catalyst to control NOX and CO emissions when the equipment is outside of the manufacturer’s recommended operating temperature ranges. For SCR and oxidation catalyst this occurs during turbine startup or shutdown. Therefore, BACT is achieved by minimizing the time for startup and shutdown. The PHPP will have a 110 MMBtu/hr auxiliary boiler that will be used to reduce the startup time for each turbine. The applicant has proposed the following NOX and CO emission rate limits for each event:
• Hot/Warm Startup: 40 pounds of NOX and 329 pounds of CO per turbine • Cold Startup: 96 pounds of NOX and 410 pounds of CO per turbine • Shutdown: 57 pounds of NOX and 337 pounds of CO per turbine
An evaluation of startup and shutdown emission limits for other similar sources found a wide range of limits. In many cases, limits are based on pounds per hour or pound per event,34 and this approach makes it difficult to compare BACT determinations because mass emission rates vary based on the size of the unit. Other facilities have longer averaging periods (24-hr), which may incorporate startup and shutdown emissions. Because the PHPP has short 1-hour averaging periods, it is appropriate to set limits on a mass basis and limit the duration of startup and shutdown events. Based on the available information, the emission rate limits and fast startup and shutdown times for the CTs represent BACT for NOx and CO during startup and shutdown. Therefore, we have determined that BACT during startup and shutdown for NOX and CO for the PHPP is as described below in Table 7-11.
34 Recently issued permits with these types of limits include the permits for the Avenal Energy Project in California, the Russell City Energy Project in California, the Victorville II Hybrid Power Project in California, and the Colusa Generating Station in California.

Palmdale (SE 09-01) Fact Sheet/Ambient Air Quality Impact Report August 2011
32
In addition, we have determined that the startup duration limits also constitute BACT for GHG emissions, because the shorter startup time increases the overall thermal efficiency of the facility. Therefore, BACT for the PHPP’s GHG emissions during startup is 110 minutes for a cold startup and 80 minutes for a warm/hot startup.
Table 7-11: Summary of NOX and CO BACT Limits During Startup and Shutdown
NOX CO Duration
Cold Startup 96 lb/event 410 lb/event
110 minutes 52.4 lb/hr 224 lb/hr
Warm/Hot Startup 40 lb/event 329 lb/event
80 minutes 30 lb/hr 247 lb/hr
Shutdown 57 lb/event 337 lb/event
30 minutes 114 lb/hr 334.6 lb/hr
7.2. BACT for Auxiliary Boiler and Heater The applicant is proposing to construct a 110 MMBtu/hr boiler that will be used to start up the CTs, and a 40 MMBtu/hr heat transfer fluid (HTF) heater as part of the solar array system. Both units will be fired with natural gas. The boiler will be limited to 500 hours of operation per year and the HTF heater will be limited to 1,000 hours of operation per year. The low hours of operation and low emission rates proposed result in very low tons per year emission rates for each unit. The boiler and HTF heater are subject to BACT for NOX, CO, PM, PM10, PM2.5, and GHGs. A top-down BACT analysis for each pollutant has been performed and is summarized below.
7.2.1 Nitrogen Oxide Emissions Step 1 - Identify All Control Options The following inherently lower-emitting control options for NOX emissions include:
• Low NOX burner design (e.g. low NOX burners, flue gas recirculation) • Limited use of equipment (limits on the hours of operation)
The available add-on NOX control technologies include:
• Selective Catalytic Reduction (SCR) system • EMxTM system (formerly SCONOx) • Selective non-catalytic reduction (SNCR)
Step 2 – Eliminate Technically Infeasible Options SCR, EMxTM, and SNCR are considered technically infeasible control options. The applicant estimated the exhaust temperature for each unit at 300°F. This is below the temperature operating range for SCR, EMxTM, and SNCR, which are all generally above 400°F.

Palmdale (SE 09-01) Fact Sheet/Ambient Air Quality Impact Report August 2011
33
Step 3 – Rank remaining control technologies The applicant proposed a NOX emission limit of 9 ppm at 3% O2 based on a 3-hr average using ultra-low NOX burner design. With the proposed low NOX burner designs and limited hours of operation the auxiliary boiler will emit up to 0.30 TPY of NOX and the heater will emit up to 0.22 TPY. A review of other BACT determinations was not performed because it is very unlikely that a more detailed review would change the final determination due to the limited use and low ton per year emission rates associated with the proposed limits.
Table 7-12: .NOX Control Technologies Ranked by Control Effectiveness
NOX Control Technologies Emission Rate (ppmvd @ 3% O2)
Low NOX burners and limited use 9 Step 4 – Economic, Energy, and Environmental Impacts The applicant has chosen the highest ranked control option for each unit, and we are not aware of any significant or unusual environmental impacts associated with the chosen technology. Step 5 – Select BACT Based on the review of the available control technologies, we have concluded BACT is the limited hours of operation, ultra-low NOX burners and an emission rate of 9.0 ppm at 3% O2 based on a 3-hr test average.
7.2.2 Carbon Monoxide Emissions Step 1 – Identify All Control Technologies The following inherently lower-emitting control options for CO emissions include:
• Good combustion practices • Limited use (limits on the hours of operation)
The available add-on CO control technologies include:
• Oxidation catalyst • EMxTM (formerly SCONOX)
Step 2 – Eliminate Technically Infeasible Oxidation catalyst and EMxTM are considered technically infeasible control options. The applicant estimated the exhaust temperature for each unit at 300F. This is below the temperature operating range for oxidation catalyst and EMxTM, which are generally above 400F. Step 3 – Rank Remaining Control Technologies The applicant proposed a CO limit of 50 ppm at 3% O2 based on a 3-hr average using good combustion practices. With the proposed good combustion practices and limited hours of operation, the auxiliary boiler will emit up to 1.01 TPY, and the heater will emit up to 0.74 TPY, of CO. A review of other BACT determinations was not performed because it is very unlikely

Palmdale (SE 09-01) Fact Sheet/Ambient Air Quality Impact Report August 2011
34
that a more detailed review would change the final determination due to the limited use and low ton per year emission rates associated with the proposed limits.
Table 7-13: CO Control Technologies Ranked by Control Effectiveness
CO Control Technologies Emission Rate (ppmvd @ 3% O2)
Good combustion practices and limited use
50
Step 4 – Economic, Energy and Environmental Impacts The applicant has chosen the highest ranked control option for each unit, and we are not aware of any significant or unusual adverse environmental impacts associated with the chosen technology. Step 5 – Select BACT Based on the review of the available control technologies, we have concluded that BACT is the limited hours of operation, good combustion practices and an emission rate of 50.0 ppm at 3% O2
based on a 3-hr test average.
7.2.3 PM, PM10 and PM2.5 Emissions The applicant has assumed that all particulate emissions from the auxiliary boiler and process heater are PM2.5. As a result, the BACT analyses for PM, PM10 and PM2.5 have been combined. Additionally, the analysis evaluates total particulate matter – filterable and condensable. Step 1 – Identify All Control Technologies The following inherently lower-emitting control options for PM, PM10, and PM2.5 emissions include:
• Low particulate fuels, low sulfur fuels, and/or pipeline natural gas (also referred to as “clean fuel”)
• Good combustion practices (including air inlet filter) • Limited use (limits on the hours of operation)
The available add-on PM, PM10, PM2.5 control technologies include:
• Cyclones (including multiclones) • Wet scrubber • Dry electrostatic precipitator (ESP) • Wet ESP • Baghouse/fabric filter.
Step 2 – Eliminate Technically Infeasible Control Options

Palmdale (SE 09-01) Fact Sheet/Ambient Air Quality Impact Report August 2011
35
All of the control technologies identified are technically feasible except for cyclones (including multiclones). As evaluated for the CTs, the low grain loading associated with natural gas emissions makes cyclones technically infeasible for this application. Step 3 – Rank Remaining Control Technologies We were not able to identify any CT using add-on PM controls; however, they are considered technically feasible and are therefore being further evaluated. The available control technologies are ranked according to control effectiveness in Table 7-14. This analysis is based on the PM, PM10, and PM2.5 analysis for the CTs. With the proposed good combustion practices and limited hours of operation, the auxiliary boiler will emit up to 0.25 TPY of PM, PM10, and PM2.5 and the heater will emit up to 0.15 TPY. A review of other BACT determinations was not performed because it is very unlikely that a more detailed review would change the final determination due to the limited use and low ton per year emission rates associated with the proposed limits.
Table 7-14: PM Control Technologies Ranked by Control Effectiveness
PM Control Technologies Control Efficiency
Wet ESP 99.1% Dry ESP/baghouse 99% Wet Scrubber (Venturi) 90% Clean fuel, good combustion practices, and limited use 0% (baseline)
Step 4 – Economic, Energy and Environmental Impacts The applicant eliminated the use of add-on PM controls for each unit because of the associated economic impacts. The 110 MMBtu/hr auxiliary boiler is limited to 500 hours of operation per year and has a potential to emit 0.2 TPY of PM, PM10, and PM2.5. The 40 MMBtu/hr heater is limited to 1,000 hours of operation per year and has a potential to emit 0.15 TPY of PM, PM10, and PM2.5. Due to the limited hours of operation and limited environmental benefit it would be impractical to require add-on controls to remove less than 0.45 TPY of PM, PM10, and PM2.5. However, the applicant also provided an economic analysis for add-on controls, which is provided in Tables 7-15 and 7-16.

Palmdale (SE 09-01) Fact Sheet/Ambient Air Quality Impact Report August 2011
36
Table 7-15: Cost Analysis for Add-on PM Control Technologies for the Auxiliary Boiler
Control Device Wet ESP Dry ESP Pulse Jet Fabric Filter
Wet Scrubber
Flowrate (scfm) 28416 28416 28416 28416 Capital Costs ($/scfm) $20 $10 $6 $3 Capital Costs ($) $568,320 $284,160 $170,496 $71,040.00 Cost Recovery Factor 0.11 0.11 0.11 0.11 Annualized Capital Costs ($/yr) $62,515 $31,257.60 $18,754.56 $7,814.40 O & M Costs ($/scfm) $5 $3 $5 $4.40 O & M Costs ($/yr) $142,080 $85,248 $142,080 $125,030 Total Annualized Costs ($/yr) $204,595 $116,506 $160,835 $132,845 Removal Efficiency 99.1% 99% 99% 90% Tons of PM2.5 Removed (TPY) 0.20 0.20 0.20 0.18 Cost Effectiveness ($/ton removed) $1,032,300 $588,400 $812,300 $738,000
Table 7-16: Cost Analysis for Add-on PM Control Technologies for the HTF Heater
Control Device Wet ESP Dry ESP Baghouse (pulse- jet cleaned)
Wet Scrubber
Flowrate (scfm) 10612 10612 10612 10612 Capital Costs ($/scfm) $20 $10 $6 $3 Capital Costs ($) $212,240 $106,120 $63,672 $26,530.00 Cost Recovery Factor 0.11 0.11 0.11 0.11 Annualized Capital Costs ($/yr) $23,346 $11,673.20 $7,003.92 $2,918.30 O & M Costs ($/scfm) $5 $3 $5 $4.40 O & M Costs ($/yr) $53,060 $31,836 $53,060 $46,693 Total Annualized Costs ($/yr) $76,406 $43,509 $60,064 $49,611 Removal Efficiency 99.1% 99% 99% 90% Tons of PM2.5 Removed (TPY) 0.15 0.15 0.15 0.14 Cost Effectiveness ($/ton removed) $514,000 $293,000 $404,500 $367,500
Step 5 – Select BACT Based on the review of the available control technologies, we have concluded BACT is the limited hours of operation, good combustion practices, and clean fuel. By “clean fuel” we mean Public Utilities Commission (PUC)-quality natural gas. PUC-quality pipeline natural gas shall not exceed a sulfur content of 0.20 grains per 100 dry standard cubic feet on a 12-month rolling average and shall not exceed a sulfur content of 1.0 grains per 100 dry standard cubic feet, at any time.

Palmdale (SE 09-01) Fact Sheet/Ambient Air Quality Impact Report August 2011
37
Additionally, based on the PTE for each unit, we are setting a PM, PM10, and PM2.5 limit of 0.8 lb/hr for the boiler and 0.3 lb/hr for the HTF heater based on a 3-hr average.
7.2.4 GHG Emissions Step 1 – Identify all control technologies The applicant generally assumed that the auxiliary boiler and HTF heater would incorporate the newest designs that increase thermal efficiency, such as new burner technologies and modern optimized instrumentation and controls. The inherently lower-emitting control options for GHG emissions include:
• Conducting an annual boiler tune-up – this would ensure that optimal thermal efficiency is maintained. Maintaining higher thermal efficiency reduces the amount of fuel combusted, which helps to minimize GHG emissions.
The add-on control options for GHG emissions include: • CCS – CCS is a technology that involves capture and storage of CO2 emissions to prevent
their release to the atmosphere. For a gas turbine, this includes removal of CO2 emissions from the exhaust stream, transportation of the CO2 to an injection site, and injection of the CO2 into available sequestration sites. Potential CO2 sequestration sites include geological formations (including oil and gas fields for enhanced recovery) and ocean storage.
Step 2 – Eliminate technically infeasible control technologies CCS The GHG BACT analysis for the CTs, discussed above, concluded that although CO2 capture and storage is technically feasible, transport of the captured CO2 to the potential sequestration sites is not technically feasible. Using this same analysis, CCS is also not technically feasible for the auxiliary boiler and HTF heater and will not be considered further in the BACT analysis. Step 3 – Rank remaining control technologies After elimination of CCS as a potential control technology, the purchase of thermally efficient units and annual boiler tune-ups are the remaining technologies. Both of these options will be required. Step 4 – Economic, Energy, and Environmental Impacts The applicant has chosen the highest ranked control option for each unit, and we are not aware of any significant or unusual adverse environmental impacts associated with the chosen technology.

Palmdale (SE 09-01) Fact Sheet/Ambient Air Quality Impact Report August 2011
38
Step 5 – Select BACT Based on a review of the available control technologies for GHG emissions from natural gas-fired boilers and process heaters, we have concluded that BACT for this source is the purchase of thermally efficient units, conducting annual boiler tune-ups on each unit, limiting the auxiliary boiler to a heat input of 110 MMBtu/hr and 500 hours of operation per year based on a 12-month rolling total, and limiting the HTF heater to 40 MMBtu/hr and 1,000 hours of operation per year based on 12-month rolling total. Currently, there are no other facilities with GHG BACT limits for limited use natural gas-fired boilers and process heaters.
7.3 BACT for Emergency Internal Combustion Engines The project includes a 2,862 HP (2134 kW) diesel-fired emergency generator and a 182 HP (138kW) diesel-fired emergency fire pump engine. Each engine will be limited to 50 hours of operation each year. The low hours of operation result in very low tons per year emission rates for each unit. This equipment is subject to BACT for NOX, CO, PM, PM10, PM2.5, and GHGs. A top-down BACT analysis has been performed and is summarized below.
7.3.1 NOX, CO, PM, PM10, PM2.5, and GHG Emissions Step 1 -- Identify all control technologies The control options for NOX emissions from engines include SCR, NOX reducing catalyst, NOX adsorber, catalyzed diesel particulate filter, catalytic converter, and oxidation catalyst.35 A catalytic converter and oxidation catalyst are also control options for CO emissions. For PM, PM10, and PM2.5 emissions, a diesel particulate filter/trap can be added on. Unlike other combustion equipment (e.g., CTs and boilers), new engines are required to be certified in compliance with NSPS requirements, including emission limits, upon purchase. Different types of engines have different emission requirements based on the type of engine being purchased (emergency engine, emergency fire pump engine, or non-emergency engine). Engine manufacturers may need to employ some of the control technologies identified above in order to comply with the NSPS emission limits, depending on the type of engine and the applicable limits. The applicant is proposing to construct an emergency engine and an emergency fire pump engine. As a result, to comply with NSPS the applicant must purchase engines that meet the emission requirements for emergency engines and emergency fire pump engines. However, we note that the applicant could purchase engines that meet the NSPS standards for non-emergency engines, which have more stringent limits, and operate them as emergency engines. In addition, the applicant must comply with California Air Resources Board (CARB) emission standards (Tier 2 standards for the emergency generator and Tier 3 standards for the emergency fire pump engine); however, the CARB standards are the same as the applicable NSPS requirements. As a result, this review identifies the control technologies to be:
35 The applicant discusses these control options in Section 8.4 of the “Supplemental Information for the Application for PSD Permit” dated July 21, 2010.

Palmdale (SE 09-01) Fact Sheet/Ambient Air Quality Impact Report August 2011
39
• NSPS-compliant emergency engine and NSPS-compliant emergency fire pump engine • Engines that meets NSPS for non-emergency engines • Limiting use (limits on the hours of operation)
Step 2 – Eliminate technically infeasible control options All of the control technologies identified are assumed to be technically feasible. Step 3 – Rank remaining control technologies The available control technologies are ranked according to control effectiveness in Table 7-17.36
Table 7-17: Emergency Engine Control Technologies Ranked by Control Effectiveness
Engine Type NMHC+NOX (g/kW-hr)
PM (g/kW-hr)
CO (g/kW-hr)
NSPS-Non-emergency (for 135 kW) 0.0237 0.59 5.0
NSPS-Non-emergency (for 2000 kW) 1.0738 0.10 3.5
NSPS-Fire Pump Engines (for 135 kW) 4.0 0.20 3.5
NSPS-Emergency (for 2000 kW) 6.4 0.20 3.5
Step 4 – Economic, energy and environmental impacts Due to economic impacts and limited environmental benefit, the applicant eliminated add-on controls for the engines. We agree that the top-ranked control technology (purchasing engines that meet NSPS standards for non-emergency engines and operating them as emergency engines) would be impractical in this case. This is illustrated in Table 7-18 by the potential emissions from these units (based on 50 hours of operation per year and complying with the NSPS for emergency engines and emergency fire pump engines). Requiring the additional reductions in emissions that would be gained by use of engines that meet NSPS standards for non-emergency engines would have very little environmental benefit, which would not justify the cost. While the potential CO2e emissions associated with this equipment are higher than those of the other pollutants, they still represent less than 0.01% of source-wide CO2e emissions. A review of other BACT determinations was not performed because it is very unlikely that a more detailed review would change the final determination due to the limited use and low ton per year emission rates associated with the proposed limits.
36 CARB-compliant engines are not listed in the rankings because the emission limitations are the same as for NSPS-compliant engines. 37 The actual applicable NSPS limits are 0.40 g/kW-hr for NOX and 0.19 g/kW-hr for NMHC. The tow limits were added together in order to compare them to the other types of engines 38 The actual applicable NSPS limits are 0.67 g/kW-hr for NOX and 0.40 g/kW-hr for NMHC. The two limits were added together in order to compare them to the other types of engines.

Palmdale (SE 09-01) Fact Sheet/Ambient Air Quality Impact Report August 2011
40
Table 7-18: Summary of Potential to Emit for Emergency Engines
Pollutant Emergency Generator
(TPY)
Emergency Fire Pump Engine
(TPY) NOX 0.67 0.03 CO 0.39 0.03 PM, PM10, PM2.5 0.02 <0.01 CO2e 27.6 4.41
Step 5 – Select BACT Based on the review of the available control technologies, we have concluded that BACT is the limited hours of operation and the emission limits listed in Table 7-19 based on a 3-hour average.39 The NSPS for engines does not currently regulate GHG emissions, but a separate GHG limit is not being proposed. It is assumed that newly purchased engines would be the most energy efficient available and that operating in compliance with NSPS requirements will ensure that each engine is properly maintained and as efficient as possible.
Table 7-19: Summary of BACT Emission Limits for Emergency Engines
Engine NMHC+NOX (g/kW-hr)
PM (g/kW-hr)
CO (g/kW-hr)
135 kW Emergency Fire Pump Engine 4.0 0.20 3.5
2000 kW Emergency Engine 6.4 0.20 3.5
7.4 BACT for Cooling Tower The PHPP includes a 130,000 gallons per minute (gpm), ten-cell evaporative (wet) cooling tower. Fugitive particulate emissions are generated from the cooling tower due to the total dissolved solids (TDS) in the water. The cooling tower is subject to BACT for PM, PM10, and PM2.5. A top-down BACT analysis has been performed and is summarized below. The applicant conservatively assumed PM, PM10 and PM2.5 emissions from the cooling tower were equivalent. Step 1 – Available Control Technologies The following inherently lower-emitting control options for PM, PM10, and PM2.5 emissions include:
• Dry cooling - uses an air cooled condenser (ACC) that cools the steam turbine-generators’ exhaust steam using a large array of fans that force air over finned tube heat exchangers. The exhaust from the steam turbine flows through a large diameter duct to the ACC where it is condensed inside the tubes through indirect contact with the ambient air. The heat is then released directly to the atmosphere.
39 These limits are the same as the applicable CARB Tier 2 and Tier 3 standards.

Palmdale (SE 09-01) Fact Sheet/Ambient Air Quality Impact Report August 2011
41
• Wet-dry hybrid cooling – uses wet and dry cooling technologies in parallel, and uses all of the equipment involved in both wet and dry cooling. Hybrid cooling technology divides the cooling function between the wet and dry systems depending on the capabilities of each system under different environmental and operational conditions.
The available add-on PM, PM10, and PM2.5 control technologies include:
• Drift eliminators Step 2 – Eliminate Technically Infeasible All of the available control options identified in Step 1 are technically feasible. Step 3 – Rank Remaining Control Technologies The types of cooling towers are ranked according to control effectiveness in Table 7-20.
Table 7-20: Cooling Tower Control Technologies Ranked by Control Effectiveness
Control Technologies Emission Rate
(TPY of PM/PM10/PM2.5)
Dry cooling 0 Wet-dry hybrid cooling 3.640 Wet cooling with 0.0005% drift eliminators
7.1
Step 4 – Economic, Energy and Environmental Impacts The applicant eliminated the use of both a dry cooling system and wet-dry hybrid cooling system due to the associated economic and environmental impacts. The use of a dry or hybrid wet-dry system would reduce the overall efficiency of the facility, due to the additional energy requirements for the wet and hybrid systems. The applicant also conducted an economic analysis comparing the annual operation costs of wet and dry cooling systems. The applicant’s analysis is reproduced in Table 7-21.
Table 7-21: Wet and Dry Cooling Tower Cost Analysis Provided by the Applicant
Wet Cooling Tower
Dry Cooling Tower
Required Power Fan Power(e) 1,700 kW 6,350 kW Circulating Pump Power 2,400 kW 0 kW
40 The applicant did not estimate potential emissions from a wet-dry hybrid system. We have approximated emissions from such a system to be one-half of those from a wet cooling system.

Palmdale (SE 09-01) Fact Sheet/Ambient Air Quality Impact Report August 2011
42
Wet Cooling Tower
Dry Cooling Tower
Power Loss Due to High Steam Turbine Backpressure 0 kW 536 kW Water Treatment Power Consumption (Zero Liquid Discharge) 850 kW <200 kW Total Net Power Loss Effect 12,798 kW 14,042 kW Costs Direct Capital Cost $26,000,000 $59,000,000(e) Water Pipeline Installation(f) ~$1,400,000 $0 Annualized Cost Capital Recovery(a) $1,940,000 $3,680,000 Equivalent Electrical Power Cost(b) $16,816,500 $18,451,000 Treatment Chemical Addition(c) $250,000 $0 Makeup Cooling Water(d) $824,200 ~$100,000 Total $/year $19,830,700 $22,231,000 Notes: a) Assumes a 30-year lifetime with a 5.75% interest rate. b) Assumes the facility operates 8,760 hour/yr and a power cost of $0.15/kWh. c) Assumes that water treatment chemicals would be needed in a wet tower to prevent corrosion, bio-fouling, etc., but would not be needed for an ACC. d) Estimated at $200/acre-foot and consumption of 4,121 acre-feet per year for wet cooling. e) Does not include additional costs required for a steam turbine that can be operated at high back pressure. f) Only includes the less than 2 miles of pipeline needed to connect to the regional backbone system. Dry cooling costs are underestimated since some water is needed even in a dry-cooled plant, which would still require a pipeline.
The cost effectiveness of using a dry cooling process to reduce 7.1 TPY of PM, PM10, and PM2.5 is $338,000 per ton. The applicant estimated a hybrid cooling system would have direct capital costs of $67 million and, as a result, would be even less cost-effective than a dry cooling system. Based on this information, we agree that using dry or hybrid cooling systems in this case would not be cost-effective and would contribute to a decrease in the overall energy efficiency of the facility. Considering collateral environmental impacts, the use of wet cooling has a potential impact associated with additional consumption of water resources. However, the water being used for the cooling tower is from the Palmdale Water Reclamation Plant and therefore wet cooling is not expected to result in any significant adverse impact on water resources in the area. Step 5 – Select BACT The applicant proposed using a wet cooling tower with 0.0005% drift eliminators as BACT for

Palmdale (SE 09-01) Fact Sheet/Ambient Air Quality Impact Report August 2011
43
the steam turbine cooling system. A comparison of the drift elimination rates for other recently permitted cooling towers is provided in Table 7-22. Based on the available information, we have determined that BACT for the cooling towers is 0.0005% drift eliminators. Additionally, we are setting a mass emission limit of 1.6 lb/hr and TDS limit of 5000 ppm.
Table 7-22: Summary of Recent BACT Determinations for Drift Eliminators
Facility Location Limit Permit Issuance Source
J.K. Smith Generating Station Kentucky 0.0005% April 2010 RBLC # KY-0100
Chocolate Bayou Facility Texas 0.0020% June 2009 RBLC # TX-0549
CPV St Charles Maryland 0.0005% November 2008 RBLC # MD-0040
John W Turk Jr Power Plant Arkansas 0.0005% November
2008 RBLC # AR-0094
7.5 BACT for Fugitive Road Dust Fugitive dust emissions will occur as a result of maintenance vehicle travel on paved and unpaved roadways in the solar field associated with the PHPP. Fugitive road dust is subject to BACT for PM, PM10, and PM2.5. A top-down BACT analysis has been performed and is summarized below. Step 1 – Available Control Technologies The control technologies for fugitive roadway dusts include: paved roads, gravel roads, chemical surfactants (also called “dust suppressants”), watering, and traffic speed controls. Step 2 – Eliminate Technically Infeasible All of the control technologies identified are technically feasible. Step 3 – Rank Remaining Control Technologies The available control options are ranked as follows:
• Paved roads • Gravel roads • Chemical surfactants, watering and traffic speed controls can result in various controls
efficiencies depending on how each technology is employed (e.g., rate of application, specific speed limit)
Step 4 – Economic, Energy and Environmental Impacts Paved roads – The applicant proposed to pave only the main access road to the plant because paving other less traveled roads would only have minimal environmental benefits. The applicant

Palmdale (SE 09-01) Fact Sheet/Ambient Air Quality Impact Report August 2011
44
noted that paving increases the amount of impervious surfaces, which increases storm water runoff, and that the infrequent rainstorms in the desert can also erode the dirt out from under the paved edges. Gravel roads - The applicant eliminated gravel roads due to the potential for rocks to become airborne and damage the parabolic mirrors in the solar field. This would result in additional costs for repairing mirrors and a reduction in solar energy production. Chemical surfactants, watering, and traffic speed controls - Surface watering and/or application of surfactants can be supplemented with limiting vehicle speed and restricting traffic in the unpaved areas. According to the applicant, experience in existing solar fields (e.g., the Solar Energy Generating Systems (SEGS) facility near Kramer Junction and Harper Lake) shows that use of a combination of the above methods is very effective in controlling fugitive dust. Use of soil stabilizers during the first few years of operation of the solar facility, followed by application of water and driving slowly in the solar field, leads to a very stable surface that yields only minor amounts of fugitive emissions. In addition, after the solar facility is built, it is in the operator’s best interest to keep dust emissions to a minimum in order to reduce the amount of mirror washing and loss of efficiency from dirty mirrors. Step 5 – Select BACT The applicant proposed BACT for fugitive road dust as:
• Paving the main access road into the plant site • Developing a dust control plan that includes inspection and maintenance procedures
undertaken to ensure that the unpaved roads remain stabilized • A durable non-toxic soil stabilizer will be applied through the solar field for dust control.
Additionally, unpaved roads within the solar field used by wash trucks that spray and clean the mirrors will be treated with soil stabilizers periodically.
• Water will be applied by water trucks on regularly disturbed areas where soil stabilizers are not as effective due to frequent use. The water used in the mirror washing will also provide for some incidental dust control.
• Vehicle speeds will be limited to no more than 10 miles per hour on unpaved roadways, with the exception that vehicles may travel up to 25 miles per hour on stabilized unpaved roads as long as such speeds do not create visible dust emissions.
Based on the information provided, we have determined that the above measures represent BACT for fugitive road dust, and the fugitive dust control plan must include, at a minimum, the requirements listed above. This determination is consistent with other BACT determinations, as illustrated in Table 7-23, for onsite operations that cause vehicle traffic.

Palmdale (SE 09-01) Fact Sheet/Ambient Air Quality Impact Report August 2011
45
Table 7-23: Summary of Recent BACT Determinations for Fugitive Road Dust Emissions
Facility Location Control Permit Issuance Source
V & M Star Ohio Water, sweeping, chemical stabilization or suppressants
Draft January
2011
RBLC # OH-0344
Nucor Steel Ohio Water, resurfacing, chemical stabilization, and/or speed reduction
Draft December
2010
RBLC # OH-0341
Flopam Inc. Maryland Paved where practical, precautions
taken to prevent dust from becoming airborne
June 2010 RBLC # LA-0240
Nucor Steel Louisiana
Paved where practical, for unpaved roads use water or dust suppressant chemicals to reduce emissions and
15 mph speed limit
May 2010 RBLC # AR-0094
John W. Turk Jr Power Plant Arkansas Water/dust suppressing chemicals November
2008 RBLC # AR-0094
7.6 BACT for Circuit Breakers
7.6.1 GHG The circuit breakers are subject to BACT for GHG emissions. The only GHG emitted from circuit breakers is sulfur hexafluoride (SF6). With the proposed control technologies, CO2e emissions are estimated at 9.56 TPY. Step 1 – Identify all control technologies The inherently lower-emitting control options for GHG emissions include:
• Use of dielectric oil or compressed air circuit breakers – these types of circuit breakers do not contain any GHG pollutants.
• Totally enclosed SF6 circuit breakers with leak detection systems – these types of circuit breakers have a maximum leak rate of 0.5% per year by weight and have an alarm warning when 10% of the SF6 has escaped. The use of an alarm identifies potential leak problems before the bulk of SF6 has escaped.
No add-on control options for GHG emissions were identified. Additionally, alternative gases to SF6 are also currently not available.41
41 Information is available at http://www.epa.gov/electricpower-sf6/documents/new_report_final.pdf.

Palmdale (SE 09-01) Fact Sheet/Ambient Air Quality Impact Report August 2011
46
Step 2 – Eliminate technically infeasible control technologies Both control options are assumed to be technically feasible. Step 3 – Rank remaining control technologies The expected emissions from the two control options are compared in Table 7-24. Currently, the only other similar facility with a GHG BACT limit is the Russell City Power Plant to be located in Hayward, California. The PSD permit for this facility has a voluntary GHG requirement to install the same leak detection system proposed for the PHPP.
Table 7-24: Circuit Breaker Control Technologies Ranked by Control Effectiveness
GHG Control Technologies CO2e Emission
Rate (TPY)
Dielectric oil or compressed air circuit breakers 0
Enclosed-pressure SF6 circuit breakers with 0.5% (by weight) annual leakage rate and leak detection systems
9.56
Step 4 – Economic, Energy, and Environmental Impacts The applicant eliminated the use of dielectric oil or compressed air circuit breakers because they are an outdated technology and the SF6 circuit breakers are more reliable. Specifically the applicant provides that according to the National Institute for Standards and Technology, SF6 “offers significant savings in land use, is aesthetically acceptable, has relatively low radio and audible noise emissions and enables substations to be installed in populated areas close to the loads.”42 Dielectric oil or compressed air circuit breakers therefore have been eliminated based on the potential adverse environmental and energy impacts. Additionally, we are not aware of any significant or unusual environmental impacts associated with the chosen technology. Step 5 – Select BACT Based on a review of the available control technologies for GHG emissions from circuit breakers, we have concluded that the applicant’s proposed requirements are BACT for this source: the use of enclosed-pressure SF6 circuit breakers with an annual leakage rate of 0.5% by weight, a 10% by weight leak detection system, and 9.56 TPY of CO2e based on a 12-month rolling total.
8. Air Quality Impacts
Clean Air Act section 165 and EPA’s PSD regulations at 40 C.F.R. section 52.21 require an examination of the impacts of the proposed PHPP on ambient air quality. The applicant must demonstrate, using air quality models, that the facility’s emissions of the PSD-regulated air pollutants would not cause or contribute to a violation of (1) the applicable
42 Ibid.

Palmdale (SE 09-01) Fact Sheet/Ambient Air Quality Impact Report August 2011
47
National Ambient Air Quality Standards (NAAQS), or (2) the applicable PSD increments (explained below in Section 8.4). This section includes a discussion of the relevant background data and air quality modeling, and our conclusion that the Project will not cause or contribute to an exceedance of the applicable NAAQS or applicable PSD increments and is otherwise consistent with PSD requirements governing air quality.
8.1 Introduction
8.1.1 Overview of PSD Air Impact Requirements Under the PSD regulations, permit applications for major sources must include an air quality analysis demonstrating that the facility’s emissions of the PSD-regulated air pollutants would not cause or contribute to a violation of the applicable NAAQS or applicable PSD increments. (A PSD increment for a pollutant applies only to areas that meet the corresponding NAAQS.) The applicant provides separate modeling analyses for each criteria pollutant emitted above the applicable significant emission rate. If a preliminary analysis shows that the ambient concentration impact of the project by itself is greater than the Significant Impact Level (SIL), then a full or cumulative impact analysis is required for that pollutant. The cumulative impact analysis includes nearby pollution sources in the modeling, and adds a monitored background concentration to account for sources not explicitly included in the model. The cumulative impact analysis must demonstrate that the Project will not cause or contribute to a NAAQS or increment violation. Required model inputs characterize the various emitting units, meteorology, and the land surface, and define a set of receptors (spatial locations at which to estimate concentrations, typically out to 50 km from the facility at issue). Modeling should be performed in accordance with EPA's Guideline on Air Quality Modeling, in Appendix W to 40 CFR Part 51 (GAQM or Appendix W). AERMOD with its default settings is the standard model choice, with CALPUFF available for complex wind situations. A PSD permit application typically includes a Good Engineering Practice (GEP) stack height analysis, to ensure a) that downwash is properly considered in the modeling for stacks less than GEP height, and b) that stack heights used as inputs to the modeling are no greater than GEP height, so as to disallow artificial dispersion from the use of overly tall stacks. The application may also include initial “load screening,” in which a variety of source operating loads and ambient temperatures are modeled, to determine the worst case scenario for use in the rest of the modeling. The PSD regulations also require an analysis of the impact on nearby Class I areas, generally those within 100 km, though the relevant Federal Land Manager (FLM) may specify additional or fewer areas. The analysis includes the NAAQS, PSD increments, and Air Quality Related Values (AQRVs). AQRVs are defined by the FLM, and typically limit visibility degradation and the deposition of sulfur and nitrogen. CALPUFF is the standard model choice for Class I analyses, since it can handle visibility chemistry as well as the typically large distances (over 50 km) to Class I areas.

Palmdale (SE 09-01) Fact Sheet/Ambient Air Quality Impact Report August 2011
48
Finally, the PSD regulations require an additional impact analysis, showing the Project's effect on visibility, soils, vegetation, and growth. This visibility analysis is independent of the Class I visibility AQRV analysis. The additional impact analysis for the PHPP is discussed in Section 9 below.
8.1.2 Identification of PHPP Modeling Documentation The PSD modeling analysis for the PHPP went through several stages, reflecting the regulatory requirements and guidance clarifications that came into effect over time, as well as discussions between the applicant and EPA about the appropriate methodologies for impact assessment. In general, the latest analyses submitted by the applicant are discussed in this AAQIR, with some references to earlier work. The PHPP modeling analysis comprises the eight documents listed in Table 8-1 below. The Class I and Class II Modeling Protocols (July 2008) describe the methods to be used for the air quality impact analyses, including choice of model and the preparation of model inputs such as meteorological data. The PSD Application (March 2009) contains the results of the modeling. After the application submittal, EPA policy changed so that the PM10 NAAQS could no longer be used as a surrogate for the PM2.5 NAAQS, and EPA promulgated the 1-hour NO2 NAAQS; neither PM2.5 nor 1-hour NO2 these was addressed in the original modeling. The applicant submitted Supplemental Information (June 2010) to update its modeling analysis by providing a PM2.5 analysis and a 1-hour NO2 analysis considering the Project and background concentrations; it also upgraded the additional impact analysis discussed in Section 9 below. The applicant's NO2 Memo #1 (October 2010) provides a cumulative 1-hour NO2 analysis, which includes nearby sources in addition to the Project itself. Finally, the Updated Analyses Memo (March 2011) revises the PM2.5 and 1-hour NO2 analyses to account for corrected hourly emissions estimates for the nearby U.S. Air Force Plant 42, and to use a more conservative estimate of the NO2 background concentration. The applicant also submitted additional documentation in NO2 Memo #2 (December 2010), and the NO2 Background Memo (July 2011), providing additional justification for the approaches taken for the applicant’s 1-hour NO2 analysis. Table 8-1: Modeling Documentation for Palmdale Hybrid Power Project PSD Application Short name Citation
Class I Modeling Protocol
“Class I Area Dispersion Modeling Protocol for the Proposed Palmdale Hybrid Power Project”, ENSR Corporation (document 10855-002-040C1MP), July 2008 (file "PHPP Class I Modeling Protocol.pdf"
Class II Modeling Protocol
“Class II Area Dispersion Modeling Protocol for the Proposed Palmdale Hybrid Power Project”, ENSR Corporation (document 10855-002-040C2MP), July 2008 (file "PHPP Class II Modeling Protocol.pdf")
Original PSD Application
“Application for Prevention of Significant Deterioration Permit for Palmdale Hybrid Power Project”, AECOM Environment (document 10855-002-040 PSD), March 2009 (file "Palmdale PSD Application.pdf")

Palmdale (SE 09-01) Fact Sheet/Ambient Air Quality Impact Report August 2011
49
Supplemental Information
“Palmdale Hybrid Power Project PSD Application, Supplemental Information”, AECOM, June 2010 (file "Supplemental PSD Submittal 072010.pdf")
NO2 Memo #1
“Response to EPA Comments on AECOM 1-hour NO2 NAAQS Analysis for PHPP”, Memorandum from Richard Hamel, AECOM, to Scott Bohning, EPA, October 7, 2010 (file "Response to EPA Comments on NO2 Modeling.pdf")
NO2 Memo #2
“Response to EPA Additional Comments on AECOM 1-hour NO2 NAAQS Analysis for Palmdale Hybrid Power Project”, Memorandum from Richard Hamel, AECOM, to Scott Bohning, EPA, December 14, 2010 (file "Response to 2nd set of EPA Comments on NO2 Modeling.pdf")
Updated Analyses Memo
“Final Update to 1-hour NO2 and 24-hour PM2.5 NAAQS Analyses for Palmdale Hybrid Power Project”, Memorandum from Richard Hamel, AECOM, to Scott Bohning, EPA, March 30, 2011 (file "Updated NO2 and PM2.5 Modeling Analyses for PHPP 033011.pdf")
NO2 Background Memo
“Justification of the use of the 3-year average 98th percentile ambient background concentration for PHPP 1-hour NO2 NAAQS Modeling”, Memorandum from Richard Hamel, AECOM, to Scott Bohning, EPA, July 21, 2011 (file "1-hour NO2 Ambient Background Justification for PHPP NAAQS Modeling 072111.pdf")
8.2. Background Ambient Air Quality The PSD regulations require the air quality analysis to contain air quality monitoring data as needed to assess ambient air quality in the area for the PSD-regulated pollutants for which there are NAAQS that may be affected by the source. In addition, for demonstrating compliance with the NAAQS, a background concentration is added to represent those sources not explicitly included in the modeling, so that the total accounts for all contributions to current air quality. For background concentrations, PHPP chose the Lancaster Division Street monitor, which is the nearest available, except for SO2, for which the Burbank West Palm Avenue is nearest. The most recent three years of data available at the time of the application are 2005-2007. (PSD Application p.6-2 pdf.47; see also Class II Modeling Protocol p.2-19 pdf.24) Based on their siting at more urbanized locations than the Project site, these monitors provide conservative estimates of background concentrations. The SO2 monitor at Burbank West Palm Avenue is 34 miles away, but is in the eastern portion of urbanized Los Angeles with its many pollution sources, and therefore it provides a conservative estimate of the SO2 background. The Lancaster Division Street monitor is just 2.5 miles from the PHPP power block; it is within the city of Lancaster, which has a population of some 150,000, and is near several roads; it is thus conservative for most pollutants. This site is discussed further below in the section on NO2-specific issues. Table 8-2 below describes the maximum background concentrations of the PSD-regulated pollutants for which there are NAAQS that may be affected by the Project’s emissions, and the corresponding NAAQS.

Palmdale (SE 09-01) Fact Sheet/Ambient Air Quality Impact Report August 2011
50
Table 8-2 Maximum background concentrations and NAAQS
NAAQS pollutant &
averaging time Background
Concentration, µg/m3 NAAQS, µg/m3 CO, 1-hr 3,680 40,000 (35 ppm) CO, 8-hr 1,840 10,000 (9 ppm) NO2, 1-hr 77.1 188 (100 ppb) NO2, annual 28.2 100 (53 ppb) PM10, 24-hr 86 150 PM2.5, 24-hr 16.3 35 PM2.5, annual 7.6 15
Note: The PM2.5 24-hr value is 98th percentile rather than maximum
8.3 Modeling Methodology for Class II areas The applicant modeled the impact of PHPP on the NAAQS and PSD Class II increments using AERMOD in accordance with EPA’s GAQM (Appendix W of 40 CFR Part 51). The modeling analyses included the maximum air quality impacts during startups and shut-downs, as well as a variety of conditions to determine worst-case short-term air impacts.
8.3.1 Model selection As discussed in the modeling protocol (Class II Modeling Protocol sec. 2, p.2-1 pdf.6; also PSD Application p.6-1 pdf.46), the model that the applicant selected for analyzing air quality impacts in Class II areas is AERMOD, along with AERMAP for terrain processing and AERMET for meteorological data processing. This accords with the default recommendations in EPA's GAQM, section 4.2.2 on Refined Analytical Techniques.

Palmdale (SE 09-01) Fact Sheet/Ambient Air Quality Impact Report August 2011
51
8.3.2 Meteorology model inputs AERMOD requires representative meteorological data in order to accurately simulate air quality impacts. For surface air data, PHPP selected 2002-2004 data from the Palmdale Regional Airport. Other nearby meteorological sites were examined, but the Palmdale Airport had better data completeness, is the closest, and has the same surface characteristics as the Project site. It is at or barely below 90% completeness for every quarter; it is within 2 miles, just on the other side of the airport's airstrip; and it is on flat, desert scrub land, with no intervening high ground between the Project and the meteorological tower (Class II Modeling Protocol p.2-4 pdf.9 and Figure 2-2, p.2-5 pdf.10). The applicant made additional comparisons of land surface characteristics of the Project and meteorological sites, in terms of surface roughness in each radial direction, concluding that because of the sites' proximity and essentially identical characteristics, the Palmdale Airport data should be considered “site specific” (or “on-site”) data (NO2 Memo #2 p.9ff pdf.9). Normally GAQM would require 5 years of airport data for modeling, but if on-site data is used, then a single year or those years available, may be used (GAMQ 8.3.3.2). In this case, additional data were available for 2005-2006, but the corresponding upper air data had a substantial amount of missing data (NO2 Memo #2 p.10 pdf.10). In any case, the wind roses for the various years are virtually indistinguishable, evidence that the 2002-2004 data are adequately representative of the meteorological conditions at the site. EPA believes that the chosen 2002-2004 Palmdale Regional Airport data is amply representative for the PHPP analysis. For upper air data, the applicant selected Mercury Desert Rock Airport in Mercury, Nevada, as being the most representative site available that had data complete enough to use (Class II Modeling Protocol p.2-4 pdf.9). PHPP later elaborated on the representativeness of the Mercury Desert Rock Airport Data, noting that Vandenberg AFB in Lompoc, CA and the Marine Corps Air Station in Miramar, CA, near San Diego are near the ocean and have a very different climate than the high-altitude, desert Palmdale location (NO2 Memo #1 p.2ff pdf.2). EPA agrees that it is appropriate to use the Mercury Desert Rock Airport upper air data for the PHPP analysis.
8.3.3 Land characteristics model inputs Land characteristics are used in the AERMOD modeling system in three ways: 1) via elevation within AERMOD to assess plume interaction with the ground; 2) via a choice of rural versus urban algorithm within AERMOD; and 3) via specific values of AERMET parameters that affect turbulence and dispersion, namely surface roughness, Bowen ratio, and albedo. The applicant used terrain elevations from United States Geological Survey (USGS) Digital Elevation Model (DEM) data for receptor heights for AERMOD, which uses them to assess plume distance from the ground for each receptor. The elevations were also used within the AERMAP preprocessor to determine hill height scales for each receptor, used by AERMOD to
Palmdale (SE 09-01) Fact Sheet/Ambient Air Quality Impact Report August 2011
52
determine whether the plume goes over or around the hill. For rural versus urban algorithm within AERMOD, the applicant classified land use within 3 km of the project using the 12-category Auer procedure, one of the methods recommended by EPA (GAQM 7.2.3(c)). Since desert scrub land is more than 50% of the area, it is classified as “rural” for choosing dispersion algorithms within AERMOD (Class II Modeling Protocol p.2-2 pdf.7, and Figure 2-1, p.2-3 pdf.8). The applicant followed EPA's “AERMOD Implementation Guide” (2008 version) in using EPA's AERSURFACE processor with the National Land Cover Data 1992 archive to determine surface characteristics for AERMET (Class II Modeling Protocol p.2-9 to 2-14 pdf.14 to 19). A 2005 satellite image shows no significant change in land use since the 1992 data was compiled, so it remains appropriate. Land use cover categories were translated by AERSURFACE into monthly parameter values used in AERMET's stage 3 input files. The AERSURFACE determination of surface roughness length used land cover in 2 radial sectors, desert scrub and the airport's airstrip, which appears reasonable. The Bowen ratio (ratio of sensible to latent heating, i.e., direct temperature change versus air heating via evaporation), and albedo (reflection coefficient) affect heat-driven turbulence and dispersion under daytime convective conditions. Seasonal Bowen ratio for the surrounding 10x10 km area was estimated by AERSURFACE using three surface moisture categories and the amount of precipitation relative to the 30-year climatological record. Seasonal albedo was also supplied by AERSURFACE for the 10x10 km area based on land cover. All of these are the standard EPA-recommended procedures for AERMOD inputs.
8.3.4 Model receptors Model receptors are chosen geographic locations at which the model estimates concentrations. The receptors should have good area coverage and be closely spaced enough so that the maximum model concentrations are be found. At larger distances, spacing between receptors may be greater than it is close to the source since concentrations vary less with increasing distance. The spatial extent of the receptors is limited by the applicable range of the model (roughly 50 km for AERMOD), and possibly by knowledge of the distance at which impacts fall to negligible levels. Receptors need be placed only in ambient air, that is, locations to which the public has access, and not inside the project fence line. In addition, to avoid overly conservative estimates when multiple sources are being modeled, separate modeling runs may be needed for different subsets of receptors, so that a given source's emissions are not counted toward concentrations within its own fence line. The applicant used receptors every 50 m along the project fence line, together with a Cartesian grid (rectangular array) of receptors, starting with 100 m spacing out to 3 km distant, and with progressively larger spacing, with 1000 m spacing between 10 and 20 km distant (PSD Application p.6-3 pdf.48). The applicant supplied a rationale for limiting the grid extent to 20 km, as opposed to 50 km. It found that short-term impacts were caused mainly by the ancillary

Palmdale (SE 09-01) Fact Sheet/Ambient Air Quality Impact Report August 2011
53
equipment, such as the emergency generator, rather than the main combustion turbines, and that maximum impacts were on the fence line or within 100 m, and likely driven by downwash effects. The applicant conducted additional modeling to compare distance impacts to those within the 20 km grid, and found that the maximum impacts within 20 km are 2 to 50 times higher than those outside, depending on averaging time (Supplemental Information p.6-1 pdf.41). EPA agrees that the receptor spacing and 20 km spatial extent are adequate for analysis of PHPP impacts.
8.3.5 Load screening and stack parameter model inputs The applicant performed initial “load screening” modeling, in which a variety of source operating loads and ambient temperatures were modeled, to determine the worst case stack parameter scenario for use in the rest of the modeling. It modeled 100% load, 100% with duct burners operating, 75% load, and 50% load. For annual averages, it used 100% load with a conservatively low temperature of 64°F (lower than actual annual average). (PSD Application Table 6-3, p.6-4 pdf.49) The choice of “worst case” is different for each pollutant, since different pollutants’ emissions respond differently to temperature and flow rate. Worst case for CO and NO2 was 100% with duct burners operating; for PM10 and PM2.5 it was 50% load (PSD Application p.6-6 pdf.51). The corresponding stack parameters were used in the remainder of the modeling to provide conservative estimates of PHPP impacts.

Palmdale (SE 09-01) Fact Sheet/Ambient Air Quality Impact Report August 2011
54
Table 8-3: Load screening and stack parameters
Source: PSD Application Table 6-3, p.6-4 pdf.49
8.3.6 Good Engineering Practice (GEP) Analysis The applicant performed a Good Engineering Practice (GEP) stack height analysis, to ensure a) that downwash is properly considered in the modeling for stacks less than GEP height, and b) that stack heights used as inputs to the modeling are no greater than GEP height, so as to disallow artificial dispersion from the use of overly tall stacks. As is typical, the GEP analysis was performed with EPA’s BPIP ( Building Profile Input Program) software, which uses building dimensions and stack heights. The analysis found that GEP stack height for the main combustion turbines was 83.8 m, greater than the planned actual height of 44.2 m. GEP stack height for the other equipment was similarly greater than the planned heights. So, for all emitting units, the AERMOD modeling used the planned actual stack heights, and included wind direction-specific Equivalent Building Dimensions to properly account for downwash. (PSD Application p.6-5 pdf.50)

Palmdale (SE 09-01) Fact Sheet/Ambient Air Quality Impact Report August 2011
55
8.4 National Ambient Air Quality Standards and PSD Class II Increment Consumption Analysis
8.4.1 Pollutants with significant emissions An air quality impact analysis is required for each PSD-regulated pollutant (for which there is a NAAQS) that is emitted in a significant amount, i.e., an amount greater than the Significant Emission Rate for the pollutant. Applicable PHPP emissions and the Significant Emission Rates are shown in Table 8-4 (derived from PSD Application Table 1-1, p.8 pdf.8). PHPP emissions of SO2 are not significant. However, PHPP emits significant amounts of CO, NOX, PM10, and PM2.5, so air impact analyses are required for CO, NO2, PM10, and PM2.5.
Table 8-4: PSD Applicability to PHPP: Pollutants Emitted in Significant Amounts
Criteria Pollutant PHPP Emissions,
tons/year Significant Emission
Rate, tons/year PSD applicable? CO 254.6 100 Yes NOX 114.9 40 Yes PM10 131.8 15 Yes PM2.5 125.3 10 Yes SO2 8.9 40 No
Source: PSD Application Table 1-1, p.8 pdf.8
8.4.2 Preliminary analysis: Project-only impacts EPA has established Significant Impact Levels (SILs) to characterize air quality impacts. A SIL is the ambient concentration resulting from the facility’s emissions, for a given pollutant and averaging period, below which the source is assumed to have an insignificant impact. For maximum modeled concentrations below the SIL, no further air quality analysis is required for the pollutant. For maximum concentrations that exceed the SIL, a cumulative modeling analysis, which incorporates the combined impact of nearby sources of air pollution, is required to determine compliance with the NAAQS and PSD increments. The results of the preliminary or Project-only analysis are shown in Table 8-5. PHPP impacts are significant for 1-hour NO2, 24-hour PM10, 24-hour PM2.5, and annual PM2.5, so cumulative impact analyses are required for these pollutants.
Table 8-5: PHPP Significant Impacts, Normal Operations NAAQS pollutant &
averaging time Project-only
Modeled Impact Significant Impact Level (SIL), μg/m3
Project impact significant?
CO, 1-hr 369.6 2000 No CO, 8-hr 20.4 500 No NO2, 1-hr 106.9 7.5 (4 ppb) Yes

Palmdale (SE 09-01) Fact Sheet/Ambient Air Quality Impact Report August 2011
56
NO2, annual 0.98 1 No PM10, 24-hr 12.7 5 Yes PM2.5, 24-hr 12.57 1.2 Yes PM2.5, annual 1.2 0.3 Yes Sources: Impacts (except for 1-hr NO2 and PM2.5): PSD Application p.6-7 pdf.52 NO2 1-hr: Supplemental Information p3-2. pdf.22 PM10: PSD Application Table 6-7, p.6-8 pdf.53 PM2.5: Updated Analyses Memo Table 9, p.15 pdf.15
8.4.3 Cumulative impact analysis A cumulative impact analysis includes nearby sources in addition to the Project itself. For demonstrating compliance with the PSD increment, only increment-consuming sources need be included, since the increment concerns only changes occurring since the applicable baseline date. However, a conservative and sometimes easier approach is simply to model all nearby sources; this was the approach taken by PHPP. For demonstrating compliance with the NAAQS, a background concentration is added to represent those sources not explicitly included in the modeling, so that the total accounts for all contribution to current air quality.
8.4.3.1 Nearby source emission inventory For both the PSD increment and NAAQS analyses, there may be a large number of sources that could potentially be included, so judgement must be applied to exclude small and/or distant sources that have only a negligible contribution to total concentrations. Only sources with a significant concentration gradient in the vicinity of the source need be included; the number of such sources is expected to be small except in unusual situations. (GAQM 8.2.3) The applicant identified two sources nearby for inclusion in the emission inventory for the cumulative analysis, based on discussions with the Antelope Valley Air Quality Management District (District) (PSD Application p.6-7 pdf.52). These are Lockheed Martin Aeronautics and Northrop Grumman, both within or adjacent to U.S. Air Force Plant 42 near the Palmdale airport. These sources had a large number of individual emitting sources (284), most of which had very low emissions. For practicality of modeling some of these were combined in a conservative way: emitters with less than 5% of total had their emissions added to the largest emitters. In support of limiting the inventory to these sources, the applicant quoted a statement from Mr. Chris Anderson, Air Quality Engineer, and Mr. Alan De Salvio, Supervisor of Air Quality Engineering, of the District: “Minor facilities located within the 6 mile radius are expected to be included in the background monitored at the AVAQMD [District] air monitoring station which is located in close proximity (approximately within 2 miles) of the PHPP site.” (NO2 Memo #2 p.11 pdf.11) The applicant also documented discussions with the District, Mojave Desert Air Quality

Palmdale (SE 09-01) Fact Sheet/Ambient Air Quality Impact Report August 2011
57
Management District (AQMD), Kern County Air Pollution Control District, and South Coast AQMD showing that there are few substantial PM2.5 sources nearby; however, Granite Rock Construction and Robertson’s Ready Mix were included in the modeling, both about 15 km (9 miles) from PHPP (Supplemental Information p.2-1 to 2-2 pdf.9 to 10, and Figure 2-1 p.2-3 pdf.11). Also, recent EPA NO2 guidance clarification states that the nearby source inventory “should focus on the area within about 10 kilometers of the project location”, which suggests that the PHPP inventory is adequate for NO2 analyses (p.16 of “Additional Clarification Regarding Application of Appendix W Modeling Guidance for the 1-hour NO2 National Ambient Air Quality Standard”, Memorandum from Tyler Fox, EPA Air Quality Modeling Group to EPA Regional Air Division Directors, March 1, 2011). Nevertheless, the applicant also performed a “Q/D” analysis, which provides another factor for consideration in determining whether sources with small emissions (Q) and/or at large distances (D) would be reasonable to exclude from the analysis. The applicant proposed that sources with a km distance greater than the NOX emissions in tons per year divided by 20 would be eligible for exclusion. (Updated Analyses Memo p.6 pdf.6, citing “Screening Method for PSD” developed by the North Carolina Air Quality Section of the North Carolina Department of Natural Resources, in file “NC 20D Letter to EPA.pdf”). The only sources to pass this initial screen were those within US Air Force Plant 42, already included in the cumulative modeling, and Bolthouse Farm emissions. In addition to being mostly downwind (east) of the project, the emissions of Bolthouse Farm are widely distributed throughout the area, and therefore are dispersed enough that they would have a negligible contribution to maximum concentrations (Updated Analyses Memo p.8 pdf.8). The Q/D analysis provides additional evidence that the source inventory is adequate for the cumulative impact analysis. EPA believes that the combination of a conservative background monitored concentration expected to include the effect of most nearby sources, EPA guidance clarification focusing on sources within 10 km, and the Q/D analysis are sufficient justification for the inventory used in the cumulative analysis.
8.4.3.2 PM2.5-specific issues The applicant originally relied on the PM10 NAAQS as a surrogate for the PM2.5 NAAQS, which was allowed under previous EPA policy. However, EPA repealed this policy (proposed February 11, 2010; final May 18, 2011), so that PM2.5 itself must be modeled. EPA also issued guidance clarification on how to combine modeled results with monitored background concentrations (“Modeling Procedures for Demonstrating Compliance with PM2.5 NAAQS”, memorandum from Stephen D. Page, Director, EPA OAQPS, March 23, 2010). Accordingly, the applicant replaced the original analysis with a new cumulative PM2.5 analysis. The applicant still conservatively used PM10 emissions as input to the modeling, so actual PM2.5 impacts may be lower than those indicated in the model results. Maximum model results were
Palmdale (SE 09-01) Fact Sheet/Ambient Air Quality Impact Report August 2011
58
correctly added to the ninety-eighth percentile of the monitored background concentration, as called for in the EPA guidance clarification. (Updated Analyses Memo p.12ff pdf.12) The PHPP application has little discussion of secondarily formed PM2.5 (as distinguished from directly emitted primary PM2.5). However, the applicant does cite an earlier AECOM analysis showing that that near the source, primary PM2.5 emissions dominate the modeled impacts (Supplemental Information, p.2-10 pdf. 18). EPA notes that, due to the time needed for chemical formation, secondary PM2.5 impacts are likely to occur much farther downwind than the significant primary impacts, which occur within 400 m of the project (Updated Analyses Memo p.12 pdf.12), and so are likely to be small and not overlapping with the impacts estimated in the application.
8.4.3.3 NO2-specific issues The applicant used the Ozone Limiting Method (OLM) option in AERMOD, in which ambient ozone concentrations limit the amount of emitted NO that is converted to NO2 (after an initial 10% conversion). In addition to requiring monitored ozone, the method requires specification of an in-stack NO2/NOX ratio. EPA believes the OLM method is justified in this area because while it has substantial ozone, most of that is due to transport from outside the area, rather than to photochemistry operating on VOC and NOX emiossions from sources within the area. Therefore, the alternative mechanisms for conversion of NO to NO2 by the hydroxyl and peroxy radicals are likely to be less important than the ozone conversion mechanism, and so the conversion is ozone-limited.
A. In-stack NO2/NOX ratio The applicant notes that since the Project would be located in an ozone nonattainment area, ozone concentrations are generally high, so that the initial in-stack NO2/NOX ratio is of less importance than would otherwise be the case, since plentiful ozone is available to convert NO to NO2 (NO2 Memo #2 p.3 pdf.3). GE Power and Water, the vendor of the GE7FA turbines planned for PHPP, provided an in-stack NO2/NOX ratio of 0.10 to 0.15 based on its review of available NO2 emission data; the Selective Catalytic Reduction (SCR) planned for PHPP would make this ratio even lower (NO2 Memo #1 p.8 pdf.8; NO2 Memo #2 p.3 pdf.3). Since little data is available for the ratio during startup and shutdown conditions, the applicant relied on a 0.4 ratio as recommended by the San Diego County Air Pollution Control District for a project with similar turbines, despite some evidence that the actual ratio could be lower for both startup and shutdown events. The short duration of these events implies that that actual ratio would be closer to the 0.10 used for normal operations (NO2 Memo #1 p.9 pdf.9).

Palmdale (SE 09-01) Fact Sheet/Ambient Air Quality Impact Report August 2011
59
B. NO2 monitor representativeness/conservativeness
As mentioned above, the applicant chose the Lancaster Division Street monitor for background NO2 concentrations. This monitor is just 2.5 miles from the PHPP power block, and is near the Sierra Highway (110 m), the Antelope Valley Freeway (SR-14) (4 km), commute traffic on Division Street (50 m), and the Southern Pacific Railway (80 m). EPA agrees with PHPP that this location is quite conservative for providing NO2 background concentrations.
C. O3 background monitor representativeness
The applicant notes that since O3 is a regionally formed pollutant, the nearness of the monitoring site to the project is the most important criterion for representativeness (NO2 Memo #1 p.10 pdf.10). The Lancaster Division Street monitor is just 2.5 miles away from the PHPP power block, and EPA agrees that it is adequately representative.
D. Missing O3 data procedure
The applicant filled in missing ozone data using a procedure to ensure that NO to NO2 conversion is not underestimated. When 1 or 2 hours are missing, the higher of the two endpoints are used for the missing hours. When 3 or more hours are missing, the higher of the two end points and of the corresponding hours from the two neighboring days are used for the missing hours. (NO2 Memo #2 p.8 pdf.8) Under this procedure, professional judgement is applied to ensure that the data from the neighboring days are not anomalously low. The applicant provided an example of the application of this procedure (Updated Analyses Memo p.3 to 4 pdf.3 to 4), as well as details of the full calculations (file “PHPP Ozone Filling Analysis.xlsx” from July 2011). EPA believes that the applicant followed a reasonable and conservative procedure for filling in missing ozone values.
E. Combining modeled and monitored values
Originally, the applicant combined each modeled concentration with the background concentration from the corresponding hour (“hour-by-hour” approach). The applicant later switched to a variant of EPA’s March 2011 memo’s43 “first tier” approach: it used the 98th percentile of all monitored values, though only for model receptors outside the USAF Plant 42 boundary; the hour-by-hour approach still applied to other receptors. (The EPA March 2011 memo’s “first-tier” approach uses the 98th percentile from among only the daily maxima, whereas 43 “Additional Clarification Regarding Application of Appendix W Modeling Guidance for the 1-hour NO2 National Ambient Air Quality Standard”, Memorandum from Tyler Fox, EPA Air Quality Modeling Group to EPA Regional Air Division Directors, March 1, 2011. http://www.epa.gov/ttn/scram/Additional_Clarifications_AppendixW_Hourly-NO2-NAAQS_FINAL_03-01-2011.pdf

Palmdale (SE 09-01) Fact Sheet/Ambient Air Quality Impact Report August 2011
60
the applicant’s variant uses the 98th percentile from among all hourly values.) While the applicant’s approach is less conservative than EPA’s first-tier approach, we believe that it remains conservative given the very conservative background monitor that is being used (NO2 Background Memo). The maximum values coincide with morning and evening commute traffic, due to the several roads near the monitor. A key concern expressed in EPA’s March 2011 memo about the hour-by-hour approach is that it implicitly assumes concentrations are spatially uniform, i.e., that the background monitor is representative of all locations44. Since this is not generally true, some degree of temporal conservativeness is warranted, as in the memo-recommended 98th-percentile of the available background concentrations by season and hour-of-day. However, for PHPP, the background monitor appears to be very conservative, so that the implicit spatial uniformity assumption of the hour-by-hour approach is actually a conservative assumption in this case. If the memo-recommended procedure were to be used in this case, then a single unusually high morning commute hourly concentration would be assumed to apply to every day of the season; a single NO2 exceedance would then become 90 exceedances, thus possibly causing an erroneous prediction of a 1-hour NO2 violation, an overly conservative approach. In addition, the applicant’s modeling included some intermittent sources (PHPP's emergency generators) that may not need to be included, per EPA’s March 2011 memo45 on hourly NO2 modeling, further adding to the conservativeness of the analysis. EPA believes that the applicant’s overall approach to the 1-hour NO2 analysis for the PHPP, including the emission inventory, background concentrations of NO2 and O3, and method for combining model results with monitored values, is adequately conservative.
8.4.3.4 Results of the cumulative impacts analysis The results of the PSD cumulative impacts analysis for PHPP’s normal operations is shown in Table 8-6. The analysis demonstrates that emissions from PHPP during normal operations will not cause or contribute to exceedances of the NAAQS for 1-hour NO2, 24-hour PM10, 24-hour PM2.5, or annual PM2.5 or applicable PSD increments. As discussed above, PHPP’s maximum modeled concentrations are below the SILs for annual NO2, 1-hour CO, and 8-hour CO; therefore, a cumulative impacts analysis was not required to demonstrate compliance for these pollutants/averaging times.
44 Ibid., p.21. 45 Ibid., p.10.

Palmdale (SE 09-01) Fact Sheet/Ambient Air Quality Impact Report August 2011
61
Table 8-6: PHPP Compliance with PSD Increments and NAAQS, Normal Operations NAAQS
pollutant & averaging
time
All Sources Modeled Impact
PSD Increment
Background Concentration
Cumulative impact w/
background NAAQS NO2, 1-hr; USAF 106.9 NA (hourly) 175.3 188 (100 ppb)
NO2, 1-hr; other 108.2 NA 77.1 185.3 188 (100 ppb)
PM10, 24-hr 12.9 30 86 98.9 150 PM2.5, 24-hr 12.58 NA 16.3 28.9 35 PM2.5, annual 1.3 NA 7.6 8.9 15 Notes: - “USAF” values are for receptors within USAF Plant 42; “other” is for receptors elsewhere; USAF Plant 42 receptors
are not ambient air with respect to its own emissions. - Background concentrations for USAF receptors were added hour-by-hour to modeled concentrations before computing
98th percentile total impact, rather than a single background value being added to the modeled impact as for the other cases.
Sources: NO2 USAF: Supplemental Information p3-2. pdf.22 NO2 other: Updated Analyses Memo Table 7, p.11 pdf.11, “Normal Operations - No PHPP Fire Water Pump” PM10: PSD Application Table 6-7, p.6-8 pdf.53 PM2.5: Updated Analyses Memo Table 9, p.15 pdf.15
8.4.3.5 Startup and shutdown analyses Combustion turbine CO and NOX emissions during startup and shutdown (SU/SD) are estimated to be substantially higher than during normal operations, and thus the applicant also modeled for shutdown, the condition having the highest emissions. Modeled stack parameters such as exit temperature and exhaust velocity were consistent with a 20% operating load; the ambient temperature used represented worst-case meteorological conditions, emission into a cool morning stable layer. Since shutdown duration may not exceed half an hour, worst case hourly emissions consist of a half-hour of normal operations followed by a shutdown event. For CO, this is 1/2 of 15.16 lb/hr, plus 337 lb, for a combined rate of 344.6 lb/hr per turbine (PSD Application p.6-9 pdf.54). For NOX, this is 1/2 of 16.6 lb/hr, plus 57 lb, for a combined rate of 65.3 lb/hr per turbine (Updated Analyses Memo Table 7, p.11 pdf.11). Emergency generator testing was not included in the NOX modeling, since it would not be undergoing testing during source shutdown. This 1-hour NO2 analysis continues to use the conservative assumptions discussed above for the analysis of normal operations. The model results are shown in Table 8-7 for the preliminary or Project-only analysis, and in Table 8-8 for the cumulative impacts analysis. The results demonstrate that emissions from PHPP will comply with the 1-hour NO2 NAAQS and both the 1-hour and 8-hour CO NAAQS under shutdown conditions (and therefore for startup conditions, for which emissions are lower). We note that the applicant was not required to, and did not, perform a cumulative impact analysis for CO, as its emissions are below the SILs; however, for informational purposes, Project impacts were added to background concentrations of CO for a rough comparison to the NAAQS.
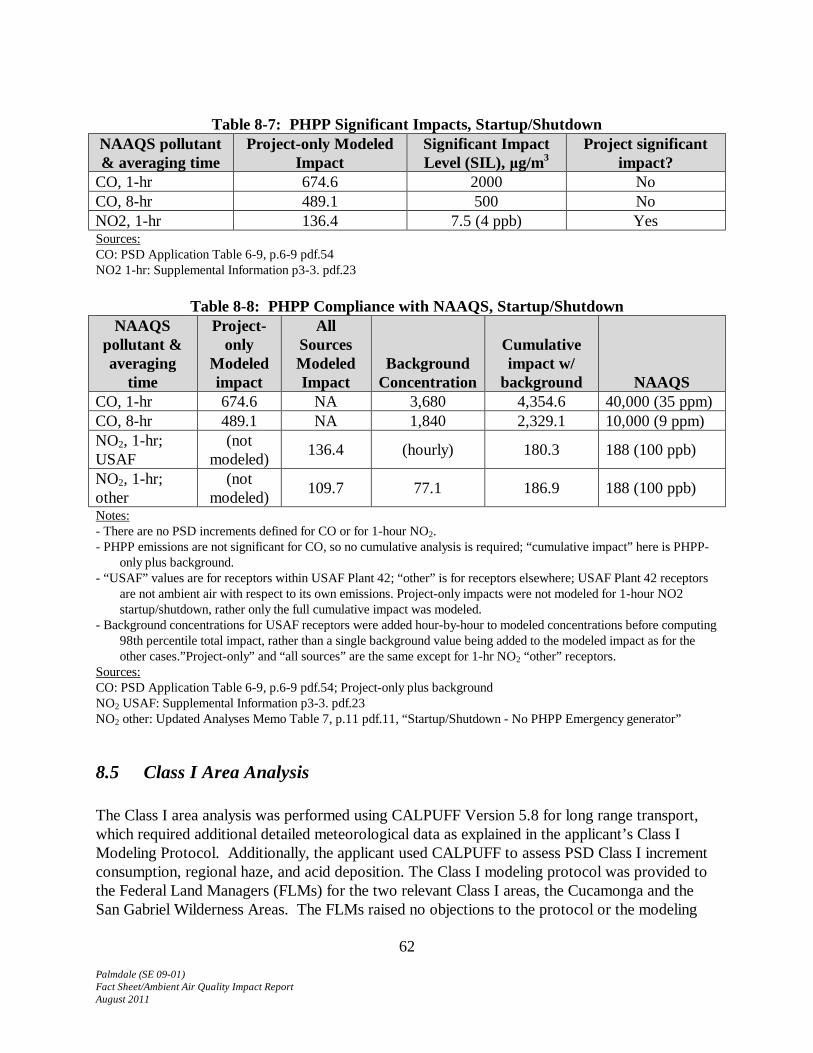
Palmdale (SE 09-01) Fact Sheet/Ambient Air Quality Impact Report August 2011
62
Table 8-7: PHPP Significant Impacts, Startup/Shutdown
NAAQS pollutant & averaging time
Project-only Modeled Impact
Significant Impact Level (SIL), μg/m3
Project significant impact?
CO, 1-hr 674.6 2000 No CO, 8-hr 489.1 500 No NO2, 1-hr 136.4 7.5 (4 ppb) Yes Sources: CO: PSD Application Table 6-9, p.6-9 pdf.54 NO2 1-hr: Supplemental Information p3-3. pdf.23
Table 8-8: PHPP Compliance with NAAQS, Startup/Shutdown NAAQS
pollutant & averaging
time
Project-only
Modeled impact
All Sources Modeled Impact
Background Concentration
Cumulative impact w/
background NAAQS CO, 1-hr 674.6 NA 3,680 4,354.6 40,000 (35 ppm) CO, 8-hr 489.1 NA 1,840 2,329.1 10,000 (9 ppm) NO2, 1-hr; USAF
(not modeled) 136.4 (hourly) 180.3 188 (100 ppb)
NO2, 1-hr; other
(not modeled) 109.7 77.1 186.9 188 (100 ppb)
Notes: - There are no PSD increments defined for CO or for 1-hour NO2. - PHPP emissions are not significant for CO, so no cumulative analysis is required; “cumulative impact” here is PHPP-
only plus background. - “USAF” values are for receptors within USAF Plant 42; “other” is for receptors elsewhere; USAF Plant 42 receptors
are not ambient air with respect to its own emissions. Project-only impacts were not modeled for 1-hour NO2 startup/shutdown, rather only the full cumulative impact was modeled.
- Background concentrations for USAF receptors were added hour-by-hour to modeled concentrations before computing 98th percentile total impact, rather than a single background value being added to the modeled impact as for the other cases.”Project-only” and “all sources” are the same except for 1-hr NO2 “other” receptors.
Sources: CO: PSD Application Table 6-9, p.6-9 pdf.54; Project-only plus background NO2 USAF: Supplemental Information p3-3. pdf.23 NO2 other: Updated Analyses Memo Table 7, p.11 pdf.11, “Startup/Shutdown - No PHPP Emergency generator”
8.5 Class I Area Analysis The Class I area analysis was performed using CALPUFF Version 5.8 for long range transport, which required additional detailed meteorological data as explained in the applicant’s Class I Modeling Protocol. Additionally, the applicant used CALPUFF to assess PSD Class I increment consumption, regional haze, and acid deposition. The Class I modeling protocol was provided to the Federal Land Managers (FLMs) for the two relevant Class I areas, the Cucamonga and the San Gabriel Wilderness Areas. The FLMs raised no objections to the protocol or the modeling

Palmdale (SE 09-01) Fact Sheet/Ambient Air Quality Impact Report August 2011
63
itself.
8.5.1 Class I Increment Consumption Analysis The results of the PHPP Class I increment analysis are shown in Table 8-9; for the PSD pollutants for which there are applicable increments, PHPP impacts are less than the Class I Significant Impact Levels (SILs), and therefore the applicant has demonstrated that the Project will not cause or contribute to any Class I PSD increment violation.
Table 8-9: PHPP Class I Increment Impacts
Class I Area Pollutant and
averaging time Project Impact,
µg/m3
Significant Impact Level,
µg/m3
Class I PSD Increment,
µg/m3
Cucamonga Wilderness Area
NO2, annual 0.0010 0.1 2.5 PM10, 24-hr 0.059 0.3 8 PM10, annual 0.003 0.2 4
San Gabriel Wilderness Area
NO2, annual 0.0017 0.1 2.5 PM10, 24-hr 0.122 0.3 8 PM10, annual 0.004 0.2 4
Source: PSD Application, Table 6-10, p.6-11 pdf.56
8.5.2 Visibility and Deposition in Class I areas The PSD regulations at 40 C.F.R. section 52.21 require that PSD permit applicants address potential impairment to visibility (e.g., regional haze, plume blight) for Class I areas. The deposition of nitrogen is another potential concern due to potential effects on soils, vegetation, and other biological resources. For Cucamonga Wilderness Area (WA), which is located greater than 50 km from the Project, a Class I regional haze analysis was conducted. The modeling considered the two CTGs’ emissions of H2SO4, NOX, PM10, PM2.5, and SO2. The applicant used CALPUFF to predict visibility impacts at Class I areas. Visibility impacts are assessed using the extinction coefficient (bext), which represents the scattering of light by air pollutants, which appears as haze that reduces visibility. The results of the CALPUFF modeling for the three meteorology years (2001-2003) are shown in Table 8-10 and indicate that changes in light extinction (bext), averaged over a 24-hour period, at Cucamonga WA is predicted to be below the 5% change threshold46.
46 “Federal Land Managers’ Air Quality Related Values Workgroup (FLAG) Phase I Report” (December 2000), U.S. Forest Service, National Park Service, U.S. Fish And Wildlife Service. http://www2.nature.nps.gov/air/Permits/flag/

Palmdale (SE 09-01) Fact Sheet/Ambient Air Quality Impact Report August 2011
64
Table 8.10: Class I Area Regional Haze CALPUFF Modeling Results
Class I Area Maximum Predicted
% Change in bext Significance Threshold
(%) 2001 2002 2003
Cucamonga WA
1.77
2.14
1.92 5
Applicants are not required to perform a cumulative effects analysis of new source growth if the visibility impact of their proposed source is less than 5%. Based on the Class I regional haze results, emissions from the facility are not expected to have an adverse impact on visibility in the Cucamonga WA. For San Gabriel WA, which is within 50 km of the Project, the impact of the Project on visibility impairment, also known as plume blight, was assessed. The EPA VISCREEN screening model was used to estimate visibility impairment to the San Gabriel WA from the CTG emissions. Effects of plume blight are assessed as changes in plume perceptibility (ΔE) and plume contrast (Cp) for sky and terrain backgrounds. A Level 1 analysis, using default meteorological data and no site-specific conditions, was conducted. Because the Level 1 results of ΔE and Cp were above the screening thresholds, a Level 2 analysis was conducted. A detailed discussion of the VISCREEN plume blight impact analysis is presented in Section 6.2.4 of the applicant’s PSD permit application. The results of the VISCREEN modeling runs are presented in Tables 8-11 and 8-12. The VISCREEN results are presented for the two default worst-case theta angles – theta equal to 10 degrees representing the sun being in front of an observer, and theta equal to 140 degrees representing the sun being behind the observer. A negative plume contrast means the plume has a darker contrast than the background sky.
Table 8-11a: Class I VISCREEN Modeling Results of Changes in Plume Perceptibility (ΔE)
Background Distance Plume Perceptibility (ΔE) Theta 10 Theta 140 Criteria
Sky 47.4 0.135 0.261 2.00 Terrain 34.6 0.806 0.072 2.00

Palmdale (SE 09-01) Fact Sheet/Ambient Air Quality Impact Report August 2011
65
Table 8-11b: Class I VISCREEN Modeling Results of
Changes in Plume Contrast (Cp)
Background Distance Plume Contrast (Cp) Theta 10 Theta 140 Criteria
Sky 47.4 0.001 -0.009 0.05 Terrain 34.6 0.005 0.001 0.05
The results from the VISCREEN model show that changes in plume perceptibility and plume contrast for sky and terrain backgrounds are below the criteria thresholds. Therefore, the plume would not be perceptible against a sky or terrain background. For Cucamonga WA and San Gabriel WA, a deposition analysis was conducted for nitrogen compounds which considered Project emissions of NOX and conversion of NOX to nitrate and nitric acid. The results from the deposition analysis are presented in Table 8-12.
Table 8-12: Class I Nitrogen Deposition CALPUFF Modeling Results
Class I Area
Maximum Predicted Nitrogen Deposition – Annual average (g/ha/yr)
Deposition Analysis
Threshold (g/ha/yr)
2001 2002 2003
Cucamonga WA 0.496 0.521 0.458 5 San Gabriel WA 0.718 0.396 0.607 5
The Deposition Analysis Threshold was established by the Federal Land Managers, and represents a level below which deposition is deemed to have no adverse effect, and does not require further analysis.47 The maximum deposition rates modeled for PHPP are below the Class I Area Nitrogen Deposition Analysis Threshold of 0.005 kilograms per hectares per year, or below 5 grams per hectare per year (g/ha/yr), and therefore no further deposition analysis is necessary.
9. Additional Impact Analysis
In addition to assessing the ambient air quality impacts expected from a proposed new source, the PSD regulations require that EPA evaluate other potential impacts on 1) soils and vegetation; 2) growth; and 3) visibility impairment. 40 C.F.R. § 52.21(o). The depth of the analysis generally depends on existing air quality, the quantity of emissions, and the
47 “Guidance on Nitrogen and Sulfur Deposition Analysis Thresholds”, Attachment to Letter from Christine L. Shaver, National Park Service and Sandra V. Silva, U.S. Fish and Wildlife Service to S. William Becker, STAPPA/ALAPCO, January 3, 2002 (files DatNotifyLetter.pdf, nsDATGuidance.pdf) http://www.nature.nps.gov/air/Permits/flag/

Palmdale (SE 09-01) Fact Sheet/Ambient Air Quality Impact Report August 2011
66
sensitivity of local soils, vegetation, and visibility in the source's impact area.
9.1 Soils and Vegetation For the soils and vegetation analysis, the applicant considered as part of the impact area the 400 meter significant impact area considered in the initial PSD application for the Project. In the applicant’s July 2010 supplement (Section 5.0), the applicant provided additional information on the vegetation and soils inventory in the project area, a discussion of the potential impacts to those soils and vegetation types with respect to the five Class II areas (within 50 km of the project) discussed in Section 9.2, Visibility Impairment, and a discussion of nitrogen deposition. Also, the applicant noted there are no federal habitat areas of concern within 20 miles of the PHPP. For most types of soils and vegetation, ambient concentrations of criteria pollutants below the secondary NAAQS will not result in harmful effects because the secondary NAAQS are set to protect public welfare, including vegetation, crops, and animals. No harmful effects are expected from this project because the total estimated maximum ambient concentrations presented in Table 9-1 are below the primary NAAQS (listed in Table 8-1 of Section 8) and secondary NAAQS for NO2 (100 µg/m3) and PM2.5 (35 µg/m3 for 24-hour periods; and 15.0 µg/m3 over an annual period). There are no secondary NAAQS for CO. The initial application (dated March 2009) used EPA’s "Screening Procedure for the Impacts of Air Pollution Sources on Plants, Soils and Animals" (1980)48 to determine if maximum modeled ground-level concentrations of NO2 and CO could have an impact on plants, soils, and animals. The modeled impacts of NO2 and CO emissions from the facility, individually, and in addition to the background concentrations of NO2 and CO, are below the minimum impact level for sensitive plants. The following table summarizes information in this regard from the PSD application (Table 6-17, Soils and Vegetation Analysis).
Table 9. 1 Project Maximum Concentrations and EPA Guidance Levels
Criteria Pollutant and Guidance
Averaging Time
EPA Screening Concentration
(µg/m3)
Modeled Maximum Concentrations
(µg/m3)
Modeling Averaging
time NO2 4-Hours 3,760 419.7 1 hour NO2 8-Hours 3,760 419.7 1 hour NO2 1-Month 564 419.7 1 hour NO2 Annual 94 29.2 Annual CO Weekly 1,800,000 1,806.4 8 hour
48 Screening Procedure for the Impacts of Air Pollution Sources on Plants, Soils, and Animals,” EPA 450/2-81-078, December 1980.

Palmdale (SE 09-01) Fact Sheet/Ambient Air Quality Impact Report August 2011
67
As part of the July 2010 supplement regarding additional impacts to vegetation, the applicant also reviewed a document developed by the U.S. Department of Agriculture entitled “A Screening Procedure to Evaluate Air Pollution Effects in Region 1 Wilderness Areas” (1991). As a complement to the EPA 1980 screening procedure document, the applicant determined that for the NOX “sensitive” species of alfalfa, which is found nearby the project, the modeled air concentrations (Table 9-1) demonstrate that the impacts are below the significance criteria. The applicant also considered soil acidification and eutrophication as part of the July 2010 supplement regarding additional impacts on soil. Nitrogen deposition in soil can have beneficial effects to vegetation if they are lacking these elements; however, gaseous emissions impacts on soils at levels greater than vegetation requirements can cause acidic conditions to develop. Soil acidification and eutrophication can occur as a result of atmospheric deposition of nitrogen. The applicant determined that project-specific modeling for nitrogen deposition was not warranted because the estimated nitrogen deposition rates were negligible as a plant growth influence and because the effects of deposition on eutrophication were insignificant, as described below. When considering soil acidification, the applicant referred to the CALPUFF modeling conducted for the PHPP’s Class I analysis. The applicant also referred to the nitrogen deposition modeling analysis (using CALPUFF) performed for a similar project, the Victorville 2 (VV2) Hybrid Power Project.49 CALPUFF incorporates the atmospheric chemistry and chemical transformations to determine nitrogen deposition and provides results in units of kilograms per hectare per year, which can be converted to pounds per unit area. For the VV2 project, the modeled maximum annual deposition rate was considered to be very low. The PHPP is nearly identical to the VV2 hybrid solar-gas plant, with the exception of a larger natural gas-fired auxiliary boiler; the PHPP boiler is 110 MMBtu/hr, while the VV2 boiler is 40 MMBtu/hr. Additionally, the predominant wind direction for PHPP is the northeast of the power block, which is similar to the predominant wind direction for VV2. (There have not been pertinent upgrades to the CALPUFF model since the VV2 2008 analysis.). Because of the similarities between the PHPP and VV2, and VV2’s fence line deposition of 1.2 ounces of nitrogen per acre, the applicant determined that the nitrogen deposition rates for PHPP also would be considered negligible as a plant growth influence, and therefore no additional nitrogen deposition analysis was performed. In sum, based on our consideration of the information and analysis provided by the applicant, we do not believe that emissions associated with the Project will result in adverse impacts on soils or vegetation.
49 EPA Region 9 issued the initial PSD permit to the Victorville 2 Hybrid Power Project in 2010. EPA proposed the PSD permit in 2008, with Docket I.D. number EPA-R09-OAR-2008-0406. (http://www.regulations.gov/#!docketDetail;D=EPA-R09-OAR-2008-0406). The initial PSD permit was issued in 2010 with Docket I.D. number EPA-R09-OAR-2008-0765 (http://www.regulations.gov/#!docketDetail;D=EPA-R09-OAR-2008-0765 )

Palmdale (SE 09-01) Fact Sheet/Ambient Air Quality Impact Report August 2011
68
9.2 Visibility Impairment Using procedures in EPA’s Workbook for Plume Visual Impact Screening and Analysis50, the applicant evaluated visibility impairment for one Class I area and five Class II areas. The five Class II areas included three state parks, one woodland, and one wilderness area. In the initial PSD application, the applicant presented visibility impairment (e.g., plume blight) for the Class I area of San Gabriel Wilderness Area (see Section 8.5.2 of the application), which is located within 50 km of the proposed PHPP. The applicant provided supplemental application information for visibility impairment in July 2010 for five Class II areas identified as potentially sensitive state or federal parks, forests, monuments, or recreation areas within 50 km of the project. These five areas with their approximate closest distances to PHPP were:
• Antelope Valley Indian Museum State Park (23 km) • Saddleback Butte State Park (26 km) • Antelope Valley California Poppy State Reserve (26 km), • Arthur B. Ripley Desert Woodland (37 km), and • Sheep Mountain WA (43 km)
The applicant performed a Level 1 and Level 2 VISCREEN analysis for all five areas. The results of this analysis were below the significance criteria for three of the five areas. A further refinement in VISCREEN of plume perceptibility for the two exceptions – Saddleback Butte State Park and Antelope Valley Indian Museum State Park – was performed for the worst-case daytime meteorological conditions; the result is that the plume would not be perceptible at either site during daylight hours, based on low plume perceptibility and contrast predicted by VISCREEN. Based on the VISCREEN results, w believe that the Project would not contribute to visibility impairment.
9.3 Growth The growth component of the additional impact analysis considers an analysis of general commercial, residential, industrial and other growth associated with the PHPP. 40 C.F.R. § 52.21(o). The PHPP is expected to employ 36 employees, with an ample work force in the Southern California area to accommodate the PHPP estimated peak of 767 construction workers; impacts to the local population and housing needs are therefore expected to be minimal. Therefore, we do not expect this project to result in any significant growth. The applicant provided growth-related information in its initial PSD application and in supplemental application materials submitted to EPA in July 2010 and July 2011. The July 2011 supplement includes Attachment A, which is an updated version of the socioeconomics analysis PHPP prepared for its July 2008 California Energy Commission (CEC) Application for 50 “Workbook for Plume Visual Impact Screening and Analysis (Revised)”, EPA, EPA–454/R–92–023, 1992.
Palmdale (SE 09-01) Fact Sheet/Ambient Air Quality Impact Report August 2011
69
Certification (AFC). The applicant’s original July 2008 CEC AFC socioeconomics analysis was based on 2000 Census data; Attachment A of the July 2011 supplement includes updated information based on the available 2010 Census data regarding population and population growth projections.
The applicant’s initial PSD application growth analysis (Section 6.3.2) stated that “… no long-term growth is expected during project operations.” A Project labor force of 36 employees was estimated. The July 2010 supplement further discussed the Project’s potential growth-inducing activities. Additional details in this supplement included a summary of growth-inducing impacts associated with employment. The information submitted indicates that for the construction and operating phases of the Project, impacts to the population and housing needs are expected to be minimal, and are expected not to induce substantial population growth. With regards to the question of whether the Project’s power generation would induce growth, the applicant anticipates that the Project would likely displace the older once-through cooling facilities in the Southern California region that are expected to be retired in the future. Therefore, rather than induce growth, PHPP would supply energy to accommodate the existing demand and projected growth in the Southern California region. In sum, based on our consideration of the information and analysis provided by the applicant, we do not expect the Project to result in any significant growth.
10. Endangered Species Pursuant to section 7 of the Endangered Species Act (ESA), 16 U.S.C. 1536, and its implementing regulations at 50 C.F.R. Part 402, EPA is required to ensure that any action authorized, funded, or carried out by EPA is not likely to jeopardize the continued existence of any endangered or threatened species or result in the destruction or adverse modification of such species’ designated critical habitat. EPA has determined that this PSD permitting action is subject to ESA section 7 requirements. The applicant and EPA identified two federally-listed species,the desert tortoise Gopherus agassizii) and the arroyo toad (Bufo californica), that might be affected by the proposed PSD permitting action for the Project. In March 2009, a Draft Biological Assessment (BA) was submitted by the applicant to EPA and the U.S. Fish and Wildlife Service (FWS). Based on discussions between the applicant and FWS, in August 2009, the applicant submitted to EPA and FWS an Addendum to the BA. The BA Addendum further detailed that the PHPP “… may affect but is not likely to adversely affect the desert tortoise and will have no effect on the arroyo toad.” In July 2011, the applicant submitted a second Addendum to the BA to EPA and FWS, outlining updates to the Project scope and a further analysis supporting the conclusion that the PHPP may affect, but is not likely to adversely affect, the federally-listed desert tortoise and will have no effect on the federally-listed arroyo toad.

Palmdale (SE 09-01) Fact Sheet/Ambient Air Quality Impact Report August 2011
70
In a letter dated August 5, 2011, EPA requested FWS’s written concurrence with EPA’s determination under ESA section 7 that the proposed PSD permit for the PHPP is not likely to adversely affect the desert tortoise or arroyo toad. EPA will proceed with its final PSD permit decision after making a determination that issuance of the permit will be consistent with ESA requirements. In making this determination, EPA will consider actions taken, or to be taken, by the applicant to ensure ESA compliance.
11. Environmental Justice Analysis Executive Order 12898, entitled “Federal Actions To Address Environmental Justice in Minority Populations and Low-Income Populations,” states in relevant part that “each Federal agency shall make achieving environmental justice part of its mission by identifying and addressing, as appropriate, disproportionately high and adverse human health or environmental effects of its programs, policies, and activities on minority populations and low-income populations.” Section 1-101 of Exec. Order 12898, 59 Fed. Reg. 7629 (Feb. 16, 1994). EPA determined that there may be minority or low-income populations potentially affected by its proposed action on the PHPP PSD permit application, and determined that it would be appropriate to prepare an Environmental Justice Analysis for this action. EPA therefore prepared an Environmental Justice Analysis, which is included in the administrative record for EPA’s proposed PSD permit for the Project. EPA’s analysis concludes that the Project will not cause or contribute to air quality levels in excess of health standards for the pollutants regulated under EPA’s proposed PSD permit for the Project, and that therefore the Project will not result in disproportionately high and adverse human health or environmental effects with respect to these air pollutants on minority or low-income populations residing near the proposed Project, or on the community as a whole.
12. Clean Air Act Title IV (Acid Rain Permit) and Title V (Operating Permit) The applicant must apply for and obtain an acid rain permit and a Title V operating permit. The applicant will apply for these permits after the facility is constructed, as these permits are not required prior to construction. The District has jurisdiction to issue the Acid Rain Permit and the Operating Permit for the facility.
13. Comment Period, Hearing, Public Information Meeting, Procedures for Final Decision, and EPA Contact
Palmdale (SE 09-01) Fact Sheet/Ambient Air Quality Impact Report August 2011
71
The comment period for EPA’s proposed PSD permit for the Project begins on August 11, 2011. Any interested person may submit written comments on EPA’s proposed PSD permit for the Project. All written comments on EPA’s proposed action must be received by EPA via email by September 14, 2011, or postmarked by September 14, 2011. Comments must be sent or delivered in writing to Lisa Beckham at one of the following addresses:
E-mail: [email protected]
U.S. Mail: Lisa Beckham (AIR-3) U.S. EPA Region 9 75 Hawthorne Street San Francisco, CA 94105-3901 Phone: (415) 972-3811
Comments should address the proposed PSD permit and facility, including such matters as:
1. The Best Available Control Technology (BACT) determinations; 2. The effects, if any, on Class I areas; 3. The effect of the proposed facility on ambient air quality; and 4. The attainment and maintenance of the NAAQS.
Alternatively, written or oral comments may be submitted to EPA at the Public Hearing for this matter that EPA will hold on September 14, 2011, pursuant to 40 C.F.R. § 124.12, to provide the public with further opportunity to comment on the proposed PSD permit for the Project. At this Public Hearing, any interested person may provide written or oral comments, in English or Spanish, and data pertaining to the proposed permit. Prior to the Public Hearing, EPA will also hold a Public Information Meeting for the purpose of providing interested parties with additional information and an opportunity for informal discussion of the proposed Project. The date, time and location of the Public Information Meeting and the Public Hearing are as follows: Date: September 14, 2011 Time: 4:00 p.m. - 6:00 p.m. (Public Information Meeting) 7:00 p.m. – 10:00 p.m. (Public Hearing) Location: Larry Chimbole Cultural Center Manzanita Ballroom, 2nd Floor
38350 Sierra Highway Palmdale, California 93550-4611

Palmdale (SE 09-01) Fact Sheet/Ambient Air Quality Impact Report August 2011
72
English-Spanish translation services will be provided at both the Public Information Meeting and the Public Hearing. If you require a reasonable accommodation, by August 31, 2011 please contact Terisa Williams, EPA Region 9 Reasonable Accommodations Coordinator, at (415) 972-3829, or [email protected]. All information submitted by the applicant is available as part of the administrative record. The proposed air permit, fact sheet/ambient air quality impact report, permit application and other supporting information are available on the EPA Region 9 website at http://www.epa.gov/region09/air/permit/r9-permits-issued.html#pubcomment. The administrative record may also be viewed in person, Monday through Friday (excluding Federal holidays) from 9:00 AM to 4:00 PM, at the EPA Region 9 address above. Due to building security procedures, please call Lisa Beckham at (415) 972-3811 at least 24 hours in advance to arrange a visit. Hard copies of the administrative record can be mailed to individuals upon request in accordance with Freedom of Information Act requirements as described on the EPA Region 9 website at http://www.epa.gov/region9/foia/ . Additional information concerning the proposed PSD permit may be obtained between the hours of 9:00 a.m. and 4:00 p.m., Monday through Friday, excluding holidays, from:
E-mail: [email protected] U.S. Mail: Lisa Beckham (AIR-3) U.S. EPA Region 9 75 Hawthorne Street San Francisco, CA 94105-3901 Phone: (415) 972-3811
EPA’s proposed PSD permit for the Project and the accompanying fact sheet/ambient air quality impact report are also available for review at the following locations: Antelope Valley Air Quality Management District, 43301 Division Street, Suite 206, Lancaster, CA 93535, (661) 723-8070; Palmdale City Library, 700 East Palmdale Boulevard, Palmdale, CA 93550-4742, (661) 267-5600; Lancaster Regional Library, 601 W. Lancaster Boulevard, Lancaster, CA 93534-3398, (661) 948-5029; Lake Los Angeles Library, 16921 East Avenue O, Palmdale, CA 93591-3045, (661) 264-0593; and Quartz Hill Library, 42018 N. 50th Street West, Quartz Hill, CA 93536-3590, (661) 943-2454. All comments that are received will be included in the public docket without change and will be available to the public, including any personal information provided, unless the comment includes Confidential Business Information (CBI) or other information whose disclosure is restricted by statute. Information that is considered to be CBI or otherwise protected should be clearly identified as such and should not be submitted through e-mail. If a commenter sends e-mail directly to the EPA, the e-mail address will be automatically captured and included as part of the public comment. Please note that an e-mail or postal

Palmdale (SE 09-01) Fact Sheet/Ambient Air Quality Impact Report August 2011
73
address must be provided with comments if the commenter wishes to receive direct notification of EPA’s final decision regarding the permit. EPA will consider all written and oral comments submitted during the public comment period before taking final action on the PSD permit application and will send notice of the final decision to each person who submitted comments and contact information during the public comment period or requested notice of the final permit decision. EPA will respond to all substantive comments in a document accompanying EPA’s final permit decision and will make the Public Hearing proceedings available to the public. EPA’s final permit decision will become effective 30 days after the service of notice of the decision unless: 1. A later effective date is specified in the decision; or 2. The decision is appealed to EPA’s Environmental Appeals Board pursuant to 40 CFR
124.19; or 3. There are no comments requesting a change to the proposed permit decision, in which
case the final decision shall become effective immediately upon issuance.
14. Conclusion and Proposed Action
EPA is proposing to issue a PSD permit for the PHPP. We believe that the proposed Project will comply with PSD requirements, including the installation and operation of BACT, and will not cause or contribute to a violation of the applicable NAAQS or applicable PSD increments. We have made this determination based on the information supplied by the applicant and our review of the analyses contained in the permit application and other relevant information contained in our administrative record. EPA will make this proposed permit and this Fact Sheet/AAQIR available to the public for review, and make a final decision after considering any public comments on our proposal.