phuse info rapid ii 2016 · 2017-02-27 · § fda launched its medical countermeasure initiative...
TRANSCRIPT
1

§ FDA launched its medical countermeasure initiative (MCMi) in response to a comprehensive, year-long review conducted by the HHS assessing the nation’s ability to respond to public health emergencies
§ Mission: Strengthen and transform the MCM enterprise by augmenting FDA’s activities in review, regulatory science, and policy to expedite its ability to respond to CBRN and EID threat
MCMiOverview
FDAlaunchedtheMCMinitiativetoimproveournation’scapacitytorespondtoCBRNandpandemicthreats
§ Enhance FDA’s product review and approval processes for the highest priority MCMs and related technologies
§ Build the necessary science base for MCM regulatory review and identify clear, efficient regulatory pathways for developing critical MCMs
§ Modernize the legal, regulatory, and policy framework to facilitate MCM development and ensure an effective public health response
ThreePillarStrategy
2

RAPID Biosurveillance System
Tier 1: Regulatory Action/Guidance§FDA and external partners issue guidance to ensure patient safety
Tier 2: Data Visualization§Dashboards summarizing key information provide safety alerts§Disproportionality metrics and detailed analyses allow FDA and collaborators to understand emerging issues
Tier 3: Data Management & Analytics§RAPID data is combined with existing MedWatch and Medwatcherreports and data from external collaborators§Advanced analytics support AE signal detection
Tier 4: Processing of Adverse Events§Healthcare professionals submit AE data via the RAPID mobile app§AE data is stored in a “data lake” to support real-time access
Thecloud-basedRAPIDBio-surveillanceSystemwillsupportcollaborationbetweenFDAandotherFederalagenciestoenhancemonitoringemerginghealththreats
medwather
Drug
Shortage

FDArequiresareal-timeactivesurveillanceapplicationtosupportpharmacovigilanceandadverseeventreportinginMCMsituation
4Real-time Application for Portable Interactive Device (RAPID) will facilitate the real-time collection, analysis, and communication of MCM product and health information during national public health emergencies
4Flexible Mobile platform to use during MCM events
4Flexible FDA cloud design complementary to FAERS
4Adaptable data management and analysis system
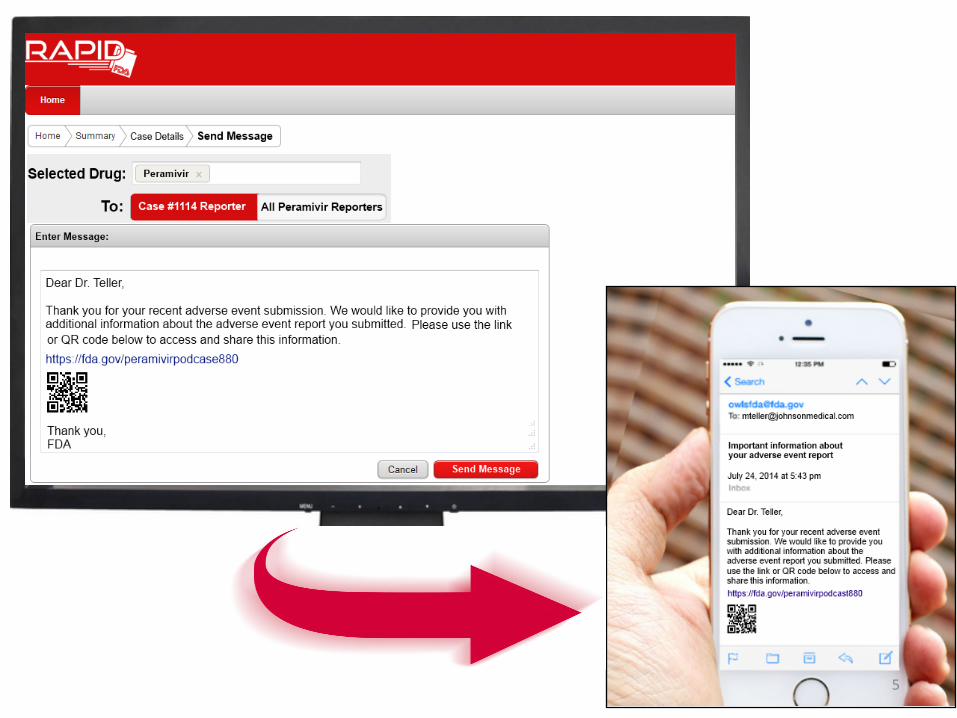
4Bidirectional CDER multimedia communications
4Decision maker data work bench
TheSolution
4
5

RAPIDMOBILEAPPS
RAPIDCLOUDENVIRONMENT
RAPIDANALYTICALTOOLS
Cloud Infrastructure•Farhan Khan•Accenture/AWS Team
Security•Kristen Wayne (CISO)
MedDRA / Data SMEs•Sonja Brajovic•Roger Goetsch•Krishna Chary (E2B)•Mitra Roca (HL7)
Web Services, Database, Dashboards, Empirica, ArcGIS•FDA RAPID Contractor Team
FDA RAPID LEADERSHIP•Dr. Henry Francis•Richard Zhang•Bruce Weaver
FDA RAPID Team•Joseph Tonning, Thomas Ly, Sanjay Sahoo, Suranjan De
FDA RAPID Contractor Team: Booz Allen Hamilton, Project Manager Lauren Neal
NIH National Library of Medicine: George Thoma, Sameer Antani, Stacey Arnesen, Whitney Quesenbery
Office of Communications•Paul Buckman•Sherunda Lister•Mary Kremzer•Catherine Chew
Geovisualization•Martha O’Connor•Wayne Gorski•Nathan Beck•Newland Agbenowosi (RAPID Contractor Team)
Empirica (Signal Detection)•Ana Szarfman•Michael Johnston•Luda Gittes (RAPID Contractor Team)
1
3
4
5
2
1
2
3
4
5Mobile Data Collection: Clinicians, Reporters, and Patients enter AE information, attach digital files (ex. photo), capture geolocation, and respond to REMS survey
Data Transferred to FDA: Data is submitted from mobile device and sent over Cellular network or WiFi to FDA’s Cloud Environment via web services
Data Processed in Cloud: Data is processed and stored in FDA Cloud. Adhering to FDA Security and Data best practices. Dashboards provide leadership, comm staff and QC views into AE Data
Response Sent to Reporter: Within 24 hours a targeted response is sent via email containing link to digital file (ie, Podcast) with additional information
Perform Analytics : Utilize RAPID Dashboard, ArcGIS (location-based analysis) , and Empirica (signal detection) for analysis
VisualLookatRAPIDStakeholders
DRISK•Amarilys Vega with Cynthia LaCivita
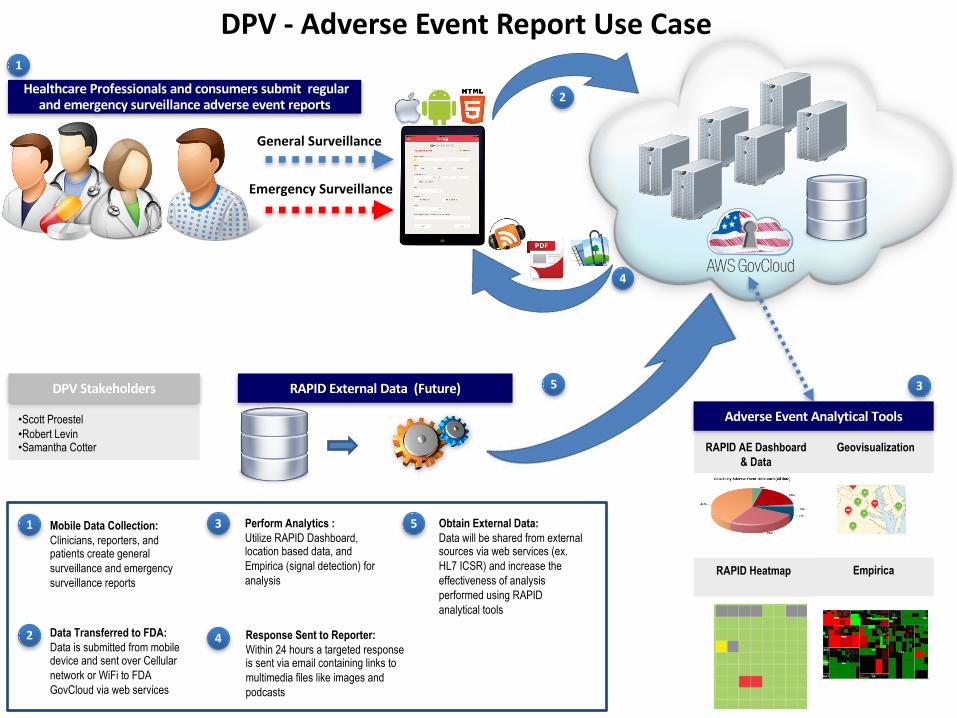
DPV•Scott Proestel and Robert Levin
DMEPA•Jo Wyeth
RAPID Dashboard & Data•OSE•USCIITG•RAPID Contractor Team
RAPIDEXTERNALDATASOURCES 6
6 Obtain External Data: Data will be shared from external sources via web services (ex. HL7 ICSR) and increase the effectiveness of analysis performed using RAPID analytical tools
AdverseEventAnalyticalTools•Scott Proestel•Robert Levin•Samantha Cotter
3
DPV- AdverseEventReportUseCase
DPVStakeholders
HealthcareProfessionalsandconsumerssubmitregularandemergencysurveillanceadverseeventreports
1
2
4
Geovisualization
Empirica
RAPID AE Dashboard & Data
General Surveillance
Emergency Surveillance
RAPIDExternalData(Future) 5
1
2
3
4
5Mobile Data Collection: Clinicians, reporters, and patients create general surveillance and emergency surveillance reports
Data Transferred to FDA: Data is submitted from mobile device and sent over Cellular network or WiFi to FDA GovCloud via web services
Response Sent to Reporter: Within 24 hours a targeted response is sent via email containing links to multimedia files like images and podcasts
Perform Analytics : Utilize RAPID Dashboard, location based data, and Empirica (signal detection) for analysis
Obtain External Data: Data will be shared from external sources via web services (ex. HL7 ICSR) and increase the effectiveness of analysis performed using RAPID analytical tools
RAPID Heatmap
REMSProgramDashboard
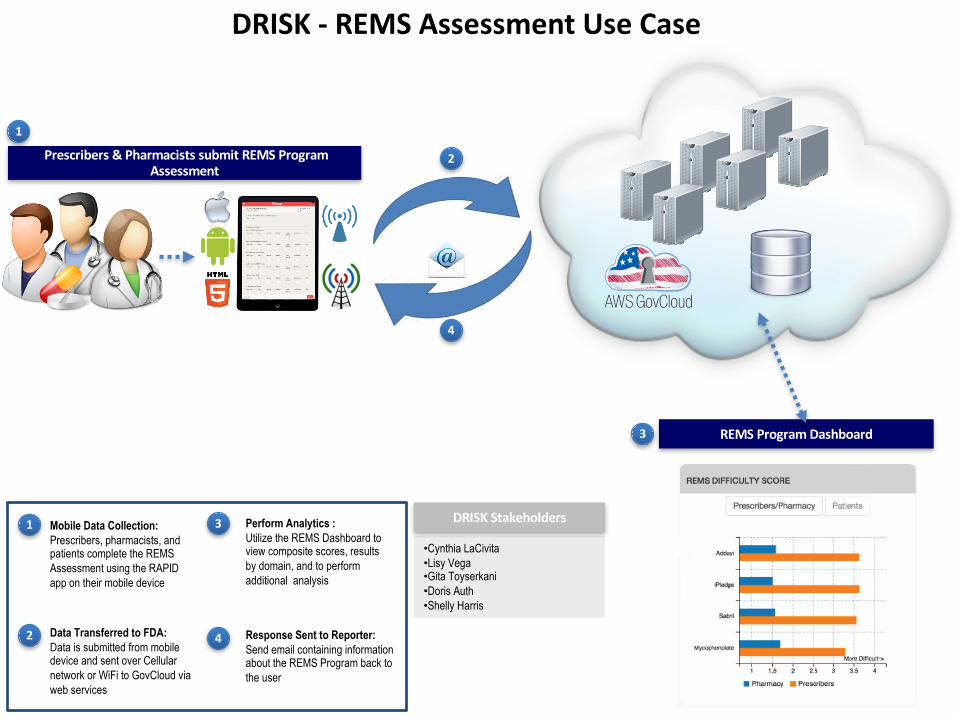
•Cynthia LaCivita•Lisy Vega•Gita Toyserkani•Doris Auth•Shelly Harris
3
1
2
3
4
Mobile Data Collection: Prescribers, pharmacists, and patients complete the REMS Assessment using the RAPID app on their mobile device
Data Transferred to FDA: Data is submitted from mobile device and sent over Cellular network or WiFi to GovCloud via web services
Perform Analytics : Utilize the REMS Dashboard to view composite scores, results by domain, and to perform additional analysis
Response Sent to Reporter: Send email containing information about the REMS Program back to the user
DRISK- REMSAssessmentUseCase
DRISKStakeholders
Prescribers&PharmacistssubmitREMSProgramAssessment
1
2
4
MedicationErrorDashboard
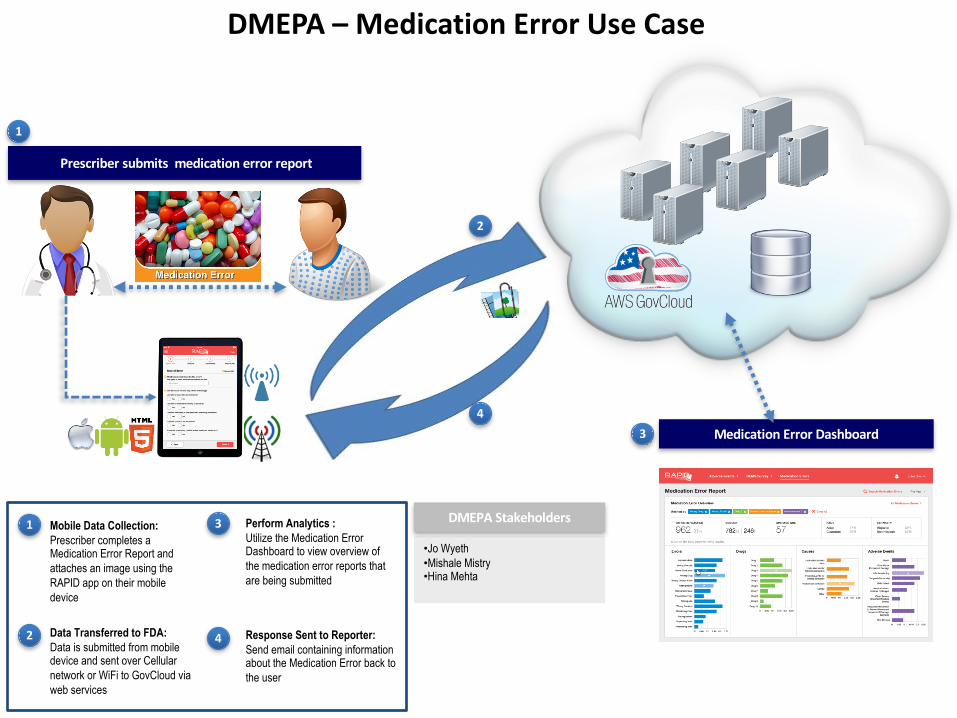
•Jo Wyeth•Mishale Mistry•Hina Mehta
3
1
2
3
4
Mobile Data Collection: Prescriber completes a Medication Error Report and attaches an image using the RAPID app on their mobile device
Data Transferred to FDA: Data is submitted from mobile device and sent over Cellular network or WiFi to GovCloud via web services
Perform Analytics : Utilize the Medication Error Dashboard to view overview of the medication error reports that are being submitted
Response Sent to Reporter: Send email containing information about the Medication Error back to the user
DMEPA– MedicationErrorUseCase
DMEPAStakeholders
Prescribersubmitsmedicationerrorreport
1
2
4

DukeUniversityMedicalCenter BrighamandWomen’sHospital UniversityofSouthernCaliforniaHospital UniversityofMarylandMedicalCenter
Triggerexamples:influenzaorder,bloodcultureorder,sputumcultureorder,CXRorder(ESP)SafetyorClinicaldata
SecureDataBrokerHHS&BoozAllenHamilton
DataAggregated&De-identified
SmartonFHIRAPIClinicalDataElementProfileforSevere
AcuteRespiratoryInfectiondataelements
Geolocation,caseandsitereporting,resourcedeploymentoverlay
ClinicalRegistrycaselevelandpatientlevelVisualizationlayerwith
streamingdataforresearchcaseandpatientlevel
Regulatory-caselevelorpatientlevel
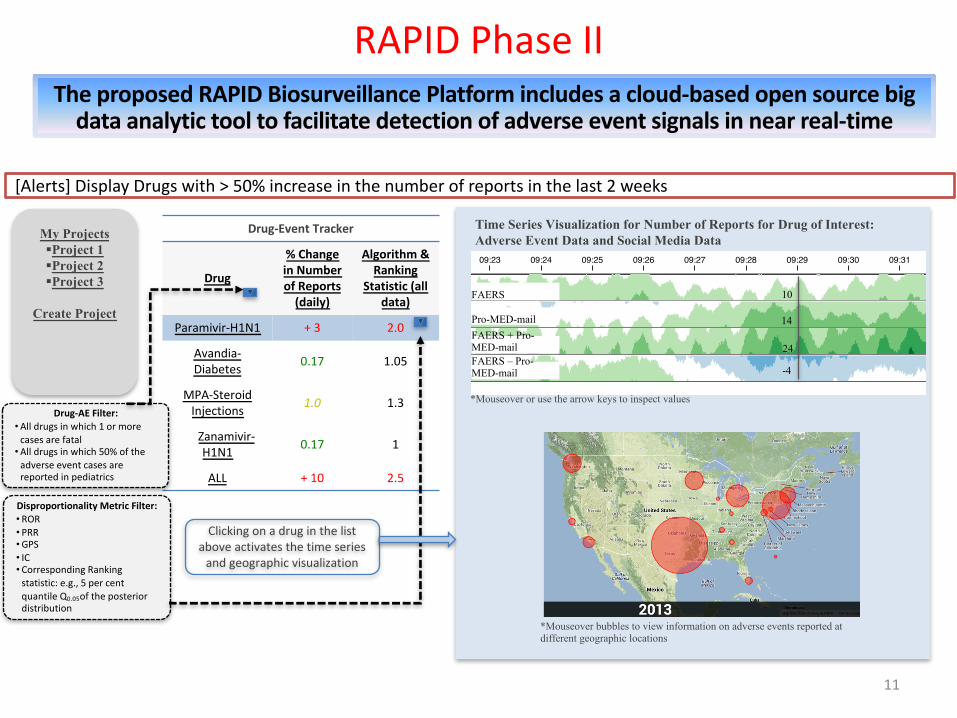
RAPIDPhaseIITheproposedRAPIDBiosurveillance Platformincludesacloud-basedopensourcebigdataanalytictooltofacilitatedetectionofadverseeventsignalsinnearreal-time
[Alerts]DisplayDrugswith>50%increaseinthenumberofreportsinthelast2weeks
My Projects§Project 1§Project 2§Project 3
Create Project
Drug-EventTracker
Drug
%ChangeinNumberofReports(daily)
Algorithm&Ranking
Statistic(alldata)
Paramivir-H1N1 +3 2.0
Avandia-Diabetes 0.17 1.05
MPA-SteroidInjections 1.0 1.3
Zanamivir-H1N1 0.17 1
ALL +10 2.5
Cubism.jsTime Series Visualization
Cubism.js is a D3 plugin for visualizing time series. Use Cubism to construct better realtimedashboards, pulling data from Graphite, Cube and other sources. Cubism is available under theApache License on GitHub.
Scalable
Cubism fetches time series data incrementally: after the initial display, Cubism reduces server loadby polling only the most recent values. Cubism renders incrementally, too, using Canvas to shiftcharts one pixel to the left. This approach lets Cubism scale easily to hundreds of metrics updatingevery ten seconds! Despite asynchronous fetching, rendering is synchronized so that charts updatesimultaneously, further improving performance and readability.
Effective
Cubism also scales in terms of perception: small multiples aligned by time facilitate rapidcomparison. Cubism’s horizon charts make better use of vertical space than standard area charts,allowing you to see many more metrics at-a-glance and increasing the likelihood of discovery. If youcompress a 120-pixel tall area chart to 30 pixels, you lose 75% of the resolution and it becomesharder to see small changes:
In contrast, horizon charts reduce vertical space without losing resolution. Larger values areoverplotted in successively darker colors, while negative values are offset to descend from the top.As you increase the number of colors, you reduce the required vertical space:
Mouseover or use the arrowkeys to inspect values.Open in a new window.
09:23 09:24 09:25 09:26 09:27 09:28 09:29 09:30 09:31 09:32 09:33 09:34 09:35 09:36 09:37 09:38
foofoo 3.13.1
barbar 8.68.6
foo + barfoo + bar 1212
foo - barfoo - bar −5.5−5.5
Area (120px)Area (120px) 3.13.1
Area (30px)Area (30px) 3.13.1
Horizon, 1-band (120px)Horizon, 1-band (120px) 3.13.1
Cubism.js http://square.github.io/cubism/
1 of 2 12/22/13 9:38 PM
Time Series Visualization for Number of Reports for Drug of Interest: Adverse Event Data and Social Media Data
FAERS
Pro-MED-mailFAERS + Pro-MED-mailFAERS – Pro-MED-mail
*Mouseover or use the arrow keys to inspect values
10
14
24
-4
*Mouseover bubbles to view information on adverse events reported at different geographic locations
Drug-AEFilter:•Alldrugsinwhich1ormorecasesarefatal
•Alldrugsinwhich50%oftheadverseeventcasesarereportedinpediatrics
DisproportionalityMetricFilter:• ROR• PRR•GPS• IC• CorrespondingRankingstatistic:e.g.,5percentquantile Q0.05oftheposteriordistribution
Clickingonadruginthelistaboveactivatesthetimeseriesandgeographicvisualization
11
RAPIDIISummary
• Bidirectionalcloudbasedsystem• Capableofrealtimeinformationandanalytics• Flexibledataandanalyticplatform• Beginningmultimediainformationanalysis• Keyissues
– Whoownsthedata?– Howwouldthetransdisciplinarygroupwork?– Whatdata,notquantityofdataisimportant?