phx report nicholls state university
TRANSCRIPT

CFA Institute Research Challenge
Hosted by: CFA Societies Texas, Louisiana, and Oklahoma
Local Challenge-‐ Southwest US Nicholls State University
CFA, Student Research Panhandle Oil and Gas Inc. (PHX)
1
Key Data ($ Amounts in Millions)
2014 2015E 2016E 2017E 2015 (Worst case)
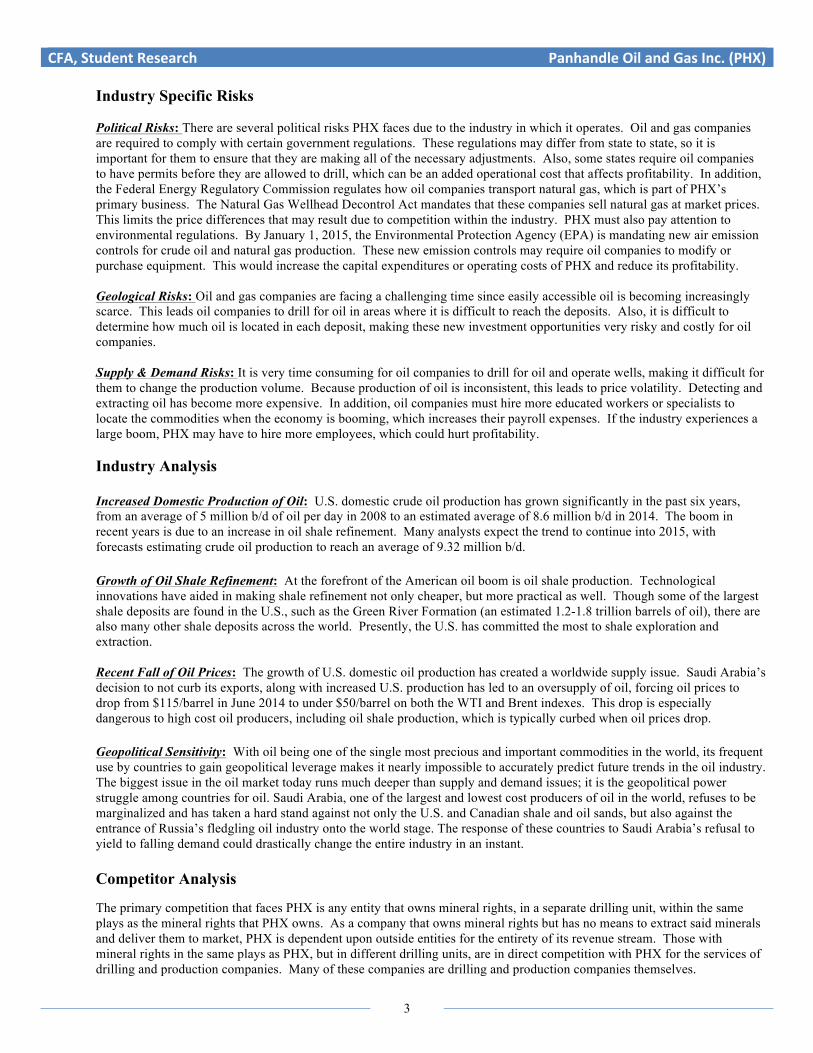
ROA (%) 10.14% 5.24% 7.75% 9.49% -1.13% ROE (%) 20.98% 9.50% 12.45% 13.41% -2.33% Total Revenue $84.41 $60.82 $71.16 $78.27 $33.89 Earnings Before Taxes $36.82 $18.01 $26.43 $32.25 -$2.77 Net Income $25.00 $12.23 $17.95 $21.90 -$2.77
Source: Mergent & Team’s Estimates Highlights:
• Unique Business Model – PHX has a very unique business model. No other publicly traded oil and gas company uses the same business model as PHX. PHX primarily focuses its efforts on the acquisition of mineral acreage and its subsequent development. PHX relies on other companies to drill and operate wells located on its land. By operating under this unique model, PHX is able to cut many operating expenses that its competitors must pay in order to operate. The downside to this model is that PHX must rely on outside entities, over which it has no control, to deliver its wares to market. It is also difficult to compare PHX to others who operate in the oil and gas industry because PHX has much smaller revenues than traditional oil and gas companies.
• Geopolitical Sensitivity of Oil – Oil drives the world’s economy. It is the single most important commodity on earth and is frequently used by major world powers as a tool of strong-armed diplomacy. Thus, the constant fluctuations of the geopolitical landscape could send shocks rippling through not only the oil industry, but could potentially rock worldwide financial markets overnight.
• Volatility in the Industry – The supply and demand for oil and gas is very volatile and unpredictable. Global and macroeconomic factors affect supply and demand, as well as the price of oil. These oil prices can change drastically in a short period of time, making it difficult for PHX to forecast its expected production and revenue.
• Mineral Legacy – One of PHX’s biggest strengths is the mineral legacy upon which it was built. A large portion of the mineral acreage owned by the company was purchased during the height of the Great Depression. PHX owns mineral rights that would be prohibitively expensive to purchase today. Since PHX does not have to pay royalties to land owners, it receives higher returns compared to a typical company (Appendix 16). This gives PHX a competitive advantage.
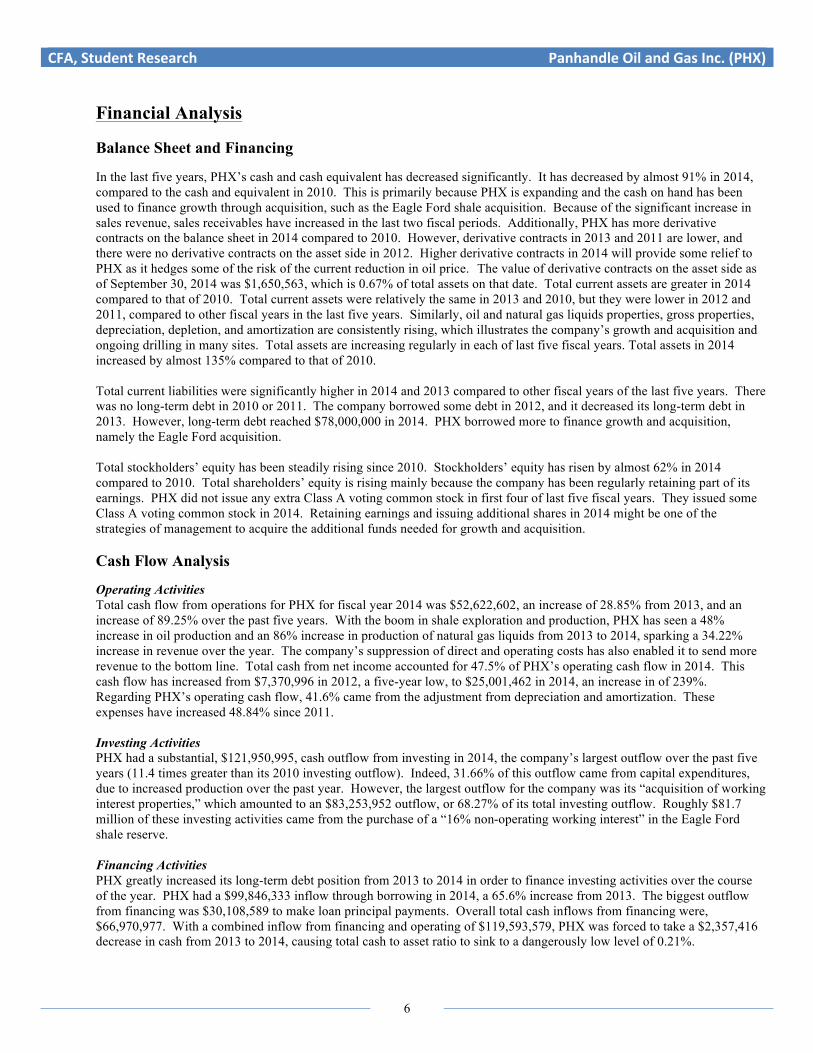
PHX Stock Performance (12-Months)
Company Name & Ticker: Panhandle Oil and Gas Inc. (NYSE: PHX) Sector: Basic Materials Industry: Independent Oil & Gas Recommendation: HOLD Price: $22.68 (as of 2/3/15) Target Price: $24.35 (7.36% increase) Date: February 4, 2015
Market Profile (2/3/15) 52 Week Range ($/share) 15.68-34.45 Average Daily Volume (3m) 108,540 Beta 0.41 Dividend Yield 0.70% Shares Outstanding 16.49M Market Capitalization ($) 374.84M Institutional Holdings (%) 47% Insider Holdings (%) 6.14% Short Interest (% of Float) 2.60% Earnings Per Share (ttm) $1.50
This report is published for educational purposes only by students competing in the CFA Institute Research Challenge.
Source: FactSet

CFA, Student Research Panhandle Oil and Gas Inc. (PHX)
2
Business Description Panhandle Oil and Gas, Inc. (PHX) is headquartered in Oklahoma City, Oklahoma and was incorporated in Range, Texas County in the Oklahoma Panhandle in 1926. The company, originally called Panhandle Cooperative Royalty Company, operated as a co-op until 1979 when it began being publicly traded. The company’s name was changed to Panhandle Oil and Gas, Inc. in 2007. PHX is engaged in the acquisition, management, and development of non-operated oil and natural gas properties, with holdings primarily located in Oklahoma. PHX has properties in eleven states. Most of PHX’s revenues come from the production and sale of oil, natural gas, and natural gas liquids.
Strategy and Core Products PHX does not operate any wells on its properties, but it does have active working interest or royalty interest in some wells. Large independent oil and gas companies operate these wells. This allows PHX to choose the projects in which to participate and the extent of involvement. It also allows PHX to focus on discovering the minerals on its properties, while other companies must employ personnel to operate wells. This reduces risk and overhead costs for PHX, and it is able to employ relatively few employees. When PHX has a working interest in a well, it funds a share of the cost to drill, complete, and operate the well. In return, PHX receives a proportionate share of production revenues. When PHX has royalty interest in a well, it does not fund any drilling costs and therefore receives a smaller proportionate share of production revenues compared to wells in which it has a working interest.
PHX owned 255,190 net mineral acres as of September 30, 2014. Land is the primary raw material for PHX; however, it also leases land. PHX had active working or royalty interest in 6,019 oil and natural gas producing wells and 95 wells being tested for production at the end of fiscal year 2014. PHX’s principal products are natural gas, crude oil, and natural gas liquids. PHX has more reserves in natural gas as compared to oil. Therefore, most of its revenues are related to natural gas. PHX’s natural gas, oil, and natural gas liquids are sold by well operators, who sell to pipeline and marketing companies in surrounding areas. Currently, PHX is focusing its capital expenditures and working interests on unconventional resource plays on its properties in the southeast Oklahoma Woodford shale, the Arkansas Fayetteville shale, the Anadarko Cana Woodford shale, and the horizontal Anadarko Basin Granite Wash. In 2014, PHX purchased a 16% non-operating working interest of 1,775 net leasehold acres in the oil-rich Eagle Ford Shale in South Texas.
Management Management's goal for PHX is to maximize stock value for investors by continuing to allocate capital spending to non-operated drilling projects and acquisitions with the highest possible rates of return. These high return projects are often unconventional resource plays on PHX’s mineral acreage. This decision is made and reinforced by PHX’s President, CEO, and Director, Michael C. Coffman. Mr. Coffman has worked with companies in the oil and gas industry since 1975. Mr. Coffman has been an executive at PHX since 1990. Mr. Coffman also works closely with Paul F. Blanchard, Jr., PHX’s Senior Vice President and COO. Mr. Blanchard has been COO at PHX since 2009, and he held upper management positions at other oil and gas companies before coming to PHX.
Industry Overview & Competitive Positioning
Macroeconomic Analysis The state of the economy in the U.S. has been steadily improving since the end of the Great Recession in 2009. According to the Bureau of Economic Analysis, real gross domestic product (GDP) increased at an annual rate of 3.9% in the third quarter of 2014. As GDP continues to rise, consumers will have more disposable income. This is a positive sign for PHX since consumers will not be as concerned about their spending on gas and oil. The unemployment rate has been steadily declining. This indicates that the economy is expanding and that PHX will benefit from greater demand from its customers. The Michigan Consumer Sentiment Index determined that consumer sentiment was at 98.1 in January of 2015, the highest level in eleven years. This increase indicates that consumers are very optimistic about the economy and will likely increase their purchases of goods and services. Also, the Affordable Care Act, which fully goes into effect in 2015, mandates that companies with more than 50 employees must provide health insurance. This act will not greatly affect PHX because it currently has only 22 employees. This may give PHX an advantage over its larger competitors who must comply with the new regulations. PHX may also be affected by changes in market interest rates. As of 2014, PHX had drawn a little over $78 million from a revolving loan it has with the Bank of Oklahoma. If market interest rates increase, it could greatly affect the future potential profitability of PHX by making it more expensive for the company to borrow money or invest in large capital projects.
CFA, Student Research Panhandle Oil and Gas Inc. (PHX)
3
Industry Specific Risks Political Risks: There are several political risks PHX faces due to the industry in which it operates. Oil and gas companies are required to comply with certain government regulations. These regulations may differ from state to state, so it is important for them to ensure that they are making all of the necessary adjustments. Also, some states require oil companies to have permits before they are allowed to drill, which can be an added operational cost that affects profitability. In addition, the Federal Energy Regulatory Commission regulates how oil companies transport natural gas, which is part of PHX’s primary business. The Natural Gas Wellhead Decontrol Act mandates that these companies sell natural gas at market prices. This limits the price differences that may result due to competition within the industry. PHX must also pay attention to environmental regulations. By January 1, 2015, the Environmental Protection Agency (EPA) is mandating new air emission controls for crude oil and natural gas production. These new emission controls may require oil companies to modify or purchase equipment. This would increase the capital expenditures or operating costs of PHX and reduce its profitability. Geological Risks: Oil and gas companies are facing a challenging time since easily accessible oil is becoming increasingly scarce. This leads oil companies to drill for oil in areas where it is difficult to reach the deposits. Also, it is difficult to determine how much oil is located in each deposit, making these new investment opportunities very risky and costly for oil companies. Supply & Demand Risks: It is very time consuming for oil companies to drill for oil and operate wells, making it difficult for them to change the production volume. Because production of oil is inconsistent, this leads to price volatility. Detecting and extracting oil has become more expensive. In addition, oil companies must hire more educated workers or specialists to locate the commodities when the economy is booming, which increases their payroll expenses. If the industry experiences a large boom, PHX may have to hire more employees, which could hurt profitability.
Industry Analysis Increased Domestic Production of Oil: U.S. domestic crude oil production has grown significantly in the past six years, from an average of 5 million b/d of oil per day in 2008 to an estimated average of 8.6 million b/d in 2014. The boom in recent years is due to an increase in oil shale refinement. Many analysts expect the trend to continue into 2015, with forecasts estimating crude oil production to reach an average of 9.32 million b/d. Growth of Oil Shale Refinement: At the forefront of the American oil boom is oil shale production. Technological innovations have aided in making shale refinement not only cheaper, but more practical as well. Though some of the largest shale deposits are found in the U.S., such as the Green River Formation (an estimated 1.2-1.8 trillion barrels of oil), there are also many other shale deposits across the world. Presently, the U.S. has committed the most to shale exploration and extraction. Recent Fall of Oil Prices: The growth of U.S. domestic oil production has created a worldwide supply issue. Saudi Arabia’s decision to not curb its exports, along with increased U.S. production has led to an oversupply of oil, forcing oil prices to drop from $115/barrel in June 2014 to under $50/barrel on both the WTI and Brent indexes. This drop is especially dangerous to high cost oil producers, including oil shale production, which is typically curbed when oil prices drop. Geopolitical Sensitivity: With oil being one of the single most precious and important commodities in the world, its frequent use by countries to gain geopolitical leverage makes it nearly impossible to accurately predict future trends in the oil industry. The biggest issue in the oil market today runs much deeper than supply and demand issues; it is the geopolitical power struggle among countries for oil. Saudi Arabia, one of the largest and lowest cost producers of oil in the world, refuses to be marginalized and has taken a hard stand against not only the U.S. and Canadian shale and oil sands, but also against the entrance of Russia’s fledgling oil industry onto the world stage. The response of these countries to Saudi Arabia’s refusal to yield to falling demand could drastically change the entire industry in an instant.
Competitor Analysis The primary competition that faces PHX is any entity that owns mineral rights, in a separate drilling unit, within the same plays as the mineral rights that PHX owns. As a company that owns mineral rights but has no means to extract said minerals and deliver them to market, PHX is dependent upon outside entities for the entirety of its revenue stream. Those with mineral rights in the same plays as PHX, but in different drilling units, are in direct competition with PHX for the services of drilling and production companies. Many of these companies are drilling and production companies themselves.

CFA, Student Research Panhandle Oil and Gas Inc. (PHX)
4
Others range from small family holdings to large private trusts. As PHX is unique in its business model, there are no comparable public entities.
Porter’s Five Forces Analysis Threat of New Entrants – The threat of new entrants in the oil and gas industry is low. Barriers to entry are high. Capital requirements are high in the oil and gas industry because the equipment used in oil and gas exploration is costly. New entrants must have access to the land required to extract oil and gas. Specialized workers may also be required for certain aspects of oil and gas exploration, and people with these credentials may be difficult to find. New entrants must have large amounts of funding in order to compete with established oil companies in the industry. Also, there are strict government regulations to follow in the oil and gas industry, which presents another obstacle for new entrants. This is positive for PHX because the low threat of new entrants should prevent new companies from entering the industry and increasing competition. Bargaining Power of Suppliers – Bargaining power of suppliers is moderate. There are few suppliers of equipment for oil and gas exploration, so they have the ability to control prices and make companies pay a premium, specifically small companies. Large and powerful companies control the majority of market share in the oil industry. These companies have more control over the prices they receive from suppliers compared to smaller companies. Suppliers do not want to lose business with the large companies, so they will adjust their prices to satisfy these customers. Suppliers have more control over the prices they give to PHX because of its smaller size compared to other companies in the industry. Bargaining Power of Buyers – The bargaining power of buyers is moderate. Oil and gas are commodity products, so buyers have the opportunity to shop around for the lowest prices. It is also possible for buyers to negotiate contracts with oil companies to receive the lowest price. The power of buyers is lessened because they do not have control over prices in the overall oil and gas market. Macroeconomic and industry factors primarily influence oil prices. Threat of Substitutes – Currently, the threat of substitutes for the oil and gas industry is low. Substitutes for oil and gas when used for power supply include wind, solar, and nuclear power; hydroelectricity; and coal. While these methods of power are becoming more accepted in today’s society, they have not taken over a major piece of the oil and gas industry’s market. These methods are still costlier and have not yet been developed to perform well in a majority of applications. These alternative power sources could become more of a threat in the future, but oil and gas is currently the most prominent method for power. Oil is also used in manufacturing products like plastics and rubber, and successful alternative manufacturing inputs for these products have not yet been found. Threat of Existing Rivalry – The threat of existing rivalry in the oil and gas industry is high. Oil and gas are both commodity products, and a few companies control the majority of the oil and gas industry. This leads to high competition and lower gross margins for oil and gas companies because of low customer switching costs. There are also high fixed costs and high exit barriers. Equipment for oil and gas extraction requires a significant amount of capital, and the equipment usually cannot be repurposed for other jobs if a company was to leave the industry. The high rivalry in the industry can be a major issue for small oil and gas companies like PHX, particularly because large companies control so much of the market.
SWOT Analysis
Strengths Growing Revenues: PHX’s revenue has been consistently increasing since 2012. If the fiscal year ended 9/30/12 is considered the base year, PHX’s revenue increased by 48.48% in 2013 and 102.96% in 2014, compared to the revenue of 2012. This can be attributed to an increase in production. Consequently, net income is increasing, which can be retained to further finance growth. Reasonable Debt Level: In each of the last three fiscal years, PHX’s debt is lower than the company’s equity. PHX’s debt-to-equity ratio is lower than the industry average. PHX has been able to meet its interest obligation easily using its operating income. Considering the current glut of oil and free fall of oil prices, less debt has put PHX in a safer position. The Independent Oil and Gas industry’s total debt/equity ratio is 62.5x, whereas PHX’s total debt to equity is 1.07x. If PHX’s debt were as high as the industry average, current oil prices could have broken PHX. PHX should be able to pay its current interest obligation using the income from natural gas and natural gas liquids.

CFA, Student Research Panhandle Oil and Gas Inc. (PHX)
5
Major Customers: In the last three years, PHX has had two or three major customers, each of which purchased 10-20% of PHX’s total oil production. The company is confident that if one customer discontinues its business with PHX, several new purchasers can be found without much deviation in sales price. This customer concentration appears to be a small risk. Lack of Drilling Equipment: PHX relies on outside drilling companies to reach and extract minerals from its owned and leased land (Appendix 16, 17). PHX does not have to maintain costly drilling, finishing, or production equipment. In the event of a downturn, PHX is not required to depreciate costly, unused equipment.
Weaknesses Small Capital Structure: Since PHX is far smaller than its competitors, it has a hard time competing financially with the big companies in the industry. When PHX is profitable, it mainly uses its operating cash flow to finance acquisitions, exploration, development, and production. PHX seldom uses a credit facility. As product price, acquisition costs, and equipment costs fluctuate, PHX may not have a second line of defense to immediately deal with these situations. Limited Employees: As of the fiscal year ending 9/30/2014, PHX had 22 employees. The company is growing, and it might need more employees to sustain its growth. However, expert and professional employees may not be readily available. Further, PHX must compete with large companies in the industry to retain the best employees. Limited Influence on Property: PHX does not operate its own wells in which it has interest. Consequently, PHX cannot exercise full influence on those properties. PHX’s reliance on third-party well operators’ verdicts and expertise can result in higher costs and unexpected or extra expenses. Lack of Drilling Equipment: PHX relies on outside drilling companies to reach, and eventually extract, minerals from its owned and leased land. As a result, PHX does not have the ability to gain access to its primary revenue stream without outside assistance. In the event of an uptick, PHX will be forced to wait for those outside organizations’ equipment to become available before being able to bring its wares to market.
Opportunities Venture Capital: The growth that PHX has been enjoying over last few years may entice a venture capital firm to make an investment. This can be a way to generate additional funding for the company’s growth and dissemination. New Markets: PHX is fairly small and operates in limited markets, mainly in the areas where its wells are located. PHX has ample room for growth given that it has sufficient funding. Mergers: Since PHX has been performing better every year, big companies might be interested in a merger with PHX. In doing so, PHX will not only have better access to capital, but it will also have access to more expertise and a broader marketplace. PHX might be a subsidiary of a big firm, but it would still operate as a sovereign company.
Threats Competitive Business Conditions: The areas of oil and natural gas acquisition, development, exploration, and production are intensely competitive in both the global and national spectrum. PHX has to compete against powerful companies to get desired producing properties and skilled human capital to conduct new exploration. PHX must compete to utilize the properties effectively and efficiently. Moreover, a significant number of PHX’s competitors are stronger financially. Some of its competitors are even fully integrated oil and gas companies. Volatile Prices: The national and international economic, political, and regulatory conditions can alter the price of oil. The volatility of prices can adversely impact PHX’s profitability, which can affect the company’s stock price. The prices of oil, natural gas liquids, and natural gas have been historically volatile and are expected to be volatile in forthcoming days as well. Current market conditions reflect adequate evidence to demonstrate the price volatility of oil. Legislation: Emission of greenhouse gases, such as methane and carbon dioxide, can adversely affect the environment. Therefore, federal and state governments have been evaluating, and in some cases implementing, climate related legislation to limit the emission of such greenhouse gases. Such limitations might require PHX to install new technology or incorporate modifications to limit greenhouse gases. The new rules might be costly because of increased capital and operating expenditures.
CFA, Student Research Panhandle Oil and Gas Inc. (PHX)
6
Financial Analysis Balance Sheet and Financing In the last five years, PHX’s cash and cash equivalent has decreased significantly. It has decreased by almost 91% in 2014, compared to the cash and equivalent in 2010. This is primarily because PHX is expanding and the cash on hand has been used to finance growth through acquisition, such as the Eagle Ford shale acquisition. Because of the significant increase in sales revenue, sales receivables have increased in the last two fiscal periods. Additionally, PHX has more derivative contracts on the balance sheet in 2014 compared to 2010. However, derivative contracts in 2013 and 2011 are lower, and there were no derivative contracts on the asset side in 2012. Higher derivative contracts in 2014 will provide some relief to PHX as it hedges some of the risk of the current reduction in oil price. The value of derivative contracts on the asset side as of September 30, 2014 was $1,650,563, which is 0.67% of total assets on that date. Total current assets are greater in 2014 compared to that of 2010. Total current assets were relatively the same in 2013 and 2010, but they were lower in 2012 and 2011, compared to other fiscal years in the last five years. Similarly, oil and natural gas liquids properties, gross properties, depreciation, depletion, and amortization are consistently rising, which illustrates the company’s growth and acquisition and ongoing drilling in many sites. Total assets are increasing regularly in each of last five fiscal years. Total assets in 2014 increased by almost 135% compared to that of 2010.
Total current liabilities were significantly higher in 2014 and 2013 compared to other fiscal years of the last five years. There was no long-term debt in 2010 or 2011. The company borrowed some debt in 2012, and it decreased its long-term debt in 2013. However, long-term debt reached $78,000,000 in 2014. PHX borrowed more to finance growth and acquisition, namely the Eagle Ford acquisition.
Total stockholders’ equity has been steadily rising since 2010. Stockholders’ equity has risen by almost 62% in 2014 compared to 2010. Total shareholders’ equity is rising mainly because the company has been regularly retaining part of its earnings. PHX did not issue any extra Class A voting common stock in first four of last five fiscal years. They issued some Class A voting common stock in 2014. Retaining earnings and issuing additional shares in 2014 might be one of the strategies of management to acquire the additional funds needed for growth and acquisition.
Cash Flow Analysis Operating Activities Total cash flow from operations for PHX for fiscal year 2014 was $52,622,602, an increase of 28.85% from 2013, and an increase of 89.25% over the past five years. With the boom in shale exploration and production, PHX has seen a 48% increase in oil production and an 86% increase in production of natural gas liquids from 2013 to 2014, sparking a 34.22% increase in revenue over the year. The company’s suppression of direct and operating costs has also enabled it to send more revenue to the bottom line. Total cash from net income accounted for 47.5% of PHX’s operating cash flow in 2014. This cash flow has increased from $7,370,996 in 2012, a five-year low, to $25,001,462 in 2014, an increase in of 239%. Regarding PHX’s operating cash flow, 41.6% came from the adjustment from depreciation and amortization. These expenses have increased 48.84% since 2011.
Investing Activities PHX had a substantial, $121,950,995, cash outflow from investing in 2014, the company’s largest outflow over the past five years (11.4 times greater than its 2010 investing outflow). Indeed, 31.66% of this outflow came from capital expenditures, due to increased production over the past year. However, the largest outflow for the company was its “acquisition of working interest properties,” which amounted to an $83,253,952 outflow, or 68.27% of its total investing outflow. Roughly $81.7 million of these investing activities came from the purchase of a “16% non-operating working interest” in the Eagle Ford shale reserve. Financing Activities PHX greatly increased its long-term debt position from 2013 to 2014 in order to finance investing activities over the course of the year. PHX had a $99,846,333 inflow through borrowing in 2014, a 65.6% increase from 2013. The biggest outflow from financing was $30,108,589 to make loan principal payments. Overall total cash inflows from financing were, $66,970,977. With a combined inflow from financing and operating of $119,593,579, PHX was forced to take a $2,357,416 decrease in cash from 2013 to 2014, causing total cash to asset ratio to sink to a dangerously low level of 0.21%.

CFA, Student Research Panhandle Oil and Gas Inc. (PHX)
7
Target Stock Price (based on worst case estimates)
Earnings Analysis Trends in Earnings for the Past Five Years From 2010 to 2014, PHX’s total revenue grew by 62.5%, from $51.9 million to $84.4 million. This large increase resulted primarily because of an 88% increase in oil, natural gas liquids and natural gas sales, which went from $44.1 million in 2010 to $82.8 million in 2014. Over these five years, PHX steadily increased its production of oil, natural gas liquids, and natural gas while the prices of these products also slightly increased. In addition, income from partnerships increased by 121%, from $405,134 in 2010 to $893,954 in 2014.
Trends in Profitability Margins for the Past Five Years PHX has shown some volatility in profit margins over the past five years (Appendix 13, 14). Both the operating margin and net profit margin declined between 2010 and 2011. Between 2010 and 2011, total revenue decreased by 13%. This resulted because of a 68.5% decrease in lease bonuses and rentals and an 88% decrease in gains on derivative contracts. Also, PHX’s operating income and net income were largely affected by a 185% increase in its provision for impairment account. By 2013, PHX returned to its 2010 levels. Operating margins have ranged from a low of 22% in 2012 to a high of 44% in 2014. This increase in operating margin may have been caused by a 91% decline in exploration costs (going from $979,718 in 2012 to $86,017 in 2014). PHX’s net profit margins show a similar pattern as the operating margins. In 2014, PHX had a net profit margin of 30%, up from 15% in 2012. Even though PHX had an increase in revenue over the past five years, it has been able to limit increases in expenses and taxes. PHX has also been able to improve its ROA, ROE, and ROI over the past five years. In 2010,PHX had an ROA of 10.69 while in 2014 it had an ROA of 12.68. PHX was able to better utilize its assets in order to produce greater earnings. Since 2010, ROE has increased from 16.59 in 2010 to 23.27 in 2014. PHX was better able to use the money their stockholders had invested into the company and produce earnings. The same goes for PHX’s ROI. In 2010,it had an ROI of 20.65. By 2014, ROI reached 24.77. Regarding investments, PHX was able to efficiently invest money into projects and produce better returns. The trend in these ratios over the past five years shows that PHX has been able to improve its use of assets and stockholders’ investments through wise investments in projects. It is important for PHX to maintain these ratios if it wants to remain profitable over the next few years.
Investment Summary We calculated PHX’s target price to be $24.35 with a target range of $18.03 to $30.66. The lower limit of the target price range is calculated using the Dividend Discount Model. The upper limit is the price calculated using the Discounted Cash Flow Model. At the current price of $22.68, as of February 3, 2015, our recommendation is a hold due to the volatility of the oil industry and the unexpected affect it may have on PHX’s stock price.
With the current state of the oil and gas market, PHX may have difficulty finding companies to drill on its land. Lower production paired with lower oil and gas prices will significantly decrease PHX’s revenue and growth. We have determined that this reduction in revenue and growth will only moderately affect the stock price, causing it to vary around the current level. Stock price will only be moderately affected because PHX has the unique advantage of owning mineral rights, rather than having to lease them. This gives PHX the opportunity to receive revenue from production as long as wells are still operating without having to incur large capital expenditures. As oil and gas prices begin to rise in the future, PHX’s revenues will increase. We believe that PHX will be able to remain in business through the decline in oil prices and production and that when prices rise, the stock price will rise. We see PHX as a long-term stock to hold in a portfolio. We do not think it would be in an investor’s best interest to sell or buy the stock in the current market.
Valuation Expected Rate of Return The price target estimate for PHX is $30.00 (Yahoo Finance). The current stock price is $22.68 (as of 2/3/15), and the dividend yield is 0.70%. This makes PHX’s total expected rate of return 32.98%. Nevertheless, looking at the oil and gas current market, it is highly unlikely that PHX will be able produce such a high capital gains yield. The price target estimate was likely made when it was assumed that higher oil prices would continue. The expected rate of return is based on this scenario, and that is why the rate of return is inflated.
Method Min Max NTM P/E $41.36 $48.59
NTM EV/EBITDA $25.97 $29.32
NTM EV/Sales $21.32 $26.30
DDM $18.03 DCF $30.66
Target Range $18.03 $30.66
Target Stock Price $24.35
Increase from
Current Price
+7.36%
CAPM
Risk Free Rate (Rf)
1.98%
Beta (β) 1.63 Market Risk
Premium (Rm) 6%
Rate of Return 11.76%
DCF Price
DDM Price

CFA, Student Research Panhandle Oil and Gas Inc. (PHX)
8
Required Rate of Return (CAPM) Using CAPM, PHX’s equity’s required rate of return was computed to be 11.76%, given an estimated risk-free rate, or a yield to maturity on a 10-year treasury bond, as of January 11, 2015, of 1.98% (U.S. Department of the Treasury, 2015), a market risk premium of 6.0% (FactSet), and the company’s beta of 1.63 (FactSet). Since the required rate of return is lower than expected rate of return, the stock is undervalued.
Dividend Discount Model The Dividend Discount Model shows PHX’s stock is overvalued. Using this model, PHX’s stock is worth $18.03. It might be because PHX retained much of its income for capital expenditure and other expenditure in 2014, and its dividend yield was just 0.70%. PHX’s forward annual dividend yield is 0.70%. Low dividend payments have caused PHX stock price to be low using Dividend Discount Model (Appendix 10).
Discounted Cash Flow (DCF) Model Free cash flow is important for every company, as it is the money actually available to distribute to all its investors. Using DCF, total value of PHX’s equity is $505,658,870.93, assuming constant growth of 2.5% in revenue after 2017. Thus, share price is $30.66 for each of 16,490,640 shares, which were outstanding as of September 30, 2014. However, if PHX’s constant revenue growth rate happens to be 1.5% or 2% after 2017, PHX’s share price would be $27.05 or $28.75 respectively. The DCF model shows that PHX is undervalued since its share price is $22.68 as of February 3, 2015 (Appendix 10).
Multiples We looked at three different scenarios to calculate potential multiples for PHX. Since PHX’s business model is unlike its competitors, using the peer averages of these multiples will not represent the best implied stock price for PHX. Estimates for the Enterprise Values were calculated on September 30, 2014. Estimates for Sales and EBITDA values were calculated on December 15, 2014. Based on these multiples, we calculated an implied price range for one share of PHX stock.
Forward Twelve Month P/E Ratio We used the next twelve month (NTM) P/E ratio to calculate PHX’s value compared to its peer group. When looking at the worst-case scenario, PHX’s estimated NTM P/E ratio is 24.18x. The NTM P/E ratio of PHX’s peer group averaged 35.12x. When we applied this average NTM P/E ratio to PHX’s estimated earnings for 2015, we calculated an implied stock price of $41.36, which will be used as the lower limit of the price range. To calculate the upper limit of the price range, we applied Anadarko Petroleum Corporation’s (APC) NTM P/E ratio to PHX’s estimated 2015 earnings and reached an implied stock price of $48.59. The implied price range in the worst-case scenario, based on NTM P/E ratio, is estimated at $41.36 to $48.59.
When looking at the average-case scenario, PHX’s estimated NTM P/E ratio is 26.77x. The average NTM P/E ratio of the peer group is 35.76x. We applied this average to PHX’s estimated earnings for 2015 and reached an implied stock price of $46.63, which will be used as the lower limit of the stock price. APC’s NTM P/E ratio was applied to PHX’s estimated earnings for 2015 to calculate the upper limit of the price range. We calculated an upper limit of $53.79. The implied price range in the average-case scenario, based on NTM P/E ratio, is estimated at $46.63 to $53.79.
In the best-case scenario, PHX’s NTM P/E ratio is estimated to be 29.36x. The average NTM P/E ratio was calculated to be 36.41x for the peer group. We applied this average to the estimated earnings for 2015 for PHX to reach the lower price limit of $52.07. APC’s NTM P/E ratio was applied to PHX’s estimated earnings for 2015 to calculate the upper price limit of $58.98. The implied price range in the best-case scenario, based on NTM P/E ratio, is estimated at $52.07 to $58.98.
Forward Twelve Month EV/EBITDA Ratio We also used the NTM EV/EBITDA ratio to calculate PHX’s value compared to its peer group. Based on the worst-case scenario, PHX’s NTM EV/EBITDA ratio estimate is 8.51x. According to our calculations, the average NTM EV/EBITDA ratio for the peer group is 8.48x. This average was applied to PHX’s estimated EBITDA for 2015 to calculate its implied stock price. We calculated an
LT debt $78m Debt Discount Rate 90%
Debt Value $70.2m Total Shares Outstanding 16.49m
Share Price (1/20/15) $21.58
Total Sh. equity $355.87m Total LT Liab. & Sh. Equity $426.07m
Weight of debt 0.16 Weight of Equity 0.84 Sum of Weight 1.00 T (Tax Rate) 32.00%
WACC = (Wd)(rd)(1-T) + (Wps)(rps) + (Ws)(rs)
WACC = 10.14%
Company Forward P/E (WORST)
PHX 24.28x APC 41.25x COG 33.86x RRC 41.18x Peer Average 35.12x Implied Price Range $41.36-$48.59
Company Forward P/E (AVG)
PHX 26.77x APC 41.25x COG 33.86x RRC 41.18x Peer Average 35.76x Implied Price Range $46.63-$53.79
Company Forward P/E (BEST)
PHX 29.36x APC 41.25x COG 33.86x RRC 41.18x Peer Average 36.41x Implied Price Range $52.07-$58.98
Company Forward
EV/EBITDA (AVG)
PHX 8.10x APC 6.84x COG 9.08x RRC 9.49x Peer Average 8.38x Implied Price Range
$27.21-$30.81

CFA, Student Research Panhandle Oil and Gas Inc. (PHX)
9
implied stock price of $25.97, which we used as the lower limit for the price range. Range Resources Corporation (RRC) EV/EBITDA ratio was applied to PHX’s estimated EBITDA for 2015 to reach the upper limit of the price range. According to our calculations, the upper limit of the implied stock price is $29.32. The implied price range in the worst-case scenario, based on NTM EV/EBITDA ratio, is estimated at $25.97 to $29.32.
In the average-case scenario, we calculated PHX’s NTM EV/EBITDA ratio estimate is 8.10x. We calculated the peer group average for the NTM EV/EBITDA ratio to be 8.38x. This average was applied to the estimated EBITDA for 2015, and we reached an implied stock price of $27.21. This will be used as the lower limit for the price range. RRC’s NTM EV/EBITDA ratio was applied to PHX’s estimated EBITDA, and we calculated an implied stock price of $30.81, which will be the upper limit. Therefore, the implied price range in the average-case scenario, based on NTM EV/EBITDA ratio, is estimated at $27.21 to $30.81.
When looking at the best-case scenario, PHX’s NTM EV/EBITDA ratio was estimated to be 7.66x. The average NTM EV/EBITDA ratio for the peer group was calculated to be 8.27x. This average NTM EV/EBITDA ratio was applied to PHX’s estimated EBITDA for 2015 to reach a lower price limit and was calculated to be $28.39. RRC’s NTM EV/EBITDA was applied to PHX’s estimated EBITDA for 2015 to calculate the upper limit for the implied stock price. This upper limit was determined to be $32.57. The implied price range in the best-case scenario, based on NTM EV/EBITDA ratio, is estimated at $28.39 to $32.57.
Forward Twelve Month EV/Sales Ratio
The NTM EV/Sales ratio was used to calculate PHX’s value compared to its peer group. When looking at the worst-case scenario, PHX’s estimated NTM EV/Sales ratio is 6.75x. We calculated the average NTM EV/Sales for the peer group to be 5.47x. This average was applied to PHX’s estimated sales for 2015 to calculate its implied stock price, which came out to $21.32. We will use this implied stock price at the lower limit for our price range. PHX’s estimated NTM EV/Sales ratio was applied to PHX’s estimated sales for 2015 to calculate the upper price limit. We calculated an implied stock price of $26.30. The implied price range in the worst-case scenario, based on NTM EV/Sales ratio, is estimated at $21.32 to $26.30. For the average-case scenario, the NTM EV/Sales ratio for PHX was estimated to be 6.09x. The average NTM EV/Sales ratio was calculated to be 5.31x for the peer group. This average was applied to the 2015 estimated sales to reach an implied stock price of $22.91. This will be the lower limit of the price range. PHX’s NTM EV/Sales ratio was applied to their estimated sales for 2015 to calculate the upper price limit. We calculated the upper price limit to be $26.30. The implied price range in the average-case scenario, based on NTM EV/Sales ratio, is estimated at $22.91 to $26.30.
Based on the best-case scenario, PHX has a NTM EV/Sales ratio estimated to be 5.55x. We calculated an average NTM EV/Sales ratio for the peer group to be 5.17x. We applied this average to the estimated sales for PHX in 2015. This resulted in a lower limit of $24.50 for the implied stock price. The upper limit was calculated by applying COG’s NTM EV/Sales to PHX’s estimated sales for 2015. We determined the upper limit of the implied stock price to be $27.52. The implied price range in the best-case scenario, based on NTM EV/Sales ratio, is estimated at $24.50 to $27.52
Conclusion
Based on the worst-case scenario, our Multiple Analysis yields a target price range of $21.32 to $48.59. However, given the dramatic decline in oil prices over the last 90 days, we believe the Multiples approach significantly overstates the valuation. Therefore, the Dividend Discount Model and the Discounted Cash Flow Model are more consistent measures of valuation in the current environment. Based on the valuation models and PHX’s current stock price of $22.68, we estimate PHX to be slightly underpriced, for now. However, if the price of oil remains low, we expect these valuation figures to drop due to lower production and a decline in the value of PHX’s assets. In this case, PHX would be overvalued. Given the current market conditions, we reiterate our hold recommendation for PHX.
Company Forward
EV/EBITDA (WORST)
PHX 8.51x APC 6.84x COG 9.08x RRC 9.49x Peer Average 8.48x Implied Price Range $25.97-$29.32
Company Forward
EV/EBITDA (BEST)
PHX 7.66x APC 6.84x COG 9.08x RRC 9.49x Peer Average 8.27x Implied Price Range $28.39-$32.57
Company Forward EV/Sales (WORST)
PHX 6.75x APC 3.78x COG 5.81x RRC 5.55x Peer Average 5.47x Implied Price Range $21.32-$26.30
Company Forward EV/Sales
(AVG) PHX 6.09x APC 3.78x COG 5.81x RRC 5.55x Peer Average 5.31x Implied Price Range $22.91-$26.30
Company Forward EV/Sales (BEST)
PHX 5.55x APC 3.78x COG 5.81x RRC 5.55x Peer Average 5.17x Implied Price Range $24.50-$27.52
CFA, Student Research Panhandle Oil and Gas Inc. (PHX)
10
Investment Risks These risks may affect the valuation and investment worth of PHX and must be considered. Unpredictable supply and demand of the oil and gas market: The market for oil and gas is volatile and unpredictable due to global and macroeconomic factors that contribute to the supply, demand, and prices of oil and gas. Demand for oil is determined by the industrial production of various nations around the world. Supply for oil is determined by OPEC and other oil producing countries. Matching supply and demand for oil is difficult, especially with the geopolitical factors that affect them. Oil prices are determined by supply and demand, so they are also difficult to predict and control. Geopolitical sensitivity: Oil prices are extremely volatile, and price declines can materially adversely affect PHX. Much of PHX’s estimates for future earnings and investments are based on average oil price figures that can change drastically in a short period of time. Natural gas prices are also determined by factors outside of PHX’s control, such as the severity and length of the winter season. The unpredictable nature of oil and gas can cause financial difficulties for PHX, especially if oil and gas demand or prices fall when the company does not expect it. PHX’s reliance on outside companies: PHX’s business model relies on outside oil and gas exploration companies to drill and operate wells on PHX’s land, while PHX collects royalty or working interest payments. This gives PHX less control over its revenue producing activities compared to other companies in the industry. If oil and gas prices fall and companies determine that it is too costly to drill on PHX’s land, which is mostly on shale formations, PHX will likely lose substantial revenue. Also, PHX has very little control over the operations of companies that do use its land for drilling. The companies that drill and operate the wells make their own financial and operating decisions, and if the decisions are flawed, PHX could incur higher costs and receive less revenue. Oil and gas supply on PHX’s land: PHX’s management makes assumptions about future revenue growth and earnings based upon their estimates of oil and gas reserves on their land. (Appendix 18). These are only estimates, so there is a strong possibility that the company could actually have less oil and gas reserves than anticipated. This could cause lower revenues in the future because wells may not extract as much oil and gas as projected. Another risk involving reserves is the fact that oil and gas are nonrenewable resources that cannot be replenished after they are extracted. If PHX extracts all of the oil and gas that can be discovered with the current technologies, the company will not have resources with which to generate more revenue. PHX’s debt level: Currently, PHX has $78,000,000 drawn on its line of credit with the Bank of Oklahoma. It is expected that this debt will be paid down by November 30, 2018. There is a risk that falling oil and gas prices or production for an extended period of time could cause PHX to not have the cash flow to repay the debt by that deadline. In this scenario, PHX would need to work out a new arrangement with the Bank of Oklahoma or risk defaulting on its debt obligations. Falling oil and gas prices or production could also lead to the Bank of Oklahoma reducing PHX’s total line of credit, and PHX may have issues securing debt financing if the company would be in need of it. Regulations affecting the oil and gas industry: The oil and gas industry is highly regulated, and there is always a risk of new regulations being presented that could cause PHX to incur higher expenses to abide by the new rules. For example, there are concerns about the environmental impacts of oil and gas hydraulic fracking. Hydraulic fracking is currently not highly regulated, but it is possible that there could be strict regulations on fracking in the future. Most of PHX’s land is on shale where fracking is required to extract oil and gas. If regulations on fracking are put into place, it could lead to large expenses for the companies that drill and operate wells on PHX’s properties, and this could indirectly lead to higher costs and lower revenues for PHX.
Other Issues Hedges: PHX currently has hedged oil prices through 2015 at a value of $4,040,870 on 44,000 barrels. This is an average price per barrel of approximately $91.84. With oil estimated to be valued at $45 per barrel in 2015, these hedges could prove quite lucrative should PHX choose to monetize them. This possible monetization of hedges should allow management to undertake calculable risks to improve remuneration, while maintaining a level of security that in a worst-case scenario PHX will remain extant.
CFA, Student Research Panhandle Oil and Gas Inc. (PHX)
11
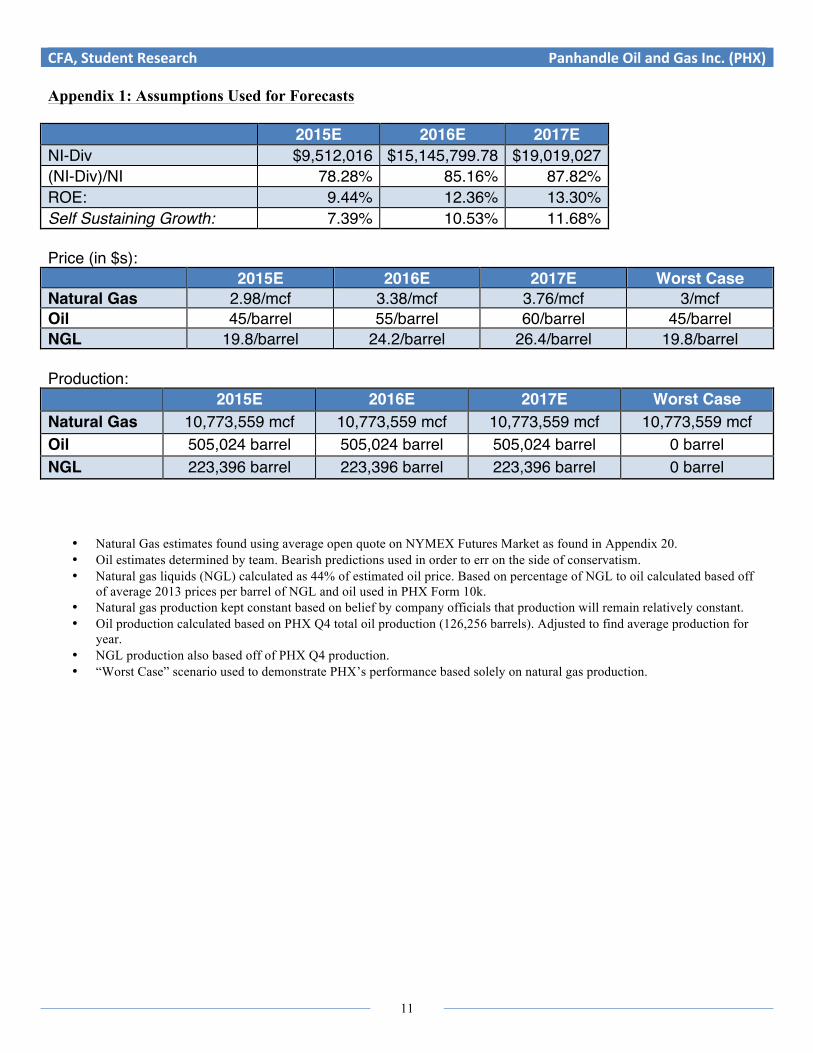
Appendix 1: Assumptions Used for Forecasts 2015E 2016E 2017E NI-Div $9,512,016 $15,145,799.78 $19,019,027 (NI-Div)/NI 78.28% 85.16% 87.82% ROE: 9.44% 12.36% 13.30% Self Sustaining Growth: 7.39% 10.53% 11.68% Price (in $s): 2015E 2016E 2017E Worst Case Natural Gas 2.98/mcf 3.38/mcf 3.76/mcf 3/mcf Oil 45/barrel 55/barrel 60/barrel 45/barrel NGL 19.8/barrel 24.2/barrel 26.4/barrel 19.8/barrel Production: 2015E 2016E 2017E Worst Case Natural Gas 10,773,559 mcf 10,773,559 mcf 10,773,559 mcf 10,773,559 mcf Oil 505,024 barrel 505,024 barrel 505,024 barrel 0 barrel NGL 223,396 barrel 223,396 barrel 223,396 barrel 0 barrel
• Natural Gas estimates found using average open quote on NYMEX Futures Market as found in Appendix 20. • Oil estimates determined by team. Bearish predictions used in order to err on the side of conservatism. • Natural gas liquids (NGL) calculated as 44% of estimated oil price. Based on percentage of NGL to oil calculated based off
of average 2013 prices per barrel of NGL and oil used in PHX Form 10k. • Natural gas production kept constant based on belief by company officials that production will remain relatively constant. • Oil production calculated based on PHX Q4 total oil production (126,256 barrels). Adjusted to find average production for
year. • NGL production also based off of PHX Q4 production. • “Worst Case” scenario used to demonstrate PHX’s performance based solely on natural gas production.

CFA, Student Research Panhandle Oil and Gas Inc. (PHX)
12
Appendix 2: Forecasted Annual Balance Sheet (in Thousands, $)
Panhandle Oil & Gas Inc. (NYSE: PHX) ASSETS 2014 2015E 2016E 2017E Cash & Equivalents 510 14,629 32,163 51,732 Receivables (ST) 16,853 12,143 14,208 15,628 Other Current Assets 2,005 1,445 1,691 1,860 Total Current Assets 19,369 28,217 48,062 69,219 Gross Property Plant & Equipment 429,816 429,816 429,816 429,816 Accumulated Depreciation 204,732 226,629 248,525 270,422 Net Property Plant & Equipment 225,084 203,187 181,290 159,394 Long Term Investments 1,936 1,936 1,936 1,936 Other Assets 251 251 251 251 Total Assets 246,641 233,592 231,539 230,317 LIABILITIES & STOCKHOLDERS’ EQUITY Accounts Payable & Accrued Expenses 7,035 5,069 5,931 6,523 Other Current Liabilities 2,415 1,740 2,036 2,239 Total Current Liabilities 9,450 6,809 9,450 9,450 LT Debt & Leases 78,000 58,000 38,000 18,000 Deferred LT Liabilities 37,364 37,364 37,364 37,364 Other Liabilities 2,638 2,638 2,638 2,638 Total Liabilities 127,452 104,811 87,452 67,452 Common Share Capital 281 281 281 281 Additional Paid-In Capital 2,861 2,861 2,861 2,861 Retained Earnings 118,794 128,386 143,693 162,954 Treasury Stock 5,858 5,858 5,858 5,858 Other Equity 3,110 3,110 3,110 3,110 Total Equity 119,189 128,781 144,088 163,348 Total Liabilities & Equity 246,641 233,592 231,539 230,800 Source: Company Data & Team’s Estimates
CFA, Student Research Panhandle Oil and Gas Inc. (PHX)
13
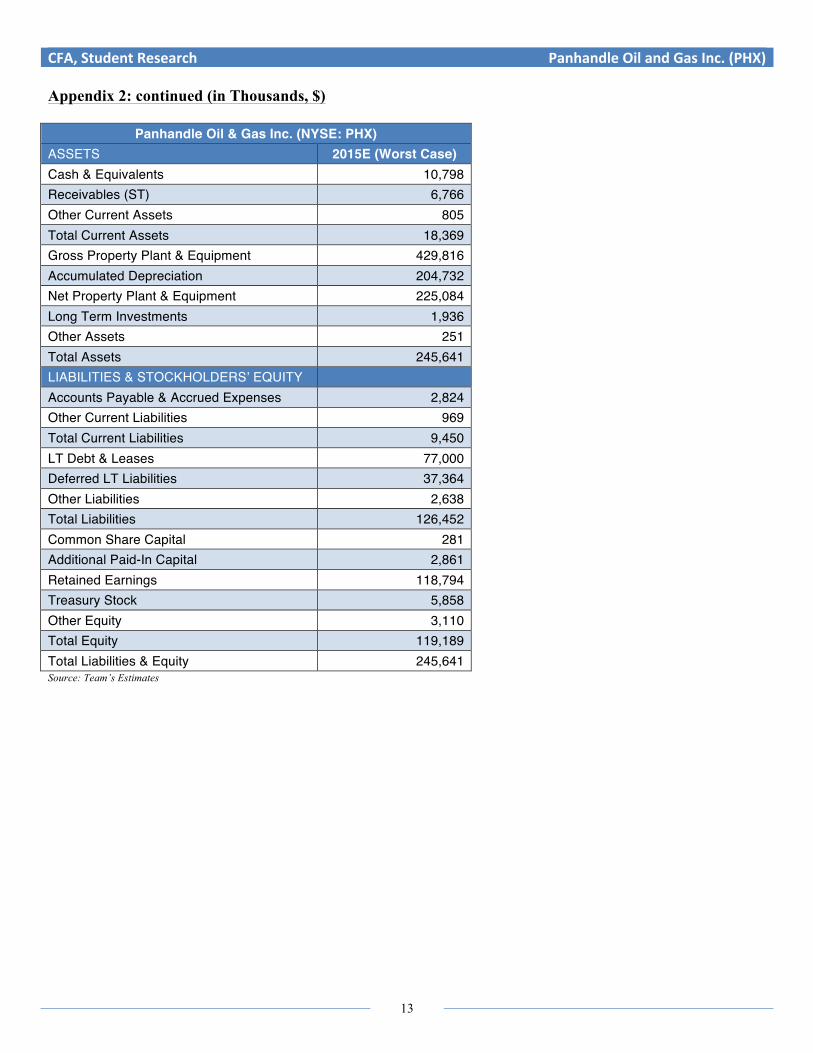
Appendix 2: continued (in Thousands, $)
Panhandle Oil & Gas Inc. (NYSE: PHX) ASSETS 2015E (Worst Case) Cash & Equivalents 10,798 Receivables (ST) 6,766 Other Current Assets 805 Total Current Assets 18,369 Gross Property Plant & Equipment 429,816 Accumulated Depreciation 204,732 Net Property Plant & Equipment 225,084 Long Term Investments 1,936 Other Assets 251 Total Assets 245,641 LIABILITIES & STOCKHOLDERS’ EQUITY Accounts Payable & Accrued Expenses 2,824 Other Current Liabilities 969 Total Current Liabilities 9,450 LT Debt & Leases 77,000 Deferred LT Liabilities 37,364 Other Liabilities 2,638 Total Liabilities 126,452 Common Share Capital 281 Additional Paid-In Capital 2,861 Retained Earnings 118,794 Treasury Stock 5,858 Other Equity 3,110 Total Equity 119,189 Total Liabilities & Equity 245,641 Source: Team’s Estimates

CFA, Student Research Panhandle Oil and Gas Inc. (PHX)
14
Appendix 3: Forecasted Annual Income Statement (in Thousands, $)
Panhandle Oil and Gas Inc. (NYSE: PHX) 2014 2015E 2016E 2017E
Natural Gas Revenue 43,687 32,105 36,415 40,509 Oil Revenue 32,449 22,726 27,776 30,301 NGL Revenue 6,711 4,423 5,406 5,898 Total Oil, Natural Gas, NGL Revenue 82,847 59,255 69,597 76,708 Lease bonuses on derivatives 423 423 423 423 Gains on Derivatives 247 247 247 247 Income from partnerships 894 894 894 894 Total Revenue 84,411 60,819 71,162 78,272 Direct Costs 16,607 11,965 14,000 15,399 Gross Profit 67,804 48,854 57,162 62,873 Selling, General & Administration 7,433 7,433 7,433 7,433 Depreciation & Amortization 21,897 21,897 21,897 21,897 Restructure, Remediation & Impairment 1,096 1,096 1,096 1,096 Other Operating Expense 86 62 73 80 Total Indirect Operating Costs 30,512 30,488 30,499 30,506 Operating Income 37,292 18,366 26,663 32,367 Interest Expense 462 344 225 107 Loss on Sale of Assets 8.37 8.37 8.37 8.37 Total Non-Operating Income 471 352 234 115 Earnings Before Tax 36,821 18,013 26,429 32,252 Taxation 11,820 5,782 8,484 10,353 Net Income 25,001 12,231 17,945 21,899 Average Shares Basic 16,727 EPS Net Basic 1.49 EPS Continuing Basic 1.49 Average Shares Diluted 16,727 EPS Net Diluted 1.49 EPS Continuing Diluted 1.49 Shares Outstanding 16,491 Source: Company Data & Team’s Estimates

CFA, Student Research Panhandle Oil and Gas Inc. (PHX)
15
Appendix 3: continued (in Thousands, $)
Panhandle Oil & Gas Inc. (NYSE: PHX) 2015E (Worst case) Natural Gas Revenue 32,321 Oil Revenue - NGL Revenue - Oil, Natural Gas, & NGL Revenue 32,321 Lease bonuses on derivatives 423 Gains on Derivatives 247 Income from partnerships 894 Total Revenue 33,885 Direct Costs 6,667 Gross Profit 27,219 Selling General & Administrative 7,433 Depreciation & Amortization 21,897 Restructure, Remediation & Impairment 1,096 Other Operating Expense 34.53 Total Indirect Operating Costs 30,461 Operating Income -3,242 Interest Expense 462 Loss on Sale of Assets 8.38 Other Non-Operating Income - Total Non-Operating Income 471 Earnings Before Tax -2,771 Taxation - Extraordinary Items - Accounting Changes - Net Income -2,771 Source: Team’s Estimates

CFA, Student Research Panhandle Oil and Gas Inc. (PHX)
16
Appendix 4: Forecasted CS Annual Balance Sheet
Panhandle Oil & Gas Inc. (NYSE: PHX) ASSETS 2014 2015E 2016E 2017E Cash & Equivalents 0.21% 6.26% 13.89% 22.41% Receivables (ST) 6.83% 5.20% 6.14% 6.77% Other Current Assets 0.81% 0.62% 0.73% 0.81% Total Current Assets 7.85% 12.08% 20.76% 29.99% Gross Property Plant & Equipment 174.27% 184.00% 185.63% 186.23% Accumulated Depreciation 83.01% 97.02% 107.34% 117.17% Net Property Plant & Equipment 91.26% 86.98% 78.30% 69.06% Long Term Investments 0.79% 0.83% 0.84% 0.84% Other Assets 0.10% 0.11% 0.11% 0.11% Total Assets 100.00% 100.00% 100.00% 100.00% LIABILITIES & STOCKHOLDERS’ EQUITY Accounts Payable & Accrued Expenses 2.85% 2.17% 2.56% 2.83% Other Current Liabilities 0.98% 0.74% 0.88% 0.97% Total Current Liabilities 3.83% 2.91% 4.08% 4.09% LT Debt & Leases 31.62% 24.83% 16.41% 7.80% Deferred LT Liabilities 15.15% 16.00% 16.14% 16.19% Other Liabilities 1.07% 1.13% 1.14% 1.14% Total Liabilities 51.68% 44.87% 37.77% 29.23% Common Share Capital 0.11% 0.12% 0.12% 0.12% Additional Paid-In Capital 1.16% 1.22% 1.24% 1.24% Retained Earnings 48.16% 54.96% 62.06% 70.60% Treasury Stock 2.38% 2.51% 2.53% 2.54% Other Equity 1.26% 1.33% 1.34% 1.35% Total Equity 48.32% 55.13% 62.23% 70.77% Total Liabilities & Equity 100.00% 100.00% 100.00% 100.00% Source: Company Data & Team’s Estimates

CFA, Student Research Panhandle Oil and Gas Inc. (PHX)
17
Appendix 4: continued
Panhandle Oil & Gas Inc. (NYSE: PHX) ASSETS 2015E (Worst Case) Cash & Equivalents 4.40% Receivables (ST) 2.75% Other Current Assets 0.33% Total Current Assets 7.48% Gross Property Plant & Equipment 174.98% Accumulated Depreciation 83.35% Net Property Plant & Equipment 91.63% Long Term Investments 0.79% Other Assets 0.10% Total Assets 100.00% LIABILITIES & STOCKHOLDERS’ EQUITY Accounts Payable & Accrued Expenses 1.15% Other Current Liabilities 0.39% Total Current Liabilities 3.85% LT Debt & Leases 31.35% Deferred LT Liabilities 15.21% Other Liabilities 1.07% Total Liabilities 51.48% Common Share Capital 0.11% Additional Paid-In Capital 1.16% Retained Earnings 48.36% Treasury Stock 2.38% Other Equity 1.27% Total Equity 48.52% Total Liabilities & Equity 100.00% Source: Team’s Estimates

CFA, Student Research Panhandle Oil and Gas Inc. (PHX)
18
Appendix 5: Forecasted CS Annual Income Statement
Panhandle Oil & Gas Inc. (NYSE: PHX) 2014 2015E 2016E 2017E Natural Gas Revenue 51.75% 52.79% 51.17% 51.75% Oil Revenue 38.44% 37.37% 39.03% 38.71% NGL Revenue 7.95% 7.27% 7.60% 7.53% Oil, Natural Gas, & NGL Revenue 98.15% 97.43% 97.80% 98.00% Lease bonuses on derivatives 0.50% 0.70% 0.59% 0.54% Gains on Derivatives 0.29% 0.41% 0.35% 0.32% Income from partnerships 1.06% 1.47% 1.26% 1.14% Total Revenue 100.00% 100.00% 100.00% 100.00% Direct Costs 19.67% 19.67% 19.67% 19.67% Gross Profit 80.33% 80.33% 80.33% 80.33% Selling General & Administrative 8.81% 12.22% 10.45% 9.50% Depreciation & Amortization 25.94% 36.00% 30.77% 27.98% Restructure, Remediation & Impairment 1.30% 1.80% 1.54% 1.40% Other Operating Expense 0.10% 0.10% 0.10% 0.10% Total Indirect Operating Costs 36.15% 50.13% 42.86% 38.97% Operating Income 44.18% 30.20% 37.47% 41.35% Interest Expense 0.55% 0.57% 0.32% 0.14% Loss on Sale of Assets -0.01% 0.01% 0.01% 0.01% Other Non-Operating Income 0.00% 0.00% 0.00% 0.00% Total Non-Operating Income -0.56% 0.58% 0.33% 0.15% Earnings Before Tax 43.62% 29.62% 37.14% 41.21% Taxation 14.00% 9.51% 11.92% 13.23% Extraordinary Items 0.00% 0.00% 0.00% 0.00% Accounting Changes 0.00% 0.00% 0.00% 0.00% Net Income 29.62% 20.11% 25.22% 27.98% Source: Company Data & Team’s Estimates

CFA, Student Research Panhandle Oil and Gas Inc. (PHX)
19
Appendix 5: continued
Panhandle Oil & Gas Inc. (NYSE: PHX) 2015E (Worst Case) Natural Gas Revenue 95.38% Oil Revenue 0.00% NGL Revenue 0.00% Oil, Natural Gas, & NGL Revenue 95.38% Lease bonuses on derivatives 1.25% Gains on Derivatives 0.73% Income from partnerships 2.64% Total Revenue 100.00% Direct Costs 19.67% Gross Profit 80.33% Selling General & Administrative 21.94% Depreciation & Amortization 64.62% Restructure, Remediation & Impairment 3.23% Other Operating Expense 0.10% Total Indirect Operating Costs 89.89% Operating Income -9.57% Interest Expense 1.36% Loss on Sale of Assets 0.02% Other Non-Operating Income 0.00% Total Non-Operating Income 1.39% Earnings Before Tax -8.18% Taxation 0.00% Extraordinary Items 0.00% Accounting Changes 0.00% Net Income -8.18% Source: Team’s Estimates

CFA, Student Research Panhandle Oil and Gas Inc. (PHX)
20
Appendix 6: Key Financial Ratios
Panhandle Oil & Gas Inc. (NYSE: PHX) Liquidity Ratio 2014 2015E 2016E 2017E 2015 (Worst) Current Ratio (x) 2.05 4.14 5.09 7.33 1.94 Utilization Ratios 2014 2015E 2016E 2017E 2015 (Worst) Receivables Turnover (x) 5.01 5.01 5.01 5.01 5.01 Days Sales Outstanding 72.88 72.88 72.88 72.88 72.88 Fixed Asset Turnover (x) 0.38 0.30 0.39 0.49 0.15 Total Asset Turnover (x) 0.34 0.26 0.31 0.34 0.14 Profitability Ratios 2014 2015E 2016E 2017E 2015 (Worst) Gross Profit Margin (%) 80.33% 80.33% 80.33% 80.33% 80.33% Operating Profit Margin (%) 44.18% 30.20% 37.47% 41.35% -9.57% Net Profit Margin (%) 29.62% 20.11% 25.22% 27.98% -10.96% ROA (%) 10.14% 5.24% 7.75% 9.49% -1.51% ROE (%) 20.98% 9.50% 12.45% 13.41% -3.11% BEP (%) 15.12% 7.86% 11.52% 14.02% -1.32% Debt Management Ratios 2014 2015E 2016E 2017E 2015 (Worst) Total Debt (%) 51.68% 44.87% 37.77% 29.23% 51.48% LT Debt (%) 31.62% 24.83% 16.41% 7.80% 31.35% Debt to Equity Ratio (%) 1.07 0.81 0.61 0.41 1.06 TIE (x) 80.67 53.43 118.39 303.39 -7.01 EBITDA times (x) 128.03 117.12 215.61 508.65 40.35 EM 2.07 1.81 1.61 1.41 2.06 Source: Company Data & Team’s Estimates
CFA, Student Research Panhandle Oil and Gas Inc. (PHX)
21
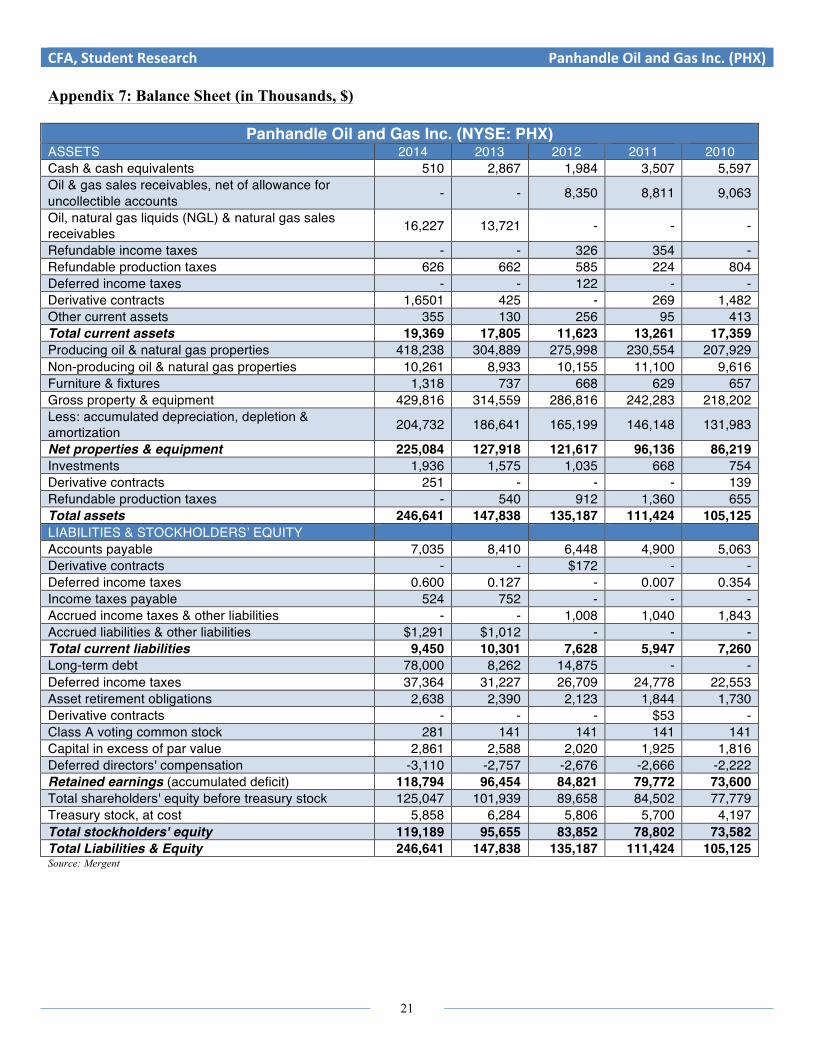
Appendix 7: Balance Sheet (in Thousands, $)
Panhandle Oil and Gas Inc. (NYSE: PHX) ASSETS 2014 2013 2012 2011 2010 Cash & cash equivalents 510 2,867 1,984 3,507 5,597 Oil & gas sales receivables, net of allowance for uncollectible accounts - - 8,350 8,811 9,063
Oil, natural gas liquids (NGL) & natural gas sales receivables 16,227 13,721 - - -
Refundable income taxes - - 326 354 - Refundable production taxes 626 662 585 224 804 Deferred income taxes - - 122 - - Derivative contracts 1,6501 425 - 269 1,482 Other current assets 355 130 256 95 413 Total current assets 19,369 17,805 11,623 13,261 17,359 Producing oil & natural gas properties 418,238 304,889 275,998 230,554 207,929 Non-producing oil & natural gas properties 10,261 8,933 10,155 11,100 9,616 Furniture & fixtures 1,318 737 668 629 657 Gross property & equipment 429,816 314,559 286,816 242,283 218,202 Less: accumulated depreciation, depletion & amortization 204,732 186,641 165,199 146,148 131,983
Net properties & equipment 225,084 127,918 121,617 96,136 86,219 Investments 1,936 1,575 1,035 668 754 Derivative contracts 251 - - - 139 Refundable production taxes - 540 912 1,360 655 Total assets 246,641 147,838 135,187 111,424 105,125 LIABILITIES & STOCKHOLDERS’ EQUITY Accounts payable 7,035 8,410 6,448 4,900 5,063 Derivative contracts - - $172 - - Deferred income taxes 0.600 0.127 - 0.007 0.354 Income taxes payable 524 752 - - - Accrued income taxes & other liabilities - - 1,008 1,040 1,843 Accrued liabilities & other liabilities $1,291 $1,012 - - - Total current liabilities 9,450 10,301 7,628 5,947 7,260 Long-term debt 78,000 8,262 14,875 - - Deferred income taxes 37,364 31,227 26,709 24,778 22,553 Asset retirement obligations 2,638 2,390 2,123 1,844 1,730 Derivative contracts - - - $53 - Class A voting common stock 281 141 141 141 141 Capital in excess of par value 2,861 2,588 2,020 1,925 1,816 Deferred directors' compensation -3,110 -2,757 -2,676 -2,666 -2,222 Retained earnings (accumulated deficit) 118,794 96,454 84,821 79,772 73,600 Total shareholders' equity before treasury stock 125,047 101,939 89,658 84,502 77,779 Treasury stock, at cost 5,858 6,284 5,806 5,700 4,197 Total stockholders' equity 119,189 95,655 83,852 78,802 73,582 Total Liabilities & Equity 246,641 147,838 135,187 111,424 105,125 Source: Mergent
CFA, Student Research Panhandle Oil and Gas Inc. (PHX)
22
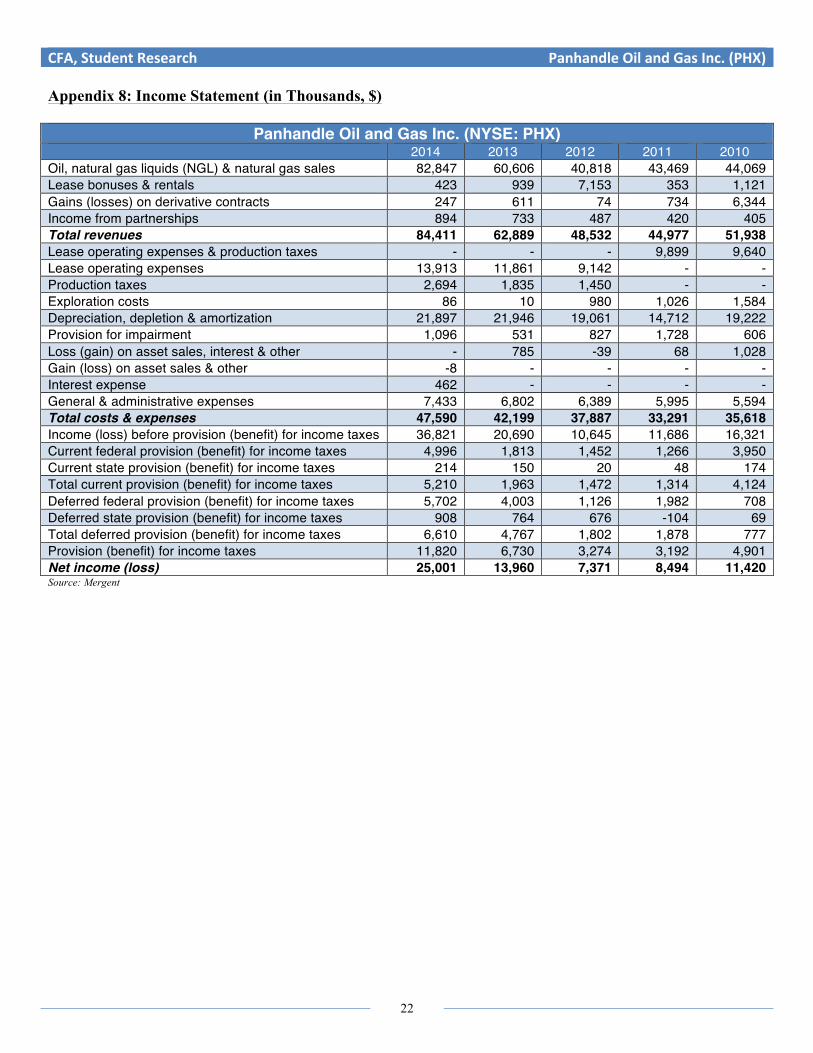
Appendix 8: Income Statement (in Thousands, $)
Panhandle Oil and Gas Inc. (NYSE: PHX) 2014 2013 2012 2011 2010 Oil, natural gas liquids (NGL) & natural gas sales 82,847 60,606 40,818 43,469 44,069 Lease bonuses & rentals 423 939 7,153 353 1,121 Gains (losses) on derivative contracts 247 611 74 734 6,344 Income from partnerships 894 733 487 420 405 Total revenues 84,411 62,889 48,532 44,977 51,938 Lease operating expenses & production taxes - - - 9,899 9,640 Lease operating expenses 13,913 11,861 9,142 - - Production taxes 2,694 1,835 1,450 - - Exploration costs 86 10 980 1,026 1,584 Depreciation, depletion & amortization 21,897 21,946 19,061 14,712 19,222 Provision for impairment 1,096 531 827 1,728 606 Loss (gain) on asset sales, interest & other - 785 -39 68 1,028 Gain (loss) on asset sales & other -8 - - - - Interest expense 462 - - - - General & administrative expenses 7,433 6,802 6,389 5,995 5,594 Total costs & expenses 47,590 42,199 37,887 33,291 35,618 Income (loss) before provision (benefit) for income taxes 36,821 20,690 10,645 11,686 16,321 Current federal provision (benefit) for income taxes 4,996 1,813 1,452 1,266 3,950 Current state provision (benefit) for income taxes 214 150 20 48 174 Total current provision (benefit) for income taxes 5,210 1,963 1,472 1,314 4,124 Deferred federal provision (benefit) for income taxes 5,702 4,003 1,126 1,982 708 Deferred state provision (benefit) for income taxes 908 764 676 -104 69 Total deferred provision (benefit) for income taxes 6,610 4,767 1,802 1,878 777 Provision (benefit) for income taxes 11,820 6,730 3,274 3,192 4,901 Net income (loss) 25,001 13,960 7,371 8,494 11,420 Source: Mergent
CFA, Student Research Panhandle Oil and Gas Inc. (PHX)
23
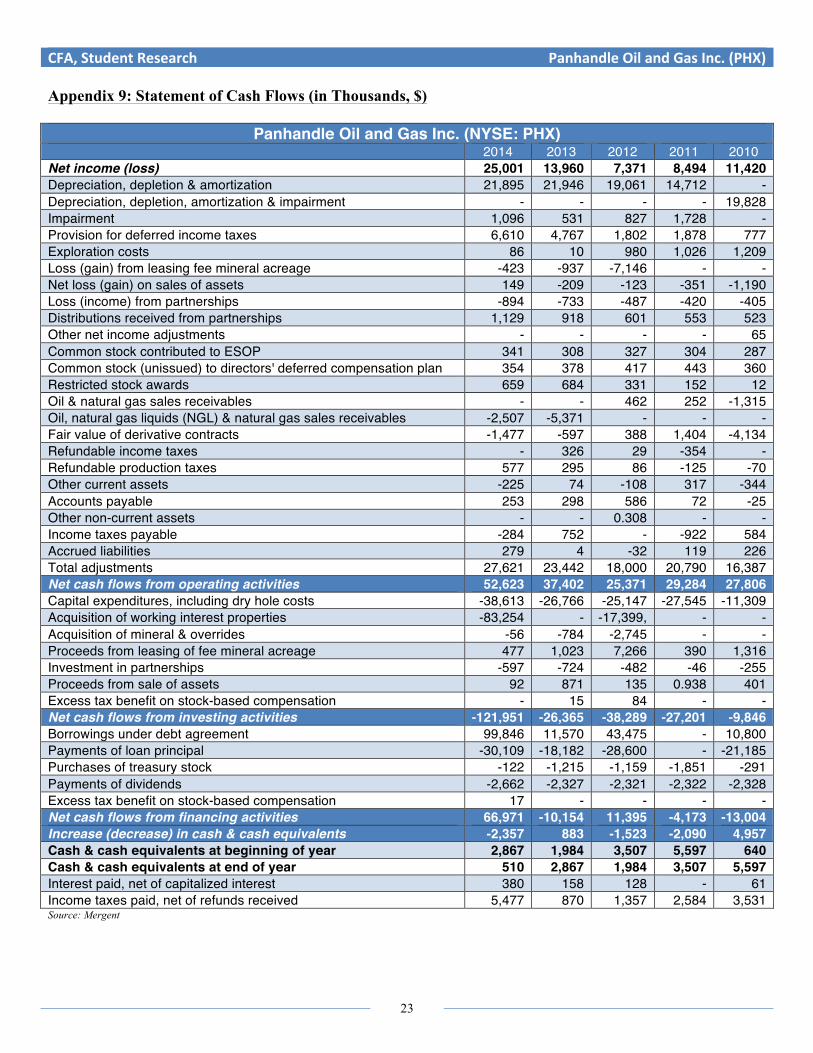
Appendix 9: Statement of Cash Flows (in Thousands, $)
Panhandle Oil and Gas Inc. (NYSE: PHX) 2014 2013 2012 2011 2010 Net income (loss) 25,001 13,960 7,371 8,494 11,420 Depreciation, depletion & amortization 21,895 21,946 19,061 14,712 - Depreciation, depletion, amortization & impairment - - - - 19,828 Impairment 1,096 531 827 1,728 - Provision for deferred income taxes 6,610 4,767 1,802 1,878 777 Exploration costs 86 10 980 1,026 1,209 Loss (gain) from leasing fee mineral acreage -423 -937 -7,146 - - Net loss (gain) on sales of assets 149 -209 -123 -351 -1,190 Loss (income) from partnerships -894 -733 -487 -420 -405 Distributions received from partnerships 1,129 918 601 553 523 Other net income adjustments - - - - 65 Common stock contributed to ESOP 341 308 327 304 287 Common stock (unissued) to directors' deferred compensation plan 354 378 417 443 360 Restricted stock awards 659 684 331 152 12 Oil & natural gas sales receivables - - 462 252 -1,315 Oil, natural gas liquids (NGL) & natural gas sales receivables -2,507 -5,371 - - - Fair value of derivative contracts -1,477 -597 388 1,404 -4,134 Refundable income taxes - 326 29 -354 - Refundable production taxes 577 295 86 -125 -70 Other current assets -225 74 -108 317 -344 Accounts payable 253 298 586 72 -25 Other non-current assets - - 0.308 - - Income taxes payable -284 752 - -922 584 Accrued liabilities 279 4 -32 119 226 Total adjustments 27,621 23,442 18,000 20,790 16,387 Net cash flows from operating activities 52,623 37,402 25,371 29,284 27,806 Capital expenditures, including dry hole costs -38,613 -26,766 -25,147 -27,545 -11,309 Acquisition of working interest properties -83,254 - -17,399, - - Acquisition of mineral & overrides -56 -784 -2,745 - - Proceeds from leasing of fee mineral acreage 477 1,023 7,266 390 1,316 Investment in partnerships -597 -724 -482 -46 -255 Proceeds from sale of assets 92 871 135 0.938 401 Excess tax benefit on stock-based compensation - 15 84 - - Net cash flows from investing activities -121,951 -26,365 -38,289 -27,201 -9,846 Borrowings under debt agreement 99,846 11,570 43,475 - 10,800 Payments of loan principal -30,109 -18,182 -28,600 - -21,185 Purchases of treasury stock -122 -1,215 -1,159 -1,851 -291 Payments of dividends -2,662 -2,327 -2,321 -2,322 -2,328 Excess tax benefit on stock-based compensation 17 - - - - Net cash flows from financing activities 66,971 -10,154 11,395 -4,173 -13,004 Increase (decrease) in cash & cash equivalents -2,357 883 -1,523 -2,090 4,957 Cash & cash equivalents at beginning of year 2,867 1,984 3,507 5,597 640 Cash & cash equivalents at end of year 510 2,867 1,984 3,507 5,597 Interest paid, net of capitalized interest 380 158 128 - 61 Income taxes paid, net of refunds received 5,477 870 1,357 2,584 3,531 Source: Mergent
CFA, Student Research Panhandle Oil and Gas Inc. (PHX)
24
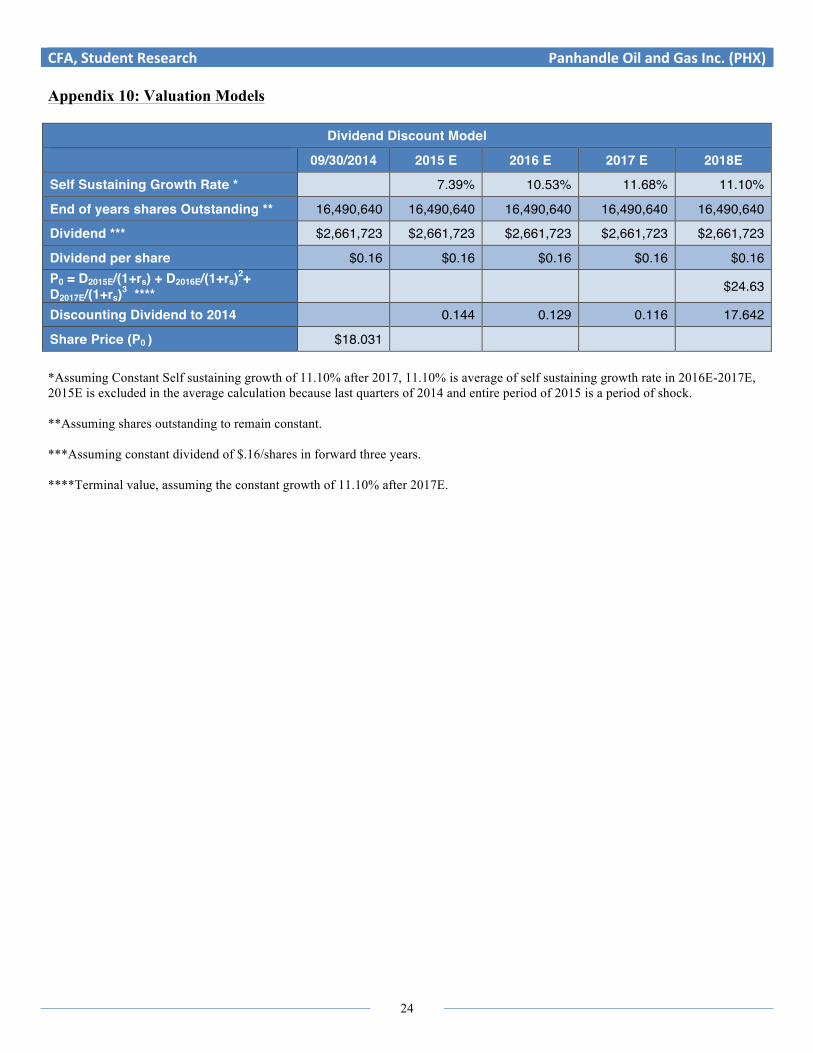
Appendix 10: Valuation Models
Dividend Discount Model 09/30/2014 2015 E 2016 E 2017 E 2018E
Self Sustaining Growth Rate * 7.39% 10.53% 11.68% 11.10%
End of years shares Outstanding ** 16,490,640 16,490,640 16,490,640 16,490,640 16,490,640
Dividend *** $2,661,723 $2,661,723 $2,661,723 $2,661,723 $2,661,723
Dividend per share $0.16 $0.16 $0.16 $0.16 $0.16 P0 = D2015E/(1+rs) + D2016E/(1+rs)2+ D2017E/(1+rs)3 **** $24.63
Discounting Dividend to 2014 0.144 0.129 0.116 17.642
Share Price (P0 ) $18.031 *Assuming Constant Self sustaining growth of 11.10% after 2017, 11.10% is average of self sustaining growth rate in 2016E-2017E, 2015E is excluded in the average calculation because last quarters of 2014 and entire period of 2015 is a period of shock. **Assuming shares outstanding to remain constant. ***Assuming constant dividend of $.16/shares in forward three years. ****Terminal value, assuming the constant growth of 11.10% after 2017E.

CFA, Student Research Panhandle Oil and Gas Inc. (PHX)
25
Appendix 10: continued
WACC 10.14% EBIT 2015 $18,365,621 FCF 2015 $37,015,314.78
2014 2015E 2016E 2017E Natural Gas Revenue $43,686,780 $32,105,204.33 $36,414,627.73 $40,508,579.96 Oil Revenue $32,449,141 $22,726,080 $27,776,320 $30,301,440 NGL Revenue $6,710,607 $4,423,240.80 $5,406,183.20 $5,897,654.40 Other Revenues $1,564,696 $1,564,696 $1,564,696 $1,564,696 Total Revenue $84,411,224 $60,819,221.13 $71,161,826.93 $78,272,370.36 Revenue Growth Rate -27.95% 17.01% 9.99%
Free Cash Flow Model Time Growth Rate FCF PV 2015 -27.95% $37,015,314.78 $33,608,873.52 2016 17.01% $43,309,949.97 $35,705,301.17 2017 9.99% $47,637,512.84 $35,658,790.37
Horizon Value 2018, Constant Growth * 2.50% $639,489,050.36 $478,685,905.87
Total Value of Operations $583,658,870.93 Less: Debt $78,000,000.00 Value of Equity $505,658,870.93 Number of Shares 16,490,640.00 Value per Share $30.66
• Real economic growth is assumed to be 2.5% after 2017. • For the calculation of WACC, the debt discount rate in the secondary market for independent oil and gas is assumed to be
90%.
Calculations Years CA-cash CL Difference Change 2014 $18,858,856 $9,449,574 $9,409,282
2015 $13,588,014.47 $6,808,522.65 $6,779,491.82 $-2,629,790.18
Free Cash Flow EBIT(1-Tax Rate) + Depreciation & Amortization - Change in Net Working Capital - Capital Expenditure FCF
FCF 2015, oil price =$45 18,365,621 (1-.32) + 21,896,902 + 2,245,160 + 0 $37,015,314.78
Sensitivity Analysis for Growth Rate
Growth Rate Horizon Value Value of Equity Share Price 1.50% $559,919,450.97 $446,097,498.07 $27.05 2.00% $597,259,127.59 $474,047,901.47 $28.75

CFA, Student Research Panhandle Oil and Gas Inc. (PHX)
26
Appendix 11: Industry Performance
Source: FactSet

CFA, Student Research Panhandle Oil and Gas Inc. (PHX)
27
Appendix 12: Trends in TAT, ROA, & ROE
Source: Company Data & Team’s Estimates
0.49"
0.39"
0.44" 0.43"
0.26"
16.59%"
9.04%"
15.55%"
23.27%"
9.44%"10.69%"
5.96%"9.86%"
12.68%"
5.20%"
0"
0.1"
0.2"
0.3"
0.4"
0.5"
0.6"
2010" 2011" 2012" 2013" 2014" 2015E"
Total Asset Turnover" ROE % (Net)" ROA % (Net)"

CFA, Student Research Panhandle Oil and Gas Inc. (PHX)
28
Appendix 13: Trends in Earnings (in Millions, $)
Source: Company Data
$42.30"
$35.08"$37.94"
$49.19"
$67.80"
$15.29"$11.62" $10.68"
$19.90"
$37.29"
$11.42"$8.49" $7.37"
$13.96"
$25.00"
$0.00"
$10.00"
$20.00"
$30.00"
$40.00"
$50.00"
$60.00"
$70.00"
$80.00"
2010" 2011" 2012" 2013" 2014"
Gross Profit" Operating Income" Net income (loss)"

CFA, Student Research Panhandle Oil and Gas Inc. (PHX)
29
Appendix 14: Trends in Margins
Source: Company Data
81.44%"77.99%" 78.18%" 78.22%" 80.33%"
29.44%"25.83%"
22.02%"
31.65%"
44.18%"
21.99%"18.89%"
15.19%"
22.20%"
29.62%"
0.00%"
10.00%"
20.00%"
30.00%"
40.00%"
50.00%"
60.00%"
70.00%"
80.00%"
90.00%"
2010" 2011" 2012" 2013" 2014"
Gross Profit" Operating Income" Net income (loss)"

CFA, Student Research Panhandle Oil and Gas Inc. (PHX)
30
Appendix 15: Derivative Contracts Derivative contracts in place as of September 30, 2014 (Prices below reflect the Company’s net price from the listed pipelines)
Contract period Production volume covered per month
Indexed pipeline
Fixed price
Natural gas costless collars July - December 2014 140,000 Mmbtu NYMEX Henry Hub $3.75 floor / $4.50 ceiling
Natural gas fixed price swaps
July - December 2014 140,000 Mmbtu NYMEX Henry Hub $4.11 May - October 2014 30,000 Mmbtu NYMEX Henry Hub $4.30
October – December 2014 40,000 Mmbtu NYMEX Henry Hub $4.61
Oil costless collars January - December 2014 4,000 Bbls NYMEX WTI $85.00 floor / $100.00 ceiling
July - December 2014 5,000 Bbls NYMEX WTI $90.00 floor / $97.00 ceiling
Oil fixed price swaps January - December 2014 3,000 Bbls NYMEX WTI $94.50
June - December 2014 4,000 Bbls NYMEX WTI $99.40 July - December 2014 4,000 Bbls NYMEX WTI $95.25 July - December 2014 5,000 Bbls NYMEX WTI $94.20 January - March 2015 6,000 Bbls NYMEX WTI $92.85 January - June 2015 7,000 Bbls NYMEX WTI $96.80 January - June 2015 5,000 Bbls NYMEX WTI $97.40 January - June 2015 4,000 Bbls NYMEX WTI $97.25
April - December 2015 5,000 Bbls NYMEX WTI $94.56 July - December 2015 7,000 Bbls NYMEX WTI $93.91
Source: Company Data
CFA, Student Research Panhandle Oil and Gas Inc. (PHX)
31
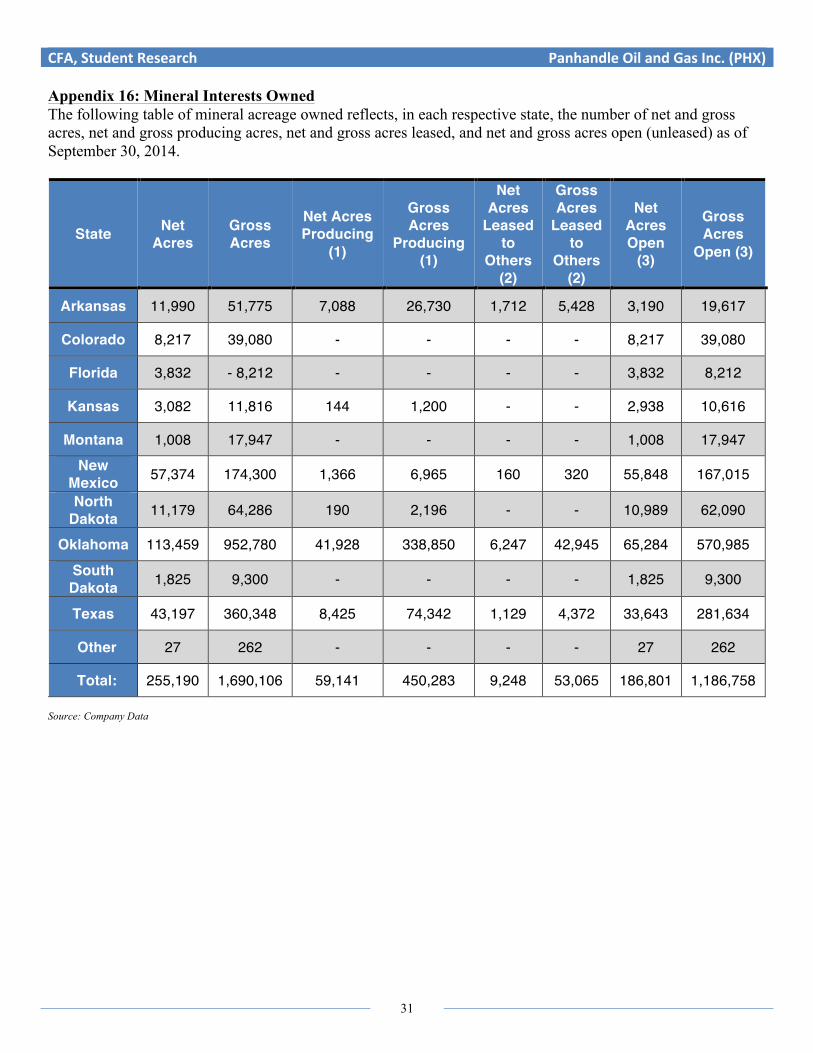
Appendix 16: Mineral Interests Owned The following table of mineral acreage owned reflects, in each respective state, the number of net and gross acres, net and gross producing acres, net and gross acres leased, and net and gross acres open (unleased) as of September 30, 2014.
State Net Acres
Gross Acres
Net Acres Producing
(1)
Gross Acres
Producing (1)
Net Acres
Leased to
Others (2)
Gross Acres
Leased to
Others (2)
Net Acres Open
(3)
Gross Acres
Open (3)
Arkansas 11,990 51,775 7,088 26,730 1,712 5,428 3,190 19,617
Colorado 8,217 39,080 - - - - 8,217 39,080
Florida 3,832 - 8,212 - - - - 3,832 8,212
Kansas 3,082 11,816 144 1,200 - - 2,938 10,616
Montana 1,008 17,947 - - - - 1,008 17,947 New
Mexico 57,374 174,300 1,366 6,965 160 320 55,848 167,015
North Dakota 11,179 64,286 190 2,196 - - 10,989 62,090
Oklahoma 113,459 952,780 41,928 338,850 6,247 42,945 65,284 570,985
South Dakota 1,825 9,300 - - - - 1,825 9,300
Texas 43,197 360,348 8,425 74,342 1,129 4,372 33,643 281,634
Other 27 262 - - - - 27 262
Total: 255,190 1,690,106 59,141 450,283 9,248 53,065 186,801 1,186,758 Source: Company Data
CFA, Student Research Panhandle Oil and Gas Inc. (PHX)
32
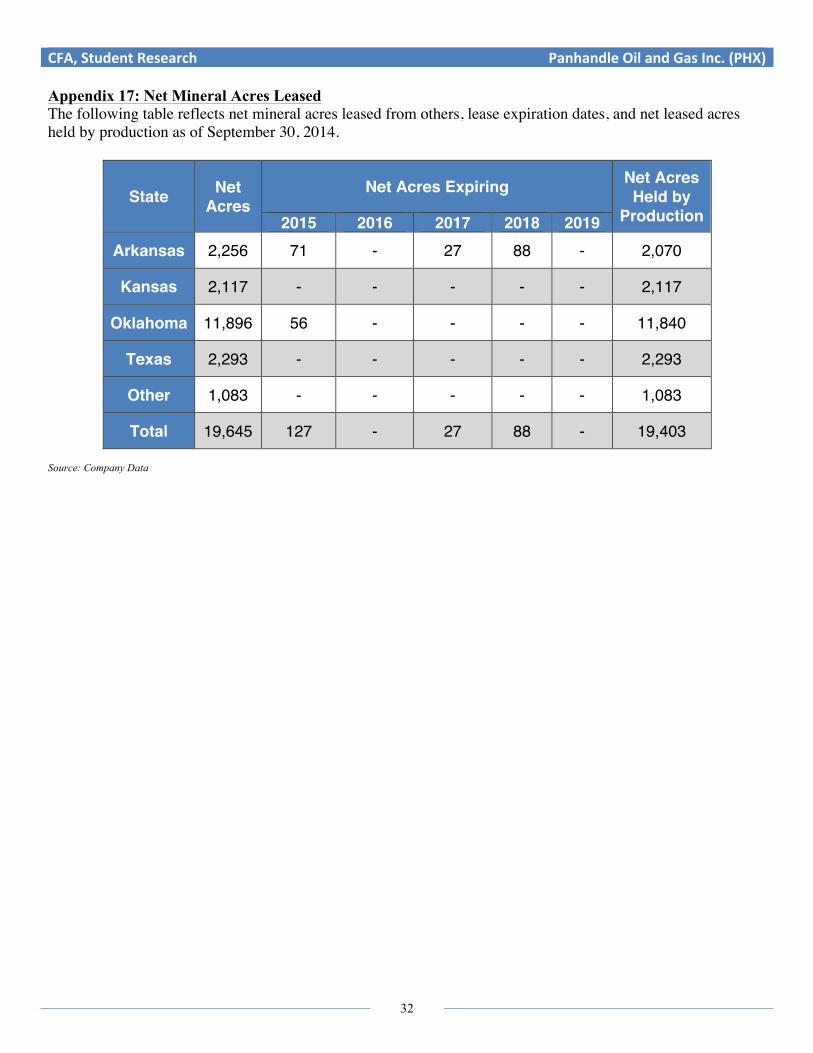
Appendix 17: Net Mineral Acres Leased The following table reflects net mineral acres leased from others, lease expiration dates, and net leased acres held by production as of September 30, 2014.
State Net Acres
Net Acres Expiring Net Acres Held by
Production 2015 2016 2017 2018 2019 Arkansas 2,256 71 - 27 88 - 2,070
Kansas 2,117 - - - - - 2,117
Oklahoma 11,896 56 - - - - 11,840
Texas 2,293 - - - - - 2,293
Other 1,083 - - - - - 1,083
Total 19,645 127 - 27 88 - 19,403 Source: Company Data

CFA, Student Research Panhandle Oil and Gas Inc. (PHX)
33
Appendix 18: Proved Reserves The following table summarizes estimates of proved reserves of oil, NGL and natural gas held by Panhandle as of September 30, 2014. All proved reserves are located onshore within the contiguous United States and are principally made up of small interests in 6,019 wells, which are predominately located in the Mid-Continent region. Other than this report, the Company’s reserve estimates are not filed with any other federal agency.
Barrels of Oil Barrels of NGL Mcf of Natural Gas Mcfe
Net Proved Developed Reserves September 30, 2014 2,890,678 1,564,859 88,512,767 115,245,989 September 30, 2013 1,037,721 764,321 82,298,833 93,111,085 September 30, 2012 849,548 494,160 65,733,119 73,795,367
Net Proved Undeveloped Reserves
September 30, 2014 4,678,901 1,475,322 53,979,593 90,904,931 September 30, 2013 605,582 851,805 49,990,334 58,734,656 September 30, 2012 222,771 294,582 47,780,937 50,885,055
Net Total Proved Reserves
September 30, 2014 7,569,579 3,040,181 142,492,360 206,150,920 September 30, 2013 1,643,303 1,616,126 132,289,167 151,845,741 September 30, 2012 1,072,319 788,742 113,514,056 124,680,422
Source: Company Data

CFA, Student Research Panhandle Oil and Gas Inc. (PHX)
34
Appendix 19: Trends in Oil Prices

CFA, Student Research Panhandle Oil and Gas Inc. (PHX)
35
Appendix 20: Prices of Natural Gas Futures
Natural Gas Nymex Futures
Market Contract Open High Low Last Change Pct Time
NG.G15.E Feb 2015 (E) 2.895 2.928 2.888 2.926 +0.045 +1.52% 23:07 NG.H15.E Mar 2015 (E) 2.862 2.889 2.853 2.887 +0.039 +1.33% 23:07 NG.J15.E Apr 2015 (E) 2.850 2.868 2.849 2.868 +0.032 +1.10% 22:53 NG.K15.E May 2015 (E) 2.895 2.925 2.831 2.861 -0.085 -2.89% 15:59 NG.M15.E Jun 2015 (E) 2.932 2.938 +0.027 +0.91% 23:04 NG.N15.E Jul 2015 (E) 2.990 3.016 2.937 2.963 -0.078 -2.58% 15:59 NG.Q15.E Aug 2015 (E) 2.994 3.003 +0.022 +0.72% set 23:04 NG.U15.E Sep 2015 (E) 2.979 2.988 +0.021 +0.69% 23:04 NG.V15.E Oct 2015 (E) 3.006 3.017 3.000 3.017 +0.020 +0.65% 23:04 NG.X15.E Nov 2015 (E) 3.119 3.150 3.079 3.100 -0.068 -2.15% 15:06 NG.Z15.E Dec 2015 (E) 3.298 3.302 +0.005 +0.15% set 23:04 NG.F16.E Jan 2016 (E) 3.435 3.437 +0.004 +0.12% 23:04 NG.G16.E Feb 2016 (E) 3.419 3.429 3.403 3.430 -0.034 -0.98% set 10:01 NG.H16.E Mar 2016 (E) 3.392 3.405 3.368 3.395 -0.032 -0.94% set 10:01 NG.J16.E Apr 2016 (E) 3.284 3.271 -0.014 -0.43% set 05:29 NG.K16.E May 2016 (E) 3.275 3.275 3.263 3.278 -0.014 -0.43% set 15:00 NG.M16.E Jun 2016 (E) 3.321 3.316 -0.014 -0.42% set 08:30 NG.N16.E Jul 2016 (E) 3.366 3.355 -0.012 -0.36% set 08:30 NG.Q16.E Aug 2016 (E) 3.331 3.339 3.325 3.363 -0.009 -0.27% set 15:00 NG.U16.E Sep 2016 (E) 3.321 3.345 3.321 3.350 -0.009 -0.27% set 15:00 NG.V16.E Oct 2016 (E) 3.351 3.363 3.288 3.373 -0.008 -0.24% set 15:00 NG.X16.E Nov 2016 (E) 3.435 3.435 3.378 3.435 -0.011 -0.32% set 15:00 NG.Z16.E Dec 2016 (E) 3.612 3.612 3.612 3.609 -0.009 -0.25% set 10:03 NG.F17.E Jan 2017 (E) 3.754 3.761 3.704 3.765 -0.008 -0.21% set 15:00 NG.G17.E Feb 2017 (E) 3.741 3.758 -0.007 -0.19% set 15:00 NG.H17.E Mar 2017 (E) 3.695 3.705 -0.006 -0.16% set 15:00 NG.J17.E Apr 2017 (E) 3.460 3.460 3.450 3.492 +0.006 +0.17% set 15:00 NG.K17.E May 2017 (E) 3.850 3.850 3.850 3.497 +0.006 +0.17% set 15:00 NG.M17.E Jun 2017 (E) 3.500 3.500 3.500 3.531 +0.006 +0.17% set 15:00 NG.N17.E Jul 2017 (E) 4.225 3.566 +0.006 +0.17% set 15:00 NG.Q17.E Aug 2017 (E) 3.615 3.615 3.615 3.575 +0.006 +0.17% set 15:00 NG.U17.E Sep 2017 (E) 3.810 3.810 3.800 3.563 +0.006 +0.17% set 15:00 NG.V17.E Oct 2017 (E) 3.850 3.850 3.850 3.588 +0.006 +0.17% set 15:00 NG.X17.E Nov 2017 (E) 3.850 3.850 3.839 3.651 +0.006 +0.16% set 15:00 NG.Z17.E Dec 2017 (E) 3.771

CFA, Student Research Panhandle Oil and Gas Inc. (PHX)
36
Works Cited: Beattie, A. (2015). 5 biggest risks faced by oil and gas companies. Retrieved from:
http://www.investopedia.com/articles/fundamental-analysis/12/5-biggest-risks-faced-by-gas-and-oil-companies.asp
Bureau of Economic Analysis. (December 23, 2014). Gross domestic product: Third quarter 2014. Retrieved from:
http://www.bea.gov/newsreleases/national/gdp/gdpnewsrelease.htm
Bureau of Labor Statistics. (2015). Labor force statistics from the current population survey. Retrieved from:
http://data.bls.gov/timeseries/LNS14000000
FactSet
Investopedia. (2014). The industry handbook: The oil services industry. Retrieved from:
http://www.investopedia.com/features/industryhandbook/oil_services.asp
Mergent Online
Nyquist, S & Lund, S. (November 19, 2014). Shale revolution: Opportunity to jump-start economic growth. Retrieved from:
http://www.forbes.com/sites/realspin/2014/11/19/the-shale-revolution-is-an-opportunity-to-jump-start-economic-growth-in-
u-s/
Oil Shale and Tar Sands Programmatic EIS. (2012). About oil shale. Retrieved from: http://ostseis.anl.gov/guide/oilshale/
Panhandle Oil and Gas, Inc. (2013). Panhandle Oil and Gas, Inc. 2013 Annual Report. Retrieved from:
http://www.panhandleoilandgas.com/Websites/panhandle/images/annual%20reports/2013_Annual_Report_-_FINAL.pdf
Panhandle Oil and Gas, Inc. (2014). Business profile. Retrieved from: http://www.panhandleoilandgas.com/business-profile
Panhandle Oil and Gas, Inc. (2014). History. Retrieved from: http://www.panhandleoilandgas.com/history
Panhandle Oil and Gas, Inc. (2014). Panhandle Oil and Gas, Inc. Form 10-K. Retrieved from:
http://www.panhandleoilandgas.com/Websites/panhandle/images/9-30-14_10K_final.pdf
The Economist. (December 6, 2014). The new economics of oil: Sheikhs vs shale. Retrieved from:
http://www.economist.com/news/leaders/21635472-economics-oil-have-changed-some-businesses-will-go-bust-market-will-
be
U.S. Energy Information Administration. (December 30, 2014). U.S. field production of crude oil. Retrieved from:
http://www.eia.gov/dnav/pet/hist/LeafHandler.ashx?n=PET&s=MCRFPUS2&f=A
U.S. Energy Information Administration. (January 13, 2015). Short-term energy outlook: U.S. petroleum and other liquids. Retrieved
from: http://www.eia.gov/forecasts/steo/report/us_oil.cfm
University of Michigan. (2015). Survey of Consumers, Preliminary Results January 2015. Retrieved from:
http://www.sca.isr.umich.edu
Yahoo Finance. (September 30, 2014). Panhandle Oil and Gas, Inc. announces 36% proved reserve growth. Retrieved from:
http://finance.yahoo.com/news/panhandle-oil-gas-inc-announces-110000204.html

CFA, Student Research Panhandle Oil and Gas Inc. (PHX)
37
Disclosures: Ownership and material conflicts of interest: The author(s), or a member of their household, of this report does not hold a financial interest in the securities of this company. The author(s), or a member of their household, of this report does not know of the existence of any conflicts of interest that might bias the content or publication of this report. Receipt of compensation: Compensation of the author(s) of this report is not based on investment banking revenue. Position as a officer or director: The author(s), or a member of their household, does not serve as an officer, director or advisory board member of the subject company. Market making: The author(s) does not act as a market maker in the subject company’s securities. Disclaimer: The information set forth herein has been obtained or derived from sources generally available to the public and believed by the author(s) to be reliable, but the author(s) does not make any representation or warranty, express or implied, as to its accuracy or completeness. The information is not intended to be used as the basis of any investment decisions by any person or entity. This information does not constitute investment advice, nor is it an offer or a solicitation of an offer to buy or sell any security. This report should not be considered to be a recommendation by any individual affiliated with CFA Societies of Texas, Louisiana, and Oklahoma CFA Institute or the CFA Institute Research Challenge with regard to this company’s stock.