phy1025f practical manual - uct physics department · 2016 phy1025f practical manual 10 v1.1 –...
TRANSCRIPT

2016PHY1025FPracticalManual v1.1–January2016
PHY1025F
PRACTICAL
MANUAL

2016PHY1025FPracticalManual v1.1–January20162
Thispageintentionallyblank

2016PHY1025FPracticalManual v1.1–January20163
PHY1025FPracticalManual
TABLEOFCONTENTS
L1–ReactionTime..................................................................................................5
L2–Hooke’sLaw.....................................................................................................7
L3–LinearMotion..................................................................................................9
L4–Flywheel........................................................................................................11
L5–Viscosity.........................................................................................................15
L6–ThinLenses....................................................................................................15
L7–SpeedofaWaveonaString..........................................................................23
L8–ElectricFieldMapping...................................................................................25
L9–ElectricCircuitsWorksheet..................................[HandoutonDayofPractical]
N1–NotesfortheReactionTimePractical...........................................................27
Introduction......................................................................................................27
Planninganexperiment.....................................................................................27
Writingalaboratoryreport...............................................................................28
Graphsandbest-fitline.....................................................................................31
N3–NotesfortheLinearMotionPractical...........................................................32
TheLoggerProandLoggerLiteSoftware...........................................................32
UsingLoggerProandLoggerLite.......................................................................32
N5–NotesfortheViscosityPractical....................................................................34
LINEARFIT..........................................................................................................34
N6–NotesfortheThinLensesPractical................................................................34
TYPEAevaluationofuncertainty.......................................................................35
Comparingresults..............................................................................................36

2016PHY1025FPracticalManual v1.1–January20164
Thispageintentionallyblank
2016PHY1025FPracticalManual v1.1–January20165
L1–ReactionTime
Goals
1. Usea1Dkinematicequationtomeasureyourreactiontime2. Investigatehowavarietyofstimulimayimpactreactiontime3. Collectdataandproduceawell-formattedtable
Thedeliverableforthispracticalisanabbreviatedwrite-upincludingthefollowingsections:DATA,ANALYSIS,UNCERTAINTY,andCONCLUSIONS.
ReactionTimeMeasurement
Introduction
Reactiontimeisthetimebetweenastimulusandyourresponse.Thestimulusisprocessedbyyournervoussystembeforeyouareabletoreact,andthetimelagisyourreactiontime.Stimulicouldbevisual(sight),auditory(hearing),tactile(touch),olfactory(smell)orgustatory(taste).
Inthisexperimentyouwillbemeasuringyourreactiontimewhenpresentedwithvisual,auditoryandtactilestimulation. Theonlyequipmentyouwill need is ameter stick. Because thedistanceanobject falls is afunctionoftime,youcanmeasurethedistancethemeterstickdropsandusethistocalculateyourreactiontime.
Theformulaforanobjecttravelingatconstantaccelerationis:
𝑥 = 𝑥! + 𝑣!𝑡 +12𝑎𝑡! (1)
where 𝑥! initialpositionoftheobject 𝑣! initialvelocityoftheobject
𝑎 accelerationoftheobject,inthiscaseaccelerationduetogravity,9.8m/s2 𝑡 elapsedtime
Procedure
Beforeactuallyperformingeachexperiment,discusswithyourlabpartnersthedifferenttypeofstimulation(visual, auditory and tactile) andmakea prediction regarding howeachmight impact your reaction time.Whichtypeofstimuliwillproducethefastestreaction?Whichwillbetheslowest?Why?
Yourpartnershouldholdthemeterstick.Whenyourpartnerdropsthestick,catchitasquicklyasyoucan.Recordthenumberofcentimetersthestickfellbeforeyoucaughtit.Youmaytakethemeasurementatthebottom,middleortopofyourgrasp,butBECONSISTENT.Takeatleastthreemeasurementsforeachtypeofstimulus(themore,thebetter).Makesureyouareisolatingonlyonestimulus,e.g.don’twatchtherulerifyouaretestingforauditoryresponse!Repeattheprocedureforeachpartner.Recordyourowneactiontimesinawell-formattedtable(SeePage29forhelpwithformatting).

2016PHY1025FPracticalManual v1.1–January20166
Analysis
Onceyouhavecollectedyourdata,convert thedistance fallentotime(willneedtorearrangeEq. (1)andcaptureyourresultsinasecondwell-formattedtable. Includeonlyonesamplecalculation;theotherscanbe done with a calculator. Be careful with your units and be sure to calculate average values for eachstimulus.
Uncertainty
Answerthefollowingquestions:
1. What factors (sources of uncertainty)mayhave produced variation in your reaction time results?Aretheybigorsmall?
2. Howcouldyouminimizethesefactors?
Conclusions
QuestionstoconsiderwhenwritingyourCONCLUSIONS:
1. Forwhichstimuluswasyourreactiontimebest?Why?Diditcoincidewithyourprediction?2. Howdidyourreactiontimedifferfromyourpartners?Wasitasignificantdifference?3. Doyouthinkyoucouldimproveyourreactiontime?Ifso,how?4. Don’tforgettoconsiderthestandarddiscussionpointsforyourconclusion(don’tnecessarilyneed
touseallofthem,seepage30formoreinformation).a. Quotingthefinalresult.b. Comparingthisresultwithothersandmakingcommentsasappropriate.c. Discusstheuncertaintyinthepractical.d. Suggestwaystoimprovetheexperiment.

2016PHY1025FPracticalManual v1.1–January20167
L2–Hooke’sLaw
Goals
1. Investigatetherelationshipbetweenanextensionofaspringandthemagnitudeoftheappliedforce2. Drawingabest-fitlinetographicaldataanddeterminingtheslopeofthebest-fitline
Thedeliverableforthispracticalisanabbreviatedwrite-upincludingthefollowingsections:DATA,ANALYSIS,UNCERTAINTY,andCONCLUSIONS.
DeterminingaSpringConstant
Introduction
Ithasbeenobservedthattheapplicationofaforcetoaspiralspringwillcausetheextensionofthatspring.Whatisnotcleariswhethertherelationshipbetweentheappliedforceandextensionofthespringislinear,i.e.,willdoublingtheappliedforcedoubletheextension?
Thisrelationshipmaybedeterminedbyplottingagraphoftheappliedforcevs.springextensionandthen,iftherelationshipislinear,thespringconstantkcanbefoundbyapplyingHooke’sLaw:
𝐹 = 𝑘𝑥 (2)
where𝐹isthemagnitudeoftheappliedforceand𝑥isthemagnitudeofthespringextension.
NotethatwhenHooke’sLawisstatedinvectorform,theequationbecomes
𝐹 = −𝑘𝑥 (3)
where the negative sign indicates the direction of the force exerted by the spring with respect to thedisplacementoftheendofthespring, i.e., thespringreactsbyopposingtheextension𝑥,whilethespringconstant,𝑘,isalwaysapositivenumber.
Procedure
You are supplied with a spiral spring suspended from a retort stand, a small bucket, a number of ballbearingsofgivenmass,andametrestick.
In thisexperimentaknown force is applied to the spiral springbyhangingamass𝑚from theendof thespring.Themagnitudeoftheforceexertedonthespringis𝑚𝑔andtheextensionproducedbytheappliedforceismeasuredwiththeaidofthemetrestick.
Themassofeachballbearingisapproximately13.7grams.Confirmthemassofanyoneoftheballbearingsbyusingatriple-beambalance.
Beginbyattaching thebucket to theendof the springandusing thepointeron theendof the spring torecordtheheightofthebucketabovethetabletop.Nowaddtheballbearingsoneatatime,recordingthenewpositionofthepointeraseachballisadded.Takeasmanyreadingsasyoucan.Tabulatethedatainawell-formedtable.

2016PHY1025FPracticalManual v1.1–January20168
Analysis
Usingtheattachedinstructions,plotthedataonagraphofforce(y-axis)vs.extension(x-axis).
Drawalineof‘bestfit’byeye.
Note: If you obtain a straight-line graph that passes through the origin, then the extension is directlyproportionaltotheforceexertedonthespring.Ifthegraphisastraightline,butdoesnotpassthroughtheorigin,thenthegraphindicatesthattheextensionislinearlyrelatedtotheappliedforce,butisnotdirectlyproportional.
Ifitisestablishedthatthespringextensionisdirectlyproportionaltotheappliedforce,thentheconstantofthat proportionality can be obtained from the slope𝑚of the straight-line graph since the equation for astraightlineis𝑦 = 𝑚𝑥 + 𝑐.
Whenyoudeterminetheslopeofthebest-fitline,dosobychoosingtwoconvenientpointsthatareasfarapartaspossibleontheline.Whendetermining𝑚,donotusesomearbitrarypairofdatapoints;youneedtodeterminetheslopeofthebestfitline–nottheslopeofalinebetweentwoarbitrarydatapoints.
Fromtheslopeofthegraph,determinethespringconstant.
Uncertainty
Answerthefollowingquestions:
1. Whatfactorsmayhaveproducedvariationinyourmeasurements?Aretheybigorsmall?2. Howcouldyouminimizethesefactors?
Conclusions
QuestionstoconsiderwhenwritingyourCONCLUSIONS:
1. Quote your calculated spring constantwith appropriate units. Does this value seem reasonable?Whyorwhynot?
2. Howdoesyourvaluecomparetoonefromanothergroup?3. Areyouconfidentinyourresult?Howcouldyoubemoreconfidentinyourspringconstantvalue?

2016PHY1025FPracticalManual v1.1–January20169
L3–LinearMotion
Goal
1. Investigate linear motion, specifically position, velocity and acceleration using Vernier GoMotionsensors.
There is no formalwrite-up required for this practical, but youwill hand in a lab book inwhich you havetabulatedandgrapheddata,andinwhichyouwillhavemadenotesandansweredspecificquestionsaboutthetwoinvestigationsdoneduringthepractical.
Part1–AccelerationofaFreeFallingObject
Aim
The aim of Part 1 is to determine the accelerationwithwhich a free-falling object falls, and to considerwhetherthisagreeswiththegenerallyacceptedvalueofthegravitationalacceleration,g,inCapeTown.
Procedure
Theapparatus isaVernierGoMotionsensorthat isabletorecordthepositionofa free-fallingobject; thecomputationaldevicethatcontrols theGoMotionsensor isabletocalculatetherelevantpositionvs. timeandvelocityvs.timegraphs.(Usethe03LinearMotionPart1LoggerLiteTemplatefoundonVula.)
Pickyourfree-fallingobjectfromtheavailableselection:aplasticcone,anetballandaminisoccerball.
Capture asmany graphs as youneed – at least six (6) – and from these determine the rangeof possiblevaluesoftheaccelerationwithwhichthefree-fallingobjectfell.TherecommendedmethodtodeterminetheaccelerationistousetheLinearFitfunctiononaselectedportionofthevelocityvstimegraph.Notethattheansweryouwillgetwillnotbeaspecificvalue,althoughyouarewelcometodeterminetheaverageofthesevalues,butarangeofvalues,i.e.,theanswerisanintervalofnumbers.
Analysis
Isthegenerallyacceptedvalueofthegravitationalaccelerationofg=(9.79824±0.00044)m/s2withinyourmeasuredinterval?Commenteitherway.
Part2–CartonanInclinedPlane
Aim
TheaimofPart2istoinvestigatetheposition,velocityandaccelerationvs.timegraphsofacartthatgoesupanddownaninclinedplane.
Procedure
Theapparatuscomprisesofacartonaninclinedtrack,andaVernierGoMotionsensorthatisabletorecordthepositionof the cart (with reference to the sensor). At the bottomof the track there is a spring thatallowsthecartto‘bounce’backupthetrack.ThedesktopPCconnectedtotheGoMotionsensorisabletocalculatetherelevantmotiongraphs.(UsethePHY1025FPractical3Part2iconfoundonthedesktop.)

2016PHY1025FPracticalManual v1.1–January201610
Letthecartgofromthetopofthetrack(startthecartabout30cmfromthefaceofthesensor)andcaptureasetofgraphs–positionvs. time,velocityvs. time&accelerationvs. time–ofthecartas it runsupanddownthetrack.
Onceyouarehappywiththecapturedmotiongraphs,carefullycopythethreegraphs–byhand–ontoasinglepieceofgraphpaperandpastetheseinyourlabbook.
Analysis
Answerthefollowingquestions:
1. Is the acceleration always positive when the velocity is positive, and is the acceleration alwaysnegativewhenthevelocityisnegative?Whyorwhynot?
2. Istheaccelerationofthecartupthetrackthesameastheaccelerationofthecartdownthetrack?Whyorwhynot?

2016PHY1025FPracticalManual v1.1–January201611
L4–Flywheel
Goals
1. Investigatetherelationshipbetweenlinearmotionandangular(rotational)motion;andspecificallyinvestigatethetransferofpotentialenergyintolinearkineticenergy,rotationalkineticenergy,andthermalenergy.
2. Verifytheenergybalanceequationwhichisunderpinnedbythelawofconservationofenergy.
Thedeliverableforthispracticalisanabbreviatedwrite-upincludingthefollowingsections:DATA,ANALYSIS,UNCERTAINTY,andCONCLUSIONS.
ConservationofEnergy
Introduction
Consider the relationshipbetween theangular velocity𝜔(speedof rotation),of anobject likea flywheel,andtheinstantaneouslinearvelocity𝑣ofapointonthecircumferenceoftherotatingobject.SeeFigure1.Thelinearvelocity𝑣ofapointonthecircumferenceoftheaxlewilldependontheangularvelocity𝜔,andthedistanceofthepointfromthecentreofrotation,i.e.,theradius𝑟oftheaxle.
Figure1:Diagramshowingtherelationshipbetween𝜔and𝑣
Therelationshipbetweentheangularvelocity𝜔andthelinearvelocity𝑣is:
𝑣 = 𝜔𝑟 (4)
where 𝑣 linearvelocityatapointontherotatingobject(inm/s) 𝜔 angularvelocityoftheobject(inrad/s)
𝑟 distanceofthepointfromthecentreofrotation(inm)
NowconsiderthecaseofamassconnectedtotheflywheelasshowninFigure2.
2016PHY1025FPracticalManual v1.1–January201612
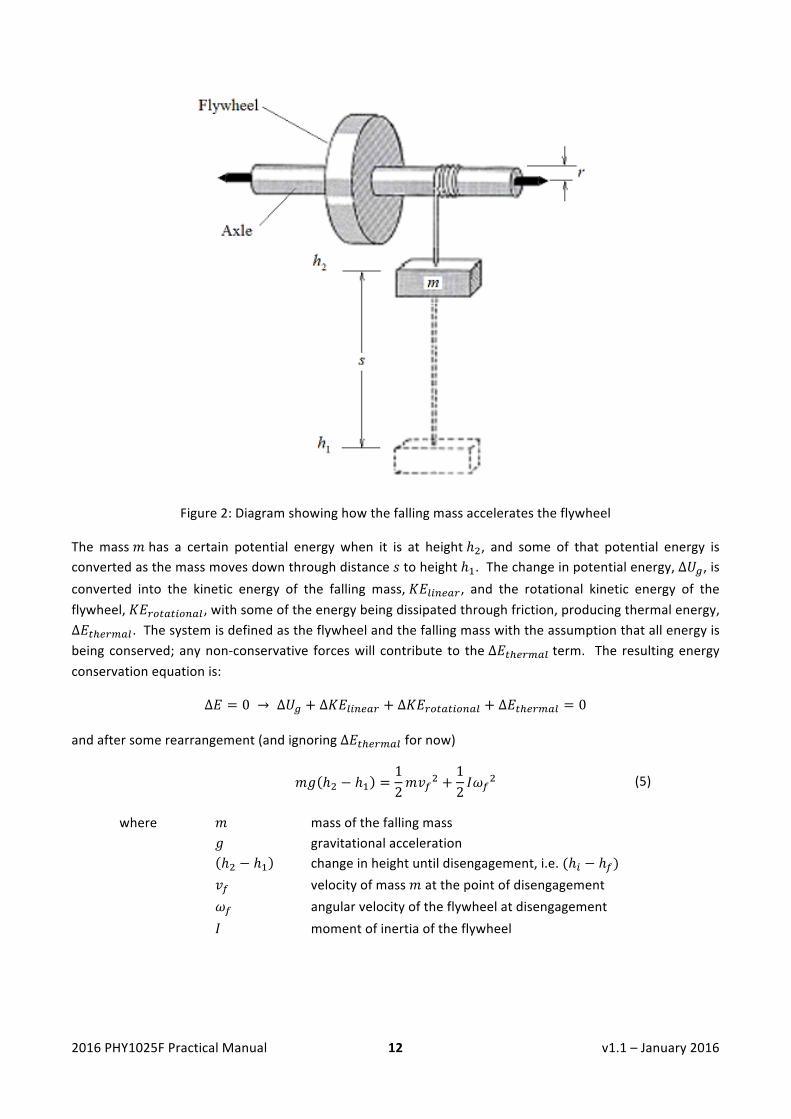
Figure2:Diagramshowinghowthefallingmassacceleratestheflywheel
Themass𝑚has a certain potential energy when it is at heightℎ!, and some of that potential energy isconvertedasthemassmovesdownthroughdistance𝑠toheightℎ!.Thechangeinpotentialenergy,∆𝑈!,isconverted into the kinetic energy of the falling mass,𝐾𝐸!"#$%&, and the rotational kinetic energy of theflywheel,𝐾𝐸!"#$#%"&$',withsomeoftheenergybeingdissipatedthroughfriction,producingthermalenergy,∆𝐸!!!"#$%.Thesystemisdefinedastheflywheelandthefallingmasswiththeassumptionthatallenergyisbeingconserved;anynon-conservative forceswill contribute to the∆𝐸!!!"#$% term. The resultingenergyconservationequationis:
∆𝐸 = 0 → ∆𝑈! + ∆𝐾𝐸!"#$%& + ∆𝐾𝐸!"#$#%"&$' + ∆𝐸!!!"#$% = 0
andaftersomerearrangement(andignoring∆𝐸!!!"#$% fornow)
𝑚𝑔 ℎ! − ℎ! =12𝑚𝑣!! +
12𝐼𝜔!! (5)
where 𝑚 massofthefallingmass 𝑔 gravitationalacceleration ℎ! − ℎ! changeinheightuntildisengagement,i.e.(ℎ! − ℎ!) 𝑣! velocityofmass𝑚atthepointofdisengagement 𝜔! angularvelocityoftheflywheelatdisengagement
𝐼 momentofinertiaoftheflywheel
2016PHY1025FPracticalManual v1.1–January201613
Themoment of inertia,𝐼, of an object, around some given axis of rotation, is a proportionality constantbetweentheappliedtorque𝜏andtheangularacceleration𝛼oftheobjectaroundthataxis.(Inasenseitistheequivalentofmassm in linearmotion,which isaproportionalityconstantbetweentheapplied force,𝐹andtheacceleration𝑎ofthemass,i.e.,𝐹 = 𝑚𝑎.)So,ingeneral,𝜏 = 𝐼𝛼.
Themomentofinertiaofanobject,aroundsomegivenaxis,dependsonthemassoftheobject,aswellasthewayinwhichthatmassisarrangedaroundtheaxisofrotation;morespecifically,𝐼dependsonthesumofthemassofeachparticleintheobject,multipliedbythesquareoftheradiusofrotationofeachparticlearoundthegivenaxis,i.e.𝐼!"! = 𝑚!𝑟!!
SubstitutingEq.(4)intoEq.(5),weget
𝑚𝑔 ℎ! − ℎ! =12𝑚𝑣! +
12𝐼𝑣𝑟
! (6)
Procedure
TheapparatustobeusedisshowninFigure2.
Mass𝑚isattachedtoalengthofstringandthefreeendofthestringcanbehookedontoapinontheaxleof the flywheel. Theaxlemaybe turnedsoas towind thestringaround thenarrowpartof the flywheel(radius𝑟)anumberoftimesasshown.Themassappliesaconstanttorque𝜏totheaxleandwhenthemassisreleasedfromrest,itacceleratestheflywheel(angularly),foraslongasthestringisconnectedtotheaxle.
• Usingatriple-beambalance,determineandrecordthemass𝑚.• Using theVernier calipers supplied to you, determine the diameter of the axle aroundwhich the
stringhasbeenturned,thencalculateandrecordtheradius𝑟oftheaxle.• Determineandrecordthedistance,𝑠 = (ℎ! − ℎ!),throughwhichthemasswillfallwhilethestring
appliesatorque𝜏totheflywheel.Therearetwopossiblewaystodeterminethedistance.o Usingameterstick,measuretheinitial(hi)andfinalposition(hf)ofthemass.o Usingthepositionvs. timegraphproducedbytheGoMotionsensor, the initialpositionof
themass(hi)willcorrespondtothelowestpointonthegraphandthefinalposition(hf)willcorrespondtothehighestpointonthegraph.
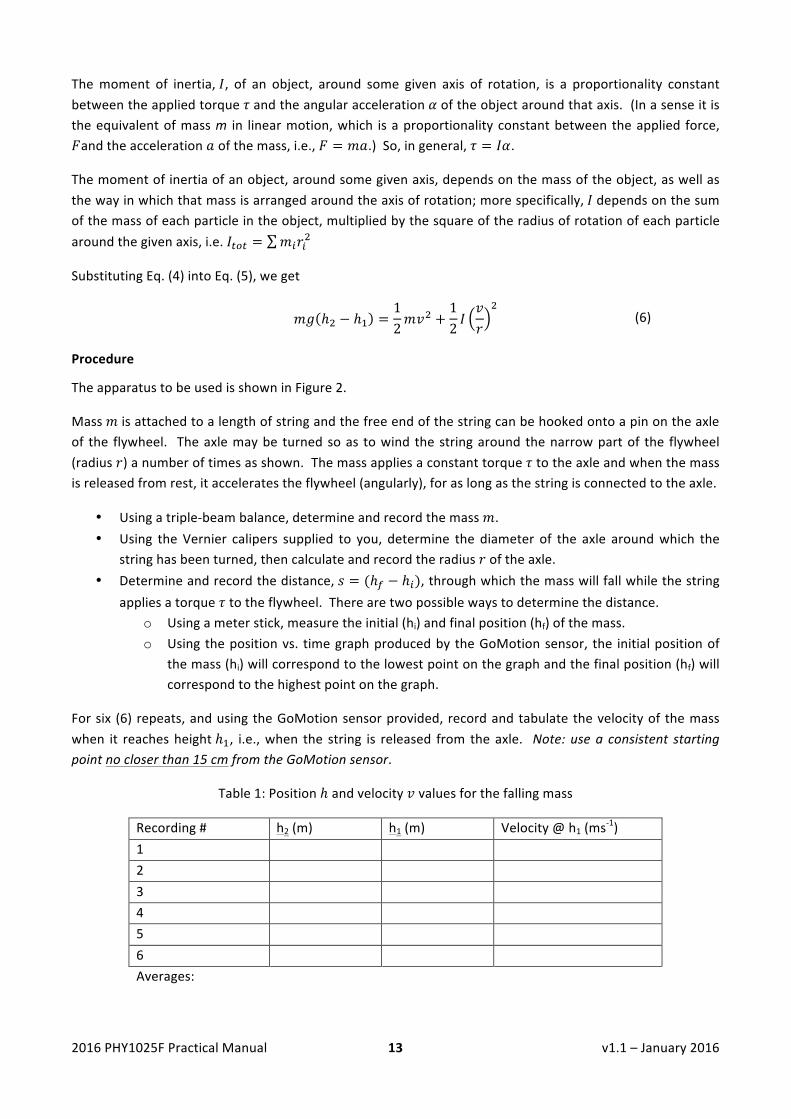
Forsix (6)repeats,andusingtheGoMotionsensorprovided,recordandtabulatethevelocityof themasswhen it reachesheightℎ!, i.e.,when the string is released from theaxle. Note:usea consistent startingpointnocloserthan15cmfromtheGoMotionsensor.
Table1:Positionℎandvelocity𝑣valuesforthefallingmass
Recording# h2(m) h1(m) Velocity@h1(ms-1)1 2 3 4 5 6 Averages:
2016PHY1025FPracticalManual v1.1–January201614
Analysis
Calculatethemeanvelocity(𝑣)fromthetabulatedreadings.Fromtherangeofvelocityvalues,estimatetheuncertainty𝑢(𝑣)inthemeasurementoftheaveragevelocity(atheightℎ!).
Using𝑔 = 9.8 𝑚𝑠!! and𝐼 = (31.0 ± 1.0)× 10!! 𝑘𝑔𝑚! , calculate∆𝑈! ,∆𝐾𝐸!"#$%& , and∆𝐾𝐸!"#$#%"&$' atthemomentthatthemassreachesheightℎ!.
Calculate a value for∆𝐸!!!"#$% . The energy equation (Eq. (6)) incorporating non-conservative forcesbecomes:
𝑚𝑔 ℎ! − ℎ! =12𝑚𝑣! +
12𝐼𝑣𝑟
!+ ∆𝐸!!!"#$% (7)
Uncertainty
Answerthefollowingquestions:
1. Whatfactors(sourcesofuncertainty)mayhaveproducedvariationinyourvelocitymeasurements?Aretheybigorsmall?
2. Howcouldyouminimizethesefactors?
Conclusions
QuestionstoconsiderwhenwritingyourCONCLUSIONS:
1. DotheseenergieslookreasonableanddotheysatisfyEq.(6)(i.e.does∆𝐾𝐸!"#$%& +∆𝐾𝐸!"#$#%"&$' =∆𝑈!)?
2. Whatnon-conservative forces contributed to your value for∆𝐸!!!"#$%? Did your∆𝐸!!!"#$% valuesurpriseyou?
3. Don’tforgettoconsiderthestandarddiscussionpointsforyourconclusiona. Quotingthefinalresult.b. Comparingthisresultwithothersandmakingcommentsasappropriate.c. Discusstheuncertaintyinthepractical.d. Suggestwaystoimprovetheexperiment.

2016PHY1025FPracticalManual v1.1–January201615
L5–Viscosity
Goals
1. Investigatetheeffectofthevariablesinhydrodynamicflowofaviscousliquid.2. Calculatetheviscosityofwater.3. Performevaluationofuncertaintyandcomparetoknownresults.4. Considerwhethersomesourcesofuncertaintycontributemoretothefinaluncertaintythanothers.
Thedeliverable for thispractical is anabbreviatedwrite-up including the following sections:PRELIMINARYINVESTIGATION,DATA,ANALYSIS,UNCERTAINTY,andCONCLUSIONS.
Aim
Theaimof thisexperiment is to investigate the relationshipbetween the flowofa liquid, thehydrostaticpressure,thelengthofthetubeandtheradiusofthetubethroughwhichtheliquidismoving.
Introduction
It has been observed that a pressure difference is required to enable the flow of a viscous fluid in longcylindricaltubeswithaconstantcross-section.Theresultingflowrate(Q)isproportionaltotheradiusofthetubetothepoweroffour.Thishasimportantimplicationsforairflowinlungalveoliandbloodflowinthearteries, and this practical will help you understand the physics behind administering a saline drip to apatient.
Thevolumetricflowrate,Q,isthevolumeofliquid,ΔV,flowinginatimeinterval,Δt,
𝑄 =∆𝑉∆𝑡
(8)
Theflowrateinapipeofconstantcross-sectionmaybedeterminedbyPoiseuille’sLaw,
𝑄 = 𝜋Δ𝑃 8𝜂𝐿
𝑟! (9)
whereΔP isthepressuredifferencebetweentheendsofthepipe,r istheconstantradiusofthepipe,L isthelengthofthepipeandηistheviscosityofthesolution.
The pressure difference in this example is the hydrostatic pressure due to the depth of fluid Δh (alsocommonlyreferredtoasthepressurehead),andthedensityofthefluid(ρwater=1g/cm3),
Δ𝑃 = 𝜌water𝑔∆ℎ (10)
Apparatus
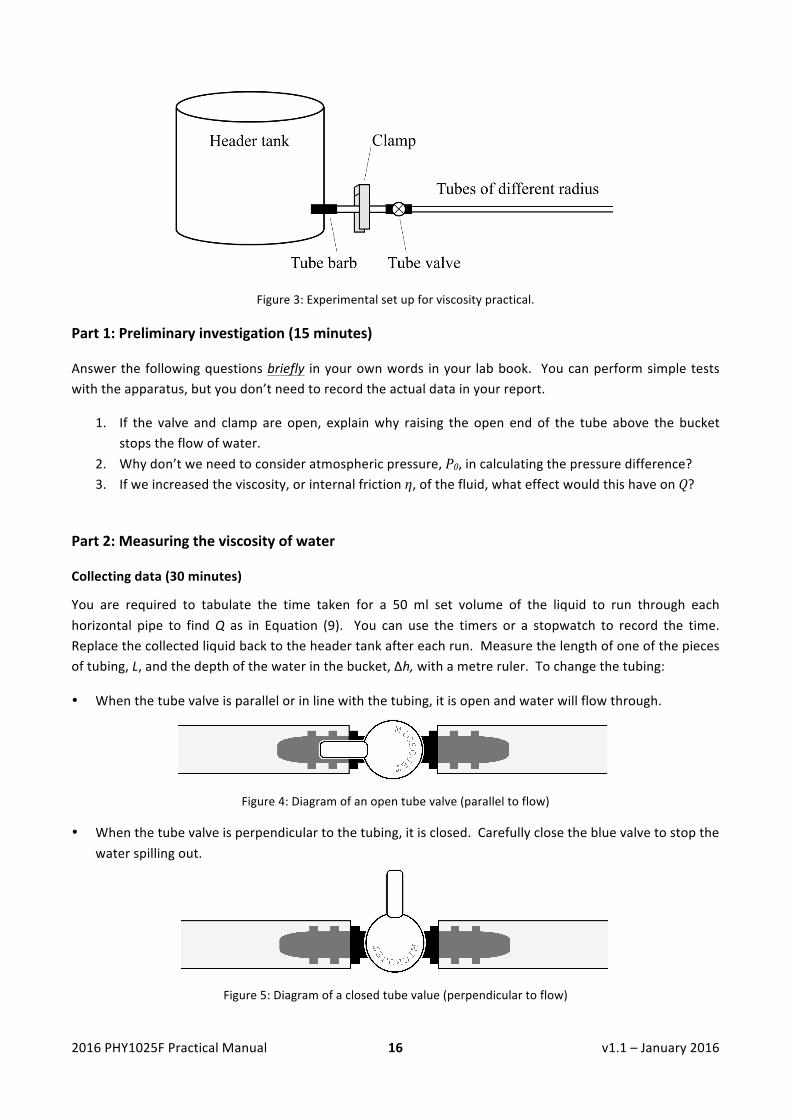
Youaresuppliedwitha‘header’tank(orabucketfilledwithwater),ametrerule,atubeclamp,ameasuringcylinder, and a stopwatch. You also have four plastic tubes – where each tube has a different internaldiameterof2.5,3.0,4.0,4.3mm. Someofthetubeshaveadaptersontheend,whichyoudon’tneedtoremove.Thereshouldbesometowelsnearbyintheeventofaspill.
2016PHY1025FPracticalManual v1.1–January201616
Figure3:Experimentalsetupforviscositypractical.
Part1:Preliminaryinvestigation(15minutes)
Answerthefollowingquestionsbriefly inyourownwords inyour labbook. Youcanperformsimpletestswiththeapparatus,butyoudon’tneedtorecordtheactualdatainyourreport.
1. If the valve and clamp are open, explainwhy raising the open end of the tube above the bucketstopstheflowofwater.
2. Whydon’tweneedtoconsideratmosphericpressure,P0,incalculatingthepressuredifference?3. Ifweincreasedtheviscosity,orinternalfrictionη,ofthefluid,whateffectwouldthishaveonQ?
Part2:Measuringtheviscosityofwater
Collectingdata(30minutes)
You are required to tabulate the time taken for a 50 ml set volume of the liquid to run through eachhorizontal pipe to findQ as in Equation (9). You can use the timers or a stopwatch to record the time.Replacethecollectedliquidbacktotheheadertankaftereachrun.Measurethelengthofoneofthepiecesoftubing,L,andthedepthofthewaterinthebucket,Δh,withametreruler.Tochangethetubing:
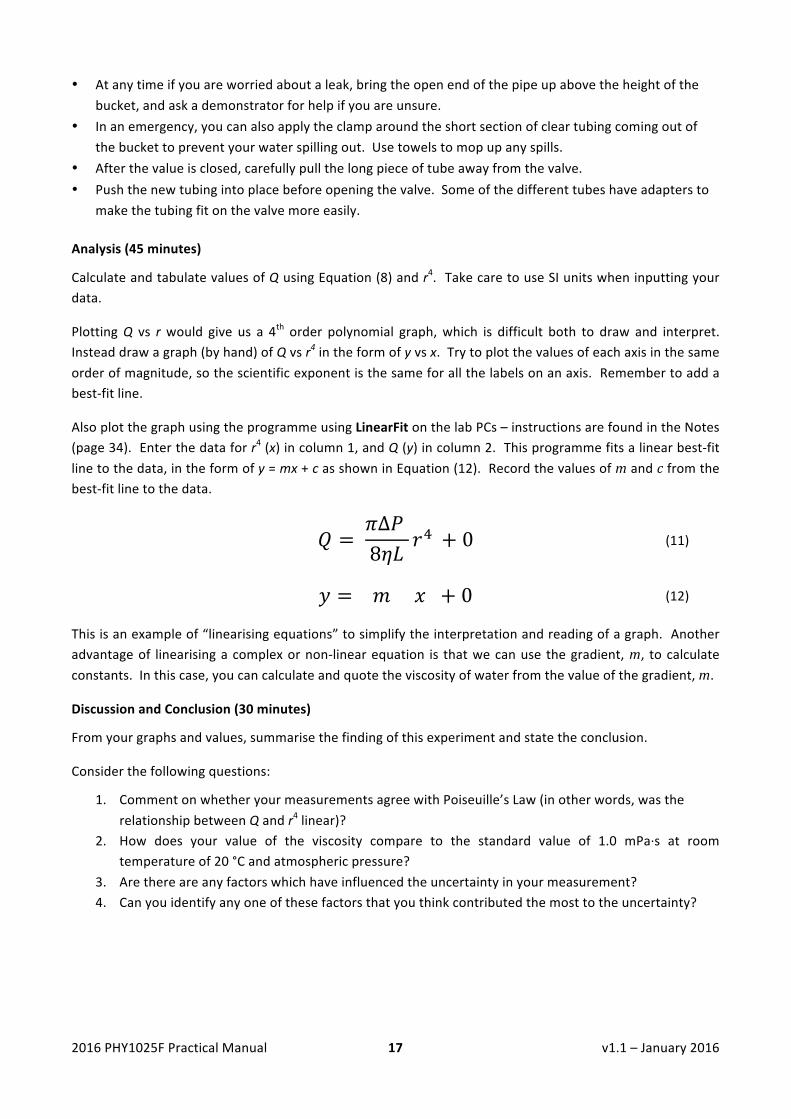
• Whenthetubevalveisparallelorinlinewiththetubing,itisopenandwaterwillflowthrough.
Figure4:Diagramofanopentubevalve(paralleltoflow)
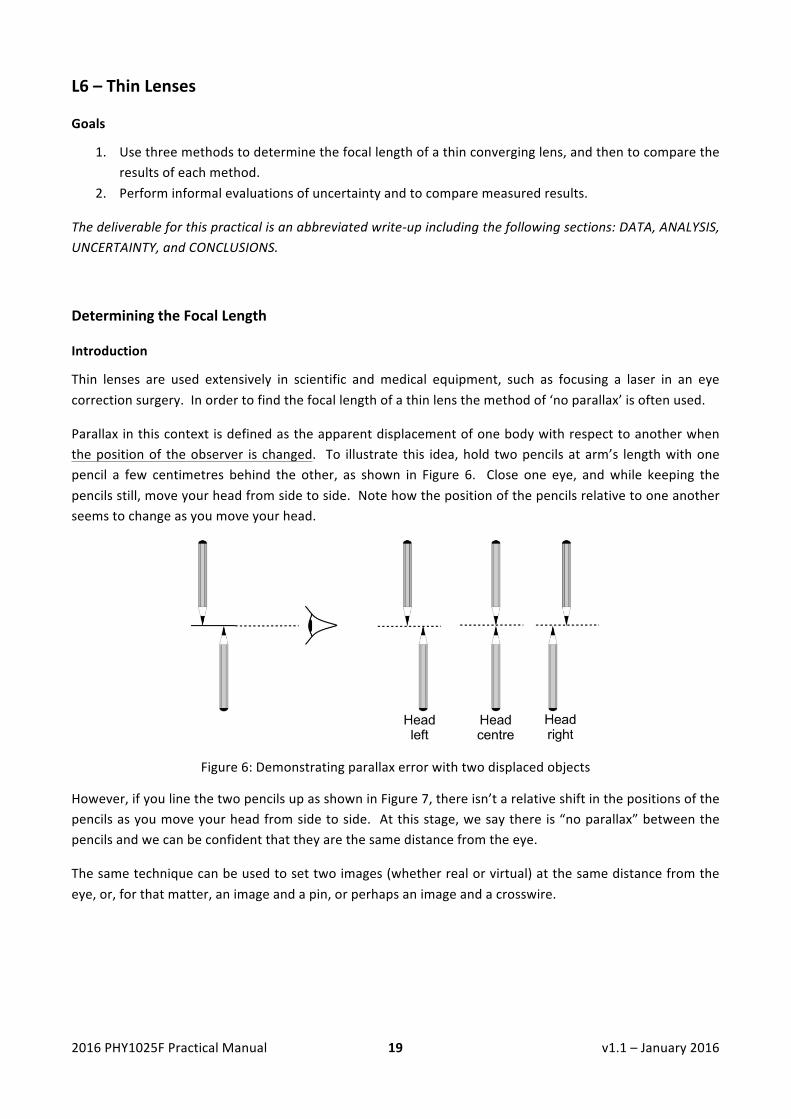
• Whenthetubevalveisperpendiculartothetubing,itisclosed.Carefullyclosethebluevalvetostopthewaterspillingout.
Figure5:Diagramofaclosedtubevalue(perpendiculartoflow)
2016PHY1025FPracticalManual v1.1–January201617
• Atanytimeifyouareworriedaboutaleak,bringtheopenendofthepipeupabovetheheightofthebucket,andaskademonstratorforhelpifyouareunsure.
• Inanemergency,youcanalsoapplytheclamparoundtheshortsectionofcleartubingcomingoutofthebuckettopreventyourwaterspillingout.Usetowelstomopupanyspills.
• Afterthevalueisclosed,carefullypullthelongpieceoftubeawayfromthevalve.• Pushthenewtubingintoplacebeforeopeningthevalve.Someofthedifferenttubeshaveadaptersto
makethetubingfitonthevalvemoreeasily.Analysis(45minutes)
CalculateandtabulatevaluesofQusingEquation(8)andr4.TakecaretouseSIunitswheninputtingyourdata.
PlottingQ vs r would give us a 4th order polynomial graph,which is difficult both to draw and interpret.Insteaddrawagraph(byhand)ofQvsr4intheformofyvsx.Trytoplotthevaluesofeachaxisinthesameorderofmagnitude,sothescientificexponentisthesameforallthelabelsonanaxis.Remembertoaddabest-fitline.
AlsoplotthegraphusingtheprogrammeusingLinearFitonthelabPCs–instructionsarefoundintheNotes(page34).Enterthedataforr4(x)incolumn1,andQ(y)incolumn2.Thisprogrammefitsalinearbest-fitlinetothedata,intheformofy=mx+casshowninEquation(12).Recordthevaluesofmandcfromthebest-fitlinetothedata.
𝑄 = 𝜋Δ𝑃 8𝜂𝐿
𝑟! + 0 (11)
𝑦 = 𝑚 𝑥 + 0 (12)
Thisisanexampleof“linearisingequations”tosimplifytheinterpretationandreadingofagraph.Anotheradvantageof linearisingacomplexornon-linearequation is thatwecanuse thegradient,m, tocalculateconstants.Inthiscase,youcancalculateandquotetheviscosityofwaterfromthevalueofthegradient,m.
DiscussionandConclusion(30minutes)
Fromyourgraphsandvalues,summarisethefindingofthisexperimentandstatetheconclusion.
Considerthefollowingquestions:
1. CommentonwhetheryourmeasurementsagreewithPoiseuille’sLaw(inotherwords,wastherelationshipbetweenQandr4linear)?
2. How does your value of the viscosity compare to the standard value of 1.0 mPa·s at roomtemperatureof20°Candatmosphericpressure?
3. Arethereareanyfactorswhichhaveinfluencedtheuncertaintyinyourmeasurement?4. Canyouidentifyanyoneofthesefactorsthatyouthinkcontributedthemosttotheuncertainty?

2016PHY1025FPracticalManual v1.1–January201618
Thispageintentionallyblank
2016PHY1025FPracticalManual v1.1–January201619
L6–ThinLenses
Goals
1. Usethreemethodstodeterminethefocallengthofathinconverginglens,andthentocomparetheresultsofeachmethod.
2. Performinformalevaluationsofuncertaintyandtocomparemeasuredresults.
Thedeliverableforthispracticalisanabbreviatedwrite-upincludingthefollowingsections:DATA,ANALYSIS,UNCERTAINTY,andCONCLUSIONS.
DeterminingtheFocalLength
Introduction
Thin lenses are used extensively in scientific andmedical equipment, such as focusing a laser in an eyecorrectionsurgery.Inordertofindthefocallengthofathinlensthemethodof‘noparallax’isoftenused.
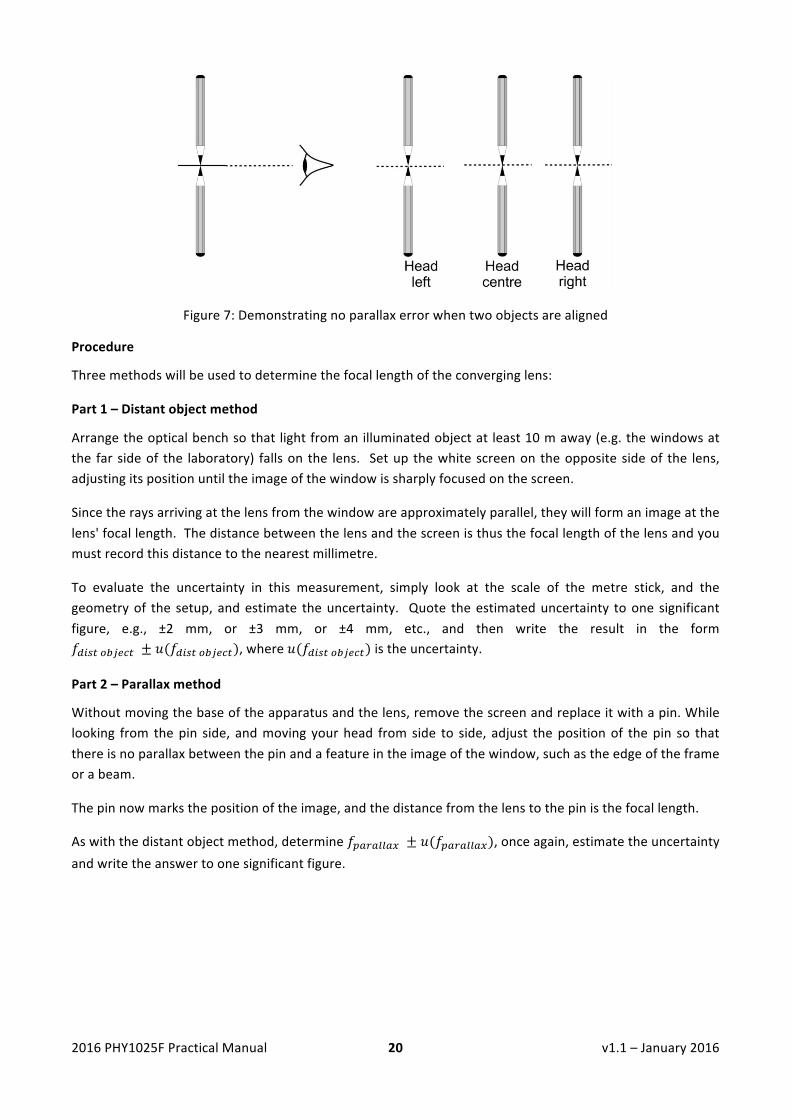
Parallaxinthiscontextisdefinedastheapparentdisplacementofonebodywithrespecttoanotherwhenthepositionof theobserver is changed. To illustrate this idea,hold twopencilsatarm’s lengthwithonepencil a few centimetres behind the other, as shown in Figure 6. Close one eye, andwhile keeping thepencilsstill,moveyourheadfromsidetoside.Notehowthepositionofthepencilsrelativetooneanotherseemstochangeasyoumoveyourhead.
Figure6:Demonstratingparallaxerrorwithtwodisplacedobjects
However,ifyoulinethetwopencilsupasshowninFigure7,thereisn’tarelativeshiftinthepositionsofthepencilsasyoumoveyourheadfromsidetoside. Atthisstage,wesaythereis“noparallax”betweenthepencilsandwecanbeconfidentthattheyarethesamedistancefromtheeye.
Thesametechniquecanbeusedtosettwoimages(whetherrealorvirtual)atthesamedistancefromtheeye,or,forthatmatter,animageandapin,orperhapsanimageandacrosswire.
2016PHY1025FPracticalManual v1.1–January201620
Figure7:Demonstratingnoparallaxerrorwhentwoobjectsarealigned
Procedure
Threemethodswillbeusedtodeterminethefocallengthoftheconverginglens:
Part1–Distantobjectmethod
Arrangetheopticalbenchsothatlightfromanilluminatedobjectatleast10maway(e.g.thewindowsatthe farsideof the laboratory) fallson the lens. Setupthewhitescreenontheoppositesideof the lens,adjustingitspositionuntiltheimageofthewindowissharplyfocusedonthescreen.
Sincetheraysarrivingatthelensfromthewindowareapproximatelyparallel,theywillformanimageatthelens'focallength.Thedistancebetweenthelensandthescreenisthusthefocallengthofthelensandyoumustrecordthisdistancetothenearestmillimetre.
To evaluate the uncertainty in this measurement, simply look at the scale of the metre stick, and thegeometryof the setup,andestimate theuncertainty. Quote theestimateduncertainty toone significantfigure, e.g., ±2 mm, or ±3 mm, or ±4 mm, etc., and then write the result in the form𝑓!"#$ !"#$%& ± 𝑢(𝑓!"#$ !"#$%&),where 𝑢(𝑓!"#$ !"#$%&)istheuncertainty.
Part2–Parallaxmethod
Withoutmovingthebaseoftheapparatusandthelens,removethescreenandreplaceitwithapin.Whilelooking from thepin side, andmoving yourhead fromside to side, adjust thepositionof thepin so thatthereisnoparallaxbetweenthepinandafeatureintheimageofthewindow,suchastheedgeoftheframeorabeam.
Thepinnowmarksthepositionoftheimage,andthedistancefromthelenstothepinisthefocallength.
Aswiththedistantobjectmethod,determine𝑓!"#"$$"% ± 𝑢(𝑓!"#"$$"%),onceagain,estimatetheuncertaintyandwritetheanswertoonesignificantfigure.
2016PHY1025FPracticalManual v1.1–January201621
Part3–Methodofconjugatefoci
Thismethodmakesuseofthelensequation:
1𝑓=
1𝑑!"#$%&
+1
𝑑!"!!" (13)
where 𝑓 focallengthofthelens 𝑑!"#$%& object-to-lensdistance 𝑑!"#$% image-to-lensdistance
Placethelensatthecentremarkoftheopticalbenchandtheobject-pinapproximately35cmfromthelens.Lookingfromtheimagesideofthelens-andusingthemethodofnoparallax–movetheimagepintowardsandawayfromthelensuntiltheimagepinisatthesamepositionastheimageitself.Adjusttheheightofthepinsandthelenstoseeboththeobjectpinandtheimagepininvertedatthesametime,similartoasshowninFigures1and2.
Recordthedistances𝑑!"#$%&and𝑑!"#$%.Itisnotnecessarytoestimatetheuncertainties.
Keeping the position of the lens fixed,move the object pin 3 cm further away from the lens. As before,locate the position of the image using themethod of no parallax andmeasure the distances𝑑!"#$%&and𝑑!"#$% onceagain.
Repeat theprocedurebymoving theobject pinover a rangeof positions (closer to and further from thelens)until youhave six setsofmeasurements for eachpositionof theobjectpin. Avoidobjectdistancesshorterthanthefocallengthofthelens,asfoundinMethod1.
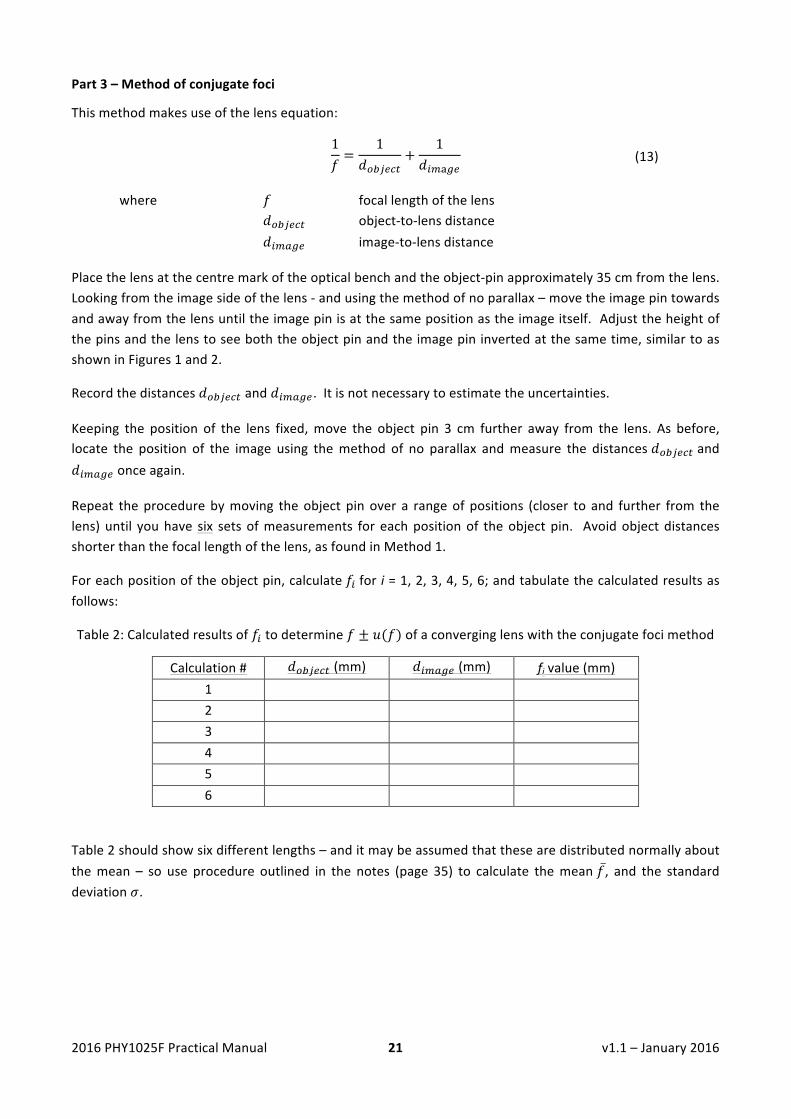
Foreachpositionoftheobjectpin,calculate𝑓! for i=1,2,3,4,5,6;andtabulatethecalculatedresultsasfollows:
Table2:Calculatedresultsof𝑓! todetermine𝑓 ± 𝑢(𝑓)ofaconverginglenswiththeconjugatefocimethod
Calculation# 𝑑!"#$%&(mm) 𝑑!"#$% (mm) fivalue(mm)1 2 3 4 5 6
Table2shouldshowsixdifferentlengths–anditmaybeassumedthatthesearedistributednormallyaboutthemean – so use procedure outlined in the notes (page 35) to calculate themean𝑓, and the standarddeviation𝜎.
2016PHY1025FPracticalManual v1.1–January201622
Todeterminethestandarduncertainty,𝑢(𝑓),inameasurementofthistype,youmustdividethestandarddeviationbythesquarerootofthenumberofreadingsused(sixinthiscase):
𝑢(𝑓) =𝜎6 (14)
When reporting this result,quote theuncertaintyof thismeasurement to twosignificant figures,e.g.,1.4mm,or2.3mm,etc.,andthenwritetheresultintheform:𝑓 ± 𝑢(𝑓).
Note: When you quote this result, write the mean𝑓 , to the same number of decimal places as theuncertainty:
Forexample:𝑓 ± 𝑢 𝑓 →154.6±3.8mm.
Analysis
Be careful with your units. Compare the results obtained for the focal length from the threemethods,consultingtheadditionalnotes(page36)forguidanceonhowtodothis.
Drawaraydiagramforeachpart,labellingtheobject,imageandfocallength.
Discusswhichoftheresultsyoubelievetobethemostcorrectandstatewhyyouthinkso.
Uncertainty
Answerthefollowingquestions:
1. Whatfactors(sourcesofuncertainty)mayhaveproducedvariationinyourmeasurements?Aretheybigorsmall?
2. Howcouldyouminimizethesefactors?
Conclusions
QuestionstoconsiderwhenwritingyourCONCLUSIONS:
1. Don’tforgettoconsiderthestandarddiscussionpointsforyourconclusion(don’tnecessarilyneedtouseallofthem)
a. Quotingthefinalresult.b. Comparingthisresultwithothersandmakingcommentsasappropriate.c. Discusstheuncertaintyinthepractical.d. Suggestwaystoimprovetheexperiment.
2016PHY1025FPracticalManual v1.1–January201623
L7–SpeedofaWaveonaString
Goals
1. Usetwomethodstomeasurethespeed𝑣withwhichawavemovesalongastretchedstring,andtocomparetheresultsofthetwomethods.
Thedeliverableforthispracticalisanabbreviatedwrite-upincludingthefollowingsections:DATA,ANALYSIS,UNCERTAINTY,andCONCLUSIONS.
Part1–VibratingString
Introduction
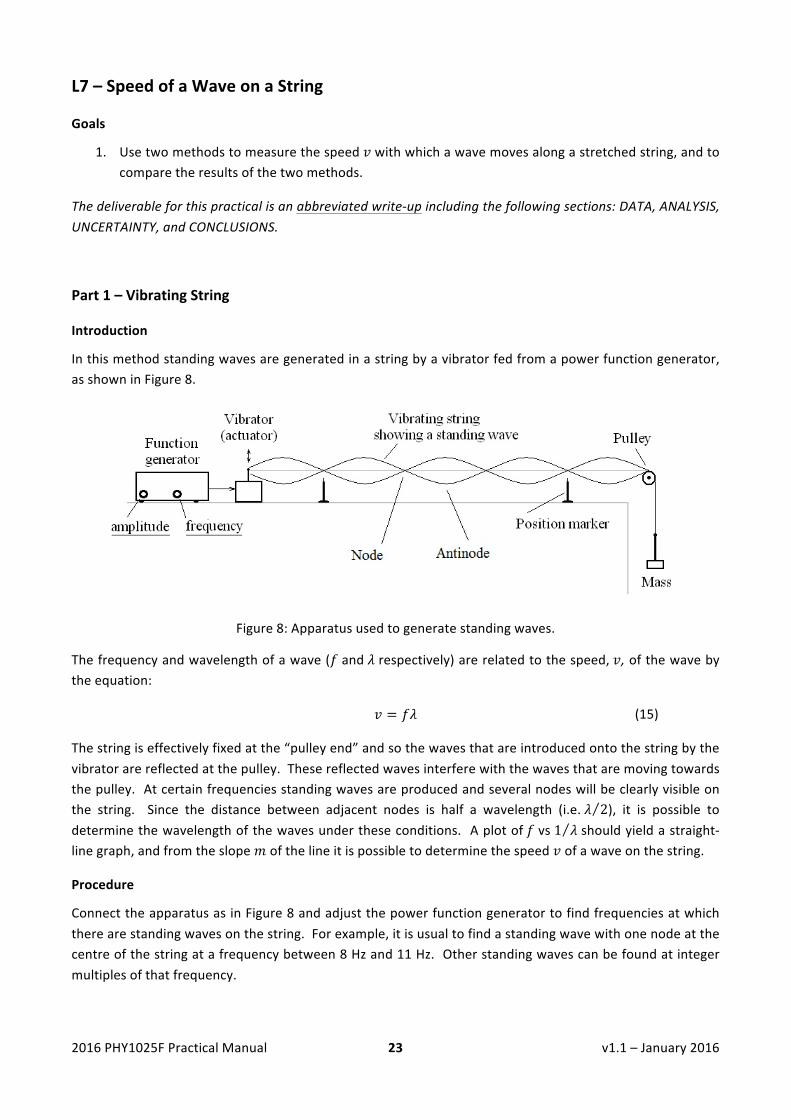
Inthismethodstandingwavesaregeneratedinastringbyavibratorfedfromapowerfunctiongenerator,asshowninFigure8.
Figure8:Apparatususedtogeneratestandingwaves.
Thefrequencyandwavelengthofawave(𝑓and𝜆respectively)arerelatedtothespeed,𝑣,ofthewavebytheequation:
𝑣 = 𝑓𝜆 (15)
Thestringiseffectivelyfixedatthe“pulleyend”andsothewavesthatareintroducedontothestringbythevibratorarereflectedatthepulley.Thesereflectedwavesinterferewiththewavesthataremovingtowardsthepulley.Atcertainfrequenciesstandingwavesareproducedandseveralnodeswillbeclearlyvisibleonthe string. Since the distance between adjacent nodes is half a wavelength (i.e.𝜆 2), it is possible todeterminethewavelengthofthewavesundertheseconditions. Aplotof𝑓vs1 𝜆shouldyieldastraight-linegraph,andfromtheslope𝑚ofthelineitispossibletodeterminethespeed𝑣ofawaveonthestring.
Procedure
ConnecttheapparatusasinFigure8andadjustthepowerfunctiongeneratortofindfrequenciesatwhichtherearestandingwavesonthestring.Forexample,itisusualtofindastandingwavewithonenodeatthecentreofthestringatafrequencybetween8Hzand11Hz.Otherstandingwavescanbefoundatintegermultiplesofthatfrequency.

2016PHY1025FPracticalManual v1.1–January201624
Note:
a) The amplitude adjustment should be as small as possible. If the vibratormakes a harshbrrrr…sound,youareoverdrivingit.
b) Sincethevibratorthatgeneratesthewavesonthestringismovingupanddown,thepointatwhichthestringisattachedtothevibratorisnotanode.
Togetthebestresults,measurethedistancebetweentheextremeleftandright-handnodesasshowninFigure8,andthencalculatethewavelengthλofasinglewave.
Recordthefrequency𝑓andwavelength𝜆foratleast6standingwaves.
PlotagraphBYHANDof𝑓vs1 𝜆.
Now determine the slope𝑚 ± 𝑢(𝑚) of the fitted line using LinearFit on the computers in the lab –instructions are found in the Notes (page 34). Note that𝑢(𝑚)is the uncertainty associated with thismeasurement.
Theslope𝑚 ± 𝑢(𝑚)representsthespeedofthewave,𝑣 ± 𝑢(𝑣)onthestring.
Part2–Mass/TensionCalculation
Introduction
Thespeedofawaveonastringisdependentuponthetension𝑇inthestringaswellasthemassperunitlength𝜇ofthestring:
𝑣 = 𝑇 𝜇 (16)
Bymeasuringthetension𝑇inthestringandthestring’smassperunitlength𝜇,itispossibletocalculatethespeed𝑣ofawaveonthestring.
Procedure
Useatriple-beambalancetomeasurethemassofthe‘masspiece’usedtostretchthestringandcalculatethetension𝑇inthestring;assuming𝑔=(9.80±0.02)ms-2.
Sinceonlyonekindofstringisusedinthisexperiment,usethetriplebeambalancetomeasurethemassofthegivenlengthofstring,andusethemetresticktomeasurethelengthofthatpieceofstring. Calculatethestring’smassperunitlength𝜇.
Finally, use equation (16) to calculate the predicted speed𝑣of awave on the string. Estimatewhat youbelievetheuncertaintyinthisresultmaybe,e.g.,2%,4%,6%,etc.
ComparisonofResults,Uncertainty&Conclusion
IncludethestandarddiscussionpointsforyourUNCERTAINTYandCONCLUSION,suchascomparetheresultsofthetwomethods,commentonthetworesultsandwhichyouconsidertobemorecorrect,compareyourresultswithothergroups,discussanypossiblesourcesofdiscrepanciesandhowyouwouldminimizethem.
2016PHY1025FPracticalManual v1.1–January201625
L8–ElectricFieldMapping
Goals
1. Investigatethenatureofatwo-dimensional,staticelectricfieldby:a. Determiningtheelectricpotentialatvariouspointsinthefield.b. Plottingtheequipotentiallinesinthefield.c. Consideringthegradients(‘downhill’slopes)betweentheequipotentiallines.d. Calculatingtheelectricfieldatvariouspoints.
Thedeliverableforthispracticalisanabbreviatedwrite-upincludingthefollowingsections:DATA,ANALYSIS,UNCERTAINTY,andCONCLUSIONS.
PlottingtheElectricPotential
Introduction
The concepts of an electric field𝑬and an electric potential𝑉in a region in space are not two different‘things’,theyaresimplytwointer-relatedmathematicalrepresentationsofthesamephenomenon. Inthestaticfieldsthatwillbeconsideredinthispractical,thesetworepresentationsarerelatedbytheequation:
∆𝑉 = −𝑬∆𝒔 (17)
where (consider𝑦 = 𝑚𝑥 + 𝑐), you can see that if you know how the electric potential,∆𝑉, changes in aregion in space,∆s, then you can determine the electric field,𝑬, which is represented by the ‘downhill’gradientofthechangeinpotential.
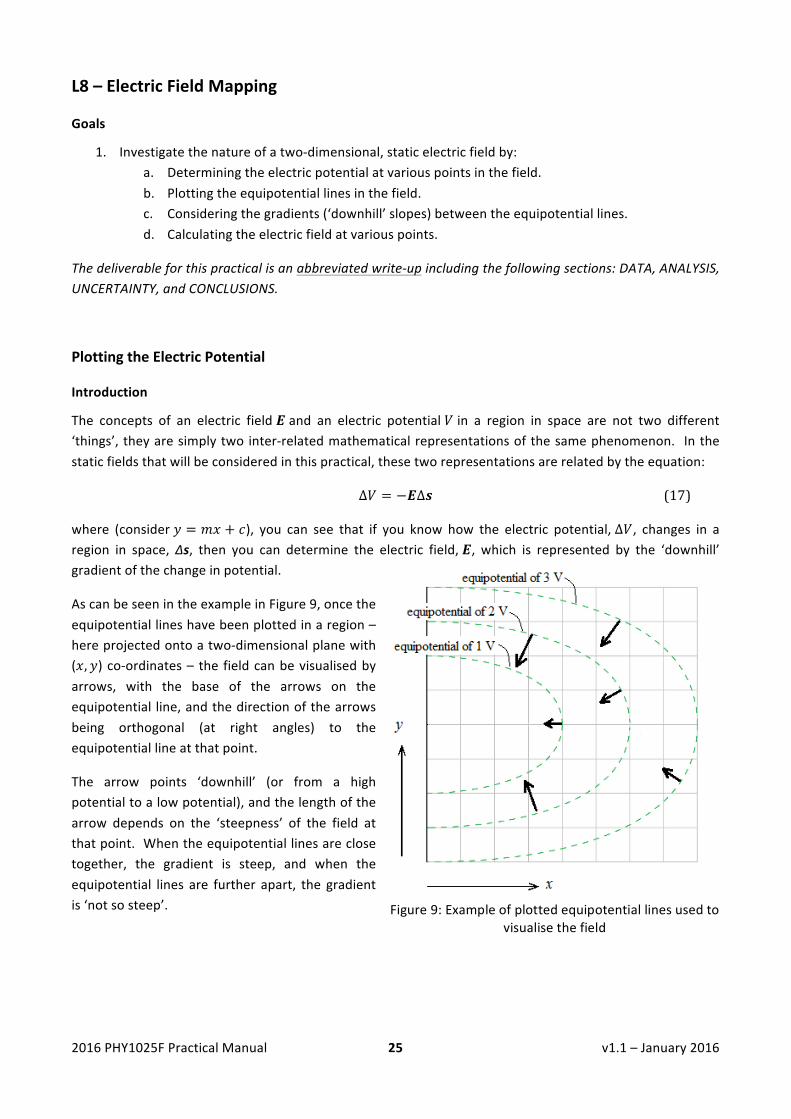
AscanbeseenintheexampleinFigure9,oncetheequipotentiallineshavebeenplottedinaregion–hereprojectedontoatwo-dimensionalplanewith(𝑥, 𝑦)co-ordinates– the fieldcanbevisualisedbyarrows, with the base of the arrows on theequipotential line,andthedirectionofthearrowsbeing orthogonal (at right angles) to theequipotentiallineatthatpoint.
The arrow points ‘downhill’ (or from a highpotentialtoalowpotential),andthelengthofthearrow depends on the ‘steepness’ of the field atthatpoint.Whentheequipotentiallinesareclosetogether, the gradient is steep, and when theequipotential lines are further apart, the gradientis‘notsosteep’.
Figure9:Exampleofplottedequipotentiallinesusedtovisualisethefield

2016PHY1025FPracticalManual v1.1–January201626
The apparatus consists of a signal generator, a digitalmulti-meter (DMM), twometal shapes and a clearPerspex tray in which there is a layer of water (3 mm to 4 mm deep). The signal generator, set to afrequencyofapproximately100Hzandanoutputvoltageof5VRMS,isconnectedtothemetalshapesasshown. The digitalmulti-meter is used to read the potential at various points in thewater; and the co-ordinates of each point is determined from a sheet of graph paperwhich is placed under the tray. TheselectedmetalshapesareplacedinthewaterasshowninFigure10.
Figure10:Apparatususedtoreadelectricpotentials
Note: Itwill be easier to track an individual electric potential value if you set theDMM to readonly onedecimalplace.UsetheRANGEbuttontocontrolthenumberofdecimalplaces.
Procedure
Foroneof the twoconfigurations shown inFigure11 takevoltage readingsatanumberofpointson theplane,sufficienttoplottheequipotentiallinesonasheetofgraphpaper.
After completing the equipotential lines, draw the electric field lines (as described in the introduction),sufficienttoinformthereaderthatyouhaveacleargraspofwhatthe𝑬fieldlookslike.
For a selected configuration, calculate the value of the𝑬field at 3differentlocationsbymeasuring∆𝑉and∆𝑠andusingEquation(17).
Uncertainty&Conclusion
Include the standard discussion points for your UNCERTAINTY andCONCLUSION, such as discuss any possible sources of discrepanciesandhowyouwouldminimizethem,commentonyourE-fieldresults,discuss the relationship between the electric field and potential,commentonthedifferentconfigurations,etc…
Figure11:ConfigurationstodeterminetheE-field.

2016PHY1025FPracticalManual v1.1–January201627
N1–NotesfortheReactionTimePractical
Introduction
ThepurposeofthePHY1025FpracticalsistodevelopskillsinaPhysicscontextthatwillberelevantforyourfutureinthemedicalprofession.Thesepracticalsaredesignedtoworkonthefollowingskills:Discovery(exploringconcepts),Measurement(takingdata),Graphs(displayingdata),Identifyingrelationships(manipulatingdataandvariables),Uncertainty(measurementsarenotexact,identifyingandpropagatinguncertainty)andDrawingConclusions(summarizingaresultbasedsolelyonwhatisobserved).
YourgradeforthePHY1025Fpracticalswillbebasedonyourlabreport.Eachweek,youwillbegivenan8-pagelabbookwhereyouwillcompleteyourwrite-upandthenhanditinattheendofeachpracticalsession.Duetotimeconstraints,youwillnotalwaysbeexpectedtocompleteafulllabreport,butyouwillalwayshavethefollowingsections:DATA,ANALYSIS,UNCERTAINTY,andCONCLUSIONS.Yourlabbookshouldcontainanymeasureddatainawell-formattedtablewithlabels,anexampleofanycalculationsperformed,copiesofanycompletedgraphs,adiscussionoftheuncertaintyinthepractical,andaclearandconcisesummaryofthepracticaldrawndirectlyfromyourobservations.Allworkshouldbecompletedinthelabbook;anyroughworkwillbeignoredwhilemarkingaslongasitisclearlyindicated.
Planninganexperiment
Thereisnofixed‘recipe’bywhichexperimentsinphysicsareperformedbutpleasenotethefollowing:
DO:
Discusswhatyouneedtodowithyourpartners.
Getafeelforhowtheapparatusworks;ifyouareuncertain,callademonstrator.
SetapageortwoasideinyourlabbookforROUGHNOTESandmakelotsofnotesthatcanbeusedinyourreport.
Drawupatableinwhichtorecordthereadingsyouwilltake;thistablewillprovideafocusforthework.Takethenecessaryreadingsandchecktoseeifthedatayouhavegatheredwillbeadequatetomeetthegoalsoftheexperiment.
Important:ALLrelevantinformationmustbecapturedINYOURLABBOOK…,notonscrapsofpaperornotepads.Youwillnotbeawardedmarks–neitherwillyoulosemarks–forneatness.
DONOT:
Wastetimecopyingtheinstructionsthatareinthemanual…;youwillnotgetmarksforreproducingtheinformationyouhavebeengiven.
StartwritingthereportbeforeyouhavecollectedtherelevantdataANDyouhaveconfirmedthatthecollecteddataareadequateforthetaskathand.

2016PHY1025FPracticalManual v1.1–January201628
Writingalaboratoryreport
Thepurposeofalaboratoryreportistocommunicatetheaim,theprocessandtheresultofanexperimenttoanoutsideaudience.
There aremany acceptableways to structure a laboratory report andwhile each component of a reportdescribedbelowneednothaveitsownheading–somecomponentscanbecombinedwithothers–allofthecomponentsreferredtoshouldbeaddressedinafulllabreport.
Titleofthereport:Thetitleshouldbeshortanddescriptive.Includethedateaswellasthenamesofthosewhoworkedwithyou.
Aim: State clearly and concisely what value was to be determined, or what phenomenon was to beinvestigated.
IntroductionandTheory:Thereportshouldgivethereaderthetheoreticalunderpinningoftheexperiment.Anyrelevantequationsshouldbeincludedinthissection.
The theorygivenhere lays the foundation for the later interpretation,analysis anddiscussionof thedatacollectedduringtheexperiment.
Apparatus: Show the apparatus used in simple labelled diagrams, sketches and/or circuits. Label thediagrams/sketches/circuitsasFigure1,orFigure2,etc.,asthecasemaybe.
Note:
• itisnotnecessarytomakedetaileddrawingsofminordetailslikeknobsoninstrumentsandtheshapesofboxesandwidgetsonstands;
• itisnotnecessarytodrawanexplodedviewoftheapparatus,and• itisnotnecessarytoprovidea‘partslist’.
Method: Themethod describes, in your ownwords, the procedures that were followedwhen doing theexperiment.Thesearetheproceduresusedtoobtaindataaswellasthoseusedtoanalysethatdata.
DO:Writeparagraphsinthepasttense,usinganimpersonalstyle.Forexample:
TheapparatususedisshowninFigure2…Fivereadingsweretakenandthesewererecordedin Table 1… The linearised data are shown in Table 2… A graph to show the relationshipbetweenAandBisshowninFigure3…Andsoon…
DONOT:Writeinpoint-for-pointform(yes,weknowwhatyouweretaughtatschool).
Donotpresentthemethodasthoughyouareprovidingarecipe.Forexample,donotwrite:• Fetchateabag,• Putitintoacup,• Addhotwater…
2016PHY1025FPracticalManual v1.1–January201629
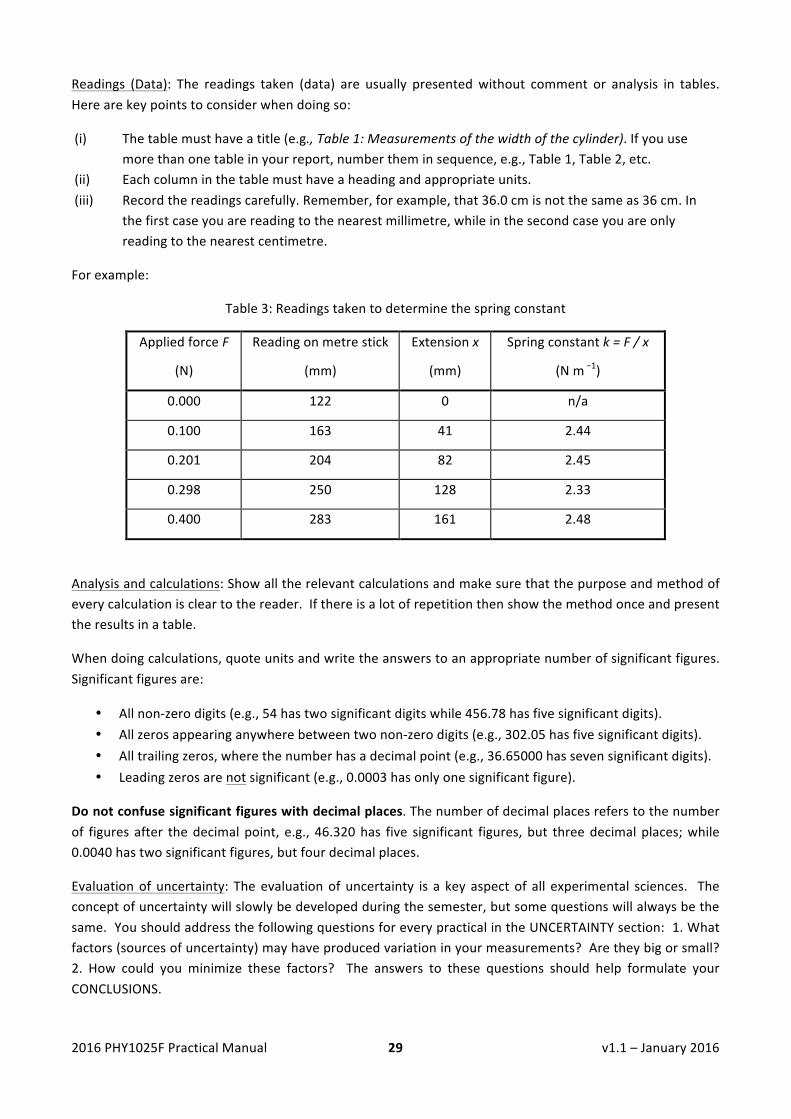
Readings (Data): The readings taken (data) are usually presentedwithout comment or analysis in tables.Herearekeypointstoconsiderwhendoingso:
(i) Thetablemusthaveatitle(e.g.,Table1:Measurementsofthewidthofthecylinder).Ifyouusemorethanonetableinyourreport,numbertheminsequence,e.g.,Table1,Table2,etc.
(ii) Eachcolumninthetablemusthaveaheadingandappropriateunits.(iii) Recordthereadingscarefully.Remember,forexample,that36.0cmisnotthesameas36cm.In
thefirstcaseyouarereadingtothenearestmillimetre,whileinthesecondcaseyouareonlyreadingtothenearestcentimetre.
Forexample:
Table3:Readingstakentodeterminethespringconstant
AppliedforceF
(N)
Readingonmetrestick
(mm)
Extensionx
(mm)
Springconstantk=F/x
(Nm−1)
0.000 122 0 n/a
0.100 163 41 2.44
0.201 204 82 2.45
0.298 250 128 2.33
0.400 283 161 2.48
Analysisandcalculations:Showalltherelevantcalculationsandmakesurethatthepurposeandmethodofeverycalculationiscleartothereader.Ifthereisalotofrepetitionthenshowthemethodonceandpresenttheresultsinatable.
Whendoingcalculations,quoteunitsandwritetheanswerstoanappropriatenumberofsignificantfigures.Significantfiguresare:
• Allnon-zerodigits(e.g.,54hastwosignificantdigitswhile456.78hasfivesignificantdigits).• Allzerosappearinganywherebetweentwonon-zerodigits(e.g.,302.05hasfivesignificantdigits).• Alltrailingzeros,wherethenumberhasadecimalpoint(e.g.,36.65000hassevensignificantdigits).• Leadingzerosarenotsignificant(e.g.,0.0003hasonlyonesignificantfigure).
Donotconfusesignificantfigureswithdecimalplaces.Thenumberofdecimalplacesreferstothenumberof figures after thedecimalpoint, e.g., 46.320has five significant figures, but threedecimalplaces;while0.0040hastwosignificantfigures,butfourdecimalplaces.
Evaluationofuncertainty: Theevaluationofuncertainty is a key aspectof all experimental sciences. Theconceptofuncertaintywillslowlybedevelopedduringthesemester,butsomequestionswillalwaysbethesame.YoushouldaddressthefollowingquestionsforeverypracticalintheUNCERTAINTYsection:1.Whatfactors(sourcesofuncertainty)mayhaveproducedvariationinyourmeasurements?Aretheybigorsmall?2. How could you minimize these factors? The answers to these questions should help formulate yourCONCLUSIONS.
2016PHY1025FPracticalManual v1.1–January201630
Interpretation,DiscussionandConclusion
Inthefinalcomponentsofthereportyouareexpectedtosummarisetheworkby:
• Quotingthefinalresult.• Comparingthisresultwithothersandmakingcommentsasappropriate.• Discusstheuncertaintyinthepractical.• Suggestwaystoimprovetheexperiment.
Forexample,ifyouraimwastomeasuregyoushould,inasentence,statethemethodthatwasusedandgivetheresult.Forexample,youmaysay:
Asimplependulumwasusedtodeterminethevalueoftheearth’sgravitationalaccelerationinCapeTown.Theresultof theexperimentwasthatgwasdeterminedtobe(9.790±0.052)ms−2,withacoverageprobabilityof68%.ThisresultagreeswithinexperimentaluncertaintywiththegivenvalueforginCapeTownwhichis(9.79824±0.00044)ms-2.
Be careful not to mix facts with opinions and avoid meaningless phrases such as “this was a successfulexperiment.” Finally, the explanation that some or other result was influenced by “human error” isdiscouraged; if a human error has been made you are expected to correct that error by repeating theexperiment.

2016PHY1025FPracticalManual v1.1–January201631
Graphsandbest-fitline
Graphsareessential for thesuccessfulcommunicationofexperiments, sodrawthemas largeaspossible.Everygraphhastohaveatitledescribingthepurposeforwhichithasbeenpresented(e.g.,Figure3:Plottodeterminetheviscosityofthesampleofoil),andifthereismorethanonegraph,numberthemsequentially,e.g.,Figure1,Figure2,etc.
Thegeneralrulesforplottinggraphsare:
• WhenaskedtoplotthegraphofsayPvs.Q,itmeansthatPmustbeontheverticalaxis(y-axis)andQmustbeonthehorizontalaxis(x-axis).
• Eachaxisshouldbelabelledwiththenameofthevariableandtheunits.• Axesshouldbemarkedinscalingfactorsof1,2,5,orthesetopowersoften.Scalingfactorssuchas
3or4usuallymakethescalesdifficulttoreadandshouldbeavoided.• Usea¤or×toshowthedatapoints…,notal(blob).
Forexample:
Inalotofexperimentalworkyouwillneedtodrawalineofbestfitbyeye.
Pleasenote:
• thebestfitlinedoesnotsimplyjointhedatapoints;• thebestfitlinehastomodelthetrendinthedata;and• itispossiblethatthebestfitlinemaynotevengothroughanyofthedatapointsasshowninthe
exampleabove.

2016PHY1025FPracticalManual v1.1–January201632
N3–NotesfortheLinearMotionPractical
TheLoggerProandLoggerLiteSoftware
VernierSoftwaredevelopseducationaldata-collectinginterfacesandthecorrespondingsoftware.TherearetwolevelsofthesoftwarethatinterfaceswiththeGo!Motionsensor:LoggerPro(forpurchase)andLoggerLite(freelyavailable).Forthelinearmotionpractical,wewillbeusingbothversionsofthesoftware(LoggerLiteforPart1andLoggerProforPart2).
ForthesetwopartsoftheLinearMotionpractical,templateshavebeenalreadycreatedinordertominimizethesetupofthesoftware.ThePart1template(entitled:03LinearMotionPart1LoggerLiteTemplate)isavailableonVulafordownload.ThePart2template(entitled:PHY1025FPractical3Part2)willbeavailableonthedesktopPCinPHYLAB1.ThereisalsoaLoggerLiteversion(entitled:03LinearMotionPart2LoggerLiteTemplate)availableonVulaifyouwouldprefertouseyourlaptopforPart2.
Inorder touseLoggerLiteonyour laptop (PCorMac),youwillneed todownload thesoftware fromtheVernier website (http://www.vernier.com/products/software/logger-lite/) and then install it on yourcomputer.[ItwillalsobeavailableonthecourseVulasite.]Hopefullyyouhavedonethisbeforearrivingtothelab.
UsingLoggerProandLoggerLite
The Logger Pro and Logger Lite software is fairly straight-forward to use, but here are a list of usefulcommandsandfeatures.
Fromthetoolbar:
…tostartcollectingdata
…tostopdatacollection(templateswillautomaticallystopreadingafteranallottedtime)
…toscaleyourgraphautomatically
…forthecursor
…tosavedatainLoggerLiteFormat

2016PHY1025FPracticalManual v1.1–January201633
Fromthemenu(morecommon):
File … Save …tosavedatainLoggerLiteformat
Data … Clear All Data …tocleardata
Analyze … Autoscale …toscaleyourgraphautomatically
Analyze … Examine …foracursor
Analyze … Linear Fit …tofitalinetotheselecteddata(selectdatausingcursor)
Fromthemenu(lesscommon):
File … Export As …tosaveasCSVortextfile(forlateranalysisinExcel,etc)
Insert … Graph …toaddavelocityoraccelerationgraph
Page … Auto Arrange …toautomaticallyarrangegraphsonthepage
Experiment … Data Collection …toadjustdatacollectionparameters(pre-setifusingtemplates)
2016PHY1025FPracticalManual v1.1–January201634
N5–NotesfortheViscosityPractical
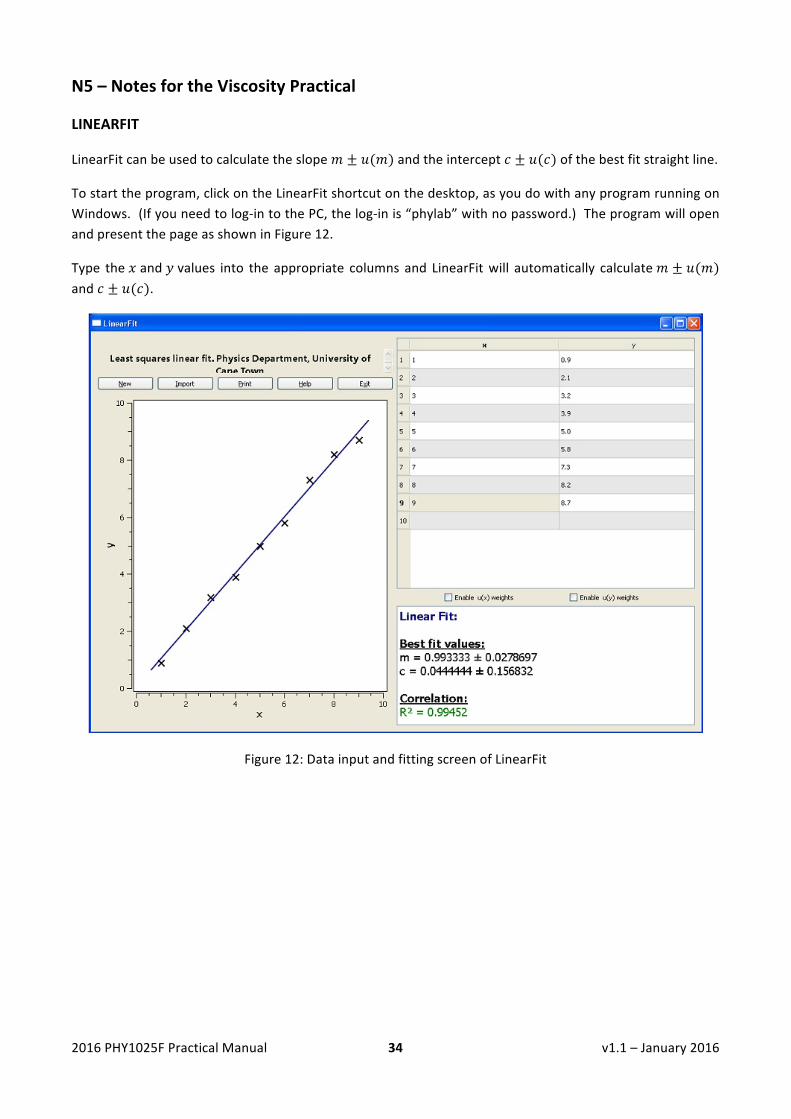
LINEARFIT
LinearFitcanbeusedtocalculatetheslope𝑚 ± 𝑢(𝑚)andtheintercept𝑐 ± 𝑢(𝑐)ofthebestfitstraightline.
Tostarttheprogram,clickontheLinearFitshortcutonthedesktop,asyoudowithanyprogramrunningonWindows.(Ifyouneedtolog-intothePC,thelog-inis“phylab”withnopassword.)TheprogramwillopenandpresentthepageasshowninFigure12.
Type the𝑥and𝑦values into the appropriate columns and LinearFitwill automatically calculate𝑚 ± 𝑢(𝑚)and𝑐 ± 𝑢(𝑐).
Figure12:DatainputandfittingscreenofLinearFit
2016PHY1025FPracticalManual v1.1–January201635
N6–NotesfortheThinLensesPractical
TYPEAevaluationofuncertainty
InaTYPEAevaluationoftheuncertainty,astatisticalmethodisusedto inferthevalueoftheuncertaintyassociatedwithameasurementbyquantifyingthe“scatter”,orthe“spread”inthevaluesofasetofdata.
Thecasewherethedataareasetofreadingsoftheform:x1,x2,x3,…
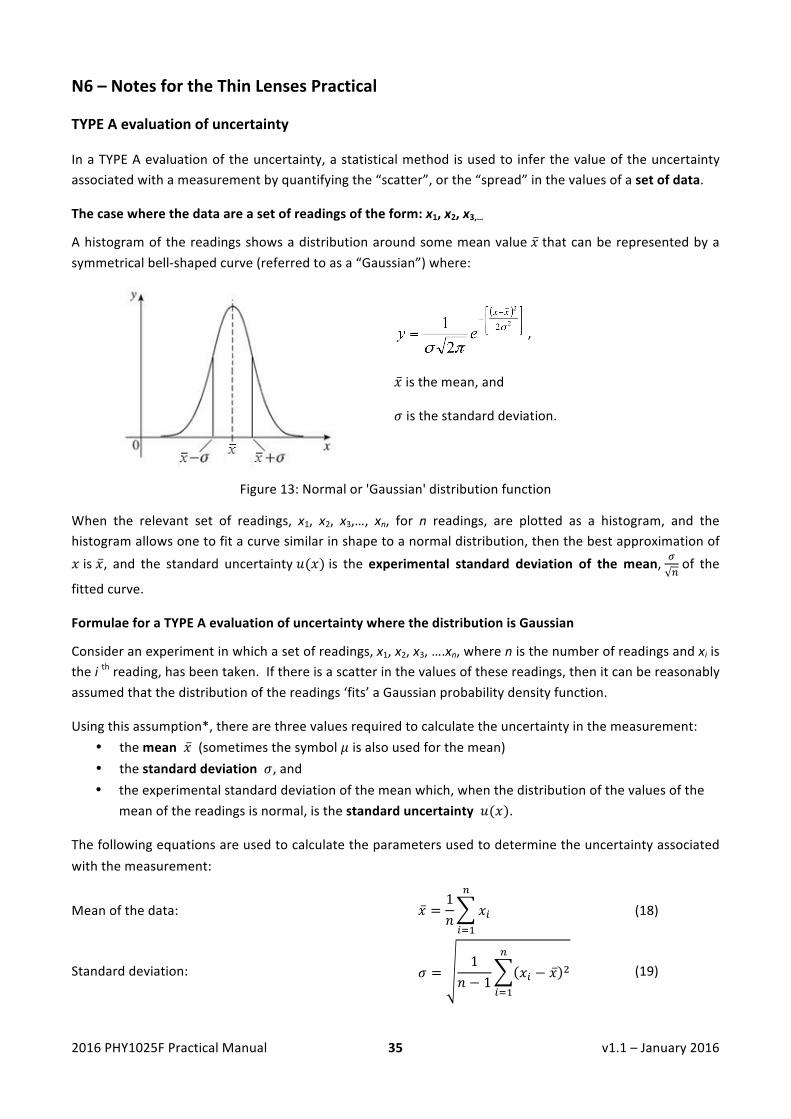
Ahistogramofthereadingsshowsadistributionaroundsomemeanvalue𝑥thatcanberepresentedbyasymmetricalbell-shapedcurve(referredtoasa“Gaussian”)where:
Figure13:Normalor'Gaussian'distributionfunction
When the relevant set of readings, x1, x2, x3,…, xn, for n readings, are plotted as a histogram, and thehistogramallowsonetofitacurvesimilarinshapetoanormaldistribution,thenthebestapproximationof𝑥is𝑥, and the standard uncertainty𝑢(𝑥)is the experimental standard deviation of the mean, !
!of the
fittedcurve.
FormulaeforaTYPEAevaluationofuncertaintywherethedistributionisGaussian
Consideranexperimentinwhichasetofreadings,x1,x2,x3,….xn,wherenisthenumberofreadingsandxiistheithreading,hasbeentaken.Ifthereisascatterinthevaluesofthesereadings,thenitcanbereasonablyassumedthatthedistributionofthereadings‘fits’aGaussianprobabilitydensityfunction.
Usingthisassumption*,therearethreevaluesrequiredtocalculatetheuncertaintyinthemeasurement:• themean𝑥(sometimesthesymbol𝜇isalsousedforthemean)• thestandarddeviation𝜎,and• theexperimentalstandarddeviationofthemeanwhich,whenthedistributionofthevaluesofthe
meanofthereadingsisnormal,isthestandarduncertainty𝑢(𝑥).
Thefollowingequationsareusedtocalculatetheparametersusedtodeterminetheuncertaintyassociatedwiththemeasurement:
Meanofthedata: 𝑥 =1𝑛
𝑥!
!
!!!
(18)
Standarddeviation: 𝜎 =1
𝑛 − 1𝑥! − 𝑥 !
!
!!!
(19)
,
�̅�isthemean,and
𝜎isthestandarddeviation.
2016PHY1025FPracticalManual v1.1–January201636
Standarduncertainty:ortheexperimentalstandarddeviationofthemean
𝑢(𝑥) =𝜎𝑛 (20)
Note:1) *Theassumptionthatthedistributionofthevaluesofthereadingsisnormalvalidatesthestatement
that“theexperimentalstandarddeviationofthemeanisthestandarduncertaintyu(x)”forthemajorityofcases.However,itisimportanttorealisethatadifferentapproachmayberequiredwherethedistributionofvaluesisnot‘normal’.
2) BecauseaGaussiandistributionwasassumed,theprobabilitythatthemeasurandlieswithinonestandarduncertaintyofthebestapproximation,is68%.
Comparingresults
Tosay that tworesultsare“close”or“nearly thesame” ismeaningless in thecontextof laboratorywork.Theresultsofanytwoexperimentscanonlybemeaningfullycomparediftheintervalsassociatedwitheachoftheresultsareknown.
Morespecifically:• Iftheintervalsthatrepresenttheresultsoftwomeasurementsoverlap,thenwesaythesetwo
results“agreewithinexperimentaluncertainty.”• Iftheintervalsthatrepresenttheresultsoftwomeasurementsdonotoverlap,thenwesaythese
results“donotagreewithinexperimentaluncertainty.”
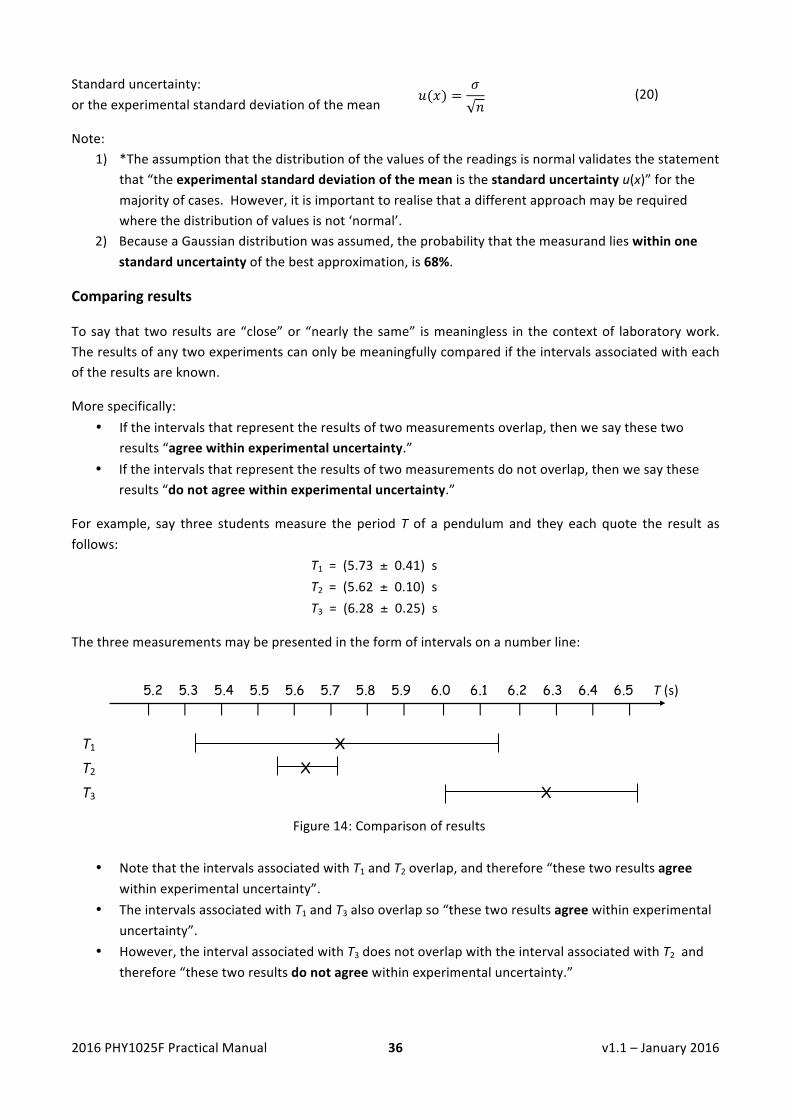
For example, say three studentsmeasure the periodTof a pendulum and they each quote the result asfollows:
T1=(5.73±0.41)s
T2=(5.62±0.10)s T3=(6.28±0.25)s
Thethreemeasurementsmaybepresentedintheformofintervalsonanumberline:
• NotethattheintervalsassociatedwithT1andT2overlap,andtherefore“thesetworesultsagreewithinexperimentaluncertainty”.
• TheintervalsassociatedwithT1andT3alsooverlapso“thesetworesultsagreewithinexperimentaluncertainty”.
• However,theintervalassociatedwithT3doesnotoverlapwiththeintervalassociatedwithT2andtherefore“thesetworesultsdonotagreewithinexperimentaluncertainty.”
5.2 5.3 5.4 5.5 5.6 5.7 5.8 5.9 6.0 6.1 6.2 6.3 6.4 6.5 T(s) ||||||||||||||
T1 X T2 X T3 X
Figure14:Comparisonofresults