phylogenetic analysis caro-beth stewart, ph.d. associate professor department of biological sciences...
Post on 21-Dec-2015
257 views
TRANSCRIPT
Phylogenetic Analysis
Caro-Beth Stewart, Ph.D.
Associate Professor
Department of Biological Sciences
University at Albany, SUNY
Albany, New York 12222
Lecture presented at the National Human Genome Research Institute for the course Current Topics in Genome Analysis 2000
C-B Stewart, NHGRI lecture, 12/5/00
What is phylogenetic analysis and why should we perform it?
Phylogenetic analysis has two major components:
1. Phylogeny inference or “tree building” — the inference of the branching orders, and ultimately the evolutionary relationships, between “taxa” (entities such as genes, populations, species, etc.)
2. Character and rate analysis —using phylogenies as analytical frameworks for rigorous understanding of the evolution of various traits or conditions of interest
C-B Stewart, NHGRI lecture, 12/5/00
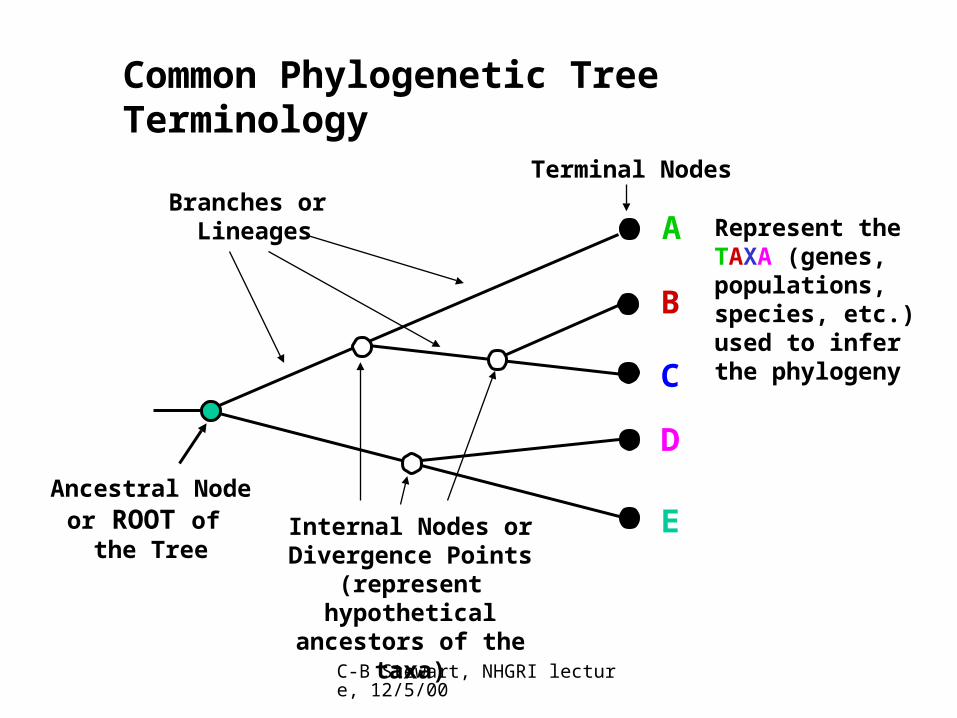
Ancestral Node or ROOT of
the TreeInternal Nodes orDivergence Points
(represent hypothetical ancestors of the taxa)
Branches or Lineages
Terminal Nodes
A
B
C
D
E
Represent theTAXA (genes,populations,species, etc.)used to inferthe phylogeny
Common Phylogenetic Tree Terminology
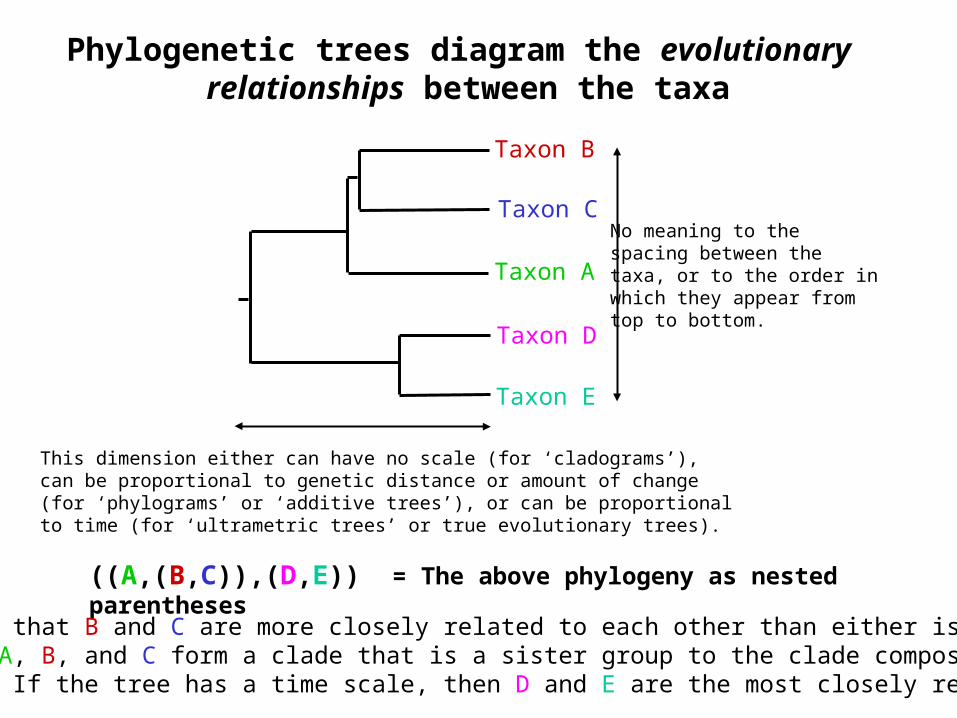
Phylogenetic trees diagram the evolutionary relationships between the taxa
((A,(B,C)),(D,E)) = The above phylogeny as nested parentheses
Taxon A
Taxon B
Taxon C
Taxon E
Taxon D
No meaning to thespacing between thetaxa, or to the order inwhich they appear fromtop to bottom.
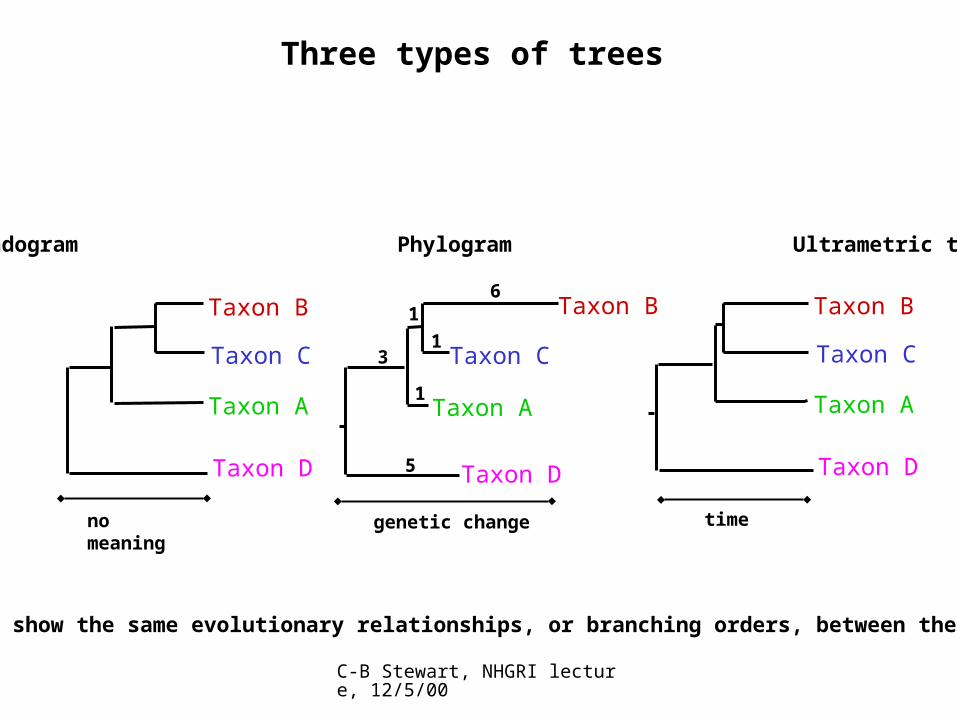
This dimension either can have no scale (for ‘cladograms’),can be proportional to genetic distance or amount of change(for ‘phylograms’ or ‘additive trees’), or can be proportionalto time (for ‘ultrametric trees’ or true evolutionary trees).
These say that B and C are more closely related to each other than either is to A,and that A, B, and C form a clade that is a sister group to the clade composed ofD and E. If the tree has a time scale, then D and E are the most closely related.
C-B Stewart, NHGRI lecture, 12/5/00
Taxon A
Taxon B
Taxon C
Taxon D
1
1
1
6
3
5
genetic change
Taxon A
Taxon B
Taxon C
Taxon D
time
Taxon A
Taxon B
Taxon C
Taxon D
no meaning
Three types of trees
Cladogram Phylogram Ultrametric tree
All show the same evolutionary relationships, or branching orders, between the taxa.
C-B Stewart, NHGRI lecture, 12/5/00
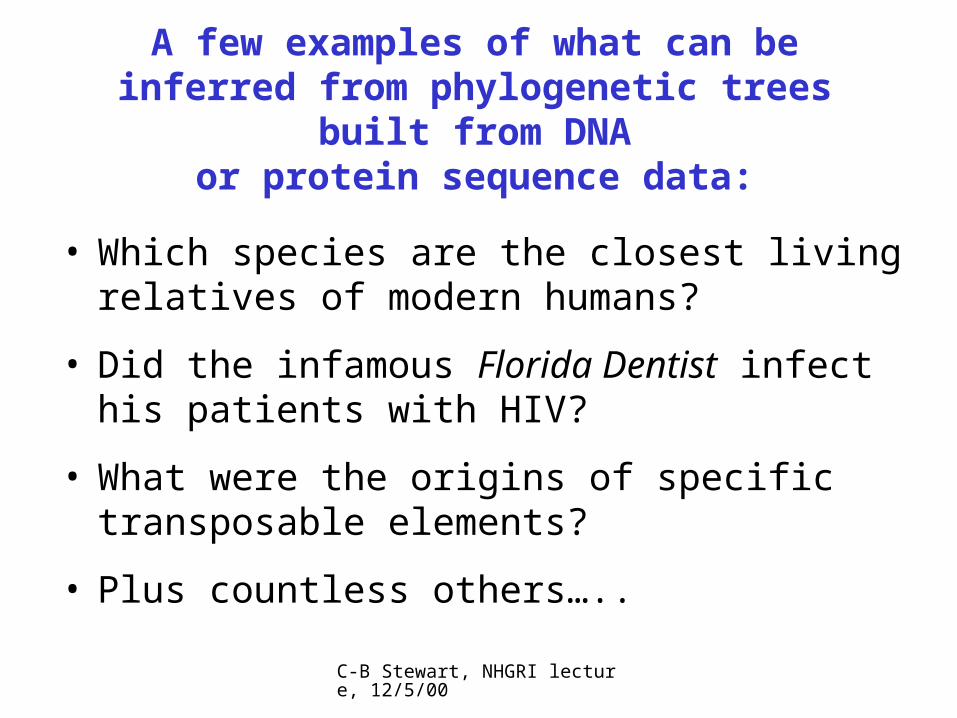
A few examples of what can be inferred from phylogenetic trees built from DNA
or protein sequence data:
• Which species are the closest living relatives of modern humans?
• Did the infamous Florida Dentist infect his patients with HIV?
• What were the origins of specific transposable elements?
• Plus countless others…..
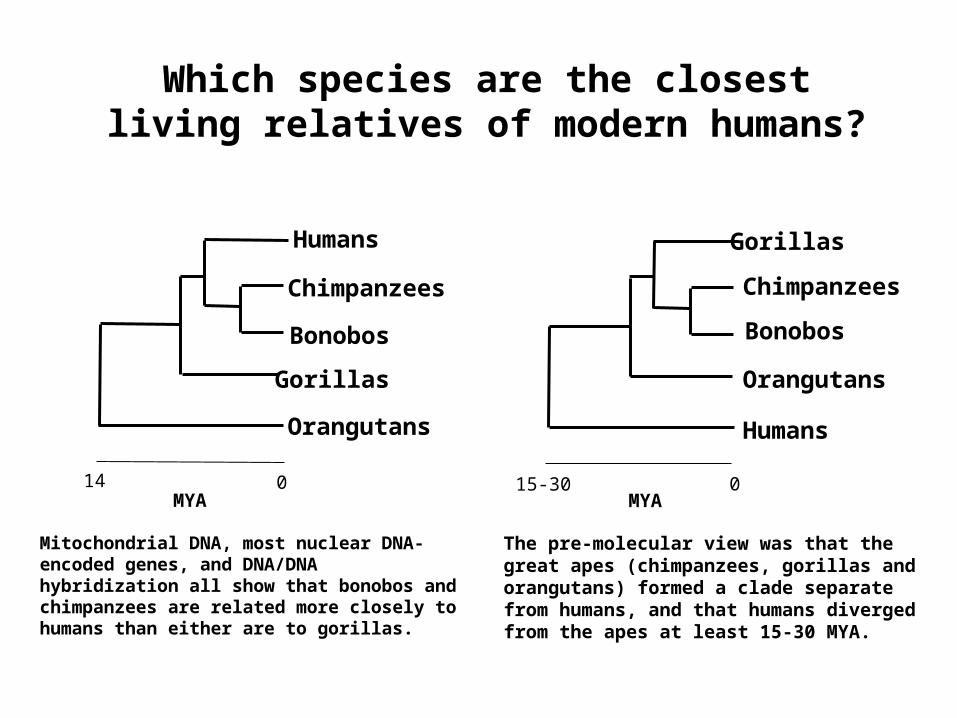
Which species are the closest living relatives of modern humans?
Mitochondrial DNA, most nuclear DNA-encoded genes, and DNA/DNA hybridization all show that bonobos and chimpanzees are related more closely to humans than either are to gorillas.
The pre-molecular view was that the great apes (chimpanzees, gorillas and orangutans) formed a clade separate from humans, and that humans diverged from the apes at least 15-30 MYA.
MYA
Chimpanzees
Orangutans Humans
Bonobos
GorillasHumans
Bonobos
Gorillas Orangutans
Chimpanzees
MYA015-30014
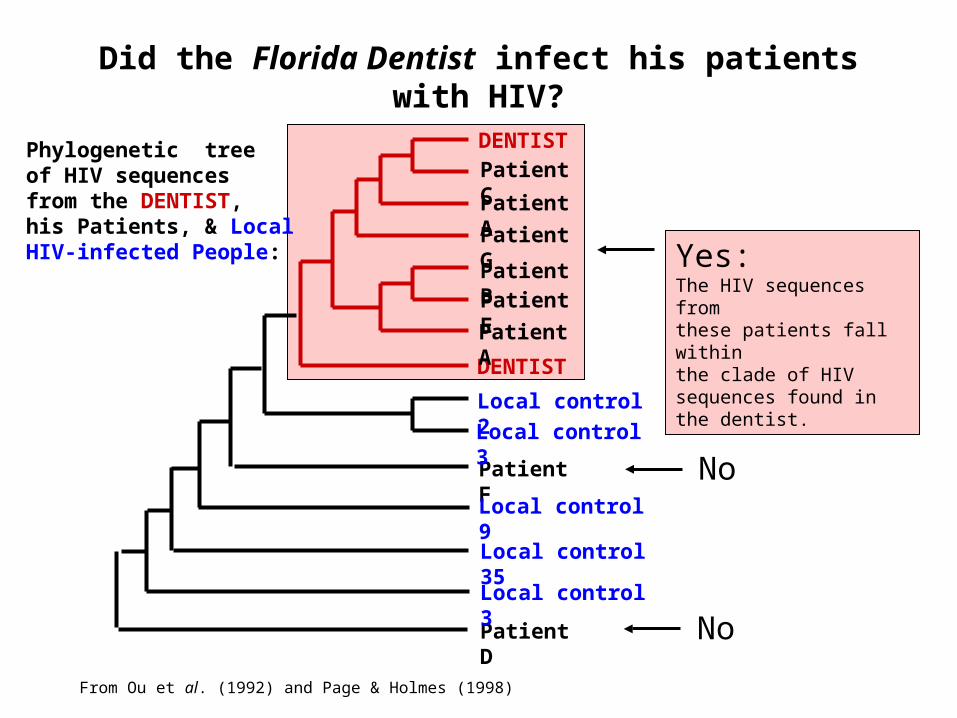
Did the Florida Dentist infect his patients with HIV?
DENTIST
DENTIST
Patient D
Patient F
Patient C
Patient A
Patient G
Patient BPatient E
Patient A
Local control 2
Local control 3
Local control 9
Local control 35
Local control 3
Yes:The HIV sequences fromthese patients fall withinthe clade of HIV sequences found in the dentist.
No
No
From Ou et al. (1992) and Page & Holmes (1998)
Phylogenetic treeof HIV sequencesfrom the DENTIST,his Patients, & LocalHIV-infected People:
C-B Stewart, NHGRI lecture, 12/5/00
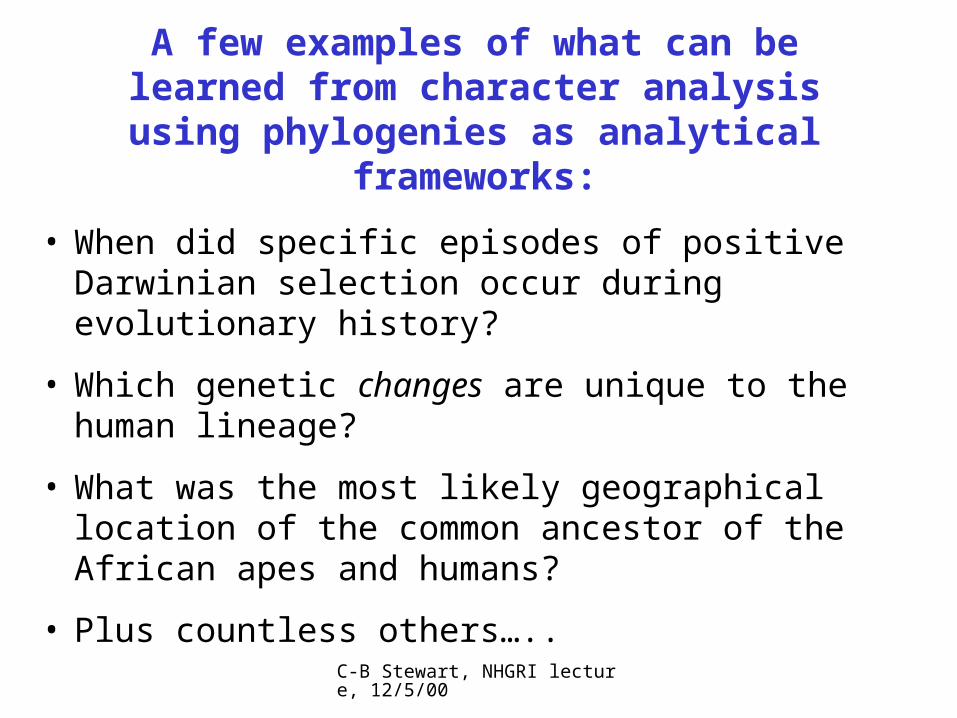
A few examples of what can be learned from character analysis using
phylogenies as analytical frameworks:
• When did specific episodes of positive Darwinian selection occur during evolutionary history?
• Which genetic changes are unique to the human lineage?
• What was the most likely geographical location of the common ancestor of the African apes and humans?
• Plus countless others…..
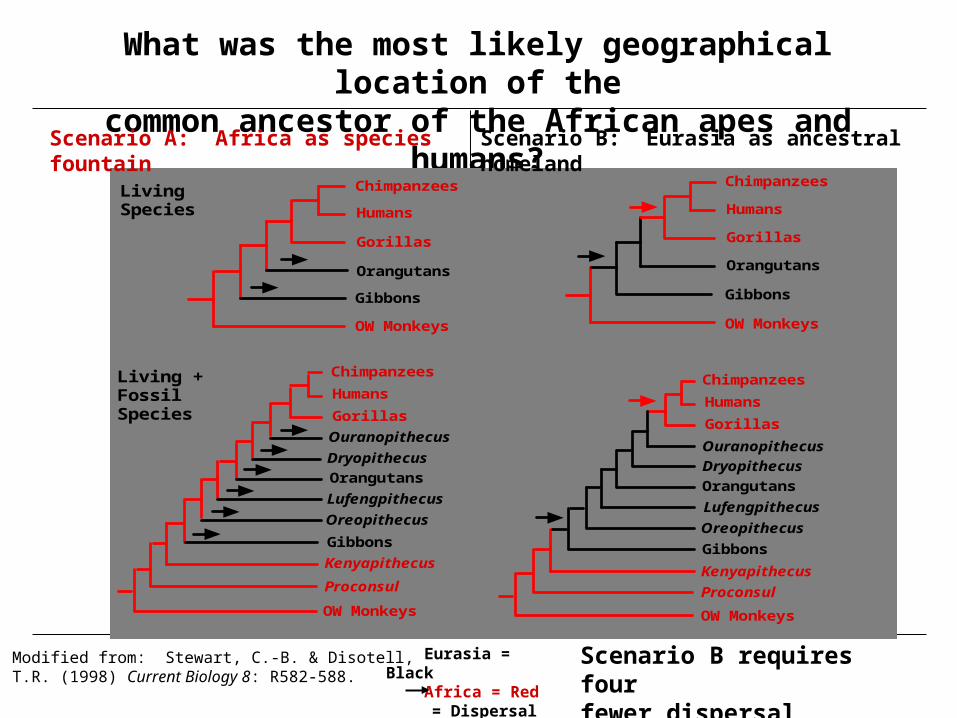
What was the most likely geographical location of the
common ancestor of the African apes and humans?
Eurasia = Black Africa = Red
= Dispersal
Modified from: Stewart, C.-B. & Disotell,T.R. (1998) Current Biology 8: R582-588.
Scenario B requires fourfewer dispersal events
OW Monkeys
Chimpanzees
Humans
Gorillas
Orangutans
Gibbons
Chimpanzees
Humans
Gorillas
Orangutans
Gibbons
Chimpanzees
Humans
Gorillas
Orangutans
Gibbons
Chimpanzees
Humans
Gorillas
Orangutans
Gibbons
Ouranopithecus
Dryopithecus
Lufengpithecus
Living Species
Living + Fossil Species
Oreopithecus
Proconsul
OW Monkeys
OW Monkeys
Kenyapithecus
OW Monkeys
Kenyapithecus
Proconsul
Ouranopithecus
Dryopithecus
Lufengpithecus
Oreopithecus
Scenario A: Africa as species fountain Scenario B: Eurasia as ancestral homeland
Inferred ancestral dispersal patterns of primates between Africa and Eurasia
From: Stewart, C.-B. & Disotell, T.R. (1998) Current Biology 8: R582-588.
C-B Stewart, NHGRI lecture, 12/5/00
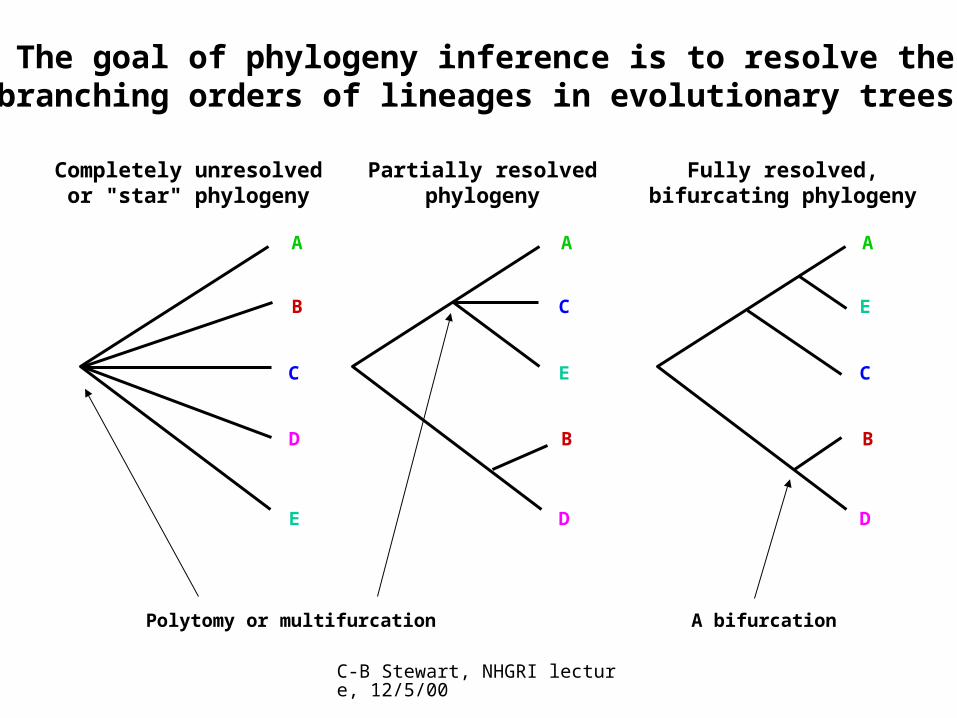
Completely unresolvedor "star" phylogeny
Partially resolvedphylogeny
Fully resolved,bifurcating phylogeny
A A A
B
B B
C
C
C
E
E
E
D
D D
Polytomy or multifurcation A bifurcation
The goal of phylogeny inference is to resolve the branching orders of lineages in evolutionary trees:
C-B Stewart, NHGRI lecture, 12/5/00
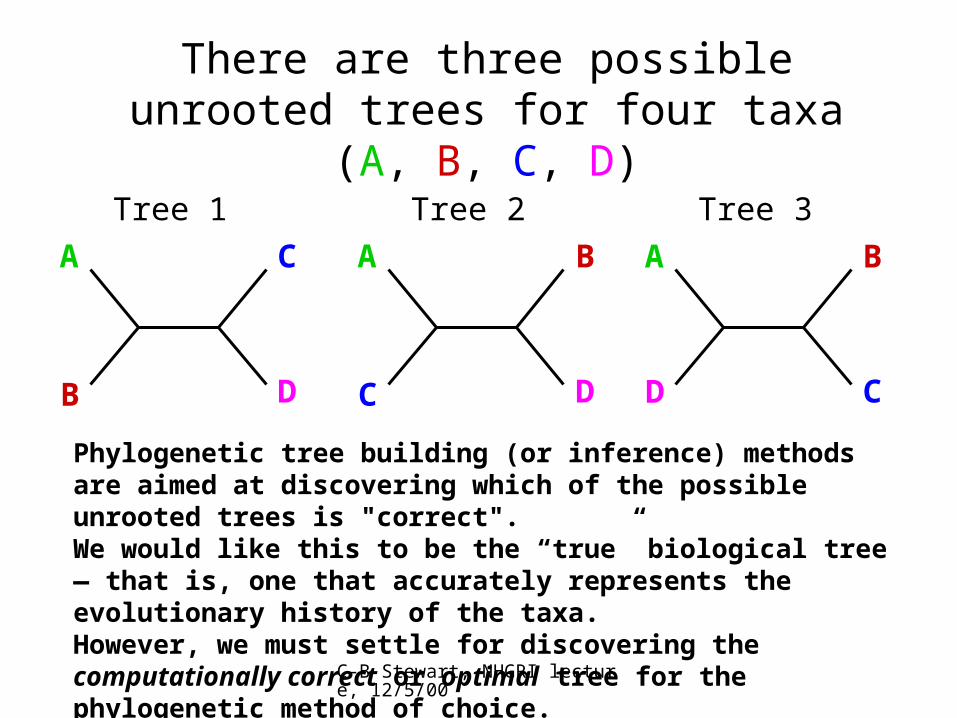
There are three possible unrooted trees for four taxa (A, B, C, D)
A C
B D
Tree 1
A B
C D
Tree 2
A B
D C
Tree 3
Phylogenetic tree building (or inference) methods are aimed at discovering which of the possible unrooted trees is "correct".We would like this to be the “true” biological tree — that is, one that accurately represents the evolutionary history of the taxa.However, we must settle for discovering the computationally correct or optimal tree for the phylogenetic method of choice.
C-B Stewart, NHGRI lecture, 12/5/00
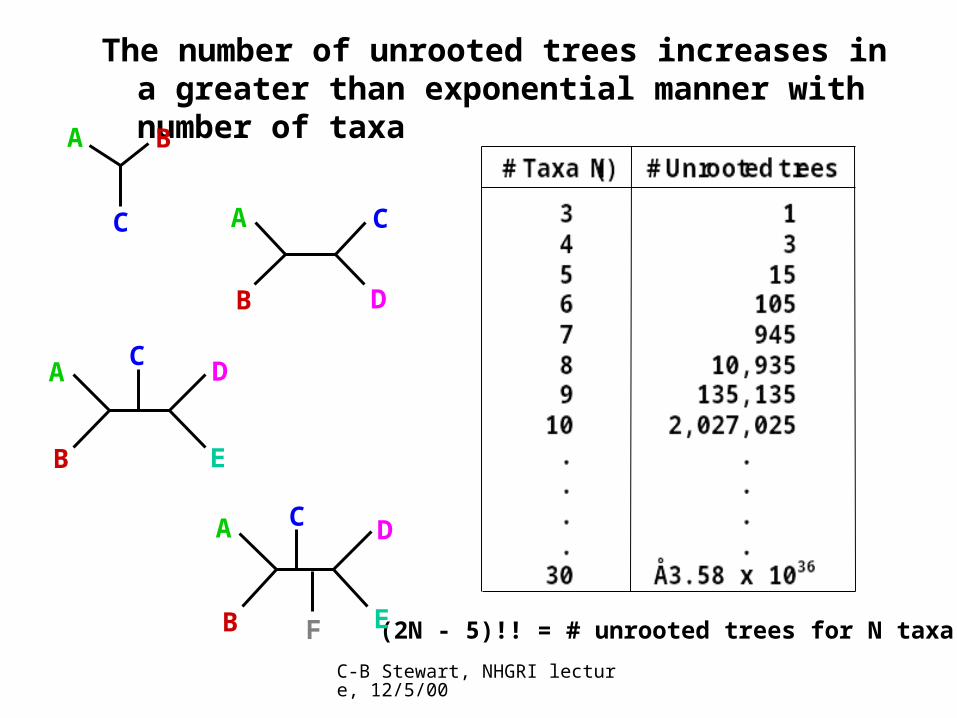
The number of unrooted trees increases in a greater than exponential manner with number of taxa
(2N - 5)!! = # unrooted trees for N taxa
CA
B D
A B
C
A D
B E
C
A D
B E
C
F
C-B Stewart, NHGRI lecture, 12/5/00
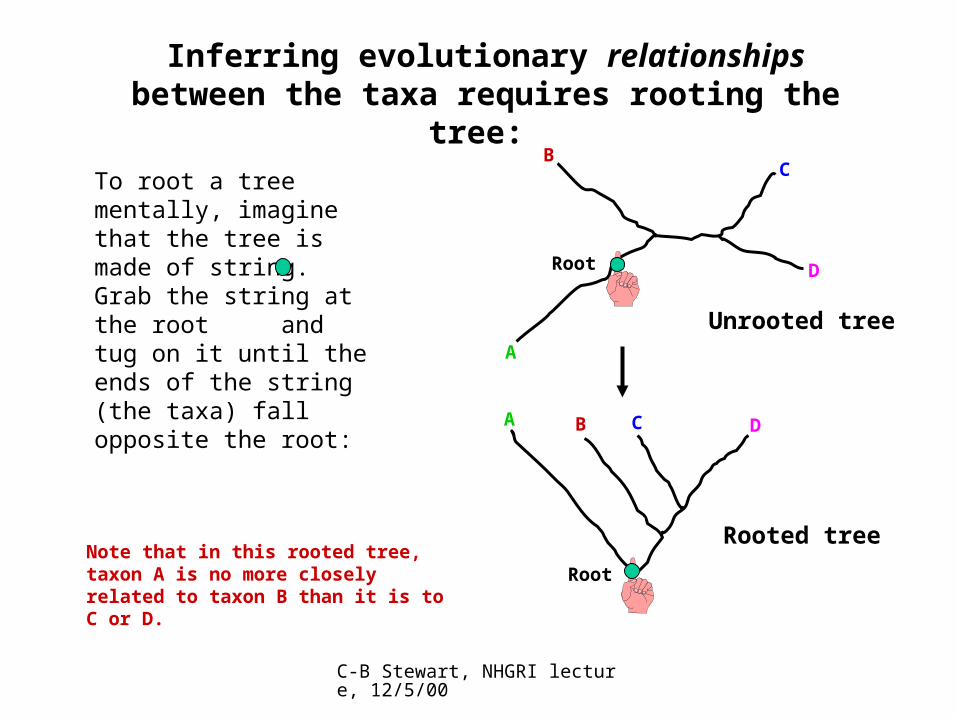
Inferring evolutionary relationships between the taxa requires rooting the tree:
To root a tree mentally, imagine that the tree is made of string. Grab the string at the root and tug on it until the ends of the string (the taxa) fall opposite the root: A
BC
Root D
A B C D
RootNote that in this rooted tree, taxon A is no more closely related to taxon B than it is to C or D.
Rooted tree
Unrooted tree
C-B Stewart, NHGRI lecture, 12/5/00
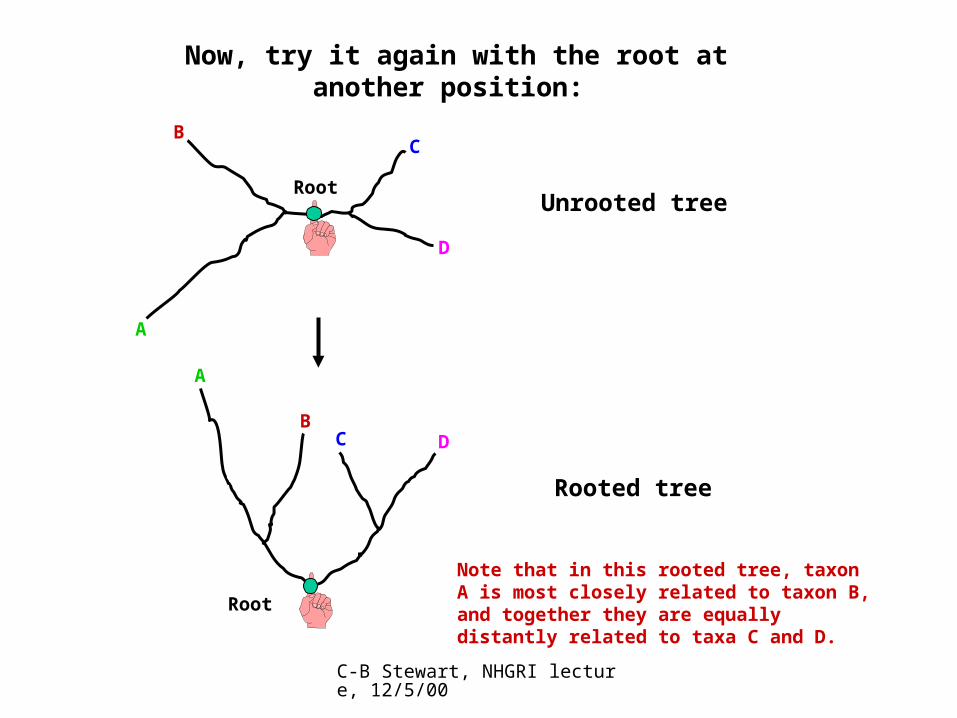
Now, try it again with the root at another position:
A
BC
Root
D
Unrooted tree
Note that in this rooted tree, taxon A is most closely related to taxon B, and together they are equally distantly related to taxa C and D.
C D
Root
Rooted tree
A
B
C-B Stewart, NHGRI lecture, 12/5/00
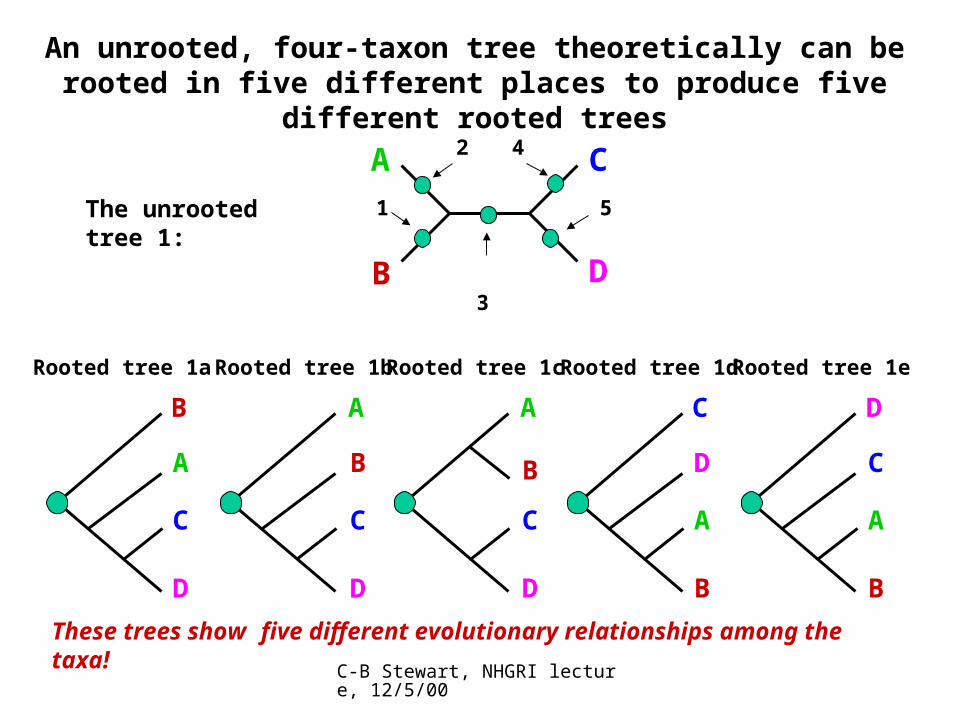
An unrooted, four-taxon tree theoretically can be rooted in five different places to produce five different rooted trees
The unrooted tree 1:
A C
B D
Rooted tree 1d
C
D
A
B
4
Rooted tree 1c
A
B
C
D
3
Rooted tree 1e
D
C
A
B
5
Rooted tree 1b
A
B
C
D
2
Rooted tree 1a
B
A
C
D
1
These trees show five different evolutionary relationships among the taxa!
C-B Stewart, NHGRI lecture, 12/5/00
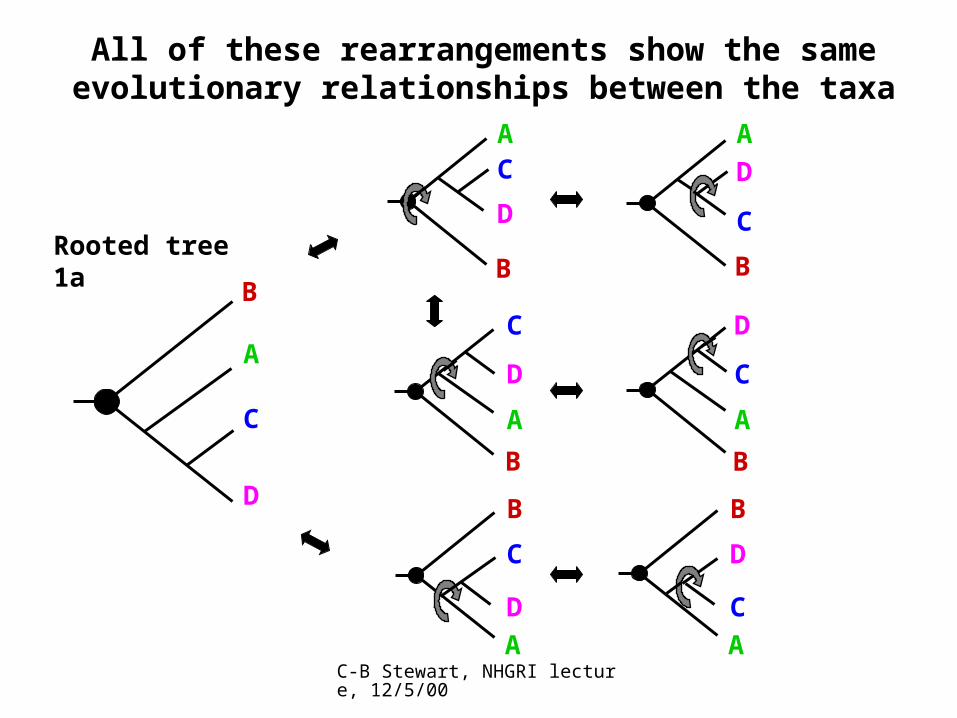
All of these rearrangements show the same evolutionary relationships between the taxa
B
A
C
D
A
B
D
C
B
C
A
D
B
D
A
C
B
AC
DRooted tree 1a
B
A
C
D
A
B
C
D
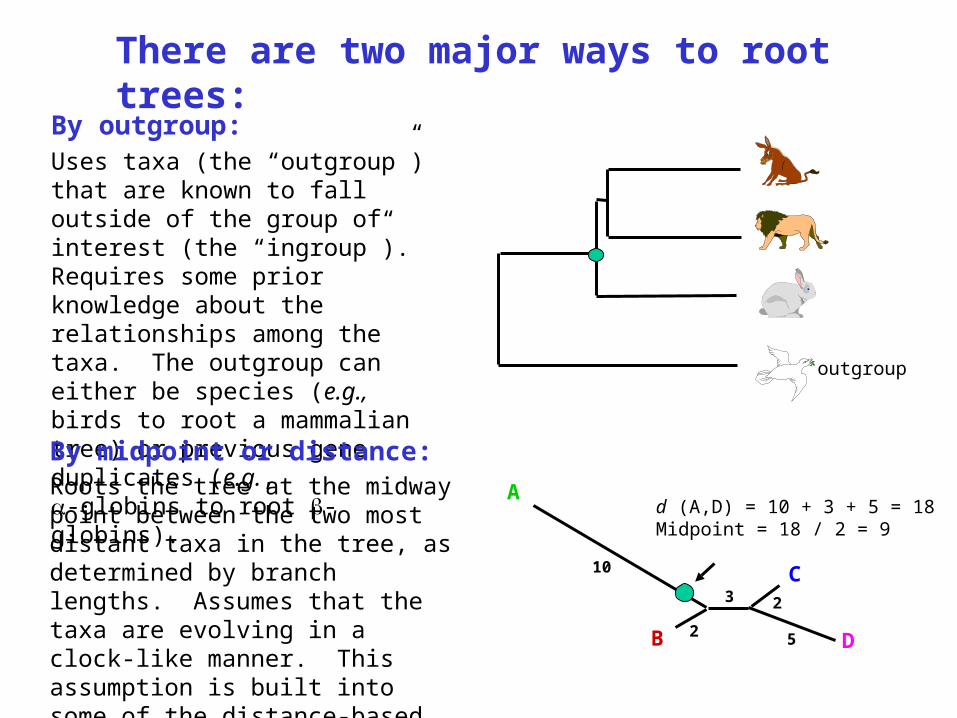
By outgroup: Uses taxa (the “outgroup”) that are known to fall outside of the group of interest (the “ingroup”). Requires some prior knowledge about the relationships among the taxa. The outgroup can either be species (e.g., birds to root a mammalian tree) or previous gene duplicates (e.g., -globins to root -globins).
There are two major ways to root trees:
A
B
C
D
10
2
3
5
2
By midpoint or distance:Roots the tree at the midway point between the two most distant taxa in the tree, as determined by branch lengths. Assumes that the taxa are evolving in a clock-like manner. This assumption is built into some of the distance-based tree building methods.
outgroup
d (A,D) = 10 + 3 + 5 = 18Midpoint = 18 / 2 = 9
C-B Stewart, NHGRI lecture, 12/5/00
x =
CA
B D
A D
B E
C
A D
B E
C
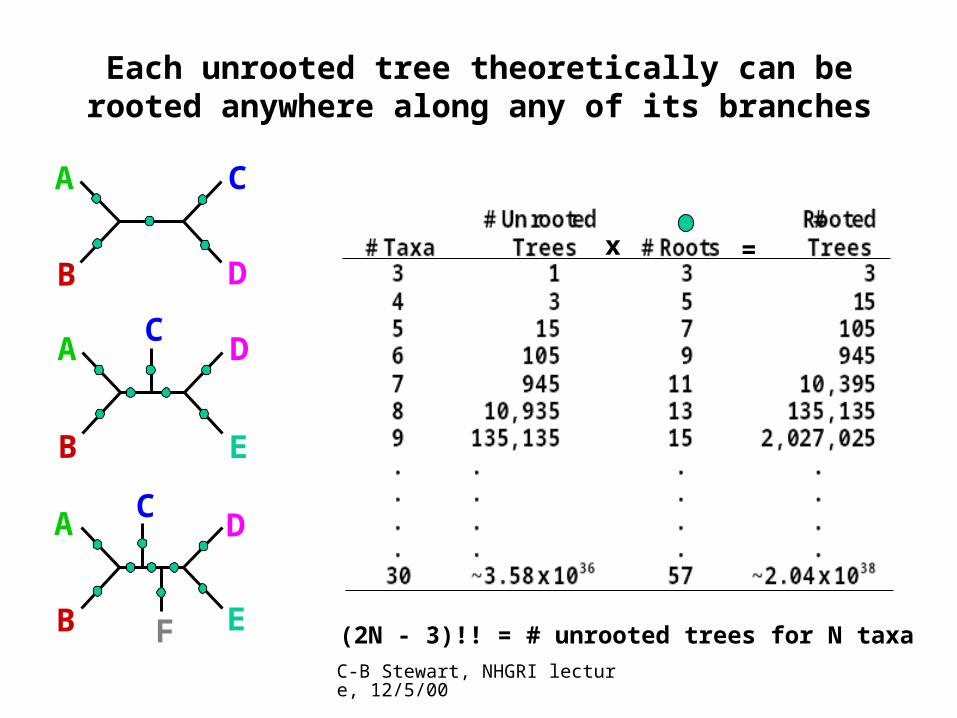
F (2N - 3)!! = # unrooted trees for N taxa
Each unrooted tree theoretically can be rooted anywhere along any of its branches
C-B Stewart, NHGRI lecture, 12/5/00
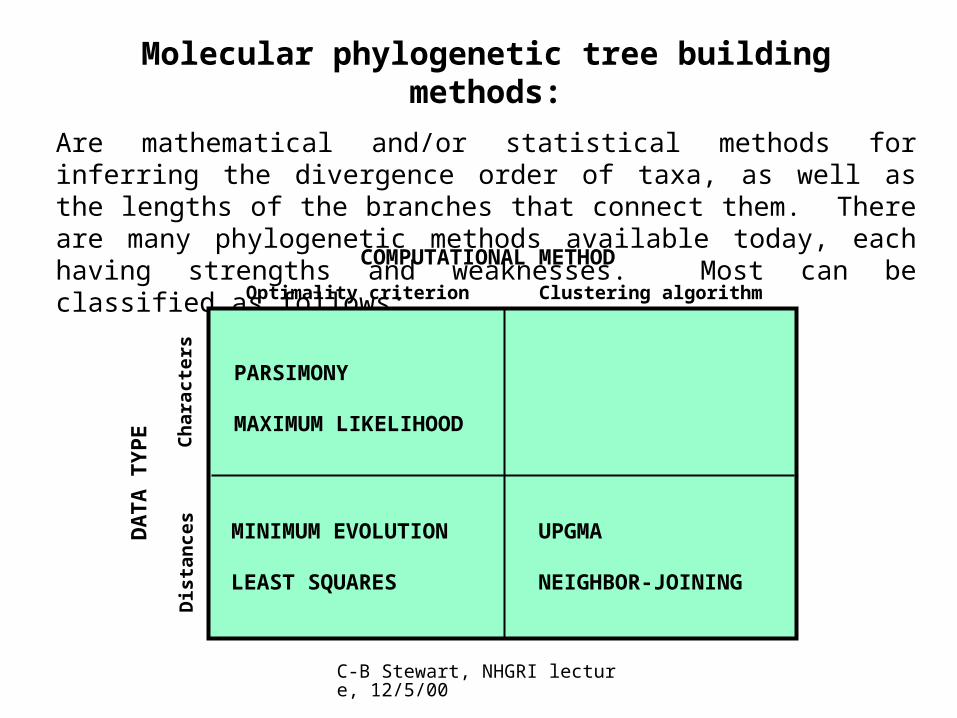
Molecular phylogenetic tree building methods:
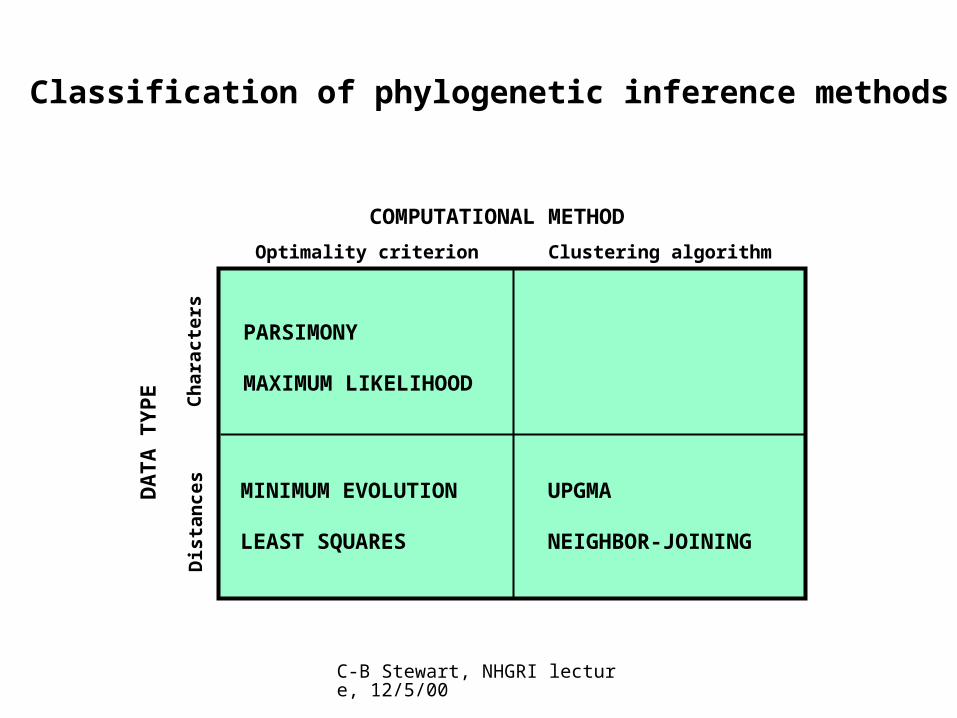
Are mathematical and/or statistical methods for inferring the divergence order of taxa, as well as the lengths of the branches that connect them. There are many phylogenetic methods available today, each having strengths and weaknesses. Most can be classified as follows:
COMPUTATIONAL METHOD
Clustering algorithmOptimality criterion
DA
TA
TY
PE
Ch
arac
ters
Dis
tan
ces
PARSIMONY
MAXIMUM LIKELIHOOD
UPGMA
NEIGHBOR-JOINING
MINIMUM EVOLUTION
LEAST SQUARES
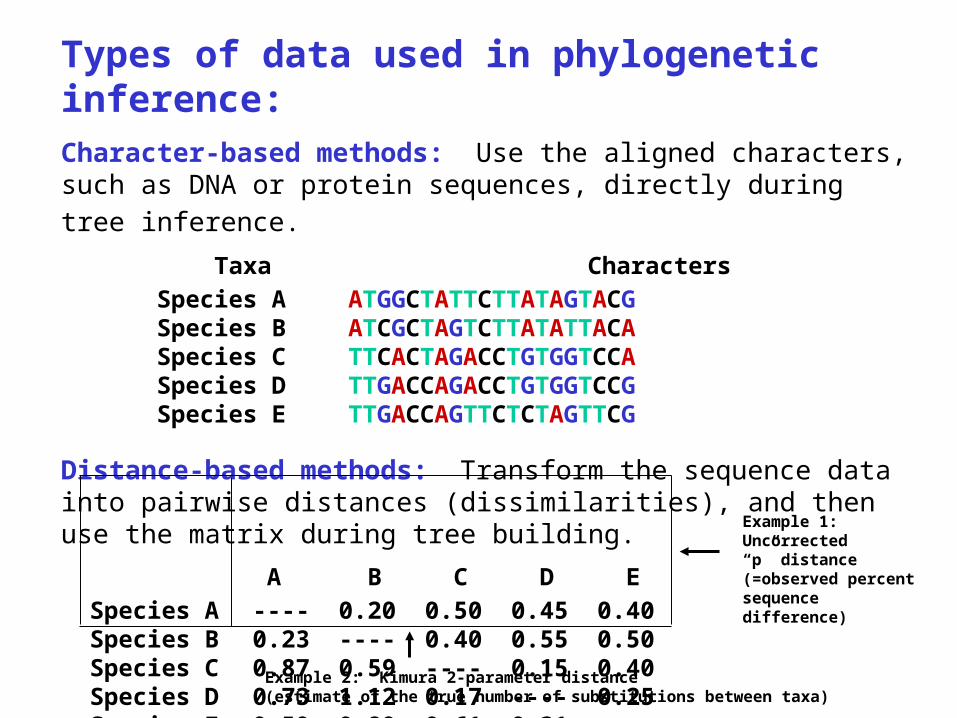
Types of data used in phylogenetic inference:Character-based methods: Use the aligned characters, such as DNA
or protein sequences, directly during tree inference. Taxa Characters
Species A ATGGCTATTCTTATAGTACGSpecies B ATCGCTAGTCTTATATTACASpecies C TTCACTAGACCTGTGGTCCASpecies D TTGACCAGACCTGTGGTCCGSpecies E TTGACCAGTTCTCTAGTTCG
Distance-based methods: Transform the sequence data into pairwise distances (dissimilarities), and then use the matrix during tree building.
A B C D E Species A ---- 0.20 0.50 0.45 0.40 Species B 0.23 ---- 0.40 0.55 0.50 Species C 0.87 0.59 ---- 0.15 0.40 Species D 0.73 1.12 0.17 ---- 0.25 Species E 0.59 0.89 0.61 0.31 ----
Example 1: Uncorrected“p” distance(=observed percentsequence difference)
Example 2: Kimura 2-parameter distance(estimate of the true number of substitutions between taxa)
C-B Stewart, NHGRI lecture, 12/5/00
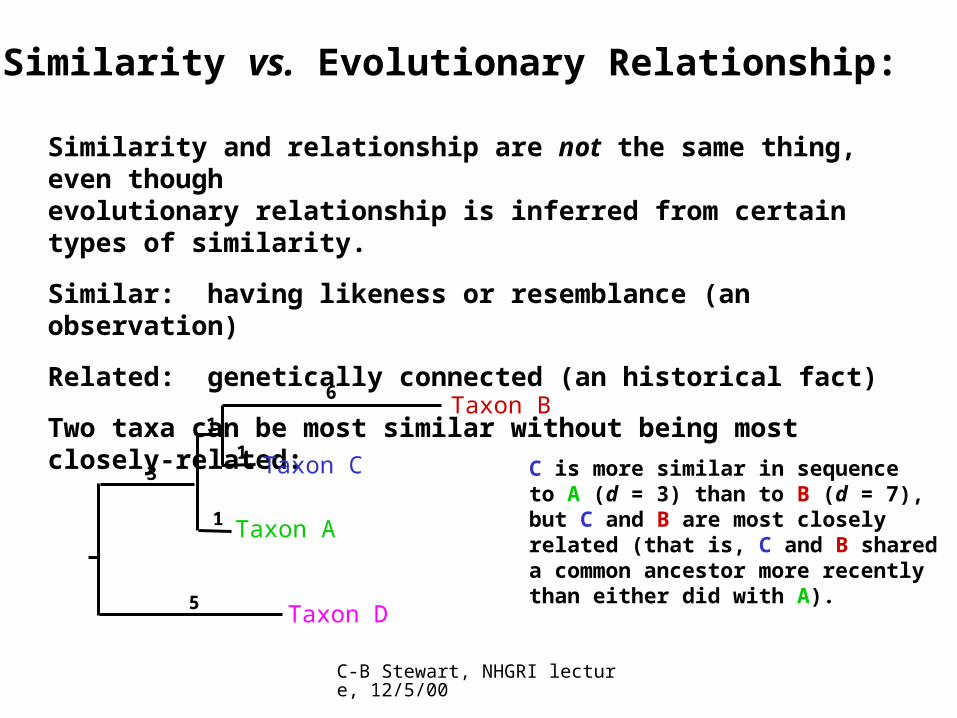
Similarity vs. Evolutionary Relationship:
Similarity and relationship are not the same thing, even thoughevolutionary relationship is inferred from certain types of similarity.
Similar: having likeness or resemblance (an observation)
Related: genetically connected (an historical fact)
Two taxa can be most similar without being most closely-related:
Taxon A
Taxon B
Taxon C
Taxon D
1
1
1
6
3
5
C is more similar in sequence to A (d = 3) than to B (d = 7),but C and B are most closelyrelated (that is, C and B shareda common ancestor more recentlythan either did with A).
Character-based methods can tease apart types of similarity and theoreticallyfind the true evolutionary tree. Similarity = relationship only if certain conditionsare met (if the distances are ‘ultrametric’).
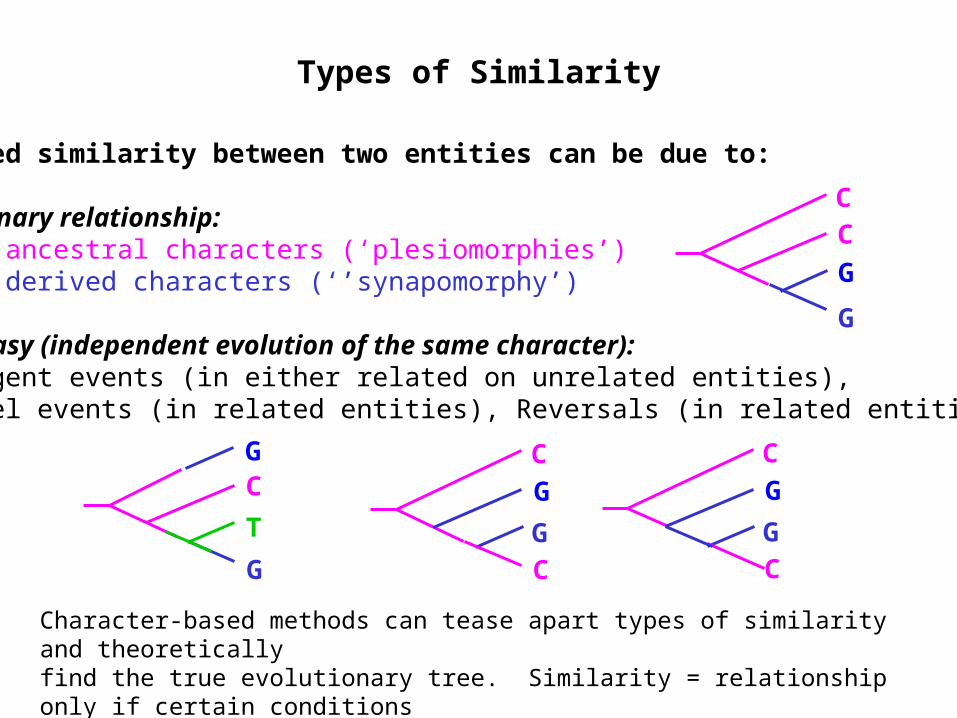
Types of Similarity
Observed similarity between two entities can be due to:
Evolutionary relationship:Shared ancestral characters (‘plesiomorphies’)Shared derived characters (‘’synapomorphy’)
Homoplasy (independent evolution of the same character):Convergent events (in either related on unrelated entities),Parallel events (in related entities), Reversals (in related entities)
CC
G
G
C
C
G
G
CG
G C
C
G
GT
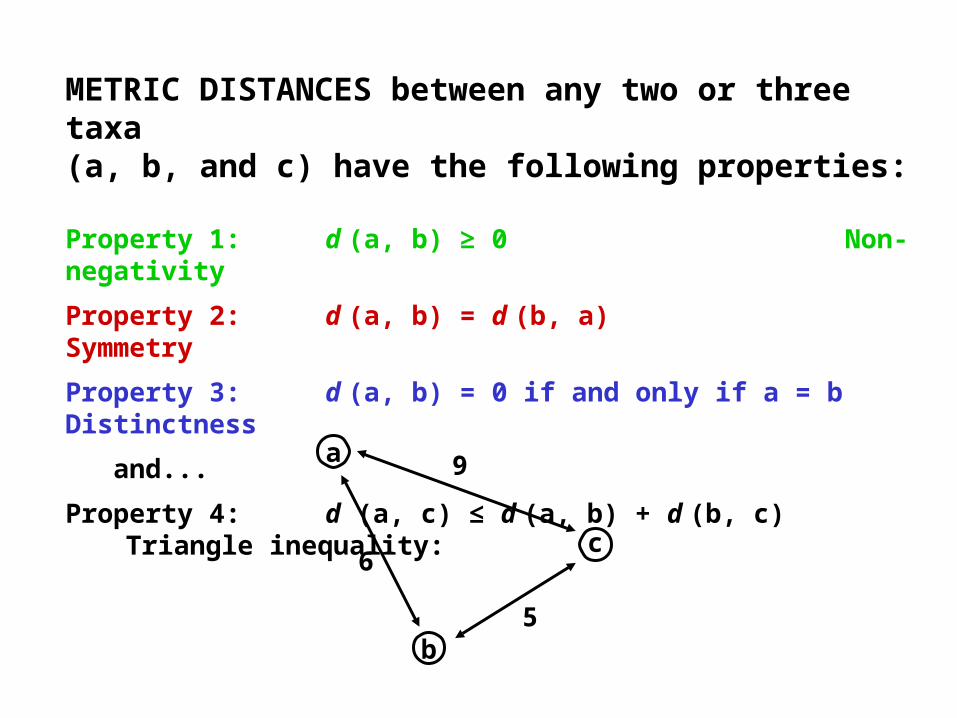
METRIC DISTANCES between any two or three taxa(a, b, and c) have the following properties:
Property 1: d (a, b) ≥ 0 Non-negativity
Property 2: d (a, b) = d (b, a) Symmetry
Property 3: d (a, b) = 0 if and only if a = b Distinctness
and...
Property 4: d (a, c) ≤ d (a, b) + d (b, c) Triangle inequality:
a
b
c6
9
5
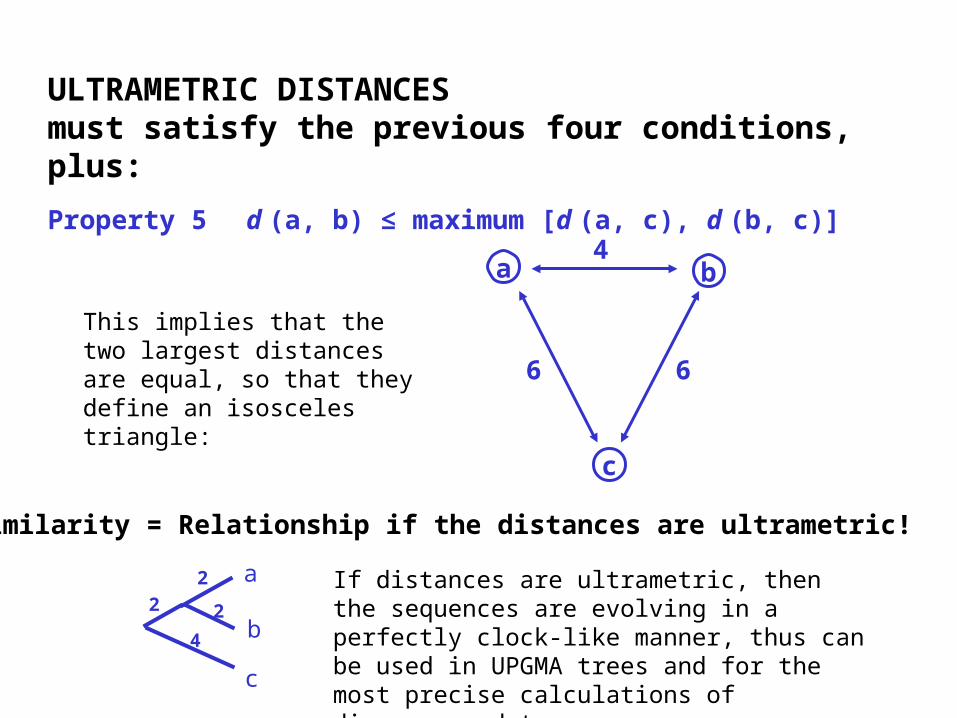
ULTRAMETRIC DISTANCESmust satisfy the previous four conditions, plus:
Property 5 d (a, b) ≤ maximum [d (a, c), d (b, c)]
If distances are ultrametric, then the sequences are evolving in a perfectly clock-like manner, thus can be used in UPGMA trees and for the most precise calculations of divergence dates.
a b4
66
c
Similarity = Relationship if the distances are ultrametric!
a
b
c
2
22
4
This implies that the two largest distances are equal, so that they define an isosceles triangle:
C-B Stewart, NHGRI lecture, 12/5/00
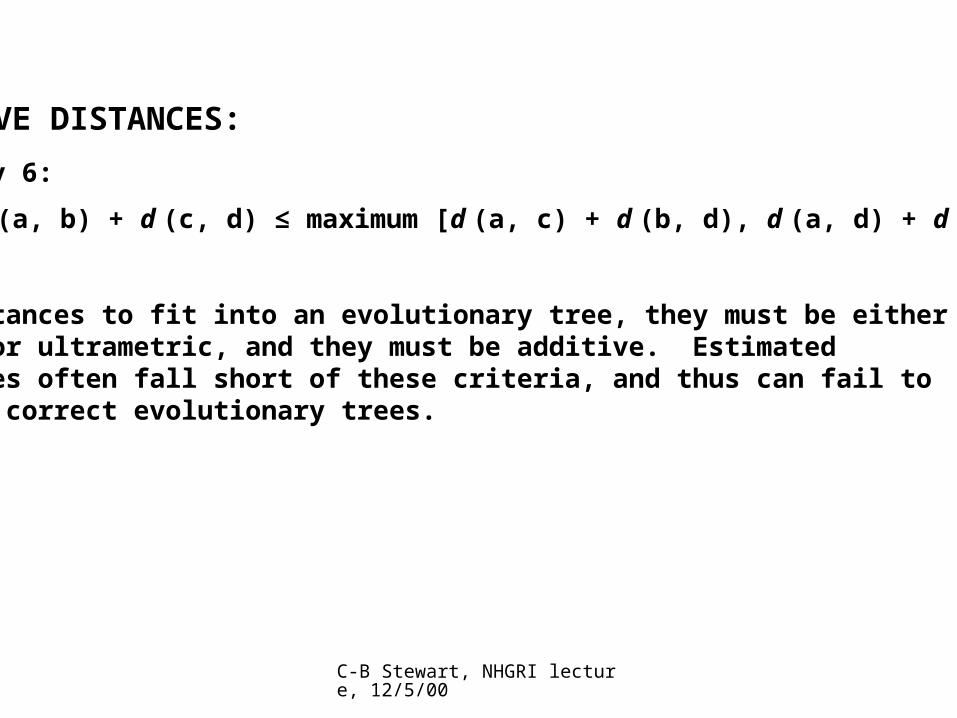
ADDITIVE DISTANCES:
Property 6:
d (a, b) + d (c, d) ≤ maximum [d (a, c) + d (b, d), d (a, d) + d (b, c)]
For distances to fit into an evolutionary tree, they must be eithermetric or ultrametric, and they must be additive. Estimateddistances often fall short of these criteria, and thus can fail toproduce correct evolutionary trees.
C-B Stewart, NHGRI lecture, 12/5/00
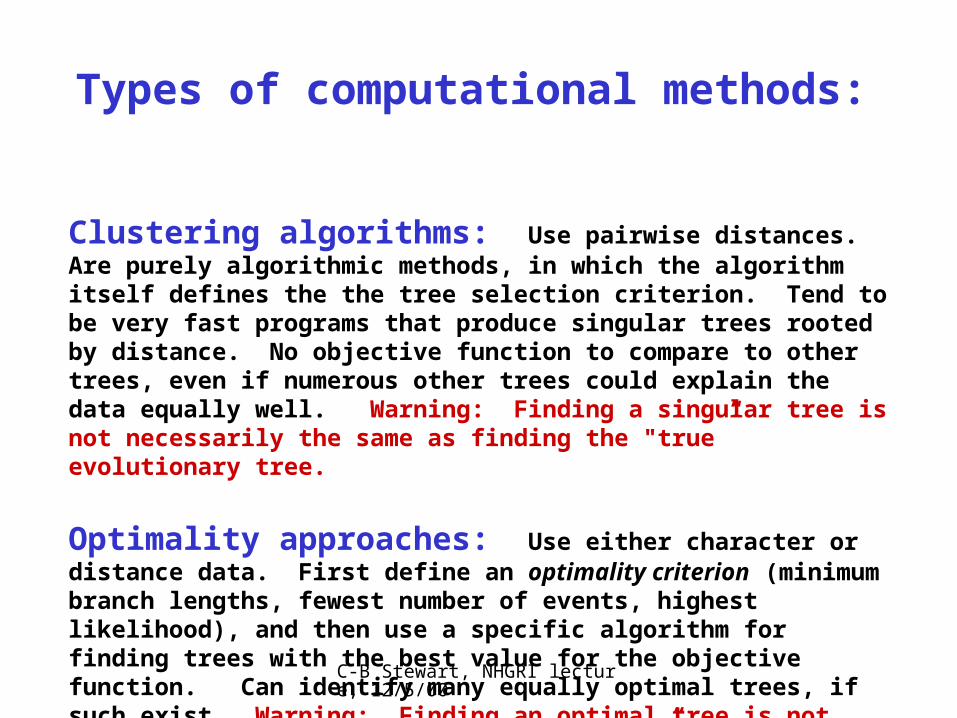
Types of computational methods:
Clustering algorithms: Use pairwise distances. Are purely algorithmic methods, in which the algorithm itself defines the the tree selection criterion. Tend to be very fast programs that produce singular trees rooted by distance. No objective function to compare to other trees, even if numerous other trees could explain the data equally well. Warning: Finding a singular tree is not necessarily the same as finding the "true” evolutionary tree.
Optimality approaches: Use either character or distance data. First define an optimality criterion (minimum branch lengths, fewest number of events, highest likelihood), and then use a specific algorithm for finding trees with the best value for the objective function. Can identify many equally optimal trees, if such exist. Warning: Finding an optimal tree is not necessarily the same as finding the "true” tree.
C-B Stewart, NHGRI lecture, 12/5/00
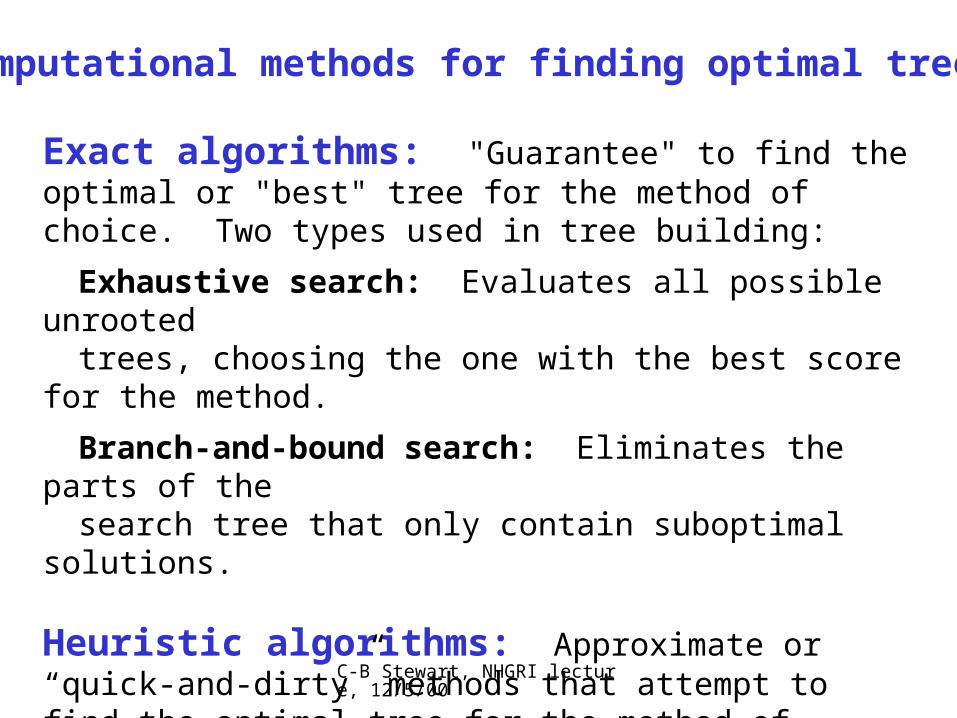
Exact algorithms: "Guarantee" to find the optimal or "best" tree for the method of choice. Two types used in tree building:
Exhaustive search: Evaluates all possible unrooted trees, choosing the one with the best score for the method.
Branch-and-bound search: Eliminates the parts of thesearch tree that only contain suboptimal solutions.
Heuristic algorithms: Approximate or “quick-and-dirty” methods that attempt to find the optimal tree for the method of choice, but cannot guarantee to do so. Heuristic searchesoften operate by “hill-climbing” methods.
Computational methods for finding optimal trees:
C-B Stewart, NHGRI lecture, 12/5/00
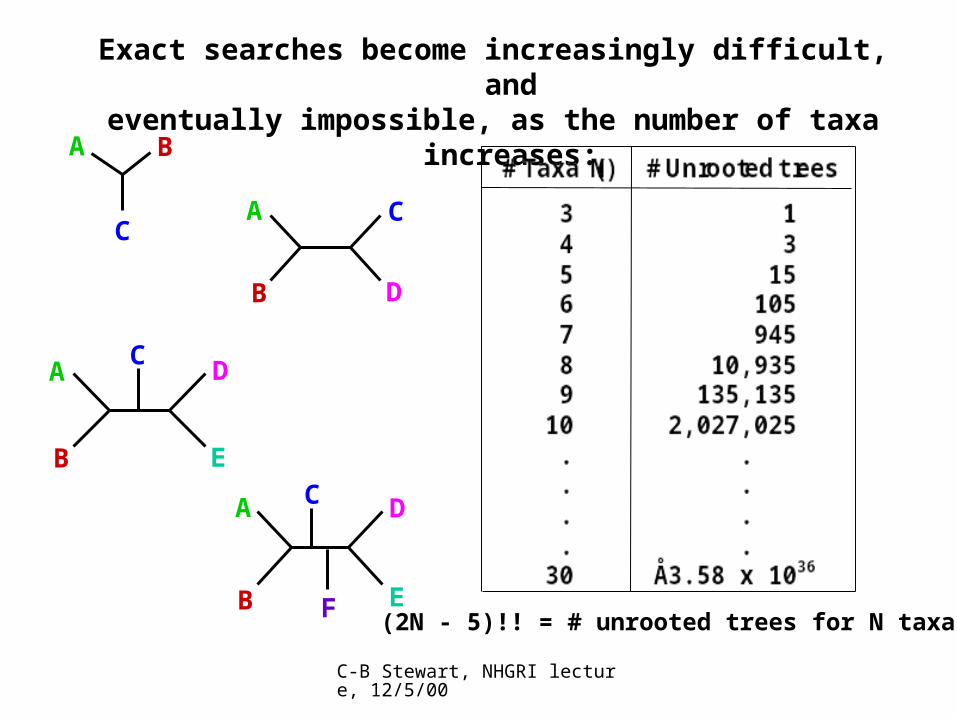
Exact searches become increasingly difficult, andeventually impossible, as the number of taxa increases:
(2N - 5)!! = # unrooted trees for N taxa
A D
B E
C
CA
B D
A B
C
A D
B E
C
F
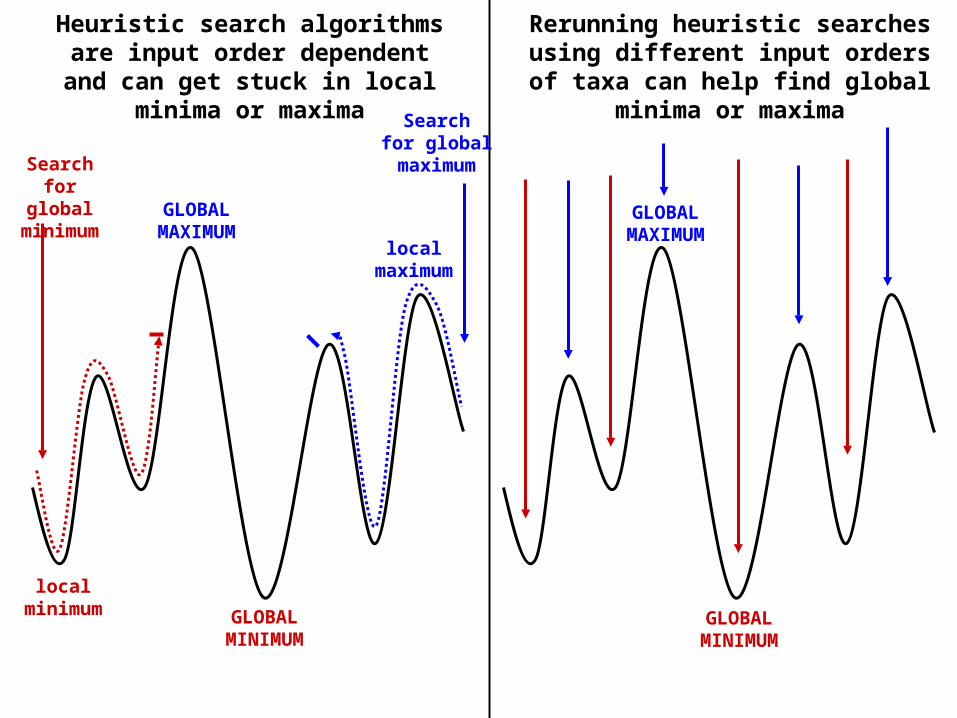
Heuristic search algorithms are input order dependent and can get stuck in local minima or maxima
Rerunning heuristic searches using different input orders of taxa can help
find global minima or maxima
Searchfor global minimum GLOBAL
MAXIMUM
GLOBALMINIMUM
localminimum
localmaximum
Searchfor globalmaximum
GLOBALMAXIMUM
GLOBALMINIMUM
C-B Stewart, NHGRI lecture, 12/5/00
COMPUTATIONAL METHOD
Clustering algorithmOptimality criterion
DA
TA
TY
PE
Ch
arac
ters
Dis
tan
ces
PARSIMONY
MAXIMUM LIKELIHOOD
UPGMA
NEIGHBOR-JOINING
MINIMUM EVOLUTION
LEAST SQUARES
Classification of phylogenetic inference methods
Parsimony methods:
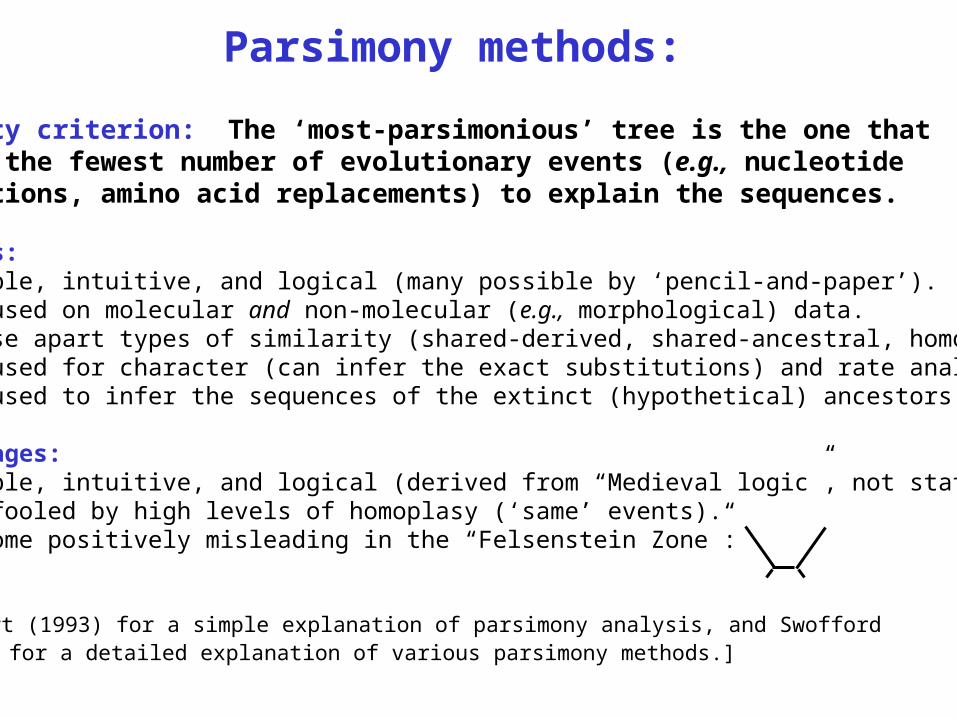
Optimality criterion: The ‘most-parsimonious’ tree is the one thatrequires the fewest number of evolutionary events (e.g., nucleotidesubstitutions, amino acid replacements) to explain the sequences.
Advantages:• Are simple, intuitive, and logical (many possible by ‘pencil-and-paper’). • Can be used on molecular and non-molecular (e.g., morphological) data.• Can tease apart types of similarity (shared-derived, shared-ancestral, homoplasy)• Can be used for character (can infer the exact substitutions) and rate analysis.• Can be used to infer the sequences of the extinct (hypothetical) ancestors.
Disadvantages:• Are simple, intuitive, and logical (derived from “Medieval logic”, not statistics!)• Can be fooled by high levels of homoplasy (‘same’ events).• Can become positively misleading in the “Felsenstein Zone”:
[See Stewart (1993) for a simple explanation of parsimony analysis, and Swoffordet al. (1996) for a detailed explanation of various parsimony methods.]
Maximum likelihood (ML) methods
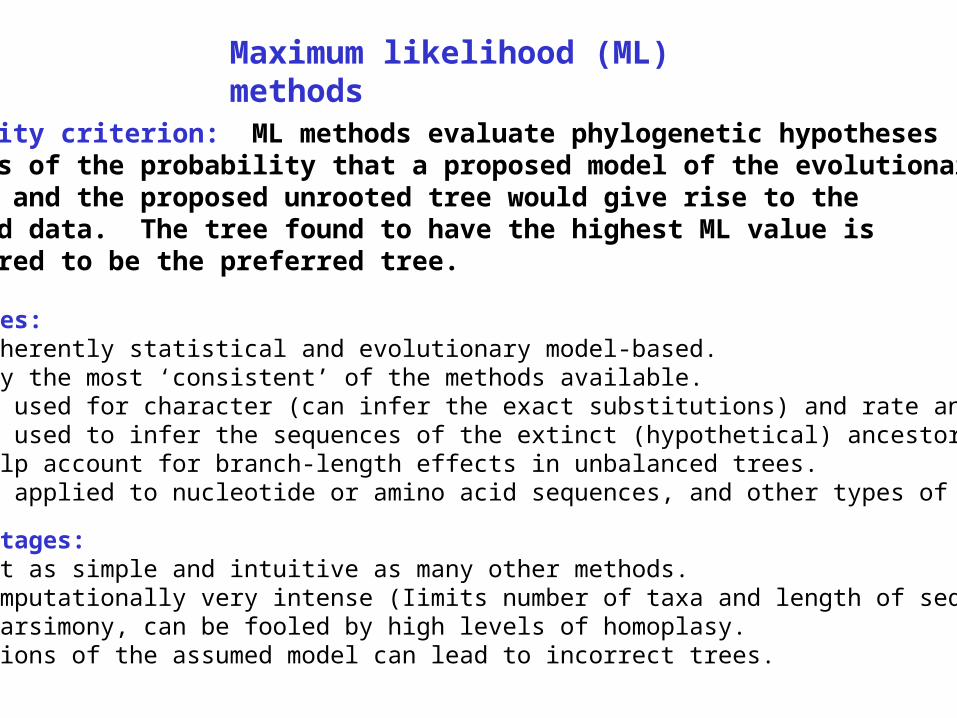
Optimality criterion: ML methods evaluate phylogenetic hypothesesin terms of the probability that a proposed model of the evolutionaryprocess and the proposed unrooted tree would give rise to theobserved data. The tree found to have the highest ML value isconsidered to be the preferred tree.
Advantages:• Are inherently statistical and evolutionary model-based.• Usually the most ‘consistent’ of the methods available.• Can be used for character (can infer the exact substitutions) and rate analysis.• Can be used to infer the sequences of the extinct (hypothetical) ancestors.• Can help account for branch-length effects in unbalanced trees.• Can be applied to nucleotide or amino acid sequences, and other types of data.
Disadvantages:• Are not as simple and intuitive as many other methods.• Are computationally very intense (Iimits number of taxa and length of sequence).• Like parsimony, can be fooled by high levels of homoplasy.• Violations of the assumed model can lead to incorrect trees.
C-B Stewart, NHGRI lecture, 12/5/00
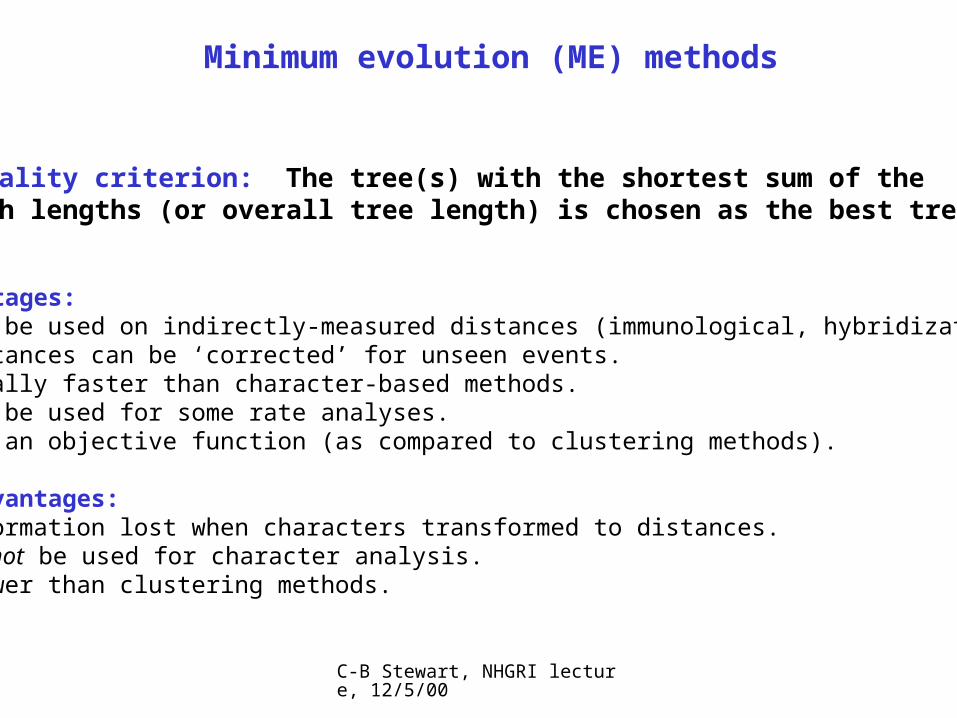
Minimum evolution (ME) methods
Optimality criterion: The tree(s) with the shortest sum of thebranch lengths (or overall tree length) is chosen as the best tree.
Advantages:• Can be used on indirectly-measured distances (immunological, hybridization).• Distances can be ‘corrected’ for unseen events.• Usually faster than character-based methods.• Can be used for some rate analyses.• Has an objective function (as compared to clustering methods).
Disadvantages:• Information lost when characters transformed to distances.• Cannot be used for character analysis.• Slower than clustering methods.
C-B Stewart, NHGRI lecture, 12/5/00
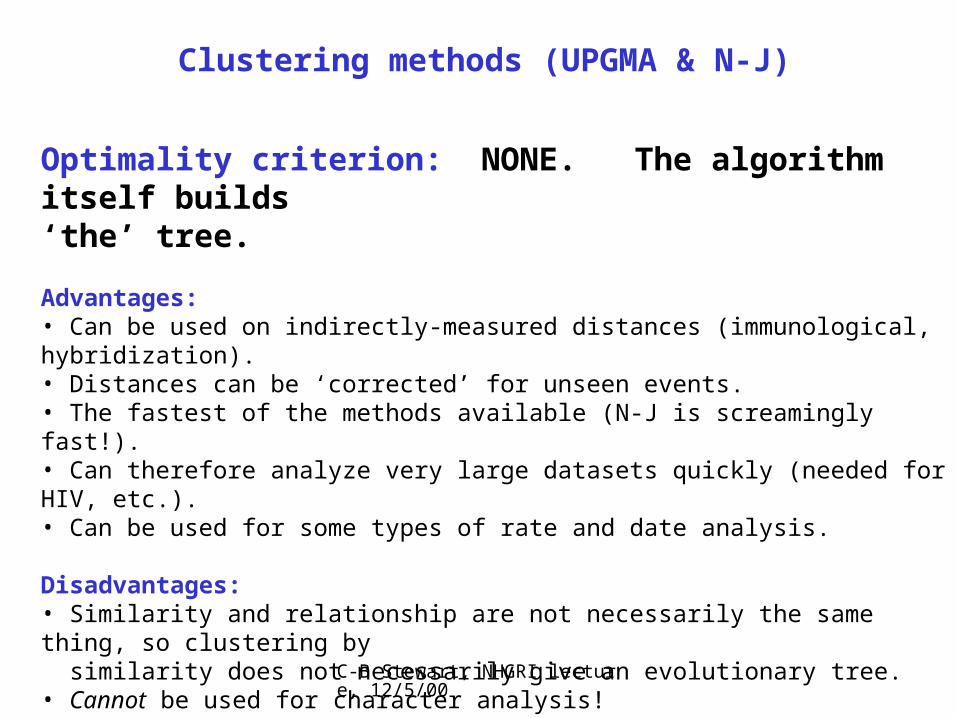
Clustering methods (UPGMA & N-J)
Optimality criterion: NONE. The algorithm itself builds‘the’ tree.
Advantages:• Can be used on indirectly-measured distances (immunological, hybridization).• Distances can be ‘corrected’ for unseen events.• The fastest of the methods available (N-J is screamingly fast!).• Can therefore analyze very large datasets quickly (needed for HIV, etc.).• Can be used for some types of rate and date analysis.
Disadvantages:• Similarity and relationship are not necessarily the same thing, so clustering by similarity does not necessarily give an evolutionary tree. • Cannot be used for character analysis!• Have no explicit optimization criteria, so one cannot even know if the program worked properly to find the correct tree for the method.
C-B Stewart, NHGRI lecture, 12/5/00
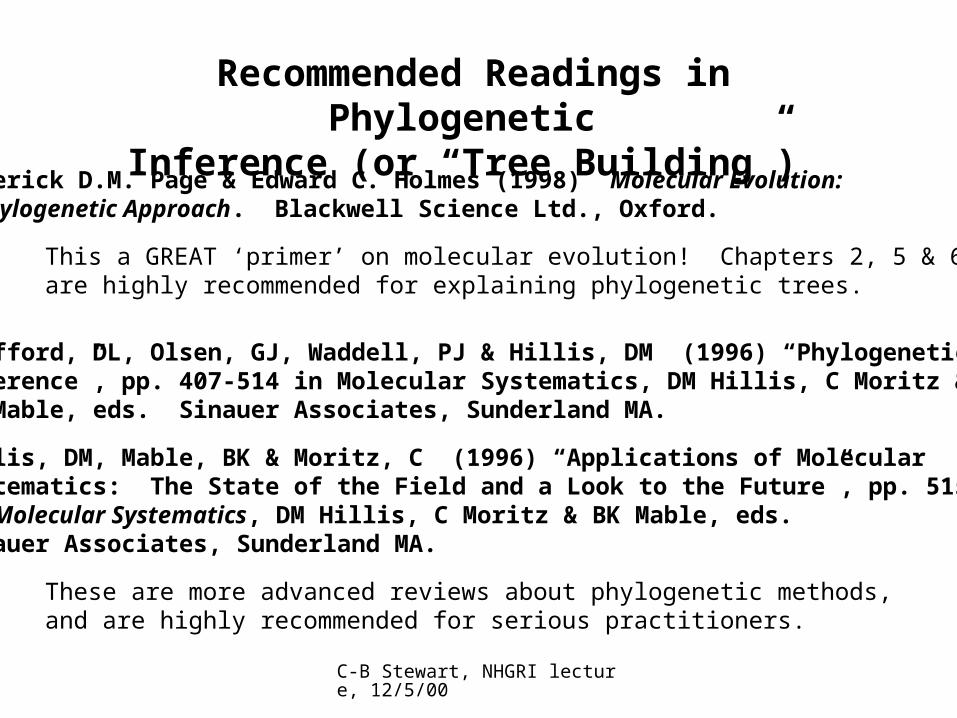
Recommended Readings in Phylogenetic Inference (or “Tree Building”)
Roderick D.M. Page & Edward C. Holmes (1998) Molecular Evolution: A Phylogenetic Approach. Blackwell Science Ltd., Oxford.
This a GREAT ‘primer’ on molecular evolution! Chapters 2, 5 & 6 are highly recommended for explaining phylogenetic trees.
Swofford, DL, Olsen, GJ, Waddell, PJ & Hillis, DM (1996) “PhylogeneticInference”, pp. 407-514 in Molecular Systematics, DM Hillis, C Moritz & BK Mable, eds. Sinauer Associates, Sunderland MA.
Hillis, DM, Mable, BK & Moritz, C (1996) “Applications of MolecularSystematics: The State of the Field and a Look to the Future”, pp. 515-543in Molecular Systematics, DM Hillis, C Moritz & BK Mable, eds. Sinauer Associates, Sunderland MA.
These are more advanced reviews about phylogenetic methods,and are highly recommended for serious practitioners.
C-B Stewart, NHGRI lecture, 12/5/00
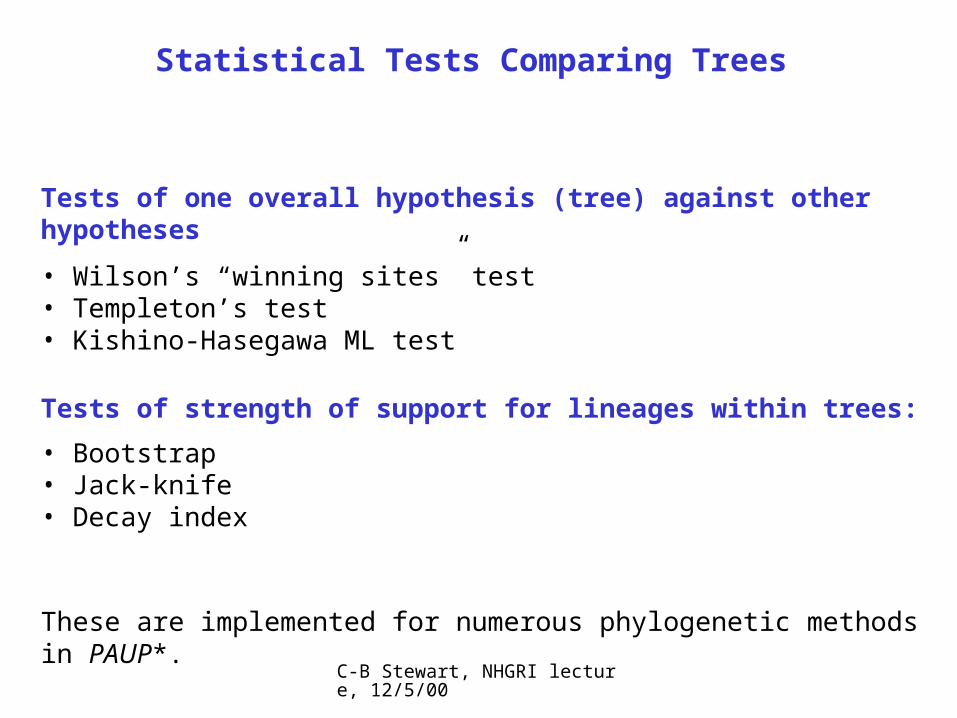
Statistical Tests Comparing Trees
Tests of one overall hypothesis (tree) against other hypotheses
• Wilson’s “winning sites” test• Templeton’s test• Kishino-Hasegawa ML test
Tests of strength of support for lineages within trees:
• Bootstrap• Jack-knife• Decay index
These are implemented for numerous phylogenetic methods in PAUP*.
C-B Stewart, NHGRI lecture, 12/5/00
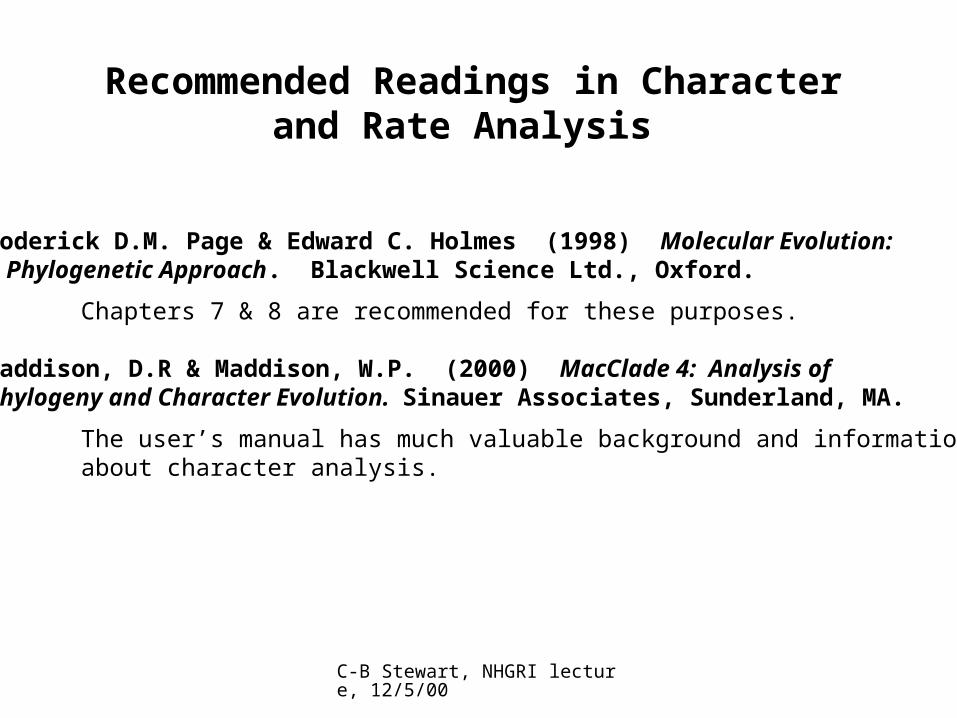
Recommended Readings in Character and Rate Analysis
Roderick D.M. Page & Edward C. Holmes (1998) Molecular Evolution:A Phylogenetic Approach. Blackwell Science Ltd., Oxford.
Chapters 7 & 8 are recommended for these purposes.
Maddison, D.R & Maddison, W.P. (2000) MacClade 4: Analysis ofPhylogeny and Character Evolution. Sinauer Associates, Sunderland, MA.
The user’s manual has much valuable background and informationabout character analysis.
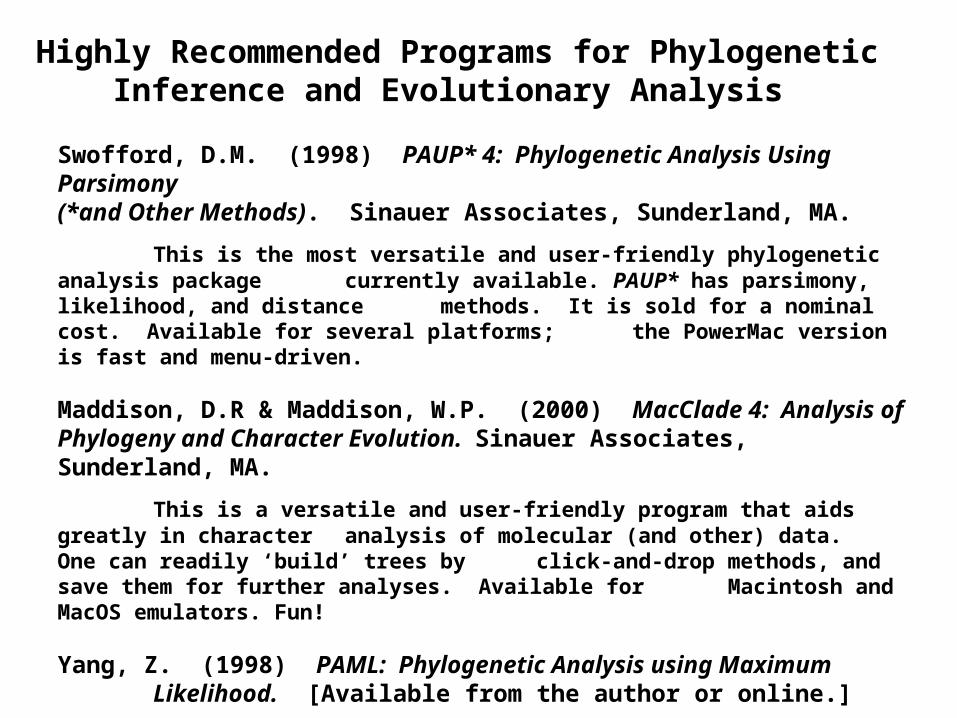
Highly Recommended Programs for Phylogenetic Inference and Evolutionary Analysis
Swofford, D.M. (1998) PAUP* 4: Phylogenetic Analysis Using Parsimony(*and Other Methods). Sinauer Associates, Sunderland, MA.
This is the most versatile and user-friendly phylogenetic analysis package currently available. PAUP* has parsimony, likelihood, and distance methods. It is sold for a nominal cost. Available for several platforms; the PowerMac version is fast and menu-driven.
Maddison, D.R & Maddison, W.P. (2000) MacClade 4: Analysis of Phylogeny and Character Evolution. Sinauer Associates, Sunderland, MA.
This is a versatile and user-friendly program that aids greatly in character analysis of molecular (and other) data. One can readily ‘build’ trees by click-and-drop methods, and save them for further analyses. Available for Macintosh and MacOS emulators. Fun!
Yang, Z. (1998) PAML: Phylogenetic Analysis using Maximum Likelihood. [Available from the author or online.]
This is the scientifically best program available for testing alternative models of molecular evolution in a phylogenetic ML framework. Is user-hostile, but worth the effort. Available for several platforms.
C-B Stewart, NHGRI lecture, 12/5/00
END
or Demonstrations?