phylogenetic homogenization of amphibian assemblages in ... · scales in the face of habitat...
TRANSCRIPT
Phylogenetic homogenization of amphibianassemblages in human-altered habitatsacross the globeA. Justin Nowakowskia,1,2, Luke O. Frishkoffb,1,2, Michelle E. Thompsonc, Tatiana M. Smitha, and Brian D. Todda
aDepartment of Wildlife, Fish, and Conservation Biology, University of California, Davis, CA 95616; bDepartment of Ecology and Evolutionary Biology,University of Toronto, Toronto, ON M5S 3B2, Canada; and cDepartment of Biological Sciences, Florida International University, Miami, FL 33199
Edited by David B. Wake, University of California, Berkeley, CA, and approved February 16, 2018 (received for review August 22, 2017)
Habitat conversion is driving biodiversity loss and restructuringspecies assemblages across the globe. Responses to habitatconversion vary widely, however, and little is known about thedegree to which shared evolutionary history underlies changes inspecies richness and composition. We analyzed data from 48 stud-ies, comprising 438 species on five continents, to understand howtaxonomic and phylogenetic diversity of amphibian assemblagesshifts in response to habitat conversion. We found that evolution-ary history explains the majority of variation in species’ responsesto habitat conversion, with specific clades scattered across theamphibian tree of life being favored by human land uses. Habitatconversion led to an average loss of 139 million years of amphibianevolutionary history within assemblages, high species and lineageturnover at landscape scales, and phylogenetic homogenization atthe global scale (despite minimal taxonomic homogenization). Line-age turnover across habitats was greatest in lowland tropical re-gions where large species pools and stable climates have perhapsgiven rise to many microclimatically specialized species. Together,our results indicate that strong phylogenetic clustering of species’responses to habitat conversion mediates nonrandom structuringof local assemblages and loss of global phylogenetic diversity. Inan age of rapid global change, identifying clades that are mostsensitive to habitat conversion will help prioritize use of limitedconservation resources.
habitat loss | land use | Anthropocene biogeography | biodiversity |phylogenetic generalized linear mixed model
Human populations have established nonnative habitatsacross the Earth that represent novel environments for bio-
diversity (1–3). Conversion of natural habitats occurs on short timescales—typically over few generations—relative to the often-vasttime scales of species’ niche evolution (4). As ecological commu-nities are increasingly exposed to rapid habitat conversion, manyspecies decline in altered habitats, whereas others persist or eventhrive. This variation in response to habitat conversion is poorlyunderstood and may result, in part, from both the environmentalconditions experienced by assemblages and the shared evolution-ary history of species. If closely related species exhibit similar re-sponses to altered environments, then habitat conversion couldprecipitate losses of entire clades from local assemblages (5).Habitat conversion favors some species that are fortuitously
preadapted to human-altered habitats while threatening others(6). An explicitly phylogenetic perspective is crucial becauseextinction risk and sensitivity to habitat conversion are ultimatelydetermined by species traits, which often reflect the sharedevolutionary histories of vulnerable species (7–11). For example,frugivorous and insectivorous birds, cool-adapted and terrestrial-developing amphibians, and small-bodied bats often have re-duced abundances in converted habitats (10, 12–17). However,the highly intercorrelated nature of many species traits means thatclearly identifying specific traits that underlie tolerance is chal-lenging, thereby limiting prediction. Phylogenetic relatedness actsas a useful proxy by integrating across all phylogenetically con-
served traits, including those that may govern responses tohabitat conversion.The cumulative outcome of environment-by-trait sorting and
species interactions in altered habitats generates changes in localdiversity (18). Diversity is usually considered solely from thetaxonomic (i.e., species identity) perspective, without consideringthe phylogenetic relationships among species. Patterns of taxo-nomic α-diversity are highly idiosyncratic, however, with differ-ent studies reporting increased, decreased, or unchanged speciesrichness following habitat conversion (3, 19). Local responsescan vary, in part, depending on the type of habitat alteration,with converted habitats that structurally contrast with naturalhabitats (e.g., intensive monocultures) often causing substantialdecreases in local richness (3, 20). The magnitude of change inphylogenetic α-diversity (the total evolutionary history containedwithin a local community) can mirror or deviate from that of tax-onomic α-diversity (21), depending on the shape of the communityphylogeny and the relatedness of species in each habitat (22). Wecurrently know little, however, about the phylogenetic relatednessof animal species that persist in converted habitats or how thesespecies are distributed across the tree of life (but see recent studiesof birds and bats at local and landscape scales; refs. 17, 21, and 23).At landscape scales, negligible changes in species richness can
obscure substantial shifts in species composition between natural
Significance
Widespread conversion of natural habitats to human land usecreates evolutionarily novel environments and causes declines ofnative species. Stemming biodiversity loss requires an under-standing of why some species persist while others decline in thesenovel habitats. We analyzed survey data of amphibian speciesfrom around the globe to determine whether closely related spe-cies respond similarly to habitat conversion. We find that speciesthat persist in converted habitats tend to come from the sameclades within the amphibian tree of life and that by favoring thesewidely distributed clades, habitat conversion leads to nonrandomextirpations and loss of evolutionary history. Our results show thatthe identity of winners and losers during the Anthropocene can betightly linked to their evolutionary history.
Author contributions: A.J.N. and L.O.F. designed research; A.J.N., L.O.F., M.E.T., T.M.S.,and B.D.T. performed research; A.J.N. and L.O.F. analyzed data; and A.J.N., L.O.F., M.E.T.,and B.D.T. wrote the paper.
The authors declare no conflict of interest.
This article is a PNAS Direct Submission.
Published under the PNAS license.
See Commentary on page 3739.1A.J.N. and L.O.F. contributed equally to this work.2To whom correspondence may be addressed. Email: [email protected] or [email protected].
This article contains supporting information online at www.pnas.org/lookup/suppl/doi:10.1073/pnas.1714891115/-/DCSupplemental.
Published online March 19, 2018.
E3454–E3462 | PNAS | vol. 115 | no. 15 www.pnas.org/cgi/doi/10.1073/pnas.1714891115
Dow
nloa
ded
by g
uest
on
Dec
embe
r 28
, 201
9
and converted habitats (24), which can arise from the concurrentloss of species that depend on natural habitats and the gain ofspecies that can exploit converted habitats (20). Taxonomicβ-diversity measures the degree to which sites differ in speciescomposition. If habitat conversion consistently benefits the sameset of species across broad spatial scales, then loss of β-diversitythrough taxonomic homogenization can occur, as assemblages indistant areas become increasingly similar (sensu refs. 25 and 26).In turn, phylogenetic β-diversity measures the degree to whichevolutionary history is shared across sites, such that phyloge-netically unique species contribute more to community differ-entiation than species with many close relatives. Importantly,even if distinct areas of the globe share no species in common,phylogenetic homogenization can still occur if habitat conversionrepeatedly benefits different species in the same clade. Measuresof taxonomic and phylogenetic β-diversity can each be parti-tioned into turnover, which measures the loss and gain of uniquespecies or lineages, and nestedness, which measures the differ-entiation among sites resulting from changes in α-diversity. Bylinking patterns of taxonomic diversity to evolutionary history,measures of phylogenetic β-diversity can provide new insightsinto how communities are being restructured at multiple spatialscales in the face of habitat conversion (21, 27–29).In addition to the evolutionary history of species, regional
environmental conditions can mediate community responses tohabitat conversion. For example, negative effects of habitat lossand fragmentation on α-diversity appear to be most pronouncedin warm, tropical climates (30), possibly owing to large increasesin temperatures and thermal stress in fragments and the sur-rounding converted habitats (31–34). Similarly, we expect thattaxonomic and phylogenetic β-diversity between natural andconverted habitats vary with latitude and elevation because re-gional climate will affect the magnitude of microclimatic differ-ences between natural and converted habitats. For example,differences in temperature between forest and pastures increasewith decreasing elevation (and increasing regional temperatures)in Central America (15), thereby modifying steepness of habitatsuitability gradients for ectotherms. High degrees of climaticniche specialization among tropical clades (e.g., narrow thermaltolerance breadths) could further intensify environmental fil-tering and lineage turnover in converted habitats in the tropics(35–37). Finally, the degree of landscape modification in a re-gion may determine the consequences of local habitat conversionon both α- and β-diversity by enriching the regional pool forspecies that are tolerant of habitat conversion, while eliminatingsensitive taxa or lineages.Here, we quantified patterns of taxonomic and phylogenetic
diversity of amphibians affected by habitat conversion across arange of converted-habitat types and biogeographic contexts. Wecompiled amphibian assemblage data from natural and con-verted habitats from published studies, and we mapped re-sponses onto a large-scale phylogeny to address the followingquestions: (i) Do closely related species exhibit similar responsesto habitat conversion, or are contrasting habitat affiliations in-terspersed randomly throughout the tree of life? (ii) Are pat-terns of phylogenetic α- and β-diversity concordant with those oftaxonomic α- and β-diversity in converted habitats, and do thesepatterns depend upon regional environmental context? (iii) Areamphibian assemblages being homogenized, as evidenced bydecreased β-diversity, in converted habitats along taxonomic andphylogenetic axes of biodiversity? By addressing these questions,we present a global analysis linking changes in amphibianabundance and diversity in converted habitats to the sharedevolutionary history of species.
ResultsSpecies Responses. Species varied widely in their responses tohabitat conversion. Based on a Bayesian implementation of a
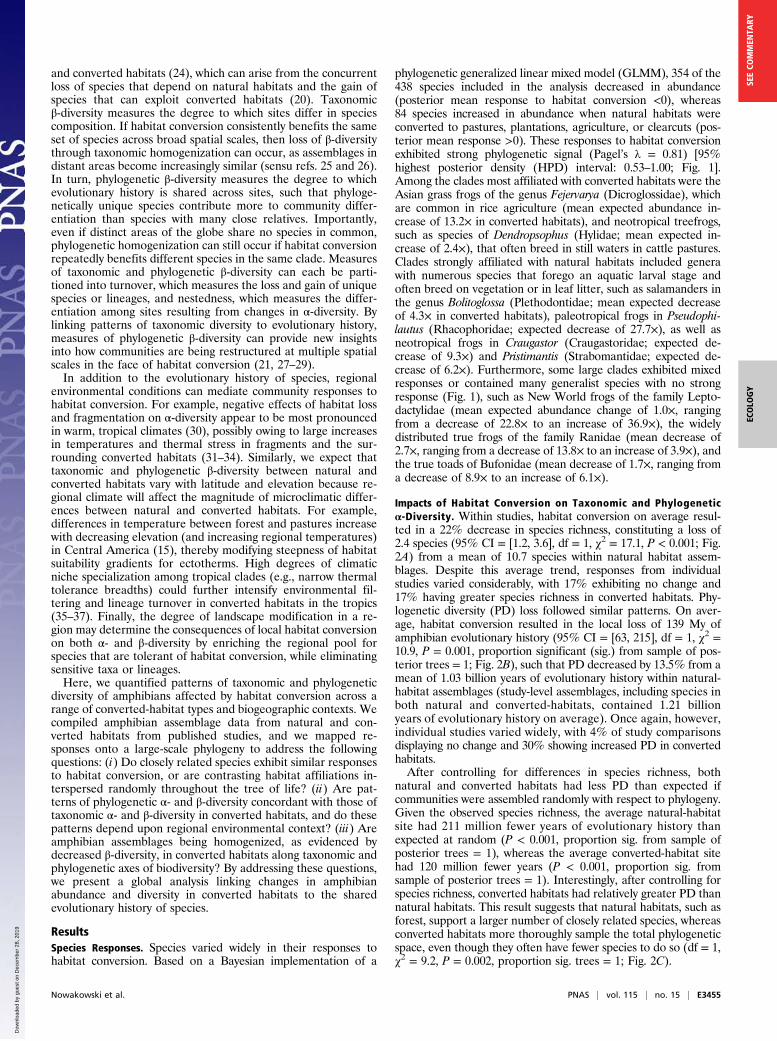
phylogenetic generalized linear mixed model (GLMM), 354 of the438 species included in the analysis decreased in abundance(posterior mean response to habitat conversion <0), whereas84 species increased in abundance when natural habitats wereconverted to pastures, plantations, agriculture, or clearcuts (pos-terior mean response >0). These responses to habitat conversionexhibited strong phylogenetic signal (Pagel’s λ = 0.81) [95%highest posterior density (HPD) interval: 0.53–1.00; Fig. 1].Among the clades most affiliated with converted habitats were theAsian grass frogs of the genus Fejervarya (Dicroglossidae), whichare common in rice agriculture (mean expected abundance in-crease of 13.2× in converted habitats), and neotropical treefrogs,such as species of Dendropsophus (Hylidae; mean expected in-crease of 2.4×), that often breed in still waters in cattle pastures.Clades strongly affiliated with natural habitats included generawith numerous species that forego an aquatic larval stage andoften breed on vegetation or in leaf litter, such as salamanders inthe genus Bolitoglossa (Plethodontidae; mean expected decreaseof 4.3× in converted habitats), paleotropical frogs in Pseudophi-lautus (Rhacophoridae; expected decrease of 27.7×), as well asneotropical frogs in Craugastor (Craugastoridae; expected de-crease of 9.3×) and Pristimantis (Strabomantidae; expected de-crease of 6.2×). Furthermore, some large clades exhibited mixedresponses or contained many generalist species with no strongresponse (Fig. 1), such as New World frogs of the family Lepto-dactylidae (mean expected abundance change of 1.0×, rangingfrom a decrease of 22.8× to an increase of 36.9×), the widelydistributed true frogs of the family Ranidae (mean decrease of2.7×, ranging from a decrease of 13.8× to an increase of 3.9×), andthe true toads of Bufonidae (mean decrease of 1.7×, ranging froma decrease of 8.9× to an increase of 6.1×).
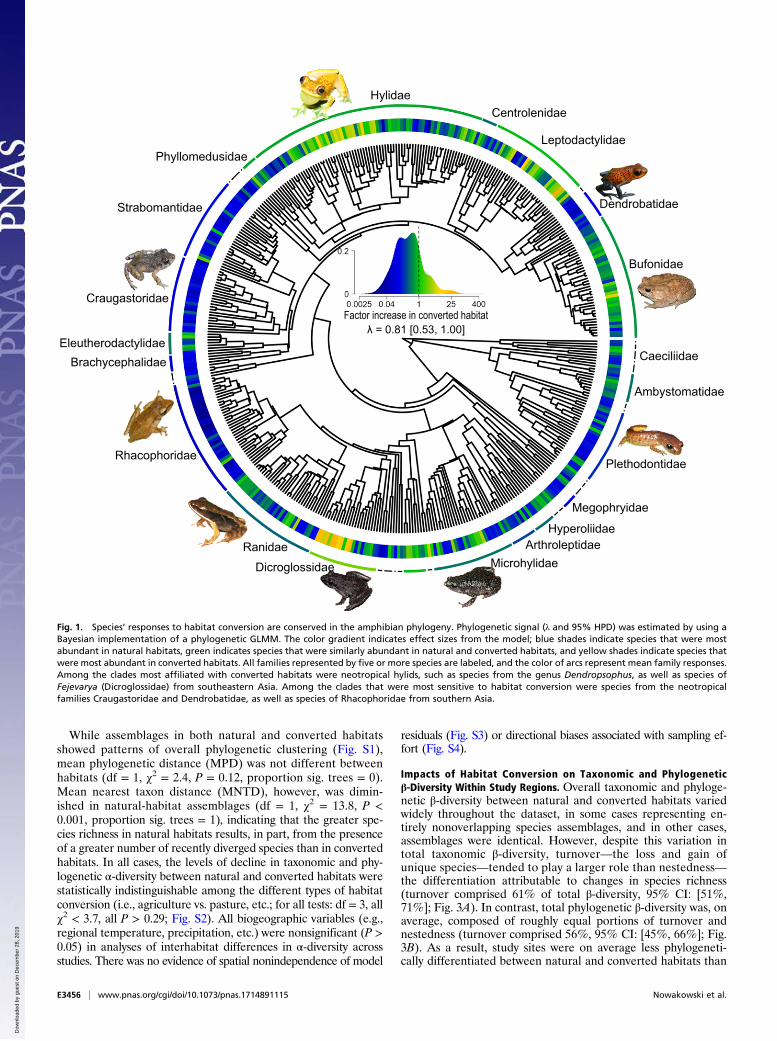
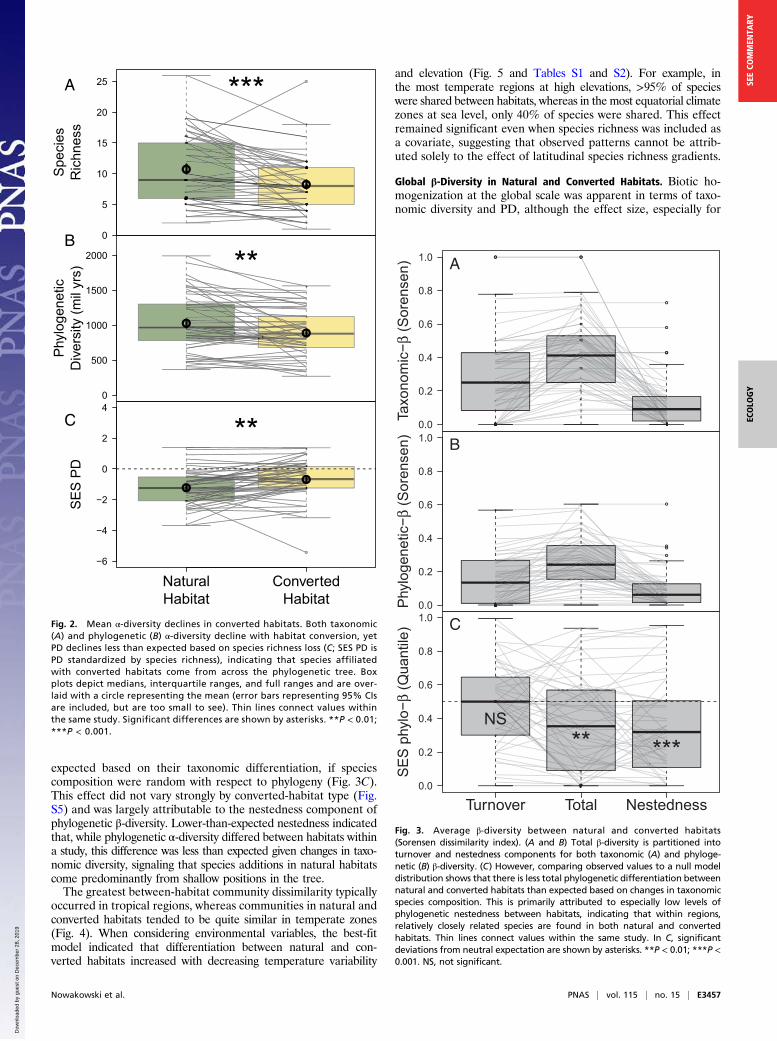
Impacts of Habitat Conversion on Taxonomic and Phylogeneticα-Diversity. Within studies, habitat conversion on average resul-ted in a 22% decrease in species richness, constituting a loss of2.4 species (95% CI = [1.2, 3.6], df = 1, χ2 = 17.1, P < 0.001; Fig.2A) from a mean of 10.7 species within natural habitat assem-blages. Despite this average trend, responses from individualstudies varied considerably, with 17% exhibiting no change and17% having greater species richness in converted habitats. Phy-logenetic diversity (PD) loss followed similar patterns. On aver-age, habitat conversion resulted in the local loss of 139 My ofamphibian evolutionary history (95% CI = [63, 215], df = 1, χ2 =10.9, P = 0.001, proportion significant (sig.) from sample of pos-terior trees = 1; Fig. 2B), such that PD decreased by 13.5% from amean of 1.03 billion years of evolutionary history within natural-habitat assemblages (study-level assemblages, including species inboth natural and converted-habitats, contained 1.21 billionyears of evolutionary history on average). Once again, however,individual studies varied widely, with 4% of study comparisonsdisplaying no change and 30% showing increased PD in convertedhabitats.After controlling for differences in species richness, both
natural and converted habitats had less PD than expected ifcommunities were assembled randomly with respect to phylogeny.Given the observed species richness, the average natural-habitatsite had 211 million fewer years of evolutionary history thanexpected at random (P < 0.001, proportion sig. from sample ofposterior trees = 1), whereas the average converted-habitat sitehad 120 million fewer years (P < 0.001, proportion sig. fromsample of posterior trees = 1). Interestingly, after controlling forspecies richness, converted habitats had relatively greater PD thannatural habitats. This result suggests that natural habitats, such asforest, support a larger number of closely related species, whereasconverted habitats more thoroughly sample the total phylogeneticspace, even though they often have fewer species to do so (df = 1,χ2 = 9.2, P = 0.002, proportion sig. trees = 1; Fig. 2C).
Nowakowski et al. PNAS | vol. 115 | no. 15 | E3455
ECOLO
GY
SEECO
MMEN
TARY
Dow
nloa
ded
by g
uest
on
Dec
embe
r 28
, 201
9
While assemblages in both natural and converted habitatsshowed patterns of overall phylogenetic clustering (Fig. S1),mean phylogenetic distance (MPD) was not different betweenhabitats (df = 1, χ2 = 2.4, P = 0.12, proportion sig. trees = 0).Mean nearest taxon distance (MNTD), however, was dimin-ished in natural-habitat assemblages (df = 1, χ2 = 13.8, P <0.001, proportion sig. trees = 1), indicating that the greater spe-cies richness in natural habitats results, in part, from the presenceof a greater number of recently diverged species than in convertedhabitats. In all cases, the levels of decline in taxonomic and phy-logenetic α-diversity between natural and converted habitats werestatistically indistinguishable among the different types of habitatconversion (i.e., agriculture vs. pasture, etc.; for all tests: df = 3, allχ2 < 3.7, all P > 0.29; Fig. S2). All biogeographic variables (e.g.,regional temperature, precipitation, etc.) were nonsignificant (P >0.05) in analyses of interhabitat differences in α-diversity acrossstudies. There was no evidence of spatial nonindependence of model
residuals (Fig. S3) or directional biases associated with sampling ef-fort (Fig. S4).
Impacts of Habitat Conversion on Taxonomic and Phylogeneticβ-Diversity Within Study Regions. Overall taxonomic and phyloge-netic β-diversity between natural and converted habitats variedwidely throughout the dataset, in some cases representing en-tirely nonoverlapping species assemblages, and in other cases,assemblages were identical. However, despite this variation intotal taxonomic β-diversity, turnover—the loss and gain ofunique species—tended to play a larger role than nestedness—the differentiation attributable to changes in species richness(turnover comprised 61% of total β-diversity, 95% CI: [51%,71%]; Fig. 3A). In contrast, total phylogenetic β-diversity was, onaverage, composed of roughly equal portions of turnover andnestedness (turnover comprised 56%, 95% CI: [45%, 66%]; Fig.3B). As a result, study sites were on average less phylogeneti-cally differentiated between natural and converted habitats than
Craugastoridae
Phyllomedusidae
Hylidae
EleutherodactylidaeBrachycephalidae
Rhacophoridae
Ambystomatidae
Megophryidae
ArthroleptidaeHyperoliidae
Plethodontidae
Leptodactylidae
Bufonidae
Centrolenidae
Caeciliidae
Ranidae
Dicroglossidae Microhylidae
Strabomantidae Dendrobatidae
Fig. 1. Species’ responses to habitat conversion are conserved in the amphibian phylogeny. Phylogenetic signal (λ and 95% HPD) was estimated by using aBayesian implementation of a phylogenetic GLMM. The color gradient indicates effect sizes from the model; blue shades indicate species that were mostabundant in natural habitats, green indicates species that were similarly abundant in natural and converted habitats, and yellow shades indicate species thatwere most abundant in converted habitats. All families represented by five or more species are labeled, and the color of arcs represent mean family responses.Among the clades most affiliated with converted habitats were neotropical hylids, such as species from the genus Dendropsophus, as well as species ofFejevarya (Dicroglossidae) from southeastern Asia. Among the clades that were most sensitive to habitat conversion were species from the neotropicalfamilies Craugastoridae and Dendrobatidae, as well as species of Rhacophoridae from southern Asia.
E3456 | www.pnas.org/cgi/doi/10.1073/pnas.1714891115 Nowakowski et al.
Dow
nloa
ded
by g
uest
on
Dec
embe
r 28
, 201
9
expected based on their taxonomic differentiation, if speciescomposition were random with respect to phylogeny (Fig. 3C).This effect did not vary strongly by converted-habitat type (Fig.S5) and was largely attributable to the nestedness component ofphylogenetic β-diversity. Lower-than-expected nestedness indicatedthat, while phylogenetic α-diversity differed between habitats withina study, this difference was less than expected given changes in taxo-nomic diversity, signaling that species additions in natural habitatscome predominantly from shallow positions in the tree.The greatest between-habitat community dissimilarity typically
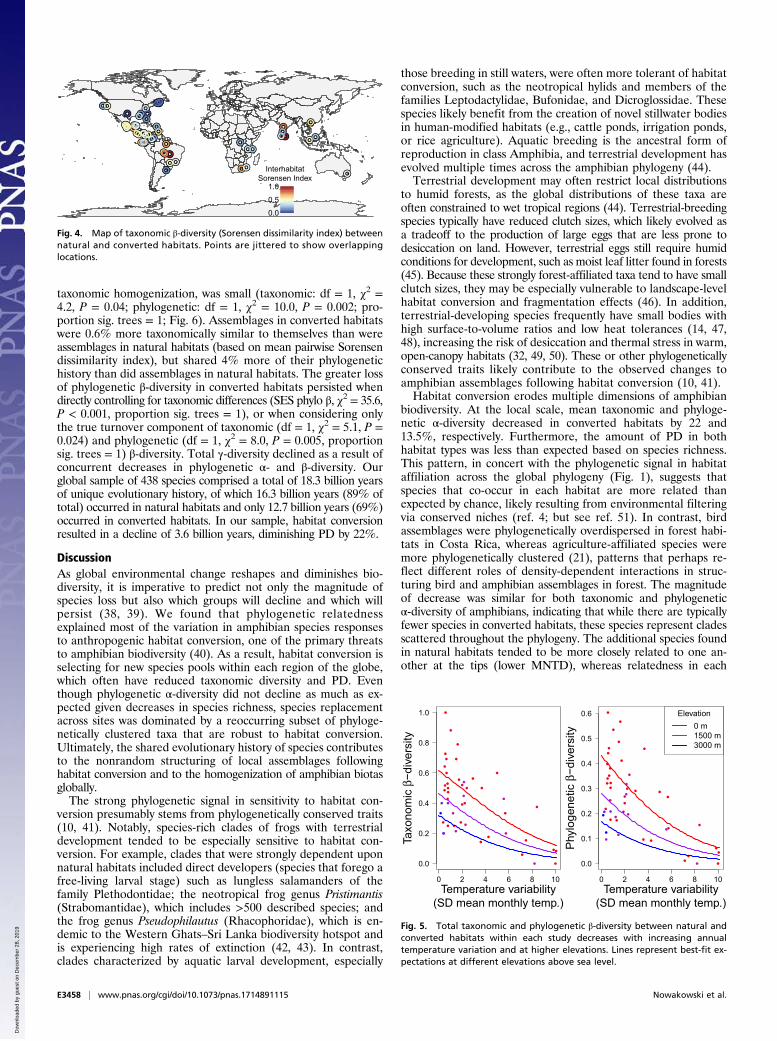
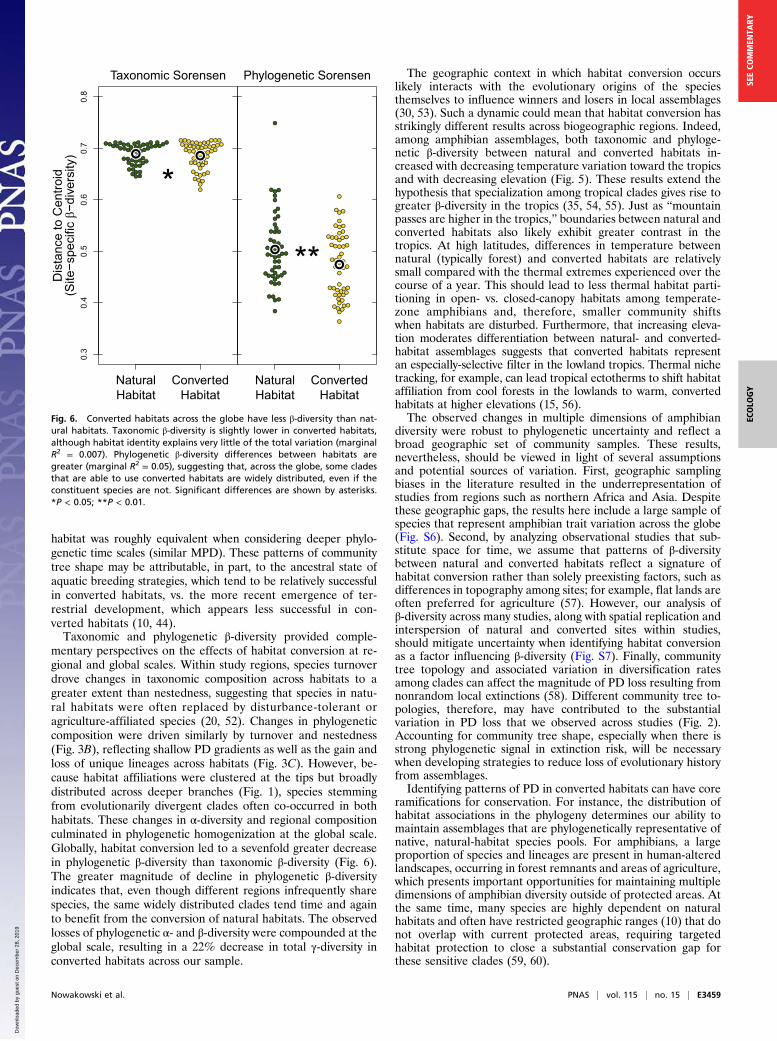
occurred in tropical regions, whereas communities in natural andconverted habitats tended to be quite similar in temperate zones(Fig. 4). When considering environmental variables, the best-fitmodel indicated that differentiation between natural and con-verted habitats increased with decreasing temperature variability
and elevation (Fig. 5 and Tables S1 and S2). For example, inthe most temperate regions at high elevations, >95% of specieswere shared between habitats, whereas in the most equatorial climatezones at sea level, only 40% of species were shared. This effectremained significant even when species richness was included asa covariate, suggesting that observed patterns cannot be attrib-uted solely to the effect of latitudinal species richness gradients.
Global β-Diversity in Natural and Converted Habitats. Biotic ho-mogenization at the global scale was apparent in terms of taxo-nomic diversity and PD, although the effect size, especially for
0
5
10
15
20
25 ***S
peci
esR
ichn
ess
0
500
1000
1500
2000 **
Phy
loge
netic
Div
ersi
ty (m
il yr
s)
−6
−4
−2
0
2
4
**
SE
S P
D
NaturalHabitat
ConvertedHabitat
B
C
A
Fig. 2. Mean α-diversity declines in converted habitats. Both taxonomic(A) and phylogenetic (B) α-diversity decline with habitat conversion, yetPD declines less than expected based on species richness loss (C; SES PD isPD standardized by species richness), indicating that species affiliatedwith converted habitats come from across the phylogenetic tree. Boxplots depict medians, interquartile ranges, and full ranges and are over-laid with a circle representing the mean (error bars representing 95% CIsare included, but are too small to see). Thin lines connect values withinthe same study. Significant differences are shown by asterisks. **P < 0.01;***P < 0.001.
0.0
0.2
0.4
0.6
0.8
1.0
Taxo
nom
ic−
(Sor
ense
n) A
0.0
0.2
0.4
0.6
0.8
1.0
Phy
loge
netic−
(Sor
ense
n) B
0.0
0.2
0.4
0.6
0.8
1.0
SE
S p
hylo−
(Qua
ntile
)
Turnover Total Nestedness
NS** ***
C
Fig. 3. Average β-diversity between natural and converted habitats(Sorensen dissimilarity index). (A and B) Total β-diversity is partitioned intoturnover and nestedness components for both taxonomic (A) and phyloge-netic (B) β-diversity. (C) However, comparing observed values to a null modeldistribution shows that there is less total phylogenetic differentiation betweennatural and converted habitats than expected based on changes in taxonomicspecies composition. This is primarily attributed to especially low levels ofphylogenetic nestedness between habitats, indicating that within regions,relatively closely related species are found in both natural and convertedhabitats. Thin lines connect values within the same study. In C, significantdeviations from neutral expectation are shown by asterisks. **P < 0.01; ***P <0.001. NS, not significant.
Nowakowski et al. PNAS | vol. 115 | no. 15 | E3457
ECOLO
GY
SEECO
MMEN
TARY
Dow
nloa
ded
by g
uest
on
Dec
embe
r 28
, 201
9
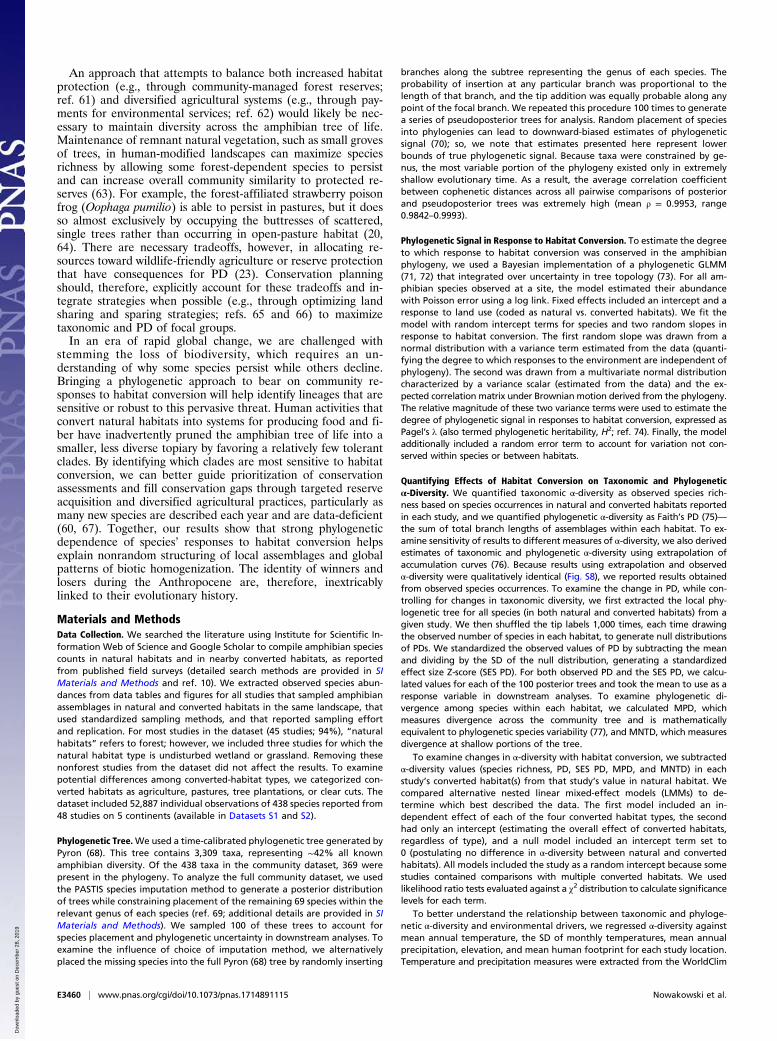
taxonomic homogenization, was small (taxonomic: df = 1, χ2 =4.2, P = 0.04; phylogenetic: df = 1, χ2 = 10.0, P = 0.002; pro-portion sig. trees = 1; Fig. 6). Assemblages in converted habitatswere 0.6% more taxonomically similar to themselves than wereassemblages in natural habitats (based on mean pairwise Sorensendissimilarity index), but shared 4% more of their phylogenetichistory than did assemblages in natural habitats. The greater lossof phylogenetic β-diversity in converted habitats persisted whendirectly controlling for taxonomic differences (SES phylo β, χ2 = 35.6,P < 0.001, proportion sig. trees = 1), or when considering onlythe true turnover component of taxonomic (df = 1, χ2 = 5.1, P =0.024) and phylogenetic (df = 1, χ2 = 8.0, P = 0.005, proportionsig. trees = 1) β-diversity. Total γ-diversity declined as a result ofconcurrent decreases in phylogenetic α- and β-diversity. Ourglobal sample of 438 species comprised a total of 18.3 billion yearsof unique evolutionary history, of which 16.3 billion years (89% oftotal) occurred in natural habitats and only 12.7 billion years (69%)occurred in converted habitats. In our sample, habitat conversionresulted in a decline of 3.6 billion years, diminishing PD by 22%.
DiscussionAs global environmental change reshapes and diminishes bio-diversity, it is imperative to predict not only the magnitude ofspecies loss but also which groups will decline and which willpersist (38, 39). We found that phylogenetic relatednessexplained most of the variation in amphibian species responsesto anthropogenic habitat conversion, one of the primary threatsto amphibian biodiversity (40). As a result, habitat conversion isselecting for new species pools within each region of the globe,which often have reduced taxonomic diversity and PD. Eventhough phylogenetic α-diversity did not decline as much as ex-pected given decreases in species richness, species replacementacross sites was dominated by a reoccurring subset of phyloge-netically clustered taxa that are robust to habitat conversion.Ultimately, the shared evolutionary history of species contributesto the nonrandom structuring of local assemblages followinghabitat conversion and to the homogenization of amphibian biotasglobally.The strong phylogenetic signal in sensitivity to habitat con-
version presumably stems from phylogenetically conserved traits(10, 41). Notably, species-rich clades of frogs with terrestrialdevelopment tended to be especially sensitive to habitat con-version. For example, clades that were strongly dependent uponnatural habitats included direct developers (species that forego afree-living larval stage) such as lungless salamanders of thefamily Plethodontidae; the neotropical frog genus Pristimantis(Strabomantidae), which includes >500 described species; andthe frog genus Pseudophilautus (Rhacophoridae), which is en-demic to the Western Ghats–Sri Lanka biodiversity hotspot andis experiencing high rates of extinction (42, 43). In contrast,clades characterized by aquatic larval development, especially
those breeding in still waters, were often more tolerant of habitatconversion, such as the neotropical hylids and members of thefamilies Leptodactylidae, Bufonidae, and Dicroglossidae. Thesespecies likely benefit from the creation of novel stillwater bodiesin human-modified habitats (e.g., cattle ponds, irrigation ponds,or rice agriculture). Aquatic breeding is the ancestral form ofreproduction in class Amphibia, and terrestrial development hasevolved multiple times across the amphibian phylogeny (44).Terrestrial development may often restrict local distributions
to humid forests, as the global distributions of these taxa areoften constrained to wet tropical regions (44). Terrestrial-breedingspecies typically have reduced clutch sizes, which likely evolved asa tradeoff to the production of large eggs that are less prone todesiccation on land. However, terrestrial eggs still require humidconditions for development, such as moist leaf litter found in forests(45). Because these strongly forest-affiliated taxa tend to have smallclutch sizes, they may be especially vulnerable to landscape-levelhabitat conversion and fragmentation effects (46). In addition,terrestrial-developing species frequently have small bodies withhigh surface-to-volume ratios and low heat tolerances (14, 47,48), increasing the risk of desiccation and thermal stress in warm,open-canopy habitats (32, 49, 50). These or other phylogeneticallyconserved traits likely contribute to the observed changes toamphibian assemblages following habitat conversion (10, 41).Habitat conversion erodes multiple dimensions of amphibian
biodiversity. At the local scale, mean taxonomic and phyloge-netic α-diversity decreased in converted habitats by 22 and13.5%, respectively. Furthermore, the amount of PD in bothhabitat types was less than expected based on species richness.This pattern, in concert with the phylogenetic signal in habitataffiliation across the global phylogeny (Fig. 1), suggests thatspecies that co-occur in each habitat are more related thanexpected by chance, likely resulting from environmental filteringvia conserved niches (ref. 4; but see ref. 51). In contrast, birdassemblages were phylogenetically overdispersed in forest habi-tats in Costa Rica, whereas agriculture-affiliated species weremore phylogenetically clustered (21), patterns that perhaps re-flect different roles of density-dependent interactions in struc-turing bird and amphibian assemblages in forest. The magnitudeof decrease was similar for both taxonomic and phylogeneticα-diversity of amphibians, indicating that while there are typicallyfewer species in converted habitats, these species represent cladesscattered throughout the phylogeny. The additional species foundin natural habitats tended to be more closely related to one an-other at the tips (lower MNTD), whereas relatedness in each
Fig. 4. Map of taxonomic β-diversity (Sorensen dissimilarity index) betweennatural and converted habitats. Points are jittered to show overlappinglocations.
0.0
0.2
0.4
0.6
0.8
1.0
Taxo
nom
ic
−div
ersi
ty
0 2 4 6 8 10Temperature variability
(SD mean monthly temp.)
0.0
0.1
0.2
0.3
0.4
0.5
0.6
Phy
loge
netic
−d
iver
sity
Elevation0 m1500 m3000 m
0 2 4 6 8 10Temperature variability
(SD mean monthly temp.)
Fig. 5. Total taxonomic and phylogenetic β-diversity between natural andconverted habitats within each study decreases with increasing annualtemperature variation and at higher elevations. Lines represent best-fit ex-pectations at different elevations above sea level.
E3458 | www.pnas.org/cgi/doi/10.1073/pnas.1714891115 Nowakowski et al.
Dow
nloa
ded
by g
uest
on
Dec
embe
r 28
, 201
9
habitat was roughly equivalent when considering deeper phylo-genetic time scales (similar MPD). These patterns of communitytree shape may be attributable, in part, to the ancestral state ofaquatic breeding strategies, which tend to be relatively successfulin converted habitats, vs. the more recent emergence of ter-restrial development, which appears less successful in con-verted habitats (10, 44).Taxonomic and phylogenetic β-diversity provided comple-
mentary perspectives on the effects of habitat conversion at re-gional and global scales. Within study regions, species turnoverdrove changes in taxonomic composition across habitats to agreater extent than nestedness, suggesting that species in natu-ral habitats were often replaced by disturbance-tolerant oragriculture-affiliated species (20, 52). Changes in phylogeneticcomposition were driven similarly by turnover and nestedness(Fig. 3B), reflecting shallow PD gradients as well as the gain andloss of unique lineages across habitats (Fig. 3C). However, be-cause habitat affiliations were clustered at the tips but broadlydistributed across deeper branches (Fig. 1), species stemmingfrom evolutionarily divergent clades often co-occurred in bothhabitats. These changes in α-diversity and regional compositionculminated in phylogenetic homogenization at the global scale.Globally, habitat conversion led to a sevenfold greater decreasein phylogenetic β-diversity than taxonomic β-diversity (Fig. 6).The greater magnitude of decline in phylogenetic β-diversityindicates that, even though different regions infrequently sharespecies, the same widely distributed clades tend time and againto benefit from the conversion of natural habitats. The observedlosses of phylogenetic α- and β-diversity were compounded at theglobal scale, resulting in a 22% decrease in total γ-diversity inconverted habitats across our sample.
The geographic context in which habitat conversion occurslikely interacts with the evolutionary origins of the speciesthemselves to influence winners and losers in local assemblages(30, 53). Such a dynamic could mean that habitat conversion hasstrikingly different results across biogeographic regions. Indeed,among amphibian assemblages, both taxonomic and phyloge-netic β-diversity between natural and converted habitats in-creased with decreasing temperature variation toward the tropicsand with decreasing elevation (Fig. 5). These results extend thehypothesis that specialization among tropical clades gives rise togreater β-diversity in the tropics (35, 54, 55). Just as “mountainpasses are higher in the tropics,” boundaries between natural andconverted habitats also likely exhibit greater contrast in thetropics. At high latitudes, differences in temperature betweennatural (typically forest) and converted habitats are relativelysmall compared with the thermal extremes experienced over thecourse of a year. This should lead to less thermal habitat parti-tioning in open- vs. closed-canopy habitats among temperate-zone amphibians and, therefore, smaller community shiftswhen habitats are disturbed. Furthermore, that increasing eleva-tion moderates differentiation between natural- and converted-habitat assemblages suggests that converted habitats representan especially-selective filter in the lowland tropics. Thermal nichetracking, for example, can lead tropical ectotherms to shift habitataffiliation from cool forests in the lowlands to warm, convertedhabitats at higher elevations (15, 56).The observed changes in multiple dimensions of amphibian
diversity were robust to phylogenetic uncertainty and reflect abroad geographic set of community samples. These results,nevertheless, should be viewed in light of several assumptionsand potential sources of variation. First, geographic samplingbiases in the literature resulted in the underrepresentation ofstudies from regions such as northern Africa and Asia. Despitethese geographic gaps, the results here include a large sample ofspecies that represent amphibian trait variation across the globe(Fig. S6). Second, by analyzing observational studies that sub-stitute space for time, we assume that patterns of β-diversitybetween natural and converted habitats reflect a signature ofhabitat conversion rather than solely preexisting factors, such asdifferences in topography among sites; for example, flat lands areoften preferred for agriculture (57). However, our analysis ofβ-diversity across many studies, along with spatial replication andinterspersion of natural and converted sites within studies,should mitigate uncertainty when identifying habitat conversionas a factor influencing β-diversity (Fig. S7). Finally, communitytree topology and associated variation in diversification ratesamong clades can affect the magnitude of PD loss resulting fromnonrandom local extinctions (58). Different community tree to-pologies, therefore, may have contributed to the substantialvariation in PD loss that we observed across studies (Fig. 2).Accounting for community tree shape, especially when there isstrong phylogenetic signal in extinction risk, will be necessarywhen developing strategies to reduce loss of evolutionary historyfrom assemblages.Identifying patterns of PD in converted habitats can have core
ramifications for conservation. For instance, the distribution ofhabitat associations in the phylogeny determines our ability tomaintain assemblages that are phylogenetically representative ofnative, natural-habitat species pools. For amphibians, a largeproportion of species and lineages are present in human-alteredlandscapes, occurring in forest remnants and areas of agriculture,which presents important opportunities for maintaining multipledimensions of amphibian diversity outside of protected areas. Atthe same time, many species are highly dependent on naturalhabitats and often have restricted geographic ranges (10) that donot overlap with current protected areas, requiring targetedhabitat protection to close a substantial conservation gap forthese sensitive clades (59, 60).
0.3
0.4
0.5
0.6
0.7
0.8
Dis
tanc
e to
Cen
troid
(Site
−spe
cific
β−di
vers
ity)
Taxonomic Sorensen
NaturalHabitat
ConvertedHabitat
Phylogenetic Sorensen
NaturalHabitat
ConvertedHabitat
Fig. 6. Converted habitats across the globe have less β-diversity than nat-ural habitats. Taxonomic β-diversity is slightly lower in converted habitats,although habitat identity explains very little of the total variation (marginalR2 = 0.007). Phylogenetic β-diversity differences between habitats aregreater (marginal R2 = 0.05), suggesting that, across the globe, some cladesthat are able to use converted habitats are widely distributed, even if theconstituent species are not. Significant differences are shown by asterisks.*P < 0.05; **P < 0.01.
Nowakowski et al. PNAS | vol. 115 | no. 15 | E3459
ECOLO
GY
SEECO
MMEN
TARY
Dow
nloa
ded
by g
uest
on
Dec
embe
r 28
, 201
9
An approach that attempts to balance both increased habitatprotection (e.g., through community-managed forest reserves;ref. 61) and diversified agricultural systems (e.g., through pay-ments for environmental services; ref. 62) would likely be nec-essary to maintain diversity across the amphibian tree of life.Maintenance of remnant natural vegetation, such as small grovesof trees, in human-modified landscapes can maximize speciesrichness by allowing some forest-dependent species to persistand can increase overall community similarity to protected re-serves (63). For example, the forest-affiliated strawberry poisonfrog (Oophaga pumilio) is able to persist in pastures, but it doesso almost exclusively by occupying the buttresses of scattered,single trees rather than occurring in open-pasture habitat (20,64). There are necessary tradeoffs, however, in allocating re-sources toward wildlife-friendly agriculture or reserve protectionthat have consequences for PD (23). Conservation planningshould, therefore, explicitly account for these tradeoffs and in-tegrate strategies when possible (e.g., through optimizing landsharing and sparing strategies; refs. 65 and 66) to maximizetaxonomic and PD of focal groups.In an era of rapid global change, we are challenged with
stemming the loss of biodiversity, which requires an un-derstanding of why some species persist while others decline.Bringing a phylogenetic approach to bear on community re-sponses to habitat conversion will help identify lineages that aresensitive or robust to this pervasive threat. Human activities thatconvert natural habitats into systems for producing food and fi-ber have inadvertently pruned the amphibian tree of life into asmaller, less diverse topiary by favoring a relatively few tolerantclades. By identifying which clades are most sensitive to habitatconversion, we can better guide prioritization of conservationassessments and fill conservation gaps through targeted reserveacquisition and diversified agricultural practices, particularly asmany new species are described each year and are data-deficient(60, 67). Together, our results show that strong phylogeneticdependence of species’ responses to habitat conversion helpsexplain nonrandom structuring of local assemblages and globalpatterns of biotic homogenization. The identity of winners andlosers during the Anthropocene are, therefore, inextricablylinked to their evolutionary history.
Materials and MethodsData Collection. We searched the literature using Institute for Scientific In-formation Web of Science and Google Scholar to compile amphibian speciescounts in natural habitats and in nearby converted habitats, as reportedfrom published field surveys (detailed search methods are provided in SIMaterials and Methods and ref. 10). We extracted observed species abun-dances from data tables and figures for all studies that sampled amphibianassemblages in natural and converted habitats in the same landscape, thatused standardized sampling methods, and that reported sampling effortand replication. For most studies in the dataset (45 studies; 94%), “naturalhabitats” refers to forest; however, we included three studies for which thenatural habitat type is undisturbed wetland or grassland. Removing thesenonforest studies from the dataset did not affect the results. To examinepotential differences among converted-habitat types, we categorized con-verted habitats as agriculture, pastures, tree plantations, or clear cuts. Thedataset included 52,887 individual observations of 438 species reported from48 studies on 5 continents (available in Datasets S1 and S2).
Phylogenetic Tree.We used a time-calibrated phylogenetic tree generated byPyron (68). This tree contains 3,309 taxa, representing ∼42% all knownamphibian diversity. Of the 438 taxa in the community dataset, 369 werepresent in the phylogeny. To analyze the full community dataset, we usedthe PASTIS species imputation method to generate a posterior distributionof trees while constraining placement of the remaining 69 species within therelevant genus of each species (ref. 69; additional details are provided in SIMaterials and Methods). We sampled 100 of these trees to account forspecies placement and phylogenetic uncertainty in downstream analyses. Toexamine the influence of choice of imputation method, we alternativelyplaced the missing species into the full Pyron (68) tree by randomly inserting
branches along the subtree representing the genus of each species. Theprobability of insertion at any particular branch was proportional to thelength of that branch, and the tip addition was equally probable along anypoint of the focal branch. We repeated this procedure 100 times to generatea series of pseudoposterior trees for analysis. Random placement of speciesinto phylogenies can lead to downward-biased estimates of phylogeneticsignal (70); so, we note that estimates presented here represent lowerbounds of true phylogenetic signal. Because taxa were constrained by ge-nus, the most variable portion of the phylogeny existed only in extremelyshallow evolutionary time. As a result, the average correlation coefficientbetween cophenetic distances across all pairwise comparisons of posteriorand pseudoposterior trees was extremely high (mean ρ = 0.9953, range0.9842–0.9993).
Phylogenetic Signal in Response to Habitat Conversion. To estimate the degreeto which response to habitat conversion was conserved in the amphibianphylogeny, we used a Bayesian implementation of a phylogenetic GLMM(71, 72) that integrated over uncertainty in tree topology (73). For all am-phibian species observed at a site, the model estimated their abundancewith Poisson error using a log link. Fixed effects included an intercept and aresponse to land use (coded as natural vs. converted habitats). We fit themodel with random intercept terms for species and two random slopes inresponse to habitat conversion. The first random slope was drawn from anormal distribution with a variance term estimated from the data (quanti-fying the degree to which responses to the environment are independent ofphylogeny). The second was drawn from a multivariate normal distributioncharacterized by a variance scalar (estimated from the data) and the ex-pected correlation matrix under Brownian motion derived from the phylogeny.The relative magnitude of these two variance terms were used to estimate thedegree of phylogenetic signal in responses to habitat conversion, expressed asPagel’s λ (also termed phylogenetic heritability, H2; ref. 74). Finally, the modeladditionally included a random error term to account for variation not con-served within species or between habitats.
Quantifying Effects of Habitat Conversion on Taxonomic and Phylogeneticα-Diversity. We quantified taxonomic α-diversity as observed species rich-ness based on species occurrences in natural and converted habitats reportedin each study, and we quantified phylogenetic α-diversity as Faith’s PD (75)—the sum of total branch lengths of assemblages within each habitat. To ex-amine sensitivity of results to different measures of α-diversity, we also derivedestimates of taxonomic and phylogenetic α-diversity using extrapolation ofaccumulation curves (76). Because results using extrapolation and observedα-diversity were qualitatively identical (Fig. S8), we reported results obtainedfrom observed species occurrences. To examine the change in PD, while con-trolling for changes in taxonomic diversity, we first extracted the local phy-logenetic tree for all species (in both natural and converted habitats) from agiven study. We then shuffled the tip labels 1,000 times, each time drawingthe observed number of species in each habitat, to generate null distributionsof PDs. We standardized the observed values of PD by subtracting the meanand dividing by the SD of the null distribution, generating a standardizedeffect size Z-score (SES PD). For both observed PD and the SES PD, we calcu-lated values for each of the 100 posterior trees and took the mean to use as aresponse variable in downstream analyses. To examine phylogenetic di-vergence among species within each habitat, we calculated MPD, whichmeasures divergence across the community tree and is mathematicallyequivalent to phylogenetic species variability (77), and MNTD, which measuresdivergence at shallow portions of the tree.
To examine changes in α-diversity with habitat conversion, we subtractedα-diversity values (species richness, PD, SES PD, MPD, and MNTD) in eachstudy’s converted habitat(s) from that study’s value in natural habitat. Wecompared alternative nested linear mixed-effect models (LMMs) to de-termine which best described the data. The first model included an in-dependent effect of each of the four converted habitat types, the secondhad only an intercept (estimating the overall effect of converted habitats,regardless of type), and a null model included an intercept term set to0 (postulating no difference in α-diversity between natural and convertedhabitats). All models included the study as a random intercept because somestudies contained comparisons with multiple converted habitats. We usedlikelihood ratio tests evaluated against a χ2 distribution to calculate significancelevels for each term.
To better understand the relationship between taxonomic and phyloge-netic α-diversity and environmental drivers, we regressed α-diversity againstmean annual temperature, the SD of monthly temperatures, mean annualprecipitation, elevation, and mean human footprint for each study location.Temperature and precipitation measures were extracted from the WorldClim
E3460 | www.pnas.org/cgi/doi/10.1073/pnas.1714891115 Nowakowski et al.
Dow
nloa
ded
by g
uest
on
Dec
embe
r 28
, 201
9
dataset (78) within 5-km buffers centered on each study area, representinglocal climates. The human footprint index—a composite of human populationdensity, land use, infrastructure, and accessibility—was extracted within 25-kmbuffers centered on each study area and represents the overall influence ofhuman activities within the study region (79). We examined all single-variablemodels with an error structure as above and used likelihood ratio tests todetermine variable significance.
Quantifying Effects of Habitat Conversion on Taxonomic and Phylogeneticβ-Diversity Within Study Regions. Based on species occurrence in naturaland converted habitats, we calculated pairwise taxonomic and phylogeneticβ-diversity metrics within each study region. We partitioned total dissimi-larity (Sorensen index) between habitats into turnover—the gain and loss ofunique species (or branches for phylogenetic β-diversity)—and nestedness—the contribution of richness (or PD) gradients to total dissimilarity—(80,81) using functions within the betapart package in R. For phylogeneticβ-diversity standardized by taxonomic β-diversity, we shuffled tip labels1,000 times on the study-specific phylogeny, while holding constant thespecies composition in each habitat type. We then calculated the stan-dardized effect size (SES) as both a Z score and as a rank of the observedvalue in the null distribution of phylogenetic β-diversities. We repeatedthe calculations on each of our 100 posterior trees and then took the meanvalue for downstream analysis.
We assessed whether interhabitat β-diversity was primarily made up ofturnover or nestedness by analyzing the proportion of total β-diversity thatwas made up of turnover, using a GLM with binomial error and a nonfixeddispersion parameter to facilitate testing proportional responses. We testedagainst the null hypothesis that the proportion of turnover was 0.5 (i.e.,neither turnover nor nestedness predominated as a driver of β-diversity)using likelihood ratio tests. Similarly, we evaluated whether phylogeneticβ-diversity was different from a neutral expectation based on taxonomicβ-diversity. We used the same GLM procedure described above but evalu-ated the rank at which the observed β-diversity value fell in the null distri-bution. A value of 0.5 indicates that PD perfectly matched the expectation,whereas values close to zero indicate that there was much less phylogenetic
turnover between habitats than expected (i.e., species that differed be-tween habitats were more closely related than expected). Because GLMMsimplemented within R currently do not permit the evaluation of over/underdispersion by using a “quasibinomial” distribution, we fit GLMs with indi-vidual studies as replicates, taking the mean value of within-study β-diversitybetween natural and converted habitats when multiple converted-habitattypes were evaluated. We also regressed β-diversity against the environ-mental variables described above to test the hypothesis that communitydissimilarity between natural and converted habitats is affected by regionalenvironmental context.
Global β-Diversity Within Natural and Human Modified Habitats. To understandwhether habitat conversion leads to taxonomic or phylogenetic homoge-nization across the globe, we quantified β-diversity among all study as-semblages, separately for natural and converted habitats. We first calculatedpairwise β-diversity across all sites, using taxonomic, phylogenetic, and SESphylogenetic β-diversity metrics. To quantify taxonomic and phylogeneticβ-diversity within each habitat, we then calculated each site’s distance fromits habitat’s multivariate median (82) using the betadisper function inpackage vegan. We compared these β-diversity values between habitatsusing a LMM with a random intercept of study (values were sufficiently farfrom 0 and 1 to not violate the Gaussian error assumption). Because pairwiseSES phylogenetic β-diversities do not represent dissimilarities, we insteadconverted pairwise dissimilarities to a single measure by taking each site’saverage dissimilarity to every other site within its habitat class and thenproceeded to analyze these values with a LMM as above.
ACKNOWLEDGMENTS. We thank M. Veiman and M. Donnelly for logisticalsupport. This work was supported by a University of Toronto Ecology andEvolutionary Biology Postdoctoral Fellowship (to L.O.F.). A.J.N. and M.E.T.were supported by Florida International University (FIU) Evidence Acquisi-tion Fellowships; M.E.T. was supported a Fulbright Student Research Award;and A.J.N. was supported by an FIU Dissertation Year Fellowship duringdata collection.
1. Foley JA, et al. (2005) Global consequences of land use. Science 309:570–574.2. Haddad NM, et al. (2015) Habitat fragmentation and its lasting impact on earth’s
ecosystems. Sci Adv 1:e1500052.3. Newbold T, et al. (2015) Global effects of land use on local terrestrial biodiversity.
Nature 520:45–50.4. Wiens JJ, et al. (2010) Niche conservatism as an emerging principle in ecology and
conservation biology. Ecol Lett 13:1310–1324.5. Purvis A, Agapow P-M, Gittleman JL, Mace GM (2000) Nonrandom extinction and the
loss of evolutionary history. Science 288:328–330.6. McKinney ML, Lockwood JL (1999) Biotic homogenization: A few winners replacing
many losers in the next mass extinction. Trends Ecol Evol 14:450–453.7. Lee TM, Jetz W (2011) Unravelling the structure of species extinction risk for pre-
dictive conservation science. Proc Biol Sci 278:1329–1338.8. Davidson AD, et al. (2012) Drivers and hotspots of extinction risk in marine mammals.
Proc Natl Acad Sci USA 109:3395–3400.9. Keinath DA, et al. (2017) A global analysis of traits predicting species sensitivity to
habitat fragmentation. Glob Ecol Biogeogr 26:115–127.10. Nowakowski AJ, Thompson ME, Donnelly MA, Todd BD (2017) Amphibian sensitivity
to habitat modification is associated with population trends and species traits. GlobEcol Biogeogr 26:700–712.
11. Todd BD, Nowakowski AJ, Rose JP, Price SJ (2017) Species traits explaining sensitivityof snakes to human land use estimated from citizen science data. Biol Conserv 206:31–36.
12. Karp DS, Ziv G, Zook J, Ehrlich PR, Daily GC (2011) Resilience and stability in bird guildsacross tropical countryside. Proc Natl Acad Sci USA 108:21134–21139.
13. Newbold T, et al. (2013) Ecological traits affect the response of tropical forest birdspecies to land-use intensity. Proc Biol Sci 280:20122131.
14. Nowakowski AJ, et al. (2017) Tropical amphibians in shifting thermal landscapesunder land-use and climate change. Conserv Biol 31:96–105.
15. Frishkoff LO, Hadly EA, Daily GC (2015) Thermal niche predicts tolerance to habitatconversion in tropical amphibians and reptiles. Glob Change Biol 21:3901–3916.
16. Trimble MJ, van Aarde RJ (2014) Amphibian and reptile communities and functionalgroups over a land-use gradient in a coastal tropical forest landscape of high richnessand endemicity. Anim Conserv 17:441–453.
17. Frank HK, Frishkoff LO, Mendenhall CD, Daily GC, Hadly EA (2017) Phylogeny, traits,and biodiversity of a neotropical bat assemblage: Close relatives show similar re-sponses to local deforestation. Am Nat 190:200–212.
18. Mayfield MM, et al. (2010) What does species richness tell us about functional traitdiversity? Predictions and evidence for responses of species and functional trait di-versity to land‐use change. Glob Ecol Biogeogr 19:423–431.
19. ThompsonME, Nowakowski AJ, Donnelly MA (2016) The importance of defining focalassemblages when evaluating amphibian and reptile responses to land use. ConservBiol 30:249–258.
20. Kurz DJ, Nowakowski AJ, Tingley MW, Donnelly MA, Wilcove DS (2014) Forest-landuse complementarity modifies community structure of a tropical herpetofauna. BiolConserv 170:246–255.
21. Frishkoff LO, et al. (2014) Loss of avian phylogenetic diversity in neotropical agri-cultural systems. Science 345:1343–1346.
22. Vellend M, Cornwell WK, Magnuson-Ford K, Mooers AØ (2011) Measuring phyloge-netic biodiversity. Biological Diversity: Frontiers in Measurement and Assessment(Oxford Univ Press, Oxford), pp 194–207.
23. Edwards DP, Gilroy JJ, Thomas GH, Uribe CAM, Haugaasen T (2015) Land-sparingagriculture best protects avian phylogenetic diversity. Curr Biol 25:2384–2391.
24. Supp SR, Ernest SK (2014) Species-level and community-level responses to disturbance:A cross-community analysis. Ecology 95:1717–1723.
25. Clavel J, Julliard R, Devictor V (2011) Worldwide decline of specialist species: Toward aglobal functional homogenization? Front Ecol Environ 9:222–228.
26. Godet L, Gaüzere P, Jiguet F, Devictor V (2015) Dissociating several forms of com-monness in birds sheds new light on biotic homogenization. Glob Ecol Biogeogr 24:416–426.
27. Graham CH, Fine PV (2008) Phylogenetic beta diversity: Linking ecological and evo-lutionary processes across space in time. Ecol Lett 11:1265–1277.
28. Helmus MR, Savage K, Diebel MW, Maxted JT, Ives AR (2007) Separating the deter-minants of phylogenetic community structure. Ecol Lett 10:917–925.
29. Sol D, Bartomeus I, González-Lagos C, Pavoine S (2017) Urbanisation and the loss ofphylogenetic diversity in birds. Ecol Lett 20:721–729.
30. Mantyka-Pringle CS, Martin TG, Rhodes JR (2012) Interactions between climate andhabitat loss effects on biodiversity: A systematic review and meta-analysis. GlobChange Biol 18:1239–1252.
31. Nowakowski AJ, Jimenez BO, Allen M, Diaz-Escobar M, Donnelly MA (2013) Land-scape resistance to movement of the poison frog, Oophaga pumilio, in the lowlandsof northeastern Costa Rica. Anim Conserv 16:188–197.
32. Nowakowski AJ, Veiman-Echeverria M, Kurz DJ, Donnelly MA (2015) Evaluatingconnectivity for tropical amphibians using empirically derived resistance surfaces. EcolAppl 25:928–942.
33. Arroyo-Rodríguez V, Saldaña-Vázquez RA, Fahrig L, Santos BA (2016) Does forestfragmentation cause an increase in forest temperature? Ecol Res 32:81–88.
34. Huey RB, et al. (2009) Why tropical forest lizards are vulnerable to climate warming.Proc Biol Sci 276:1939–1948.
35. Janzen DH (1967) Why mountain passes are higher in the tropics. Am Nat 101:233–249.
36. Pyron RA, Wiens JJ (2013) Large-scale phylogenetic analyses reveal the causes of hightropical amphibian diversity. Proc Biol Sci 280:20131622.
37. Bonetti MF, Wiens JJ (2014) Evolution of climatic niche specialization: A phylogeneticanalysis in amphibians. Proc Biol Sci 281:20133229.
38. Dirzo R, et al. (2014) Defaunation in the Anthropocene. Science 345:401–406.
Nowakowski et al. PNAS | vol. 115 | no. 15 | E3461
ECOLO
GY
SEECO
MMEN
TARY
Dow
nloa
ded
by g
uest
on
Dec
embe
r 28
, 201
9
39. Murray KA, Verde Arregoitia LD, Davidson A, Di Marco M, Di FonzoMM (2014) Threat
to the point: Improving the value of comparative extinction risk analysis for conser-vation action. Glob Change Biol 20:483–494.
40. Stuart SN, et al. (2008) Threatened Amphibians of the World (Lynx Edicions, Barce-
lona).41. Almeida-Gomes M, Rocha CFD (2015) Habitat loss reduces the diversity of frog re-
productive modes in an Atlantic forest fragmented landscape. Biotropica 47:113–118.42. Frost DR (2017) Amphibian Species of the World: An Online Reference (American
Museum of Natural History, New York).43. IUCN (2016) The IUCN Red List of Threatened Species (International Union for Con-
servation of Nature and Natural Resources, Cambridge, UK), Version 2016-3.44. Gomez-Mestre I, Pyron RA, Wiens JJ (2012) Phylogenetic analyses reveal unexpected
patterns in the evolution of reproductive modes in frogs. Evolution 66:3687–3700.45. Crump ML (2015) Anuran reproductive modes: Evolving perspectives. J Herpetol 49:
1–16.46. Quesnelle PE, Lindsay KE, Fahrig L (2014) Low reproductive rate predicts species
sensitivity to habitat loss: A meta-analysis of wetland vertebrates. PLoS One 9:e90926.47. Scheffers BR, et al. (2013) Thermal buffering of microhabitats is a critical factor me-
diating warming vulnerability of frogs in the Philippine biodiversity hotspot.
Biotropica 45:628–635.48. Catenazzi A, Lehr E, Vredenburg VT (2014) Thermal physiology, disease, and am-
phibian declines on the eastern slopes of the Andes. Conserv Biol 28:509–517.49. Tracy CR, Christian KA, Tracy CR (2010) Not just small, wet, and cold: Effects of body
size and skin resistance on thermoregulation and arboreality of frogs. Ecology 91:
1477–1484.50. Nowakowski AJ, et al. (2018) Thermal biology mediates responses of amphibians and
reptiles to habitat modification. Ecol Lett 21:345–355.51. Mayfield MM, Levine JM (2010) Opposing effects of competitive exclusion on the
phylogenetic structure of communities. Ecol Lett 13:1085–1093.52. Schneider-Maunoury L, et al. (2016) Abundance signals of amphibians and reptiles
indicate strong edge effects in neotropical fragmented forest landscapes. Biol
Conserv 200:207–215.53. Frishkoff LO, et al. (2016) Climate change and habitat conversion favour the same
species. Ecol Lett 19:1081–1090.54. Buckley LB, Jetz W (2008) Linking global turnover of species and environments. Proc
Natl Acad Sci USA 105:17836–17841.55. Zuloaga J, Kerr JT (2017) Over the top: Do thermal barriers along elevation gradients
limit biotic similarity? Ecography 40:478–486.56. Larsen TH (2012) Upslope range shifts of Andean dung beetles in response to de-
forestation: Compounding and confounding effects of microclimatic change.Biotropica 44:82–89.
57. Grau HR, Aide M (2008) Globalization and land-use transitions in Latin America. Ecol
Soc 13:16.58. Heard SB, Mooers AØ (2000) Phylogenetically patterned speciation rates and ex-
tinction risks change the loss of evolutionary history during extinctions. Proc Biol Sci267:613–620.
59. Nori J, et al. (2015) Amphibian conservation, land-use changes and protected areas: A
global overview. Biol Conserv 191:367–374.60. Nowakowski AJ, Angulo A (2015) Targeted habitat protection and its effects on the
extinction risk of threatened amphibians. FrogLog 116:8–10.
61. Porter-Bolland L, et al. (2012) Community managed forests and forest protectedareas: An assessment of their conservation effectiveness across the tropics. For EcolManage 268:6–17.
62. Morse W, et al. (2009) Consequences of environmental service payments for forestretention and recruitment in a Costa Rican biological corridor. Ecol Soc 14:23.
63. Mendenhall CD, et al. (2014) Countryside biogeography of neotropical reptiles andamphibians. Ecology 95:856–870.
64. Robinson D, Warmsley A, Nowakowski AJ, Reider KE, Donnelly MA (2013) The valueof remnant trees in pastures for a neotropical poison frog. J Trop Ecol 29:345–352.
65. Mendenhall CD, Shields-Estrada A, Krishnaswami AJ, Daily GC (2016) Quantifying andsustaining biodiversity in tropical agricultural landscapes. Proc Natl Acad Sci USA 113:14544–14551.
66. Fischer J, et al. (2014) Land sparing versus land sharing: Moving forward. Conserv Lett7:149–157.
67. Catenazzi A (2015) State of the world’s amphibians. Annu Rev Environ Resour 40:91–119.
68. Pyron RA (2014) Biogeographic analysis reveals ancient continental vicariance andrecent oceanic dispersal in amphibians. Syst Biol 63:779–797.
69. Thomas GH, et al. (2013) PASTIS: An R package to facilitate phylogenetic assemblywith soft taxonomic inferences. Methods Ecol Evol 4:1011–1017.
70. Rabosky DL (2015) No substitute for real data: A cautionary note on the use ofphylogenies from birth-death polytomy resolvers for downstream comparativeanalyses. Evolution 69:3207–3216.
71. Frishkoff LO, de Valpine P, M’Gonigle LK (2017) Phylogenetic occupancy models in-tegrate imperfect detection and phylogenetic signal to analyze community structure.Ecology 98:198–210.
72. Ives AR, Helmus MR (2011) Generalized linear mixed models for phylogenetic analysesof community structure. Ecol Monogr 81:511–525.
73. de Villemereuil P, Wells JA, Edwards RD, Blomberg SP (2012) Bayesian models forcomparative analysis integrating phylogenetic uncertainty. BMC Evol Biol 12:102.
74. Hadfield JD, Nakagawa S (2010) General quantitative genetic methods for compar-ative biology: Phylogenies, taxonomies and multi-trait models for continuous andcategorical characters. J Evol Biol 23:494–508.
75. Faith DP (1992) Conservation evaluation and phylogenetic diversity. Biol Conserv 61:1–10.
76. Chao A, et al. (2015) Rarefaction and extrapolation of phylogenetic diversity.Methods Ecol Evol 6:380–388.
77. Tucker CM, et al. (2017) A guide to phylogenetic metrics for conservation, communityecology and macroecology. Biol Rev Camb Philos Soc 92:698–715.
78. Hijmans RJ, Cameron SE, Parra JL, Jones PG, Jarvis A (2005) Very high resolution in-terpolated climate surfaces for global land areas. Int J Climatol 25:1965–1978.
79. Sanderson EW, et al. (2002) The human footprint and the last of the wild: The humanfootprint is a global map of human influence on the land surface, which suggests thathuman beings are stewards of nature, whether we like it or not. Bioscience 52:891–904.
80. Baselga A (2010) Partitioning the turnover and nestedness components of beta di-versity. Glob Ecol Biogeogr 19:134–143.
81. Leprieur F, et al. (2012) Quantifying phylogenetic beta diversity: Distinguishing be-tween ‘true’ turnover of lineages and phylogenetic diversity gradients. PLoS One 7:e42760.
82. Anderson MJ, Ellingsen KE, McArdle BH (2006) Multivariate dispersion as a measureof beta diversity. Ecol Lett 9:683–693.
E3462 | www.pnas.org/cgi/doi/10.1073/pnas.1714891115 Nowakowski et al.
Dow
nloa
ded
by g
uest
on
Dec
embe
r 28
, 201
9