phylogenetic relationships of b-related phytochromes in the brassicaceae: redundancy and the...
TRANSCRIPT

Molecular Phylogenetics and Evolution 49 (2008) 411–423
Contents lists available at ScienceDirect
Molecular Phylogenetics and Evolution
journal homepage: www.elsevier .com/locate /ympev
Phylogenetic relationships of B-related phytochromes in the Brassicaceae:Redundancy and the persistence of phytochrome D
Sarah Mathews a,*, Kim McBreen b
a Arnold Arboretum of Harvard University, 22 Divinity Avenue, Cambridge, MA 02138, USAb Allan Wilson Centre, Massey University, Palmerston North, New Zealand
a r t i c l e i n f o
Article history:Received 13 June 2007Revised 18 July 2008Accepted 26 July 2008Available online 19 August 2008
Keywords:Phytochrome BPhytochrome DGene duplicationRedundancyEvolutionArabidopsisBrassicaceaePhylogeny
1055-7903/$ - see front matter � 2008 Elsevier Inc. Adoi:10.1016/j.ympev.2008.07.026
* Corresponding author. Fax: +1 617 495 9484.E-mail address: [email protected] (S. Ma
a b s t r a c t
Plants use phytochrome (phy) photoreceptors to detect and respond to changes in the quantities and pro-portions of red (R) and far-red (FR) light in their environments. The principal mediators of responses to Rand FR in Arabidopsis thaliana are phyA and phyB, which are found in all angiosperms surveyed. The pres-ent study is concerned with a phytochrome gene pair in Arabidopsis, PHYB and PHYD, which are of rela-tively recent origin, share high sequence identity, and are partially redundant. Our data suggest that theduplication occurred after the mustard family (Brassicaceae) diverged from its closest relatives but beforethe radiation of extant Brassicaceae, and that both copies have persisted for up to 40 myr. We detected noevidence of positive selection in the divergence of PHYD from PHYB; the evolution of both sequences isconstrained by purifying selection. Levels of diversity at both loci are among the lowest observed atnuclear genes in A. thaliana. In common with other loci in A. thaliana, PHYB and PHYD showed elevatedlevels of intraspecific replacement variation, and each showed an excess of rare nucleotide polymor-phisms, consistent with a recent, rapid population expansion. Our results are consistent with the func-tional importance of amino acid divergence in the central regions of phyB and phyD and suggestspecific sites for mutagenesis that may yield insights into the functional differences of phyB and phyD.
� 2008 Elsevier Inc. All rights reserved.
1. Introduction
Photomorphogenesis, the control of plant form by ambient lightconditions, is mediated by phytochrome photoreceptors, which ab-sorb red light (R) and far-red light (FR), and by distinct blue- andultraviolet-absorbing receptors (e.g., Franklin et al., 2005; Spaldingand Folta, 2005). Green plant phytochromes are a small family ofwell-studied photoreceptors present in all land plants and greenalgae that have an overall secondary structure that is highly con-served (Fankhauser, 2001; Montgomery and Lagarias, 2002;Mathews, 2006). The N-terminal photosensory core comprises aPAS domain, a GAF domain that harbors the conserved cysteine towhich a linear tetrapyrrole chromophore covalently binds, and aGAF-related PHY domain unique to phytochromes. A 2.5-Å crystalstructure of the PAS and GAF folds of the bacteriophytochrome ofDeinococcus radiodurans reveals that they interact as a trefoil knot(Wagner et al., 2005), a structural feature that is likely to be foundwidely in phytochromes (Wagner et al., 2005; Rockwell et al.,2006). The C-terminal regulatory region comprises a PAS-relateddomain (PRD) of two PAS repeats and a histidine kinase related do-main (HKRD). Deletion mutants lacking the C-terminal region pro-vide evidence of its importance in modulation of phytochrome
ll rights reserved.
thews).
signaling (e.g., Matsushita et al., 2003; Oka et al., 2004) and pointmutations in the HKRD support its importance in phyB1 signaling(Krall and Reed, 2000). Phytochrome activity requires dimerizationof two holoprotein monomers, and both homodimers and heterodi-mers have been detected in planta (Sharrock and Clack, 2004).
Functional phytochromes exist in two photointerconvertibleforms, a red absorbing form (Pr) with an absorption maximum of�660 nm, and far-red absorbing (Pfr) with an absorption maxi-mum of �730 nm (Furuya and Song, 1994). This feature allowsplants to detect the quantity of R and FR in ambient radiationand monitor changes in the R:FR ratio and in total irradiance(Smith, 1982), effecting responses important during all stages ofplant development via multiple signaling networks (e.g., Mølleret al., 2002; Nagy and Schäfer, 2002; Quail, 2002a,b; Franklin andWhitelam, 2004). Light is a critical resource for plants and geneticmechanisms capable of detecting light signals and mediating re-sponses are likely to be highly adaptive and under strong selectivepressure (Aphalo et al., 1999; Schmitt et al., 1999; Botto and Smith,2002; Mathews et al., 2003).
In Arabidopsis thaliana there are five phytochromes, phyA–E(Sharrock and Quail, 1989; Clack et al., 1994), which result from se-rial duplication and functional divergence (Mathews and Sharrock,
1 Abbreviations: PHY, gene sequence; PHY, apoprotein sequence; phy, holoprotein(chromophore attached); phy, null mutant.

412 S. Mathews, K. McBreen / Molecular Phylogenetics and Evolution 49 (2008) 411–423
1997; Mathews, 2006). A duplication near the origin of seed plantsresulted in two distinct lines that persist in all seed plants. Subse-quent duplications occurred in each of these lines, resulting in thefour major forms that are widely distributed in flowering plants,phyA, B, C, and E. A duplication before the origin of angiospermsled to phyA and phyC (Sharrock and Quail, 1989; Mathews et al.,1995), while a duplication very early in the history of angiospermsled to phyB and phyE (Mathews and Sharrock, 1997; S. Mathewsunpublished data). A more recent duplication of phyB gave riseto phyD (Clack et al., 1994; Mathews et al., 1995).
PhyA and phyB are the principal mediators of responses to FRand R, respectively, and each functions throughout the life cycleof A. thaliana. By virtue of their different responses to light qualityand their differential stability in light, phyA and phyB functionboth antagonistically and complementarily to regulate responsesthroughout the life of the plant. PhyA is the predominant form inetiolated tissue, and mediates responses to continuous Fr (Frc)(Nagatani et al., 1993; Parks and Quail, 1993; Whitelam et al.,1993; van Tuinen et al., 1995; Shinomura et al., 2000; Takanoet al., 2001). PhyA functions in seed germination, is required forde-etiolation in response to FRc but not continuous R (Rc), playsa minor role in leaf expansion in light-grown plants under Rc, playsa role in timing of flowering and, due to its ability to mediate re-sponses to millisecond exposure to R and FR, can detect light con-ditions that the other phytochromes cannot distinguish fromdarkness, such as deep canopy shade, and very brief exposure tosunlight (reviewed in Casal et al., 1997; Franklin and Whitelam,2004). PhyB is the predominant form in light-grown tissue, is sta-ble in light, and mediates responses to Rc and pulsed R (Reed et al.,1993; Robson et al., 1993; Halliday et al., 1994; Elich and Chory,1997; Devlin et al., 2003). It functions in R-induced seed germina-tion, de-etiolation, and flowering. Furthermore, phyB is the pri-mary mediator of shade avoidance, a plastic response of shade-intolerant plants to neighbors (detected by changes in R:FR), typi-cally involving stem elongation, suppression of branching, andearly flowering (Smith, 1982, 2000; Smith and Whitelam, 1997;Aphalo et al., 1999; Schmitt et al., 1999; Botto and Smith, 2002).This enables the plant to anticipate and respond appropriately tocompetition for light (Ballaré et al., 1990). Casal and Smith(1989) provide an excellent review of evidence for the adaptivesignificance of shade avoidance. More recently, these and otherauthors (Schmitt et al., 1995; Ballaré et al., 1997; Schmitt, 1997;Smith and Whitelam, 1997) have speculated that the ability ofangiosperms to avoid shade has contributed to their spectacularsuccess. Each of the remaining phytochromes has a role in photo-morphogenesis that is most apparent in mutants with lesions inmultiple phytochromes (Aukerman et al., 1997; Devlin et al.,1998; Hennig et al., 2002; Franklin et al., 2003a,b; Monte et al.,2003; Sharrock et al., 2003a,b), and unlike PHYA and PHYB, eachof these remaining loci are missing from some angiosperms(Mathews et al., 1995; Mathews and Sharrock, 1996, 1997; Howeet al., 1998; Lavin et al., 1998; Li and Chinnappa, 2003).
The focus of our study is on PHYB and PHYD, which apparentlyresult from a relatively recent split in the PHYB gene lineage, pos-sibly in the mustard family (Brassicaceae). PHYB and PHYD of A.thaliana share high sequence identity (�80% at the amino acid le-vel) and are partially redundant (Reed et al., 1993; Aukermanet al., 1997; Devlin et al., 1999; Franklin et al., 2003b; Sharrocket al., 2003a,b). Recent but independent duplications in the PHYBline also have been detected in the tomato (Mathews et al.,1995; Pratt et al., 1995), carrot (Mathews et al., 1995), and willow(Howe et al., 1998) families. Gene duplication of single or low copyloci may lead to the evolution of novel function (Ohno, 1970), tothe subdivision of ancestral functions among copies (Hughes,1994; Henikoff et al., 1997; Force et al., 1999; Lynch and Force,2000), to the partial loss of function from one of the copies, or to
the silencing of one copy. While models have predicted thatmost duplicates should be silenced (e.g., Walsh, 1995; Nadeauand Sankoff, 1997), more have been retained than is expected fromthese models (Wagner, 1998; Force et al., 1999; Lynch and Conery,2000; Lynch et al., 2001). In each of these cases, different selectiveforces are expected to predominate (Haldane, 1933; Fisher, 1935;Clark, 1994; Force et al., 1999; Lynch and Force, 2000; Mooreand Purugganan, 2003). Although at least one naturally occurringPHYD of A. thaliana is a pseudogene, ecotypes commonly used inthe lab retain a phyD (Aukerman et al., 1997) that may functiondistinctly from phyB (Halliday and Whitelam, 2003; Sharrocket al., 2003a,b).
To determine the phylogenetic position of the duplication andto test for changes in selective pressure within and between copies,we obtained two sets of sequence data. We obtained a set of partialsequences in a PCR survey conducted to determine the phyloge-netic distribution of PHYB and PHYD in the Brassicaceae, and fromtwo closely related families, Cleomaceae and Capparaceae (sensuHall et al., 2002). We also obtained a set of nearly complete PHYBand PHYD coding and intron sequences by sampling multipleaccessions of A. thaliana and single accessions of A. halleri and A.lyrata. Here, we report results from (1) phylogenetic analyses ofpartial sequences to determine the phylogenetic position of theduplication and to infer amino acid changes on the tree; (2) tree-based analyses of partial sequences to test whether selective con-straints on lineages and amino acids have been altered since thegene duplication; and (3) analyses of full-length Arabidopsis se-quences to estimate levels of diversity, divergence, and to test forrecent changes in selective pressure. We found that the duplicationleading to PHYB and PHYD occurred near the origin of the Brassic-aceae. Since phyB is the principal mediator of shade avoidance andof development mediated by red light (absorption maximum of�660 nm) signals, we expected PHYB sequence evolution to beconstrained. In contrast, since phyD may play a lesser role in shadeavoidance and photomorphogenesis, we expected PHYD sequenceevolution might be less constrained. We found this generally tobe true. While there is evidence that purifying selection is actingon both genes, constraints are relaxed in PHYD relative to PHYB.Inference of amino acid changes on the phylogenetic tree identifiesa small number of residues that may have a role in determining thedistinct functions of the two copies.
2. Materials and methods
2.1. DNA isolation and sequencing
We sampled 23 species from Brassicaceae and four species fromthe closely related families Cleomaceae and Capparaceae (Hallet al., 2002; Table 1). The genus Arabidopsis is here representedby three species, and A. thaliana by 17 ecotypes that were targetedto represent diversity within the species (Breyne et al., 1999;Vander Zwan et al., 2000). Seeds of A. thaliana were provided bythe Arabidopsis Biological Resource Center (ABRC) or purchasedfrom Lehle Seeds (Round Rock, TX). A. halleri seeds were kindlyprovided by T. Mitchell-Olds. Seeds were surface sterilized andplanted in Petri dishes on half strength Murashige and Skoog med-ium (Murashige and Skoog, 1962) with 1% agar (w/v). After a coldtreatment of 5–7 days, seeds were exposed to red-light for 30–60 min to induce uniform germination. Seedlings were grown for7–10 days under white light from above before harvesting for iso-lation of DNA. Tissue from multiple Arabidopsis seedlings and fromindividuals of the Brassicaceae species was harvested and isolatedusing the plant Dneasy mini kit (QIAGEN, Chatsworth, CA). DNAs ofmany taxa were kindly provided by M. Beilstein, J. Hall, or P. Hee-nan (Table 1).
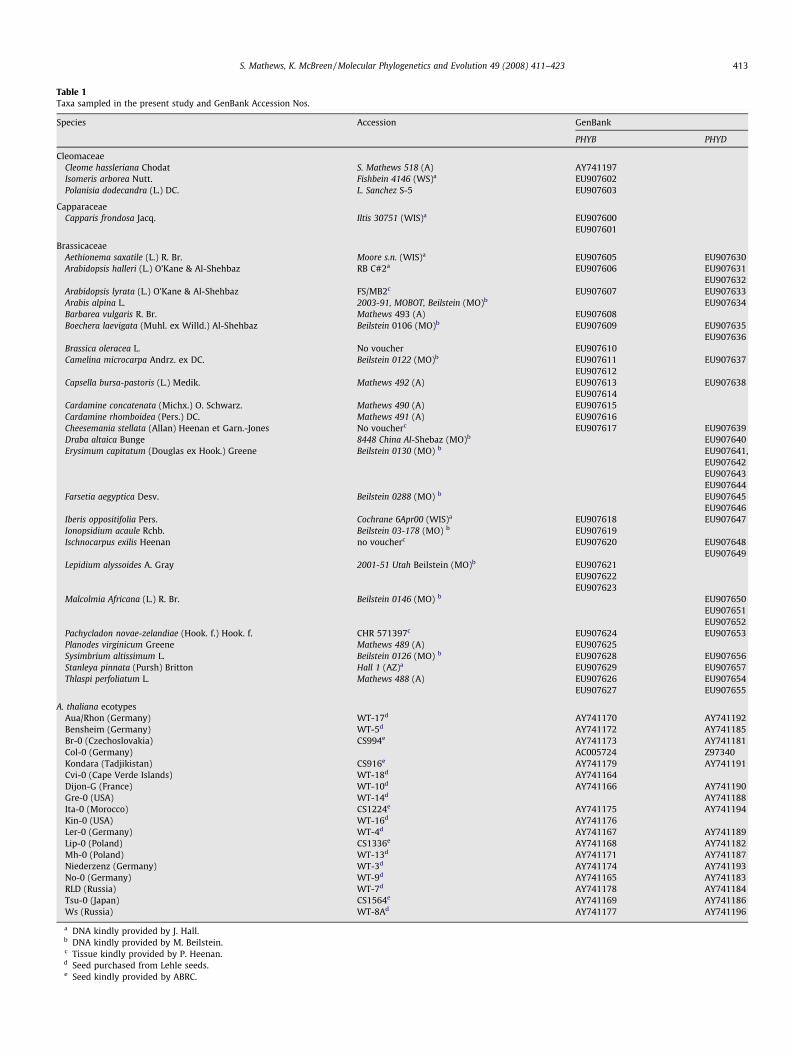
Table 1Taxa sampled in the present study and GenBank Accession Nos.
Species Accession GenBank
PHYB PHYD
CleomaceaeCleome hassleriana Chodat S. Mathews 518 (A) AY741197Isomeris arborea Nutt. Fishbein 4146 (WS)a EU907602Polanisia dodecandra (L.) DC. L. Sanchez S-5 EU907603
CapparaceaeCapparis frondosa Jacq. Iltis 30751 (WIS)a EU907600
EU907601
BrassicaceaeAethionema saxatile (L.) R. Br. Moore s.n. (WIS)a EU907605 EU907630Arabidopsis halleri (L.) O’Kane & Al-Shehbaz RB C#2a EU907606 EU907631
EU907632Arabidopsis lyrata (L.) O’Kane & Al-Shehbaz FS/MB2c EU907607 EU907633Arabis alpina L. 2003-91, MOBOT, Beilstein (MO)b EU907634Barbarea vulgaris R. Br. Mathews 493 (A) EU907608Boechera laevigata (Muhl. ex Willd.) Al-Shehbaz Beilstein 0106 (MO)b EU907609 EU907635
EU907636Brassica oleracea L. No voucher EU907610Camelina microcarpa Andrz. ex DC. Beilstein 0122 (MO)b EU907611 EU907637
EU907612Capsella bursa-pastoris (L.) Medik. Mathews 492 (A) EU907613 EU907638
EU907614Cardamine concatenata (Michx.) O. Schwarz. Mathews 490 (A) EU907615Cardamine rhomboidea (Pers.) DC. Mathews 491 (A) EU907616Cheesemania stellata (Allan) Heenan et Garn.-Jones No voucherc EU907617 EU907639Draba altaica Bunge 8448 China Al-Shebaz (MO)b EU907640Erysimum capitatum (Douglas ex Hook.) Greene Beilstein 0130 (MO) b EU907641,
EU907642EU907643EU907644
Farsetia aegyptica Desv. Beilstein 0288 (MO) b EU907645EU907646
Iberis oppositifolia Pers. Cochrane 6Apr00 (WIS)a EU907618 EU907647Ionopsidium acaule Rchb. Beilstein 03-178 (MO) b EU907619Ischnocarpus exilis Heenan no voucherc EU907620 EU907648
EU907649Lepidium alyssoides A. Gray 2001-51 Utah Beilstein (MO)b EU907621
EU907622EU907623
Malcolmia Africana (L.) R. Br. Beilstein 0146 (MO) b EU907650EU907651EU907652
Pachycladon novae-zelandiae (Hook. f.) Hook. f. CHR 571397c EU907624 EU907653Planodes virginicum Greene Mathews 489 (A) EU907625Sysimbrium altissimum L. Beilstein 0126 (MO) b EU907628 EU907656Stanleya pinnata (Pursh) Britton Hall 1 (AZ)a EU907629 EU907657Thlaspi perfoliatum L. Mathews 488 (A) EU907626 EU907654
EU907627 EU907655
A. thaliana ecotypesAua/Rhon (Germany) WT-17d AY741170 AY741192Bensheim (Germany) WT-5d AY741172 AY741185Br-0 (Czechoslovakia) CS994e AY741173 AY741181Col-0 (Germany) AC005724 Z97340Kondara (Tadjikistan) CS916e AY741179 AY741191Cvi-0 (Cape Verde Islands) WT-18d AY741164Dijon-G (France) WT-10d AY741166 AY741190Gre-0 (USA) WT-14d AY741188Ita-0 (Morocco) CS1224e AY741175 AY741194Kin-0 (USA) WT-16d AY741176Ler-0 (Germany) WT-4d AY741167 AY741189Lip-0 (Poland) CS1336e AY741168 AY741182Mh-0 (Poland) WT-13d AY741171 AY741187Niederzenz (Germany) WT-3d AY741174 AY741193No-0 (Germany) WT-9d AY741165 AY741183RLD (Russia) WT-7d AY741178 AY741184Tsu-0 (Japan) CS1564e AY741169 AY741186Ws (Russia) WT-8Ad AY741177 AY741196
a DNA kindly provided by J. Hall.b DNA kindly provided by M. Beilstein.c Tissue kindly provided by P. Heenan.d Seed purchased from Lehle seeds.e Seed kindly provided by ABRC.
S. Mathews, K. McBreen / Molecular Phylogenetics and Evolution 49 (2008) 411–423 413

414 S. Mathews, K. McBreen / Molecular Phylogenetics and Evolution 49 (2008) 411–423
For all taxa except Arabidopsis species, partial phytochrome se-quences (corresponding to codons 240–886 according to the num-bering in Mathews et al., 1995) were amplified with Taq DNApolymerase (QIAGEN) according to the manufacturers protocolsusing degenerate primers (Table 2). The amplified region spans in-tron I and the target fragments range in size from 2.0 to 2.5 kb.Fragments of the expected size were excised from 1.2% agarosegels, extracted using the QIAquick gel extraction kit (QIAGEN),transformed into pGemT-easy (Promega) for cloning. Plasmidswere isolated using the QIAprep (QIAGEN) spin miniprep kit andsequenced in both directions using nested primers at approxi-mately 600-bp intervals. Multiple clones from each PCR productwere screened. Since the primers designed to be PHYB- andPHYD-specific often amplified both genes, we screened multipleclones to obtain both copies. However, even when primers appar-ently amplified just one of the paralogs, we screened multiple (6–12) clones in order to sample the variation at a locus. Polymorphicclones from a single locus were included in phylogenetic analyses.From Cleome hassleriana, in addition to the shorter fragment de-scribed above, a longer PHYB was obtained using b72f andb1169r (Table 2). This sequence is nearly complete, spanning allfour exons and three introns, and missing approximately 250 basesof end sequence. Phytochromes B and D were amplified from eachA. thaliana ecotype, phytochrome B from A. lyrata and phytochromeD from A. halleri with a mixture of QIAGEN Taq DNA polymeraseand Takara Ex TaqTM Polymerase using b1f with b30UTR or b1211rand using d1f with d30UTR or d1190r (Table 2). Arabidopsis prod-ucts were sequenced directly using cycle sequencing with BigDyeterminators (Applied Biosystems) from both directions with a ser-ies of nested sense and antisense primers at approximately 600-bpspacing on each strand.
DNA sequencing was performed with a Prism 3700 96-capillaryautomated sequencer (Applied Biosystems). Sequencher (GeneCodes Corporation) was used to confirm or correct base calls bySequencing Analysis (Applied Biosystems) and create contigs.
2.2. Assembly of data sets
Partial sequences from genera in Brassicaceae were alignedusing MacClade version 4.0 (Maddison and Maddison, 2000); long-er sequences from Arabidopsis species and C. hassleriana were trun-cated to include codons 240–886 (according to the numbering inMathews et al., 1995). Portions of the sequences that could notbe aligned (intron I and a variable region from approximately ami-no acids 646–660) were excluded from all analyses. Full-length se-quences from A. thaliana ecotypes were aligned using MacClade
Table 2Amplification primers
Primera Sequence
b50UTRf 50-AAATCAAACGGAATGGTTTC-30
b1f 50-ATGGTNWRNGGNGTNGGNGG-30
d1f 50-AAAATGGTCTCCGGAGGTG-30
b72f 50-GCNGTNTTYGARMARTCNGG-30
212f 50-TCWGGNAARCCNTTYTAYGC-30
b232f 50-GAGCCDGCDMGDACDGARGAYCC-30
b232f(deg) 50-GAGCCRGCTMGRASYGARGAYCC-30
d232f 50-CCDGCDMGDACNGARGAYCCG-30
b678r 50-GTYTCDATSARYCKAACCATYTC-30
b887r 50-TCYTGBCCWCCDATHGCRTTRTG-30
b1169r 50-TCYCTDATRTAYTGNACNTCNCC-30
d1190r 50-CATCATCATCATTAGAGGAACC-30
b1211r 50-CTAATATGGCATCATCAGCATC-30
d30UTR 50-CATTCAATGCCACTCATGAAGAGG-30
a Except for UTR primers, primer sequences are numbered according to theirposition in the alignment of Mathews et al. (1995); b and d primers are specific toPHYB and/or to PHYD; 212f is a universal primer that amplifies multiple PHY.
version 4.0 (Maddison and Maddison, 2000). The PHYB and PHYDcoding sequences could be unambiguously aligned throughouttheir length except for the extreme amino terminus; however, in-trons could not confidently be aligned between PHYB and PHYDand they were excluded from analyses that included both copies.
2.3. Analyses of partial sequences from Brassicaceae
Maximum likelihood (ML) analyses of the alignment of partialsequences were conducted using Garli (Zwickl, 2006;www.bio.utexas.edu/faculty/antisense/garli/Garli.html) startingfrom a random tree. Parameters were estimated from the data un-der the general time reversible model of nucleotide substitutionwith gamma rate variation and a proportion of invariant sites,which was the best fitting model as selected by Modeltest3.5(Posada and Crandall, 1998) under Akaike information criteria.Amino acid changes were visualized on the inferred phylogenetictree using MacClade 4.0 (Maddison and Maddison, 2000) and anuntrimmed (with respect to length) data set of all sequences. Max-imum parsimony (MP) analyses were performed using Paup*
4.0b10 (Swofford, 2002). The heuristic search used one hundredrandom addition order replicates with Multrees (save multipletrees) and TBR (tree bisection and reconnection) branch swapping.All characters were equally weighted and treated as unordered.Strength of support for individual branches was estimated usingbootstrap analysis of 100 ML replicates or 1000 MP replicates usingthe same search parameters used in the heuristic searches.
We used Yang’s (1998) branch test, implemented in PAML(Yang, 1997), to determine if there was evidence of variable selec-tive pressure among branches in the Brassicaceae PHYB and PHYDtree. The test is based on the assumption that the ratio of nonsyn-onymous to synonymous changes (x) measures selective pressureon amino acids, and that x < 1 if evolution is constrained, thatx = 1 if evolution is neutral, and that x > 1 if positive selection isoccurring (but see Wyckoff et al., 2005). The test compares the like-lihoods of trees when x is assumed to have the same or differentvalues across the gene phylogeny. In our analyses, we comparedthe likelihoods of trees estimated under the one- and two-ratiomodels and under two- and three-ratio models (Tables 3 and 4).Sequences of Aethionema and Cardamine were omitted from thesetests because they were considerably shorter than the other se-quences in the data set, and A. thaliana was represented only bythe Columbia ecotype.
Although the branch test allows x to vary among branches, x isaveraged across all sites. It is likely that a majority of sites in thesegenes will be under purifying selection, so we have also conductedthe branch-site test (Yang and Nielsen, 2002), which estimates xfor different classes of sites and on selected branches, and is there-fore a more sensitive test. The null model for this test is the site-specific M3 (discrete with K = 2 site classes; Yang and Nielsen,2002), which allows two x ratios for all branches. This is compared(using G test with v2 distribution) to a model allowing x ratios tobe estimated separately on a selected branch. While the test may
Table 3Log likelihood values and parameter estimates under different models using Yang’s(1998) test
Model p lnL xo xb xd
a. 1 ratio: xo = xb = xd 86 �19710.87 0.073 = xo = xo
b. 2 ratios: xd, xb = xo 87 �19689.99 0.056 = xo 0.096c. 2 ratios: xb, xd = xo 87 �19702.71 0.082 0.057 = xo
d. 2 ratios: xo, xb = xd 87 �19706.38 0.054 0.076 = xb
e. 3 ratios: xo, xb, xd 88 �19689.64 0.055 0.057 0.098
Note: xo, xb, and xd are the ratio of nonsynonymous to synonymous changesestimated on the outgroup, the PHYB and the PHYD clades, respectively.

Table 4G statistics (Whelan and Goldman, 1999) for likelihood ratio tests
Null hypothesis Assumption Models compared G
xd = (xb = xo) xb = xo a and b 41.76***
xb = (xd = xo) xd = xo a and c 16.32***
xo = (xb = xd) xb = xd a and d 8.98**
xb = xo xd free b and e 0.71xd = xo xb free c and e 26.15***
xb = xd xo free d and e 33.49***
Note: xo, xb, and xd are the ratio of nonsynonymous to synonymous changesestimated on the outgroup, the PHYB and the PHYD clades, respectively.p < 0.05.
** p < 0.005.*** p < 0.0005.
S. Mathews, K. McBreen / Molecular Phylogenetics and Evolution 49 (2008) 411–423 415
produce false positives in some cases (e.g., Zhang, 2004), the use ofmultiple runs from different starting values reduces this possibility(Wong et al., 2004).
2.4. Analyses of full-length sequences from Arabidopsis
For analyses of full-length sequences from Arabidopsis, DnaSP(version 3.53, Rozas and Rozas, 1999), was used to estimatedescriptive statistics and conduct tests for selection, unless other-wise stated. The levels of polymorphism in each gene, coding re-gion, domain and intron, were estimated as the average numberof nucleotide differences per site, p (Nei, 1987); divergence be-tween species was estimated as K (Nei, 1987). We used the four-gamete test (Hudson and Kaplan, 1985) to test for recombination.In coding regions, divergence between species and between PHYBand PHYD was estimated separately for synonymous and nonsyn-onymous sites (Nei and Gojobori, 1986) using Jukes and Cantor’s(1969) correction.
We used the McDonald–Kreitman test (McDonald andKreitman, 1991) to test the expectation that under neutrality theKa/Ks of fixed differences between species (divergence) should bethe same as Ka/Ks within species (polymorphism), using the G-testof independence. The G value is calculated with one degree of free-dom by the trapezoidal method of numerical integration. The sig-nificance of the Tajima test statistics was determined incoalescent simulations with 10,000 runs using the number of seg-regating sites under a model of no recombination. At PHYB, wecompared A. thaliana and A. lyrata. At PHYD, we compared A. thali-ana and A. halleri.
3. Results
3.1. The phylogenetic position of the PHYB/PHYD gene duplication
We obtained partial sequences from multiple clones of PHYBand PHYD from 19 and 17 species of Brassicaceae, respectively (Ta-ble 1), yielding 1860 alignable characters for analysis. We also ob-tained partial sequences of a PHYB-related gene from the outgroupgenera Capparis, Polanisia, and Isomeris, and a nearly full-length se-quence from C. hassleriana. For tree estimation and PAML (Yang,1997) analyses, some sequences were discarded from the matrices,based on the following criteria. Where multiple clones of PHYB orPHYD from an individual were identical or very similar (up totwo nucleotide differences in the first ca. 800 bp sequenced), allbut one was discarded. Occasionally, more divergent sequencesin a group from a single individual were also discarded. These weresequences that formed monophyletic groups but that differed inregions that were difficult to align between PHYB and PHYD. Theseregions of uncertain homology were excluded from phylogeneticand PAML analyses and so it was not informative to include morethan one representative sequence in the matrix.
For some species (Arabidopsis halleri, Boechera laevigata,Camelina microcarpa, Capsella bursa-pastoris, Erysimum capitatum,Farsetia aegyptica, Ischnocarpus exilis, Lepidium alyssoides, Malcolmiaafricana, and Thlaspi perfoliatum) this left multiple divergent clones,and all were included in analyses. Results from ML and MP boot-strap analyses were congruent and strongly supported the mono-phyly of Brassicaceae PHYB and PHYD and of their sister-grouprelationship. The ML bootstrap consensus is shown in Fig. 1. Theseresults suggest that the gene duplication occurred after Brassica-ceae diverged from the line leading to the closely related families,Cleomaceae and Capparaceae, but before the radiation of extantBrassicaceae. The monophyly of Cleomaceae PHYB also wasstrongly supported. The multiple divergent copies of PHYB or PHYDfrom individual species formed monophyletic lineages with 100%(most taxa), 92% (Malcolmia PHYD), 91% (A. halleri PHYD), or 86%(Ischnocarpus PHYD) bootstrap support (Fig. 1). These sequencesmay be indicative of species- or genus-specific duplications inthe PHYB and PHYD lineages.
A number of organismal relationships are supported by thePHYB and PHYD data. Aethionema saxatile is sister to all other gen-era in both gene clades. Malcomia africana diverges above Aethio-nema and is sister to the remaining genera in the PHYD clade.Both genes support a clade of Arabidopsis, Boechera laevigata,Pachycladon, Camelina microcarpa, and Capsella bursa-pastoris. ThePHYD data suggest that Erysimum capitatum belongs in this cladeand the PHYB data suggest that Barbarea vulgaris, Cardamine, andPlanodes virginicum belong in this clade. Sisymbrium altissismumand Stanleya pinnata are united in both gene clades, and Brassicaoleracea is their sister group in the PHYB clade. Similarly, Iberisoppositifolia and Thlaspi perfoliatum are united in both gene clades.The positions of Ionopsidium acaule and Lepidium alyssioides areunresolved. The relationships that are supported by the PHYB andPHYD data are highly congruent with those inferred in recent stud-ies of the Brassicaceae (Mitchell and Heenan, 2000; Koch et al.,2001; Hall et al., 2002; Heenan et al., 2002; O’Kane and Al-Shehbaz,2003; Al-Shehbaz et al., 2006; Bailey et al., 2006; Beilstein et al.,2006).
3.2. Purifying selection acts on both PHYB and PHYD in Brassicaceae
Maximum likelihood models of codon evolution allowing x tovary across lineages but averaged over all sites (branch test; Yang,1998), and across both lineages and codon sites (branch-sites test;Yang and Nielsen, 2002) were used to test whether lineages, or aclass of sites along a specified branch were under positive selec-tion. We formulated six models concerning x for branches in thetree (Table 3). Model (a) estimates a single x (0.073) for allbranches of the tree (see Section 2). Models (b) through (d) allowtwo x ratios. Model (b) estimates x for the PHYD lineage(0.096), and for the remainder of the tree (0.056). The differencein likelihood values between models (a) and (b) (lnL = �19710.87and lnL = �19689.99, respectively) is significant (p < 0.0005 withone d.f.; Table 4). Model (c) estimates x for the PHYB lineage(0.057), and for the remainder of the tree (0.082); the differencein likelihood values between this and model (a) is significant(p < 0.0005 with one d.f.). Model (d) estimates x for the PHYBbranches outside Brassicaceae (0.054), and for the remainder ofthe tree (0.077); the difference in likelihood values between thisand model (a) is significant (p < 0.005 with one d.f.). These threecomparisons suggest that although purifying selection is stillimportant in the PHYD lineage, evolution of PHYD is relaxed rela-tive to that of PHYB. Model (e) allows three x ratios, and estimatesx for the outgroup PHYB lineage (0.055), the PHYB lineage (0.057),and the PHYD lineage (0.096). Models (b), (c) and (d) are nestedwithin this model. Model (e) shows no significant improvementover model (b) (p = 0.40 with one d.f.) suggesting evolutionary

Fig. 1. Maximum likelihood majority-rule bootstrap consensus tree from analyses of the PHYB and PHYD data from Brassicaceae and outgroups. Bootstrap percentages >50%are provided for each branch.
416 S. Mathews, K. McBreen / Molecular Phylogenetics and Evolution 49 (2008) 411–423
constraints on PHYB have not changed since duplication. Model (e)significantly improves on both models (c) and (d) (p < 0.0005 withone d.f.), further suggesting that evolutionary constraints arestronger on PHYB than PHYD. In none of the branch tests modelsdid x exceed 0.1, showing the importance of purifying selectionover the majority of sites in each gene.
The branch-site model (Yang and Nielsen, 2002) allows detec-tion of positive selection at a subset of sites and is thus more sen-sitive. We used the branch-sites to test for positive selection onthree different branches, the branch leading to the PHYB lineage,to the PHYD lineage, and on the branch leading to Brassicaceae.
No sites were found to have been under positive selection (x ratiosranging from 0 to 0.22).
3.3. Nucleotide diversity in Arabidopsis thaliana
We sequenced PHYB and PHYD alleles from 17 and 16 ecotypesof A. thaliana, respectively, including the Ws PHYD pseudogene (Ta-ble 1). PHYB alleles were around 4030 bases in length (Table 5),excluding a 1 bp insertion in intron III of ecotype Kondara and a12 bp repeat present in alleles of most ecotypes at the N-terminal(amino acid residues 11–14 of Mathews et al., 1995). PHYD alleles

Table 5Summary of Polymorphism in PHYB and PHYD Regions of A. thaliana
Total Coding Non-Coding Exon I Intron I Exon II Intron II Exon III Intron III Exon IV
PHYBSites 4030 3476 554 2142 88 809 90 291 376 234p 0.0015 0.0013 0.0028 0.0009 0 0.0019 0.002 0.0025 0.0037 0.0008p (silent) 0.0023 0.002 0.0018 0.0041 0 0Tajima’s D �0.917 (NS)
PHYDSites 3761 3372 389 2172 84 807 99 291 206 102p 0.0024 0.0022 0.0035 0.0028 0.002 0.0015 0.0017 0.0006 0.0047 0.0016p (silent) 0.0031 0.003 0.0038 0.002 0 0Tajima’s D �1.588 (NS)
S. Mathews, K. McBreen / Molecular Phylogenetics and Evolution 49 (2008) 411–423 417
were 3761 bases (Table 5) excluding length variation of 1 bp in a Trepeat in the second intron. Additionally, PHYD of ecotype Ws has a14 bp deletion (Aukerman et al., 1997). PHYD sequences from eco-types Ita-0 and Gre-0 contained stop codons in their sequences, atamino acid sites 488 and 666, respectively, and are potentiallynonfunctional. In both cases this replaced a glutamine, involvinga first codon position change from C to T, in all analyses this nucle-otide was treated as unknown in case it represented sequencing er-ror. Coding regions of PHYB and PHYD share high sequence identity(K = 0.197 in exons) and are straightforward to align, with theexception of portions of the amino terminus (residues 1–52 ofMathews et al., 1995). Using the four-gamete test (Hudson andKaplan, 1985) we found no evidence for recombination in eithergene (data not presented).
Twenty-five polymorphic sites were present in the PHYB data-set, 23 of which were single nucleotide polymorphisms; 14 ofthese were unambiguous singletons (Fig. 2A). PHYB sequenceswere generally very similar with six out of 17 ecotypes formingone identical group (Tsu-0, Aua/Rhon, Mh-0, Bensheim, Br-0, Nie-derzenz) and another ecotype differing from these by only threebases (Kin-0); another group of three identical sequences (Ler-0,Lip-0, Col-0) are distinguished from three ecotypes by three (No-0) or fewer (two: Cvi-0, one: Dijon-G) differences (Fig. 2A). Themaximum difference between sequences is 10, between Kondaraand Cvi-0. The PHYD dataset contained 47 polymorphic sites: oneindel and 46 nucleotide polymorphisms, of which 26 were unam-biguous singletons (Fig. 2B). The maximum difference is 19 poly-morphisms, between Mh-0 and Col-0. As with PHYB, Tsu-0 isidentical to Bensheim, and Aua/Rhon to Niederzenz, although un-like PHYB there are 13 differences between these pairs of ecotypes,Br has 15 differences from Tsu-0 and 11 from Aua/Rhon. No-0 andRLD have identical PHYD sequences. Thus, in each gene, slightlyover half the polymorphisms are singletons.
Levels of nucleotide diversity (p) are low in both genes (Table5), particularly in coding regions. In PHYB, however, even thislow level of diversity is far from evenly distributed. In the codingregion, diversity is highest in exons II and III (p = 0.0019 and0.0025, respectively) and lowest in exons I and IV (p = 0.0009and 0.0008), respectively. Intron I has no polymorphic sites, whilediversity in intron II is similar to that of exons II and III. The mostvariable region in PHYB is intron III (p = 0.0037). Diversity in the 50
half of PHYB, which encodes the photosensory domain, is muchlower than in the 30 half of the gene, which encodes the regulatorydomain. In contrast, variation in PHYD is generally more evenlydistributed and in most regions, diversity is higher in PHYD thanin PHYB, especially in exons I and IV and in introns I and III (Table5). However, in exon III, which encodes part of the HKRD, diversityis much lower in PHYD than in PHYB. As in PHYB, intron III is themost diverse (p = 0.0047). The most distinct haplotype in this sam-ple is that of Ws PHYD, a pseudogene (Aukerman et al., 1997), andthe levels of coding sequence diversity at PHYB (0.0013) and PHYD
(0.0022) are among the lowest reported for other genes of A. thali-ana, which range from 0.0015 to 0.0067 (Innan et al., 1996;Kawabe et al., 1997, 2000; Purugganan and Suddith, 1998; Kawabeand Miyashita, 1999; Kuittinen and Aguadé, 2000; Aguadé, 2001;Olsen et al., 2002; Kamiya et al., 2002; Le Corre et al., 2002;Shepard and Purugganan, 2003; Yoshida et al., 2003).
3.4. Rates of synonymous substitution in PHYB and PHYD
Neither PHYB nor PHYD sequences have values of nonsynony-mous polymorphism that exceed values of synonymous polymor-phism (pa/ps = 0.53 and 0.64, respectively). These values aremoderately high compared to A. thaliana genes studied so far,which range from 0.05 for F3H (Aguadé, 2001) to 1.1 for CAL(Purugganan and Suddith, 1998) when complete sequences areconsidered. However, this is due to rates of synonymous substitu-tion that are very low rather than to elevated rates of nonsynony-mous substitution. The four genes with a higher ratio are theMADS-box genes CAULIFOWER (pa/ps = 1.1, Purugganan and Sud-dith, 1998) and PISTILLATA (pa/ps = 0.73, Olsen et al., 2002), theregulatory gene FRIGIDA (pa/ps = 0.79, Le Corre et al., 2002), andthe disease resistance gene RPP13 (pa/ps = 0.9 across the entiregene and 1.5 within the putative pathogen-recognition region,Rose et al., 2004).
3.5. Amino acid replacements cluster in the central region
A subset of the radical amino acid replacements distinguishingPHYB from PHYD occur at sites that are conserved in PHYB or inall PHY and are thus likely to have occurred since the gene duplica-tion. Half of the 17 substitutions that make up this subset are clus-tered in a central region that includes part of the PHY and all of thePAS-related domains that is implicated in conferring signaling spec-ificity on the two genes. The remainder are distributed among theGAF, PHY, and HKRD (see Fig. 3 for schematic of protein structure).
3.6. Levels of intraspecific divergence at PHYB and PHYD
Despite the low levels of nucleotide diversity at both PHYB andPHYD, their level of divergence from orthologs in other Arabidopsisspecies (Table 6) is comparable to that of other genes studied todate. In a survey of 304 Arabidopsis loci, rates of synonymous sub-stitutions per synonymous site (Ks) ranged from 0.000 to 0.552(mean = 0.119, Barrier et al., 2003), while rates of nonsynonymoussubstitution per nonsynonymous site (Ka) range from 0.000 to0.159 (mean = 0.025; Barrier et al., 2003; for single gene studiessee also Innan et al., 1996; Kawabe et al., 1997, 2000; Kawabeand Miyashita, 1999; Kuittinen and Aguadé, 2000; Kamiya et al.,2002; Le Corre et al., 2002; Yoshida et al., 2003). Fig. 3 comparesp and total divergence (K) over the two genes. Levels of polymor-phism and divergence appear to vary concordantly, an observation

Fig. 2. Summary of polymorphisms detected in A. thaliana (A) PHYB and (B) PHYD. A dot indicates identical nucleotide to ecotype Col-0. Nucleotide positions in the currentdata set of polymorphisms are indicated above. Single base indels are represented by-(presence of a gap in the alignment) or the nucleotide; the 12 base-pair indel in PHYB isrepresented by ID1 and is at nucleotide position 25–36.
418 S. Mathews, K. McBreen / Molecular Phylogenetics and Evolution 49 (2008) 411–423
that was confirmed by the non-significance of McDonald’s (1996,1998) tests of heterogeneity in the ratio of polymorphism to diver-gence (results not shown). The ratios of Ka:Ks between A. thalianaand A. lyrata PHYB (0.09), and between A. thaliana and A. halleriPHYD (0.17, Table 6) also are comparable to other genes studied,which range from 0.00 to 2.59 (mean = 0.213; Barrier et al.,2003), and indicate that the evolution of both loci is constrained.Of the 23 polymorphic substitutions in PHYB, 17 were in exons.Ten of these were replacement polymorphisms and six were syn-onymous polymorphisms (Table 7). Between A. thaliana and A. lyra-ta, there were 27 fixed replacement and 88 fixed synonymouschanges. Thus, the ratio of nonsynonymous to synonymous substi-tutions varies significantly within and between species (G = 9.4,
P = 0.002). A similar result was obtained for PHYD. Of the 46 poly-morphic substitutions, 38 were in exons. Twenty-four of thesewere replacement polymorphisms and nine were synonymouspolymorphisms (Table 7). Between A. thaliana and A. halleri, therewere 61 fixed replacement and 105 fixed synonymous differences(G = 14.6, P = 0.0001). Thus, the neutral-equilibrium model can berejected for both PHYB and PHYD.
3.7. Patterns of polymorphism are consistent with range expansion
We also used the test of Tajima (1989) to evaluate the relativeroles of neutral evolution and selection, although the sensitivityof this test may be limited here due to low levels of nucleotide var-

Fig. 3. Sliding window plot of nucleotide diversity within A. thaliana (p) and total divergence between A. thaliana and outgroups (K) for (A) PHYB and (B) PHYD (excludingecotype Ws). Windows include 50 bp, with successive displacement of 10 bp. The structure of each gene is represented above the plot (boxes represent exons, lines representintrons). Locations of functional domains (Montgomery and Lagarias, 2002; Wagner et al., 2005) are indicated within the plot; white boxes in the plot indicate theapproximate location of the PAS A and PAS B regions of the PAS-related domain (PRD). PAS, GAF, and PHY domains form the core photosensory region; P1 is an N-terminalextension rich in serines and threonines; the PRD and histidine-kinase-related domain (HKRD) form the regulatory domain. A. lyrata and A. halleri were outgroups for PHYBand PHYD, respectively.
Table 6Sequence divergence in Arabidopsis
Locus Total Ka/Ks Ka Ks
PHYB 0.048 0.09 0.011 0.119PHYD 0.058 0.17 0.026 0.148
Note: Ka and Ks are the estimated divergence between species at nonsynonymousand synonymous sites respectively. At PHYB, A. thaliana and A. lyrata are compared;at PHYD, A. thaliana and A. halleri are compared.
Table 7Results from McDonald and Kreitman (1991) tests
Fixed Polymorphic
PHYBa Synonymous 88 6Replacement 27 10
PHYDb Synonymous 105 9Replacement 61 24
a A. thaliana PHYB with A. lyrata for interspecies comparison (G = 9.4, p = 0.002).b A. thaliana PHYD with A. halleri for interspecific comparison (G = 14.6,
p = 0.0001).
S. Mathews, K. McBreen / Molecular Phylogenetics and Evolution 49 (2008) 411–423 419
iation and small sample size. We found that the test statistics werenot significant (Table 5) but both were negative, indicating a slightexcess of rare alleles of each gene. The nearly significant value forPHYD is consistent with a recent range expansion of the speciesand/or inbreeding depression (Purugganan and Suddith, 1999;Kuittinen and Aguadé, 2000; Sharbel et al., 2000; Aguadé, 2001;Olsen et al., 2002; Shepard and Purugganan, 2003). And the patternof polymorphisms observed in both genes also is consistent with
that expected in an expanding population (Rogers and Harpending,1992; Fig. 4).
4. Discussion
4.1. The divergence of PHYB and PHYD
The phylogeny of PHYB and PHYD inferred from our data sug-gests that the duplication leading to their divergence occurred inan ancestral crucifer, after the divergence of Brassicaceae fromtheir closest relatives, the Cleomaceae and Capparaceae. If bothcopies were present in Cleomaceae and Capparaceae and we hadsimply failed to detect them, the sequences from these familiesthat we did detect would have fallen into either the PHYB or PHYDclade of the gene phylogeny. Instead PHYB and PHYD from Brassic-aceae are each other’s closest relatives. In contrast, we assume thatmost Brassicaceae maintain both copies. Although our PCR surveydid not detect both copies in all the genera that we sampled, thismore likely results from sampling failure than gene loss becauseboth copies were detected in Aethionema, the sister group of theother genera, and in more derived genera. Our taxonomic samplewas limited, but it was broad, including several of the lineages in-ferred in recent studies of the family (Mitchell and Heenan, 2000;Koch et al., 2001; Hall et al., 2002; Heenan et al., 2002; O’Kane andAl-Shehbaz, 2003; Al-Shehbaz et al., 2006; Bailey et al., 2006;Beilstein et al., 2006). This suggests that PHYD has persisted forup to 40 myr, the estimated age of the family (Koch et al., 2001),and longer than the expected half-life for duplicate genes of3–7 myr (Lynch and Conery, 2000). Although the timing of the

Fig. 4. Observed and expected frequencies of polymorphic nucleotide sites in anexpanding population for A. thaliana (A) PHYB and (B) PHYD. The expected valuewas obtained according to Rogers and Harpending (1992).
420 S. Mathews, K. McBreen / Molecular Phylogenetics and Evolution 49 (2008) 411–423
duplication is similar to that of a genome duplication in an ances-tral Brassicaceae around 38 myr ago (Ermolaeva et al., 2003), theevidence from their flanking genes does not indicate that PHYBand PHYD are products of the genome duplication.
Unlike the divergence of PHYA from PHYC, which involved theorigin of novel functions and an apparent episode of positive selec-tion (Mathews et al., 2003), the divergence of PHYD from PHYB hasinvolved no detectable episodes of positive selection, and the genesare partially redundant. The tree-based maximum likelihood esti-mates of x provide evidence that the evolution of both genes ishighly constrained, but with selection on PHYD (x = 0.098) relaxedrelative to selection on PHYB (x = 0.057). Nonetheless, it is knownthat amino acid divergence in the central regions of the phyB andphyD coding sequences (including part of the PHY domain and allof the PRD) are critical to their respective activities in A. thalianaand that these two photoreceptors differ significantly in their abil-ities to activate signaling pathways (Sharrock et al., 2003b). Be-cause phyB and phyD amino acid sequences are 86% similar inthe region that determines these differences, Sharrock et al.(2003b) suggested that it was likely that the amino acids responsi-ble could be identified. Our results from analysis of A. thaliana eco-
types are consistent with the implicated importance of the centralregion in determining the differential functions of phyB and phyD.This region contains half of the 17 radical replacements that wefound to occur at sites that are generally conserved in phyB or inall phytochromes. All of these 17 replacements potentially involvechanges of charge that may influence intra- and intermolecularprotein interactions. The testing of all or a subset of these aminoacid sites through mutagenesis may provide additional insight intothe differential signaling activities of phyD and phyB.
We found that levels of nucleotide diversity and divergence inA. thaliana for both PHYB and PHYD (Tables 5 and 6) were atthe low end of the range reported for other loci in Arabidopsis(e.g., Barrier et al., 2003). It is possible that previously normal lev-els of variation have been eliminated, leaving only mutations thathave occurred recently. For example, results from the Tajima’s Dtest could indicate that the conservation in PHYD results from aselective sweep, which with the extent of linkage disequilibriumin A. thaliana (Hagenblad and Nordborg, 2002; Nordborg et al.,2002), and a selection coefficient as low as 0.01, could result fromselection at neighboring genes as far as 10 Kb from PHYD (Kaplanet al., 1989). However, if this were the case, the sweep would alsohave affected the Ws pseudogene, which is diverging relativelyrapidly from the PHYD sequences in the other ecotypes. Addition-ally, there is a much higher level of variation in the third intronthan in the remainder of the gene. If the lack of diversity in PHYDamong ecotypes were due to a selective sweep rather than to puri-fying selection, we would expect similarly low variation in intronsand exons. The number of rare polymorphisms in the PHYB andPHYD datasets indicates that deleterious alleles may be presentwithin the ecotypes but that they are not becoming fixed, consis-tent with nearly neutral evolution and/or with a relaxation ofselective constraints coupled with a recent population expansion(e.g., Le Corre et al., 2002), as has been suggested for A. thaliana(Purugganan and Suddith, 1999; Kuittinen and Aguadé, 2000;Sharbel et al., 2000; Aguadé, 2001; Olsen et al., 2002; Shepardand Purugganan, 2003).
4.2. The persistence of PHYD
In A. thaliana, PHYD is expressed at relatively low levels in a sub-set of the tissues in which PHYB is expressed (Goosey et al., 1997;Sharrock and Clack, 2002). The expression of PHYD driven by aPHYB promoter can fully complement the early flowering pheno-type of phyB-1, but has additive and minor effects on a subset ofthe shade avoidance responses (Sharrock et al., 2003a). Both phyBand phyD mediate interactions with cryptochrome-mediated bluelight responses (Franklin et al., 2003b), but phyD null mutants havenormal germination in red light (Aukerman et al., 1997).
The relaxation of selective constraints on PHYD and the loss of afunctional PHYD from at least one A. thaliana ecotype are consistentwith the apparently minor role of phyD in photomorphogenesis.Nonetheless, the persistence of PHYD during the evolution of theBrassicaceae may indicate that phyD is more important than isunderstood and that phenotypic effects would be more apparentin conditions that remain to be explored. The natural environmentis considerably more complex than the laboratory environment,and it is becoming more apparent that temperature effects andphotoperiod influence phytochrome activity, and the roles of spe-cific phytochromes (Halliday and Whitelam, 2003; Franklin andWhitelam, 2004; Heschel et al., 2007). For example, Halliday andWhitelam (2003) showed that both temperature and photoperiodaffect the prominence of phyD in the control of flowering and leafexpansion, while Heschel and colleagues (Heschel et al., 2007)showed that phyA and phyE are prominent in germination at highand low temperatures, respectively, and that phyB is important ingermination across a wide range of temperatures. These findings

S. Mathews, K. McBreen / Molecular Phylogenetics and Evolution 49 (2008) 411–423 421
have profound implications for our understanding of geneticredundancy. Functional divergence could lead to differences in anumber of processes that influence the activities of phyB and phyD,including rates of photoconversion and dark reversion, propensityto form homo versus heterodimers, interactions with signalingpartners, and translocation between the cytoplasm and nucleus.Divergence in any of these activities might be more pronouncedin some environments than in others, leading to genetic redun-dancy that functions across environments rather than across devel-opmental stages or tissue types.
Acknowledgments
We thank Ted Clack and Bob Sharrock for primers and DNAs,Renee Harper, Mannie Liscum, and Jane Murfett for technical ad-vice, Tom Mitchell-Olds for seed, Mark Beilstein, Jocelyn Hall, andPeter Heenan for DNA, Ziheng Yang for discussion of PAML analy-ses, and Peter Tiffin, Julin Maloof, Cynthia Weinig, Bob Sharrock,and two anonymous reviewers for helpful comments on the man-uscript. This work was supported by the University of Missouri Re-search Board and Mission Enhancement funds awarded to S.M.
References
Al-Shehbaz, I.A., Beilstein, M.A., Kellogg, E.A., 2006. Systematics and phylogeny ofthe Brassicaceae (Cruciferae): an overview. Plant Syst. Evol. V259, 89–120.
Aguadé, M., 2001. Nucleotide sequence variation at two genes of thephenylpropanoid pathway, the FAH1 and F3H genes, in Arabidopsis thaliana.Mol. Biol. Evol. 18, 1–9.
Aphalo, P.J., Ballaré, C.L., Scopel, A.L., 1999. Plant-plant signaling, the shade-avoidance response and competition. J. Exp. Bot. 50, 1629–1634.
Aukerman, M.J., Hirschfeld, M., Wester, L., Weaver, M., Clack, T., Amasino, R.M.,Sharrock, R.A., 1997. A deletion in the PHYD gene of the ArabidopsisWassilewskija ecotype defines a role for phytochrome D in red/far-red lightsensing. Plant Cell 9, 1317–1326.
Bailey, C.D., Koch, M.A., Mayer, M., Mummenhoff, K., O’Kane Jr., S.L., Warwick, S.I.,Windham, M.D., Al-Shehbaz, I.A., 2006. Toward a global phylogeny of theBrassicaceae. Mol. Biol. Evol. 23, 2142–2160.
Ballaré, C., Scopel, A.L., Sanchez, R., 1990. Far-red radiation reflected from adjacentleaves, an early signal of competition in plant canopies. Science 247, 329–332.
Ballaré, C.L., Scopel, A.L., Sanchez, R.A., 1997. Foraging for light, Photosensoryecology and agricultural implications. Plant Cell Environ. 20, 820–825.
Barrier, M., Bustamante, C.D., Yu, J.Y., Purugganan, M.D., 2003. Selection on rapidlyevolving proteins in the Arabidopsis genome. Genetics 163, 723–733.
Beilstein, M.A., Al-Shehbaz, I.A., Kellogg, E.A., 2006. Brassicaceae phylogeny andtrichome evolution. Am. J. Bot. 93, 607–619.
Botto, J.F., Smith, H., 2002. Differential genetic variation in adaptive strategies to acommon environmental signal in Arabidopsis accessions: phytochrome-mediated shade avoidance. Plant Cell Environ. 25, 53–63.
Breyne, P., Rombaut, D., Van Gysel, A., Van Montagu, M., Gerats, T., 1999. AFLPanalysis of genetic diversity within and between Arabidopsis thaliana ecotypes.Mol. Gen. Genet. 261, 627–634.
Casal, J., Smith, H., 1989. The function, action and adaptive significance ofphytochrome in light-grown plants. Plant Cell Environ. 12, 855–862.
Casal, J.J., Sanchez, R.A., Yanovsky, M.J., 1997. The function of phytochrome A. PlantCell Environ. 20, 813–819.
Clack, T., Mathews, S., Sharrock, R.A., 1994. The phytochrome apoprotein family inArabidopsis is encoded by 5 genes—the sequences and expression of phyD andphyE. Plant Mol. Biol. 25, 413–427.
Clark, A.G., 1994. Invasion and maintenance of a gene duplication. Proc. Natl. Acad.Sci. USA 91, 2950–2954.
Devlin, P.F., Patel, S., Whitelam, G.C., 1998. Phytochrome E influences internodeelongation and flowering time in Arabidopsis. Plant Cell 10, 1479–1487.
Devlin, P.F., Robson, P.R.H., Patel, S.R., Goosey, L., Sharrock, R.A., Whitelam, G.C.,1999. Phytochrome D acts in the shade-avoidance syndrome in Arabidopsis bycontrolling elongation growth and flowering time. Plant Physiol. 119, 909–915.
Devlin, P.F., Yanovsky, M.J., Kay, S.A., 2003. A genomic analysis of the shadeavoidance response in Arabidopsis. Plant Physiol. 133, 1617–1629.
Elich, T.D., Chory, J., 1997. Phytochrome: If it looks and smells like a histidine kinase,is it a histidine kinase? Cell 91, 713–716.
Ermolaeva, M.D., Wu, M., Eisen, J.A., Salzberg, S.L., 2003. The age of the Arabidopsisthaliana genome duplication. Plant Mol. Biol. 51, 859–866.
Fankhauser, C., 2001. The phytochromes, a family of Red/Far-red absorbingphotoreceptors. J. Biol. Chem. 276, 11453–11456.
Fisher, R., 1935. The sheltering of lethals. Am. Nat. 69, 446–453.Force, A., Lynch, M., Postlethwait, J., 1999. Preservation of duplicate genes by
subfunctionalization. Am. Zool. 39, 460.Franklin, K.A., Davis, S.J., Stoddart, W.M., Vierstra, R.D., Whitelam, G.C., 2003a.
Mutant analyses define multiple roles for phytochrome C in Arabidopsisphotomorphogenesis. Plant Cell 15, 1981–1989.
Franklin, K.A., Larner, V.S., Whitelam, G.C., 2005. The signal transducingphotoreceptors of plants. Int. J. Dev. Biol. 49, 653–664.
Franklin, K.A., Praekelt, U., Stoddart, W.M., Billingham, O., Halliday, K.J., Whitelam,G.C., 2003b. Phytochromes B, D, and E act redundantly to control multiplephysiological responses in Arabidopsis. Plant Physiol. 131, 1340–1346.
Franklin, K.A., Whitelam, G.C., 2004. Light signals, phytochromes and cross-talkwith other environmental cues. J. Exp. Bot. 55, 271–276.
Furuya, M., Song, P., 1994. Assembly and properties of holophytochrome. In:Kendrick, R., Kronenberg, G. (Eds.), Photomorphogenesis in Plants. KluwerAcademic Publishers, Dordrecht, The Netherlands, pp. 105–140.
Goosey, L., Palecanda, L., Sharrock, R.A., 1997. Differential patterns of expression ofthe Arabidopsis PHYB, PHYD, and PHYE phytochrome genes. Plant Physiol. 115,959–969.
Hagenblad, J., Nordborg, M., 2002. Sequence variation and haplotype structuresurrounding the flowering time locus FRI in Arabidopsis thaliana. Genetics 161,289–298.
Haldane, J., 1933. The part played by recurrent mutation in evolution. Am. Nat. 67,5–19.
Hall, J.C., Sytsma, K.J., Iltis, H.H., 2002. Phylogeny of Capparaceae and Brassicaceaebased on chloroplast sequence data. Am. J. Bot. 89, 1826–1842.
Halliday, K.J., Koorneef, M., Whitelam, G.C., 1994. Phytochrome B and at least oneother phytochrome mediate the accelerated flowering response of Arabidopsisthaliana to low red/far-red ratio. Plant Physiol. 128, 194–200.
Halliday, K.J., Whitelam, G.C., 2003. Changes in photoperiod or temperature alterthe functional relationships between phytochromes and reveal roles for phyDand phyE. Plant Physiol. 131, 1913–1920.
Heenan, P.B., Mitchell, A.D., Koch, M., 2002. Molecular systematics of the NewZealand Pachycladon (Brassicaceae) complex: generic circumscription andrelationship to Arabidopsis sens Lat. and Arabis sens. lat. N Z. J. Bot. 40, 543–562.
Henikoff, S., Greene, E.A., Pietrokovski, S., Bork, P., Attwood, T.K., Hood, L., 1997.Gene families: the taxonomy of protein paralogs and chimeras. Science 278,609–614.
Hennig, L., Stoddart, W., Dieterle, M., Whitelam, G.C., Schaffer, E., 2002.Phytochrome E controls light-induced germination of Arabidopsis. PlantPhysiol. 128, 194–200.
Heschel, M.S., Selby, J., Butler, C., Whitelam, G.C., Sharrock, R.A., Donohue, K., 2007.A new role for phytochromes in temperature-dependent germination. NewPhytol. 174, 735–741.
Howe, G.T., Bucciaglia, P.A., Hackett, W.P., Furnier, G.R., Cordonnier-Pratt, M.-M.,Gardner, G., 1998. Evidence that the phytochrome gene family in blackcottonwood has one PHYA locus and two PHYB loci but lacks members of thePHYC/F and PHYE subfamilies. Mol. Biol. Evol. 15, 160–175.
Hudson, R.R., Kaplan, N.L., 1985. Statistical properties of the number ofrecombination events in the history of a sample of DNA sequences. Genetics111, 147–164.
Hughes, A.L., 1994. The evolution of functionally novel proteins after geneduplication. Proc. R. Soc. Lond. B 256, 119–124.
Innan, H., Tajima, F., Terauchi, R., Miyashita, N.T., 1996. Intragenic recombination inthe Adh locus of the wild plant Arabidopsis thaliana. Genetics 143, 1761–1770.
Jukes, T.H., Cantor, C.R., 1969. Evolution of protein molecules. In: Munro, H. (Ed.),Mammalian Protein Metabolism. Academic Press, New York, pp. 21–123.
Kamiya, T., Kawabe, A., Miyashita, N.T., 2002. Nucleotide polymorphism at theAtmyb2 locus of the wild plant Arabidopsis thaliana. Genet. Res. 80, 89–98.
Kaplan, N.L., Hudson, R.R., Langley, C.H., 1989. The ‘‘hitchhiking effect” revisited.Genetics 123, 887–899.
Kawabe, A., Innan, H., Terauchi, R., Miyashita, N.T., 1997. Nucleotide polymorphismin the acidic chitinase focus (ChiA) region of the wild plant Arabidopsis thaliana.Mol. Biol. Evol. 14, 1303–1315.
Kawabe, A., Miyashita, N.T., 1999. DNA variation in the basic chitinase locus (ChiB)region of the wild plant Arabidopsis thaliana. Genetics 153, 1445–1453.
Kawabe, A., Yamane, K., Miyashita, N.T., 2000. DNA polymorphism at the cytosolicphosphoglucose isomerase (PgiC) locus of the wild plant Arabidopsis thaliana.Genetics 156, 1339–1347.
Koch, M., Haubold, B., Mitchell-Olds, T., 2001. Molecular systematics of theBrassicaceae: evidence from coding plastidic matK and nuclear Chssequences. Am. J. Bot. 88, 534–544.
Krall, L., Reed, J.W., 2000. The histidine kinase-related domain participates inphytochrome B function but is dispensable. Proc. Natl. Acad. Sci. USA 97, 8169–8174.
Kuittinen, H., Aguadé, M., 2000. Nucleotide variation at the CHALCONE ISOMERASElocus in Arabidopsis thaliana. Genetics 155, 863–872.
Lavin, M., Eshbaugh, E., Hu, J.-M., Mathews, S., Sharrock, R.A., 1998. Monophyleticsubgroups of the tribe Millettieae (Leguminosae) as revealed by phytochromenucleotide sequence data. Am. J. Bot. 85, 412–433.
Le Corre, V., Roux, F., Reboud, X., 2002. DNA polymorphism at the FRIGIDA gene inArabidopsis thaliana: Extensive nonsynonymous variation is consistent withlocal selection for flowering time. Mol. Biol. Evol. 19, 1261–1271.
Li, W.Z., Chinnappa, C.C., 2003. The phytochrome gene family in the Stellarialongpipes complex. Int. J. Plant Sci. 164, 657–673.
Lynch, M., Conery, J.S., 2000. The evolutionary fate and consequences of duplicategenes. Science 290, 1151–1155.
Lynch, M., Force, A., 2000. The probability of duplicate gene preservation bysubfunctionalization. Genetics 154, 459–473.
Lynch, M., O’Hely, M., Walsh, B., Force, A., 2001. The probability of preservation of anewly arisen gene duplicate. Genetics 159, 1789–1804.

422 S. Mathews, K. McBreen / Molecular Phylogenetics and Evolution 49 (2008) 411–423
Maddison, D.R., Maddison, W.P., 2000. MacClade 4. Analysis of phylogeny andcharacter evolution. Sunderland, MA, Sinauer Associates.
Mathews, S., 2006. Phytochrome-mediated development in land plants, red lightsensing evolves to meet the challenges of changing light environments. Mol.Ecol. 15, 3483–3503.
Mathews, S., Burleigh, J.G., Donoghue, M.J., 2003. Adaptive evolution in thephotosensory domain of phytochrome A in early angiosperms. Mol. Biol. Evol.20, 1087–1097.
Mathews, S., Lavin, M., Sharrock, R.A., 1995. Evolution of the phytochrome genefamily and its utility for phylogenetic analyses of angiosperms. Ann. Mo. Bot.Gard. 82, 296–321.
Mathews, S., Sharrock, R.A., 1996. The phytochrome gene family in grasses(Poaceae): A phylogeny and evidence that grasses have a subset of the locifound in dicot angiosperms. Mol. Biol. Evol. 13, 1141–1150.
Mathews, S., Sharrock, R.A., 1997. Phytochrome gene diversity. Plant Cell Environ.20, 666–671.
Matsushita, T., Mochizuki, N., Nagatani, A., 2003. Dimers of the N-terminal domainof phytochrome B are functional in the nucleus. Nature 424, 571–574.
McDonald, J.H., 1996. Detecting non-neutral heterogeneity across a region of DNAsequence in the ratio of polymorphism to divergence. Mol. Biol. Evol. 13, 253–260.
McDonald, J.H., 1998. Improved tests for heterogeneity across a region of DNAsequence in the ratio of polymorphism to divergence. Mol. Biol. Evol. 15, 377–384.
McDonald, J.H., Kreitman, M., 1991. Adaptive protein evolution at adh locus inDrosophila. Nature 351, 652–654.
Mitchell, A.D., Heenan, P.B., 2000. Systematic relationships of New Zealand endemicBrassicaceae inferred from nrDNA ITS sequence data. Syst. Bot. 25, 98–105.
Møller, S.G., Ingles, P.J., Whitelam, G.C., 2002. The cell biology of phytochromesignaling. New Phytol. 154, 553–590.
Monte, E., Alonso, J.M., Ecker, J.R., Zhang, Y., Li, X., Young, J., Austin-Phillips, S., Quail,P.H., 2003. Isolation and characterization of phyC mutants in Arabidopsis revealscomplex crosstalk between phytochrome signaling pathways. Plant Cell 15,1962–1980.
Montgomery, B.L., Lagarias, J.C., 2002. Phytochrome ancestry: sensors of bilins andlight. Trends Plant Sci. 7, 357–366.
Moore, R.C., Purugganan, M.D., 2003. The early stages of duplicate gene evolution.Proc. Natl. Acad. Sci. USA 100, 15682–15687.
Murashige, T., Skoog, F., 1962. A revised medium for rapid growth and bioassayswith tobacco tissue cultures. Physiol. Plant 15, 473–497.
Nadeau, J.H., Sankoff, D., 1997. Comparable rates of gene loss and functionaldivergence after genome duplications early in vertebrate evolution. Genetics147, 1259–1266.
Nagatani, A., Reed, J.W., Chory, J., 1993. Isolation and initial characterization ofArabidopsis mutants that are deficient in phytochrome A. Plant Physiol. 102,269–277.
Nagy, F., Schäfer, E., 2002. Phytochromes control photomorphogenesis bydifferentially regulated, interacting signaling pathways in higher plants. Ann.Rev. Plant Biol. 53, 329–355.
Nei, M., 1987. Molecular Evolutionary Genetics. Columbia University Press, NewYork.
Nei, M., Gojobori, T., 1986. Simple methods for estimating the numbers ofsynonymous and nonsynonymous nucleotide substitutions. Mol. Biol. Evol. 3,418–426.
Nordborg, M., Borevitz, J.O., Bergelsen, J., Berry, C.C., Chory, J., Hagenblad, J.,Kreitman, M., Maloof, J.N., Noyes, T., Oefner, P.J., Stahl, E.A., Weigel, D., 2002. Theextent of linkage disequilibrium in Arabidopsis thaliana. Nat. Genet. 30, 190–193.
Ohno, S., 1970. Evolution by Gene Duplication. Springer-Verlag, Berlin.Oka, Y., Matsushita, T., Mochizuki, N., Suzuki, T., Tokutomi, S., Nagatani, A., 2004.
Functional analysis of a 450-amino acid N-terminal fragment of phytochrome Bin Arabidopsis. Plant Cell 16, 2104–2116.
O’Kane, S.L., Al-Shehbaz, I.A., 2003. Phylogenetic position and generic limits ofArabidopsis (Brassicaceae) based on sequences of nuclear ribosomal DNA. Ann.Mo. Bot. Gard. 90, 603–612.
Olsen, K.M., Womack, A., Garrett, A.R., Suddith, J.I., Purugganan, M.D., 2002.Contrasting evolutionary forces in the Arabidopsis thaliana floral developmentalpathway. Genetics 160, 1641–1650.
Parks, B.M., Quail, P.H., 1993. HY8, a new class of Arabidopsis long hypocotylmutants deficient in functional phytochrome A. Plant Cell 5, 39–48.
Posada, D., Crandall, K.A., 1998. MODELTEST: testing the model of DNA substitution.Bioinformatics 14, 817–818.
Pratt, L.H., Cordonnier-Pratt, M.-M., Hauser, B., Caboche, M., 1995. Tomato containstwo differentially exrpressed genes encoding B-type phytochromes, neither ofwhich can be considered an ortholog of Arabidopsis phytochrome B. Planta 197,203–206.
Purugganan, M.D., Suddith, J.I., 1998. Molecular population genetics of theArabidopsis CAULIFLOWER regulatory gene: Nonneutral evolution andnaturally occurring variation in floral homeotic function. Proc. Natl. Acad. Sci.USA 95, 8130–8134.
Purugganan, M.D., Suddith, J.I., 1999. Molecular population genetics of floralhomeotic loci: Departures from the equilibrium-neutral model at the APETALA3and PISTILLATA genes of Arabidopsis thaliana. Genetics 151, 839–848.
Quail, P.H., 2002a. Photosensory perception and signaling in plant cells: newparadigms? Curr. Opin. Cell Biol. 14, 180–188.
Quail, P.H., 2002b. Phytochrome photosensory signaling networks. Nat. Rev. Mol.Cell Biol. 3, 85–93.
Reed, J.W., Nagpol, P., Poole, D., Furuya, M., Chory, J., 1993. Mutations in the gene forthe red far-red light receptor phytochrome B alter cell elongation andphysiological responses throughout Arabidopsis development. Plant Cell 5,147–157.
Robson, P.R.H., Whitelam, G.C., Smith, H., 1993. Selected components of the shade-avoidance syndrome are displayed in a normal manner in mutants ofArabidopsis thaliana and Brassica rapa deficient in phytochrome B. PlantPhysiol. 102, 1179–1184.
Rockwell, N.C., Su, Y.-S., Lagarias, J.C., 2006. Phytochrome structure and signalingmechanisms. Annu. Rev. Plant Biol. 57, 837–858.
Rogers, A.R., Harpending, H., 1992. Population growth makes waves in thedistribution of pairwise genetic differences. Mol. Biol. Evol. 9, 552–569.
Rose, L.E., Bittner-Eddy, P.D., Langley, C.H., Holub, E.B., Michelmore, R.W., Beynon,J.L., 2004. The maintenance of extreme amino acid diversity at the diseaseresistance gene, RPP13, in Arabidopsis thaliana. Genetics 166, 1517–1527.
Rozas, J., Rozas, R., 1999. DnaSP version 3: an integrated program for molecularpopulation genetics and molecular evolution analysis. Bioinformatics 15, 174–175.
Schmitt, J., 1997. Is photomorphogenic shade avoidance adaptive? perspectivesfrom population biology. Plant Cell Environ. 20, 826–830.
Schmitt, J., Dudley, S.A., Pigliucci, M., 1999. Manipulative approaches to testingadaptive plasticity: Phytochrome-mediated shade-avoidance responses inplants. Am. Nat. 154, S43–S54.
Schmitt, J., McCormac, A.C., Smith, H., 1995. A test of the adaptive plasticityhypothesis using transgenic and mutant plants disabled in phytochrome-mediated elongation responses to neighbors. Am. Nat. 146, 937–953.
Sharbel, T.F., Haubold, B., Mitchell-Olds, T., 2000. Genetic isolation by distance inArabidopsis thaliana: biogeography and postglacial colonization of Europe. Mol.Ecol. 9, 2109–2118.
Sharrock, R., Clack, T., 2004. Heterodimerization of type II phytochromes inArabidopsis. Proc. Natl. Acad. Sci. USA 101, 11500–11505.
Sharrock, R.A., Clack, T., 2002. Patterns of expression and normalized levels of thefive Arabidopsis phytochromes. Plant Physiol. 130, 442–456.
Sharrock, R.A., Clack, T., Goosey, L., 2003a. Differential activities of the ArabidopsisphyB/D/E phytochromes in complementing phyB mutant phenotypes. PlantMol. Biol. 52, 135–142.
Sharrock, R.A., Clack, T., Goosey, L., 2003b. Signaling activities among the ArabidopsisphyB/D/E phytochromes: a major role for the central region of the apoprotein.Plant J. 34, 317–326.
Sharrock, R.A., Quail, P.H., 1989. Novel phytochrome sequences in Arabidopsisthaliana: structure, evolution, and differential expression of a plant regulatoryphotoreceptor family. Genes Dev. 3, 1745–1757.
Shepard, K.A., Purugganan, M.D., 2003. Molecular population genetics of theArabidopsis CLAVATA2 region: The genomic scale of variation and selection ina selfing species. Genetics 163, 1083–1095.
Shinomura, T., Uchida, K., Furuya, M., 2000. Elementary processes ofphotoperception by phytochrome A for high-irradiance response of hypocotylelongation in Arabidopsis. Plant Physiol. 122, 147–156.
Smith, H., 1982. Light quality, photoperception and plant strategy. Ann. Rev. PlantPhysiol. 33, 481–518.
Smith, H., 2000. Phytochromes and light signal perception by plants—an emergingsynthesis. Nature 407, 585–591.
Smith, H., Whitelam, G.C., 1997. The shade avoidance syndrome: Multiple responsesmediated by multiple phytochromes. Plant Cell Environ. 20, 840–844.
Spalding, E.P., Folta, K.M., 2005. Illuminating topics in plant photobiology. Plant CellEnviron. 28, 39–53.
Swofford, D.L., 2002. PAUP*. Phylogenetic Analysis Using Parsimony (*and othermethods). Version 4. Sinauer, Sunderland, Massachusetts.
Tajima, F., 1989. Statistical method for testing the neutral mutation hypothesis byDNA polymorphism. Genetics 123, 585–595.
Takano, M., Kanegae, H., Shinomura, T., Miyao, A., Hirochika, H., Furuya, M., 2001.Isolation and characterization of rice phytochrome A mutants. Plant Cell 13,521–534.
van Tuinen, A.L., Kerckhoffs, H.J., Nagatani, A., Kendrick, R., Koorneef, M., 1995. Far-red light-insensitive, phytochrome A-deficient mutants of tomato. Mol. Gen.Genet. 246, 133–141.
Vander Zwan, C., Brodie, S.A., Campanella, J.J., 2000. The intraspecific phylogeneticsof Arabidopsis thaliana in worldwide populations. Syst. Bot. 25, 47–59.
Wagner, A., 1998. The fate of duplicated genes: loss or new function? Bioessays 20,785–788.
Wagner, J.R., Brunzelle, J.S., Forest, K.T., Vierstra, R.D., 2005. A light-sensing knotrevealed by the structure of the chromophore-binding domain of thephytochrome. Nature 438, 325–331.
Walsh, J.B., 1995. How often do duplicated genes evolve new functions. Genetics139, 421–428.
Whelan, S., Goldman, N., 1999. Distributions of statistics used for the comparison ofmodels of sequence evolution in phylogenetics. Mol. Biol. Evol. 16, 1292–1299.
Whitelam, G.C., Johnson, E., Peng, J., Carol, O., Anderson, M.L., Cowl, J.S., Harberd,N.P., 1993. Phytochrome-A null mutants of Arabidopsis display a wild-typephenotype in white-light. Plant Cell 5, 757–768.
Wong, W.S., Yang, Z., Goldman, N., Nielsen, R., 2004. Accuracy and power ofstatistical methods for detecting adaptive evolution in protein codingsequences and for identifying positively selected sites. Genetics 168, 1041–1051.

S. Mathews, K. McBreen / Molecular Phylogenetics and Evolution 49 (2008) 411–423 423
Wyckoff, G.J., Malcom, C.M., Vallender, E.J., Lahn, B.T., 2005. A highly unexpectedstrong correlation between fixation probability of nonsynonymous mutationsand mutation rate. Trends Genet. 21, 381–385.
Yang, Z., 1997. PAML: a program package for phylogenetic analysis by maximumlikelihood. Comput. Appl. Biosci. 13, 555–556.
Yang, Z., 1998. Likelihood ratio tests for detecting positive selection and applicationto primate lysozyme evolution. Mol. Biol. Evol. 15, 568–573.
Yang, Z., Nielsen, R., 2002. Codon-substitution models for detecting molecularadaptation at individual sites along specific lineages. Mol. Biol. Evol. 19, 908–917.
Yoshida, K., Kamiya, T., Kawabe, A., Miyashita, N.T., 2003. DNA polymorphism at theACAULIS5 locus of the wild plant Arabidopsis thaliana. Genes Genet. Syst. 78, 11–21.
Zhang, J.Z., 2004. Frequent false detection of positive selection by the likelihoodmethod with branch-site models. Mol. Biol. Evol. 21, 1332–1339.
Zwickl, D.J. 2006. Genetic algorithm approaches for the phylogenetic analysis oflarge biological sequence datasets under the maximum likelihood criterion.Ph.D. dissertation, The University of Texas at Austin.