phylogeographic patterns of the aconitum nemorum species group (ranunculaceae) shaped by geological...
TRANSCRIPT
ORIGINAL ARTICLE
Phylogeographic patterns of the Aconitum nemorum species group(Ranunculaceae) shaped by geological and climatic eventsin the Tianshan Mountains and their surroundings
Xiao-Long Jiang • Ming-Li Zhang •
Hong-Xiang Zhang • Stewart C. Sanderson
Received: 9 October 2012 / Accepted: 27 May 2013
� Springer-Verlag Wien 2013
Abstract To investigate the impacts of ancient geologi-
cal and climatic events on the evolutionary history of the
Aconitum nemorum species group, including A. nemorum
s. str., A. karakolicum, and A. soongoricum; a total of 18
natural populations with 146 individuals were sampled,
mainly from grassy slopes or the coniferous forest under-
story of the Tianshan Mountain Range and its surround-
ings. Two cpDNA intergenic spacer regions (trnS-trnG and
psbA-trnH) were sequenced and 16 haplotypes were
identified. These were clustered into three divergent lin-
eages which almost entirely corresponded to the three
species. Analysis of molecular variance indicated restricted
gene flow, mainly among species. High levels of genetic
distance were detected among eastern populations in A.
nemorum s. str. and A. karakolicum from spatial genetic
landscape analysis. Neutral tests and mismatch distribution
analysis suggest that A. nemorum s. str. experienced
demographic expansions during interglacial periods. Based
on haplotype distribution and the median-joining network,
it was inferred that this species underwent two periods of
eastward expansion. Our molecular dating indicates that
the lineages of the complex separated during the period of
the late Tertiary to late Pleistocene (11.74–0.064 million
years ago), which was most likely triggered by recent rapid
uplift of the Tianshan Mountains, while genetic variation at
the intra-specific level might be attributed to climatic
cycles in the late Quaternary.
Keywords Aconitum � Phylogeography � Tianshan
Mountains � Speciation � Glacial refugia �Restricted gene flow
Introduction
Phylogeography, a new discipline which began at 1980s,
plays an important role in connecting population genetics
and phylogenetic systematics (Avise 2000). Since the
recent rapid development of this discipline, it has been
recognized as an appropriate method to detect the present
spatial genetic structures of species and infer the anteced-
ent historical events (Liu et al. 2009; Hardy et al. 2002;
Avise 2000). For example, in Europe and North America,
phylogeographic studies have shown many temperate plant
species to have experienced multiple processes of south
retreat–north colonization in accordance with glacial–
interglacial cycles (Hewitt 2000). Due to complex topog-
raphy and high levels of species diversity, the consideration
of hypotheses on how plant species in mountainous regions
have responded to paleoclimatic changes and geological
events has also attracted numerous botanists and ecologists
Electronic supplementary material The online version of thisarticle (doi:10.1007/s00606-013-0859-x) contains supplementarymaterial, which is available to authorized users.
X.-L. Jiang � M.-L. Zhang (&) � H.-X. Zhang
Key Laboratory of Biogeography and Bioresource in Arid Land,
Xinjiang Institute of Ecology and Geography, Chinese Academy
of Sciences, Urumqi 830011, China
e-mail: [email protected]
X.-L. Jiang � H.-X. Zhang
University of Chinese Academy of Sciences, Beijing 100049,
China
M.-L. Zhang
State Key Laboratory of Systematic and Evolutionary Botany,
Institute of Botany, Chinese Academy of Sciences,
Beijing 100093, China
S. C. Sanderson
Shrub Sciences Laboratory, Intermountain Research Station,
Forest Service, US Department of Agriculture, Utah 84601, USA
123
Plant Syst Evol
DOI 10.1007/s00606-013-0859-x
(Zhou et al. 2012; Liu et al. 2009; Hewitt 2004; Wang et al.
2009; Muellner et al. 2005; Stewart et al. 2010). Many
mountain plants are deemed to have retreated to low alti-
tudes to avoid alpine glaciations (Wulff 1943), although
some cold-tolerant species might have been able to survive
on mountain platforms during glacial periods (Wang et al.
2009). For example, the European distributed, cold-tolerant
species Trollius europaeus experienced migrations to
northern areas even during glacial periods (Espındola et al.
2012).
Among regions harboring multiple genetic haplotypes in
China (Liu et al. 2012), the Qinghai-Tibetan Plateau (QTP)
and adjacent southwestern China, due to an exceptionally
high biodiversity, have been regarded as a study hotspot
(Liu et al. 2009, 2012; Qiu et al. 2011a, 2011b; Zhou et al.
2012; Sun et al. 2010). High species richness and genetic
diversity in this region are associated with rapid uplifting
of the southeastern QTP during the Miocene (Clark et al.
2005) and the Quaternary glacial–interglacial cycles (Cun
and Wang 2010; Jia et al. 2012). For example, Jia et al.
(2012) recently investigated the phylogeographic structure
of Hippophae rhamnoides, showing this species to have
originated in the QTP and dispersed across Eurasia during
the Pliocene and Quaternary.
Attention has now also been directed to the phyloge-
ography of the region of arid Northwestern China, where
the spatial genetic structure and demographical history of a
number of eremophytes have been recently assessed (Meng
and Zhang 2011; Li et al. 2012; Su et al. 2012). Investi-
gating the phylogeographical patterns of these plants can
allow for an understanding of the effects of geological and/
or climatic events on plant species in the area. However,
the forest and grassland species widespread in relatively
humid, high altitude zones of mountain ranges have as yet
been given little focus.
The Tianshan Mountains, located between the Tarim
and Dzungarian basins in Northwestern China, were
mainly formed as a result of the intensive Cenozoic India–
Asia collision (Sun et al. 2004). Although the chronologi-
cal process of this uplift is still in debate, it is believed that
the most recent uplift of the Tianshan Mountains occurred
in the late Tertiary (Sun et al. 2004; Wang 2010). Also,
according to evidence from analysis of palynology and
ancient alpine glaciers (Zhao et al. 2009; Yan et al. 1998),
climatic cycles of cold-dry to warm-humid conditions were
experienced during the late Quaternary in the Tianshan
Mountains. These geological events and climatic changes
are believed to have profoundly affected the genetic
structure and distribution patterns of species. Zhang and
Zhang (2012) showed that cold-dry climates during glacial
periods in these mountains may have triggered specific and
intra-specific divergence within the Delphinium naviculare
species group.
The Quaternary climatic oscillations were generally
more recent than the divergence between species. For
example, uplifts in the QTP during the early Miocene to
Pliocene promoted speciation in Cupressus (Xu et al.
2010a). Considering the timescale of the uplift of the
Tianshan Mountains, we study the phylogeography of the
Aconitum nemorum species group, containing A. nemorum
s. str., A. soongoricum, and A. karakolicum, mainly
occurring in the forest understory, on grassy slopes, and
along mountain streams, to provide new perspectives on
the evolutionary history of this species group in relation to
events in this area. These taxa belong to Series Grandi-
tuberosa Steinb. of Aconitum, which have been shown to
be monophyletic and have obvious morphological discon-
tinuities (Luo et al. 2005) based on characters of the fol-
licles and seeds. The seeds are released when the ventral
suture dehisces, and their distance of dispersal is small
(Guan et al. 1979). This limited dispersal ability would lead
to lower levels of gene flow among and within the species.
Therefore, we attempt to study phylogeography of this
multi-species group employing two cpDNA noncoding
regions, which are maternally inherited and non-recom-
bining in most flowering plants (Schaal et al. 1998). We
address the following two issues: (1) inference of the
spatial genetic structure of the A. nemorum species group
and (2) effects that the Tianshan Mountains uplift and
Quaternary glaciations in Northwestern China may have
had on shaping this structure.
Materials and methods
Taxon and population sampling
A total of 146 individuals from 18 natural populations,
including 6 populations (48 samples) of A. nemorum s. str.,
9 populations (72 samples) of A. soongoricum, and 3
populations (26 samples) of A. karakolicum, were collected
in this study (Table 1). Our sampling locations covered
most of the range of the A. nemorum species group in
China. The latitude, longitude, and altitude of each locality
were recorded using a global positioning system (GPS). To
avoid the collection of clones, we sampled individuals
separated by at least 50 m. Leaves were sampled randomly
and quickly dried with silica gel and stored frozen until
extraction. Voucher specimens of each individual were
deposited in the Herbarium of Xinjiang Institute of Ecol-
ogy and Geography, Chinese Academy of Science (XJBI).
Laboratory procedures
Total genomic DNA was extracted from dried leaf tissue
following a modified cetyltrimethyl ammonium bromide
X.-L. Jiang et al.
123
(CTAB) protocol (Doyle and Doyle 1987). To get a pre-
liminary screen of chloroplast variation, 8 universal prim-
ers were used initially for 18 samples from 18 natural
localities. Two chloroplast regions, psbA-trnH (Sang et al.
1997) and trnS-trnG (Hamilton 1999), were found to dis-
play more variations than the other six markers examined
(trnL–trnF, atpB–abcL, rps16–trnK, psbK–psbA, ycf6–
psbM, and rps12–rpl20). We then performed amplifications
on all individuals using these two pairs of primers. Poly-
merase chain reaction (PCR) amplifications were carried
out in 30 ll reaction volumes consisting of 1.5 ll of
109 PCR buffer (Takara, Japan), 2 ll of 25 mM MgCl2,
1.8 ll of each primer (Sangon, Shanghai, China) at 50 ng/ll,
3 ll of 2.5 mM dNTP solution in an equimolar ratio,
0.46 ll of Taq DNA polymerase (5 U/ll, Takara, Japan),
and 0.5 ll of genomic DNA (10–100 lg). Amplification
using these primers began with an initial hotstart at 95 �C
for 4 min, followed by 30 cycles of denaturation at 94 �C
for 30 s, annealing at 52 �C for 30 s, extension at 72 �C for
90 s, and a final extension at 72 �C for 10 min. Amplification
products were purified, and sequenced by a commercial
laboratory (Shanghai Sangon Biological Engineering Technol-
ogy & Service, Shanghai, China).
Nucleotide sequences were edited in Seqman (Laser-
gene, DNASTAR Inc., Madison, Wisconsin, USA), and
aligned using ClustalX version 1.81 (Thompson et al.
1997) with default parameters, and then refined manually.
The cpDNA haplotypes were identified based on nucleotide
variations in the species examined (see below). They are
deposited in GenBank database (GenBank accession no.:
KC837082–KC837094 and KC837096 for psbA-trnH, and
accession no.: KC837076–KC837080 for trnS-trnG).
Genetic diversity and phylogeographic structure
analysis
The plastid (cpDNA) haplotypes and polymorphic sites
were assessed for the concatenated alignment sequences of
146 individuals of the A. nemorum species group using
DnaSP 5.0 (Librado and Rozas 2009). Estimations of
population genetic indexes [haplotypes diversities (h),
nucleotide diversity (p) and analysis of molecular variance
(AMOVA)] were computed in Arlequin 3.1 (Excoffier
et al. 2005). Three groups based on these taxa were pre-
specified in the AMOVA analysis. A median-joining net-
work (Bandelt et al. 1999) was constructed using the pro-
gram Network 4.6.1.0 (available at http://www.fluxus-
engineering.com/sharenet_rn.htm) to evaluate phylogenetic
relationships among haplotypes. Possible historical demo-
graphic expansions of the three species were examined
using the Tajima D test (Tajima 1989) and Fs test of Fu
(1997). D values significantly different from 0 are usually
correlated with selection, bottlenecks, or population
expansion, and a significantly negative F’s value indicates
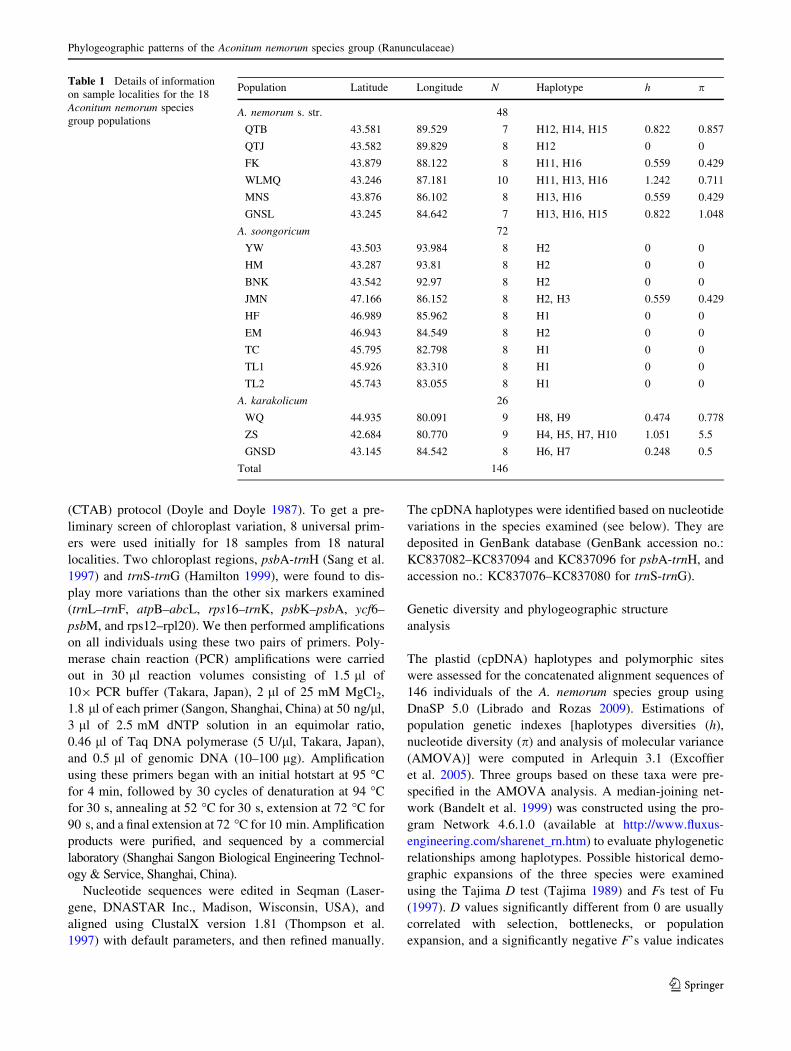
Table 1 Details of information
on sample localities for the 18
Aconitum nemorum species
group populations
Population Latitude Longitude N Haplotype h p
A. nemorum s. str. 48
QTB 43.581 89.529 7 H12, H14, H15 0.822 0.857
QTJ 43.582 89.829 8 H12 0 0
FK 43.879 88.122 8 H11, H16 0.559 0.429
WLMQ 43.246 87.181 10 H11, H13, H16 1.242 0.711
MNS 43.876 86.102 8 H13, H16 0.559 0.429
GNSL 43.245 84.642 7 H13, H16, H15 0.822 1.048
A. soongoricum 72
YW 43.503 93.984 8 H2 0 0
HM 43.287 93.81 8 H2 0 0
BNK 43.542 92.97 8 H2 0 0
JMN 47.166 86.152 8 H2, H3 0.559 0.429
HF 46.989 85.962 8 H1 0 0
EM 46.943 84.549 8 H2 0 0
TC 45.795 82.798 8 H1 0 0
TL1 45.926 83.310 8 H1 0 0
TL2 45.743 83.055 8 H1 0 0
A. karakolicum 26
WQ 44.935 80.091 9 H8, H9 0.474 0.778
ZS 42.684 80.770 9 H4, H5, H7, H10 1.051 5.5
GNSD 43.145 84.542 8 H6, H7 0.248 0.5
Total 146
Phylogeographic patterns of the Aconitum nemorum species group (Ranunculaceae)
123
a recent demographic expansion. Mismatch distribution
analysis (Schneider and Excoffier 1999) was also used to
infer the demographic histories of the species. Unimodal
pairwise mismatch distributions indicate that populations
have experienced recent demographic expansion, while
multimodal distributions are related to demographic equi-
librium or decline (Slatkin and Hudson 1991; Rogers and
Harpending 1992). Raggedness index (r) and P values were
computed to test the significance of the population
expansion model. All these analyses were conducted in
Arlequin 3.1 (Excoffier et al. 2005). We estimated the
expansion time for lineages using the equation s = 2ut
(where s is the time in number of generations elapsed since
the sudden expansion episode, u the mutation rate per
generation for the total length of analyzed sequence, and
t is the time measured in generations). Values of u were
calculated in equation u = 2lkg, where l is the mutation
rate per nucleotide site per year (s/s/y), k the length of the
cpDNA fragment, and g is the generation time in years.
According to the average substitution rates of cpDNA
genes in Angiosperms, we used a range of the mutation rate
from 1.0 9 10-9 to 3.0 9 10-9 s/s/y (Wolfe et al. 1987) to
estimate the expansion time. We used 2 years as the gen-
eration time in accordance with previous studies (Li 1995).
To determine possible genetic discontinuities among
populations within species, a genetic landscape shape
analysis was carried out using Alleles in Space (AIS)
(Miller 2005) for each species. First, a connectivity net-
work was generated on the basis of the geographic coor-
dinates of sampling locations using the Delaunay
triangulation rule (Brouns et al. 2003; Watson 1992). Then,
the connectivity network was combined with the genetic
distance matrix to form a landscape shape interpolation.
The result of this procedure is a three-dimensional surface
plot where x- and y-axes are equivalent to population
geographical coordinates and the z-axis is genetic distance.
Phylogenetic analysis and estimation of divergence
times
We reconstructed phylogenetic relationships of the haplo-
types in the A. nemorum species group using two methods,
maximum likelihood (ML) and Bayesian inference (BI).
We chose Aconitum gymnandrum, Consolida ajacis, and
Delphinium elatum as outgroups for the study. The cpDNA
sequences of C. ajacis (GenBank accession no.: AF216578
for psbA-trnH and accession no.: JF331819 for trnS-trnG)
and A. gymnandrum (GenBank accession no.: FJ418150.1
for psbA-trnH and accession no.: JF331856.1 for trnS-
trnG) were downloaded from the GenBank database, and
those of D. elatum (GenBank accession no.: KC837095 for
psbA-trnH and accession no.: KC837081 for trnS-trnG)
were obtained in this study.
PhyML 3.0 (Guindon et al. 2010) was used to perform
the ML analysis. A HKY ? I model of substitution was
selected by Modeltest 3.7 (Posada and Crandall 1998) using
the Akaike information criterion (AIC) (Kelchner and
Thomas 2007). This model was also used in BI and BEAST
analysis (see below). To evaluate clade support values,
1,000 replicates of bootstrap analysis were performed. BI
analyses were carried out in MrBayes 3.2 (Ronquist et al.
2012). A Markov chain Monte Carlo (MCMC) was run for
20 million generations with two parallel searches using four
chains, each starting with a random tree. Trees were sam-
pled every 1,000 generations and the first 10 % was dis-
carded as burn-in. Tracer 1.5 (Rambaut and Drummond
2007) was used to check whether the log likelihood (lnL) of
sampled trees reached a stationary distribution.
As fossil record and specific substitution rates in Aco-
nitum were lacking, we used the range of the synonymous
substitution rates of cpDNA genes (1.0–3.0 9 10-9 s/s/y)
(Wolfe et al. 1987) to estimate divergence time.
BEAST version 1.6.1 (Drummond and Rambaut 2007)
was used to estimate dates of lineage divergence. To
choose optimal parameters for the BEAST analysis, an
initial MCMC was run for 20 million generations using an
uncorrelated lognormal clock model and a constant popu-
lation size. TRACER version 1.5 (Rambaut and Drum-
mond 2007) was used to examine the parameter ucld.stdev
and whether it was greater than 1 or close to 0. A parameter
value greater than 1 would suggest that our data was
appropriate for a relaxed molecular clock model. The final
MCMC was run for 20 million generations with sampling
every 1,000 generations. Two independent runs achieved
the same results. The effective sample sizes (ESS) of each
parameter from TRACER version 1.5 were required to
have values greater than 200. The maximum clade credi-
bility (MCC) tree was generated using TreeAnnotator
version 1.6.1 (Drummond and Rambaut 2007).
Results
Sequence diversity and haplotype distribution
The lengths of the psbA-trnH and trnS-trnG sequences
were 268 and 739 bp, respectively. A total of 13 nucleotide
substitutions and 14 indels/inserts were found in the con-
catenated psbA-trnH and trnS-trnG sequences (Table S1).
According to the presence of nucleotide substitutions and
indels, a total of 16 haplotypes were identified in the 18
populations, including 6 haplotypes (H11, H12, H13, H14
H15, H16) in A. nemorum s. str., 3 (H1, H2, H3) in A.
soongoricum, and 7 (H4, H5, H6, H7, H8, H9, H10) in A.
karakolicum (Table S1; Fig. 1). No haplotypes were shared
among any of the three species. The nucleotide
X.-L. Jiang et al.
123
composition of the two cpDNA spacers consisted of A
(32.67 %), T (36.67 %), G (14.39 %), and C (16.27 %).
The intra-population haplotype diversity (h) and nucleotide
diversity (p) of A. soongoricum were 0, expectation for
population JMN was 0.559 and 0.429, respectively; A.
nemorum s. str. and A. karakolicum had high intra-popu-
lation haplotype diversity (h) and nucleotide diversity (p),
except for the QTJ and GNSD populations (Table 1).
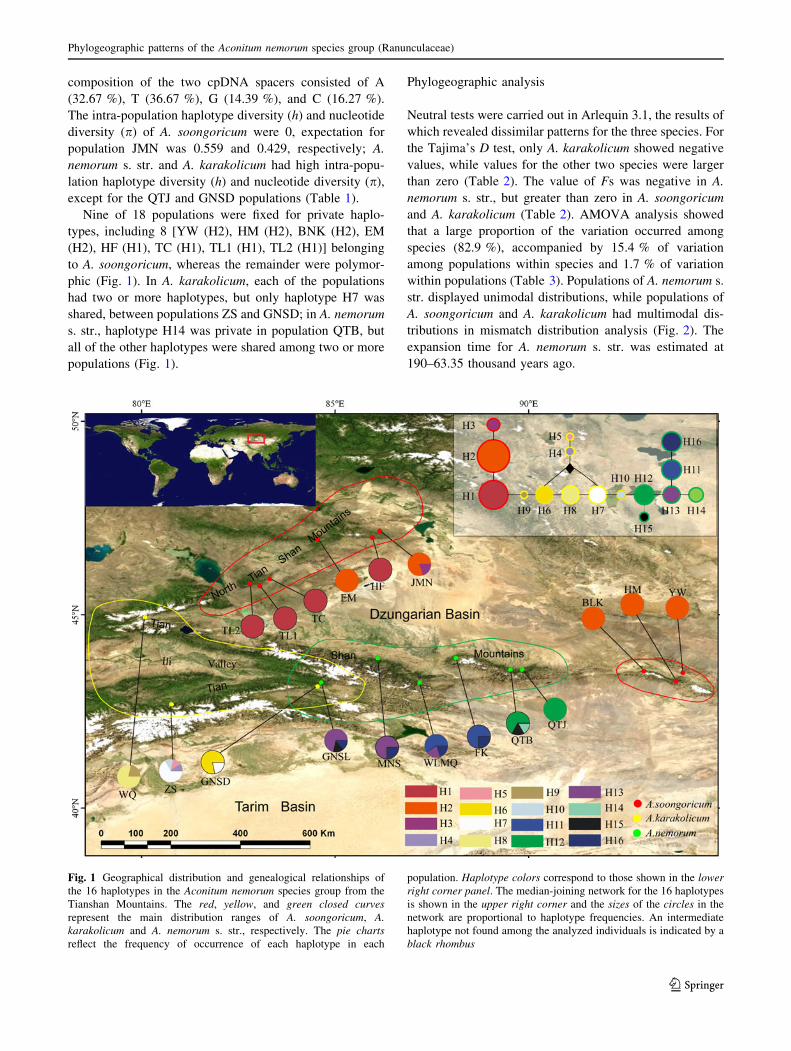
Nine of 18 populations were fixed for private haplo-
types, including 8 [YW (H2), HM (H2), BNK (H2), EM
(H2), HF (H1), TC (H1), TL1 (H1), TL2 (H1)] belonging
to A. soongoricum, whereas the remainder were polymor-
phic (Fig. 1). In A. karakolicum, each of the populations
had two or more haplotypes, but only haplotype H7 was
shared, between populations ZS and GNSD; in A. nemorum
s. str., haplotype H14 was private in population QTB, but
all of the other haplotypes were shared among two or more
populations (Fig. 1).
Phylogeographic analysis
Neutral tests were carried out in Arlequin 3.1, the results of
which revealed dissimilar patterns for the three species. For
the Tajima’s D test, only A. karakolicum showed negative
values, while values for the other two species were larger
than zero (Table 2). The value of Fs was negative in A.
nemorum s. str., but greater than zero in A. soongoricum
and A. karakolicum (Table 2). AMOVA analysis showed
that a large proportion of the variation occurred among
species (82.9 %), accompanied by 15.4 % of variation
among populations within species and 1.7 % of variation
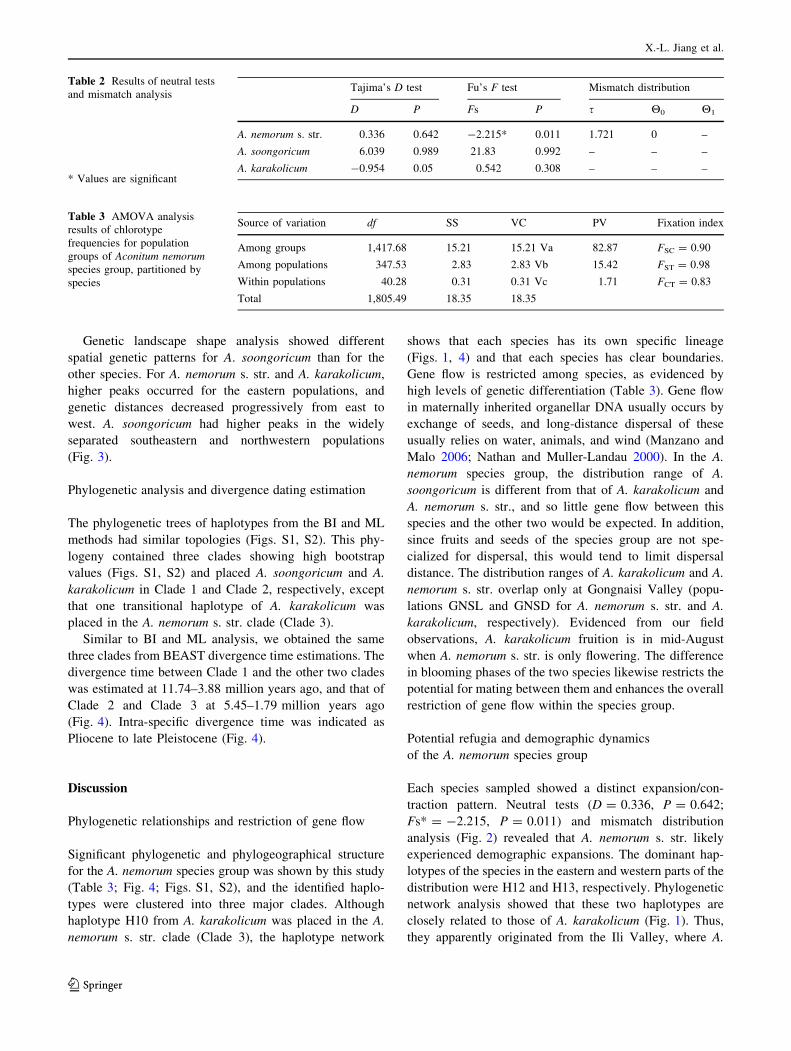
within populations (Table 3). Populations of A. nemorum s.
str. displayed unimodal distributions, while populations of
A. soongoricum and A. karakolicum had multimodal dis-
tributions in mismatch distribution analysis (Fig. 2). The
expansion time for A. nemorum s. str. was estimated at
190–63.35 thousand years ago.
Fig. 1 Geographical distribution and genealogical relationships of
the 16 haplotypes in the Aconitum nemorum species group from the
Tianshan Mountains. The red, yellow, and green closed curves
represent the main distribution ranges of A. soongoricum, A.
karakolicum and A. nemorum s. str., respectively. The pie charts
reflect the frequency of occurrence of each haplotype in each
population. Haplotype colors correspond to those shown in the lower
right corner panel. The median-joining network for the 16 haplotypes
is shown in the upper right corner and the sizes of the circles in the
network are proportional to haplotype frequencies. An intermediate
haplotype not found among the analyzed individuals is indicated by a
black rhombus
Phylogeographic patterns of the Aconitum nemorum species group (Ranunculaceae)
123
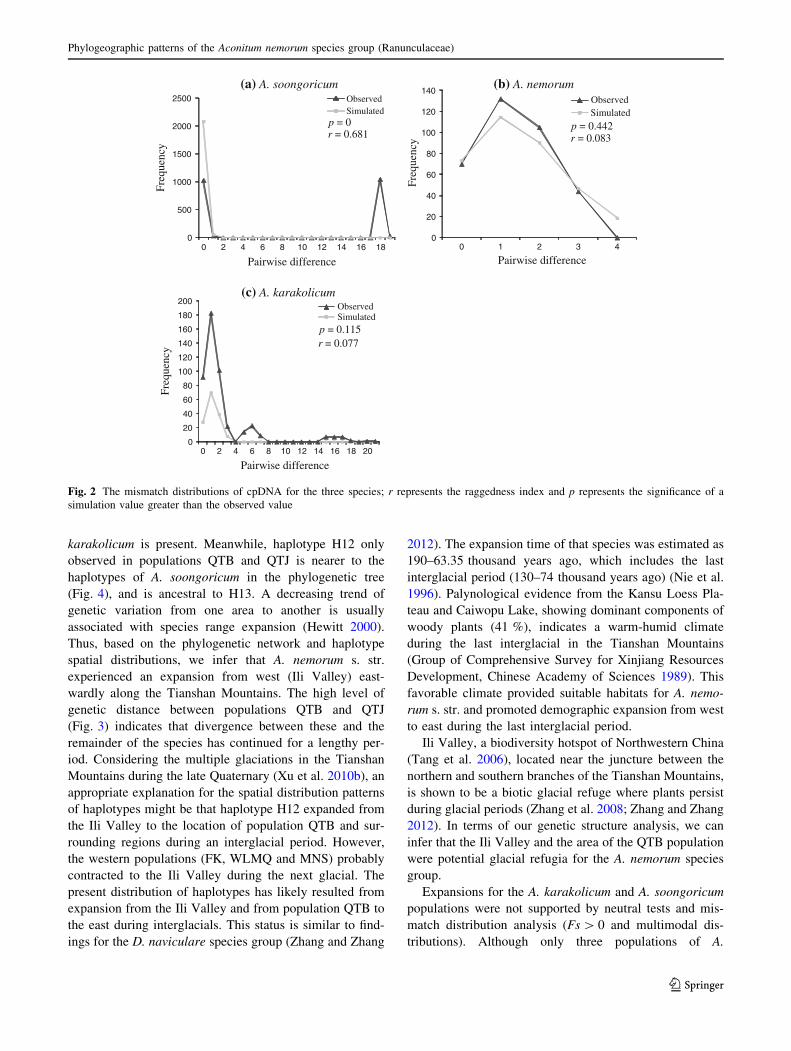
Genetic landscape shape analysis showed different
spatial genetic patterns for A. soongoricum than for the
other species. For A. nemorum s. str. and A. karakolicum,
higher peaks occurred for the eastern populations, and
genetic distances decreased progressively from east to
west. A. soongoricum had higher peaks in the widely
separated southeastern and northwestern populations
(Fig. 3).
Phylogenetic analysis and divergence dating estimation
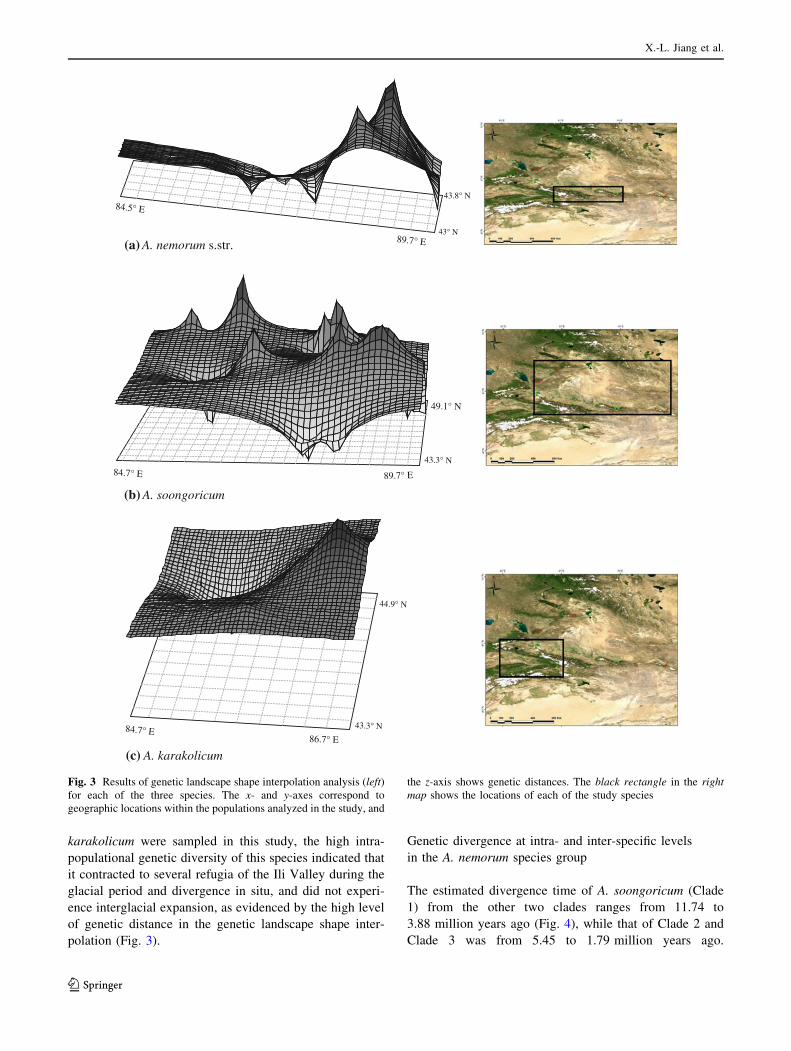
The phylogenetic trees of haplotypes from the BI and ML
methods had similar topologies (Figs. S1, S2). This phy-
logeny contained three clades showing high bootstrap
values (Figs. S1, S2) and placed A. soongoricum and A.
karakolicum in Clade 1 and Clade 2, respectively, except
that one transitional haplotype of A. karakolicum was
placed in the A. nemorum s. str. clade (Clade 3).
Similar to BI and ML analysis, we obtained the same
three clades from BEAST divergence time estimations. The
divergence time between Clade 1 and the other two clades
was estimated at 11.74–3.88 million years ago, and that of
Clade 2 and Clade 3 at 5.45–1.79 million years ago
(Fig. 4). Intra-specific divergence time was indicated as
Pliocene to late Pleistocene (Fig. 4).
Discussion
Phylogenetic relationships and restriction of gene flow
Significant phylogenetic and phylogeographical structure
for the A. nemorum species group was shown by this study
(Table 3; Fig. 4; Figs. S1, S2), and the identified haplo-
types were clustered into three major clades. Although
haplotype H10 from A. karakolicum was placed in the A.
nemorum s. str. clade (Clade 3), the haplotype network
shows that each species has its own specific lineage
(Figs. 1, 4) and that each species has clear boundaries.
Gene flow is restricted among species, as evidenced by
high levels of genetic differentiation (Table 3). Gene flow
in maternally inherited organellar DNA usually occurs by
exchange of seeds, and long-distance dispersal of these
usually relies on water, animals, and wind (Manzano and
Malo 2006; Nathan and Muller-Landau 2000). In the A.
nemorum species group, the distribution range of A.
soongoricum is different from that of A. karakolicum and
A. nemorum s. str., and so little gene flow between this
species and the other two would be expected. In addition,
since fruits and seeds of the species group are not spe-
cialized for dispersal, this would tend to limit dispersal
distance. The distribution ranges of A. karakolicum and A.
nemorum s. str. overlap only at Gongnaisi Valley (popu-
lations GNSL and GNSD for A. nemorum s. str. and A.
karakolicum, respectively). Evidenced from our field
observations, A. karakolicum fruition is in mid-August
when A. nemorum s. str. is only flowering. The difference
in blooming phases of the two species likewise restricts the
potential for mating between them and enhances the overall
restriction of gene flow within the species group.
Potential refugia and demographic dynamics
of the A. nemorum species group
Each species sampled showed a distinct expansion/con-
traction pattern. Neutral tests (D = 0.336, P = 0.642;
Fs* = -2.215, P = 0.011) and mismatch distribution
analysis (Fig. 2) revealed that A. nemorum s. str. likely
experienced demographic expansions. The dominant hap-
lotypes of the species in the eastern and western parts of the
distribution were H12 and H13, respectively. Phylogenetic
network analysis showed that these two haplotypes are
closely related to those of A. karakolicum (Fig. 1). Thus,
they apparently originated from the Ili Valley, where A.
Table 2 Results of neutral tests
and mismatch analysis
* Values are significant
Tajima’s D test Fu’s F test Mismatch distribution
D P Fs P s H0 H1
A. nemorum s. str. 0.336 0.642 -2.215* 0.011 1.721 0 –
A. soongoricum 6.039 0.989 21.83 0.992 – – –
A. karakolicum -0.954 0.05 0.542 0.308 – – –
Table 3 AMOVA analysis
results of chlorotype
frequencies for population
groups of Aconitum nemorum
species group, partitioned by
species
Source of variation df SS VC PV Fixation index
Among groups 1,417.68 15.21 15.21 Va 82.87 FSC = 0.90
Among populations 347.53 2.83 2.83 Vb 15.42 FST = 0.98
Within populations 40.28 0.31 0.31 Vc 1.71 FCT = 0.83
Total 1,805.49 18.35 18.35
X.-L. Jiang et al.
123
karakolicum is present. Meanwhile, haplotype H12 only
observed in populations QTB and QTJ is nearer to the
haplotypes of A. soongoricum in the phylogenetic tree
(Fig. 4), and is ancestral to H13. A decreasing trend of
genetic variation from one area to another is usually
associated with species range expansion (Hewitt 2000).
Thus, based on the phylogenetic network and haplotype
spatial distributions, we infer that A. nemorum s. str.
experienced an expansion from west (Ili Valley) east-
wardly along the Tianshan Mountains. The high level of
genetic distance between populations QTB and QTJ
(Fig. 3) indicates that divergence between these and the
remainder of the species has continued for a lengthy per-
iod. Considering the multiple glaciations in the Tianshan
Mountains during the late Quaternary (Xu et al. 2010b), an
appropriate explanation for the spatial distribution patterns
of haplotypes might be that haplotype H12 expanded from
the Ili Valley to the location of population QTB and sur-
rounding regions during an interglacial period. However,
the western populations (FK, WLMQ and MNS) probably
contracted to the Ili Valley during the next glacial. The
present distribution of haplotypes has likely resulted from
expansion from the Ili Valley and from population QTB to
the east during interglacials. This status is similar to find-
ings for the D. naviculare species group (Zhang and Zhang
2012). The expansion time of that species was estimated as
190–63.35 thousand years ago, which includes the last
interglacial period (130–74 thousand years ago) (Nie et al.
1996). Palynological evidence from the Kansu Loess Pla-
teau and Caiwopu Lake, showing dominant components of
woody plants (41 %), indicates a warm-humid climate
during the last interglacial in the Tianshan Mountains
(Group of Comprehensive Survey for Xinjiang Resources
Development, Chinese Academy of Sciences 1989). This
favorable climate provided suitable habitats for A. nemo-
rum s. str. and promoted demographic expansion from west
to east during the last interglacial period.
Ili Valley, a biodiversity hotspot of Northwestern China
(Tang et al. 2006), located near the juncture between the
northern and southern branches of the Tianshan Mountains,
is shown to be a biotic glacial refuge where plants persist
during glacial periods (Zhang et al. 2008; Zhang and Zhang
2012). In terms of our genetic structure analysis, we can
infer that the Ili Valley and the area of the QTB population
were potential glacial refugia for the A. nemorum species
group.
Expansions for the A. karakolicum and A. soongoricum
populations were not supported by neutral tests and mis-
match distribution analysis (Fs [ 0 and multimodal dis-
tributions). Although only three populations of A.
0
500
1000
1500
2000
2500
0 2 4 6 8 10 12 14 16 18
ObservedSimulated
0
20
40
60
80
100
120
140
0 1 2 3 4
ObservedSimulated
0
20
40
60
80
100
120
140
160
180
200
0 2 4 6 8 10 12 14 16 18 20
ObservedSimulated
(a) A. soongoricum (b) A. nemorum
(c) A. karakolicum
Freq
uenc
y
Pairwise difference
Freq
uenc
y
Pairwise difference
Pairwise difference
Freq
uenc
y
p = 0r = 0.681
p = 0.442 r = 0.083
p = 0.115r = 0.077
Fig. 2 The mismatch distributions of cpDNA for the three species; r represents the raggedness index and p represents the significance of a
simulation value greater than the observed value
Phylogeographic patterns of the Aconitum nemorum species group (Ranunculaceae)
123
karakolicum were sampled in this study, the high intra-
populational genetic diversity of this species indicated that
it contracted to several refugia of the Ili Valley during the
glacial period and divergence in situ, and did not experi-
ence interglacial expansion, as evidenced by the high level
of genetic distance in the genetic landscape shape inter-
polation (Fig. 3).
Genetic divergence at intra- and inter-specific levels
in the A. nemorum species group
The estimated divergence time of A. soongoricum (Clade
1) from the other two clades ranges from 11.74 to
3.88 million years ago (Fig. 4), while that of Clade 2 and
Clade 3 was from 5.45 to 1.79 million years ago.
43° N
84.5° E
89.7° E
43.8° N
84.7° E
43.3° N
49.1° N
89.7° E
84.7° E
44.9° N
43.3° N
86.7° E
(a) A. nemorum s.str.
(b) A. soongoricum
(c) A. karakolicum
Fig. 3 Results of genetic landscape shape interpolation analysis (left)
for each of the three species. The x- and y-axes correspond to
geographic locations within the populations analyzed in the study, and
the z-axis shows genetic distances. The black rectangle in the right
map shows the locations of each of the study species
X.-L. Jiang et al.
123
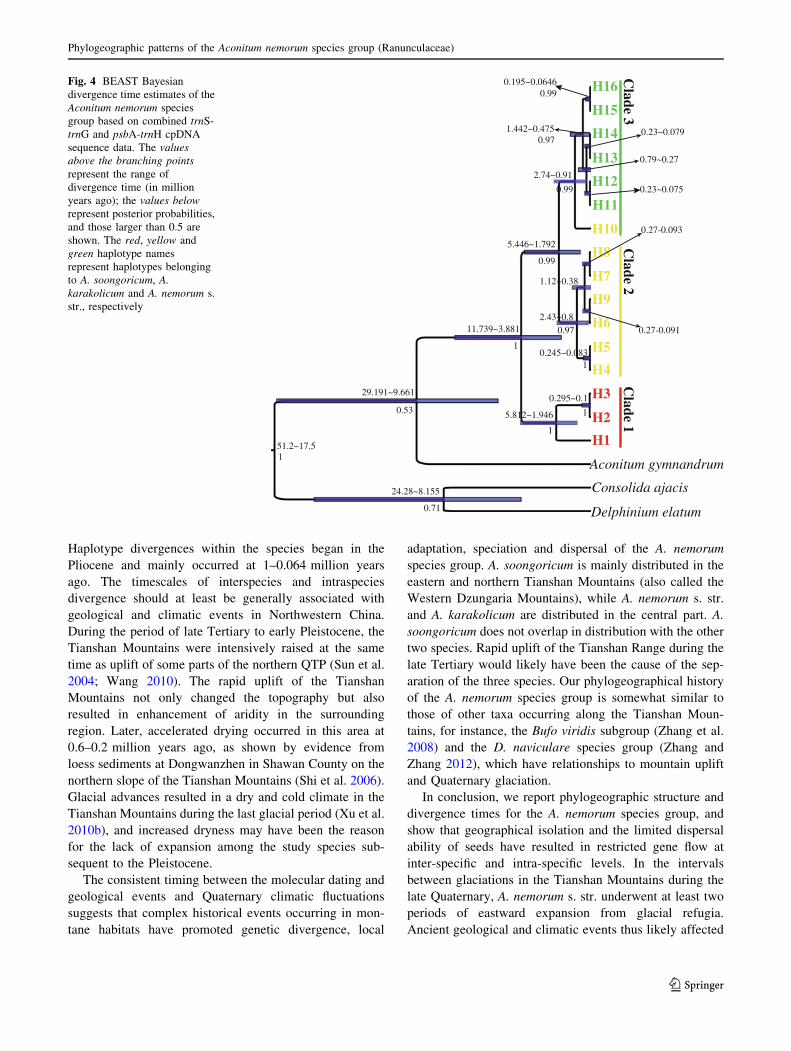
Haplotype divergences within the species began in the
Pliocene and mainly occurred at 1–0.064 million years
ago. The timescales of interspecies and intraspecies
divergence should at least be generally associated with
geological and climatic events in Northwestern China.
During the period of late Tertiary to early Pleistocene, the
Tianshan Mountains were intensively raised at the same
time as uplift of some parts of the northern QTP (Sun et al.
2004; Wang 2010). The rapid uplift of the Tianshan
Mountains not only changed the topography but also
resulted in enhancement of aridity in the surrounding
region. Later, accelerated drying occurred in this area at
0.6–0.2 million years ago, as shown by evidence from
loess sediments at Dongwanzhen in Shawan County on the
northern slope of the Tianshan Mountains (Shi et al. 2006).
Glacial advances resulted in a dry and cold climate in the
Tianshan Mountains during the last glacial period (Xu et al.
2010b), and increased dryness may have been the reason
for the lack of expansion among the study species sub-
sequent to the Pleistocene.
The consistent timing between the molecular dating and
geological events and Quaternary climatic fluctuations
suggests that complex historical events occurring in mon-
tane habitats have promoted genetic divergence, local
adaptation, speciation and dispersal of the A. nemorum
species group. A. soongoricum is mainly distributed in the
eastern and northern Tianshan Mountains (also called the
Western Dzungaria Mountains), while A. nemorum s. str.
and A. karakolicum are distributed in the central part. A.
soongoricum does not overlap in distribution with the other
two species. Rapid uplift of the Tianshan Range during the
late Tertiary would likely have been the cause of the sep-
aration of the three species. Our phylogeographical history
of the A. nemorum species group is somewhat similar to
those of other taxa occurring along the Tianshan Moun-
tains, for instance, the Bufo viridis subgroup (Zhang et al.
2008) and the D. naviculare species group (Zhang and
Zhang 2012), which have relationships to mountain uplift
and Quaternary glaciation.
In conclusion, we report phylogeographic structure and
divergence times for the A. nemorum species group, and
show that geographical isolation and the limited dispersal
ability of seeds have resulted in restricted gene flow at
inter-specific and intra-specific levels. In the intervals
between glaciations in the Tianshan Mountains during the
late Quaternary, A. nemorum s. str. underwent at least two
periods of eastward expansion from glacial refugia.
Ancient geological and climatic events thus likely affected
H2
H1
H4
H3
H11
H10
H9
H8
H7
H6
H5
H16
H15
H12
H14
H13
Aconitum gymnandrum
Consolida ajacis
Delphinium elatum
0.53
51.2~17.5
29.191~9.661
0.97
1
0.99
1
1
1
1
0.71
0.99
24.28~8.155
11.739~3.881
5.446~1.792
5.812~1.946
2.74~0.91
1.442~0.4750.97
0.195~0.06460.99
0.295~0.1
0.23~0.079
0.23~0.075
0.79~0.27
0.27-0.091
0.27-0.093
1.12~0.38
2.43~0.8
0.245~0.083
Clade 1
Clade 2
Clade 3
Fig. 4 BEAST Bayesian
divergence time estimates of the
Aconitum nemorum species
group based on combined trnS-
trnG and psbA-trnH cpDNA
sequence data. The values
above the branching points
represent the range of
divergence time (in million
years ago); the values below
represent posterior probabilities,
and those larger than 0.5 are
shown. The red, yellow and
green haplotype names
represent haplotypes belonging
to A. soongoricum, A.
karakolicum and A. nemorum s.
str., respectively
Phylogeographic patterns of the Aconitum nemorum species group (Ranunculaceae)
123
the evolution and current distribution of the A. nemorum
species group. Genetic divergence among the three species
from late Tertiary to early Quaternary appears to have been
driven principally by rapid uplift of the Tianshan Moun-
tains. The cold-dry to warm-humid climatic cycles during
the late Quaternary are inferred to have promoted genetic
divergence within the species.
Acknowledgments We are grateful to Kai-Qing Xie and Jian Zhang
in Shihezi University for help in the material collection. Two anon-
ymous reviewers and Dr. Isabel Sanmartin are deeply grateful for
their helpful comment and suggestion on the manuscript. Funding was
provided by CAS Important Direction for Knowledge Innovation
Project (No. KZCX2-EW-305), and Xinjiang Institute of Ecology and
Geography, Chinese Academy of Sciences.
References
Avise JC (2000) Phylogeography: the history and formation of
species. Harvard University Press, Cambridge
Bandelt HJ, Forster P, Rohl A (1999) Median-joining networks for
inferring intraspecific phylogenies. Mol Biol Evol 16:37–48
Brouns G, De Wulf A, Constales D (2003) Delaunay triangulation
algorithms useful for multibeam echosounding. J Surv Eng-Asce
129:79–84
Clark MK, House MA, Royden LH, Whipple KX, Burchfiel BC,
Zhang X, Tang W (2005) Late Cenozoic uplift of southeastern
Tibet. Geol 33:525–528
Cun YZ, Wang XQ (2010) Plant recolonization in the Himalaya from
the southeastern Qinghai-Tibetan Plateau: geographical isolation
contributed to high population differentiation. Mol Phylogenet
Evol 56:972–982
Doyle JJ, Doyle JL (1987) A rapid DNA isolation procedure for small
quantities of fresh leaf tissue. Phytochem Bull 19:11–15
Drummond AJ, Rambaut A (2007) BEAST: bayesian evolutionary
analysis by sampling trees. BMC Evol Biol 7:214
Espındola A, Pellissier L, Maiorano L, Hordijk W, Guisan A, Alvarez
N (2012) Predicting present and future intra-specific genetic
structure through niche hindcasting across 24 millennia. Ecol
Lett 15:649–657
Excoffier L, Laval G, Schneider S (2005) Arlequin (version 3.0): an
integrated software package for population genetics data anal-
ysis. Evol Bioinform 1:47–50
Fu YX (1997) Statistical tests of neutrality of mutations against
population growth, hitchhiking and background selection.
Genetics 147:915–925
Group of Comprehensive Survey for Xinjiang Resources Develop-
ment, Chinese Academy of Sciences (1989) Geology and
environment in the Quaternary period in Xinxjiang. China
Agriculture Press, Beijing
Guan KJ, Xiao PG, Wang WC, Pang KY (1979) Flora of China, vol
27. Science Press, Beijing
Guindon S, Dufayard J-F, Lefort V, Anisimova M, Hordijk W,
Gascuel O (2010) New algorithms and methods to estimate
maximum-likelihood phylogenies: assessing the performance of
PhyML 3.0. Syst Biol 59:307–321
Hamilton MB (1999) Four primer pairs for the amplification of
chloroplast intergenic regions with intraspecific variation. Mol
Ecol 8:521–523
Hardy ME, Grady JM, Routman EJ (2002) Intraspecific phylogeog-
raphy of the slender madtom: the complex evolutionary history
of the Central Highlands of the United States. Mol Ecol
11:2393–2403
Hewitt G (2000) The genetic legacy of the Quaternary ice ages.
Nature 405:907–913
Hewitt G (2004) Genetic consequences of climatic oscillations in the
Quaternary. Philos T Roy Soc B 359:183–195
Jia DR, Abbott RJ, Liu TL, Mao KS, Bartish IV, Liu JQ (2012) Out of
the Qinghai-Tibet Plateau: evidence for the origin and dispersal
of Eurasian temperate plants from a phylogeographic study of
Hippophae rhamnoides (Elaeagnaceae). New Phytol
194:1123–1133
Kelchner SA, Thomas MA (2007) Model use in phylogenetics: nine
key questions. Trends Ecol Evol 22:87–94
Li LQ (1995) The geographical distribution of Subfam. Helleboroi-
deae (Ranunculaceae). Acta Phytotaxon Sin 33:537–555
Li ZH, Chen J, Zhao GF, Guo YP, Kou YX, Ma YZ, Wang G, Ma XF
(2012) Response of a desert shrub to past geological and climatic
change: a phylogeographic study of Reaumuria soongarica
(Tamaricaceae) in western China. J Syst Evol 50:351–361
Librado P, Rozas J (2009) DnaSP v5: a software for comprehensive
analysis of DNA polymorphism data. Bioinformatics 25:1451–1452
Liu YF, Wang Y, Huang HW (2009) Species-level phylogeographical
history of Myricaria plants in the mountain ranges of western
China and the origin of M. laxiflora in the Three Gorges
mountain region. Mol Ecol 18:2700–2712
Liu JQ, Sun YS, Ge XJ, Gao LM, Qiu YX (2012) Phylogeographic
studies of plants in China: advances in the past and directions in
the future. J Syst Evol 50:267–275
Luo Y, Zhang F, Yang QE (2005) Phylogeny of Aconitum subgenus
Aconitum (Ranunculaceae) inferred from ITS sequences. Plant
Syst Evol 252(1–2):11–25
Manzano P, Malo JE (2006) Extreme long-distance seed dispersal via
sheep. Front Ecol Enviro 4:244–248
Meng HH, Zhang ML (2011) Phylogeography of Lagochilus ilicifo-
lius (Lamiaceae) in relation to Quaternary climatic oscillation
and aridification in northern China. Biochem Syst Ecol
39:787–796
Miller MP (2005) Alleles In Space (AIS): computer software for the
joint analysis of interindividual spatial and genetic information.
J Hered 96:722–724
Muellner AN, Tremetsberger K, Stuessy T, Baeza CM (2005)
Pleistocene refugia and recolonization routes in the southern
Andes: insights from Hypochaeris palustris (Asteraceae, Lactu-
ceae). Mol Ecol 14:203–212
Nathan R, Muller-Landau HC (2000) Spatial patterns of seed
dispersal, their determinants and consequences for recruitment.
Trends Ecol Evol 15:278–285
Nie GZ, Liu JQ, Guo ZT (1996) The major stratigraphic boundaries
and climatic events in Weinan loess section since 0.15 Ma BP:
based on chronological evidences. Quat Sci 16:221–231
Posada D, Crandall KA (1998) MODELTEST: testing the model of
DNA substitution. Bioinformatics 14:817–818
Qiu YX, Li Y, Zhai SN, Guo YP, Ge XJ, Comes HP (2011a) Glacial
survival east and west of the ‘Mekong-Salween Divide’ in the
Himalaya-Hengduan Mountains region as revealed by AFLPs
and cpDNA sequence variation in Sinopodophyllum hexandrum
(Berberidaceae). Mol Phylogenet Evol 59:412–424
Qiu YX, Fu CX, Comes HP (2011b) Plant molecular phylogeography
in China and adjacent regions: tracing the genetic imprints of
Quaternary climate and environmental change in the world’s
most diverse temperate flora. Mol Phylogenet Evol 59:225–244
Rambaut A, Drummond A (2007) Tracer v1.4. http://beast.bio.ed.
ac.uk/Tracer
Rogers AR, Harpending H (1992) Population-growth makes waves in
the distribution of pairwise genetic-differences. Mol Biol Evol
9:552–569
X.-L. Jiang et al.
123
Ronquist F, Teslenko M, van der Mark P, Ayres DL, Darling A,
Hohna S, Larget B, Liu L, Suchard MA, Huelsenbeck JP (2012)
MrBayes 3.2: efficient Bayesian phylogenetic inference and
model choice across a large model space. Syst Biol 61:539–542
Sang T, Crawford DJ, Stuessy TF (1997) Chloroplast DNA phylog-
eny, reticulate evolution, and biogeography of Paeonia (Paeon-
iaceae). Am J Bot 84:1120–1136
Schaal BA, Hayworth DA, Olsen KM, Rauscher JT, Smith WA
(1998) Phylogeographic studies in plants: problems and pros-
pects. Mol Ecol 7:465–474
Schneider S, Excoffier L (1999) Estimation of past demographic
parameters from the distribution of pairwise differences when
the mutation rates very among sites: application to human
mitochondrial DNA. Genetics 152:1079–1089
Shi ZT, Fang XM, Song YG, An ZS, Yang SL (2006) Loess
sediments in the north slope of Tianshan Mountains and it’s
indication of desertification since Middle Pleistocene. Mar Geol
Quat Geol 36:109–114
Slatkin M, Hudson RR (1991) Pairwise comparisons of mitochon-
drial-DNA sequences in stable and exponentially growing
populations. Genetics 129:555–562
Stewart JR, Lister AM, Barnes I, Dalen L (2010) Refugia revisited:
individualistic responses of species in space and time. Proc R
Soc B 277:661–671
Su ZH, Zhang ML, Cohen J (2012) Phylogeographic and demo-
graphic effects of Quaternary climate oscillations in Hexinia
polydichotoma (Asteraceae) in Tarim Basin and adjacent areas.
Plant Syst Evol
Sun JM, Zhu RX, Bowler J (2004) Timing of the Tianshan Mountains
uplift constrained by magnetostratigraphic analysis of molasse
deposits. Earth Planet Sci Lett 219:239–253
Sun H, Zhang YH, Volis S (2010) Chloroplast phylogeny and
phylogeography of Stellera chamaejasme on the Qinghai-Tibet
Plateau and in adjacent regions. Mol Phylogenet Evol 57:
1162–1172
Tajima F (1989) Statistical-method for testing the neutral mutation
hypothesis by DNA polymorphism. Genetics 123:585–595
Tang Z, Wang Z, Zheng C, Fang J (2006) Biodiversity in China’s
Mountains. Front Ecol Environ 4:347–352
Thompson JD, Gibson TJ, Plewniak F, Jeanmougin F, Higgins DG
(1997) The CLUSTAL_X windows interface: flexible strategies
for multiple sequence alignment aided by quality analysis tools.
Nucleic Acids Res 25:4876–4882
Wang LN, Ji JQ, Sun DX (2010) The uplift history of south-western
Tianshan: implications from AFT analysis of detrital samples.
Chin J of Geophys 53:931–945
Wang LY, Abbott RJ, Zheng W, Chen P, Wang YJ, Liu JQ (2009)
History and evolution of alpine plants endemic to the Qinghai-
Tibetan Plateau: Aconitum gymnandrum (Ranunculaceae). Mol
Ecol 18:709–721
Watson DF (1992) Contouring: a guide to the analysis and display of
spatial data (with programs on diskette). Pergamon Press, Oxford
Wolfe KH, Li WH, Sharp PM (1987) Rates of Nucleotide substitution
vary greatly among plant mitochondrial, chloroplast, and nuclear
Dnas. Proc Natl Acad Sci USA 84:9054–9058
Wulff EV (1943) An introduction to historical plant geography.
Chronica Botanica Company, Waltham
Xu T, Abbott RJ, Milne RI, Mao K, Du FK, Wu G, Ciren Z, Miehe G,
Liu J (2010a) Phylogeography and allopatric divergence of
cypress species (Cupressus L.) in the Qinghai-Tibetan Plateau
and adjacent regions. BMC Evol Biol 10:194
Xu XK, Kleidon A, Miller L, Wang SQ, Wang LQ, Dong GC (2010b)
Late Quaternary glaciation in the Tianshan and implications for
palaeoclimatic change: a review. Boreas 39:215–232
Yan S, Mu G, Xu Y, Zhao Z (1998) Quaternary environmental
evolution of the Lop Nur region, China. Acta Geographical
Sinica 53:332–340
Zhang HX, Zhang ML (2012) Genetic structure of the Delphinium
naviculare species group tracks Pleistocene climatic oscillations
in the Tianshan Mountains, arid Central Asia. Palaeogeogr
Palaeoclimatol Palaeoecol 353–355:93–103
Zhang YJ, Stock M, Zhang P, Wang XL, Zhou H, Qu LH (2008)
Phylogeography of a widespread terrestrial vertebrate in a
barely-studied Palearctic region: green toads (Bufo viridis
subgroup) indicate glacial refugia in Eastern Central Asia.
Genetica 134:353–365
Zhao JD, Liu SY, He YQ, Song YG (2009) Quaternary glacial
chronology of the Ateaoyinake River Valley, Tianshan Moun-
tains, China. Geomorphology 103:276–284
Zhou WW, Wen Y, Fu JZ, Xu YB, Jin JQ, Ding L, Min MS, Che J,
Zhang YP (2012) Speciation in the Rana chensinensis species
complex and its relationship to the uplift of the Qinghai-Tibetan
Plateau. Mol Ecol 21:960–973
Phylogeographic patterns of the Aconitum nemorum species group (Ranunculaceae)
123