phylogeography of striped skunks (mephitis mephitis) in north
TRANSCRIPT

Phylogeography of striped skunks (Mephitis mephitis) in NorthAmerica: Pleistocene dispersal and contemporary population structure
HEATHER D. BARTON AND SAMANTHA M. WISELY*
116 Ackert Hall, Division of Biology, Kansas State University, Manhattan, KS 66506, USA
Present address of SMW: Wildlife Ecology and Conservation and Ordway-Swisher Biological Station, Conservation
Genetics and Molecular Ecology Lab, 110 Newins-Ziegler Hall, University of Florida, Gainesville, FL 62611, USA
* Correspondent: [email protected]
Pleistocene climate fluctuations rearranged ecosystems, and influenced the contemporary distribution of
modern species. Although specialist species were often restricted to isolated refugia by Pleistocene climate
change, generalist species may have been less constrained in their distribution and movements. We used a
combination of genetic data and previously published fossil data to investigate the phylogeography and
contemporary population structure of a generalist species, the striped skunk (Mephitis mephitis). We sequenced
a portion of the mitochondrial cytochrome-b gene (601 base pairs) and amplified 8 microsatellite loci from 314
striped skunk specimens. Phylogenetic analysis of the cytochrome-b gene revealed the presence of 4 distinct
phylogroups, and examination of microsatellite data indicated a pattern of secondary contact among these
clades. We infer from these data that during the Rancholabrean stage prior to the Illinoian glaciation, striped
skunks emerged from a southern refugium in the Texas–Mexico region and colonized the southeastern United
States, forming a 2nd, later refugium in the east. This colonization was followed by a 2nd dispersal event from
the southern source population to west of the Rocky Mountains during the Illinoian glacial period. During the
Sangamonian interglacial stage, 2 distinct subclades formed on either side of the Sierra Nevada. During the
Holocene, the subclade that colonized the Great Basin then expanded east across the northern Rockies and
recolonized the Great Plains to create an area of secondary contact with the southern phylogroup. Secondary
contact occurred to a lesser extent with individuals from the eastern phylogroup east of the Mississippi River. It
appears that periodic Pleistocene glacial expansions and retreats caused a series of range expansions and
secondary contact events in this native North American species to create a complex pattern of population
structure today.
Key words: generalist species, Mephitis mephitis, phylogeography, Pleistocene, population genetics, Quaternary
biogeography, striped skunk
E 2012 American Society of Mammalogists
DOI: 10.1644/10-MAMM-A-270.1
The Pleistocene was a time of periodic climate fluctuations
that led to the formation and subsequent retraction of large ice
sheets over much of the Northern Hemisphere. The cyclical
expansion and contraction of these ice sheets throughout
the Pleistocene affected the environment and landscape, and
influenced the distribution of continental biota. At the end of
the Pleistocene (12,000 years ago), temperatures yet again
increased, glaciers retreated, and flora and fauna that had been
confined to refugia during the Wisconsinan glacial period
expanded as ecosystems developed throughout the Holocene
and into recent times (Graham et al. 1996; Hewitt 2000). For
many species, Pleistocene glacial cycles and subsequent
Holocene climatic warming produced patterns of vicariance
and dispersal that, in turn, generated modern patterns of
genetic diversity and population structuring in many species of
mammals (Hewitt 2004).
Phylogeographic studies, which combine fossil, genetic,
climatic, and biogeographic data, seek to understand the
vicariant and dispersal processes of plant and animal species
that drive Quaternary and contemporary distributions. In
North America, phylogeographic studies of fauna have often
focused on endemic montane or boreal species that typically
expanded out of low-elevation, low-latitude, ice-free Pleisto-
cene refugia to their modern distributions (Lessa et al. 2003;
w w w . m a m m a l o g y . o r g
Journal of Mammalogy, 93(1):38–51, 2012
38
Dow
nloaded from https://academ
ic.oup.com/jm
amm
al/article-abstract/93/1/38/899396 by guest on 05 May 2019

Lunt et al. 1998; Santucci et al. 1998; Taberlet and Bouvet
1994). Because boreal specialist species depend on a narrow
range of resources, species such as the black bear (Ursus
americanus) and the American marten (Martes americana)
relied on refugia that were located in the southeastern and
eastern United States (Rand 1954; Soltis et al. 2006), the
southwestern United States and Mexico (Olah-Hemmings et
al. 2010; Rand 1954), and along the Pacific coast (Scudder and
Gessler 1989). For some species, eastern Beringia (central
Alaska and western Yukon) also functioned as a Pleistocene
refugium (Hopkins 1967; Lessa et al. 2003). These refugia
served as origins of future range expansion for endemic and
specialist species into uninhabited, developing ecosystems
following the final retreat of the Laurentide ice sheet at the
end of the Wisconsinan glaciation. Generalist species, which
were not subject to the same habitat restrictions as specialist
species during the Pleistocene, also were relegated to lower
latitudes, but they could traverse a broader spectrum of
habitats in the unglaciated areas. The greater freedom of
movement afforded to generalist species during the Pleisto-
cene may have allowed them to utilize different colonization
routes and regions than specialist species (Dragoo et al. 2006;
Lister 2004). We investigated the effects of Pleistocene
climate change on the distribution and movements of one
such North American generalist species, the striped skunk
(Mephitis mephitis).
Striped skunks are small-bodied mesocarnivores whose
modern distribution ranges from northern Mexico through the
continental United States and well into Canada (Dragoo 2009;
George 2006). All extant skunk species (Mephitidae) in the
New World evolved from a primitive skunk genus (Martino-
gale) that migrated to the New World in the late Miocene
(Wang et al. 2005); however, 2 basal skunk species in the
family, Mydaus javanensis and Mydaus marchei, are associ-
ated with Java and the Philippines, respectively (Dragoo and
Honeycutt 1997; Eizirik et al. 2010). Phylogenetic evidence
suggests that striped skunks diverged from a common ancestor
with their sister genus, Spilogale (Dragoo et al. 1993). The
earliest fossil evidence of the genus Mephitis is from the early
Pleistocene (,1.8 million years ago [mya]) and comes from
the Broadwater site in Nebraska (Kurten and Anderson 1980).
Late Pleistocene (70,000 years ago to 14,500 years ago) fossil
records suggest that striped skunks were broadly distributed
across much of the southern half of the United States by the
end of the Pleistocene, and fossil records from the Holocene
(,10,000-4,500 years ago) provide evidence that striped
skunks expanded into the upper Midwest and Northeast
regions of the United States following the retreat of the
Wisconsinan glacier (FAUNMAP Working Group 1994).
In the current study, we used a combination of genetic,
fossil, and biogeographic data to develop a biogeographic
history of striped skunks in North America. We hypothesized
that, unlike boreal species, the life-history traits of this
generalist species afforded striped skunks the ability to move
longitudinally during glacial stages when high latitudes and
high elevations were uninhabitable, but southern latitudes
provided habitat that could be inhabited and provide a route
for dispersal. These patterns of movement have been seen in
the phylogeographic assessments of such habitat generalists as
raccoons (Procyon lotor—Cullingham et al. 2008), deer mice
(Peromyscus maniculatus—Dragoo et al. 2006), and five-lined
skinks (Eumeces fasciatus—Howes et al. 2006). We hypoth-
esized that following regional dispersal, geographic features
such as mountains and major river drainages acted as isolating
mechanisms that caused striped skunk populations to diverge
into separate lineages. Studies of another highly mobile genera-
list species, the raccoon, have shown that rivers and mountains
are barriers to movement, generating population structure (Biek
et al. 2007; Jenkins et al. 1988); in particular, the Mississippi
River partitions populations of raccoons (Cullingham et al.
2008), the northern short-tailed shrew (Blarina brevicauda—
Brant and Orti 2003), and the five-lined skink (Howes et al.
2006). Therefore, we hypothesized that the Mississippi River
was a biogeographic barrier to striped skunks both in the
Pleistocene and currently. We further hypothesized that
climatic warming during the Holocene would have allowed
this species to expand latitudinally across North America, and
for populations that diverged during the Pleistocene to admix.
Studies of striped skunk ecology have shown that they are true
habitat generalists (Lariviere et al. 1999; Lariviere and Messier
1998; Verts 1967) and are highly mobile with a large dispersal
capacity (Bixler and Gittleman 2000). Thus, we hypothesized
that the biogeographic history of this species would provide
evidence for both vicariance and population admixture during
the dynamic climatic events of the last 2 million years.
MATERIALS AND METHODS
Sample collection.—Because striped skunks are a broadly
distributed North American species (Hall 1981), we wanted to
ensure that we adequately sampled the range of the species.
Ear tissue samples from 314 striped skunks were collected by
United States Department of Agriculture–Animal and Plant
Health Inspection Service employees and the Texas State
Health Department from 20 states (Arizona, California,
Georgia, Illinois, Indiana, Louisiana, Maine, Michigan,
Montana, Nebraska, Nevada, New Mexico, North Dakota,
Ohio, Oregon, Texas, Vermont, Virginia, West Virginia, and
Wyoming). Samples were sent to Kansas State University for
analysis. The full record for each sample included individual
identification, state, county, latitude and longitude, GenBank
accession, and sex (Appendix I).
Laboratory procedures.—We extracted DNA from 314 ear
tissue samples at Kansas State University using a PrepGem
Blood and Tissue extraction kit (Zygem, Inc., Solana Beach,
California). We amplified a 601–base pair (bp) segment of the
cytochrome-b gene using 2 primer sets: 31CB (59-TGAAA-
CTTCGGTTCCTTG-39) and 728CB (59-TTCAGTGGATTG-
GCTGGAGT-39), and 48CB (59-GCTCGGAATTTGCTTGA-
TTC-39) and 745CB (59-TAATATGGGGTGGGGTGTTC-39)
at a total volume of 10 ml, which consisted of 2 ml of DNA
extract (4.5–52.0 ng/ml), 13 polymerase chain reaction buffer,
February 2012 BARTON AND WISELY—PHYLOGEOGRAPHY OF STRIPED SKUNKS 39
Dow
nloaded from https://academ
ic.oup.com/jm
amm
al/article-abstract/93/1/38/899396 by guest on 05 May 2019

1.5 mM of MgCl2, 0.2 mM of deoxynucleoside triphosphates,
1.0 mg/ml of bovine serum albumin, 0.5 mM of each primer,
and 0.3 unit Taq. Polymerase chain reaction conditions were
55uC for 2 min, followed by 30 cycles of 94uC for 15 s, 50uCfor 15 s, and 72uC for 30 s, followed by 72uC for 1 min, ending
with a 4uC hold. Polymerase chain reaction products were
purified and sequenced at the Advanced Genetic Technology
Center (University of Kentucky, Lexington). Sequences were
edited using Sequencher 4.7 (Gene Codes Corporation, Ann
Arbor, Michigan). Sequences were deposited in the GenBank
database (accession numbers JN008441–JN008709).
We also amplified striped skunk DNA at 8 microsatellite
loci (Dragoo et al. 2009) at a total volume of 10 ml, which
consisted of 2 ml of DNA extract (4.5–52.0 ng/ml), 13
polymerase chain reaction buffer, 2.7 mM of MgCl2, 0.3 mM
of deoxynucleoside triphosphates, 0.1 mg/ml of bovine serum
albumin, 0.8 M of Betaine, 0.2 mM of forward primer, 0.5 mM
of reverse and 4 dye-tagged primers (FAM and HEX
[Integrated DNA Technologies, Coralville, Iowa] and PET
and NED [Applied Biosystems, Carlsbad, California]), and 0.5
unit Taq. Polymerase chain reaction conditions for primer sets
22-70, 42-15, 22-19, and 42-73 were 94uC for 5 min, followed
by 30 cycles of 94uC for 30 s, 51uC for 45 s (primer sets 22-14
and 22-26: 54uC, primer set 42-25: 53uC), and 72uC for 45 s,
followed by 10 cycles of 94uC for 30 s, 53uC for 45 s, and
72uC for 45 s, followed by 72uC for 10 min. Primer set 22-67
required the use of a touchdown polymerase chain reaction,
with conditions as follows: 94uC for 5 min, followed by 8
cycles of 94uC for 30 s, 60uC for 30 s, and 72uC for 30 s, with
the annealing temperature decreasing every 2 cycles to 58uC,
56uC, and 52uC, respectively, followed by 30 cycles of 94uCfor 30 s, 50uC for 30 s, and 72uC for 30 s, followed by 72uCfor 10 min. Samples that failed to amplify were reextracted
using a DNeasy Blood and Tissue extraction kit (Qiagen Inc.,
Valencia, California) and reamplified. Polymerase chain reac-
tion product was visualized on an ABI 3730 DNA analyzer
(Applied Biosystems) and scored at all 8 loci using
GeneMarker version 1.85 (SoftGenetics LLC, State College,
Pennsylvania). Each locus was independently amplified and
visualized an average of 4 times.
Mitochondrial DNA sequence data analyses.—We based
our analyses on a 601-bp section of the cytochrome-b gene,
and used both graphical and statistical methods of data
analysis. Traditional graphical approaches, such as nested
clade analysis (Templeton 1998), allowed us to assess popula-
tion divisions (Templeton 2008). We minimized the risk of
committing a type I error that is often associated with graphi-
cal analyses by extensively sampling the current distribu-
tion of this mobile, yet small-bodied carnivore (Bixler and
Gittleman 2000). In order to account for stochastic effects on
evolutionary history, we also used a model-based statistical
approach to obtain maximum-likelihood estimates of diver-
gence times using IMa2 (available from http://genfaculty.
rutgers.edu/hey/software; Hey and Nielson 2007).
We determined the relationships among haplotypes using a
median-joining network in Network 4.5.1.6 (available from
www.fluxus-engineering.com). The resulting phylogroups
formed the basis for all subsequent analyses of historical
population. Mutation rates for cytochrome b in striped skunks
have not been previously calculated; therefore, we relied on
known transition and transversion fractions for the family
Mustelidae, the sister family to Mephitidae (Marmi et al.
2004). We used these fractions and the date for the 1st known
striped skunk fossil (1.8 mya—Kurten and Anderson 1980) to
calculate a mutation rate of 6.20 3 1028 substitutions per site
per year. Assuming a generation time of 1 year in striped
skunks, we expected a mutation to occur every 26,837 years
on average for a 601-bp sequence. We used this mutation rate
to estimate divergence times in terms of average number of
mutations (rho) separating ancestral and descendent haplo-
types in Network 4.5.1.6 (Forster et al. 1996). We conducted
nested clade analysis using the median-joining network
generated from the cytochrome-b data set in Network 4.5.1.6.
We defined nested clades based on the rules of Templeton et al.
(1987), and conducted the nested clade analysis using GeoDis
2.4 (available from: http://darwin.uvigo.es/software/geodis.
html; Posada et al. 2000) and Templeton’s (1998) inference key.
We constructed phylogenetic trees using the Bayesian method
implemented in BEAST 1.4.8 (available from http://beast.bio.
ed.ac.uk/Main_Page; Drummond and Rambaut 2007), and
calculated posterior probabilities from 107 iterations after
discarding the first 105 iterations as burn-in. We used a general
time-reversible (GTR) model of DNA substitution, proportion of
invariable sites, and shape of the gamma distribution (GTR+I+G
model, base frequencies of A 5 0.2961, C 5 0.2519, G 5
0.1353, T 5 0.3167, rate matrix 5 [4.2082, 17.7883, 1.8460,
1.0952, 44.5668], I 5 0.4611, G 5 0.6328) using MrModeltest
2.3 (available from https://wiki.uio.no/usit/suf/vd/hpc/index.
php/Modeltest/MrModeltest; Nylander 2004), to analyze the
cytochrome-b data set in Bayesian analyses. We used the
hooded skunk (Mephitis macroura; cytochrome b, GenBank
accession DQ471840) as our outgroup. A maximum clade
credibility tree was generated from 9,001 trees after a burn-in of
1,000 trees in TreeAnnotator 1.4.8 (part of the BEAST package),
and visualized using FigTree 1.3.1 (available from: http://tree.
bio.ed.ac.uk/software/figtree/).
We used Markov chain Monte Carlo–based simulations in
the program IMa2 to assess an isolation-with-migration
demographic model for striped skunks, and to produce
maximum-likelihood estimates and confidence intervals for
divergence times among haplogroups from median-joining
networks. We used the Hasegawa, Kishino, & Yano (HKY)
model of substitution and the cytochrome-b data set for this
analysis. We began with multiple runs of 1,000 steps
(following 100,000 iterations as burn-in) to assess mixing
and to fine-tune the parameter space. We then conducted 2
independent runs of 1,000,000 Markov chain Monte Carlo
simulation steps. Consistent marginal peak locations with
unimodal likelihood curves approaching 0 on either end of the
distribution of parameter values indicated reasonable sampling
of trees, which were then used in ‘‘LoadTree’’ mode to
estimate joint distributions, final parameter estimates, and
40 JOURNAL OF MAMMALOGY Vol. 93, No. 1
Dow
nloaded from https://academ
ic.oup.com/jm
amm
al/article-abstract/93/1/38/899396 by guest on 05 May 2019
credibility intervals (Hey and Nielson 2007). Although
generation time to most recent common ancestor (TMRCA) is
not analogous to divergence time, we compared values to
increase our confidence in divergence time. TMRCA represents
the time (in generations) that lineages shared a common
relative, while divergence time represents when populations
genetically diverged from one another. TMRCA will be older
than divergence time; however, the high dispersal capacity of
striped skunks combined with Pleistocene climate fluctuations
likely led to rapid population structuring, so that the time
between the 2 estimates might be short. Thus, we felt that it
was appropriate to use TMRCA to confirm our divergence time
estimates.
We calculated TMRCA using a Bayesian coalescent-based
approach implemented in BEAST 1.4.8, and specified a
Bayesian skyline plot as the demographic model (Drummond
et al. 2005). Bayesian skyline analysis uses a Markov chain
Monte Carlo approach (Drummond et al. 2002), allowing for
simultaneous estimation of genealogy, nucleotide substitution
rate, and demography. Bayesian skyline analysis as imple-
mented in BEAST is a coalescent model and does not impose
a specific demographic growth pattern a priori, because
demography is one of the fitted components. We ran the
analysis for 106 iterations, discarding the first 105 iterations as
burn-in; we reran the analysis until each scale factor was
optimized, which occurred after 7 runs. Our final run consisted
of 107 iterations, with the first 106 iterations discarded as burn-
in. We visualized the results with Tracer 1.4.1 (available from
http://tree.bio.ed.ac.uk/software/tracer/). We also tested for
population growth by calculating Fu’s FS (Fu 1997) in DnaSP
5.5 (available from http://www.ub.edu/dnasp/; Rozas et al.
2003) for different phylogroups as indicated by our haplotype
networks and phylogenetic trees. Fu’s FS compares the
number of polymorphic sites to the total number of nucleotide
differences to detect population growth; populations with
recent expansion have statistically significant negative values
(Fu 1997).
For geographical analyses, we used SAMOVA version 1.0
(available from http://web.unife.it/progetti/genetica/Isabelle/
samova.html) to independently evaluate population structure
(Dupanloup et al. 2002). We assumed that the number of
geographical groupings (K) ranged from 2 to 5 for cytochrome
b, based on haplogroups from the median-joining networks.
Using multiple geographic groupings allowed us to test
hypotheses about the relationships among phylogroups to
determine patterns of population structure among striped
skunks. We evaluated the degree to which population genetic
differences could be explained by isolation by distance in
Arlequin 3.11 (available from http://cmpg.unibe.ch/software/
arlequin3/) using Mantel tests between pairwise WST, a
measure of genetic differentiation among phylogroups and
geographical distances among those clades.
We used Arlequin 3.11 to estimate nucleotide and haplotype
diversity and to generate a matrix of pairwise WST values based
on pairwise differences between haplotypes for cytochrome b
(Nei and Li 1979). We evaluated statistical significance (P 5
0.05) based on 1,000 permutations, then performed a sequen-
tial Bonferroni correction for multiple tests (Rice 1989).
Microsatellite DNA analyses.—We used 8 microsatellite
loci to assess the contemporary population structure of striped
skunks. First, we determined the number of segregating
populations in our host population using a Bayesian clustering
algorithm in STRUCTURE 2.3 (available from http://pritch.
bsd.uchicago.edu/structure.html; Pritchard et al. 2000) by
conducting 1 run for K 5 1 through K 5 25, where K is the
number of populations. After the initial runs, we narrowed the
population size range and conducted 20 runs each for K 5 1
through K 5 6. We determined the likely number of popu-
lations based on the change in the log probability of data
between K values (Evanno et al. 2005). Individuals were
assigned to a population according to the individual q-value
(the proportion of each individual’s genome that can be
assigned to a given population) determined in STRUCTURE;
these populations formed the basis for all subsequent con-
temporary population genetic analyses. We tested for Hardy–
Weinberg equilibrium using GENEPOP 3.4 (available from
http://genepop.curtin.edu.au/; Raymond and Rousset 1995); to
ensure that microsatellite loci were randomly associated with
one another, we tested for linkage disequilibrium (GENEPOP
3.4). We estimated mean allelic richness for each population
using FSTAT 2.9 (available from http://www2.unil.ch/popgen/
softwares/fstat.htm; Goudet et al. 2002). We also determined
the global FST value and population pairwise FST values to deter-
mine the amount of gene flow among populations throughout
North America. We used MIGRATE 2.3 (available from http://
popgen.sc.fsu.edu/Migrate/Migrate-n.html; Beerli and Felsen-
stein 1999) to estimate the relative effective population size (h)
of striped skunks throughout North America by calculating h 5
4Nem for skunk populations. We used a Brownian microsatellite
model, and ran the program until the values became stationary.
Because striped skunks succumb to a variety of diseases, we also
tested all populations for the signature of a bottleneck using
BOTTLENECK 1.2.02 (available from http://www1.montpellier.
inra.fr/URLB/bottleneck/bottleneck.html; Cornuet and Luikart
1996).
We also investigated the fine-scale population structure of
striped skunks using a combination of linear regression and
population structure analyses for individuals in the west, cen-
tral, and eastern United States. Using microsatellite markers,
we calculated the average q-value for all individuals in the
Great Plains, including animals from Texas, Nebraska,
Wyoming, Montana, and North Dakota, and regressed the
average q-values against latitude to test the hypothesis that
contemporary secondary contact was occurring among separate
lineages of skunks in northern and southern populations of the
Great Plains (Ward and Neel 1976). We conducted linear
regression analysis using SAS (SAS Institute Inc., Cary, North
Carolina) to test for the presence of clinal change in allele
frequency. To test for secondary contact of distinct lineages east
of the Mississippi River, we regressed the average q-values for
individuals from Georgia, Virginia, West Virginia, Indiana,
Illinois, Ohio, and Michigan against latitude.
February 2012 BARTON AND WISELY—PHYLOGEOGRAPHY OF STRIPED SKUNKS 41
Dow
nloaded from https://academ
ic.oup.com/jm
amm
al/article-abstract/93/1/38/899396 by guest on 05 May 2019

RESULTS
Nested clade analysis and phylogeny.—We obtained partial
cytochrome-b sequences (601 bp) from 269 of the 314
samples. The cytochrome-b haplotype network revealed that
haplotypes were divided into 4 phylogroups. The Pacific
phylogroup contained only samples from California; the South
phylogroup contained mostly samples from the southwestern
and Gulf Coast states (Arizona, New Mexico, Texas, and
Louisiana); the Intermountain West phylogroup consisted
mostly of samples from the northern Great Plains, Great Basin,
northern Rocky Mountains, and Pacific Northwest (Oregon,
Montana, Nebraska, Nevada, North Dakota, and Wyoming);
and the East phylogroup contained mostly samples east of the
Mississippi River (Georgia, Illinois, Indiana, Maine, Michi-
gan, Ohio, Vermont, Virginia, and West Virginia; Fig. 1).
Some samples from Montana and Wyoming also were present
in the South phylogroup, and some samples from Texas and
New Mexico were present among haplotypes found in the
Intermountain West group. Additionally, samples from Illinois
were also found in both the South and Intermountain West
phylogroups.
The nested clade analysis revealed a pattern of contiguous
range expansion for the entire network that represented the
entire continental sample (Fig. 1). In addition, significant
patterns of demography were found for the East and South
phylogroups. The East phylogroup showed evidence of allo-
patric fragmentation; the South phylogroup showed evidence
of restricted gene flow and isolation by distance using
Templeton’s key (1998). Mantel tests using the WST values
from the cytochrome-b data set and geographic distance
confirmed the presence of a pattern of isolation by distance for
striped skunks throughout North America (r2 5 0.14, n 5 6,
P 5 0.02).
The patterning seen in the cytochrome-b median-joining
network was consistent with the maximum clade credibility
phylogenetic tree (Fig. 2). Using hooded skunk as the outgroup,
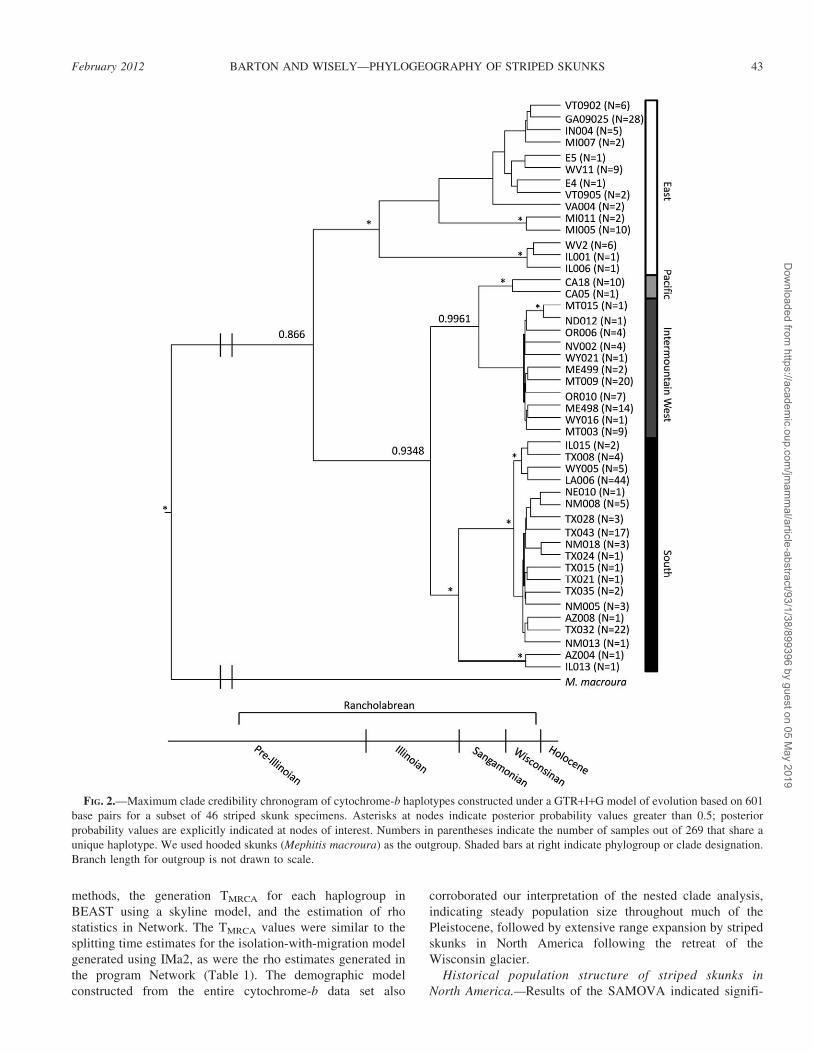
the phylogram showed well-formed clades. The split of the East
clade and the South clade was the oldest divergence event,
followed by the split of the Intermountain West clade from the
South clade. Finally, the Pacific clade split from the Intermoun-
tain West clade most recently, and represents the most derived
clade. All bifurcation points representing these splits had greater
than 0.5 posterior probability support, trees built using maximum
parsimony had similar topologies (results not shown), and
molecular clock estimates supported the chronology of events.
Results of the isolation-with-migration model, generated by
the program IMa2, indicated that the East phylogroup split
from the South phylogroup an estimated 209,000 years ago,
the Intermountain West phylogroup split from the South
phylogroup an estimated 149,000 years ago, and the Pacific
phylogroup split from the Intermountain West phylogroup an
estimated 132,000 years ago. However, the credibility inter-
vals were broad for all divergence time estimates (Table 1).
We corroborated these divergence estimates using 2 other
FIG. 1.—Median-joining network based on 601 base pairs of cytochrome b in the mitochondrial genome for 269 striped skunk specimens.
Branch lengths are proportional to the number of substitutions, and circle sizes are proportional to the number of individuals represented.
Ambiguous connections were resolved using the rooted maximum clade credibility phylogenetic tree. The East clade is indicated with a solid
line, the Intermountain West clade is indicated with a dotted line, the Pacific clade is indicated with a dot–dash line, and the South clade is
indicated with a dashed line. Results of nested clade analysis, including allopatric fragmentation (AF), restricted gene flow (RGF), and isolation
by distance (IBD), are indicated where significant.
42 JOURNAL OF MAMMALOGY Vol. 93, No. 1
Dow
nloaded from https://academ
ic.oup.com/jm
amm
al/article-abstract/93/1/38/899396 by guest on 05 May 2019
methods, the generation TMRCA for each haplogroup in
BEAST using a skyline model, and the estimation of rho
statistics in Network. The TMRCA values were similar to the
splitting time estimates for the isolation-with-migration model
generated using IMa2, as were the rho estimates generated in
the program Network (Table 1). The demographic model
constructed from the entire cytochrome-b data set also
corroborated our interpretation of the nested clade analysis,
indicating steady population size throughout much of the
Pleistocene, followed by extensive range expansion by striped
skunks in North America following the retreat of the
Wisconsin glacier.
Historical population structure of striped skunks in
North America.—Results of the SAMOVA indicated signifi-
FIG. 2.—Maximum clade credibility chronogram of cytochrome-b haplotypes constructed under a GTR+I+G model of evolution based on 601
base pairs for a subset of 46 striped skunk specimens. Asterisks at nodes indicate posterior probability values greater than 0.5; posterior
probability values are explicitly indicated at nodes of interest. Numbers in parentheses indicate the number of samples out of 269 that share a
unique haplotype. We used hooded skunks (Mephitis macroura) as the outgroup. Shaded bars at right indicate phylogroup or clade designation.
Branch length for outgroup is not drawn to scale.
February 2012 BARTON AND WISELY—PHYLOGEOGRAPHY OF STRIPED SKUNKS 43
Dow
nloaded from https://academ
ic.oup.com/jm
amm
al/article-abstract/93/1/38/899396 by guest on 05 May 2019

cant models for both 3 and 4 populations of striped skunks in
North America. In general, we found a continental pattern of
separation by longitude and latitude. The WST values were
similar for all 4 levels of population structure, but the WST
value for 4 populations was higher than for 3 populations and
was an order of magnitude more significant, suggesting that 4
was most likely the correct number of groupings. Samples
west of the Rocky Mountains and in the northern and central
Great Plains defined 1 group and closely mirrored the Pacific
and Intermountain West phylogroups, samples from the
southern Great Plains and the Southwest defined another
group (similar to the South phylogroup), and a 3rd group was
defined by all samples east of the Mississippi, except for
samples from the New England area, which formed their own
group. We found moderate to high levels of differentiation
(pairwise WST) among all pairs of phylogroups (Table 2). The
East phylogroup was differentiated from the other phy-
logroups. The Intermountain West phylogroup also was
differentiated from the South phylogroup (Table 2).
The combination of haplotype and nucleotide diversity
patterns present in each phylogroup provides some indication
of demographic processes (Avise 2000). The low haplotype
and nucleotide diversity in the cytochrome-b data for the
Pacific phylogroup suggest that skunks in California were
recently isolated from the their ancestral haplogroup, the
Intermountain West, after animals expanded up the western
side of the Sierra Nevada range (Table 3). The combination of
high haplotype diversity and low nucleotide diversity in the
remaining phylogroups suggests that these areas were
independently colonized and isolated from other populations
during the late Pleistocene. The combination of high haplotype
diversity and high nucleotide diversity for the pooled data set
suggests that a large amount of gene flow and admixture
occurred throughout North America.
For the entire data set, Fu’s FS revealed a signature of
expansion (Fu’s FS 5 26.403, P ,, 0.001); the South
phylogroup, and the East and Intermountain West phylogroups
all displayed significant signatures of population expansion
(Fu’s FS 5 27.083, P 5 0.001; Fu’s FS 5 24.319, P 5
0.008; Fu’s FS 5 22.748, P 5 0.035, respectively), whereas
the Pacific phylogroup did not (Fu’s FS 5 1.137, P 5 0.388).
These values indicated a steady expansion of striped skunks
throughout much of North America. The combination of
divergence estimates, phylogenetic patterns, and expansion
estimates reveals the historical pattern of regional expansion
within some populations (Fig. 3).
Contemporary striped skunk population structure.—Analy-
sis of microsatellite markers indicated that none of the loci
exhibited linkage disequilibrium (P . 0.05 after Bonferroni
correction). Mean allelic richness and heterozygosity were
similar for all 3 populations (Table 4). We found heterozygote
deficiency at all 8 loci in the Northwest population, at 5 loci in
the South population, and at 7 loci in the East population
(Table 4). A Wilcoxon sign-rank test in program BOTTLE-
NECK 1.2.02 under the 2-phase mutation model was
significant for the Northwest, suggesting a past population
reduction and subsequent expansion; when all populations
were combined, the bottleneck signature was only marginally
significant (Table 4). The Bayesian clustering algorithm using
microsatellite markers in STRUCTURE indicated 3 contem-
porary populations of striped skunks in North America, which
we define as: Northwest: samples from California, Oregon,
Nevada, Wyoming, Montana, Nebraska, and North Dakota;
South: samples from Arizona, Louisiana, New Mexico, and
Texas; and East: samples from Georgia, Illinois, Indiana,
Maine, Michigan, Ohio, Vermont, Virginia, and West Virginia.
The global FST was 0.029 6 0.005, which indicated that there
was only a modest degree of divergence among populations of
TABLE 1.—Estimates for phylogroup divergence times using 3 different estimators based on cytochrome-b sequences. The 95% credibility
intervals for the posterior distributions of isolation with migration and time to most recent common ancestor (TMRCA) are indicated
in parentheses.
Splitting event
Isolation with migration
(3 1,000 years) TMRCA (3 1,000 years) Rho estimate
Rho estimate in years
(3 1,000 years)
South–East 209 (123–2,144) 358 (145–602) 10.7 6 2.52 287 6 68
South–Intermountain West 149 (87–228) 130 (60–213) 6.11 6 1.82 164 6 49
Intermountain West–Pacific 132 (74–207) 97 (17–215) 3.87 6 1.64 104 6 44
TABLE 2.—Pairwise WST estimates based on cytochrome-b sequence data from 4 haplogroups determined using median-joining networks (left
side of table), and pairwise FST estimates based on microsatellite markers for 3 contemporary striped skunk populations (right side of table).
Based on sequential Bonferroni correction with a 5 0.05, all 4 phylogroups and all 3 contemporary populations were significantly differentiated
from one another using both sets of molecular markers, suggesting strong population structure throughout North America.
Phylogroup Pacific
Intermountain
West South East South East Northwest Population
Pacific — — Northwest
Intermountain West 0.62 — — 0.03 East
South 0.69 0.75 — — 0.03 0.02 South
East 0.82 0.85 0.82 —
44 JOURNAL OF MAMMALOGY Vol. 93, No. 1
Dow
nloaded from https://academ
ic.oup.com/jm
amm
al/article-abstract/93/1/38/899396 by guest on 05 May 2019

striped skunks across different regions of North America.
Pairwise FST values among the 3 populations (Table 2) indi-
cated a modest but statistically significant amount of differen-
tiation among populations throughout North America. Effective
populations sizes (h; Table 4) for striped skunk populations in
the Northwest, South, and East were not significantly different
among populations.
We also examined fine-scale population structure in the
western, central, and eastern regions of the United States.
Within the Northwest population, samples on either side of the
Sierra Nevada (California versus Nevada and Oregon) that had
divergent haplotypic signatures, all comprised a single popu-
lation (K 5 1) when microsatellite markers were analyzed in
STRUCTURE. The pairwise FST between populations on
either side of the Sierra Nevada range was 0.04 (P 5 0.02).
Clinal analysis within the East population showed a slight
gradient in individual q-value with latitude near the Mis-
sissippi River; however, linear regression indicated that this
cline was not significant (r2 5 0.56; F1,4 5 4.96, P 5 0.09;
Fig. 4), and a pairwise FST 5 0.018 (P 5 0.01) between
samples from Illinois, Indiana, Ohio, and Michigan and
samples from Virginia, West Virginia, and Georgia suggested
that they operate as a single population. Clinal analysis in the
Great Plains using samples from the Northwest and South
populations revealed a gradient in individual q-values with
latitude, suggesting a pattern of secondary contact between 2
divergent lineages from north to south in the Great Plains;
latitude was a significant predictor of q-value in the Great
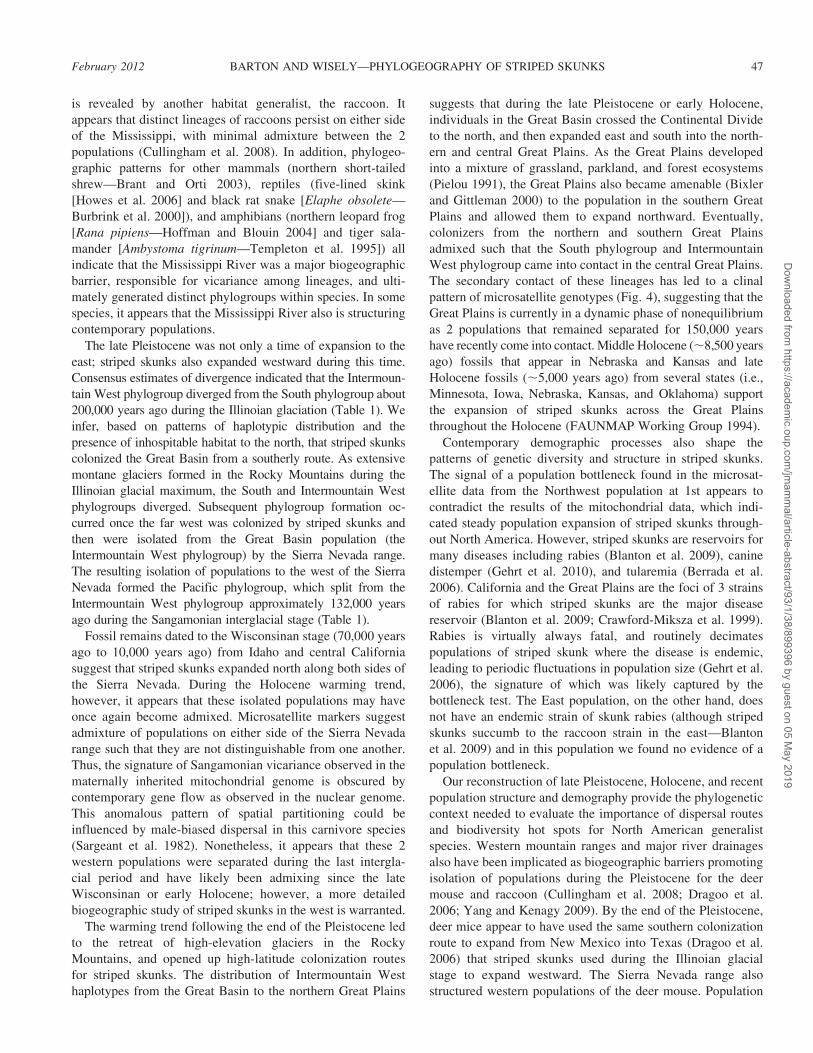
Plains (r2 5 0.80, F1,5 5 11.33, P 5 0.02; Fig. 4).
DISCUSSION
During the Pleistocene, fluctuating climates and ecosystems
redistributed the majority of the North American biota, which
had dramatic effects on the evolutionary history and distri-
bution of many species. Generalist species such as the striped
skunk (Rosatte 1987), however, were able to persist in a
variety of environmental conditions, and colonized previously
unoccupied areas of the continent during glacial maxima.
Unhindered by fluctuating ecosystems, the population size of
striped skunks appeared to remain constant throughout the
climatic fluctuations of the late Pleistocene until popula-
tions increased during the Wisconsinan glaciation (110,000-
10,000 years ago). Examination of data from our study
suggests that the biogeographic patterns of striped skunks
represent multiple Pleistocene expansions (Fig. 3) from the
ancestral clade in the south-central United States and Mexico,
from which all other lineages of striped skunks descended.
From Irvingtonian deposits (1.8 mya to 0.5 mya), fossil
remains have been found from Florida, Colorado, and
Arkansas (Anderson 2004) and suggest that striped skunks
expanded across the Mississippi River and into the southeast-
ern United States. Examination of our data suggests that the
FIG. 3.—Geographic distribution striped skunk phylogroups based on 601 base pairs of cytochrome-b gene in mitochondrial DNA. Pie charts
indicate the proportional representation of groups in each state. The hypothesized Pleistocene and Holocene dispersal patterns for striped skunk
phylogroups are indicated by unique dash marks.
TABLE 3.—Haplotype and nucleotide diversities for the
cytochrome-b sequences of 601 base pairs for each of the 4 striped
skunk phylogroups, and for all groups combined. Only the South and
East phylogroups exhibited haplotype sharing, with 3 haplotypes
being present in both phylogroups.
Phylogroup n Haplotypes
Haplotype
diversity
Nucleotide
diversity
Pacific 11 2 0.182 6 0.021 0.001 6 0.001
Intermountain West 64 11 0.826 6 0.001 0.003 6 0.002
South 117 20 0.810 6 0.001 0.004 6 0.003
East 77 16 0.830 6 0.001 0.004 6 0.003
All specimens 269 46 0.938 6 0.006 0.015 6 0.008
February 2012 BARTON AND WISELY—PHYLOGEOGRAPHY OF STRIPED SKUNKS 45
Dow
nloaded from https://academ
ic.oup.com/jm
amm
al/article-abstract/93/1/38/899396 by guest on 05 May 2019
southeastern colonizers split from the ancestral population in
the south-central United States and Mexico (Table 1) during
the late Pleistocene when repeated glacial melting widened the
Mississippi River and acted as a barrier to admixture between
these 2 biogeographic regions. Ultimately, this vicariant event
led to the generation of 2 separate lineages of striped skunks, 1
represented by the ancestral South phylogroup and 1 repre-
sented by the East phylogroup (see Van Gelder [1959] for a
similar pattern in spotted skunks [Spilogale]).
The South and East populations represent the ancestral
lineages from which all other lineages descended. The pattern
of restricted gene flow with isolation by distance in the South
phylogroup revealed by nested clade analysis indicates that
stable population size and equilibrium conditions persisted
throughout the late Pleistocene in this region. This population
was likely stable during the oscillating ice ages due to its
distance from the effects of glaciers to the north. Fu’s FS
estimate for the South phylogroup indicated a signature of
population expansion, providing more evidence that this group
was the population of origin for Pleistocene and Holocene
expansion across North America. The presence of allopatric
fragmentation in the nested clade analysis for the East phylo-
group (Fig. 1) suggests that subsequent to the South–East
phylogroup split, the East phylogroup was small and isolated
from western and central skunk populations for the remainder
of the Pleistocene.
The retreat of the Wisconsinan glacier in the east pre-
cipitated the development of habitable ecosystems in the
northeast, enabling animals in the southeast to expand north up
to the Great Lakes. The complete retreat of the Laurentide ice
sheet ultimately provided habitat for striped skunks in the New
England regions of the United States by the middle to late
Holocene. The appearance of fossil remains from that time
period (8,500 years ago to 4,500 years ago) in Tennessee,
Kentucky, Ohio, Pennsylvania, and New York support the
hypothesis that striped skunks expanded northward toward the
Great Lakes and New England throughout the Holocene; by
the late Holocene (,4,500 years ago), striped skunks had
expanded into much of their modern distribution (FAUNMAP
Working Group 1994). Yet, we found no evidence that
animals in the southeast, represented by the East phylogroup,
expanded westward across the Mississippi River at any point
following the initial South–East phylogroup split, which
suggests that the Mississippi River was a historical barrier,
and continues to be a modern barrier to dispersal by striped
skunks. Indeed, examination of our microsatellite data
revealed the highest levels of contemporary differentiation
on either side of the Mississippi River (Table 2), suggesting
that the modern populations that descended from divergent
lineages have not admixed. Only in the northern half of the
Mississippi River do we find evidence that animals from both
the South phylogroup and Intermountain West phylogroup
crossed the Mississippi River (Fig. 3).
The Mississippi River thus represents a considerable
biogeographic barrier in the eastern United States; this pattern
TABLE 4.—Population genetic analyses of each of the 3 striped skunk populations, for pooled data, and for each microsatellite locus. All
populations had a similar effective population size (h), and similar levels of observed and expected heterozygosity (HO and HE, respectively) and
allelic richness (AR). One of the populations showed the presence of a population bottleneck, and the pooled data showed a marginally
significant bottleneck signature. All 8 loci were out of Hardy–Weinberg equilibrium (HWE) when all samples were pooled.
AR HO HE h Bottleneck HWE
Population
Northwest 14.63 6 0.39 0.75 6 0.02 0.88 6 0.01 4.36 P 5 0.01 —
South 15.87 6 0.24 0.81 6 0.02 0.88 6 0.02 5.36 P 5 0.25 —
East 14.30 6 0.30 0.74 6 0.01 0.88 6 0.01 3.03 P 5 0.07 —
Pooled data 12.88 6 0.43 0.764 6 0.01 0.896 6 0.01 — P 5 0.05 —
Microsatellite locus
22-70 23.00 0.756 0.933 — — P ,, 0.001
22-67 20.00 0.789 0.888 — — P ,, 0.001
22-14 18.00 0.759 0.910 — — P ,, 0.001
42-26 17.00 0.736 0.916 — — P ,, 0.001
42-15 18.00 0.699 0.881 — — P ,, 0.001
42-25 22.00 0.843 0.889 — — P 5 0.02
22-19 17.00 0.789 0.886 — — P ,, 0.001
42-73 15.00 0.742 0.855 — — P ,, 0.001
FIG. 4.—Linear regression of average q-value against latitude for
the South and Northwest populations (black circles), and for the East
population (open squares). Linear regression was significant for the
South and Northwest populations (r2 5 0.80; P 5 0.02), but not for
the East population (r2 5 0.56; P 5 0.09), indicating incomplete
admixture in the Great Plains.
46 JOURNAL OF MAMMALOGY Vol. 93, No. 1
Dow
nloaded from https://academ
ic.oup.com/jm
amm
al/article-abstract/93/1/38/899396 by guest on 05 May 2019
is revealed by another habitat generalist, the raccoon. It
appears that distinct lineages of raccoons persist on either side
of the Mississippi, with minimal admixture between the 2
populations (Cullingham et al. 2008). In addition, phylogeo-
graphic patterns for other mammals (northern short-tailed
shrew—Brant and Orti 2003), reptiles (five-lined skink
[Howes et al. 2006] and black rat snake [Elaphe obsolete—
Burbrink et al. 2000]), and amphibians (northern leopard frog
[Rana pipiens—Hoffman and Blouin 2004] and tiger sala-
mander [Ambystoma tigrinum—Templeton et al. 1995]) all
indicate that the Mississippi River was a major biogeographic
barrier, responsible for vicariance among lineages, and ulti-
mately generated distinct phylogroups within species. In some
species, it appears that the Mississippi River also is structuring
contemporary populations.
The late Pleistocene was not only a time of expansion to the
east; striped skunks also expanded westward during this time.
Consensus estimates of divergence indicated that the Intermoun-
tain West phylogroup diverged from the South phylogroup about
200,000 years ago during the Illinoian glaciation (Table 1). We
infer, based on patterns of haplotypic distribution and the
presence of inhospitable habitat to the north, that striped skunks
colonized the Great Basin from a southerly route. As extensive
montane glaciers formed in the Rocky Mountains during the
Illinoian glacial maximum, the South and Intermountain West
phylogroups diverged. Subsequent phylogroup formation oc-
curred once the far west was colonized by striped skunks and
then were isolated from the Great Basin population (the
Intermountain West phylogroup) by the Sierra Nevada range.
The resulting isolation of populations to the west of the Sierra
Nevada formed the Pacific phylogroup, which split from the
Intermountain West phylogroup approximately 132,000 years
ago during the Sangamonian interglacial stage (Table 1).
Fossil remains dated to the Wisconsinan stage (70,000 years
ago to 10,000 years ago) from Idaho and central California
suggest that striped skunks expanded north along both sides of
the Sierra Nevada. During the Holocene warming trend,
however, it appears that these isolated populations may have
once again become admixed. Microsatellite markers suggest
admixture of populations on either side of the Sierra Nevada
range such that they are not distinguishable from one another.
Thus, the signature of Sangamonian vicariance observed in the
maternally inherited mitochondrial genome is obscured by
contemporary gene flow as observed in the nuclear genome.
This anomalous pattern of spatial partitioning could be
influenced by male-biased dispersal in this carnivore species
(Sargeant et al. 1982). Nonetheless, it appears that these 2
western populations were separated during the last intergla-
cial period and have likely been admixing since the late
Wisconsinan or early Holocene; however, a more detailed
biogeographic study of striped skunks in the west is warranted.
The warming trend following the end of the Pleistocene led
to the retreat of high-elevation glaciers in the Rocky
Mountains, and opened up high-latitude colonization routes
for striped skunks. The distribution of Intermountain West
haplotypes from the Great Basin to the northern Great Plains
suggests that during the late Pleistocene or early Holocene,
individuals in the Great Basin crossed the Continental Divide
to the north, and then expanded east and south into the north-
ern and central Great Plains. As the Great Plains developed
into a mixture of grassland, parkland, and forest ecosystems
(Pielou 1991), the Great Plains also became amenable (Bixler
and Gittleman 2000) to the population in the southern Great
Plains and allowed them to expand northward. Eventually,
colonizers from the northern and southern Great Plains
admixed such that the South phylogroup and Intermountain
West phylogroup came into contact in the central Great Plains.
The secondary contact of these lineages has led to a clinal
pattern of microsatellite genotypes (Fig. 4), suggesting that the
Great Plains is currently in a dynamic phase of nonequilibrium
as 2 populations that remained separated for 150,000 years
have recently come into contact. Middle Holocene (,8,500 years
ago) fossils that appear in Nebraska and Kansas and late
Holocene fossils (,5,000 years ago) from several states (i.e.,
Minnesota, Iowa, Nebraska, Kansas, and Oklahoma) support
the expansion of striped skunks across the Great Plains
throughout the Holocene (FAUNMAP Working Group 1994).
Contemporary demographic processes also shape the
patterns of genetic diversity and structure in striped skunks.
The signal of a population bottleneck found in the microsat-
ellite data from the Northwest population at 1st appears to
contradict the results of the mitochondrial data, which indi-
cated steady population expansion of striped skunks through-
out North America. However, striped skunks are reservoirs for
many diseases including rabies (Blanton et al. 2009), canine
distemper (Gehrt et al. 2010), and tularemia (Berrada et al.
2006). California and the Great Plains are the foci of 3 strains
of rabies for which striped skunks are the major disease
reservoir (Blanton et al. 2009; Crawford-Miksza et al. 1999).
Rabies is virtually always fatal, and routinely decimates
populations of striped skunk where the disease is endemic,
leading to periodic fluctuations in population size (Gehrt et al.
2006), the signature of which was likely captured by the
bottleneck test. The East population, on the other hand, does
not have an endemic strain of skunk rabies (although striped
skunks succumb to the raccoon strain in the east—Blanton
et al. 2009) and in this population we found no evidence of a
population bottleneck.
Our reconstruction of late Pleistocene, Holocene, and recent
population structure and demography provide the phylogenetic
context needed to evaluate the importance of dispersal routes
and biodiversity hot spots for North American generalist
species. Western mountain ranges and major river drainages
also have been implicated as biogeographic barriers promoting
isolation of populations during the Pleistocene for the deer
mouse and raccoon (Cullingham et al. 2008; Dragoo et al.
2006; Yang and Kenagy 2009). By the end of the Pleistocene,
deer mice appear to have used the same southern colonization
route to expand from New Mexico into Texas (Dragoo et al.
2006) that striped skunks used during the Illinoian glacial
stage to expand westward. The Sierra Nevada range also
structured western populations of the deer mouse. Population
February 2012 BARTON AND WISELY—PHYLOGEOGRAPHY OF STRIPED SKUNKS 47
Dow
nloaded from https://academ
ic.oup.com/jm
amm
al/article-abstract/93/1/38/899396 by guest on 05 May 2019

structure of the deer mouse mirrors populations of striped
skunks and suggests that the Sierra Nevada was a source of
vicariance for multiple species, and provided separate north-
ward colonization routes on either side of the mountain range
(Yang and Kenagy 2009). Additionally, genetic diversity of
the deer mouse on a continental scale is similar to diversity
patterns of the striped skunk in the Great Plains and upper
Midwest with high levels of admixture of separate lineages.
For multiple generalist species, it appears that midcontinental
North America represents hot spots of intraspecific biodiver-
sity where secondary contact of divergent lineages has led to
high levels of genetic diversity and the admixture of pre-
viously separated lineages (Blackburn and Measey 2009; He
et al. 2008; Hopper and Gioia 2004; Petit et al. 2003).
The comparative phylogeography among deer mice,
raccoons, and striped skunks implies that multiple generalist
mammalian species shared similar colonization and vicari-
ance events, which resulted in similar contemporary patterns
of population structure. The presence of multiple ancient
lineages in contemporary populations of deer mice, raccoons,
and striped skunks suggests that it may be worthwhile to
further characterize modern gene flow and secondary con-
tact among divergent lineages of these and other generalist
species. Generalist mammals are often zoonotic disease
reservoirs (Cullingham et al. 2008; Dragoo et al. 2006;
Ngamprasertwong et al. 2008) that can respond rapidly to
habitat alteration. When distantly related lineages admix, so
can their pathogens, which increases the potential for genetic
recombination in pathogens, and the introduction of novel
pathogens into naıve populations (Brooks and Hoberg 2007;
Campos-Krauer and Wisely 2011; Hoberg and Brooks 2008;
Holmes 2004). By investigating the phylogeography of host
species, we can begin to examine host–pathogen coevolution
and the potential for disease emergence or pandemics in new
habitats.
ACKNOWLEDGMENTS
We thank M. Dunbar, R. Pleszewski, the many United States
Department of Agriculture–Animal and Plant Health Inspection
Service Wildlife Service employees, and the employees of the Texas
State Health Department for providing striped skunk samples. We
also thank C. Ganser and H. Petersen for laboratory assistance. We
thank M. Statham for his comments and suggestions during
manuscript preparation. Finally, we thank 2 anonymous reviewers
for their helpful editorial reviews. Funding for this study was
provided by a Berryman Institute Graduate Student Fellowship grant,
and support from the Kansas State University Conservation Genetic
and Molecular Ecology Lab.
LITERATURE CITED
ANDERSON, E. 2004. The carnivora from Porcupine Cave. Pp. 141–154
in Biodiversity response to climate change in the middle
Pleistocene: the Porcupine Cave fauna from Colorado (A. D.
Barnosky, ed.). University of California Press, Berkeley.
AVISE, J. C. 2000. Phylogeography: the history and formation of
species. Harvard University Press, Cambridge, Massachusetts.
BEERLI, P., AND J. FELSENSTEIN. 1999. Maximum likelihood estimation
of migration rates and population numbers of two populations
using a coalescent approach. Genetics 152:763–773.
BERRADA, Z. L., H. K. GOETHERT, AND S. R. TELEFORD. 2006. Raccoons
and skunks as sentinels for enzootic tularemia. Emerging
Infectious Diseases 12:1019–1021.
BIEK, R., J. C. HENDERSON, L. WALLER, C. E. RUPPRECHT, AND L. A.
REAL. 2007. A high-resolution genetic signature of demographic
and spatial expansion in epizootic rabies virus. Proceedings of the
National Academy of Sciences 104:7993–7998.
BIXLER, A., AND J. L. GITTLEMAN. 2000. Variation in home range and
use of habitat in the striped skunk (Mephitis mephitis). Journal of
Zoology (London) 251:525–533.
BLACKBURN, D. C., AND G. J. MEASEY. 2009. Dispersal to or
from an African biodiversity hotspot? Molecular Ecology 18:
1904–1915.
BLANTON, J. D., K. ROBERTSON, D. PALMER, AND C. E. RUPPRECHT.
2009. Rabies surveillance in the United States during 2008. Journal
of the American Veterinary Medical Association 235:676–
689.
BRANT, S. V., AND G. ORTI. 2003. Phylogeography of the northern
short-tailed shrew, Blarina brevicauda (Insectivora: Soricidae):
past fragmentation and postglacial recolonization. Molecular
Ecology 12:1435–1449.
BROOKS, D. R., AND E. P. HOBERG. 2007. How will global climate
change affect parasite–host assemblages? Trends in Parasitology
23:571–574.
BURBRINK, F. T., R. LAWSON, AND J. B. SLOWINSKI. 2000. Mitochondrial
DNA phylogeography of the polytopic North American rat snake
(Elaphe obsoleta): a critique of the subspecies concept. Evolution
54:2107–2118.
CAMPOS-KRAUER, J. M., AND S. M. WISELY. 2011. Deforestation and
cattle ranching drive rapid range expansion and secondary contact
of vicariant populations of a semiaquatic rodent in the Gran Chaco
ecosystem. Global Change Biology 17:206–218.
CORNUET, J. M., AND G. LUIKART. 1996. Description and power
analysis of two tests for detecting recent population bottlenecks
from allele frequency data. Genetics 144:2001–2014.
CRAWFORD-MIKSZA, L. K., D. A. WADFORD, AND D. P. SCHNURR. 1999.
Molecular epidemiology of enzootic rabies in California. Journal
of Clinical Virology 14:207–219.
CULLINGHAM, C. I., C. J. KYLE, B. A. POND, AND B. N. WHITE. 2008.
Genetic structure of raccoons in eastern North America based on
mtDNA: implications for subspecies designation and rabies disease
dynamics. Canadian Journal of Zoology 86:947–958.
DRAGOO, J. W. 2009. Family Mephitidae (skunks). Pp. 532–563 in
Handbook of the mammals of the world (D. E. Wilson and R. A.
Mittermeier, eds.). Lynx Edicions, Barcelona, Spain.
DRAGOO, J. W., R. D. BRADLEY, R. L. HONEYCUTT, AND J. W. TEMPLETON.
1993. Phylogenetic relationships among the skunks: a molecular
perspective. Journal of Mammalian Evolution 1:255–267.
DRAGOO, J. W., K. E. COAN, K. A. MOORE, S. E. HENKE, R. C.
FLEISCHER, AND S. M. WISELY. 2009. Polymorphic microsatellite
markers for the striped skunk, Mephitis mephitis, and other
mephitids. Molecular Ecology Resources 9:383–385.
DRAGOO, J. W., AND R. L. HONEYCUTT. 1997. Systematics of mustelid-
like carnivores. Journal of Mammalogy 78:426–443.
DRAGOO, J. W., J. A. LACKEY, K. E. MOORE, E. P. LESSA, J. A. COOK, AND
T. L. YATES. 2006. Phylogeography of the deer mouse (Peromyscus
maniculatus) provides a predictive framework for research on
hantaviruses. Journal of General Virology 87:1997–2003.
48 JOURNAL OF MAMMALOGY Vol. 93, No. 1
Dow
nloaded from https://academ
ic.oup.com/jm
amm
al/article-abstract/93/1/38/899396 by guest on 05 May 2019

DRUMMOND, A. J., G. K. NICHOLLS, A. G. RODRIGO, AND W. SOLOMON.
2002. Estimating mutation parameters, population history, and
genealogy simultaneously from temporally spaced sequence data.
Genetics 161:1307–1320.
DRUMMOND, A. J., AND A. RAMBAUT. 2007. BEAST: Bayesian
evolutionary analysis by sampling trees. BMC Evolutionary
Biology 7:214.
DRUMMOND, A. J., A. RAMBAUT, B. SHAPIRO, AND O. G. PYBUS. 2005.
Bayesian coalescent inference of past population dynamics from
molecular sequences. Molecular Biology and Evolution 22:1185–
1192.
DUPANLOUP, I., S. SCHNEIDER, AND L. EXCOFFIER. 2002. A simulated
annealing approach to define the genetic structure of populations.
Molecular Ecology 11:2571–2582.
EIZIRIK, E., ET AL. 2010. Pattern and timing of diversification of the
mammalian order Carnivora inferred from multiple nuclear gene
sequences. Molecular Phylogenetics and Evolution 56:49–
63.
EVANNO, G., S. REGNAUT, AND J. GOUDET. 2005. Detecting the number
of clusters of individuals using the software STRUCTURE: a
simulation study. Molecular Ecology 14:2611–2620.
FAUNMAP WORKING GROUP. 1994. FAUNMAP: a database docu-
menting late Quaternary distributions of mammal species in the
United States. Illinois State Museum, Springfield. Vol. XXV.
FORSTER, P., R. HARDING, A. TORRONI, AND H.-J. BANDELT. 1996.
Origin and evolution of native American mtDNA variation: a
reappraisal. American Journal of Human Genetics 59:935–
945.
FU, Y. X. 1997. Statistical tests of neutrality of mutations against
population growth, hitchhiking and background selection. Genetics
147:915–925.
GEHRT, D. D., G. F. HUBERT, AND J. A. ELLIS. 2006. Extrinsic effects
on long-term population trends of Virginia oppossums and striped
skunks at a large spatial scale. American Midland Naturalist
155:168–180.
GEHRT, S. D., M. J. KINSEL, AND C. ANCHOR. 2010. Pathogen dynamics
and morbidity of striped skunks in the absence of rabies. Journal of
Wildlife Diseases 46:335–347.
GEORGE, J. 2006. Climate change lures skunks, moose to the Arctic.
29 September 2006, Nunatsiaq News, Iqaluit, Nunavut, Canada.
GOUDET, J., N. PERRIN, AND P. WASER. 2002. Tests for sex-biased
dispersal using bi-parentally inherited genetic markers. Molecular
Ecology 11:1103–1114.
GRAHAM, R. W., ET AL. 1996. Spatial response of mammals to late
Quaternary environmental fluctuations. Science 272:1601–
1606.
HALL, E. R. 1981. The mammals of North America. 2nd ed. John
Wiley & Sons, Inc., New York.
HE, T., B. B. LAMONT, S. L. KRAUSS, N. J. ENRIGHT, AND B. MILLER.
2008. Covariation between intraspecific genetic diversity and
species diversity within a plant functional group. Journal of
Ecology 96:956–961.
HEWITT, G. M. 2000. The genetic legacy of the Quaternary ice ages.
Nature 405:907–913.
HEWITT, G. M. 2004. Genetic consequences of climatic oscillations in
the Quaternary. Philosophical Transactions of the Royal Society of
London, B. Biological Sciences 359:183–195.
HEY, J., AND R. NIELSON. 2007. Integration within the Felsenstein
equation for improved Markov chain Monte Carlo methods in
population genetics. Proceedings of the National Academy of
Sciences 104:2785–2790.
HOBERG, E. P., AND D. R. BROOKS. 2008. A macroevolutionary mosaic:
episodic host-switching, geographical colonization, and diversifi-
cation in complex host–parasite systems. Journal of Biogeography
35:1533–1550.
HOFFMAN, E. A., AND M. S. BLOUIN. 2004. Evolutionary history of the
northern leopard frog: reconstruction of phylogeny, phylogeogra-
phy, and historical changes in population demography from
mitochondrial DNA. Evolution 58:145–159.
HOLMES, E. C. 2004. The phylogeography of human viruses.
Molecular Ecology 13:745–756.
HOPKINS, D. M. 1967. The Bering land bridge. Stanford University
Press, Stanford, California.
HOPPER, S. D., AND P. GIOIA. 2004. The Southwest Australia floristic
region: evolution and convservation of a global hot spot of biodiversity.
Annual Review of Ecology, Evolution, and Systematics 35:623–
650.
HOWES, B. J., B. LINDSAY, AND S. C. LOUGHEED. 2006. Range-wide
phylogeography of a temperate lizard, the five-lined skink (Eumeces
fasciatus). Molecular Phylogenetics and Evolution 40:183–194.
JENKINS, S. R., B. D. PERRY, AND W. G. WINKLER. 1988. Ecology and
epidemiology of raccoon rabies. Reviews of Infectious Diseases
10:S620–S625.
KURTEN, B., AND E. ANDERSON. 1980. Pleistocene mammals of North
America. Columbia University Press, New York.
LARIVIERE, S., AND F. MESSIER. 1998. Spatial organization of a prairie
striped skunk population during the waterfowl nesting season.
Journal of Wildlife Management 62:199–204.
LARIVIERE, S., L. R. WALTON, AND F. MESSIER. 1999. Selection by
striped skunks (Mephitis mephitis) of farmsteads and buildings as
denning sites. American Midland Naturalist 142:96–101.
LESSA, E. P., J. A. COOK, AND J. L. PATTON. 2003. Genetic footprints of
demographic expansion in North America, but not Amazonia,
during the late Quaternary. Proceedings of the National Academy
of Sciences 100:10331–10334.
LISTER, A. M. 2004. The impact of Quaternary ice ages on
mammalian evolution. Philosophical Transactions of the Royal
Society of London, B. Biological Sciences 359:221–241.
LUNT, D. H., K. M. IBRAHIM, AND G. M. HEWITT. 1998. mtDNA
phylogeography and post-glacial patterns of subdivision in the
meadow grasshopper Chorthippus parallelus. Heredity 80:
633–641.
MARMI, J., J. F. LOPEZ-GIRALDEZ, AND X. DOMINGO-ROURA. 2004.
Phylogeny, evolutionary history and taxonomy of the Mustelidae
based on sequences of the cytochrome b gene and a complex
repetitive flanking region. Zoological Scripta 33:481–499.
NEI, M., AND W.-H. LI. 1979. Mathematical model for studying
genetic variation in terms of restriction endonucleases. Proceedings
of the National Academy of Sciences 76:5269–5273.
NGAMPRASERTWONG, T., I. J. MACkIE, P. A. RACEY, AND S. B. PIERTNEY.
2008. Spatial distribution and microsatellite DNA variation in
Daubenton’s bat within Scotland. Molecular Ecology 17:3243–3258.
NYLANDER, J. A. A. 2004. MrModeltest, version 2. Program
distributed by the author, Evolutionary Biology Centre, Uppsala
University, Uppsala, Sweden.
OLAH-HEMMINGS, V., ET AL. 2010. Phylogeography of declining relict
and lowland leopard frogs in the desert southwest of North
America. Journal of Zoology (London) 280:343–354.
PETIT, R. J., ET AL. 2003. Glacial refugia: hotspots but not melting pots
of genetic diversity. Science 300:1563–1565.
PIELOU, E. C. 1991. After the ice age: return of life to glaciated North
America. University of Chicago Press, Chicago, Illinois.
February 2012 BARTON AND WISELY—PHYLOGEOGRAPHY OF STRIPED SKUNKS 49
Dow
nloaded from https://academ
ic.oup.com/jm
amm
al/article-abstract/93/1/38/899396 by guest on 05 May 2019

POSADA, D., K. A. CRANDALL, AND A. R. TEMPLETON. 2000. GeoDis: a
program for the cladistic nested analysis of the geographical
distribution of genetic haplotypes. Molecular Ecology 9:487–488.
PRITCHARD, J. K., M. STEPHENS, AND P. DONNELLY. 2000. Inference of
population structure from multilocus genotype data. Genetics
155:945–959.
RAND, A. L. 1954. The ice age and mammal speciation in North
America. Arctic 7:31–35.
RAYMOND, M., AND F. ROUSSET. 1995. GENEPOP (version 1.2):
population genetics software for exact tests and ecumenicism.
Journal of Heredity 86:248–249.
RICE, W. R. 1989. Analyzing tables of statistical tests. Evolution
43:223–225.
ROSATTE, R. C. 1987. Striped, spotted, hooded, and hog-nosed skunk.
Pp. 598–613 in Wild furbearer management and conservation in
North America. Ontario Trappers Association, Toronto, Ontario,
Canada.
ROZAS, J., J. C. S.-D. BARRIO, X. MESSEGUER, AND R. ROZAS. 2003.
DnaSP, DNA polymorphism analyses by the coalescent and other
methods. Bioinformatics 19:2496–2497.
SANTUCCI, F., B. C. EMERSON, AND G. M. HEWITT. 1998. Mitochondrial
DNA phylogeography of European hedgehogs. Molecular Ecology
7:1163–1172.
SARGEANT, A. B., R. J. GREENWOOD, J. L. PIEHL, AND W. B. BICKNELL.
1982. Recurrence, mortality, and dispersal of prairie striped
skunks, Mephitis mephitis, and implications to rabies epizootiol-
ogy. Canadian Field Naturalist 96:312–316.
SCUDDER, G. G. E., AND N. GESSLER. 1989. The outer shores. Queen
Charlotte Islands Museum Press, Skidegate, British Columbia,
Canada.
SOLTIS, D. E., A. B. MORRIS, J. S. MCLACHLAN, P. S. MANOS, AND P. S.
SOLTIS. 2006. Comparative phylogeography of unglaciated eastern
North America. Molecular Ecology 15:4261–4293.
TABERLET, P., AND J. BOUVET. 1994. Mitochondrial DNA polymor-
phism, phylogeography, and conservation genetics of the brown
bear, Ursus arctos in Europe. Proceedings of the Royal Society of
London, B. Biological Sciences 255:195–200.
TEMPLETON, A. R. 1998. Nested clade analyses of phylogeographic
data: testing hypotheses about gene flow and population history.
Molecular Ecology 7:381–397.
TEMPLETON, A. R. 2008. Nested clade analysis: an extensively
validated method for strong phylogeographic inference. Molecular
Ecology 17:1877–1880.
TEMPLETON, A. R., E. BOERWINKLE, AND C. F. SING. 1987. A cladistic
analysis of phenotypic associations with haplotypes inferred from
restriction endonuclease mapping. I. Basic theory and an analysis
of alcohol dehydrogenase activity in Drosophila. Genetics
117:343–351.
TEMPLETON, A. R., E. ROUTMAN, AND C. A. PHILLIPS. 1995. Separating
population structure from population history: a cladistic analysis of
the geographical distribution of mitochondrial DNA haplotypes in
the tiger salamander, Ambystoma tigrinum. Genetics 140:767–782.
VAN GELDER, R. G. 1959. A taxonomic revision of the spotted skunks
(genus Spilogale). Bulletin of the American Museum of Natural
History 117:229–392.
VERTS, B. J. 1967. The biology of the striped skunk. University of
Illinois Press, Urbana.
WANG, X., D. P. WHISTLER, AND G. T. TAKEUCHI. 2005. A new basal
skunk Martinogale (Carnivora, Mephitinae) from late Miocene
Dove Springs formation, California, and origin of New World
mephitines. Journal of Vertebrate Paleontology 25:936–949.
WARD, R. H., AND J. V. NEEL. 1976. The genetic structure of a tribal
population, the Yanomama Indians. XIV. Clines and their
interpretation. Genetics 82:103–121.
YANG, D.-S., AND G. J. KENAGY. 2009. Nuclear and mitochondrial
DNA reveal contrasting evolutionary processes in populations of
deer mice (Peromyscus maniculatus). Molecular Ecology 18:5115–
5125.
Submitted 31 July 2010. Accepted 25 July 2011.
Associate Editor was David L. Reed.
APPENDIX IList of samples of Mephitis mephitis used in the present study,
including: state, identification number, county, GenBank accession
number, and sex. Samples were obtained as described in ‘‘Materials
and Methods.’’
Arizona.—AZ004, Cochise, JN008613, female; AZ007, Cochise,
JN008636, male; AZ008, Cochise, JN008597, female.
California.—CA02, Sacramento, JN008604, male; CA03, Sacra-
mento, JN008534, male; CA04, Sacramento, JN008527, male; CA05,
Sacramento, JN008573, male; CA07, Humboldt, JN008529, un-
known; CA08, Humboldt, JN008574, unknown; CA09, Humboldt,
JN008633, unknown; CA16, Butte, JN008572, male; CA17, Butte,
JN008593, female; CA18, Butte, JN008483, male; CA19, Butte,
JN008612, male.
Georgia.—C11, Walker, JN008470, female; C34, Walker,
JN008665, female; E1, Walker, JN008652, female; E2, Walker,
JN008606, male; E3, Catoosa, JN008464, female; E4, Walker,
JN008605, unknown; E5, Whitfield, JN008486, unknown; E6,
Whitfield, JN008482, unknown; E7, Walker, JN008504, unknown;
E8, Walker, JN008507, unknown; GA9005, Catoosa, JN008476,
male; GA9006, Catoosa, JN008697, female; GA9007, Walker,
JN008584, male; GA9008, Walker, JN008648, male; GA9011,
Walker, JN008521, male; GA9013, Chattooga, JN008675, male;
GA9025, Walker, JN008459, female.
Illinois.—IL001, Madison, JN008595, male; IL002, Crawford,
JN008497, female; IL003, Effingham, JN008703, male; IL004,
Crawford, JN008647, female; IL005, Clark, JN008676, male;
IL006, Jasper, JN008503, male; IL007, Crawford, JN008680, male;
IL008, Vermillion, JN008693, male; IL009, Crawford, JN008585,
male; IL010, Crawford, JN008582, male; IL011, Crawford,
JN008614, male; IL012, Jasper, JN008502, male; IL013, Jersey,
JN008685, female; IL014, DuPage, JN008533, male; IL015, DuPage,
JN008611, female; IL016, Cook, JN008598, female; IL018, Sanga-
mon, JN008663, male; IL019, Lake, JN008640, male.
Indiana.—IN003, Carroll, JN008700, female; IN004, Harrison,
JN008460, male; IN006, Harrison, JN008477, female; IN007,
Harrison, JN008489, female; IN008, Harrison, JN008629, male;
IN015, Steuben, JN008500, male; IN017, Steuben, JN008508, male;
IN018, Tippecanoe, JN008596, male; IN019, Montgomery,
JN008631, unknown; IN020, Montgomery, JN008469, unknown;
IN021, Clark, JN008626, male; IN022, Daviess, JN008627, un-
known; IN023, Pike, JN008480, unknown; IN024, Pike, JN008610,
unknown; IN025, LeGrange, JN008632, unknown; IN026, Noble,
JN008515, unknown.
Louisiana.—LA001, Caldwell, JN008615, male; LA002, Ouachita,
JN008499, male; LA003, Franklin, JN008468, male; LA004,
JN008639, Ouachita, female; LA005, Ouachita, JN008461, female;
LA006, Tensas, JN008447, male; LA007, Ouachita, JN008656, male;
50 JOURNAL OF MAMMALOGY Vol. 93, No. 1
Dow
nloaded from https://academ
ic.oup.com/jm
amm
al/article-abstract/93/1/38/899396 by guest on 05 May 2019

LA008, Madison, JN008520, male; LA009, Madison, JN008570,
male; LA010, Madison, JN008641, male; LA011, Madison,
JN008454, female; LA012, Madison, JN008463, male; LA014,
Madison, JN008511, male; LA015, Caldwell, JN008541, female;
LA016, Madison, JN008455, male; LA017, Franklin, JN008495,
male; LA018, Ouachita, JN008580, male; LA019, Ouachita,
JN008474, male; LA020, Madison, JN008537, male.
Maine.—ME478, Aroostook, JN008531, female; ME479, Penob-
scot, JN008698, male; ME480, Penobscot, JN008667, female;
ME481, Washington, JN008525, female; ME486, Penobscot,
JN008696, female; ME489, Aroostook, JN008655, male; ME492,
Aroostook, JN008557, male; ME494, Aroostook, JN008642, male;
ME496, Aroostook, JN008635, female; ME497, Penobscot,
JN008646, unknown; ME498, Aroostook, JN008510, male; ME499,
Penobscot, JN008601, female; ME510, Penobscot, JN008654, male;
ME511, Aroostook, JN008577, male; ME512, Aroostook, JN008638,
female; ME513, Aroostook, JN008576, male.
Michigan.—MI001, Ingham, JN008488, male; MI002, Shiawassee,
JN008692, male; MI003, Ingham, JN008600, male; MI004, Ingham,
JN008514, male; MI005, Gratiot, JN008591, male; MI006, Ingham,
JN008539, male; MI007, Clinton, JN008602, unknown; MI008,
Clinton, JN008492, male; MI009, Clinton, JN008704, unknown;
MI010, Clinton, JN008690, male; MI011, Clinton, JN008583, male;
MI012, Clinton, JN008479, male; MI013, Clinton, JN008688, male;
MI014, Clinton, JN008609, male.
Montana.—MT001, Yellowstone, JN008699, male; MT002, Rose-
bud, JN008709, male; MT003, Rosebud, JN008490, female; MT004,
Rosebud, JN008686, male; MT005, Musselshell, JN008538, male;
MT006, Rosebud, JN008608, male; MT007, Rosebud, JN008702,
male; MT008, Rosebud, JN008630, female; MT009, Rosebud,
JN008562, male; MT010, Rosebud, JN008548, male; MT011,
Rosebud, JN008607, female; MT012, Dawson, JN008506, male;
MT013, Rosebud, JN008586, female; MT014, Rosebud, JN008691,
male; MT015, Rosebud, JN008659, male; MT017, Yellowstone,
JN008694, male.
Nebraska.—NE01, Fillmore, JN008587, unknown; NE03, Douglas,
JN008517, female; NE04, Cass, JN008524, male; NE05, York,
JN008657, male; NE06, Hall, JN008588, unknown; NE09, Seward,
JN008522, male; NE010, Fillmore, JN008571, male; NE011,
Nuckolls, JN008637, unknown; NE013, Nuckolls, JN008677, male.
Nevada.—NV002, Washoe, JN008575, male; NV003, Washoe,
JN008625, male; NV004, Washoe, JN008619, male; NV005,
Washoe, JN008618, male.
New Mexico.—NM001, Dona Ana, JN008556, unknown; NM002,
Dona Ana, JN008551, male; NM003, Dona Ana, JN008569, female;
NM004, Dona Ana, JN008599, male; NM005, Dona Ana, JN008446,
female; NM006, Dona Ana, JN008559, female; NM007, Dona Ana,
JN008549, male; NM008, Dona Ana, JN008535, male; NM009,
Dona Ana, JN008547, female; NM010, Dona Ana, JN008701, male;
NM011, Dona Ana, JN008471, male; NM012, Dona Ana, JN008617,
male; NM013, Dona Ana, JN008453, female; NM014, Dona Ana,
JN008540, female; NM015, Dona Ana, JN008452, female; NM016,
Dona Ana, JN008565, female; NM017, Dona Ana, JN008679,
female; NM018, Dona Ana, JN008472, male; NM019, Dona Ana,
JN008594, male; NM020, Dona Ana, JN008592, male.
North Dakota.—ND002, Slope, JN008674, male; ND005, Ransom,
JN008567, male; ND006, Ransom, JN008590, male; ND007, Logan,
JN008475, male; ND011, McHenry, JN008558, male; ND012,
McHenry, JN008651, female.
Ohio.—IN010, Williams, JN008684, male; IN013, Williams,
JN008707, male.
Oregon.—OR001, Wasco, JN008481, male; OR002, Crook,
JN008473, male; OR003, Deschutes, JN008494, male; OR004,
Crook, JN008683, female; OR005, Deschutes, JN008650, female;
OR006, Deschutes, JN008462, male; OR007, Deschutes, JN008466,
female; OR008, Crook, JN008589, male; OR010, Crook, JN008465,
female.
Texas.—TX001, Angelina, JN008536, unknown; TX002, Brown,
JN008552, unknown; TX003, Webb, JN008568, unknown; TX004,
Webb, JN008554, unknown; TX005, Webb, JN008530, unknown;
TX006, Webb, JN008581, unknown; TX008, Rusk, JN008544,
unknown; TX009, Brown, JN008512, unknown; TX010, Comanche,
JN008501, unknown; TX011, Comanche, JN008550, unknown;
TX012, Hamilton, JN008579, unknown; TX013, Rusk, JN008578,
unknown; TX014, Comanche, JN008653, unknown; TX015, Brown,
JN008526, unknown; TX016, Hidalgo, JN008566, unknown; TX017,
Rusk, JN008669, unknown; TX018, Comanche, JN008491, un-
known; TX019, Comanche, JN008445, unknown; TX020, Brown,
JN008644, unknown; TX021, Angelina, JN008670, unknown;
TX022, Angelina, JN008689, unknown; TX023, Moore, JN008518,
unknown; TX024, Cherokee, JN008542, unknown; TX028, Collin,
JN008532, unknown; TX029, Tarrant, JN008616, unknown; TX030,
Wichita, JN008678, unknown; TX031, Tarrant, JN008509, unknown;
TX032, Midland, JN008441, unknown; TX033, Wichita, JN008496,
unknown; TX035, Collin, JN008444, unknown; TX036, Hutchinson,
JN008603, unknown; TX037, Wichita, JN008498, unknown; TX038,
Wichita, JN008484, unknown; TX039, Cherokee, JN008563, un-
known; TX040, Gregg, JN008545, unknown; TX041, Wichita,
JN008553, unknown; TX042, Collin, JN008505, unknown; TX043,
Gregg, JN008442, unknown; TX044, Collin, JN008485, unknown;
TX045, Wichita, JN008561, unknown; TX046, Johnson, JN008555,
unknown; TX047, Midland, JN008443, unknown; TX049, Hutch-
inson, JN008543, unknown.
Vermont.—VT0901, Orleans, JN008519, male; VT0902, Franklin,
JN008493, male; VT0903, Franklin, JN008564, male; VT0905,
Orleans, JN008456, female; VT0907, Lamoille, JN008664, female.
Virginia.—VA001, Washington, JN008661, male; VA002, Wash-
ington, JN008660, male; VA003, Scott, JN008634, male; VA004,
Washington, JN008516, male; VA005, Washington, JN008643, male.
West Virginia.—WV1, Cabell, JN008671, unknown; WV2, Mason,
JN008457, unknown; WV3, Mason, JN008708, unknown; WV4,
Wayne, JN008662, unknown; WV5, Randolph, JN008673, male;
WV6, Randolph, JN008687, female; WV7, Mason, JN008682, male;
WV8, Mason, JN008458, male; WV9, Jackson, JN008672, male;
WV11, Monongalia, JN008467, male; WV12, Wetzel, JN008705,
male; WV13, Harrison, JN008695, male; WV14, Preston, JN008649,
male; WV15, Marshall, JN008658, male; WV17, Marion, JN008523,
male; WV18, Upshur, JN008478, male; WV19, Taylor, JN008666,
male; WV20, Barbour, JN008560, unknown.
Wyoming.—WY001, Crook, JN008628, male; WY002, Fremont,
JN008451, unknown; WY003, Fremont, JN008487, unknown;
WY004, Fremont, JN008622, unknown; WY005, Fremont,
JN008448, unknown; WY006, Fremont, JN008668, unknown;
WY007, Fremont, JN008450, unknown; WY008, Fremont,
JN008546, unknown; WY009, Fremont, JN008449, unknown;
WY010, Fremont, JN008624, unknown; WY011, Fremont,
JN008623, unknown; WY012, Fremont, JN008681, unknown;
WY013, Fremont, JN008513, unknown; WY014, Natrona,
JN008528, unknown; WY015, Natrona, JN008706, male; WY016,
Natrona, JN008621, male; WY019, Carbon, JN008645, unknown;
WY021, Carbon, JN008620, male.
February 2012 BARTON AND WISELY—PHYLOGEOGRAPHY OF STRIPED SKUNKS 51
Dow
nloaded from https://academ
ic.oup.com/jm
amm
al/article-abstract/93/1/38/899396 by guest on 05 May 2019