physbiochem enzyme kinetics
TRANSCRIPT
8/2/2019 PhysBiochem Enzyme Kinetics
http://slidepdf.com/reader/full/physbiochem-enzyme-kinetics 1/29
Physical Biochemistry
Enzyme kinetics
8/2/2019 PhysBiochem Enzyme Kinetics
http://slidepdf.com/reader/full/physbiochem-enzyme-kinetics 2/29
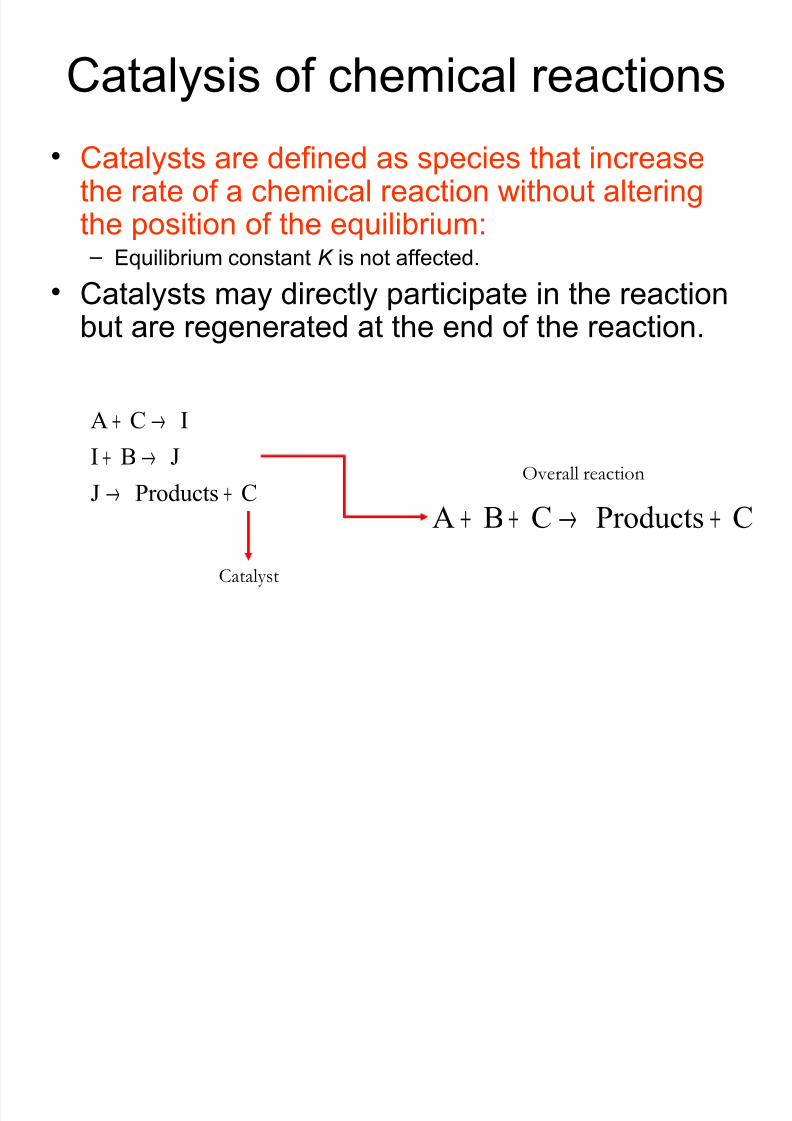
Catalysis of chemical reactions
• Catalysts are defined as species that increasethe rate of a chemical reaction without alteringthe position of the equilibrium: – Equilibrium constant K is not affected.
• Catalysts may directly participate in the reactionbut are regenerated at the end of the reaction.
CProductsJ
JBIICA
+→
→+
→+
CProductsCBA +→++
Catalyst
Overall reaction
8/2/2019 PhysBiochem Enzyme Kinetics
http://slidepdf.com/reader/full/physbiochem-enzyme-kinetics 3/29
Enzymes
• Very high rate enhancements : – Typically 10 6 – 10 14 compared to uncatalyzed rate. – Diffusion-controlled/limited : Enhancement is so high,
the rate essentially depends on fast a substrate canreach the active site.
• High selectivity : – Only particular substrates can bind.
• High specificity : – Only particular reaction is catalyzed:• E.g. Glucosyl transferase will only add glucose on to 2
position of another glucose, but not at the other positions 3,4and 6.
8/2/2019 PhysBiochem Enzyme Kinetics
http://slidepdf.com/reader/full/physbiochem-enzyme-kinetics 4/29
Enzymes
• Have ability to respond to external signalsor their environment: – Activity of enzymes can be controlled or
altered. – Very important prerequisite to control
metabolism.
8/2/2019 PhysBiochem Enzyme Kinetics
http://slidepdf.com/reader/full/physbiochem-enzyme-kinetics 5/29
Free energy of binding
• Enzymes use the free energy of binding ∆bG to
change the free energy of activation ∆ ‡G.• Rate of reaction is determined by the free
energy difference between transition state andreactants: – Reduction of this difference increases rate.
• For single-substrate reactions, two ways: – Destabilize substrate / stabilize transition state. – Altering the reaction mechanism.
8/2/2019 PhysBiochem Enzyme Kinetics
http://slidepdf.com/reader/full/physbiochem-enzyme-kinetics 6/29
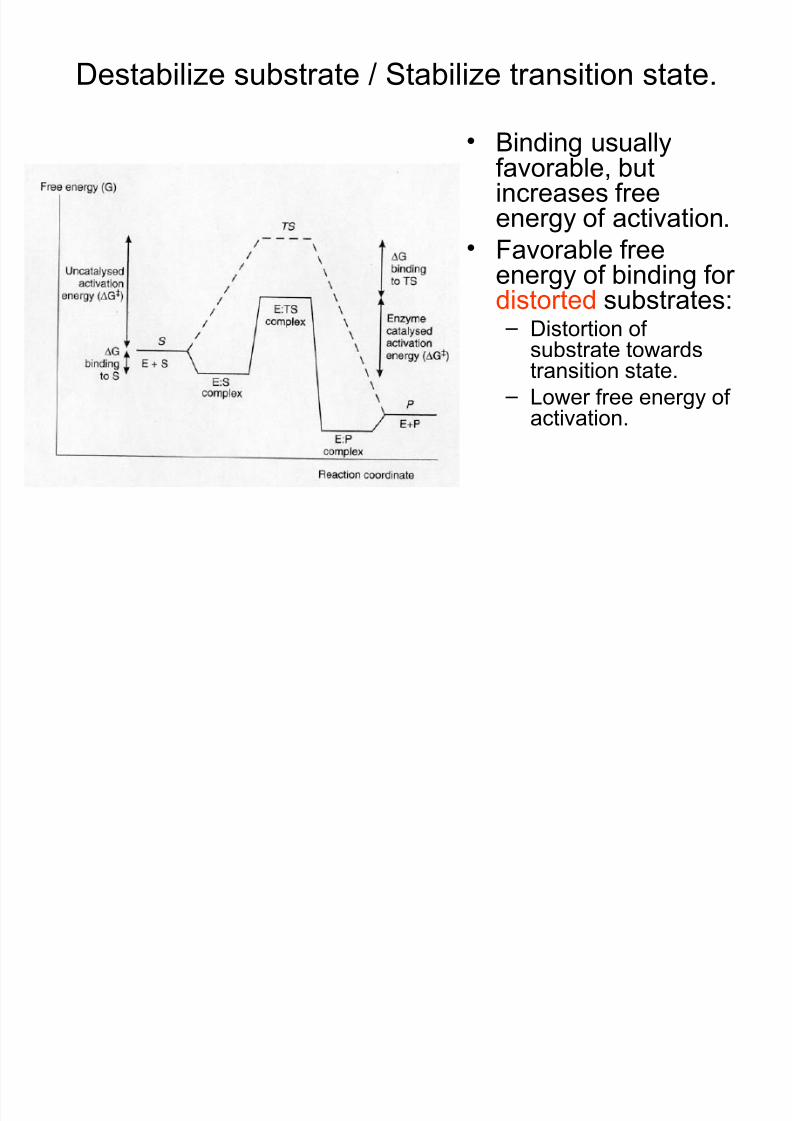
Destabilize substrate / Stabilize transition state.
• Binding usuallyfavorable, butincreases freeenergy of activation.
• Favorable freeenergy of binding for distorted substrates: – Distortion of
substrate towardstransition state.
– Lower free energy of activation.
8/2/2019 PhysBiochem Enzyme Kinetics
http://slidepdf.com/reader/full/physbiochem-enzyme-kinetics 7/29
Altering reaction mechanism
• Enzyme provides functional groups that aremore effective than the normal reactants : – Glu of enzyme acts as proton donor instead of water
of solvent.• This changes the reaction mechanism towards a
path with a lower free energy of activation: – Increases rate.
• Free energy of binding is used to position thesubstrate in the best possible orientation withrespect to the functional groups.
8/2/2019 PhysBiochem Enzyme Kinetics
http://slidepdf.com/reader/full/physbiochem-enzyme-kinetics 8/29
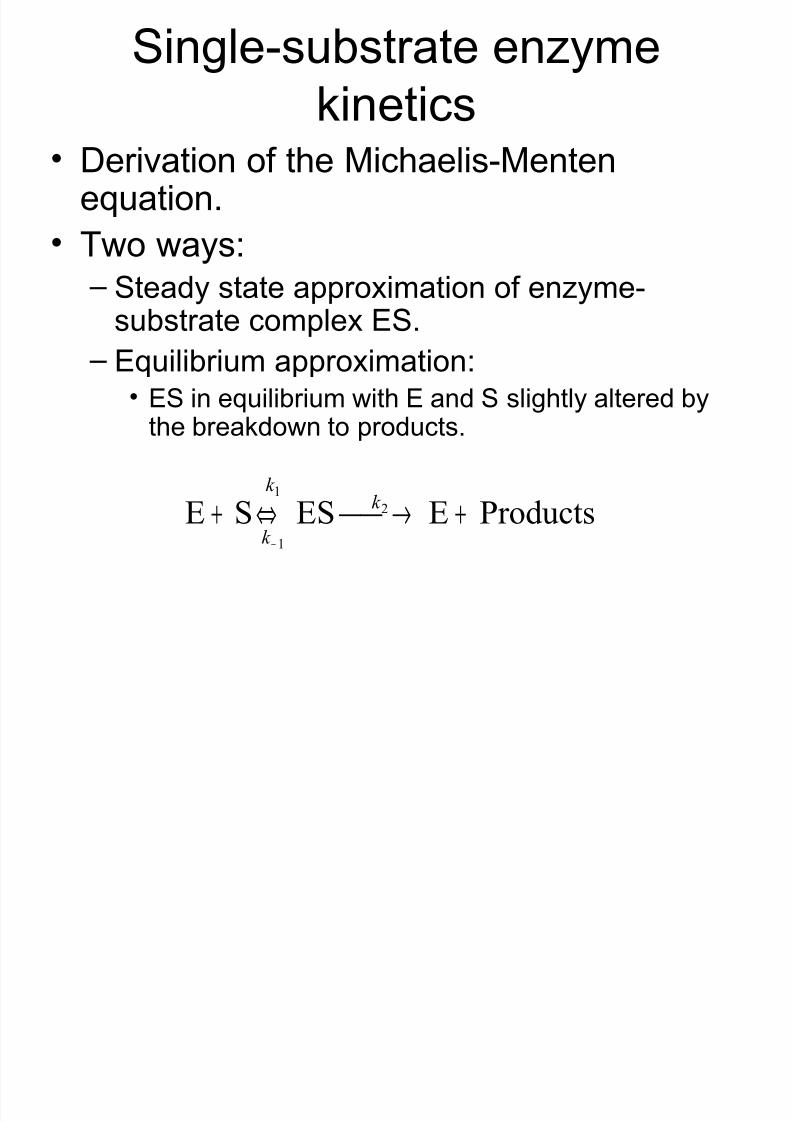
Single-substrate enzymekinetics
• Derivation of the Michaelis-Mentenequation.
• Two ways: – Steady state approximation of enzyme-
substrate complex ES. – Equilibrium approximation:
• ES in equilibrium with E and S slightly altered bythe breakdown to products.
ProductsEESSE 21
1
+ → ⇔+−
k k
k
8/2/2019 PhysBiochem Enzyme Kinetics
http://slidepdf.com/reader/full/physbiochem-enzyme-kinetics 9/29
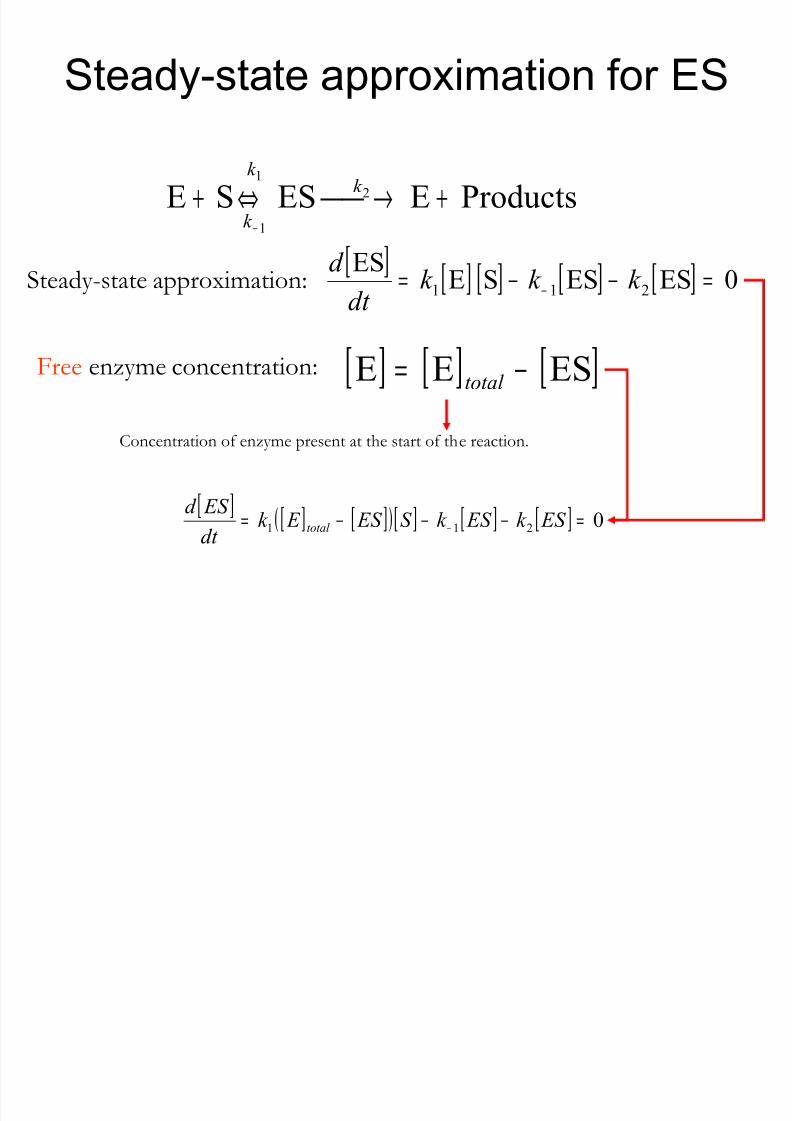
Steady-state approximation for ES
ProductsEESSE 21
1
+ → ⇔+−
k k
k
[ ] [ ] [ ] [ ] [ ]0ESESSEES 211 =−−= − k k k dt
d Steady-state approximation:
[ ] [ ] [ ]ESEE −=total
Free enzyme concentration:
Concentration of enzyme present at the start of the reaction.
[ ] [ ] [ ]( )[ ] [ ] [ ]0211=−−−=
−ES k ES k S ES E k
dt
ES d total
8/2/2019 PhysBiochem Enzyme Kinetics
http://slidepdf.com/reader/full/physbiochem-enzyme-kinetics 10/29
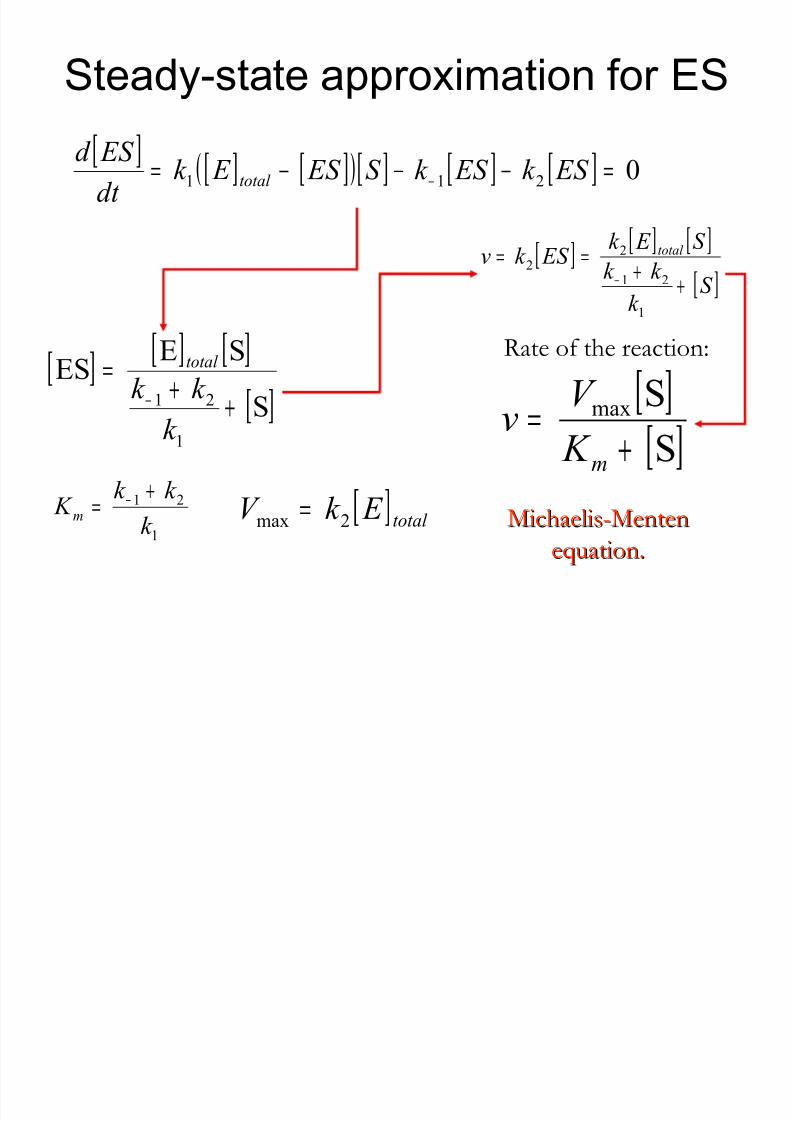
Steady-state approximation for ES
[ ] [ ] [ ]( )[ ] [ ] [ ]0211=−−−=
−ES k ES k S ES E k
dt
ES d total
[ ] [ ] [ ]
[ ]S
SEES
1
21
+
+=
−
k
k k total
[ ] [ ] [ ]
[ ]S k
k k
S E k ES k v total
++
==−
1
21
22
Rate of the reaction:
[ ][ ]SS
max+
=m
K
V v
1
21
k
k k K
m
+= − [ ]total
E k V 2max
= Michaelis-MentenMichaelis-Menten
equation.equation.
8/2/2019 PhysBiochem Enzyme Kinetics
http://slidepdf.com/reader/full/physbiochem-enzyme-kinetics 11/29
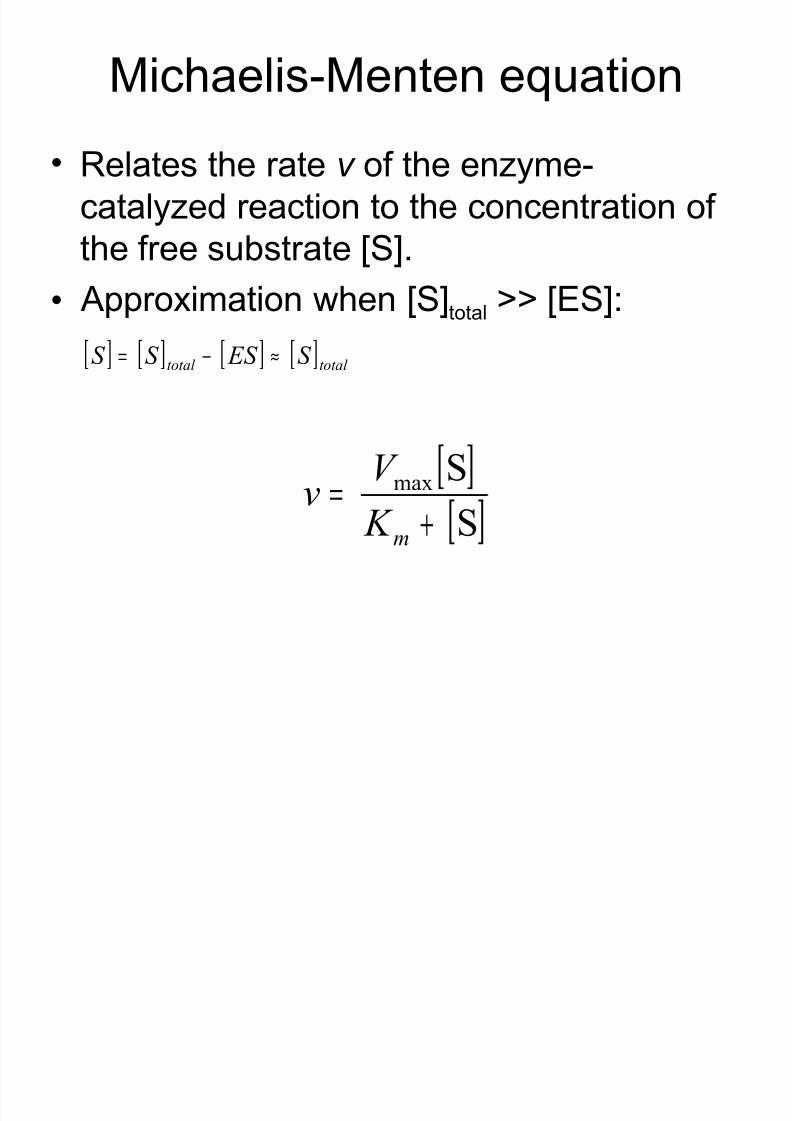
Michaelis-Menten equation
• Relates the rate v of the enzyme-catalyzed reaction to the concentration of the free substrate [S].
• Approximation when [S] total >> [ES]:
[ ][ ]SSmax
+=
m K
V v
[ ] [ ] [ ] [ ]total total S ES S S ≈−=
8/2/2019 PhysBiochem Enzyme Kinetics
http://slidepdf.com/reader/full/physbiochem-enzyme-kinetics 12/29
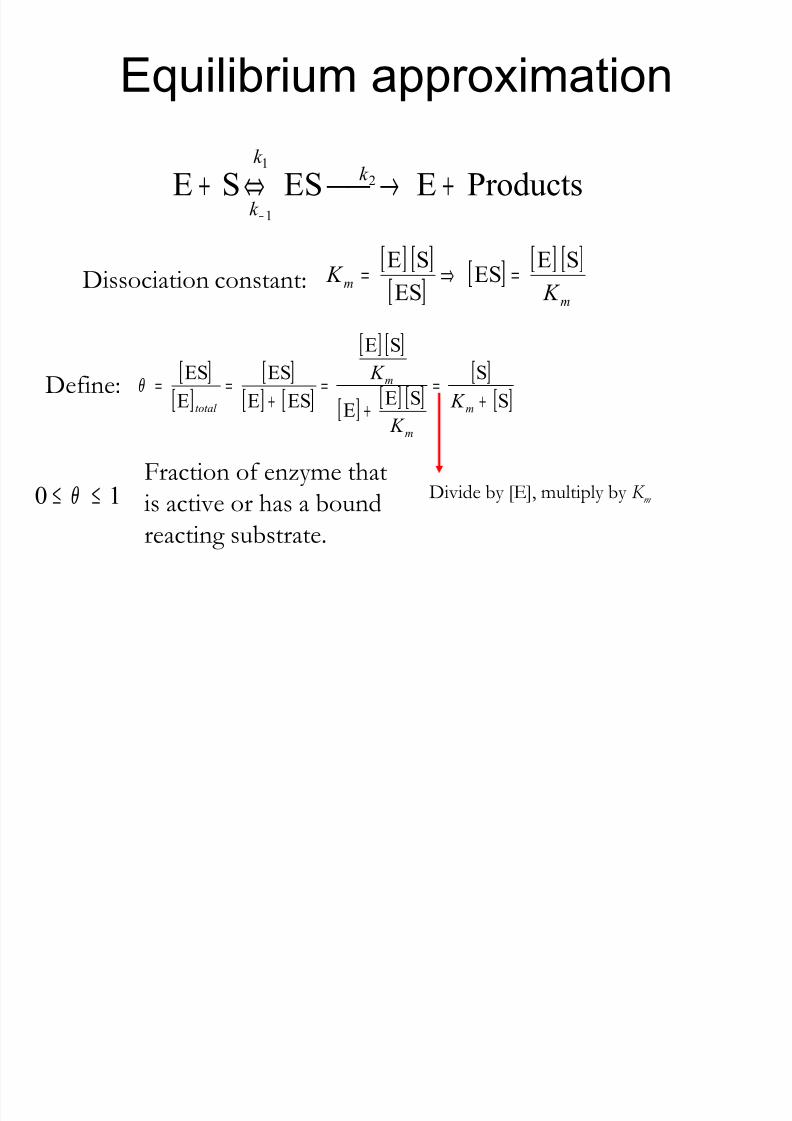
Equilibrium approximation
ProductsEESSE 21
1
+ → ⇔+−
k k
k
[ ] [ ][ ] [ ]
[ ] [ ]m
m K K
SEESES
SE=⇒=Dissociation constant:
[ ][ ]
[ ][ ] [ ]
[ ] [ ]
[ ][ ] [ ]
[ ][ ]S
SSE
E
SE
ESEES
EES
+=
+
=+
==m
m
m
total K
K
K θ Define:
10 ≤≤ θ Fraction of enzyme thatis active or has a boundreacting substrate.
Divide by [E], multiply by K m
8/2/2019 PhysBiochem Enzyme Kinetics
http://slidepdf.com/reader/full/physbiochem-enzyme-kinetics 13/29
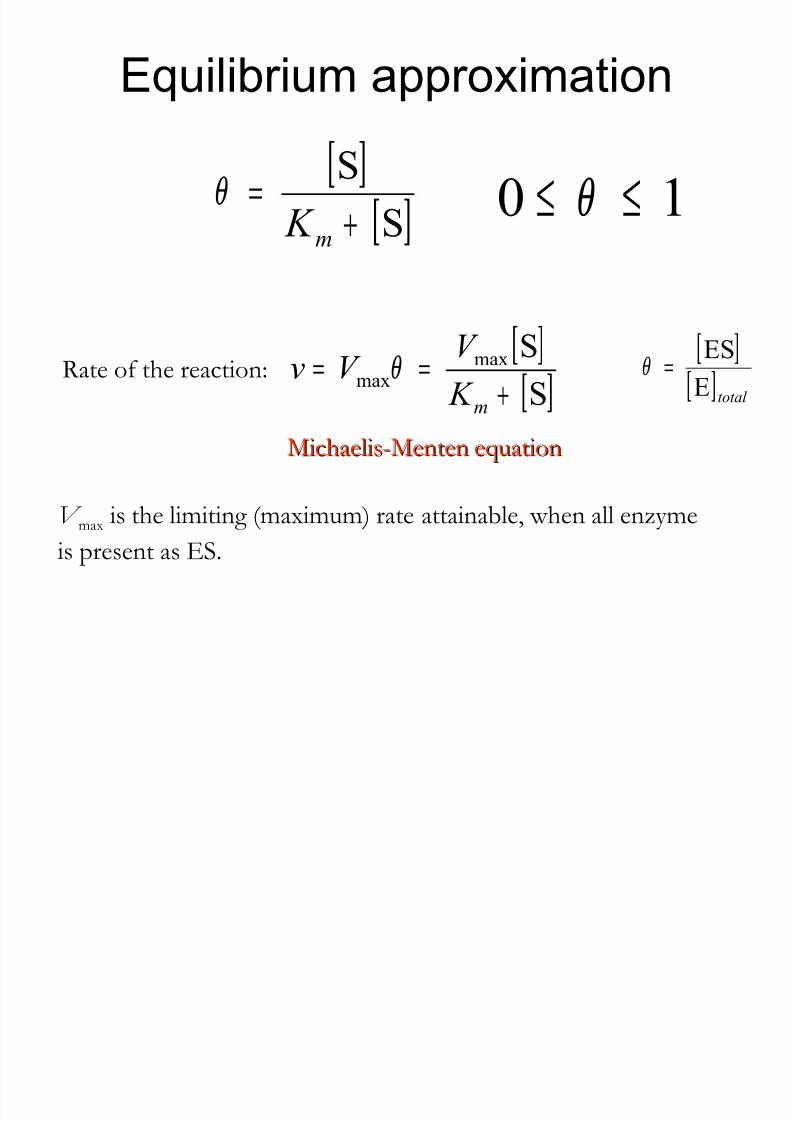
Equilibrium approximation
[ ][ ]S
S+
=m
K θ 10 ≤≤ θ
Rate of the reaction:[ ][ ]SSmax
max +==
m K
V V v θ
Michaelis-Menten equationMichaelis-Menten equation
V max is the limiting (maximum) rate attainable, when all enzyme
is present as ES.
[ ][ ]total E
ES=θ
8/2/2019 PhysBiochem Enzyme Kinetics
http://slidepdf.com/reader/full/physbiochem-enzyme-kinetics 14/29
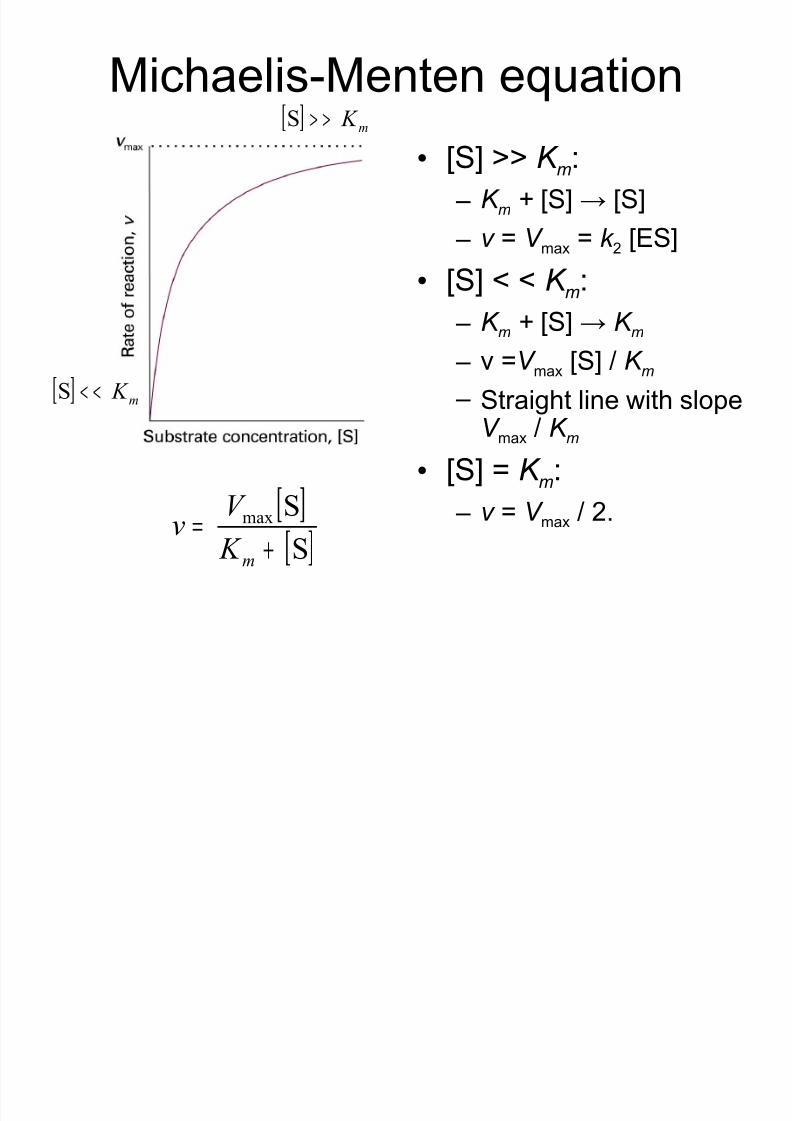
Michaelis-Menten equation
• [S] >> K m: – K m + [S] → [S] – v = V max = k 2 [ES]
• [S] < < K m: – K m + [S] → K m – v = V max [S] / K m – Straight line with slope
V max / K m• [S] = K m:
– v = V max / 2.[ ]
[ ]S
Smax
+
=m K
V v
[ ] m K > >S
[ ] m K < <S
8/2/2019 PhysBiochem Enzyme Kinetics
http://slidepdf.com/reader/full/physbiochem-enzyme-kinetics 15/29
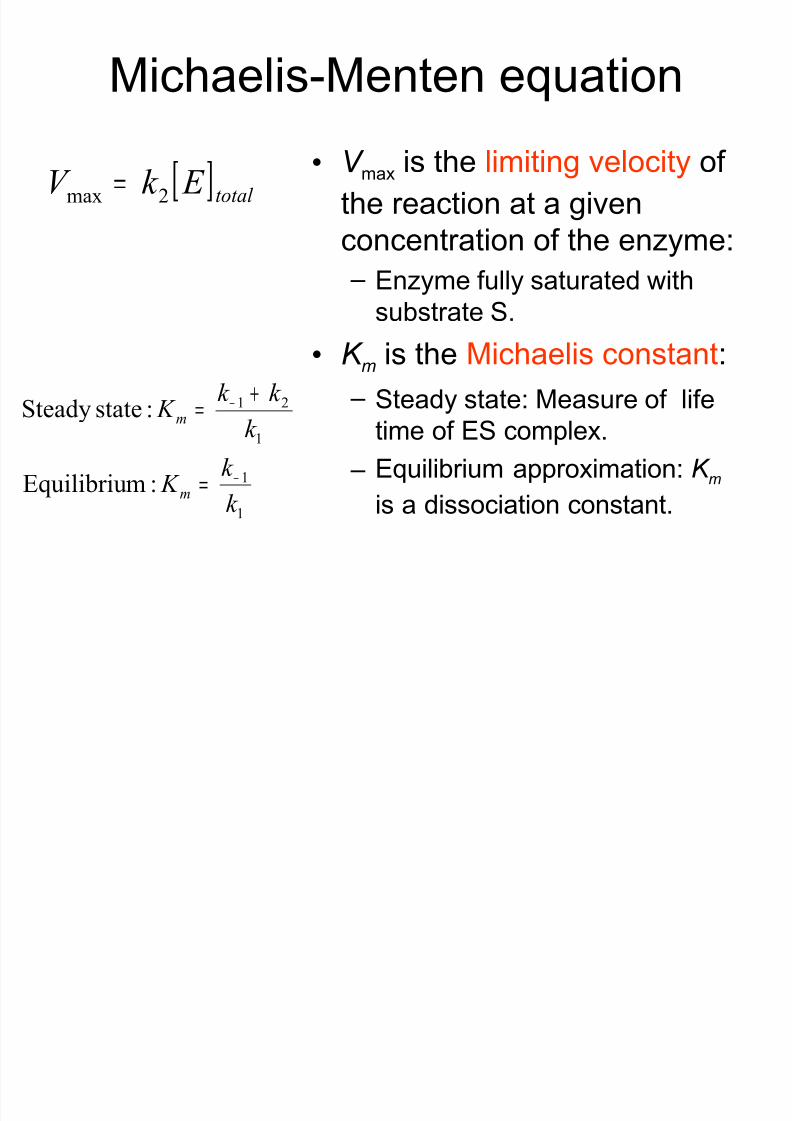
Michaelis-Menten equation
• V max is the limiting velocity of the reaction at a givenconcentration of the enzyme:
– Enzyme fully saturated withsubstrate S.
• K m is the Michaelis constant : – Steady state: Measure of life
time of ES complex. – Equilibrium approximation: K m
is a dissociation constant.
[ ]total E k V
2max=
1
1
1
21
:mEquilibriu
:stateSteady
k
k K
k
k k
K
m
m
−
−
=
+
=
8/2/2019 PhysBiochem Enzyme Kinetics
http://slidepdf.com/reader/full/physbiochem-enzyme-kinetics 16/29
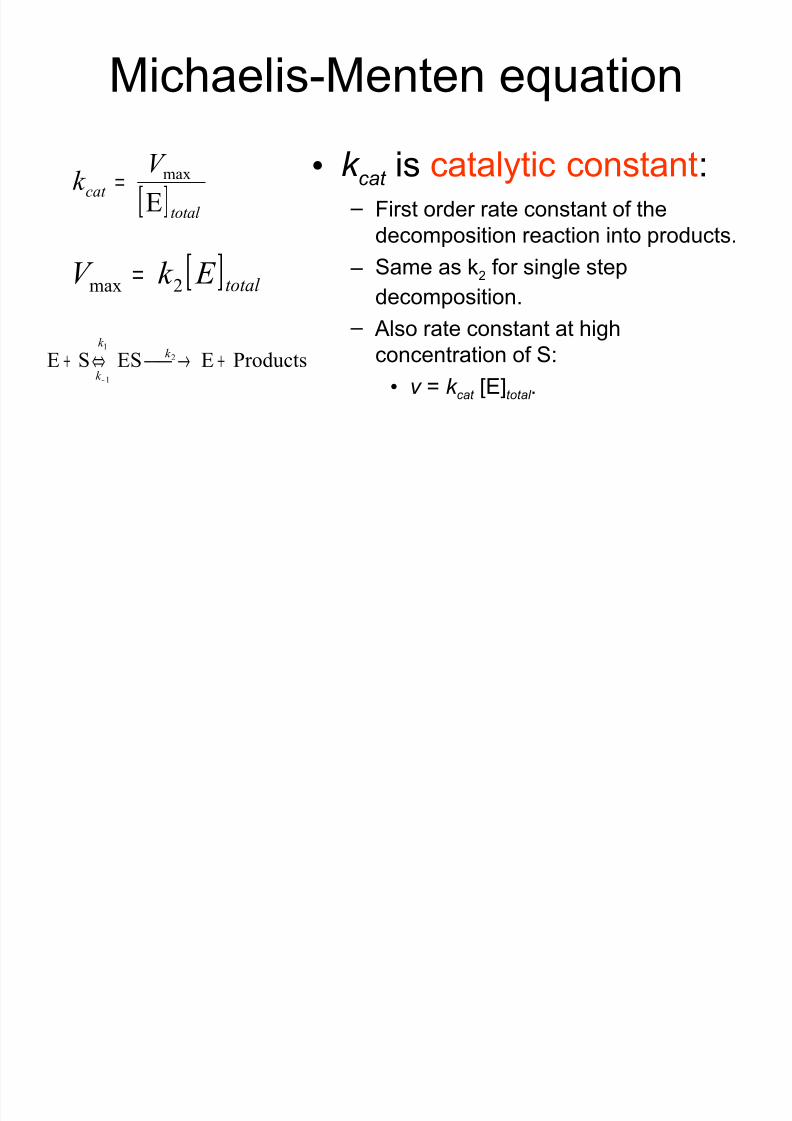
Michaelis-Menten equation
• k cat is catalytic constant : – First order rate constant of the
decomposition reaction into products.
– Same as k 2 for single stepdecomposition. – Also rate constant at high
concentration of S:• v = k cat [E]total .
[ ]total
cat
V k
Emax=
[ ]total E k V 2max =
ProductsEESSE 21
1
+ → ⇔+−
k k
k
8/2/2019 PhysBiochem Enzyme Kinetics
http://slidepdf.com/reader/full/physbiochem-enzyme-kinetics 17/29
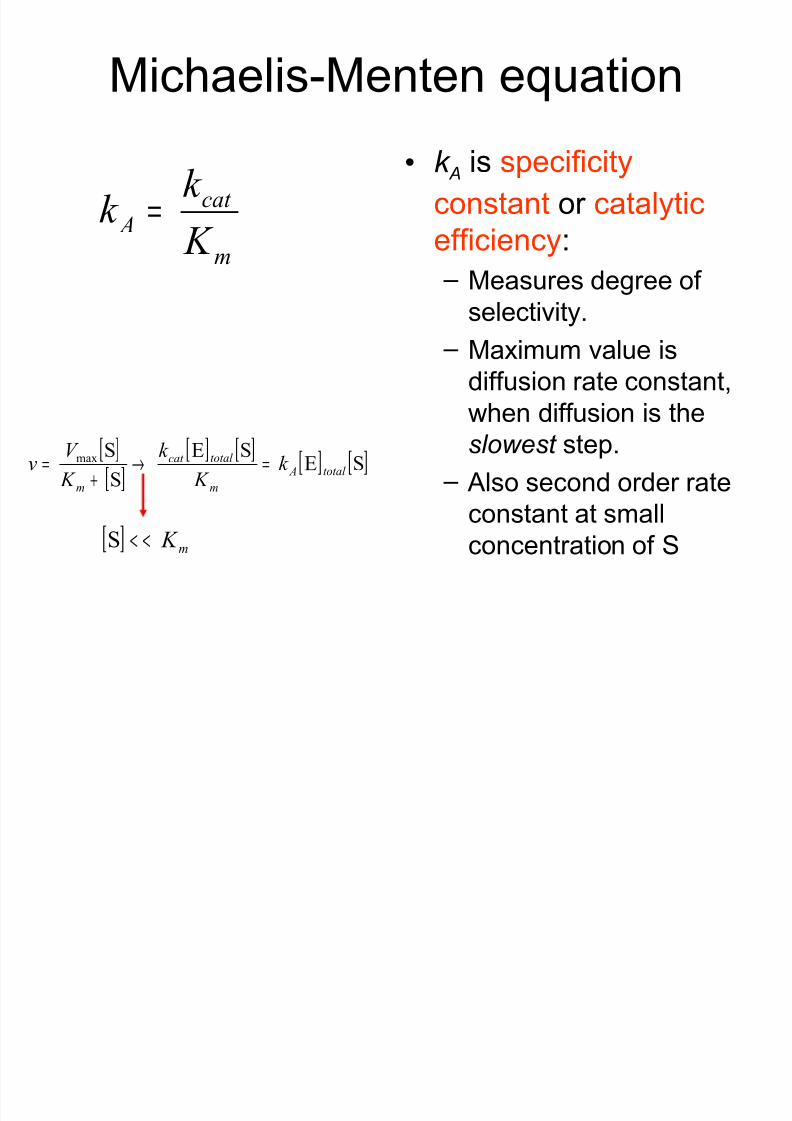
Michaelis-Menten equation
• k A is specificity constant or catalyticefficiency :
– Measures degree of selectivity.
– Maximum value isdiffusion rate constant,
when diffusion is theslowest step.
– Also second order rateconstant at small
concentration of S
m
cat A
K
k k =
[ ][ ]
[ ] [ ] [ ] [ ]SESE
SSmax
total A
m
total cat
m
k K
k
K
V v =→
+=
[ ] m K < <S
8/2/2019 PhysBiochem Enzyme Kinetics
http://slidepdf.com/reader/full/physbiochem-enzyme-kinetics 18/29
Michaelis-Menten equation
• Turnover number: – Moles of substrate consumed or product
formed per mole enzyme per unit time. – Same as k cat .
8/2/2019 PhysBiochem Enzyme Kinetics
http://slidepdf.com/reader/full/physbiochem-enzyme-kinetics 19/29
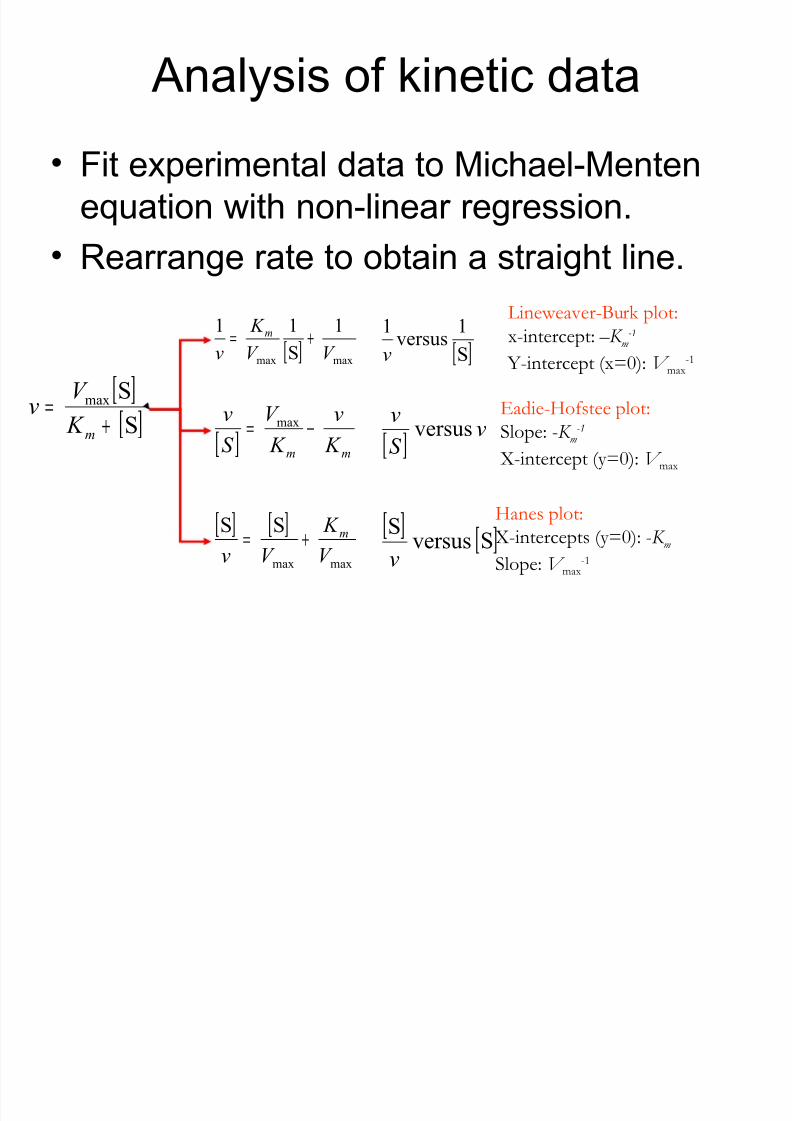
Analysis of kinetic data
• Fit experimental data to Michael-Mentenequation with non-linear regression.
• Rearrange rate to obtain a straight line.
[ ][ ]SSmax
+=
m K
V v
[ ] maxmax
1S11
V V
K
vm +=
[ ]S1
versus1v
Lineweaver-Burk plot:x-intercept: – K
m -1
Y-intercept (x=0): V max
-1
[ ] mmK
v K V
S v −= max
[ ]v
S v versus Eadie-Hofstee plot:Slope: -K
m -1
X-intercept (y=0): V max
[ ] [ ]maxmax
SS
V
K
V v
m+= [ ] [ ]SversusSv
Hanes plot:X-intercepts (y=0): - K
m
Slope: V max
-1
8/2/2019 PhysBiochem Enzyme Kinetics
http://slidepdf.com/reader/full/physbiochem-enzyme-kinetics 20/29
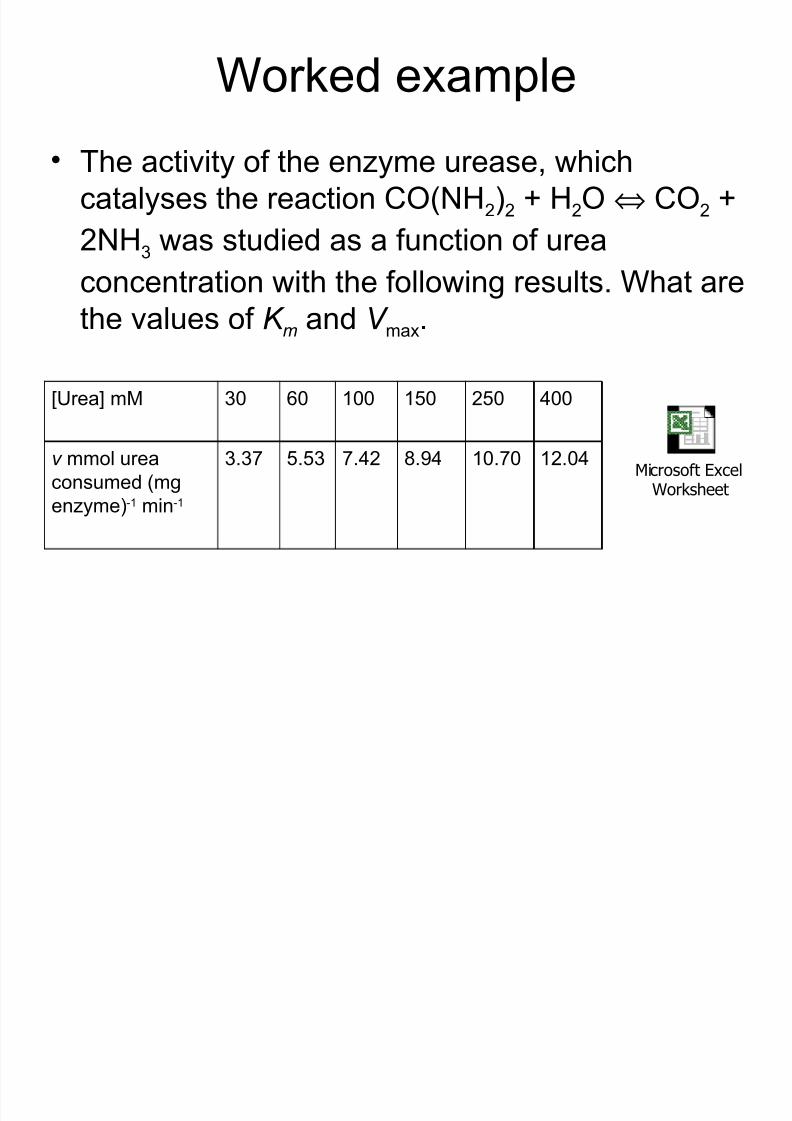
Worked example
• The activity of the enzyme urease, whichcatalyses the reaction CO(NH 2)2 + H 2O ⇔ CO 2 +2NH 3 was studied as a function of urea
concentration with the following results. What arethe values of K m and V max .
[Urea] mM 30 60 100 150 250 400
v mmol ureaconsumed (mgenzyme) -1 min -1
3.37 5.53 7.42 8.94 10.70 12.04 Microsoft ExcelWorksheet
8/2/2019 PhysBiochem Enzyme Kinetics
http://slidepdf.com/reader/full/physbiochem-enzyme-kinetics 21/29
Limitations• Pre-steady-state period:
– Reaction reaches not immediately equilibrium:• Can be used to obtain better information about reaction.
– Rate equations much more complex.• Approach to equilibrium:
– Assumption: Forward reaction towards products is irreversible. – Practise: Reversible reaction if product concentration is high enough.• Product inhibition:
– Product has an ability to bind to active site to become an competitiveinhibitor.
• Substrate inhibition:
– Some enzymes are inhibited by high substrate concentration. – Usually indicates a second binding site for substrate.• Enzymes with more than one active site:
– Active sites may affect each other. – Positive, negative cooperativity.
8/2/2019 PhysBiochem Enzyme Kinetics
http://slidepdf.com/reader/full/physbiochem-enzyme-kinetics 22/29
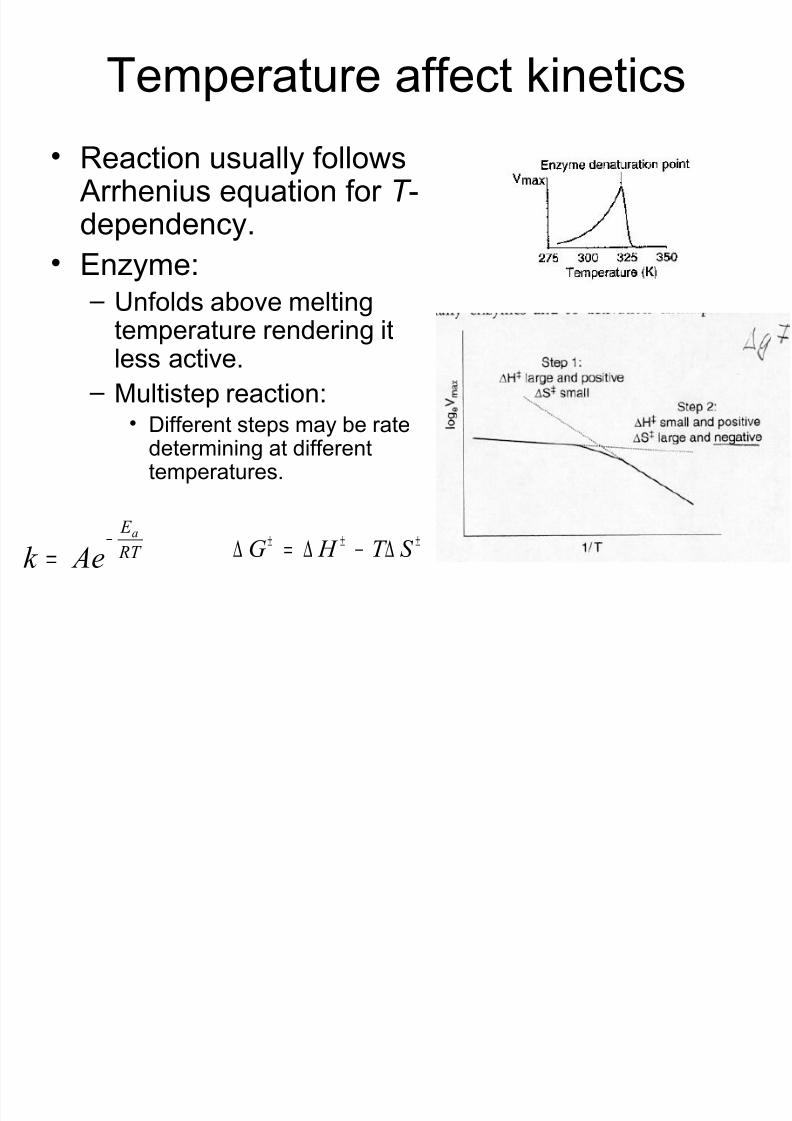
Temperature affect kinetics
• Reaction usually follows Arrhenius equation for T -dependency.
• Enzyme: – Unfolds above meltingtemperature rendering itless active.
– Multistep reaction:• Different steps may be rate
determining at differenttemperatures.
RT
E a
Aek −
=±±±
∆−∆=∆ S T H G
8/2/2019 PhysBiochem Enzyme Kinetics
http://slidepdf.com/reader/full/physbiochem-enzyme-kinetics 23/29
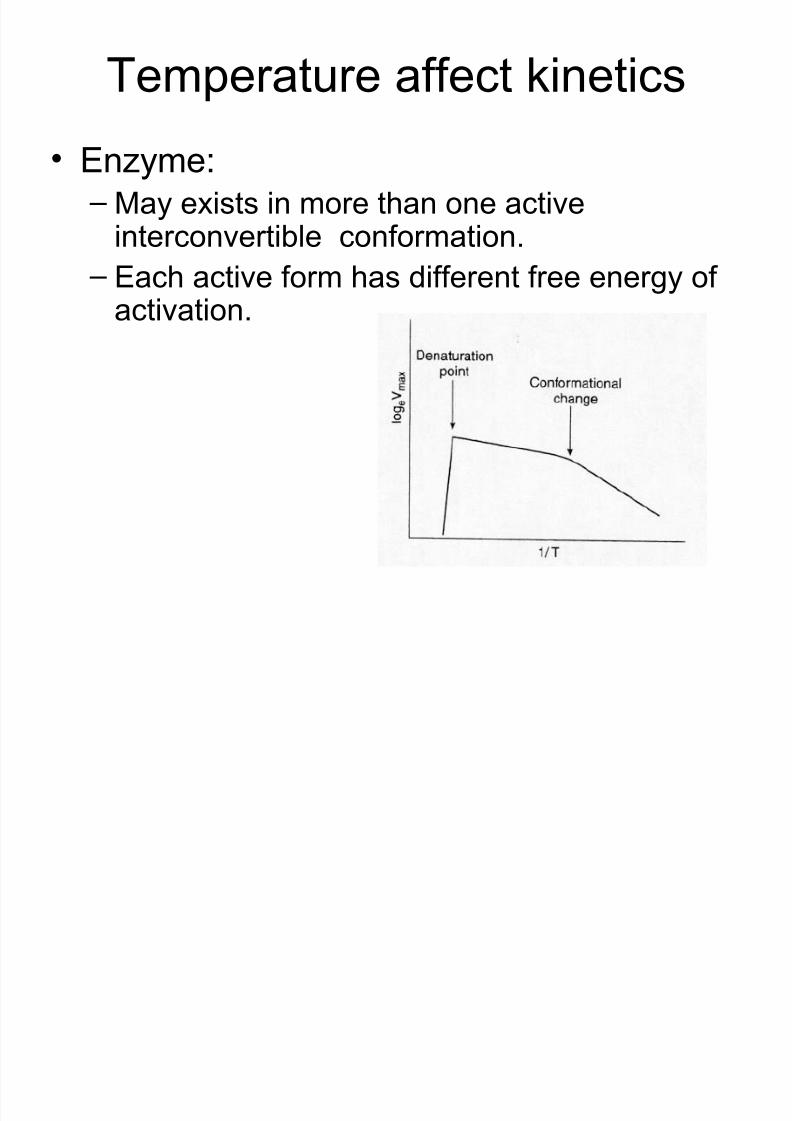
Temperature affect kinetics
• Enzyme: – May exists in more than one active
interconvertible conformation.
– Each active form has different free energy of activation.
8/2/2019 PhysBiochem Enzyme Kinetics
http://slidepdf.com/reader/full/physbiochem-enzyme-kinetics 24/29
Effects of p H
• Changes in pH affects rates of enzyme-catalyzed reactions by: – H+ and/or OH - appear in rate equation(s).
– Changes in ionization state of substrate:• Additional acid-base catalysis.• Changes in substrate binding free energy:
– Affects K m.
– pH affect stability of enzyme:• Changes in ionization state of titrating residues: – May affect binding and therefore K m.
– May V max if titrating residues directly participate in reaction.
8/2/2019 PhysBiochem Enzyme Kinetics
http://slidepdf.com/reader/full/physbiochem-enzyme-kinetics 25/29
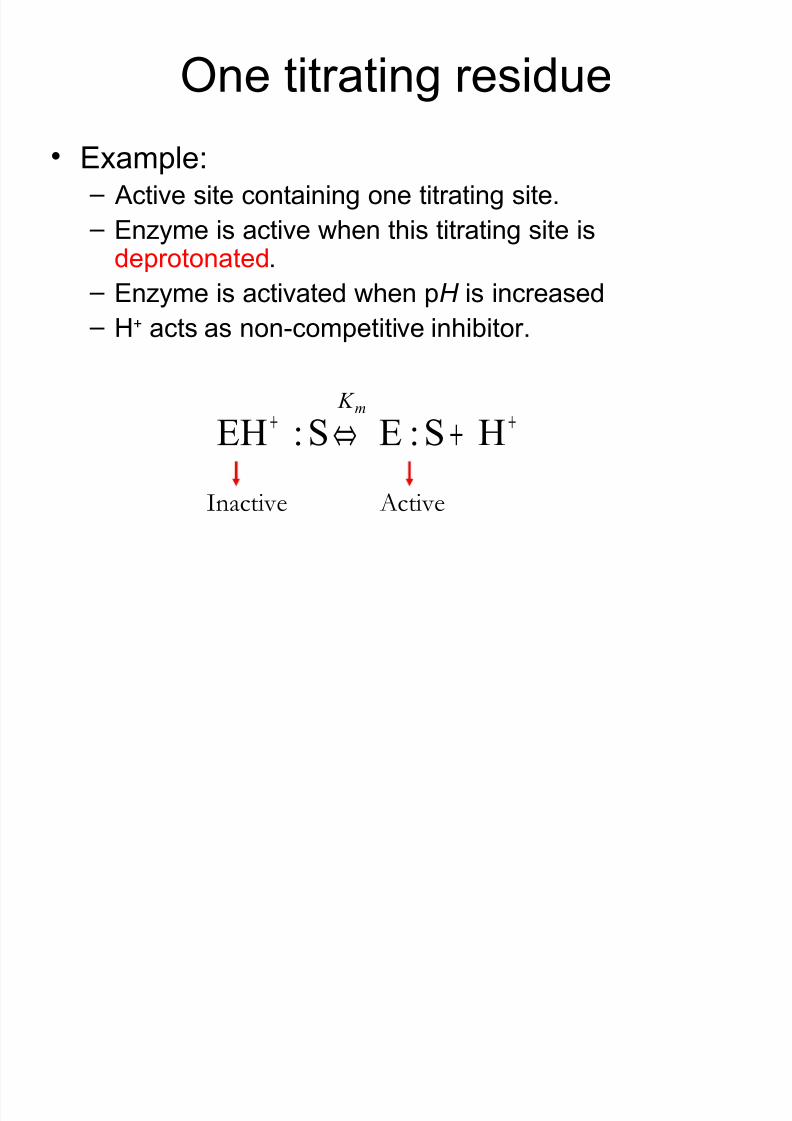
One titrating residue
• Example: – Active site containing one titrating site. – Enzyme is active when this titrating site is
deprotonated . – Enzyme is activated when p H is increased – H+ acts as non-competitive inhibitor.
++ +⇔ HS:ES:EHm K
Inactive Active
8/2/2019 PhysBiochem Enzyme Kinetics
http://slidepdf.com/reader/full/physbiochem-enzyme-kinetics 26/29
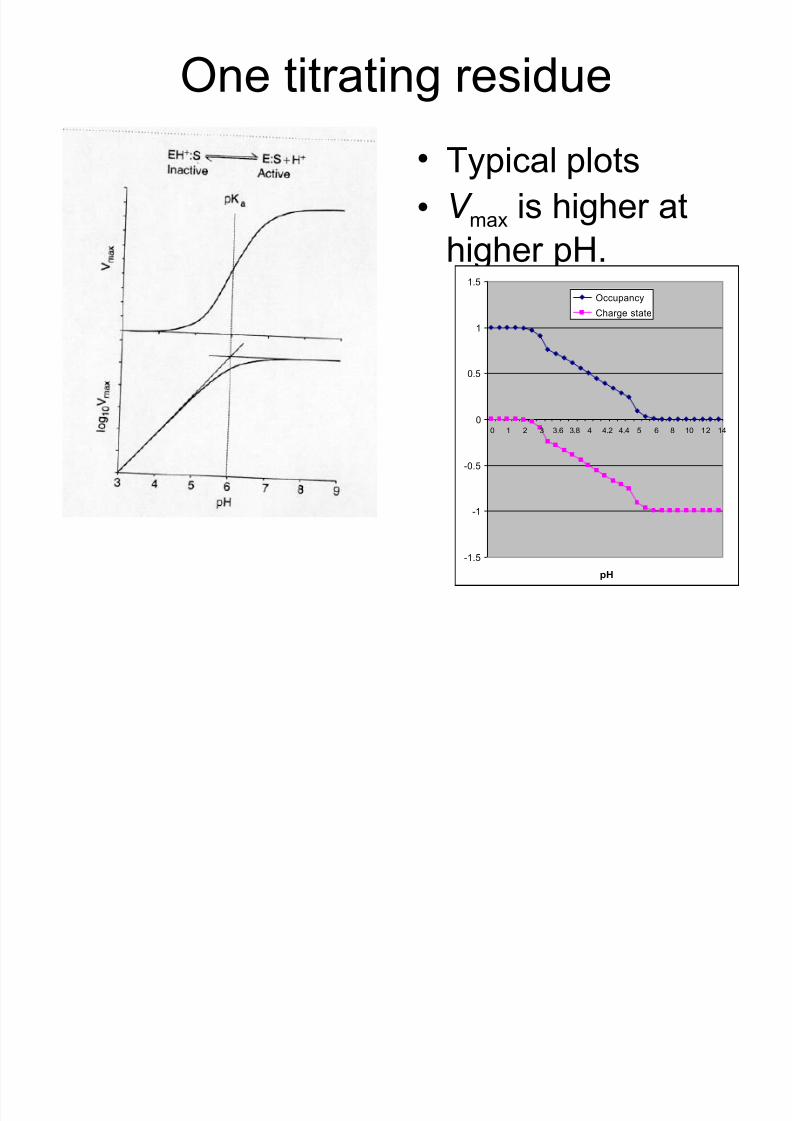
One titrating residue
• Typical plots• V max is higher at
higher pH.
-1.5
-1
-0.5
0
0.5
1
1.5
0 1 2 3 3.6 3.8 4 4.2 4.4 5 6 8 10 12 14
pH
Occupancy
Charge state
8/2/2019 PhysBiochem Enzyme Kinetics
http://slidepdf.com/reader/full/physbiochem-enzyme-kinetics 27/29
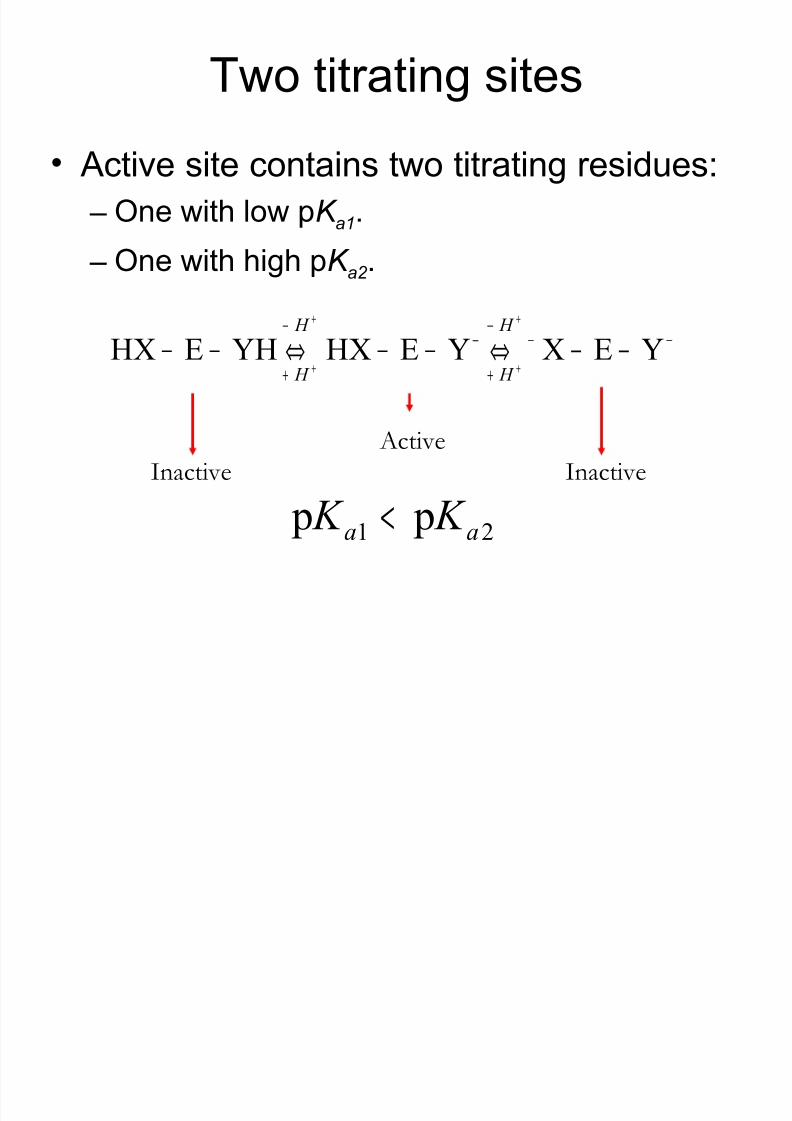
Two titrating sites
• Active site contains two titrating residues: – One with low p K a1 .
– One with high p K a2
.
−−−
+
−−
+
−−⇔−−⇔−−
+
+
+
+YEXYEHXYHEHX
H
H
H
H
ActiveInactive Inactive
21 p p aaK K <
8/2/2019 PhysBiochem Enzyme Kinetics
http://slidepdf.com/reader/full/physbiochem-enzyme-kinetics 28/29
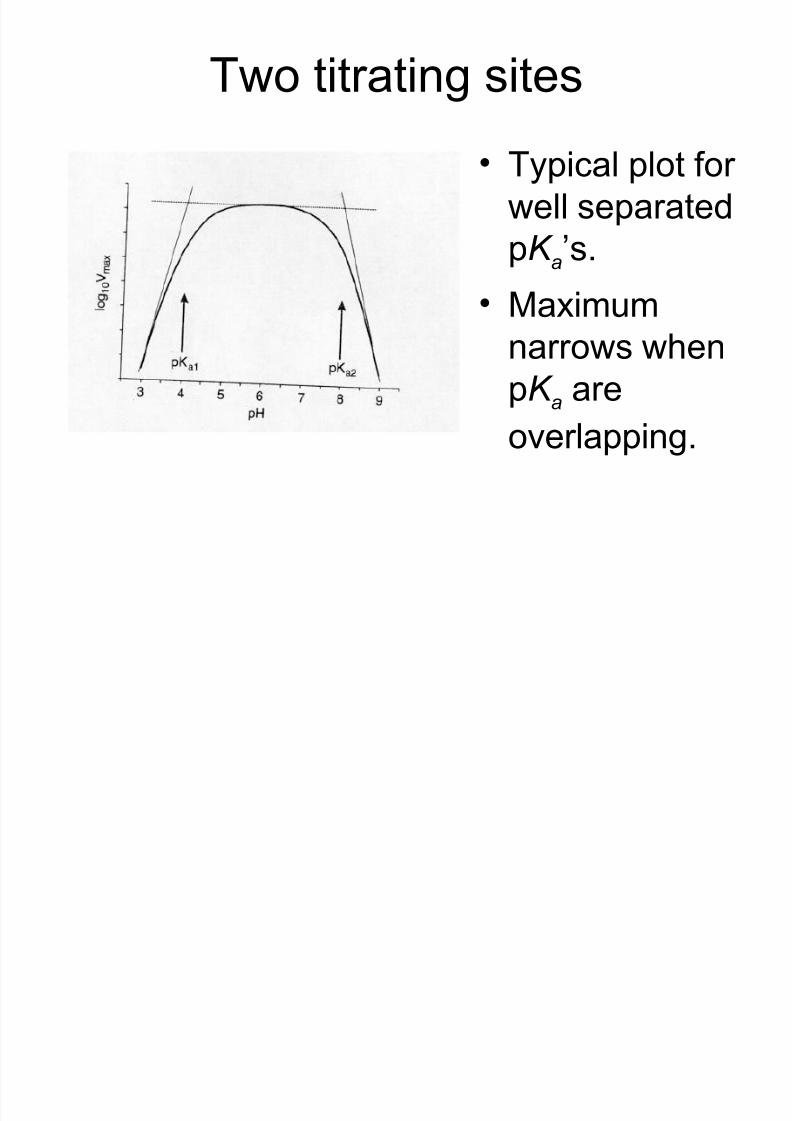
Two titrating sites
• Typical plot for well separatedpK a’s.
• Maximumnarrows whenpK a areoverlapping.
8/2/2019 PhysBiochem Enzyme Kinetics
http://slidepdf.com/reader/full/physbiochem-enzyme-kinetics 29/29
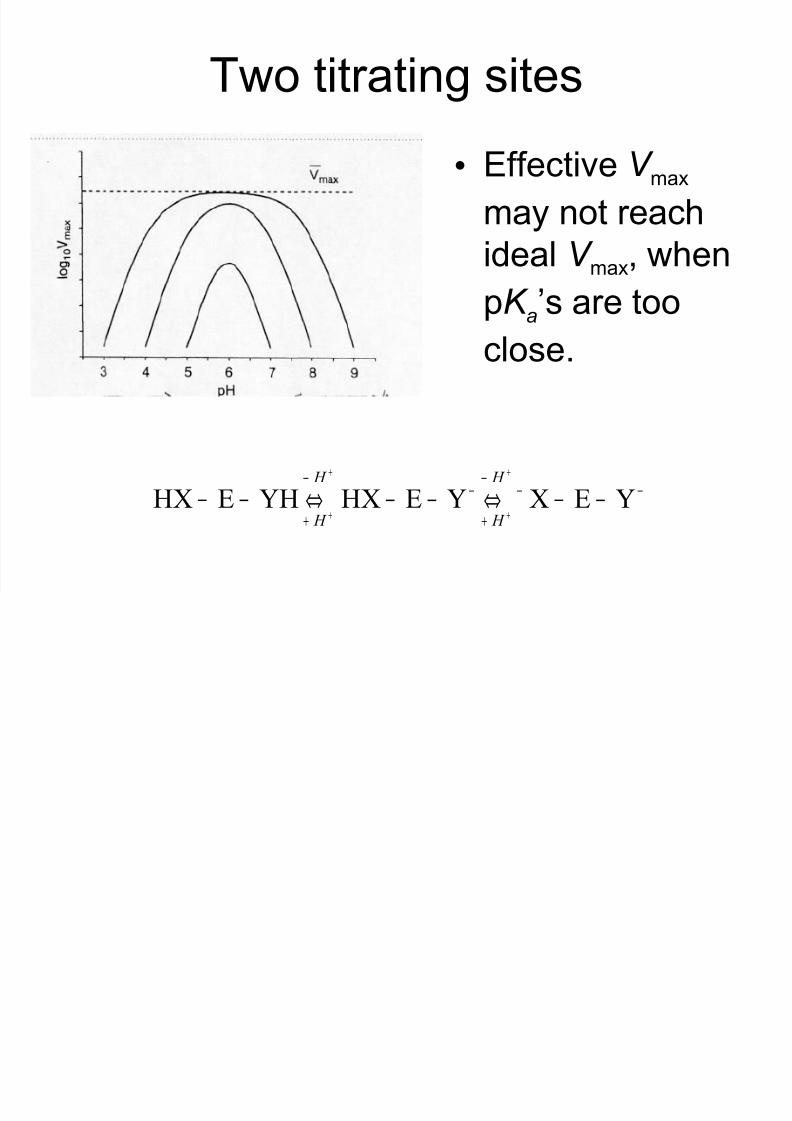
Two titrating sites
• Effective V max may not reachideal V max , whenpK a’s are tooclose.
−−−
+
−−
+
−−⇔−−⇔−−
+
+
+
+YEXYEHXYHEHX
H
H
H
H